the Creative Commons Attribution 4.0 License.
the Creative Commons Attribution 4.0 License.
 | 27 Aug 2021
Mid-Pliocene West African Monsoon rainfall as simulated in the PlioMIP2 ensemble
Ellen Berntell
Qiong Zhang
Alan M. Haywood
Julia C. Tindall
Stephen J. Hunter
Zhongshi Zhang
Xiangyu Li
Chuncheng Guo
Kerim H. Nisancioglu
Christian Stepanek
Gerrit Lohmann
Linda E. Sohl
Mark A. Chandler
Ning Tan
Camille Contoux
Gilles Ramstein
Michiel L. J. Baatsen
Anna S. von der Heydt
Deepak Chandan
William Richard Peltier
Ayako Abe-Ouchi
Wing-Le Chan
Youichi Kamae
Charles J. R. Williams
Daniel J. Lunt
Ran Feng
Bette L. Otto-Bliesner
Esther C. Brady
The mid-Pliocene warm period (mPWP; ∼3.2 million years ago) is seen as the most recent time period characterized by a warm climate state, with similar to modern geography and ∼400 ppmv atmospheric CO2 concentration, and is therefore often considered an interesting analogue for near-future climate projections. Paleoenvironmental reconstructions indicate higher surface temperatures, decreasing tropical deserts, and a more humid climate in West Africa characterized by a strengthened West African Monsoon (WAM). Using model results from the second phase of the Pliocene Modelling Intercomparison Project (PlioMIP2) ensemble, we analyse changes of the WAM rainfall during the mPWP by comparing them with the control simulations for the pre-industrial period. The ensemble shows a robust increase in the summer rainfall over West Africa and the Sahara region, with an average increase of 2.5 mm/d, contrasted by a rainfall decrease over the equatorial Atlantic. An anomalous warming of the Sahara and deepening of the Saharan Heat Low, seen in >90 % of the models, leads to a strengthening of the WAM and an increased monsoonal flow into the continent. A similar warming of the Sahara is seen in future projections using both phase 3 and 5 of the Coupled Model Intercomparison Project (CMIP3 and CMIP5). Though previous studies of future projections indicate a west–east drying–wetting contrast over the Sahel, PlioMIP2 simulations indicate a uniform rainfall increase in that region in warm climates characterized by increasing greenhouse gas forcing. We note that this effect will further depend on the long-term response of the vegetation to the CO2 forcing.
- Article
(7843 KB) - Full-text XML
- BibTeX
- EndNote


The mid-Pliocene warm period (mPWP; 3.264–3.025 Ma; also known as the mid-Piacenzian warm period) is considered to be the most recent past warm climate state, with average global temperatures several degrees above pre-industrial (PI) levels (1.4–4.7 ∘C; Haywood et al., 2020) and atmospheric CO2 concentrations of ∼400 ppmv (Badger et al., 2013; Bartoli et al., 2011; Dowsett et al., 2010; Haywood et al., 2020, 2013; de la Vega et al., 2020; Martínez-Botí et al., 2015; Pagani et al., 2010; Raymo et al., 1996; Salzmann et al., 2013; Seki et al., 2010; Tripati et al., 2009; Zhang et al., 2013). Paleoenvironmental reconstructions indicate a warm and humid climate during the mPWP, with elevated sea surface temperatures (SSTs) and surface air temperatures (SATs), especially at high latitudes (Dowsett et al., 2010; Salzmann et al., 2013), forests and grassland expanding into areas that are covered by tundra during more recent times, and savanna and woodland expanding at the expense of deserts (Salzmann et al., 2008). While much of the research on the mPWP climate focused on global large-scale patterns and the high latitudes (Haywood et al., 2013, 2020; De Nooijer et al., 2020), several studies have emphasized the implications of the warm climate state for tropical climate, showing, e.g. an enhancement of the East Asian Summer Monsoon (Wan et al., 2010) and a drying of the Southern Hemisphere tropics and subtropics (Pontes et al., 2020). Analysis based on, e.g. dust records of the coast of West Africa, also indicates a strengthened West African Monsoon (WAM) during the mPWP, as well as wetter conditions over West Africa and the Sahara region (Kuechler et al., 2018; Salzmann et al., 2008).
With a paleogeography and atmospheric CO2 concentrations similar to today (Dowsett et al., 2010), the mPWP has long been considered an interesting analogue for near-future climate projections (Chandler et al., 1994; Jiang et al., 2005) and has been the focus of many modelling studies (e.g. Haywood and Valdes, 2004; Salzmann et al., 2008). To increase our understanding of the dynamical drivers of the warm climate state, several model simulations have been performed as part of the Pliocene Modelling Intercomparison Project (PlioMIP; Haywood et al., 2010, 2011). Model–data comparisons between the PlioMIP1 (first phase of PlioMIP) simulations and PRISM3 (PRISM – Pliocene Research Interpretation and Synoptic Mapping) reconstructions (Dowsett et al., 2010, 2012, 2013) have shown an underestimation of the high-latitude warming in the mPWP and an overestimation of the warming in the tropics (Haywood et al., 2013; Salzmann et al., 2013), which has influenced the representation of the WAM within the models (Zhang et al., 2016). PlioMIP1 was later followed up by a second phase (PlioMIP2), representing a more narrow geological time window (marine isotope stage KM5c, 3.205 Mya) to, e.g. facilitate data–model comparison (Haywood et al., 2016), and though some areas of concern still remain, results from the PlioMIP2 have shown a widespread model–data agreement (Haywood et al., 2020).
While previous model studies have shown that the high-latitude warming has reduced the Equator–pole temperature gradient (Haywood et al., 2013) and weakened tropical circulation such as the Hadley Circulation (Corvec and Fletcher, 2017), the terrestrial warming during the mPWP has been shown to strengthen the WAM and increase the summer rainfall over the Sahel region by more than 1 mm/d (Haywood et al., 2020; Zhang et al., 2016). A similar rainfall increase over the Sahel is seen in future projections for both CMIP3 and CMIP5 ensembles, though this is with a drying located over western Sahel (Roehrig et al., 2013). However, models have been shown to inaccurately capture past rainfall variability and change over West Africa and the Sahel region (Berntell et al., 2018; Roehrig et al., 2013), and there is still little confidence in future projections of the summer rainfall (Biasutti et al., 2008; Cook, 2008; Roehrig et al., 2013). West Africa is a region sensitive to hydrological variability and experienced extended droughts during the 1970s and 1980s (Berntell et al., 2018; Held et al., 2005; Nicholson et al., 2000). There is a large need to increase confidence in future projections in order to support adaption strategies in the region.
The similarity to modern conditions, as well as the high amount of paleogeological and environmental data from the mPWP, has made PlioMIP2 well suited to both evaluate the models' ability to capture a warm climate state and further our understanding of the effects of greenhouse gas forcing and related feedbacks on the global climate system (Haywood et al., 2020; Haywood and Valdes, 2004). In this article we will evaluate the representation of the WAM within the PlioMIP2 ensemble, qualitatively compare it to palaeohydrological reconstructions, and discuss the implications for the WAM in a near-future warm climate state with increasing greenhouse gas forcing.
2.1 Participating PlioMIP2 models
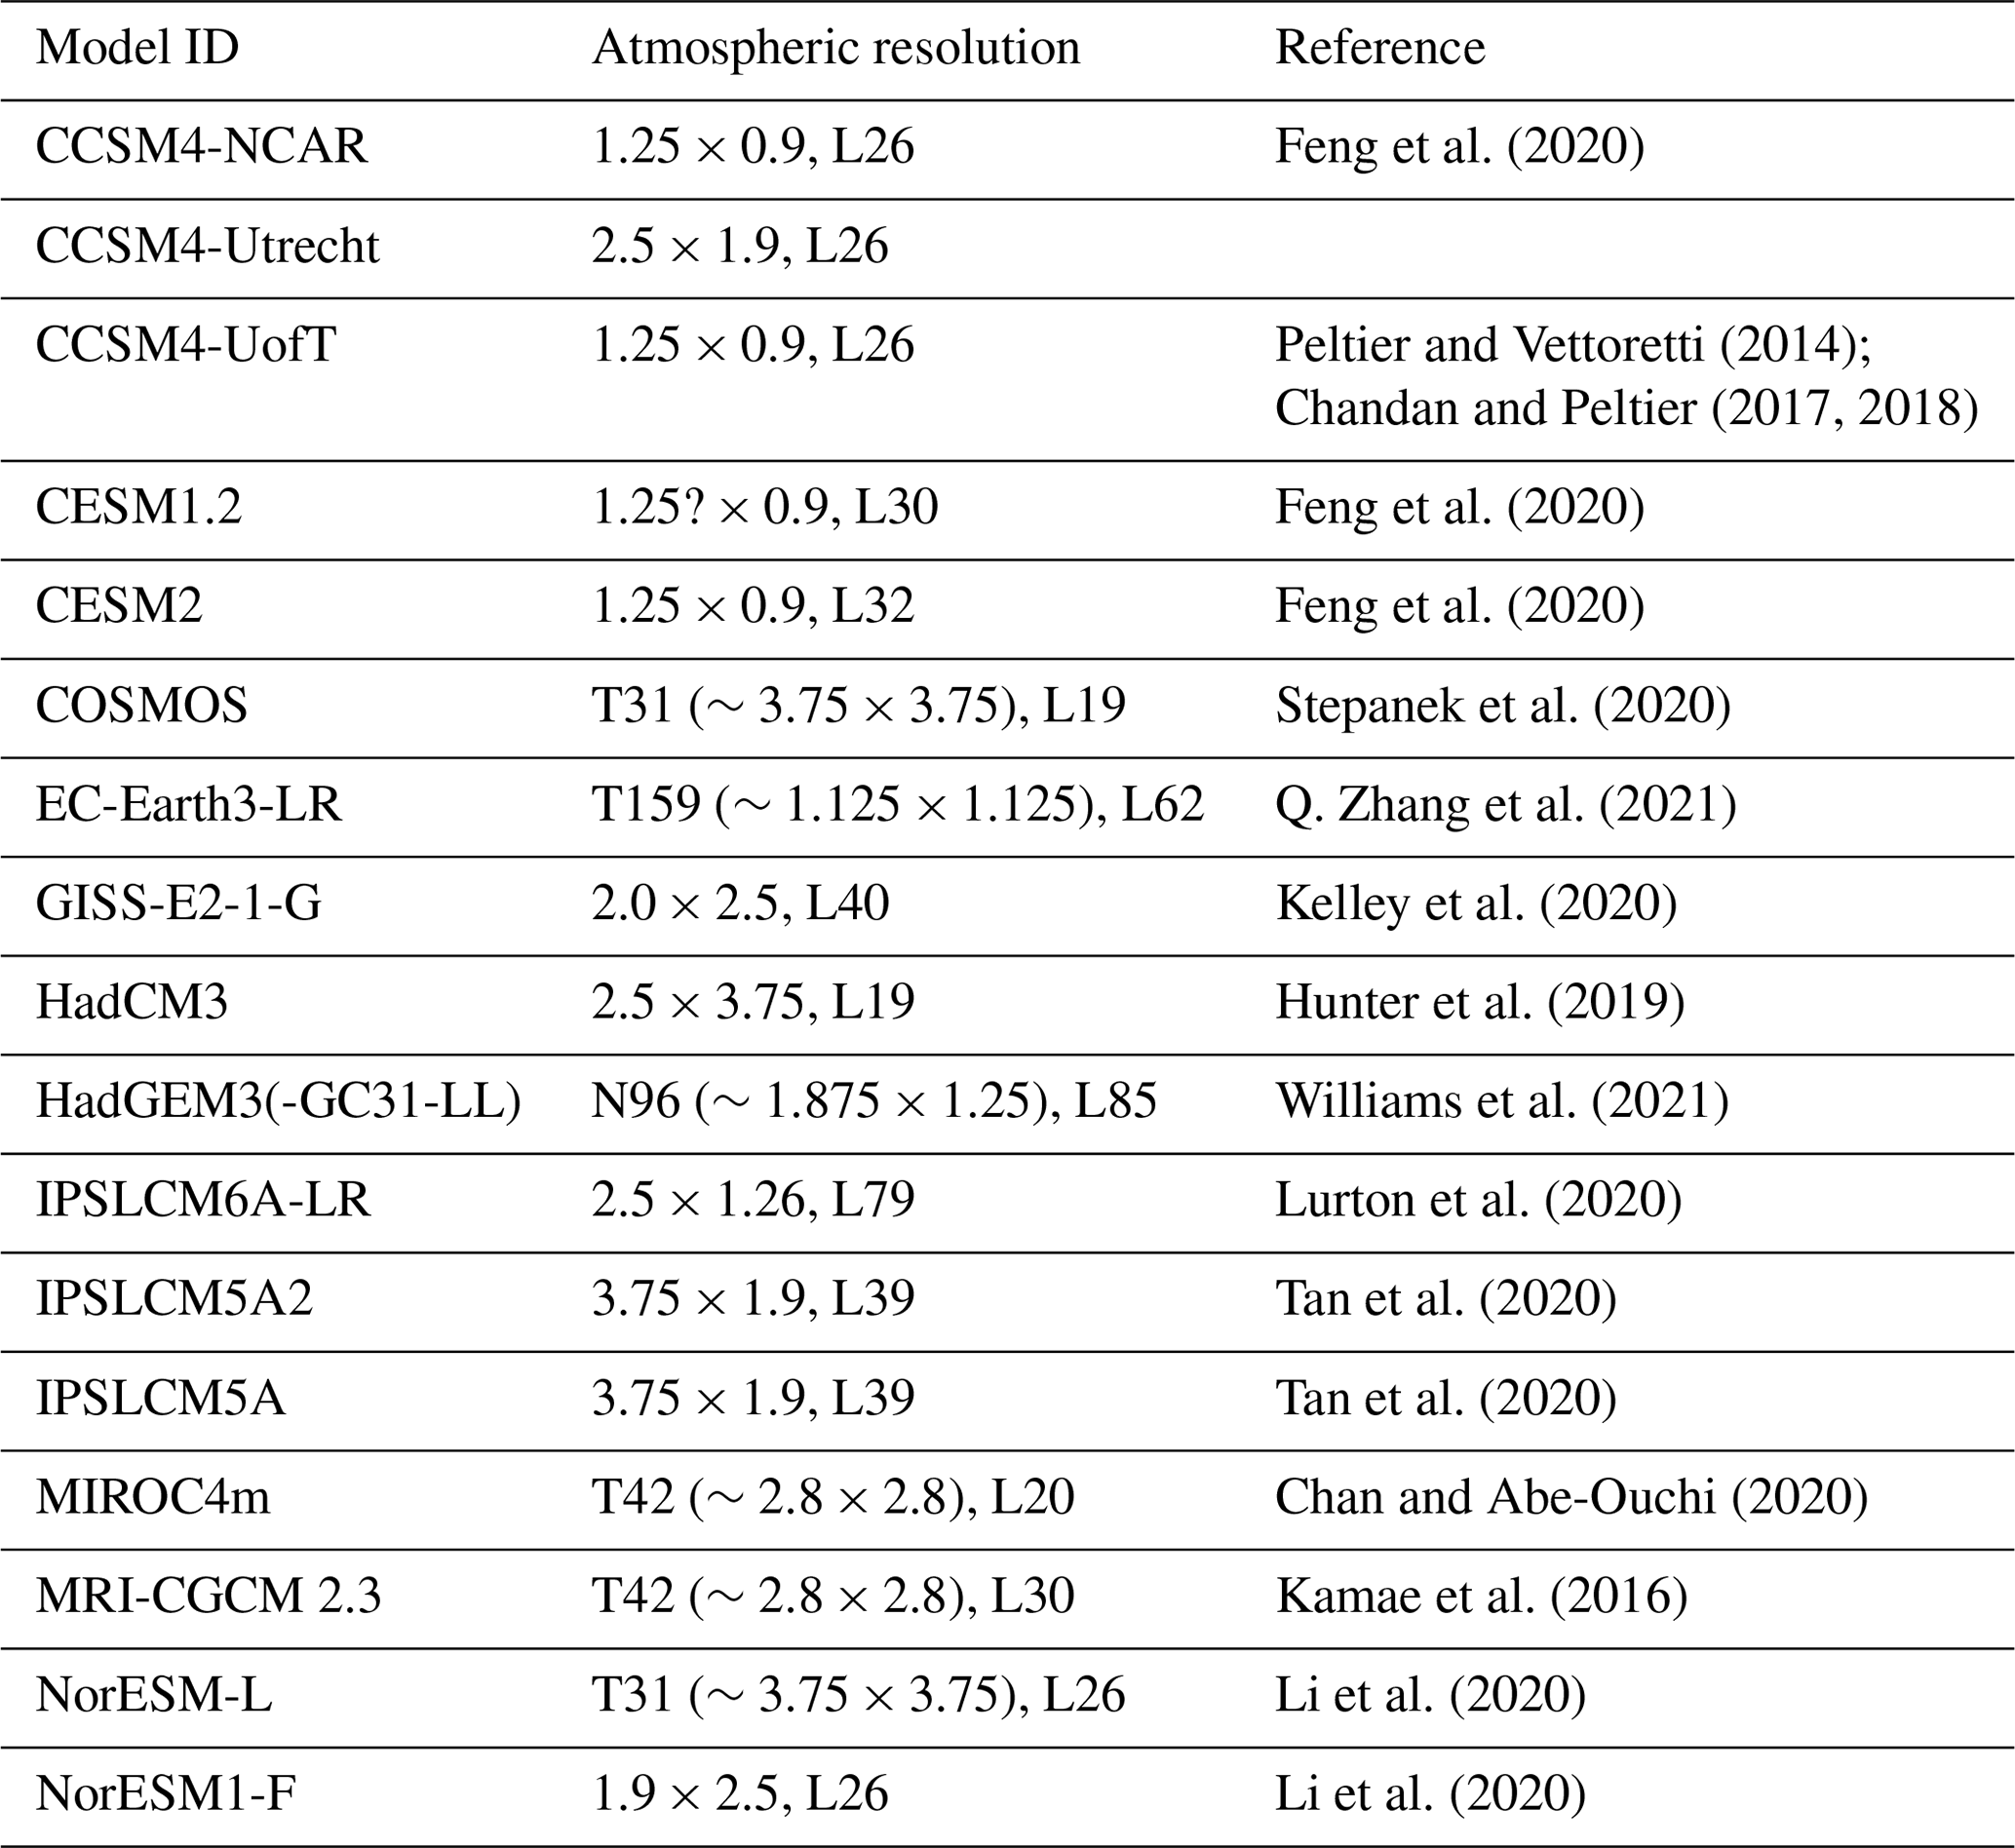
To examine the behaviour of the WAM during the mPWP, data produced by 17 different general circulation models as part of the PlioMIP2 were used (Table 1). Simulations produced within PlioMIP2 are run for at least 500 years (Haywood et al., 2016) towards an equilibrium state, and the last 100 years of the simulations are then used for analysis. In the experimental set-up the CO2 levels are set to 400 ppmv, and the remaining concentrations of trace gases and aerosols are set to pre-industrial levels (Haywood et al., 2016). The simulations are run using standard or enhanced boundary conditions from PRISM4 (Dowsett et al., 2016) as described in Haywood et al. (2016), with changes to, e.g. the topography, bathymetry, and land ice cover. All model simulations are run using a mid-Pliocene land–sea mask, except for HadGEM3 and MRI-CGCM 2.3, which use a modern land–sea mask. COSMOS uses dynamic vegetation (Stepanek et al., 2020), while the remaining 16 models use prescribed vegetation based on Salzmann et al. (2008). As the models have different horizontal resolutions, the data from the models were bilinearly interpolated onto a 1∘ × 1∘ grid using the software CDO (Climate Data Operators, Schulzweida, 2019) to facilitate multi-model analysis.
Table 1PlioMIP2 models used in this study. Spatial resolution of the atmosphere model indicated by grid cell extent (in degrees longitude × latitude) and number of vertical layers (L).
2.2 Methods
The rainfall and West African climate is analysed over the months July–October (JASO), and the multi-model mean (MMM) represents the unweighted average of the PlioMIP2 ensemble. The robustness of the signal is evaluated using the methodology of Mba et al. (2018), where the signal is considered robust if at least 14 of the 17 models (≥ 80 %) agree on the sign of the anomaly and the MMM anomaly is equal to or larger than the inter-model standard deviation. The models are evaluated against their PI simulation, and the 1901–1930 climatology based on CRU TS v4 (Climatic Research Unit gridded Time Series; Harris et al., 2020) is included as a reference for the observations. The seasonal cycle of the WAM is also examined over two sub-regions, the Sahel (10–20∘ N, 20∘ W–30∘ E) and the coast of Guinea (5–10∘ N, 20∘ W–30∘ E), representing regions characterized by a narrow and a wider or bimodal rainfall season, respectively. A more narrow definition of the Sahel region is also sometimes used (10∘ W–10∘ E, e.g. Thorncroft et al., 2011), but our analysis has shown no difference in the seasonal distribution of rainfall compared to a wider region (20∘ W–30∘ E). Given the possible northward expansion of the WAM during the mPWP, the seasonal cycle over the Sahara region (20–30∘ N, 20∘ W–30∘ E) is also included.
3.1 Changes in seasonality
The progression of the WAM creates different seasonal cycles of rainfall depending on the region, where northern latitudes in West Africa (south of the Sahara) have one clear peak while more southern regions have a wider or bimodal rainy season (Nicholson et al., 2000). We have therefore divided West Africa into two sub-regions, the Sahel (10–20∘ N, 20∘ W–30∘ E) and the coast of Guinea (5–10∘ N, 20∘ W–30∘ E), and shown the results together with the seasonal cycle over the Sahara region (20–30∘ N, 20∘ W–30∘ E). The seasonal cycle of terrestrial rainfall is calculated for each ensemble member and presented together with the MMM for the PI and mPWP simulations separately, as well as for the Pliocene anomaly (mPWP-PI) (Fig. 1). The “modern” seasonal cycle is plotted together with the PI cycle for reference, based on 1901–1930 CRU TS v4 data (Harris et al., 2020).
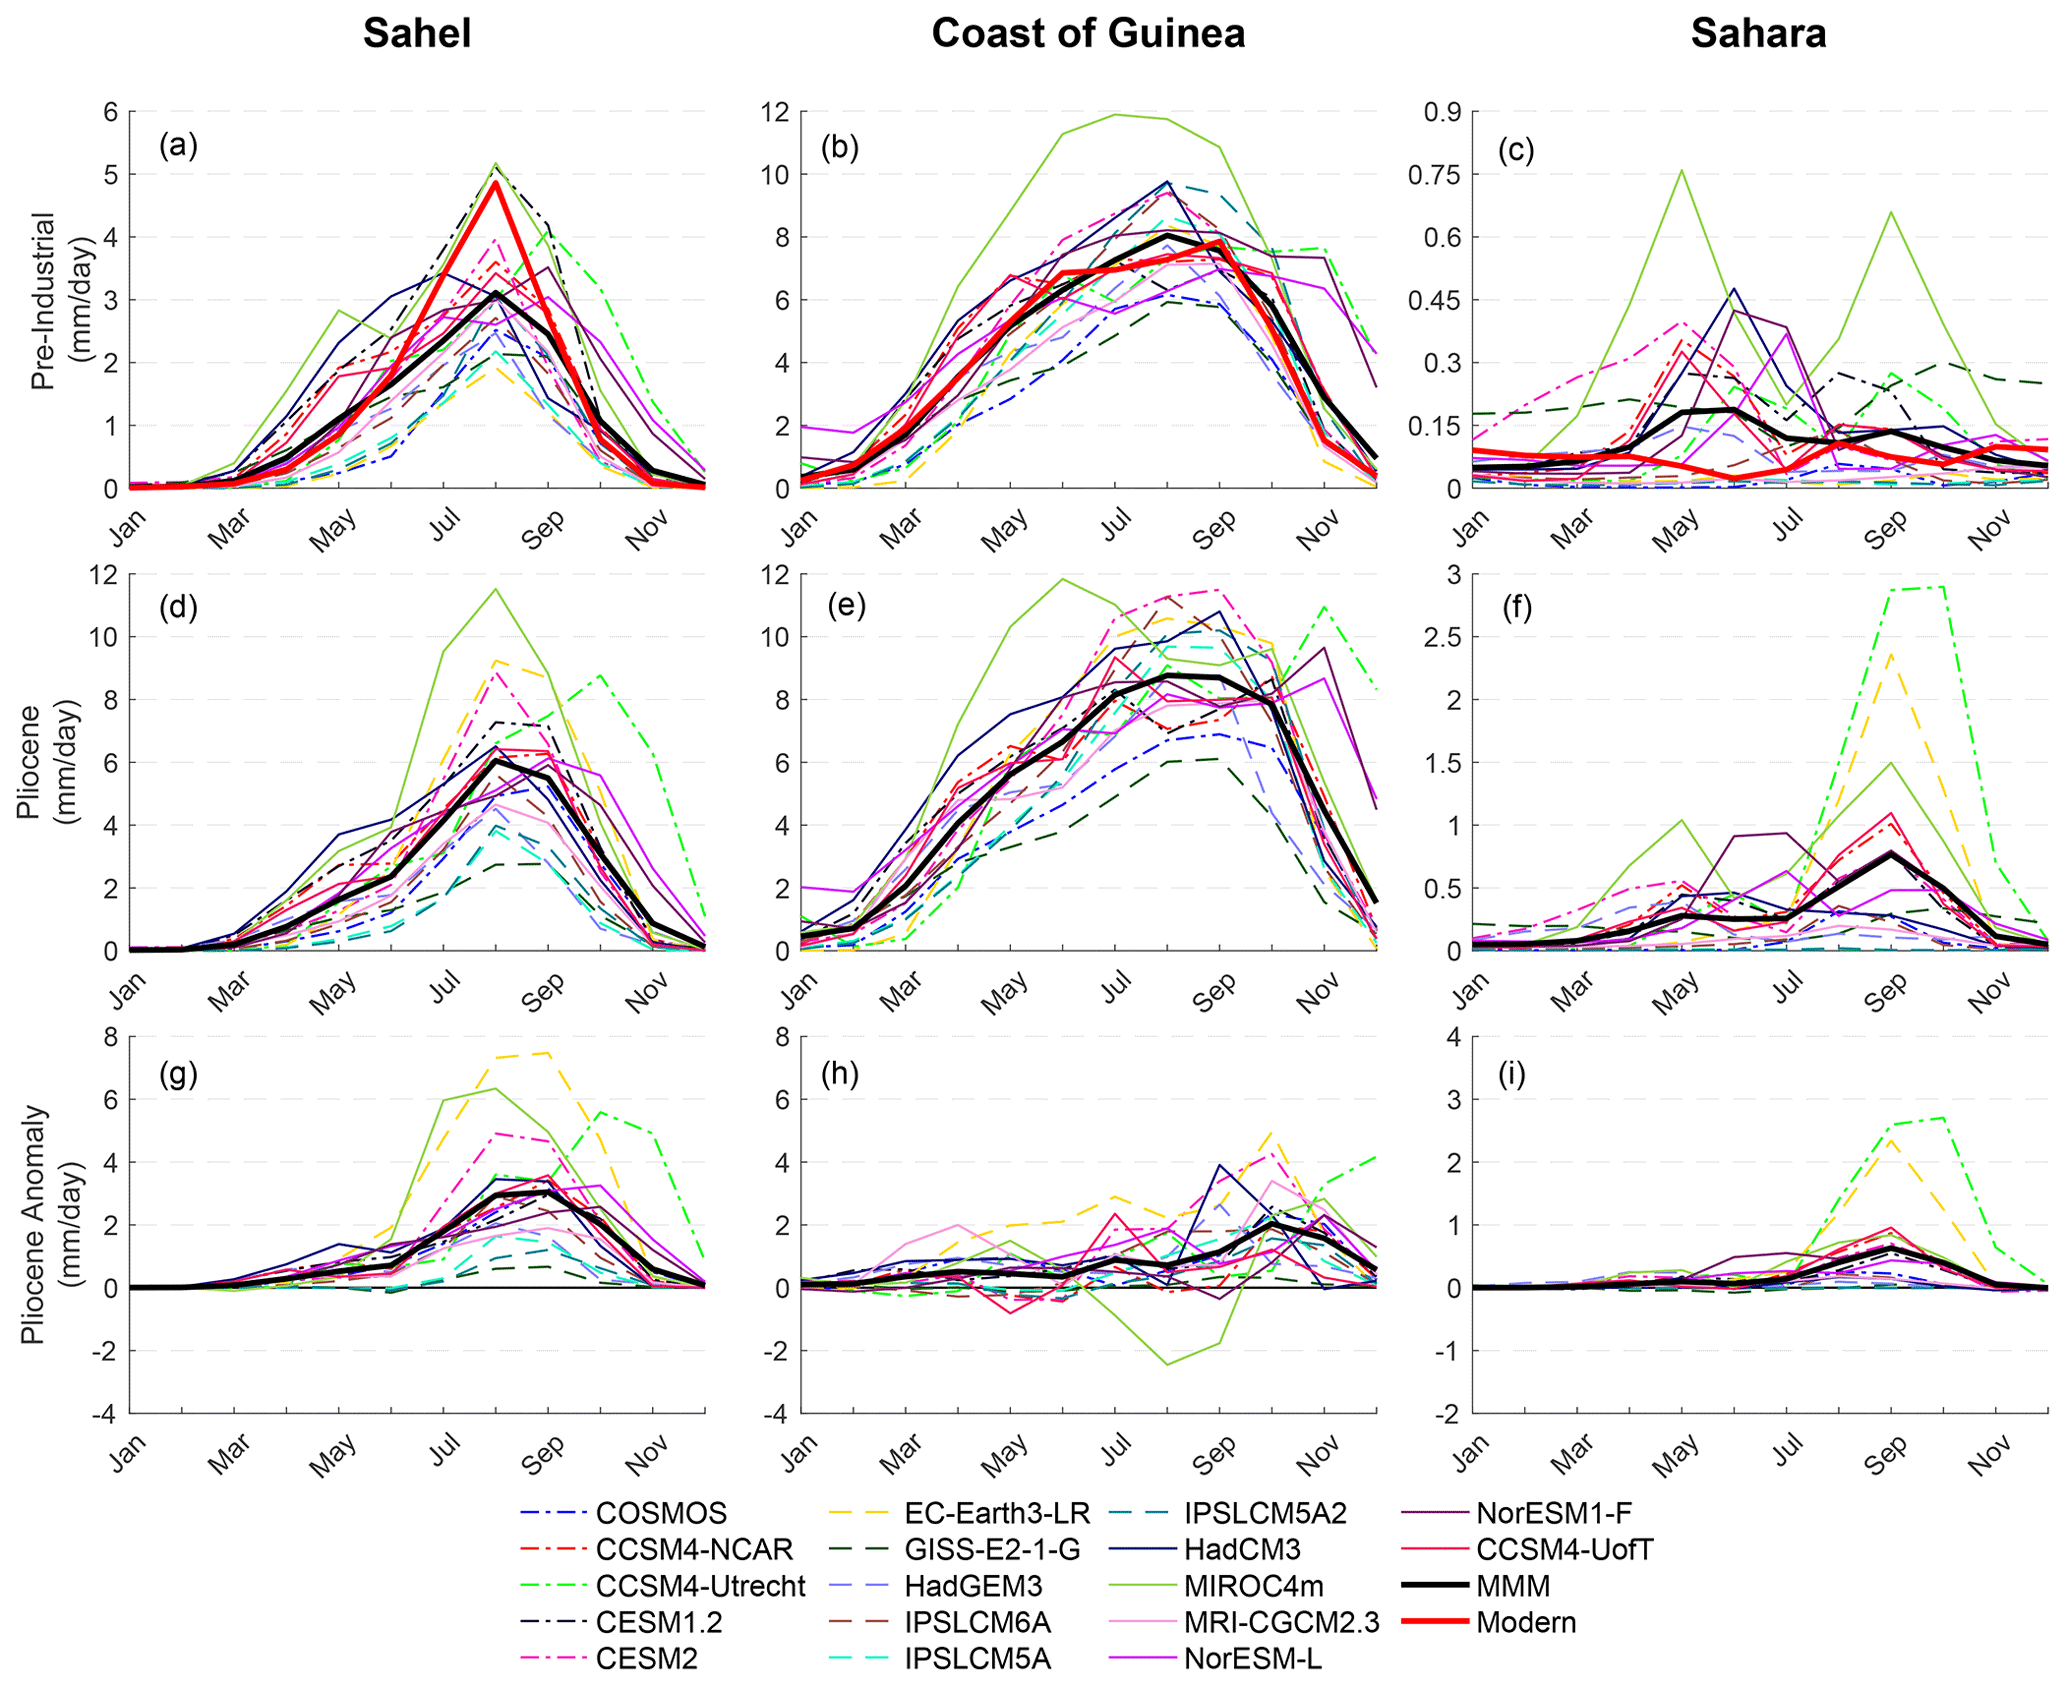
Figure 1Seasonal cycle of rainfall (unit: mm/d) over the Sahel (a, d, g), the coast of Guinea (b, e, h), and the Sahara region (c, f, i) for PI (a–c), mPWP (d–f), and mPWP anomalies (mPWP-PI, g–i). The multi-model mean MMM (black) is shown together with the individual models, and the modern conditions as derived from observations (Harris et al., 2020) are included as a reference (red).
In agreement with PI observations, the PI MMM shows a seasonal cycle with a peak in rainfall in August over the Sahel at 3.1 mm/d. The individual models mainly exhibit the same seasonal cycle; however, four models exhibit that the highest level of rainfall shifted to July (HadCM3) or September (CCSM4-Utrecht, NorESM-L and NorESM-F) rather than August. The magnitude of summer rainfall seen in CESM1.2 and MIROC4m is 5.1 and 5.2 mm/d respectively and is comparable to modern conditions (4.9 mm/d) (Fig. 1), while the other 15 ensemble members remain within a span of 2–4 mm/d, which is considerably below modern levels. The mPWP MMM shows an increase in monsoon rainfall, with the maximum rainfall doubling and reaching 6.1 mm/d in August. The largest increase is shown in EC-Earth3-LR at 7.3 and 7.5 mm/d in August and September, making it reach a maximum of 9.2 mm/d in the Pliocene Sahel. As with the PI, the highest level of Pliocene rainfall in the PlioMIP2 ensemble is seen in MIROC4m, with 11.5 mm/d in August. All models show an increase in rainfall in the July–October period, with the largest increase occurring either in August, September, or October, resulting in a lengthening of the WAM. We will therefore base our spatial analysis of the WAM on the July–October (JASO) period, although this does not alter the spatial patterns compared to a shorter monsoon season (July–September).
Over the coast of Guinea, the PI simulations show higher levels of rainfall through most of the Northern Hemisphere's spring, summer, and fall, with the ensemble mean showing a maximum of 8.1 mm/d occurring in August (Fig. 1). This is, both in seasonal distribution and amount, comparable to the PI observations that exhibit maximum rainfall of 7.9 mm/d in September. However, while the observations show a slight bi-modal rainfall distribution, with peaks in June and September, the PI MMM has a wider distribution with a peak in August. 16 of the 17 members have maximum levels of rainfall spanning between 5.9 and 9.8 mm/d, while MIROC4m again exceeds the remaining models with rainfall reaching 11.9 mm/d in July. The MMM of the mPWP simulations again shows an increase of monsoon rainfall compared to the PI, with positive anomalies throughout the seasonal cycle, but it shows the highest values in October and a secondary peak in July. However, while no individual models showed negative anomalies during the monsoon season in the Sahel, CCSM4-NCAR, MIROC4m, and NorESM1-F show a decrease in rainfall over the coast of Guinea in July–September. The remaining models show both increasing and decreasing rainfall during April–June but mainly positive anomalies from July to November.
The rainfall over the Sahara region remains low for the PI observations and PI simulations, with both PI observations and the PI MMM remaining consistently below 0.2 mm/d throughout the year and 16 of the 17 models staying between 0.0–0.5 mm/d (Fig. 1). MIROC4m again exhibits the highest levels of rainfall, with a peak of 0.8 mm/d in May and a second peak of 0.7 mm/d in September. The mPWP simulations show a clear increase in rainfall over Sahara in the later part of the WAM season, with the mPWP MMM anomalies centred on September and the maximum rainfall reaching 0.8 mm/d. The largest increase is seen in EC-Earth3-LR and CCSM4-Utrecht at 2.3 mm/d in September and 2.6 and 2.7 mm/d in September and October, respectively.
3.2 Changes in monsoon rainfall
To see the changes in the WAM rainfall during the mPWP we look at the JASO rainfall anomalies (mPWP-PI, Fig. 2). The MMM shows a clear dipole pattern with a latitudinal transition at 7∘ N stretching from the Atlantic Ocean to the eastern part of northern Africa (Fig. 2a). The robust signal of rainfall increase is centred on the Sahel and southern Sahara, covering most of northern Africa and reaching from the coast of Guinea into the northern Sahara. The negative anomalies cover an area stretching from 7∘ N and continuing south over the equatorial Atlantic, with the largest decrease located along the Gulf of Guinea.

Figure 2The mPWP July–August–September–October (JASO) rainfall anomalies (mPWP-PI) for the MMM (a) and the individual models (b–r), with all panels using the same colour bar. Robust signals in (a) are indicated with an x, where >80 % of the models (14 out of 17) show the same sign of anomaly and the anomaly is equal to or larger than the inter-model standard deviation. Dots indicate that only the first criterion is fulfilled. The pattern correlation between the MMM and individual model is seen in the bottom-left corner of (b–r). (s) The inter-model variability is shown as the standard deviation (unit: mm/d).
The large-scale features of the rainfall anomalies are consistent over the individual models, with the rainfall increase centred at 10–15∘ N and reaching up into the southern Sahara and negative values located over the Gulf of Guinea (Fig. 2a and b–r). The results are less consistent along the coast of Guinea, with models indicating slightly different locations of the transition from negative to positive rainfall anomalies. Some models exhibit a rainfall decrease reaching up to 9∘ N (MIROC4m, GISS-E2-1-G), while other models limit the negative values to only cover the equatorial Atlantic and Central Africa (CCSM4-UofT, HadCM3). EC-Earth3-LR, CCSM4-UofT, CCSM4-NCAR, and HadCM3 show the highest pattern correlation to the MMM at R=0.96 (EC-Earth3-LR) and R=0.93 (other models), respectively, while GISS-E2-1-G has the lowest correlation (R=0.52). The different models show the largest spread over the Sahel and southern Sahara (standard deviation of 2–4 mm/d, Fig. 2s). This is a region where all models indicate an increase in rainfall, but the simulated magnitude differs largely, from over 8 mm/d in EC-Earth3-LR and MIROC4m to around 1 mm/d for GISS-E2-1-G and IPSLCM5A2. A spatial mean of the rainfall anomalies over the Sahel (Fig. 3) shows a similar spread, with the highest values for EC-Earth3-LR and MIROC4m (6.1 and 5.0 mm/d) and the lowest for GISS-E2-1-G and IPSLCM5A2 (0.4 and 0.7 mm/d). The remaining 13 models all show an increase of 1–4 mm/d over Sahel with a MMM of 2.5 mm/d.
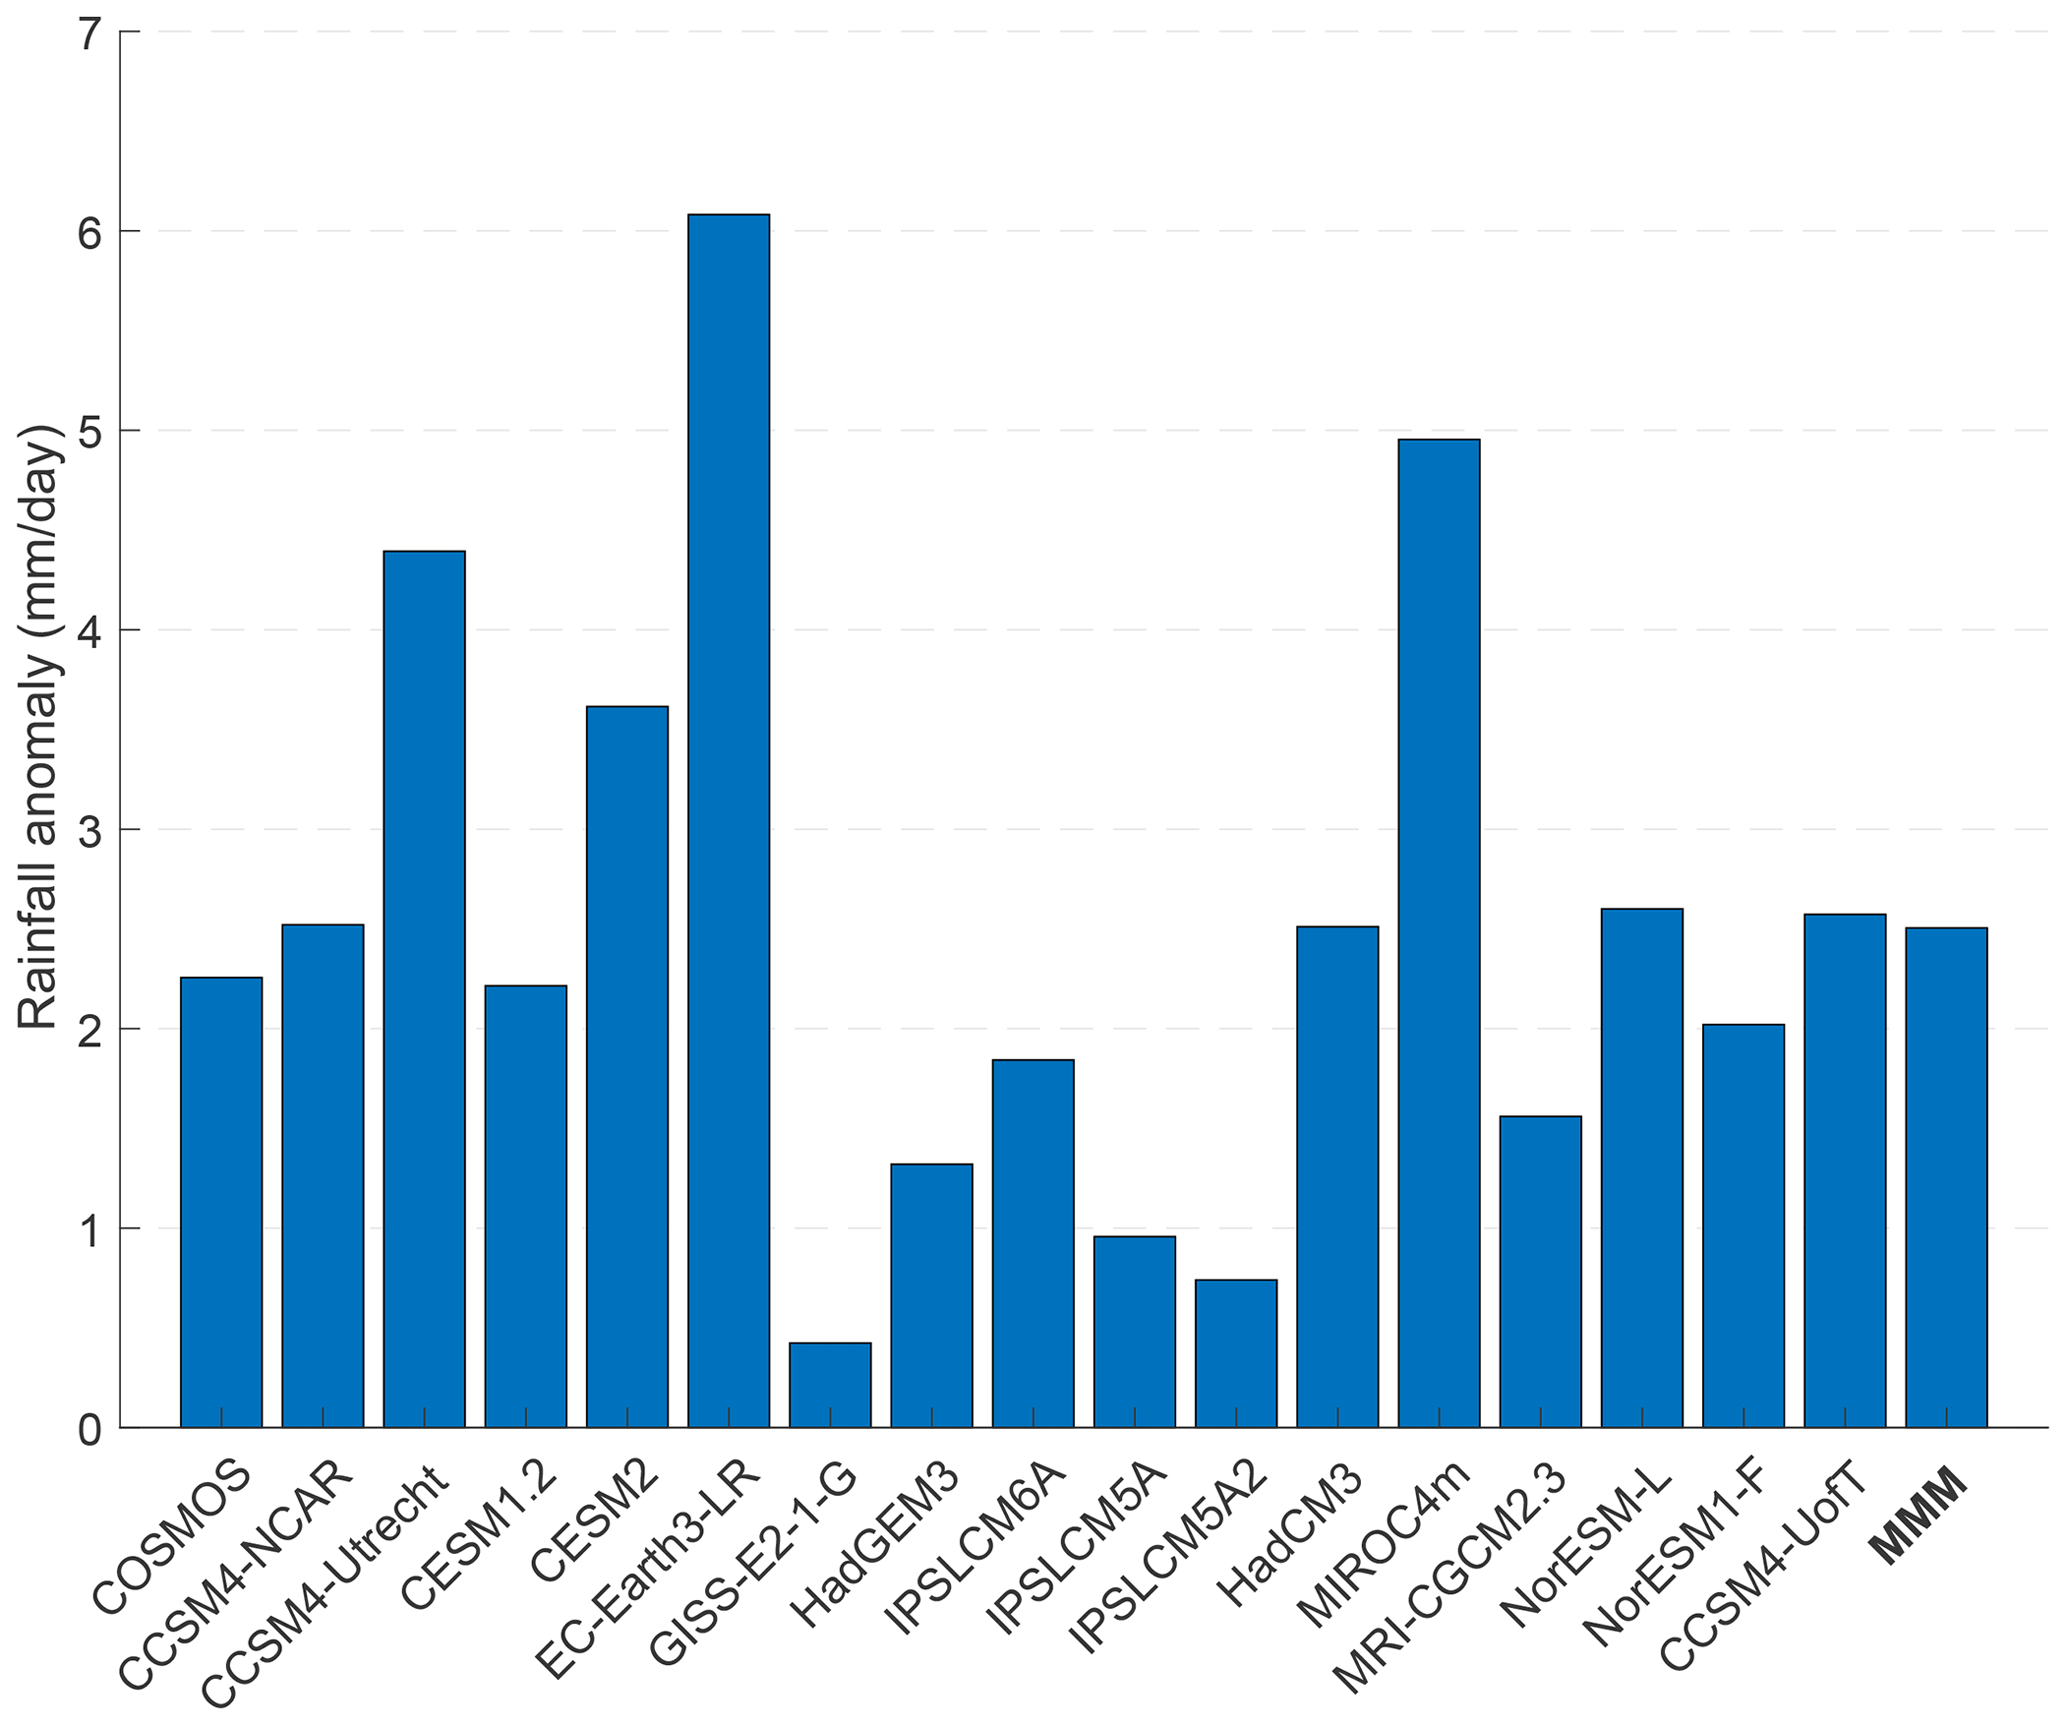
Figure 3Mean July–October (JASO) Sahel (10–20∘ N, 20∘ W–30∘ E) mPWP rainfall anomaly (mPWP-PI, unit: mm/d) for the individual PlioMIP2 ensemble models, together with the MMM.
Looking at the latitudinal mean JASO rainfall (Fig. 4) we can also see that the rain belt, i.e. the latitudinal band of maximum rainfall during the WAM, has shifted northward in the mPWP and is centred at 9.5∘ N with the largest rainfall increase of 2.0–3.1 mm/d occurring between 9.5 and 17.5∘ N for the MMM. The ensemble does, however, still exhibit a large spread, with three models showing a maximum increase to the south of the MMM (IPSLCM5A, IPSLCM5A2 and IPSLCM6A), four models showing an increase to the north (CCSM4-Utrecht, CESM1.2, NorESM-L and NorESM1-F), and two models showing a substantially larger increase than the MMM (EC-Earth3-LR and MIROC4m).
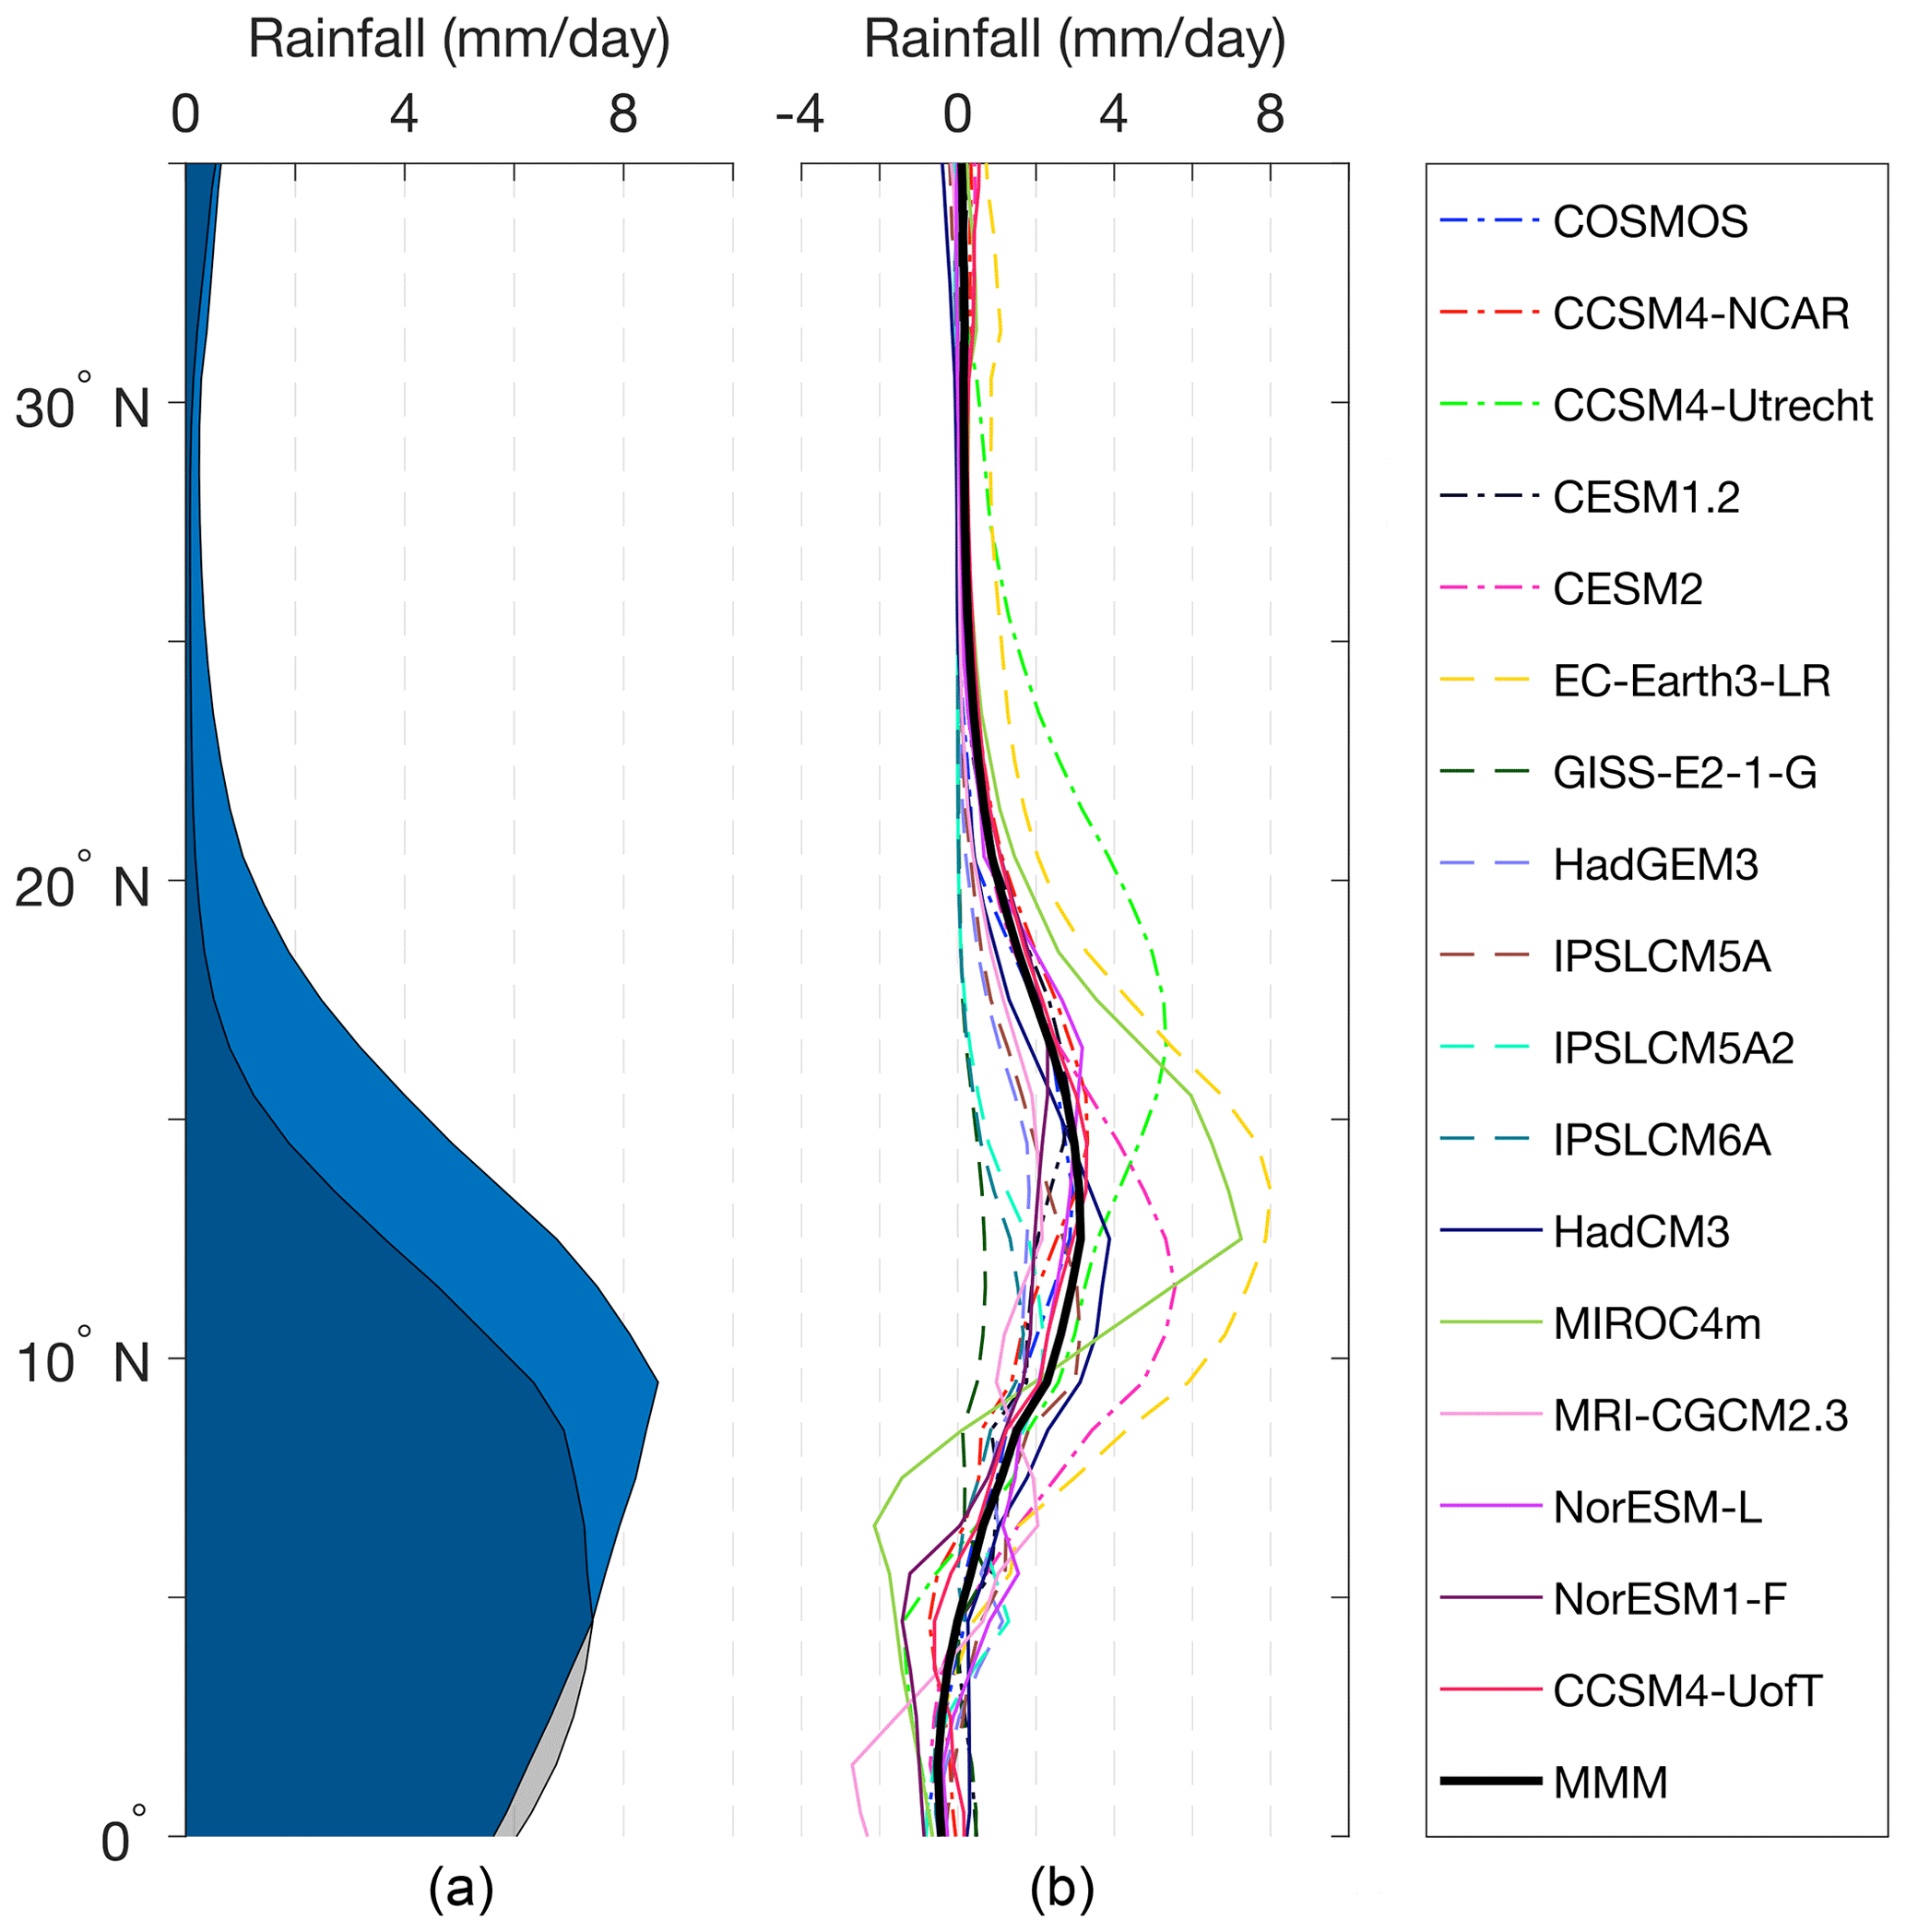
Figure 4(a) Latitudinal mean terrestrial rainfall for MMM PI (grey) and mPWP (blue), with dark blue where they overlap, and (b) latitudinal mean July–October (JASO) rainfall anomalies (mPWP-PI) for the individual models and for the MMM.
3.3 The dynamics for the changes in WAM rainfall
To understand the dynamics behind the increased rainfall in West Africa during the mPWP, the sea level pressure, horizontal wind at 850 hPa, and near-surface temperature anomalies (mPWP-PI) are analysed for each individual model.
Sea level pressure anomalies for the monsoon season (JASO, mPWP-PI) are shown in Fig. 5 for the individual PlioMIP2 models. All models except MRI-CGCM 2.3 (Fig. 5n) show a deepening of the low-pressure area across the Sahara region (negative anomalies) and a strengthening of the negative latitudinal pressure gradients between the Sahara and the equatorial Atlantic. CCSM4-NCAR, EC-Earth3-LR, and CCSM4-UofT (Fig. 5b, f and q), the models with some of the highest pattern correlation in rainfall to the ensemble mean, all exhibit a clear north–south dipole pattern with negative sea level pressure anomalies over the Sahara continuing northward into Europe and positive anomalies over the Sahel, the coast of Guinea, and the equatorial Atlantic. The same dipole pattern, with a latitudinal transition at approx. 17∘ N, is also seen in seven additional ensemble members (CCSM4-Utrecht, CESM2, GISS-E2-1-G, HadGEM3, MIROC4m, NorESM-L, and NorESM1-F), but while MRI-CGCM 2.3 exhibits positive sea level pressure anomalies south of 15∘ N, the negative anomalies over the Sahara are divided by positive anomalies over northern Africa and southern Europe, centred on the Mediterranean region, resulting in a quadrupole-type pattern (Fig. 5n). The three IPSL models (IPSLCM6A, IPSLCM5A and IPSLCM5A2) show negative anomalies or weak positive anomalies south of 17∘ N, forming a weaker enhancement of the latitudinal pressure gradient relative to the other PlioMIP2 models.
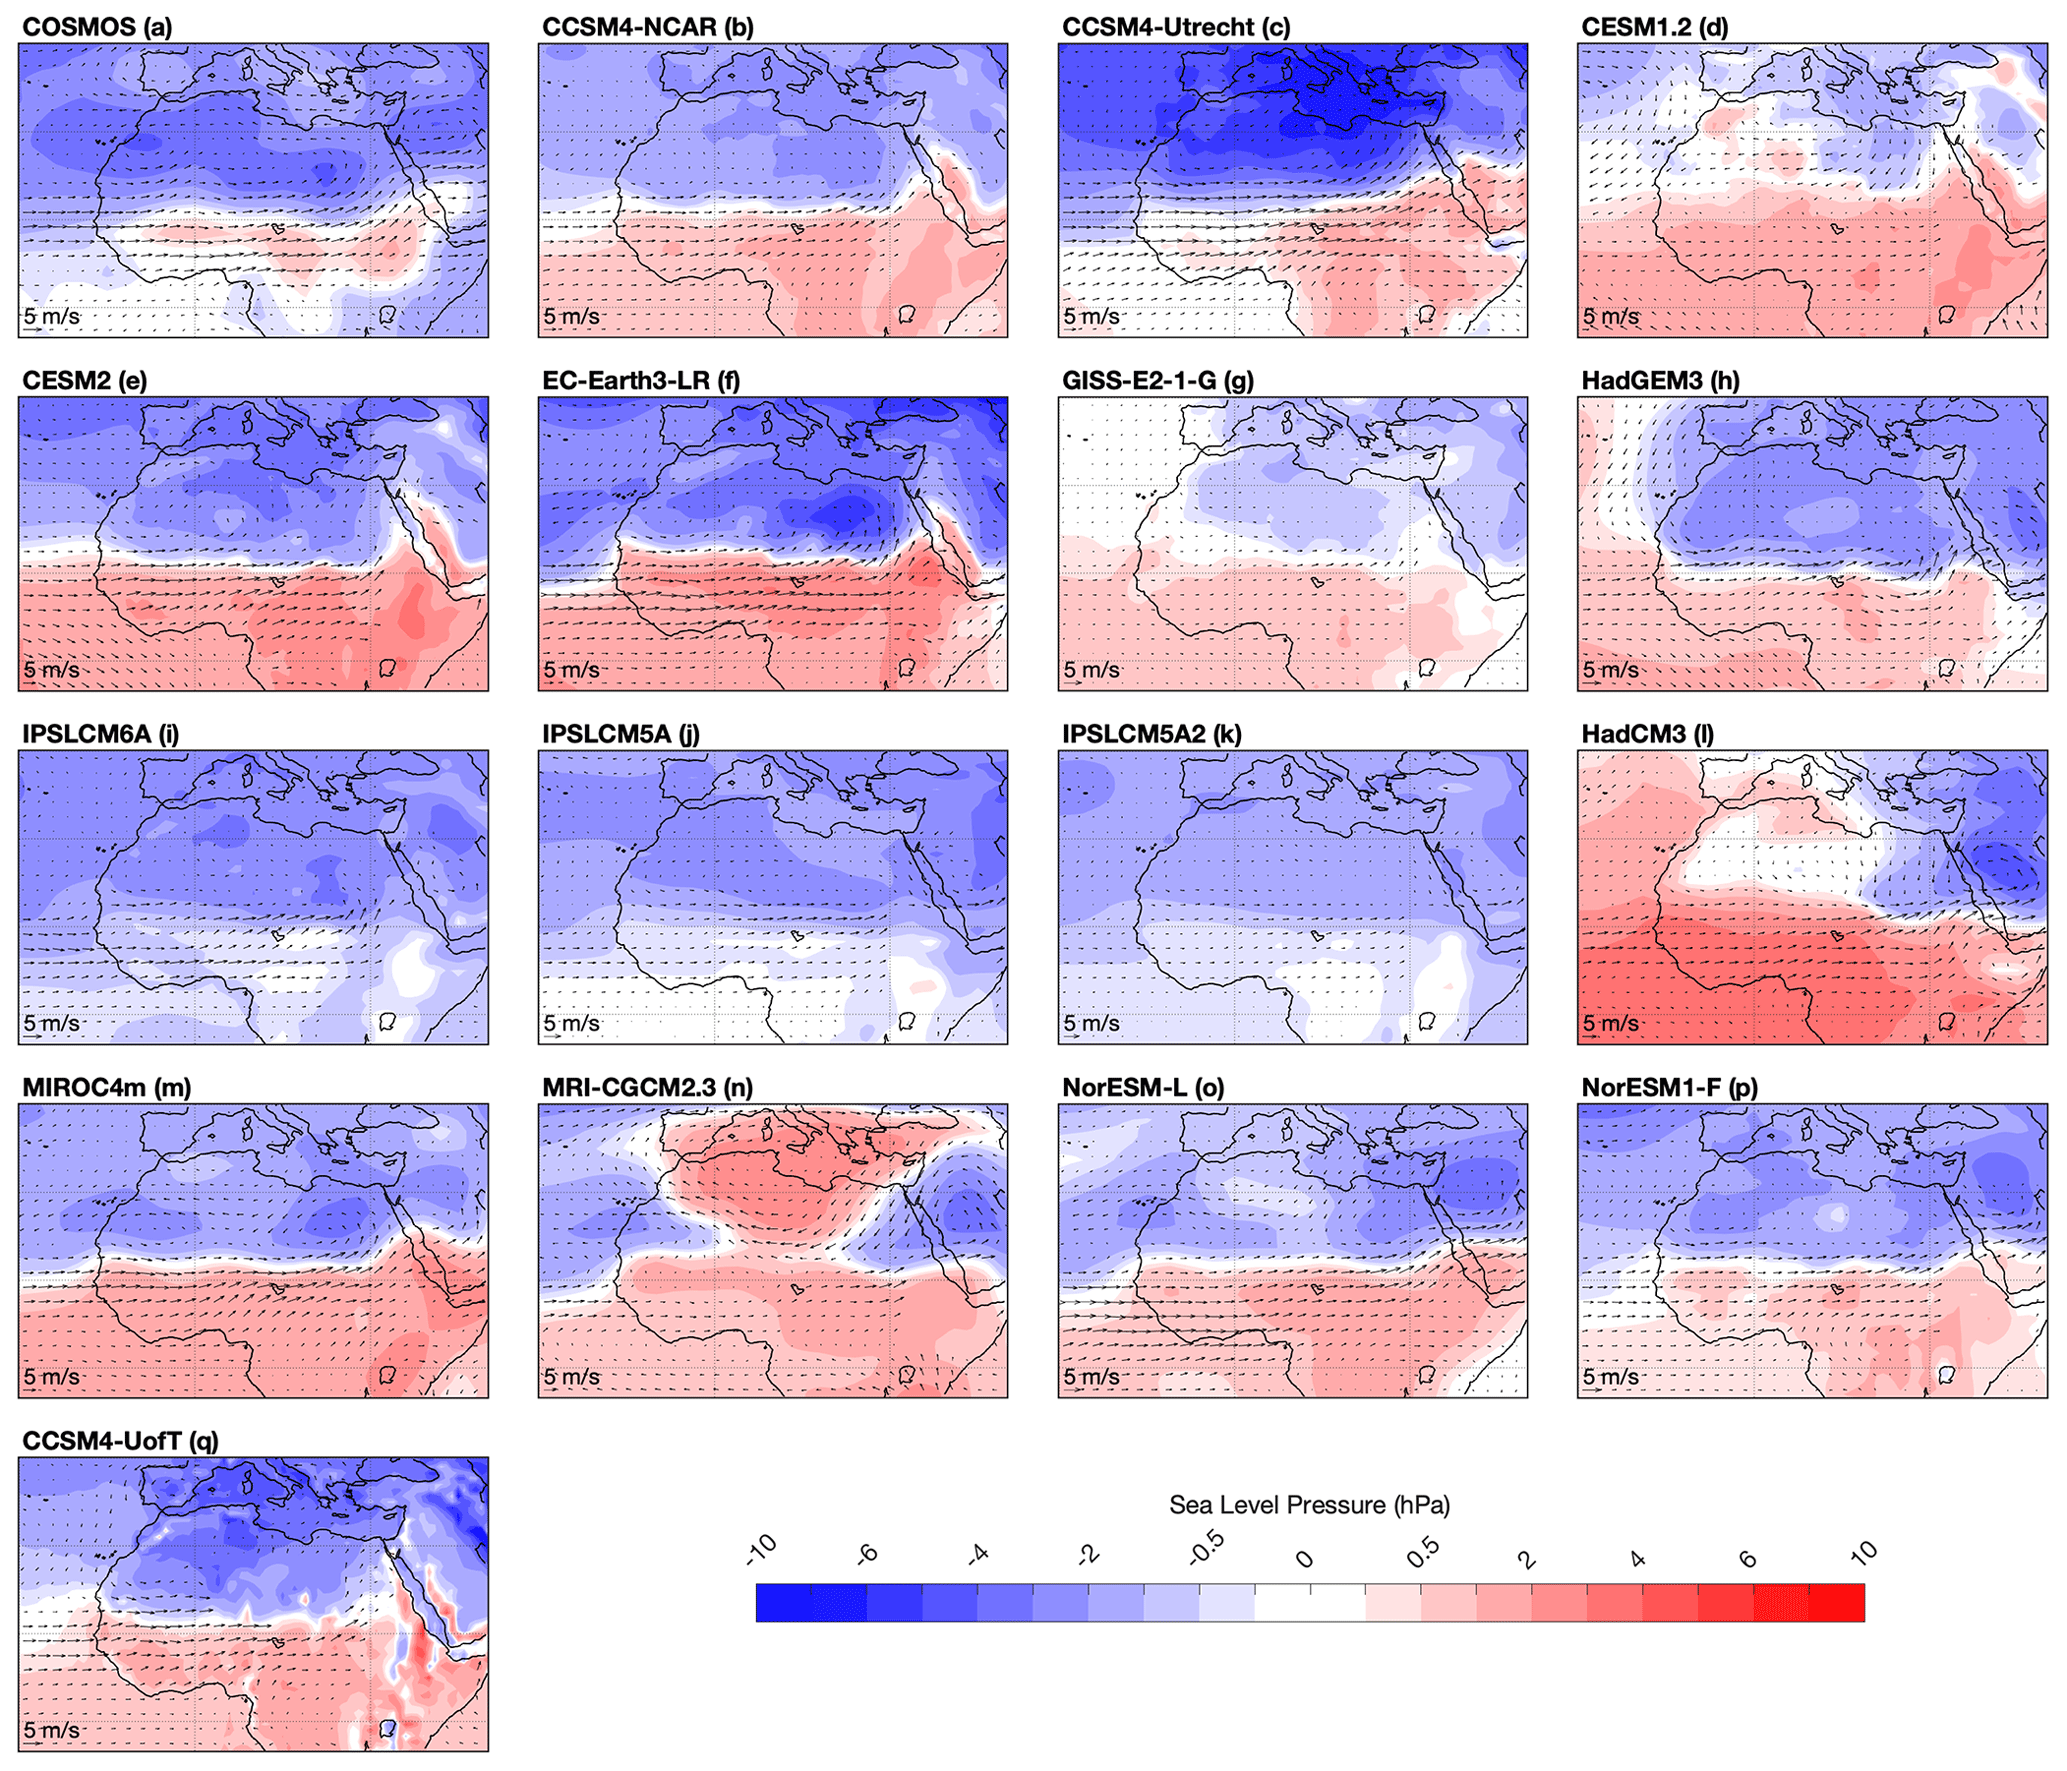
Figure 5July–October (JASO) mean sea level pressure (shading) and 850 hPa horizontal wind (vectors) anomalies for the PlioMIP2 ensemble members (a–q).
Associated with the deepening of the Saharan Heat Low and strengthening of the latitudinal pressure gradients is an anomalous cyclonic flow and strengthened westerly and southwesterly horizontal winds at the 850 hPa level, going from the equatorial Atlantic into the Sahel and Sahara (Fig. 5a–q). This is seen in all models, albeit at different magnitudes, with the highest increase in wind speed seen in CCSM4-Utrecht, EC-Earth3-LR, and MIROC4m (Fig. 5c, f and m) and the lowest in GISS-E2-1-G, IPSLCM5A, and IPSLCM5A2 (Fig. 5g, j and k).
The JASO near-surface temperature anomalies (ΔSAT, mPWP-PI, Fig. 6) show a strengthened north–south temperature gradient between the Sahara Desert and the equatorial Atlantic for all models except MRI-CGCM 2.3 (Fig. 6n). The temperature increase either stretches relatively uniformly across the Sahara, as in EC-Earth3-LR, COSMOS, and CCSM4-UofT, or exhibits two separate centres, one in the western Sahara and one in the eastern Sahara, as in MIROC4m, NorESM-L, and NorESM1-F. MRI-CGCM 2.3 (Fig. 6n) has positive temperature anomalies located mainly outside the Sahara, centred along both the western coast of the Sahara and over the eastern Sahara and the Arabian Peninsula. An area of negative temperature anomalies is located over the Mediterranean region, and its surrounding areas in the northern Sahara exhibit a weaker warming than the neighbouring areas of the Sahara Desert. Nine models show clear latitudinal bands of negative anomalies stretching across northern Africa at approx. 15∘ N (COSMOS, CCSM4-NCAR, CCSM4-Utrecht, EC-Earth 3-LR, HadCM3, MIROC4m, MRI-CGCM 2.3, NorESM-L, NorESM1-F), similar to the latitude of maximum rainfall increase. CCSM4-UofT temperatures exhibit negative anomalies more dispersed over northern Africa, located mainly along the western coastline of the Sahara and over the central Sahel region.

Figure 6July–October (JASO) mean near-surface temperature anomalies (ΔSAT, mPWP-PI) for the PlioMIP2 ensemble members (a–q).
4.1 The paleo-proxy evidence for WAM during the mid-Pliocene
The mPWP is often used as an analogue for near-future climate change due to its similar-to-modern paleogeography and high concentrations of CO2 in the atmosphere (Corvec and Fletcher, 2017; Dowsett et al., 2013; Sun et al., 2013), and both marine and terrestrial proxy reconstructions indicate a climate with higher sea surface and surface air temperatures than present (Dowsett et al., 2013; Salzmann et al., 2008). A model–data comparison using PlioMIP1 indicated that the models underestimated the high-latitude warming by up to 15 ∘C, while overestimating the low-latitude temperatures by 1–6 ∘C (Dowsett et al., 2013; Haywood et al., 2013; Salzmann et al., 2013). A comparison of atmosphere-only general circulation models (AGCMs) and coupled ocean–atmosphere models (AOGCMs) showed that AGCMs, using prescribed SSTs based on paleo-reconstructions, produce a much stronger WAM compared to models using a coupled ocean–atmosphere configuration, believed to be due to the overestimation of SST and SAT in the tropics in the PlioMIP1 AOGCMs (Zhang et al., 2016). Analysis of the PlioMIP2 ensemble by Haywood et al. (2020) indicates a widespread model–data agreement for SSTs and little systematic temperature bias in the tropics, suggesting a reduced underestimation of the WAM in the PlioMIP2, but the relatively low availability of palaeohydrological proxies covering West Africa makes it difficult to perform a similar model–data comparison for the WAM and its related rainfall (Salzmann et al., 2008, 2013). However, several studies of proxy reconstructions across northern Africa indicate a more humid climate during the mid-Pliocene. Palynological data records suggest a higher density of tree cover and an expansion of woodland and savanna in northern Africa at the expense of deserts (Bonnefille, 2010; Salzmann et al., 2008). Multi-proxy studies analysing, e.g. plant wax and dust records in marine sediment cores taken offshore of West Africa, indicate wetter conditions during the mid-Pliocene (deMenocal, 2004; Feakins et al., 2005; Kuechler et al., 2018), which is qualitatively consistent with the results from the PlioMIP2 ensemble (Fig. 2). The expansion of forest into the Sahara region is also seen in the results from COSMOS (Stepanek et al., 2020), which is the only member of the PlioMIP2 ensemble that is run with dynamic vegetation. It is also important to note that the PlioMIP2 ensemble is designed to simulate the Marine Isotope Stage KM5c (MIS KM5c; 3.205 Ma) within the mPWP (Haywood et al., 2020, 2016), and while it represents a useful comparison to modern conditions it might not represent the full climate variability within the mPWP, possibly affecting model–data comparisons (Prescott et al., 2014; Samakinwa et al., 2020).
4.2 WAM – PI and mid-Pliocene
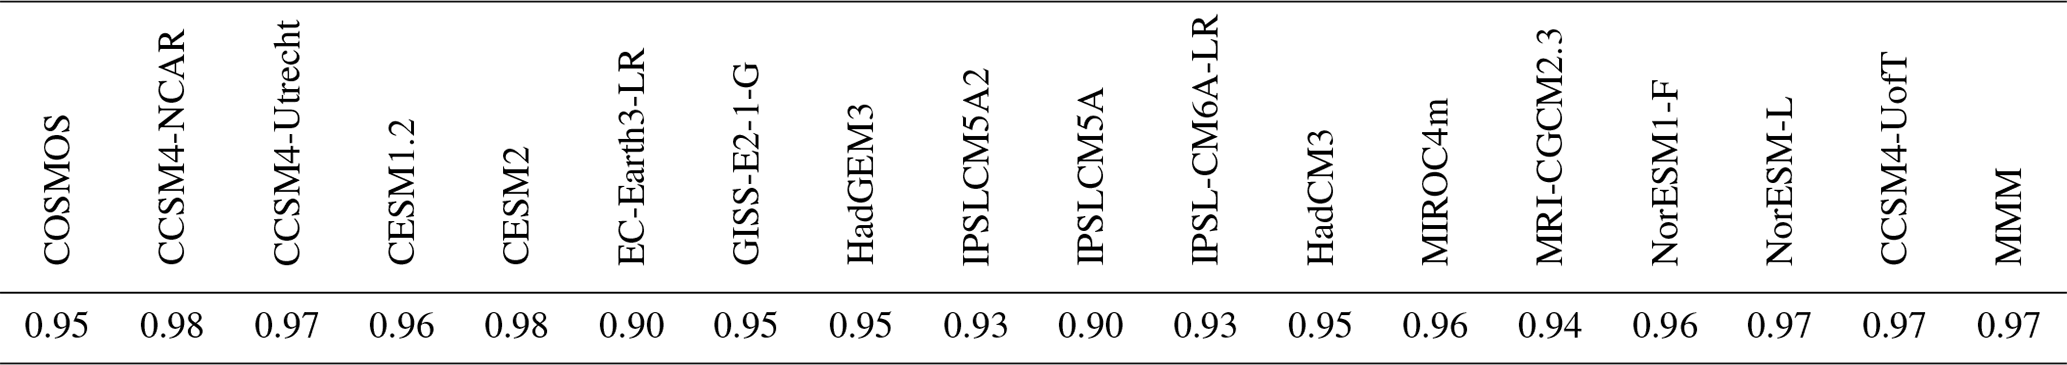
High pattern correlations of JAS rainfall over West Africa (R>0.90; Table 2) between the PI simulations and climatologies based on observational data (CRU: 1901–1930;Harris et al., 2020) for all models (R=0.97 for MMM) indicate that the models are able to sufficiently reproduce the WAM rainfall pattern. However, looking at the absolute values (Fig. 1) it is clear that while they capture the general seasonal cycle with rainfall peaking in July–September, most models still underestimate the magnitude of the modern summer rainfall over the Sahel by 1–3 mm/d, the only exceptions being CESM1.2 and MIROC4m with >5 mm/d of rainfall in August. This is consistent with our general understanding that models struggle to capture West African rainfall (e.g. Roehrig et al., 2013).
Table 2Pattern correlation of July–September mean rainfall over West Africa (0–25∘ N, 30∘ W–30∘ E) between PlioMIP2 PI simulations, including the MMM and observational data (CRU TS v4.: 1901–1930 mean).
The MMM shows a clear increase in summer rainfall in the Sahel region and (to a lesser extent) over the Sahara region, consistent with a strengthened WAM during the mPWP (Fig. 1). The anomalies are centred on mid-summer to late summer (August–September), which indicates a later withdrawal of the WAM and a lengthened monsoon season. The monsoonal rainfall over the (terrestrial) Coast of Guinea also exhibits larger positive anomalies over the later months of the summer rainfall, further suggesting an intensification of the WAM rainfall towards the end of the monsoon season as well as a later withdrawal during the mid-Pliocene.
There is a large consistency within the ensemble regarding the general features of the mPWP WAM (Fig. 2). All models show a JASO rainfall increase over the Sahel reaching up into the Sahara and negative anomalies over the Equatorial Atlantic, indicating an intensification and northward shift as well as expansion of the WAM. The changes are statistically robust and consistent with previous studies on both PlioMIP1 and 2, where the tropics, particularly the Northern Hemisphere monsoon region, is identified as a region with a robust rainfall signal during the mid-Pliocene (Haywood et al., 2020; Li et al., 2018; Pontes et al., 2020; Zhang et al., 2016). A model–proxy comparison by Feng et al. (2021) has also shown that the wetter conditions seen over the Sahel and West Africa in PlioMIP2 (Fig. 2) are consistent with the available qualitative indicators of mPWP hydroclimate, although the magnitude of change cannot be obtained from these proxy datasets and therefore not compared quantitatively to the PlioMIP2 results.
The signal is markedly stronger in the PlioMIP2 compared to PlioMIP1, where the MMM shows a doubling of the rainfall increase over Sahel from 1–2 mm/d in PlioMIP1 (Zhang et al., 2016) to 2–4 mm/d in PlioMIP2 (Fig. 2). Note that the use of June–August as the monsoon season in Zhang et al. (2016) might also have contributed to the discrepancy, especially given the rainfall increase seen in our results over the later part of the monsoon season (Fig. 1). The updated boundary conditions from PRISM3 to PRISM4 might have contributed to this enhancement, where a sensitivity study by (Samakinwa et al., 2020) using COSMOS has shown that the updated paleogeography played the largest role in the changes to the global large-scale climate between PlioMIP1 and PlioMIP2. However, these changes appear to be more pronounced in high latitudes than in low latitudes (Samakinwa et al., 2020), and HadGEM3 and MRI-CGCM 2.3, which did not implement the enhanced boundary conditions, still exhibit a precipitation response over West Africa within 1 SD of the MMM (Fig. 2). Haywood et al. (2020) instead suggest that the sensitivity of the individual ensemble members to the mid-Pliocene boundary conditions is mostly related to the model parameterization and initial conditions, with model improvements between the two phases also playing a role. Within model families, later model versions, run with the same boundary and initial conditions, tend to be more sensitive than earlier versions (Haywood et al., 2020). This is also consistent with our results, where CESM2 exhibits larger rainfall anomalies than CESM1.2 and IPSLCM6A exhibits larger rainfall anomalies than IPSLCM5A and IPSLCM5A2, for example (Fig. 3).
The precipitation response of the models over West Africa is also in many ways similar to their global response, where, for example, the weakest rainfall increase in the Sahel is seen in GISS-E2-1-G (Fig. 2), consistent with the model's low global rainfall response to the mid-Pliocene boundary conditions (Haywood et al., 2020). Models that were identified as having a larger land–sea rainfall anomaly contrast, with a larger rainfall enhancement over land compared to the ocean (Haywood et al., 2020), are also the models that show a larger rainfall increase in the Sahel (EC-Earth3-LR, HadCM3, MIROC4m, NorESM1-F, NorESM-L and CCSM4-UofT). However, COSMOS, which did not show a clear land rainfall enhancement globally, exhibits similarly strong levels of rainfall increase in the Sahel, even slightly more than NorESM1-F (2.3 and 2.0 mm/d respectively).
Haywood et al. (2020) also suggest that, in general, models exhibiting large SAT sensitivity (i.e. high global mean ΔSAT) also exhibit a larger rainfall change (globally), but there is still uncertainty in changes in more regional patterns. While this finding is consistent with the results from EC-Earth3-LR, which has one of the highest increases in both Sahel rainfall and global SAT (De Nooijer et al., 2020), there is less consistency within the remaining ensemble. MIROC4m and IPSLCM6A both exhibit similar global ΔSAT (De Nooijer et al., 2020), but their rainfall change differs by close to a factor of 3 (Fig. 3). The PlioMIP2 models, however, show a consistent JASO warming of the Sahara Desert (Fig. 6), and if the analysis is limited to the Sahara (10∘ W–10∘ E, 20–30∘ N), a clear link between the ΔSAT and the rainfall increase can be observed (Fig. 7, R=0.42, 90 % significance, and if only looking at JAS: R=0.50, 95 % significance). The warming of the Sahara and strengthened latitudinal temperature gradient between the Sahara region and the equatorial Atlantic leads to a deepening of the thermally induced Saharan Heat Low (Fig. 5) (Lavaysse et al., 2009). This deepened Saharan Heat Low induces low-level convergence and strengthens the southwesterly flow, bringing moisture from the equatorial Atlantic into the continent, leading to increased moisture availability and rainfall over Sahel and parts of Sahara and, in summary, indicating a strengthened WAM (Fig. 5).
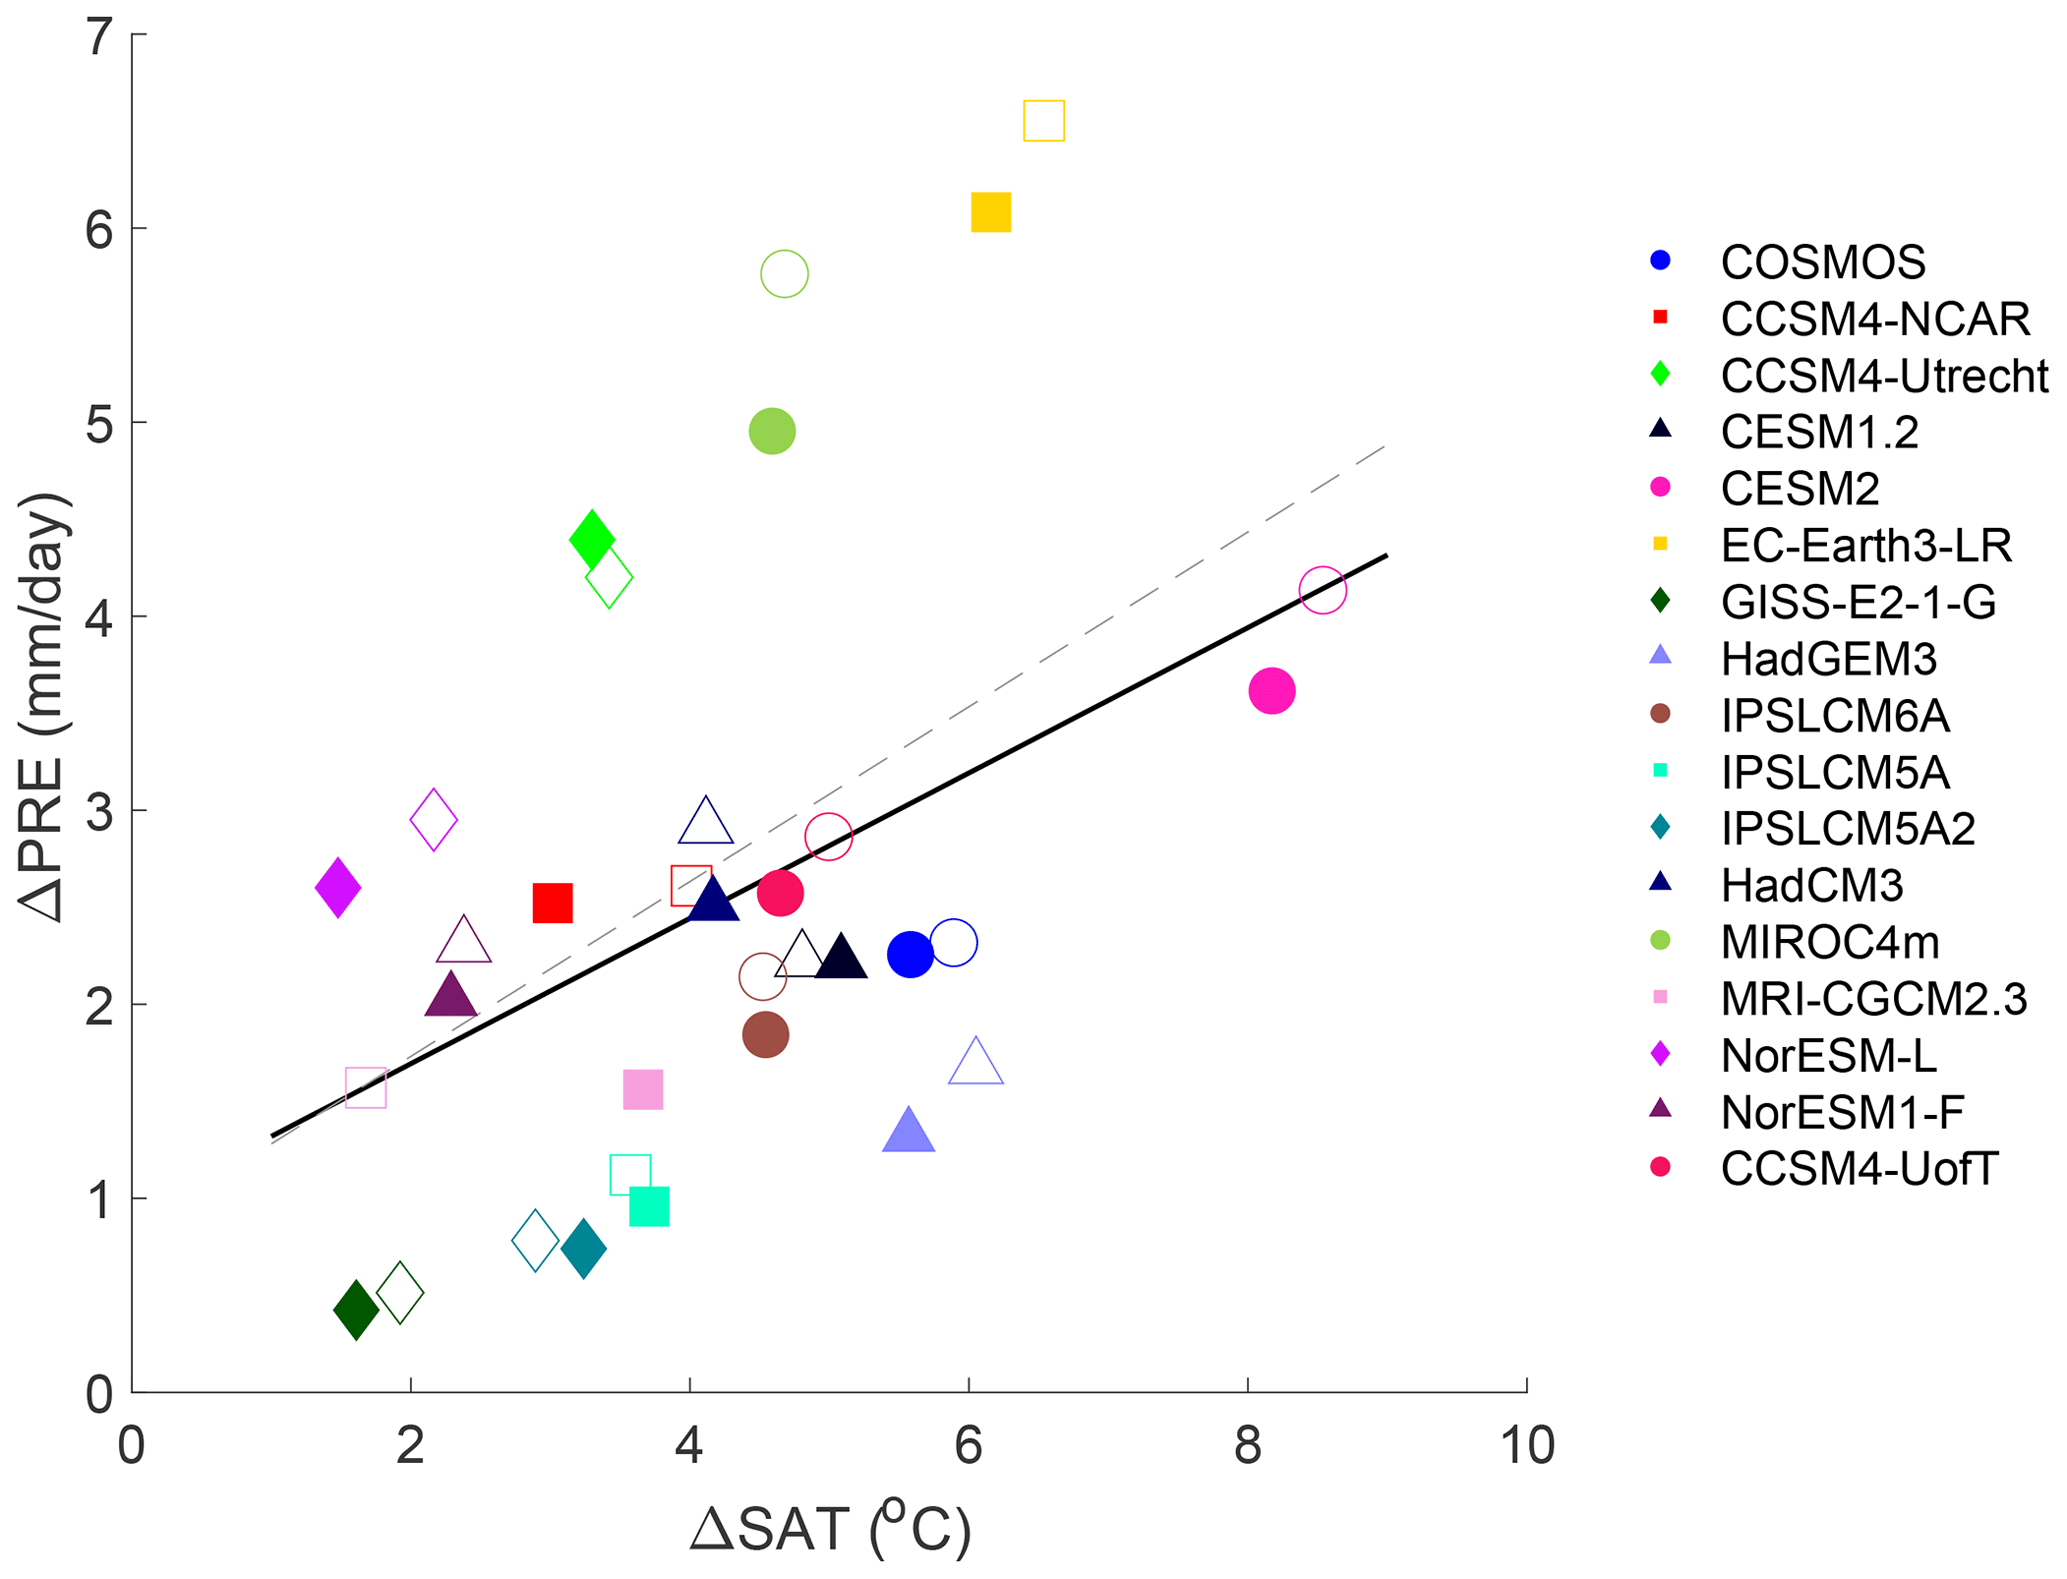
Figure 7Sahel (10–20∘ N, 20∘ W–30∘ E) rainfall and Sahara (20–30∘ N, 10∘ W–10∘ E) near-surface temperature anomalies (mPWP − PI). Filled markers and the black line show JASO anomalies and least-squares fit, while non-filled markers and the dashed line show JAS anomalies and least-squares fit.
4.3 Role of mid-Pliocene forcing and boundary conditions
The warming of the Sahara region and subsequent strengthening of the WAM is similar to what we see during other warm climates, such as the mid-Holocene and last interglacial period (Gaetani et al., 2017; Otto-Bliesner et al., 2021), but given the boundary conditions in the mid-Pliocene simulations this warming over Sahara is most likely driven by the changes in the atmospheric CO2 concentration, topography, and related vegetation changes over West Africa. Studies of model simulations as well as observational data has shown that greenhouse gas forcing leads to a land–ocean warming contrast, with a larger temperature increase over land (Byrne and O'Gorman, 2013; Haywood et al., 2020; Lambert et al., 2011). The contrast is a result of the lower moisture availability over land influencing the lapse rate and leading to a higher warming compared to the ocean (Byrne and O'Gorman, 2013), which is consistent with the strong response over the arid Sahara region (Fig. 6). Studies show that this land–ocean warming contrast is present in both equilibrium and transient simulations (Lambert et al., 2011), and future scenarios of climate change show a continued land–ocean contrast and warming of the Sahara region (Boer, 2011; Sutton et al., 2007), leading to strengthened latitudinal temperature gradients.
In addition to the CO2 forcing, the majority of the PlioMIP2 ensemble members were forced by the PRISM4 boundary conditions, with reconstructed distributions of topography, bathymetry, land ice cover, vegetation, and land–sea mask being amongst the major changes compared to modern geography (Dowsett et al., 2016; Haywood et al., 2016). While the PlioMIP2 set-up, with orography and vegetation being changed together, makes it difficult to distinguish between the impact of the two boundary conditions, the sensitivity simulations by COSMOS indicate that the mid-Pliocene paleogeography still contributes to the increased rainfall over West Africa in mPWP (Stepanek et al., 2020). The enhanced topography with closed Arctic gateways has been shown to strengthen the Atlantic meridional overturning circulation (AMOC), contributing to the warming in the North Atlantic seen in PlioMIP2, as well as the reduced model–proxy mismatch between PlioMIP1 and 2 (Z. Zhang et al., 2021). However, although the strength of the AMOC has been linked to rainfall variability over the Sahel (Mulitza et al., 2008), HadGEM3, which did not include the enhanced topography and instead exhibits a weakening of the AMOC (Z. Zhang et al., 2021), still exhibits a rainfall increase over West Africa close to (within 1 SD) the MMM (Fig. 2). These findings indicate that other mid-Pliocene boundary conditions remain important related to rainfall changes over West Africa.
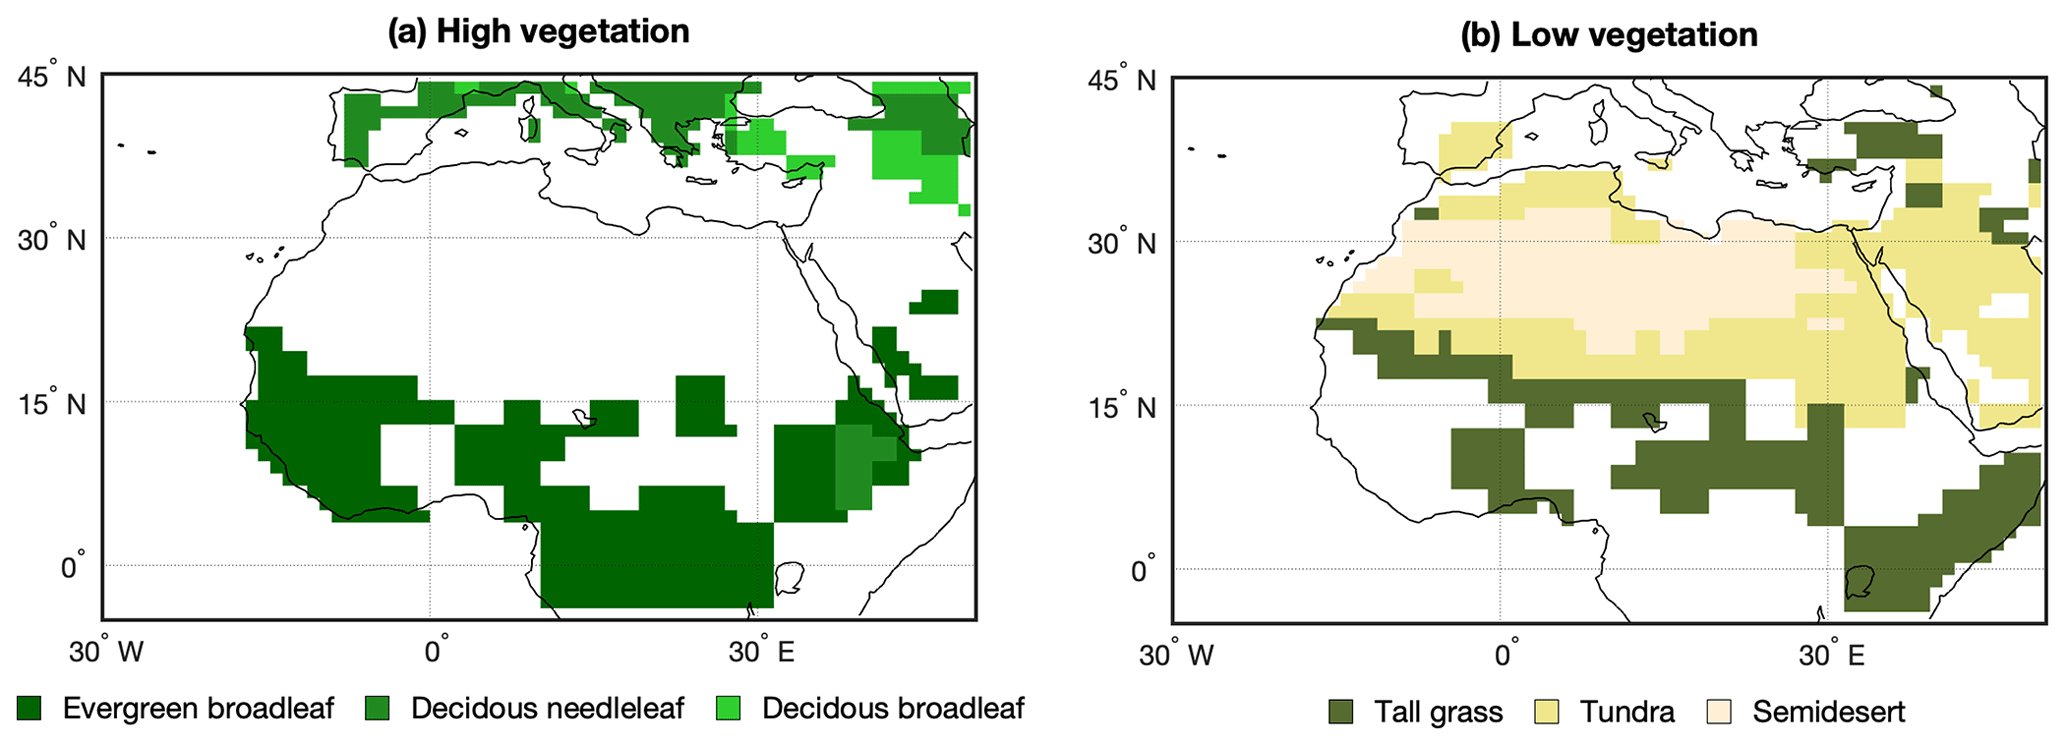
Figure 8Prescribed PRISM4 (a) high and (b) low vegetation used as boundary conditions for PlioMIP2 simulations (Dowsett et al., 2016), sourced from Salzmann et al. (2008).
Land surface changes are also known to impact rainfall over West Africa, where, e.g. expansion of vegetation into the Sahara region at the expense of desert leads to a decrease of the surface albedo and an increase in equivalent potential temperature, further strengthening the Saharan Heat Low and subsequently the WAM, leading to a vegetation–albedo feedback (Charney, 1975). Additionally, later modelling studies have emphasized the role of soil moisture (Patricola and Cook, 2008) and evapotranspiration (Rachmayani et al., 2015) in the vegetation–precipitation feedback due to their effect on low-level moist static energy, convective instability, and surface latent heat flux anomalies. These feedback mechanisms have been shown to strengthen the response of the WAM to external forcing in other past climates (e.g. Braconnot et al., 1999; Chandan and Peltier, 2020; Claussen and Gayler, 1997; Messori et al., 2019; Rachmayani et al., 2015), and the enhanced vegetation in the PlioMIP2 ensemble (Haywood et al., 2020; Salzmann et al., 2008) is likely to have contributed to the strengthening of the mPWP WAM and West African summer rainfall. While vegetation and orography are changed together in PlioMIP2, making it difficult to separate the impact of the two boundary conditions, sensitivity experiments indicate that they play a large role in the mPWP rainfall increase over West Africa (Chan and Abe-Ouchi, 2020; Hunter et al., 2019; Kamae et al., 2016). Studies by Feng et al. (in review, Sci. Adv.) further indicate that the enhanced vegetation drives the mPWP hydroclimatological changes over the Sahel to a larger extent than the enhanced topography. In PlioMIP2 the enhanced vegetation is used as a boundary condition (Fig. 8), but a northward expansion of vegetation is also seen in the dynamic vegetation model COSMOS (Stepanek et al., 2020, Fig. 25e, f), indicating that the mPWP rainfall increase over West Africa and Sahel of 2.5 mm/d for the MMM and 2.3 mm/d for COSMOS (Fig. 3) can support the enhanced vegetation cover seen in the PRISM4.
As the latitudinal land–ocean temperature gradient is central to the development and strength of the WAM through the development of the Saharan Heat Low (Lavaysse et al., 2009), the results have strong implications for future scenarios. Unlike the results in PlioMIP2, and previously in PlioMIP1 (Zhang et al., 2016), which exhibit a uniform rainfall increase over West Africa, both CMIP3 (SRES A2) and CMIP5 (RCP8.5) model ensembles show a drying over the western Sahel and a rainfall increase over the central and eastern Sahel (Roehrig et al., 2013). As analysis of both CMIP3 and CMIP5 ensembles show a large spread in projected rainfall change in the Sahel region, which weakens its confidence in future projections (Roehrig et al., 2013), our results support a future strengthening of the WAM and rainfall increase over West Africa and the Sahel in a high CO2 scenario. However, given the role of the enhanced vegetation in the strengthening of the mPWP WAM, this will also depend on the future vegetation changes in the region which still remain elusive (Bathiany et al., 2014).
The PlioMIP2 ensemble shows a clear rainfall increase over West Africa, with the largest increase located over Sahel, and a strengthening of the WAM leading to the rainfall reaching farther in over the continent. These results are consistent with geological evidence which suggests a more humid climate during the mid-Pliocene (Kuechler et al., 2018; Salzmann et al., 2008). Some regional differences occur among the ensemble members, mainly along the coast of the Gulf of Guinea, where some models indicate drier conditions while other models indicate a rainfall increase. The largest inter-model variability is centred along the Sahel, where the magnitude of the rainfall increase varies largely between the models. The strengthened WAM is driven by the warming of the Sahara region and subsequent deepening of the Saharan Heat Low, most likely due to the greenhouse gas forcing, vegetation changes, and land–ocean warming contrast. The deepened Saharan Heat Low leads to anomalous cyclonic flow and increased moisture flux into the Sahel region, resulting in a northward shift and intensification of the rainbelt. Given the potential for using the PlioMIP2 as an analogue for near-future scenarios, these results suggest a more uniform rainfall increase over West Africa and the Sahel region, unlike the east–west contrast seen in both CMIP3 and CMIP5 future projections (Roehrig et al., 2013). Alternatively, these results suggest that the extent of analogue between mid-Pliocene and future climate in the context of rainfall over West Africa may depend on the long-term response of vegetation to the CO2 forcing and on the speed with which climate adapts to future carbon dioxide burden – CMIP simulations of a transient climate and mid-Pliocene simulations of a quasi-equilibrium climate representing endmembers of potential future conditions.
The model data can be downloaded from PlioMIP2 data server located at the School of Earth and Environment of the University of Leeds; an email can be sent to Alan Haywood (a.m.haywood@leeds.ac.uk) for access.
EB and QZ designed the work. EB did the analysis and wrote the manuscript. QZ, QL, AMH, JCT, SJH, ZZ, XL, CG, KHN, CS, GL, LES, MAC, NT, CC, GR, MLJB, ASvdH, DC, WRP, AAO, WLC, YK, CJRW, DJL, RF, BLOB, and ECB provided the PlioMIP2 experiments and contributed to the discussion of the results.
The authors declare that they have no conflict of interest.
Publisher's note: Copernicus Publications remains neutral with regard to jurisdictional claims in published maps and institutional affiliations.
This article is part of the special issue “PlioMIP Phase 2: experimental design, implementation and scientific results”. It does not belong to a conference.
The model simulations with EC-Earth3 and data analysis were performed by resources provided by ECMWF's computing and archive facilities and the Swedish National Infrastructure for Computing (SNIC) at the National Supercomputer Centre (NSC).
Gerrit Lohmann and Christian Stepanek acknowledge computational resources from the Computing and Data Centre of the Alfred-Wegener-Institute – Helmholtz-Centre for Polar and Marine Research. Gerrit Lohmann and CS acknowledge funding via the Helmholtz Climate Initiative REKLIM and the Alfred Wegener Institute's research programme “Changing Earth – Sustaining our Future”.
Bette L. Otto-Bliesner, Esther C. Brady and Ran Feng acknowledge that material for their participation is based upon work supported by the National Center for Atmospheric Research, which is a major facility sponsored by the National Science Foundation (NSF) (cooperative agreement no. 1852977 and NSF OPP grant no. 1418411). Ran Feng is also supported by NSF grant no. 1903650. The CESM project is supported primarily by the National Science Foundation. Computing and data storage resources, including the Cheyenne supercomputer (https://doi.org/10.5065/D6RX99HX), were provided by the Computational and Information Systems Laboratory (CISL) at NCAR. NCAR is sponsored by the National Science Foundation.
Wing-Le Chan and Ayako Abe-Ouchi acknowledge funding from JSPS (KAKENHI grant no. 17H06104 and MEXT KAKENHI grant no. 17H06323) and computational resources from the Earth Simulator at JAMSTEC, Yokohama, Japan.
The NorESM simulations benefitted from resources provided by UNINETT Sigma2 – the National Infrastructure for High Performance Computing and Data Storage in Norway
William Richard Peltier and Deepak Chandan were supported by Canadian NSERC Discovery Grant A9627, and they wish to acknowledge the support of SciNet HPC Consortium for providing computing facilities. SciNet is funded by the Canada Foundation for Innovation under the auspices of Compute Canada, the Government of Ontario, the Ontario Research Fund – Research Excellence, and the University of Toronto.
Charles J. R. Williams and Daniel J. Lunt acknowledge the financial support of the UK Natural Environment Research Council (NERC)-funded SWEET project (research grant no. NE/P01903X/1).
Development of GISS-E2.1 was supported by the NASA Modeling, Analysis, and Prediction (MAP) Program. CMIP6 simulations with GISS-E2.1 were made possible by the NASA High-End Computing (HEC) Program through the NASA Center for Climate Simulation (NCCS) at Goddard Space Flight Center.
The PRISM4 reconstruction and boundary conditions used in PlioMIP2 were funded by the U.S. Geological Survey Climate and Land Use Change Research and Development Program. Any use of trade, firm, or product names is for descriptive purposes only and does not imply endorsement by the U.S. Government.
This research has been supported by the Vetenskapsrådet (grant nos. 2013-06476 and 2017-04232).
The article processing charges for this open-access publication were covered by Stockholm University.
This paper was edited by Martin Claussen and reviewed by Matthias Prange and one anonymous referee.
Badger, M. P. S., Schmidt, D. N., Mackensen, A., and Pancost, R. D.: High-resolution alkenone palaeobarometry indicates relatively stable pCO2 during the pliocene (3.3–2.8 ma), Philos. T. R. Soc. A, 371, 20130094, https://doi.org/10.1098/rsta.2013.0094, 2013.
Bartoli, G., Hönisch, B., and Zeebe, R. E.: Atmospheric CO2 decline during the Pliocene intensification of Northern Hemisphere glaciations, Paleoceanography, 26, PA4213, https://doi.org/10.1029/2010PA002055, 2011.
Bathiany, S., Claussen, M., and Brovkin, V.: CO2-induced sahel greening in three CMIP5 earth system models, J. Climate, 27, 7163–7184, https://doi.org/10.1175/JCLI-D-13-00528.1, 2014.
Berntell, E., Zhang, Q., Chafik, L., and Körnich, H.: Representation of Multidecadal Sahel Rainfall Variability in 20th Century Reanalyses, Sci. Rep., 8, 6–13, https://doi.org/10.1038/s41598-018-29217-9, 2018.
Biasutti, M., Held, I. M., Sobel, A. H., and Giannini, A.: SST forcings and Sahel rainfall variability in simulations of the twentieth and twenty-first centuries, J. Climate, 21, 3471–3486, https://doi.org/10.1175/2007JCLI1896.1, 2008.
Boer, G. J.: The ratio of land to ocean temperature change under global warming, Clim. Dynam., 37, 2253–2270, https://doi.org/10.1007/s00382-011-1112-3, 2011.
Bonnefille, R.: Cenozoic vegetation, climate changes and hominid evolution in tropical Africa, Global Planet. Change, 72, 390–411, https://doi.org/10.1016/j.gloplacha.2010.01.015, 2010.
Braconnot, P., Joussaume, S., Marti, O., and de Noblet, N.: Synergistic feedbacks from ocean and vegetation on the African monsoon response to mid-Holocene insolation, Geophys. Res. Lett., 26, 2481–2484, 1999.
Byrne, M. P. and O'Gorman, P. A.: Land-ocean warming contrast over a wide range of climates: Convective quasi-equilibrium theory and idealized simulations, J. Climate, 26, 4000–4016, https://doi.org/10.1175/JCLI-D-12-00262.1, 2013.
Chan, W.-L. and Abe-Ouchi, A.: Pliocene Model Intercomparison Project (PlioMIP2) simulations using the Model for Interdisciplinary Research on Climate (MIROC4m), Clim. Past, 16, 1523–1545, https://doi.org/10.5194/cp-16-1523-2020, 2020.
Chandan, D. and Peltier, W. R.: Regional and global climate for the mid-Pliocene using the University of Toronto version of CCSM4 and PlioMIP2 boundary conditions, Clim. Past, 13, 919–942, https://doi.org/10.5194/cp-13-919-2017, 2017.
Chandan, D. and Peltier, W. R.: On the mechanisms of warming the mid-Pliocene and the inference of a hierarchy of climate sensitivities with relevance to the understanding of climate futures, Clim. Past, 14, 825–856, https://doi.org/10.5194/cp-14-825-2018, 2018.
Chandan, D. and Peltier, W. R.: African Humid Period Precipitation Sustained by Robust Vegetation, Soil, and Lake Feedbacks, Geophys. Res. Lett., 47, e2020GL088728, https://doi.org/10.1029/2020GL088728, 2020.
Chandler, M., Rind, D., and Thompson, R.: Joint investigations of the middle Pliocene climate II: GISS GCM Northern Hemisphere results, Global Planet. Change, 9, 197–219, https://doi.org/10.1016/0921-8181(94)90016-7, 1994.
Charney, J. G.: Dynamics of deserts and drought in the Sahel, Q. J. Roy. Meteor. Soc., 101, 193–202, https://doi.org/10.1002/qj.49710142802, 1975.
Claussen, M. and Gayler, V.: The Greening of the Sahara during the Mid-Holocene: Results of an Interactive Atmosphere-Biome Model, Glob. Ecol. Biogeogr. Lett., 6, 369–377, https://doi.org/10.2307/2997337, 1997.
Cook, K. H.: Climate science: The mysteries of Sahel droughts, Nat. Geosci., 1, 647–648, https://doi.org/10.1038/ngeo320, 2008.
Corvec, S. and Fletcher, C. G.: Changes to the tropical circulation in the mid-Pliocene and their implications for future climate, Clim. Past, 13, 135–147, https://doi.org/10.5194/cp-13-135-2017, 2017.
de la Vega, E., Chalk, T. B., Wilson, P. A., Bysani, R. P., and Foster, G. L.: Atmospheric CO2 during the Mid-Piacenzian Warm Period and the M2 glaciation, Sci. Rep., 10, 11002, https://doi.org/10.1038/s41598-020-67154-8, 2020.
deMenocal, P. B.: African climate change and faunal evolution during the Pliocene-Pleistocene, Earth Planet. Sc. Lett., 220, 3–24, https://doi.org/10.1016/S0012-821X(04)00003-2, 2004.
de Nooijer, W., Zhang, Q., Li, Q., Zhang, Q., Li, X., Zhang, Z., Guo, C., Nisancioglu, K. H., Haywood, A. M., Tindall, J. C., Hunter, S. J., Dowsett, H. J., Stepanek, C., Lohmann, G., Otto-Bliesner, B. L., Feng, R., Sohl, L. E., Chandler, M. A., Tan, N., Contoux, C., Ramstein, G., Baatsen, M. L. J., von der Heydt, A. S., Chandan, D., Peltier, W. R., Abe-Ouchi, A., Chan, W.-L., Kamae, Y., and Brierley, C. M.: Evaluation of Arctic warming in mid-Pliocene climate simulations, Clim. Past, 16, 2325–2341, https://doi.org/10.5194/cp-16-2325-2020, 2020.
Dowsett, H., Robinson, M., Haywood, A., Salzmann, U., Hill, D., Sohl, L., Chandler, M., Williams, M., Foley, K., and Stoll, D. K.: The PRISM3D paleoenvironmental reconstruction, Stratigraphy, 7, 123–139, 2010.
Dowsett, H., Dolan, A., Rowley, D., Moucha, R., Forte, A. M., Mitrovica, J. X., Pound, M., Salzmann, U., Robinson, M., Chandler, M., Foley, K., and Haywood, A.: The PRISM4 (mid-Piacenzian) paleoenvironmental reconstruction, Clim. Past, 12, 1519–1538, https://doi.org/10.5194/cp-12-1519-2016, 2016.
Dowsett, H. J., Robinson, M. M., Haywood, A. M., Hill, D. J., Dolan, A. M., Stoll, D. K., Chan, W. Le, Abe-Ouchi, A., Chandler, M. A., Rosenbloom, N. A., Otto-Bliesner, B. L., Bragg, F. J., Lunt, D. J., Foley, K. M., and Riesselman, C. R.: Assessing confidence in Pliocene sea surface temperatures to evaluate predictive models, Nat. Clim. Change, 2, 365–371, https://doi.org/10.1038/nclimate1455, 2012.
Dowsett, H. J., Foley, K. M., Stoll, D. K., Chandler, M. A., Sohl, L. E., Bentsen, M., Otto-Bliesner, B. L., Bragg, F. J., Chan, W. Le, Contoux, C., Dolan, A. M., Haywood, A. M., Jonas, J. A., Jost, A., Kamae, Y., Lohmann, G., Lunt, D. J., Nisancioglu, K. H., Abe-Ouchi, A., Ramstein, G., Riesselman, C. R., Robinson, M. M., Rosenbloom, N. A., Salzmann, U., Stepanek, C., Strother, S. L., Ueda, H., Yan, Q., and Zhang, Z.: Sea surface temperature of the mid-piacenzian ocean: A data-model comparison, Sci. Rep., 3, 2013, https://doi.org/10.1038/srep02013, 2013.
Feakins, S. J., deMenocal, P. B., and Eglinton, T. I.: Biomarker records of late Neogene changes in northeast African vegetation, Geology, 33, 977–980, https://doi.org/10.1130/G21814.1, 2005.
Feng, R., Otto-Bliesner, B. L., Brady, E. C., and Rosenbloom, N.: Increased Climate Response and Earth System Sensitivity From CCSM4 to CESM2 in Mid-Pliocene Simulations, J. Adv. Model. Earth Syst., 12, e2019MS002033, https://doi.org/10.1029/2019MS002033, 2020.
Feng, R., Bhattacharya, T., Otto-bliesner, B., Brady, E., Haywood, A., Tindall, J., Hunter, S., Abe-Ouchi, A., Chan, W. L., Kageyama, M., Contoux, C., Guo, C., Li, X., Lohmann, G., Stepanek, C., Tan, N., Zhang, Q., Han, Z., Williams, C., Lunt, D., and Dowsett, H.: Past terrestrial hydroclimate driven by Earth System Feedbacks, [preprint], https://doi.org/10.31223/X5P60P, 2021.
Gaetani, M., Messori, G., Zhang, Q., Flamant, C., and Pausata, F. S. R.: Understanding the mechanisms behind the northward extension of the West African monsoon during the mid-holocene, J. Climate, 30, 7621–7642, https://doi.org/10.1175/JCLI-D-16-0299.1, 2017.
Harris, I., Osborn, T. J., Jones, P., and Lister, D.: Version 4 of the CRU TS monthly high-resolution gridded multivariate climate dataset, Sci. Data, 7, 109, https://doi.org/10.1038/s41597-020-0453-3, 2020.
Haywood, A. M. and Valdes, P. J.: Modelling Pliocene warmth: Contribution of atmosphere, oceans and cryosphere, Earth Planet. Sci. Lett., 218, 363–377, https://doi.org/10.1016/S0012-821X(03)00685-X, 2004.
Haywood, A. M., Dowsett, H. J., Otto-Bliesner, B., Chandler, M. A., Dolan, A. M., Hill, D. J., Lunt, D. J., Robinson, M. M., Rosenbloom, N., Salzmann, U., and Sohl, L. E.: Pliocene Model Intercomparison Project (PlioMIP): experimental design and boundary conditions (Experiment 1), Geosci. Model Dev., 3, 227–242, https://doi.org/10.5194/gmd-3-227-2010, 2010.
Haywood, A. M., Dowsett, H. J., Robinson, M. M., Stoll, D. K., Dolan, A. M., Lunt, D. J., Otto-Bliesner, B., and Chandler, M. A.: Pliocene Model Intercomparison Project (PlioMIP): experimental design and boundary conditions (Experiment 2), Geosci. Model Dev., 4, 571–577, https://doi.org/10.5194/gmd-4-571-2011, 2011.
Haywood, A. M., Hill, D. J., Dolan, A. M., Otto-Bliesner, B. L., Bragg, F., Chan, W.-L., Chandler, M. A., Contoux, C., Dowsett, H. J., Jost, A., Kamae, Y., Lohmann, G., Lunt, D. J., Abe-Ouchi, A., Pickering, S. J., Ramstein, G., Rosenbloom, N. A., Salzmann, U., Sohl, L., Stepanek, C., Ueda, H., Yan, Q., and Zhang, Z.: Large-scale features of Pliocene climate: results from the Pliocene Model Intercomparison Project, Clim. Past, 9, 191–209, https://doi.org/10.5194/cp-9-191-2013, 2013.
Haywood, A. M., Dowsett, H. J., Dolan, A. M., Rowley, D., Abe-Ouchi, A., Otto-Bliesner, B., Chandler, M. A., Hunter, S. J., Lunt, D. J., Pound, M., and Salzmann, U.: The Pliocene Model Intercomparison Project (PlioMIP) Phase 2: scientific objectives and experimental design, Clim. Past, 12, 663–675, https://doi.org/10.5194/cp-12-663-2016, 2016.
Haywood, A. M., Tindall, J. C., Dowsett, H. J., Dolan, A. M., Foley, K. M., Hunter, S. J., Hill, D. J., Chan, W.-L., Abe-Ouchi, A., Stepanek, C., Lohmann, G., Chandan, D., Peltier, W. R., Tan, N., Contoux, C., Ramstein, G., Li, X., Zhang, Z., Guo, C., Nisancioglu, K. H., Zhang, Q., Li, Q., Kamae, Y., Chandler, M. A., Sohl, L. E., Otto-Bliesner, B. L., Feng, R., Brady, E. C., von der Heydt, A. S., Baatsen, M. L. J., and Lunt, D. J.: The Pliocene Model Intercomparison Project Phase 2: large-scale climate features and climate sensitivity, Clim. Past, 16, 2095–2123, https://doi.org/10.5194/cp-16-2095-2020, 2020.
Held, I. M., Delworth, T. L., Lu, J., Findell, K. L., and Knutson, T. R.: Simulation of Sahel drought in the 20th and 21st centuries, P. Natl. Acad. Sci. USA, 102, 17891–17896, https://doi.org/10.1073/pnas.0509057102, 2005.
Hunter, S. J., Haywood, A. M., Dolan, A. M., and Tindall, J. C.: The HadCM3 contribution to PlioMIP phase 2, Clim. Past, 15, 1691–1713, https://doi.org/10.5194/cp-15-1691-2019, 2019.
Jiang, D., Wang, H., Ding, Z., Lang, X., and Drange, H.: Modeling the middle Pliocene climate with a global atmospheric general circulation model, J. Geophys. Res.-Atmos., 110, D14107, https://doi.org/10.1029/2004JD005639, 2005.
Kamae, Y., Yoshida, K., and Ueda, H.: Sensitivity of Pliocene climate simulations in MRI-CGCM2.3 to respective boundary conditions, Clim. Past, 12, 1619–1634, https://doi.org/10.5194/cp-12-1619-2016, 2016.
Kelley, M., Schmidt, G. A., Nazarenko, L., Bauer, S. E., Ruedy, R., Russell, G. L., Ackerman, A. S., Aleinov, I., Bauer, M., Bleck, R., Canuto, V., Cesana, G., Cheng, Y., Clune, T. L., Cook, B. I., Cruz, C. A., Del Genio, A. D., Elsaesser, G. S., Faluvegi, G., Kiang, N. Y., Kim, D., Lacis, A. A., Leboissetier, A., LeGrande, A. N., Lo, K. K., Marshall, J., Matthews, E. E., McDermid, S., Mezuman, K., Miller, R. L., Murray, L. T., Oinas, V., Orbe, C., Pérez García-Pando, C., Perlwitz, J. P., Puma, M. J., Rind, D., Romanou, A., Shindell, D. T., Sun, S., Tausnev, N., Tsigaridis, K., Tselioudis, G., Weng, E., Wu, J., and Yao, M.-S.: GISS-E2.1: Configurations and climatology, J. Adv. Model. Earth Syst., 12, e2019MS002025, https://doi.org/10.1029/2019MS002025, 2020.
Kuechler, R. R., Dupont, L. M., and Schefuß, E.: Hybrid insolation forcing of Pliocene monsoon dynamics in West Africa, Clim. Past, 14, 73–84, https://doi.org/10.5194/cp-14-73-2018, 2018.
Lambert, F. H., Webb, M. J., and Joshi, M. M.: The relationship between land-ocean surface temperature contrast and radiative forcing, J. Climate, 24, 3239–3256, https://doi.org/10.1175/2011JCLI3893.1, 2011.
Lavaysse, C., Flamant, C., Janicot, S., Parker, D. J., Lafore, J.-P., Sultan, B., and Pelon, J.: Seasonal evolution of the West African heat low: a climatological perspective, Clim. Dynam, 33, 313–330, https://doi.org/10.1007/s00382-009-0553-4, 2009.
Li, X., Jiang, D., Tian, Z., and Yang, Y.: Mid-Pliocene global land monsoon from PlioMIP1 simulations, Palaeogeogr. Palaeoclimatol. Palaeoecol., 512, 56–70, https://doi.org/10.1016/j.palaeo.2018.06.027, 2018.
Li, X., Guo, C., Zhang, Z., Otterå, O. H., and Zhang, R.: PlioMIP2 simulations with NorESM-L and NorESM1-F, Clim. Past, 16, 183–197, https://doi.org/10.5194/cp-16-183-2020, 2020.
Lurton, T., Balkanski, Y., Bastrikov, V., Bekki, S., Bopp, L., Braconnot, P., Brockmann, P., Cadule, P., Contoux, C., Cozic, A., Cugnet, D., Dufresne, J. L., Éthé, C., Foujols, M. A., Ghattas, J., Hauglustaine, D., Hu, R. M., Kageyama, M., Khodri, M., Lebas, N., Levavasseur, G., Marchand, M., Ottlé, C., Peylin, P., Sima, A., Szopa, S., Thiéblemont, R., Vuichard, N., and Boucher, O.: Implementation of the CMIP6 Forcing Data in the IPSL-CM6A-LR Model, J. Adv. Model. Earth Syst., 12, e2019MS001940, https://doi.org/10.1029/2019MS001940, 2020.
Martínez-Botí, M. A., Foster, G. L., Chalk, T. B., Rohling, E. J., Sexton, P. F., Lunt, D. J., Pancost, R. D., Badger, M. P. S., and Schmidt, D. N.: Plio-Pleistocene climate sensitivity evaluated using high-resolution CO2 records, Nature, 518, 49–54, https://doi.org/10.1038/nature14145, 2015.
Mba, W. P., Longandjo, G. N. T., Moufouma-Okia, W., Bell, J. P., James, R., Vondou, D. A., Haensler, A., Fotso-Nguemo, T. C., Guenang, G. M., Tchotchou, A. L. D., Kamsu-Tamo, P. H., Takong, R. R., Nikulin, G., Lennard, C. J., and Dosio, A.: Consequences of 1.5 ∘C and 2 ∘C global warming levels for temperature and precipitation changes over Central Africa, Environ. Res. Lett., 13, 055011, https://doi.org/10.1088/1748-9326/aab048, 2018.
Messori, G., Gaetani, M., Zhang, Q., Zhang, Q., and Pausata, F. S. R.: The water cycle of the mid-Holocene West African monsoon: The role of vegetation and dust emission changes, Int. J. Climatol., 39, 1927–1939, https://doi.org/10.1002/joc.5924, 2019.
Mulitza, S., Prange, M., Stuut, J. B., Zabel, M., Von Dobeneck, T., Itambi, A. C., Nizou, J., Schulz, M., and Wefer, G.: Sahel megadroughts triggered by glacial slowdowns of Atlantic meridional overturning, Paleoceanography, 23, PA4206, https://doi.org/10.1029/2008PA001637, 2008.
Nicholson, S. E., Some, B., and Kone, B.: An analysis of recent rainfall conditions in West Africa, including the rainy seasons of the 1997 El Nino and the 1998 La Nina years, J. Climate, 13, 2628–2640, https://doi.org/10.1175/1520-0442(2000)013<2628:AAORRC>2.0.CO;2, 2000.
Otto-Bliesner, B. L., Brady, E. C., Zhao, A., Brierley, C. M., Axford, Y., Capron, E., Govin, A., Hoffman, J. S., Isaacs, E., Kageyama, M., Scussolini, P., Tzedakis, P. C., Williams, C. J. R., Wolff, E., Abe-Ouchi, A., Braconnot, P., Ramos Buarque, S., Cao, J., de Vernal, A., Guarino, M. V., Guo, C., LeGrande, A. N., Lohmann, G., Meissner, K. J., Menviel, L., Morozova, P. A., Nisancioglu, K. H., O'ishi, R., Salas y Mélia, D., Shi, X., Sicard, M., Sime, L., Stepanek, C., Tomas, R., Volodin, E., Yeung, N. K. H., Zhang, Q., Zhang, Z., and Zheng, W.: Large-scale features of Last Interglacial climate: results from evaluating the lig127k simulations for the Coupled Model Intercomparison Project (CMIP6)–Paleoclimate Modeling Intercomparison Project (PMIP4), Clim. Past, 17, 63–94, https://doi.org/10.5194/cp-17-63-2021, 2021.
Pagani, M., Liu, Z., Lariviere, J., and Ravelo, A. C.: High Earth-system climate sensitivity determined from Pliocene carbon dioxide concentrations, Nat. Geosci., 3, 27–30, https://doi.org/10.1038/ngeo724, 2010.
Patricola, C. M. and Cook, K. H.: Atmosphere/vegetation feedbacks: A mechanism for abrupt climate change over northern Africa, J. Geophys. Res.-Atmos., 113, D18102, https://doi.org/10.1029/2007JD009608, 2008.
Peltier, W. R. and Vettoretti, G.: Dansgaard-Oeschger oscillations predicted in a comprehensive model of glacial climate: A “kicked” salt oscillator in the Atlantic, Geophys. Res. Lett., 41, 7306–7313, https://doi.org/10.1002/2014GL061413, 2014.
Pontes, G. M., Wainer, I., Taschetto, A. S., Gupta, A. Sen, Ouchi, A. A., Brady, E. C., Chan, W. Le, Chandan, D., Contoux, C., Feng, R., Hunter, S. J., Kame, Y., Lohmann, G., Bliesner, B. L. O., Peltier, W. R., Stepanek, C., Tindall, J., Tan, N., and Zhang, Q.: Drier tropical and subtropical Southern Hemisphere in the mid-Pliocene Warm Period, Sci. Rep., 10, 13458, https://doi.org/10.1038/s41598-020-68884-5, 2020.
Prescott, C. L., Haywood, A. M., Dolan, A. M., Hunter, S. J., Pope, J. O., and Pickering, S. J.: Assessing orbitally-forced interglacial climate variability during the mid-Pliocene Warm Period, Earth Planet. Sc. Lett., 400, 261–271, https://doi.org/10.1016/j.epsl.2014.05.030, 2014.
Rachmayani, R., Prange, M., and Schulz, M.: North African vegetation–precipitation feedback in early and mid-Holocene climate simulations with CCSM3-DGVM, Clim. Past, 11, 175–185, https://doi.org/10.5194/cp-11-175-2015, 2015.
Raymo, M. E., Grant, B., Horowitz, M., and Rau, G. H.: Mid-Pliocene warmth: Stronger greenhouse and stronger conveyor, Mar. Micropaleontol., 27, 313–326, https://doi.org/10.1016/0377-8398(95)00048-8, 1996.
Roehrig, R., Bouniol, D., Guichard, F., Hourdin, F., and Redelsperger, J.-L.: The present and future of the west african monsoon: A process-oriented assessment of CMIP5 simulations along the AMMA transect, J. Climate, 26, 6471–6505, https://doi.org/10.1175/JCLI-D-12-00505.1, 2013.
Salzmann, U., Haywood, A. M., Lunt, D. J., Valdes, P. J., and Hill, D. J.: A new global biome reconstruction and data-model comparison for the Middle Pliocene, Global Ecol. Biogeogr., 17, 432–447, https://doi.org/10.1111/j.1466-8238.2008.00381.x, 2008.
Salzmann, U., Dolan, A. M., Haywood, A. M., Chan, W. Le, Voss, J., Hill, D. J., Abe-Ouchi, A., Otto-Bliesner, B., Bragg, F. J., Chandler, M. A., Contoux, C., Dowsett, H. J., Jost, A., Kamae, Y., Lohmann, G., Lunt, D. J., Pickering, S. J., Pound, M. J., Ramstein, G., Rosenbloom, N. A., Sohl, L., Stepanek, C., Ueda, H., and Zhang, Z.: Challenges in quantifying Pliocene terrestrial warming revealed by data-model discord, Nat. Clim. Change, 3, 969–974, https://doi.org/10.1038/nclimate2008, 2013.
Samakinwa, E., Stepanek, C., and Lohmann, G.: Sensitivity of mid-Pliocene climate to changes in orbital forcing and PlioMIP's boundary conditions, Clim. Past, 16, 1643–1665, https://doi.org/10.5194/cp-16-1643-2020, 2020.
Schulzweida, U.: CDO User Guide (Version 1.9.8), Zenodo [software], https://doi.org/10.5281/zenodo.3539275, 2019.
Seki, O., Foster, G. L., Schmidt, D. N., Mackensen, A., Kawamura, K., and Pancost, R. D.: Alkenone and boron-based Pliocene pCO2 records, Earth Planet. Sc. Lett., 292, 201–211, https://doi.org/10.1016/j.epsl.2010.01.037, 2010.
Stepanek, C., Samakinwa, E., Knorr, G., and Lohmann, G.: Contribution of the coupled atmosphere–ocean–sea ice–vegetation model COSMOS to the PlioMIP2, Clim. Past, 16, 2275–2323, https://doi.org/10.5194/cp-16-2275-2020, 2020.
Sun, Y., Ramstein, G., Contoux, C., and Zhou, T.: A comparative study of large-scale atmospheric circulation in the context of a future scenario (RCP4.5) and past warmth (mid-Pliocene), Clim. Past, 9, 1613–1627, https://doi.org/10.5194/cp-9-1613-2013, 2013.
Sutton, R. T., Dong, B., and Gregory, J. M.: Land/sea warming ratio in response to climate change: IPCC AR4 model results and comparison with observations, Geophys. Res. Lett., 34, 2–6, https://doi.org/10.1029/2006GL028164, 2007.
Tan, N., Contoux, C., Ramstein, G., Sun, Y., Dumas, C., Sepulchre, P., and Guo, Z.: Modeling a modern-like pCO2 warm period (Marine Isotope Stage KM5c) with two versions of an Institut Pierre Simon Laplace atmosphere–ocean coupled general circulation model, Clim. Past, 16, 1–16, https://doi.org/10.5194/cp-16-1-2020, 2020.
Thorncroft, C. D., Nguyen, H., Zhang, C., and Peyrille, P.: Annual cycle of the West African monsoon: Regional circulations and associated water vapour transport, Q. J. Roy. Meteor. Soc., 137, 129–147, https://doi.org/10.1002/qj.728, 2011.
Tripati, A. K., Roberts, C. D., and Eagle, R. A.: Coupling of CO2 and Ice sheet stability over major climate transitions of the last 20 million years, Science, 326, 1394–1397, https://doi.org/10.1126/science.1178296, 2009.
Wan, S., Tian, J., Steinke, S., Li, A., and Li, T.: Evolution and variability of the East Asian summer monsoon during the Pliocene: Evidence from clay mineral records of the South China Sea, Palaeogeogr. Palaeocl., 293, 237–247, https://doi.org/10.1016/j.palaeo.2010.05.025, 2010.
Williams, C. J. R., Sellar, A. A., Ren, X., Haywood, A. M., Hopcroft, P., Hunter, S. J., Roberts, W. H. G., Smith, R. S., Stone, E. J., Tindall, J. C., and Lunt, D. J.: Simulation of the mid-Pliocene Warm Period using HadGEM3: Experimental design and results from model-model and model-data comparison, Clim. Past Discuss. [preprint], https://doi.org/10.5194/cp-2021-40, in review, 2021.
Zhang, Q., Berntell, E., Axelsson, J., Chen, J., Han, Z., de Nooijer, W., Lu, Z., Li, Q., Zhang, Q., Wyser, K., and Yang, S.: Simulating the mid-Holocene, last interglacial and mid-Pliocene climate with EC-Earth3-LR, Geosci. Model Dev., 14, 1147–1169, https://doi.org/10.5194/gmd-14-1147-2021, 2021.
Zhang, R., Zhang, Z., Jiang, D., Yan, Q., Zhou, X., and Cheng, Z.: Strengthened African summer monsoon in the mid-Piacenzian, Adv. Atmos. Sci., 33, 1061–1070, https://doi.org/10.1007/s00376-016-5215-y, 2016.
Zhang, Y. G., Pagani, M., Liu, Z., Bohaty, S. M., and Deconto, R.: A 40-million-year history of atmospheric CO2, Philos. T. R. Soc. A, 371, 20130096, https://doi.org/10.1098/rsta.2013.0096, 2013.
Zhang, Z., Li, X., Guo, C., Otterå, O. H., Nisancioglu, K. H., Tan, N., Contoux, C., Ramstein, G., Feng, R., Otto-Bliesner, B. L., Brady, E., Chandan, D., Peltier, W. R., Baatsen, M. L. J., von der Heydt, A. S., Weiffenbach, J. E., Stepanek, C., Lohmann, G., Zhang, Q., Li, Q., Chandler, M. A., Sohl, L. E., Haywood, A. M., Hunter, S. J., Tindall, J. C., Williams, C., Lunt, D. J., Chan, W.-L., and Abe-Ouchi, A.: Mid-Pliocene Atlantic Meridional Overturning Circulation simulated in PlioMIP2, Clim. Past, 17, 529–543, https://doi.org/10.5194/cp-17-529-2021, 2021.