the Creative Commons Attribution 4.0 License.
the Creative Commons Attribution 4.0 License.
 | 23 Dec 2020
Pliocene expansion of C4 vegetation in the Core Monsoon Zone on the Indian Peninsula
Liviu Giosan
Yongsong Huang
The expansion of C4 vegetation during the Neogene was one of the largest reorganizations of Earth's terrestrial biome. Once thought to be globally synchronous in the late Miocene, site-specific studies have revealed differences in the timing of the expansion and suggest that local conditions play a substantial role. Here, we examine the expansion of C4 vegetation on the Indian Peninsula since the late Miocene by constructing a ∼6-million-year paleorecord with marine sediment from the Bay of Bengal at Site U1445, drilled during International Ocean Discovery Program Expedition 353. Analyses of element concentrations indicate that the marine sediment originates from the Mahanadi River in the Core Monsoon Zone (CMZ) of the Indian Peninsula. Hydrogen isotopes of the fatty acids of leaf waxes reveal an overall decrease in the CMZ precipitation since the late Miocene. Carbon isotopes of the leaf wax fatty acids suggest C4 vegetation on the Indian Peninsula existed before the end of the Miocene but expanded to even higher abundances during the mid-Pliocene to mid-Pleistocene (∼3.5 to 1.5 million years ago). Similar to the CMZ on the Indian Peninsula, a Pliocene expansion or re-expansion has previously been observed in northwest Australia and in East Africa, suggesting that these tropical ecosystems surrounding the Indian Ocean remained highly sensitive to changes in hydroclimate after the initial spread of C4 plants in late Miocene.
- Article
(4119 KB) - Full-text XML
-
Supplement
(207 KB) - BibTeX
- EndNote


The expansion of plants using the C4 photosynthetic pathway is one of the most dramatic reorganizations of the global biome during the Neogene. A widespread late-Miocene expansion (8 to 6 Ma) is well documented, and many studies have interpreted the broadly synchronous timing as ecosystems adapting to decreasing pCO2 (e.g., Ehleringer et al., 1991; Ehleringer and Cerling, 1995; Cerling et al., 1993, 1997; Herbert et al., 2016). However, an increasing number of studies have shown that the timing, regional patterns, rate, and drivers of C4 grassland expansion were much more diverse and complex (An et al., 2005; Behrensmeyer et al., 2007; Huang et al., 2007; Edwards et al., 2010; Zhou et al., 2014). Along with low pCO2, a C4 photosynthetic pathway is better adapted to higher temperature, aridity, seasonality, and during disturbances such as flood, droughts, and fires (e.g., Edwards et al., 2010, and references therein). The interplay of these parameters varies amongst regions. Resolving the precise timing and factors leading to major changes in vegetation demands site-specific studies (Strömberg, 2011; Zhou et al., 2014).
Our study provides a novel piece of the puzzle in unraveling the complexities of C4 expansion by constructing a 6-million-year (Myr) record of C4 vegetation and aridity on the Indian Peninsula. The marine sediment record is from International Ocean Discovery Program (IODP) Site U1445 (17∘44.72′ N, 84∘47.25′ E; 2503 m water depth; Fig. 1a) drilled in the Bay of Bengal (BoB) close to the mouths of the Mahanadi River. Lithologies at Site U1445 include calcareous fossils, biosilica, silt, and clays (including glauconite), and are generally described as hemipelagic sediment (Clemens et al., 2016). The Indian monsoon dictates climate patterns in the Mahanadi River drainage basin: rainy summers, dry winters, and an annual reversal of wind direction (Gadgil, 2003; Sarkar et al., 2015). Highly sensitive to the seasonal changes, more than 80 % of runoff from the Mahanadi River into the BoB occurs during the summer (Chakrapani and Subramanian, 1990).
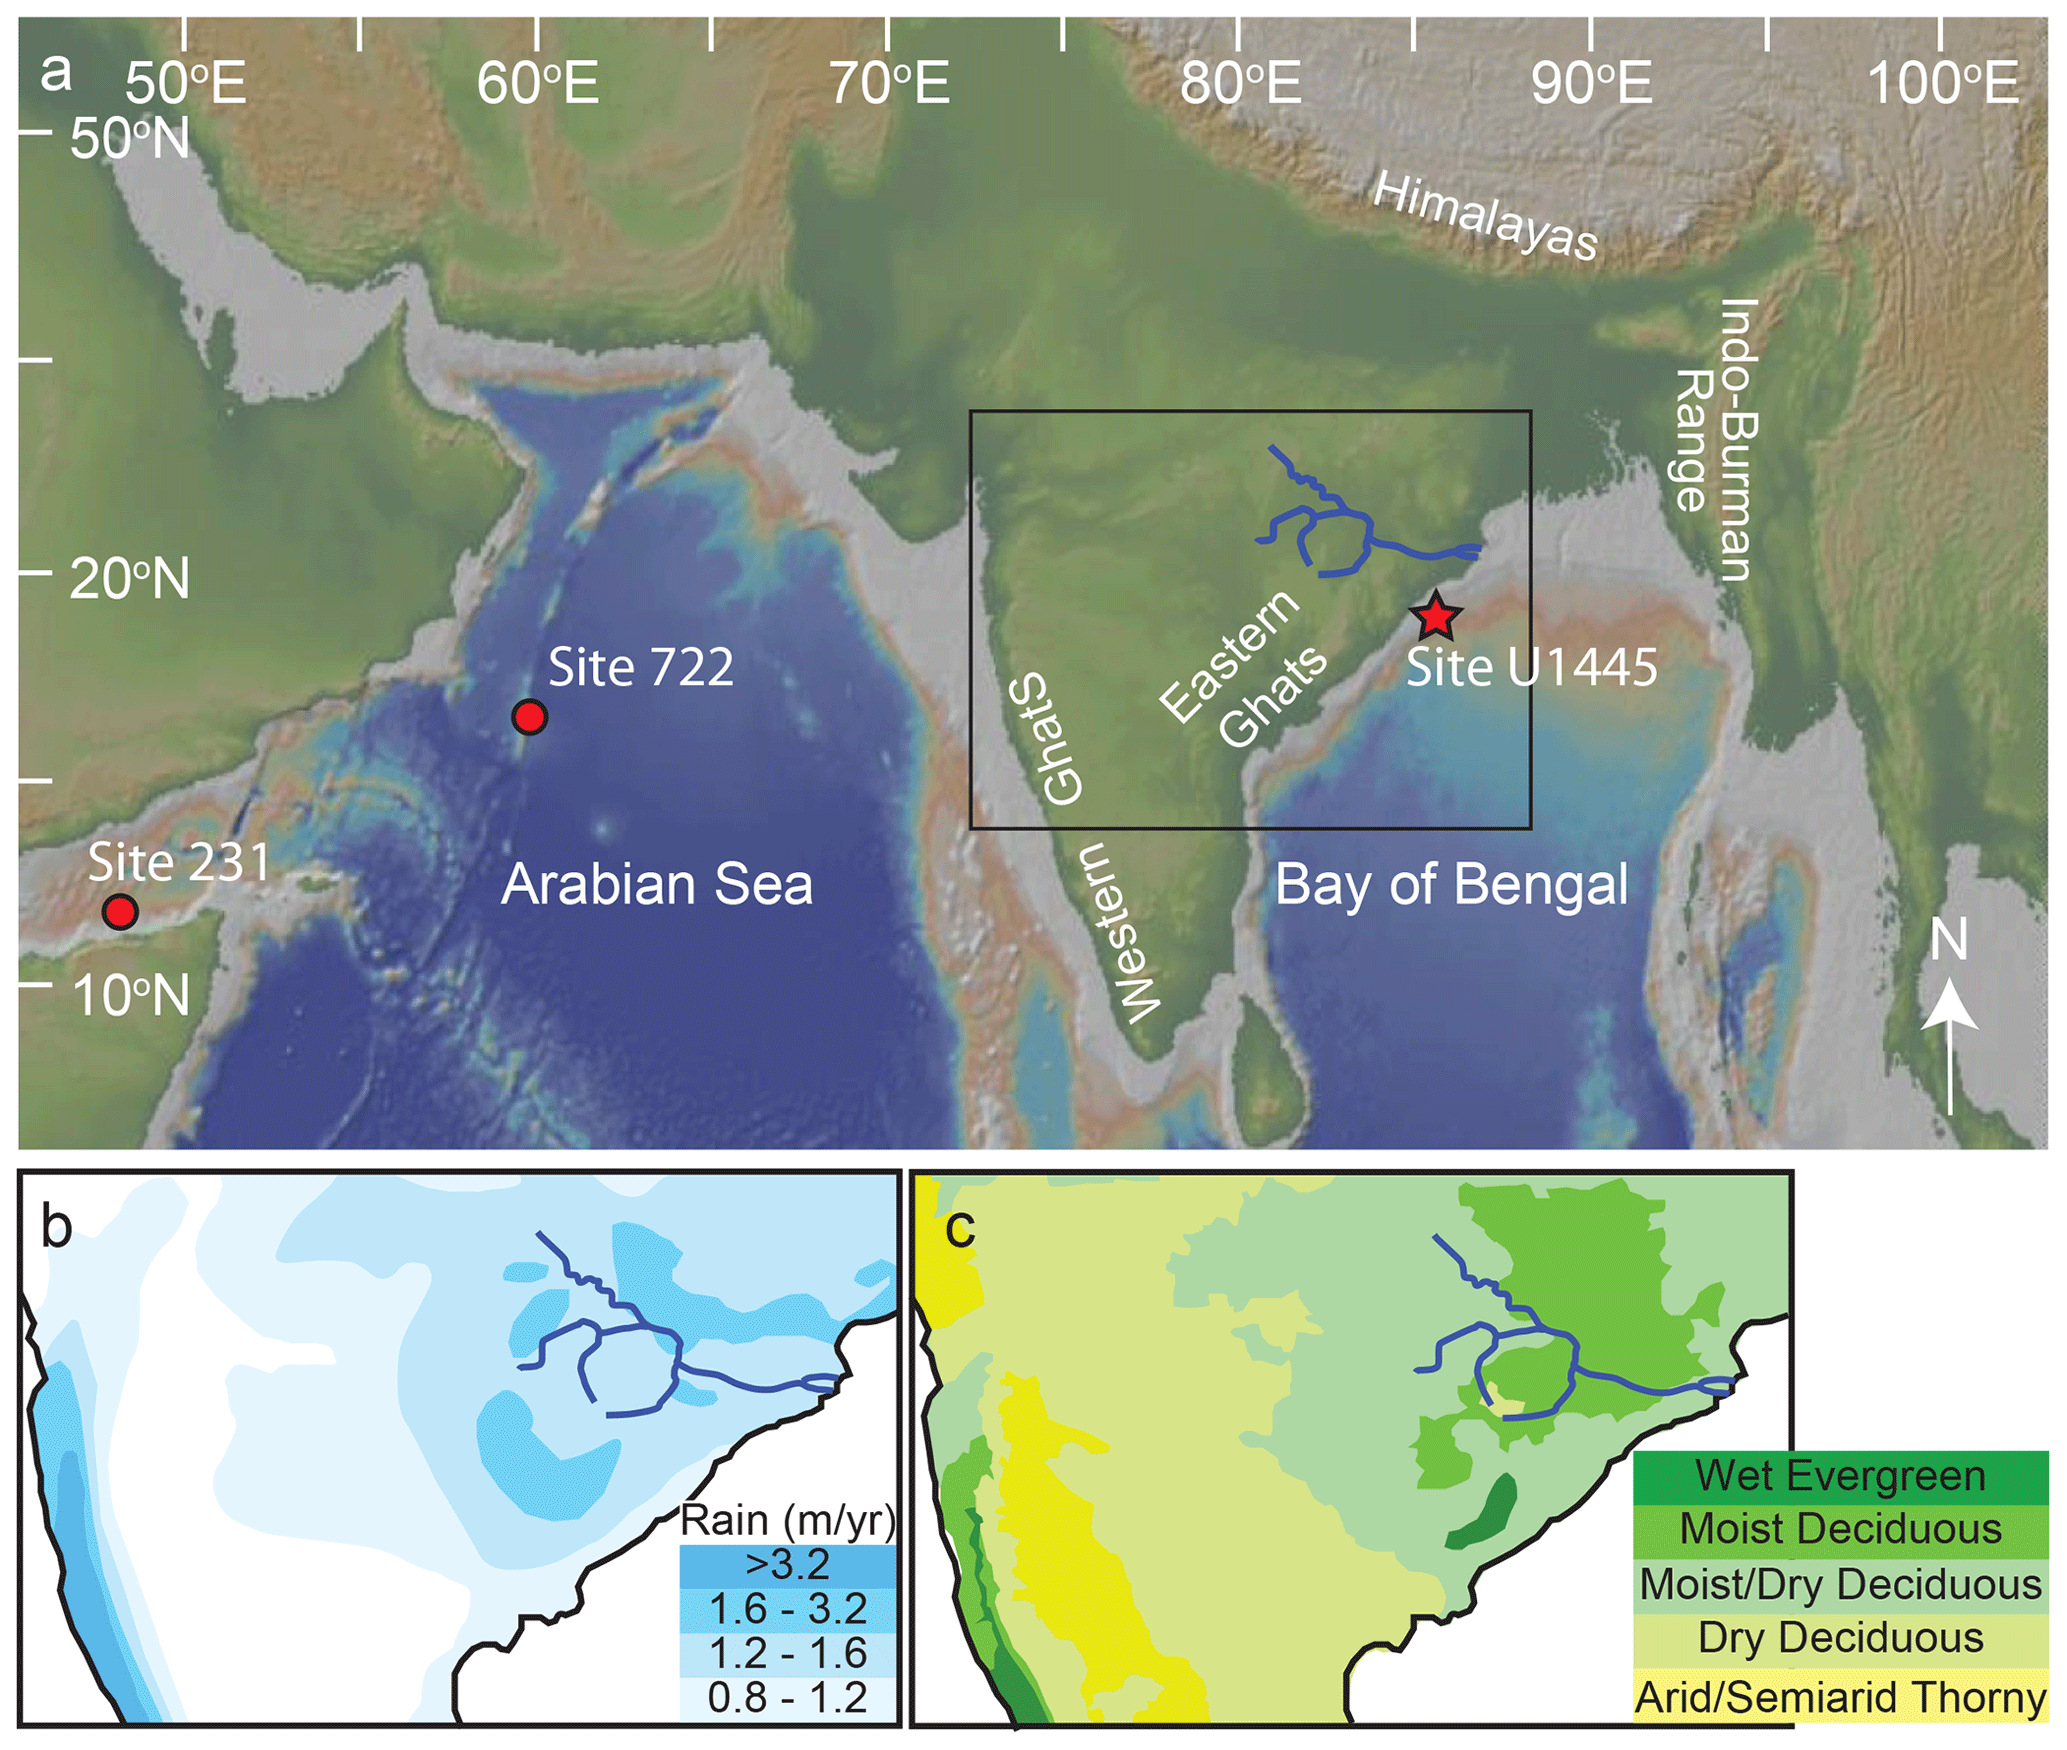
Figure 1(a) Location of IODP Site U1445 in the Bay of Bengal (red star). Site 231 in the Gulf of Aden and Site 722 in the Arabian Sea are plotted for reference (red dots). The topography and bathymetry are represented in the background map. The Mahanadi River and its main tributaries are traced in dark blue. The region shown in the box outlines the zoomed-in area in panels (b) and (c), which are modified from Ponton et al. (2012). (b) Average annual rainfall (meters per year) and (c) natural ecosystems in the region including the Mahanadi River drainage basin.
Previous reconstructions of Neogene C4 expansion in regions affected by the Indian monsoon use deposits originating from the Himalayas and their piedmont regions (France-Lanord and Derry, 1994; Quade and Cerling, 1995; Quade et al., 1995; Cerling et al., 1997; Freeman and Colarusso, 2001; Sanyal et al., 2004; Behrensmeyer et al., 2007; Galy et al., 2010; Ghosh et al., 2017). The Mahanadi River drains a relatively low-elevation region of the Indian Peninsula distinct from the nearby mountain ranges (e.g., the Western Ghats, the Himalayas, the Indo-Burman ranges; Fig. 1; Xie et al., 2006). With minimal orographic precipitation in the Mahanadi River basin, rainfall in this “Core Monsoon Zone” (CMZ) represents the mean behavior of the Indian monsoon (Fig. 1; Ponton et al., 2012; Sarkar et al., 2015; Giosan et al., 2017, and references therein).
Although agriculture dominates present-day vegetation, models of seasonal climate predict that the natural flora of the Mahanadi Basin would be closed-canopy, moist deciduous forests and moist-to-dry woodlands with rare open spaces (Fig. 1c; Zorzi et al., 2015, and references therein). Today, the region encompasses a range of C3 and C4 vegetation, but proxies and models suggest that the plant communities are highly sensitive to glacial–interglacial changes with nearly all flora utilizing a C4 pathway during the last glacial maximum (Galy et al., 2008; Phillips et al., 2014; Zorzi et al., 2015, and references therein). The behavior of vegetation in the CMZ over million-year timescales is unknown.
Here, we use inorganic bulk geochemical analyses to fingerprint the origin of sediment at Site U1445 as being from the Mahanadi River. Then, we use bulk organic and compound-specific biomarkers at the same site, including carbon and hydrogen isotope measurements of leaf wax fatty acids, to reconstruct the changes in C4 vegetation and rainfall in the CMZ of the Indian Peninsula over the last ∼6 Myr (Fig. 2).
Over million-year timescales, Site U1445 had a constant sedimentation rate ( m Myr−1; Clemens et al., 2016). We fit a locally weighted spline to biostratigraphic and magnetostratigraphic age constraints from Hole U1445A (Clemens et al., 2016) using CLAM software in R (Blaauw, 2010) to estimate the age of our samples (Fig. A1). Our samples and the age constraints were from the same hole. Uncertainty on the ages is estimated to be less than ±0.2 Myr. Shipboard scientists observed thin turbiditic sequences (∼2–20 cm thick) throughout Site U1445 and the expansion and dissociation of gas hydrates upon recovery that may muddle a higher-resolution record (Clemens et al., 2016). However, Site U1445 has fewer and smaller turbidite deposits relative to other sites drilled in this region, and the records spanning million-year timescales are likely relatively undisturbed.
To determine sediment provenance, we measured major, trace, and rare earth element concentrations on 30 bulk sediment samples spanning 0 to 6 Myr including light and dark layers of sediment (Sect. 2.1). To reconstruct hydrological and vegetation changes, we analyzed bulk organics (Sect. 2.2) as well as compound-specific biomarkers (Sect. 2.3) from 57 samples. We constructed the sampling plan to characterize the differences in organic content and isotope composition between the lighter and darker layers of sediment. As such, samples for organic and biomarker analysis were collected from Site U1445 in pairs, visually targeting relatively light and dark layers at similar depths to capture the variability range on shorter timescales while characterizing longer trends.
2.1 Inorganic analyses of bulk major, trace, and rare earth element concentrations
The samples that we analyzed for major, trace, and rare earth element concentrations were originally collected for moisture and density (MAD) measurements onboard the JOIDES Resolution during IODP Expedition 353. Each sample was collected with a 2 cm diameter plastic syringe that fits into the top of a 10 cm3 glass vial, allowing for the vial to be completely filled with sediment (Clemens et al., 2016). The samples were dried in a convective oven at for 24 h (Clemens et al., 2016). The remaining sample preparation, digestions, and analyses were conducted at Boston University, and a detailed description of the analytical geochemical procedures are presented in Dunlea et al. (2015). In summary, sediment samples were hand-powdered with an agate mortar and pestle. For major elements, sample powders were digested by flux fusion (Murray et al., 2000) and analyzed by inductively coupled plasma-emission spectrometry (ICP-ES). For analysis of trace and rare earth elements, sample powders were dissolved in a heated acid cocktail (HNO3, HCl, and HF, with later additions of HNO3 and H2O2 after samples were dried down) under clean-lab conditions and analyzed by inductively couple plasma-mass spectrometry (ICP-MS). Three separate digestions of a matrix-matched in-house sediment standard were analyzed with each batch and determined precision [(standard deviation)∕(average)x100] was ∼2 % of the measured value for each element. The international Standard Reference Material BHVO-2 was analyzed as an unknown with each batch, and the results were consistently found to be accurate within precision for each element.
2.2 Analyses of carbon and nitrogen content and isotopes
Analyses of the abundance of total carbon (TC), total inorganic carbon (TIC), total organic carbon (TOC), nitrogen (N), and the δ13C of the TOC component were performed at Woods Hole Oceanographic Institution, and the methods are described in Whiteside et al. (2011). In brief, samples for TOC were weighed into tared silver boats and then acidified to remove carbonates in a closed desiccator for 3 d at 60–65 ∘C over concentrated HCl. All samples were flash-combusted in a Costech 4010 elemental analyzer coupled via a Finnigan-MAT Conflo II interface to a Thermo DELTA V Plus isotope ratio mass spectrometer. Data were recorded and integrated using the Isodat software package. Post-run calculations were performed for blank corrections, quantifications, and final calibrations.
2.3 Isotope analyses of compound-specific biomarkers
The analyses of compound-specific biomarkers were performed at Brown University (e.g., Daniels et al., 2017). Samples were freeze-dried and lipids were extracted from 3.5 to 4.5 g of sediment using a Dionex 350 accelerated solvent extractor (ASE) with dichloromethane : methanol (9:1 v∕v). The fatty acids in the total lipid extract were separated from the neutral lipids using aminopropyl silica gel chromatography, eluting with a dichloromethane : isopropanol solution followed by ether with 5 % acetic acid.
The fatty acids were methylated to form fatty acid methyl ester (FAME) by dissolving the dried down acid fraction in ∼0.3 mL of toluene and ∼1 mL of 5:95 acetyl chloride : methanol with known isotopic composition. Nitrogen replaced the headspace in the vial before they were capped tightly and heated at 60 ∘C for 12 h. Once the reaction was complete, the FAMEs were separated from the water by-products formed during the methylation reaction. Samples received ∼1 mL of synthetic saline solution (50 g NaCl L−1 of double-distilled water) and ∼1 mL of hexane, were vigorously shaken, and were then allowed to rest until the hexane separated from the water. The hexane fraction was pipetted into a new vial, avoiding the water. Another ∼1 mL of hexane was added to the sample, shaken, and pipetted into the new vial. To clean the solution and isolate the fatty acids, samples were run through a second silica gel column, eluting with hexane to remove unwanted acids and then dichloromethane to acquire the clean FAME fraction.
The FAME fraction was analyzed on an Agilent 6890 gas chromatograph with a flame ionization detector (GC-FID). Sample blanks were analyzed with every batch. The isotope ratios of the FAME fraction (δDn−acid and δ13Cn−acid) were measured on a Thermo Finnigan Deltaplus XL isotope ratio mass spectrometer with a HP 6890 gas chromatograph and a high-temperature pyrolysis reactor for sample introduction. For δD, three injections of each sample were analyzed, and for δ13C, two injections of each sample were analyzed. Between every six injections, an in-house lab standard mixture containing known amounts of various n-acids was analyzed to monitor instrument accuracy and precision. The δD and δ13C were corrected for the methyl groups added during derivatization using the following equations:
and
where n is the carbon chain length of the compound, and the methanol added has δD ‰ and δ13C ‰. Analytical uncertainty was calculated by [standard deviation∕average] of the injections and is typically less than 3 % for δD and less than 1 % for δ13C. The standard deviations are reported in Table S3 in the Supplement. For every instrument run, samples were analyzed in random order.
2.4 Correction of plant physiological effects on δD
We corrected the δD for differences in C3 versus C4 plant physiology (Fig. E1; Smith and Freeman, 2006; Chikaraishi and Naraoka, 2007). First, we calculated the fraction of C3 versus C4 vegetation with δ13CFA for each sample, estimating that C3 and C4 vegetation have a δ13CFA of ‰ and ‰, respectively (Chikaraishi et al., 2004; Ponton et al., 2012). Then, we approximate that C3 plants have a δD that is 30 ‰ lighter than C4 plants (Smith and Freeman, 2006; Chikaraishi and Naraoka, 2007; Ghosh et al., 2017) and use the fraction of C3 versus C4 to correct the δD of each sample for the differences in plant physiology (Fig. E1). The corrected data show the same overall trend as the uncorrected data, except the values are shifted to be more negative and the overall change in δD is steeper (Fig. E1).
To determine the provenance of the aluminosilicate fraction, we examined the proportions of Al, Ti, Sc, Nb, La, and Th concentrations, because other elements (e.g., Fe, K, Mg, Si, Zr, Hf) may be affected by continental weathering, sorting during transport, and post-depositional authigenic processes. The results from 30 samples have almost constant element proportions of the selected elements, indicating that the aluminosilicate fraction of sediment did not significantly vary over the past 6 Myr. The composition of the 30 samples, even amongst the light and dark layers, matches the composition of lithologies that comprise the Mahanadi Basin such as Precambrian granite and gneisses of the Indian Craton and associated sedimentary deposits (Sharma, 2009; Fig. B1; Table S1). Marine sediment deposits in other parts of the Bay of Bengal closer to the Krishna and Godavari rivers or the Ganges and Brahmaputra rivers have a more mafic or highly variable composition that is not observed at Site U1445 (e.g., Tripathy et al., 2014; Fig. B1). As such, we interpret our results as recording terrestrial changes in the CMZ, specifically the Mahanadi drainage basin.
The pairs of samples used for organic analyses are spaced ∼28 m apart (∼260 kyr intervals), and the adjacent light and dark layers within each pair were 0.2 to 4.3 m apart in the sediment core (2 to 46 kyr; Fig. A1). The color difference can be related to the total organic carbon content (wt %; TOC) and total nitrogen content with darker layers having 1.0 to 2.8 times more than adjacent lighter layers (Figs. 2a, C1; Table S2).
Long-chain normal fatty acids of leaf waxes are derived from land plants and are well preserved during transport and burial in marine sediment (Eglinton and Eglinton, 2008). We focus on the C30 chain length to avoid possible contamination from non-terrestrial sources that contribute shorter-chain-length fatty acids (Fig. D1; Table S3). The results of the δ13C of C30 fatty acid of leaf waxes (δ13CFA) show a 5 ‰ increase from mid-Pliocene to mid-Pleistocene (∼3.5 to ∼1.5 Ma), after which δ13CFA decreases and becomes more variable from ∼1.5 Ma to the present (Fig. 2b). The hydrogen isotope compositions of the leaf wax fatty acids (δDFA) increase gradually over the past 6 Myr, but they have a wide range amongst light and dark layers and shorter time intervals (Fig. 2c; Table S3). Comparing the earlier and later time intervals when δ13CFA changes, before the mid-Pliocene (3.5 Ma), δDFA ranges from −179 ‰ to −147 ‰, and after the mid-Pleistocene (1.5 Ma), the δDFA increases to between −166 ‰ and −126 ‰ (Fig. 2c).
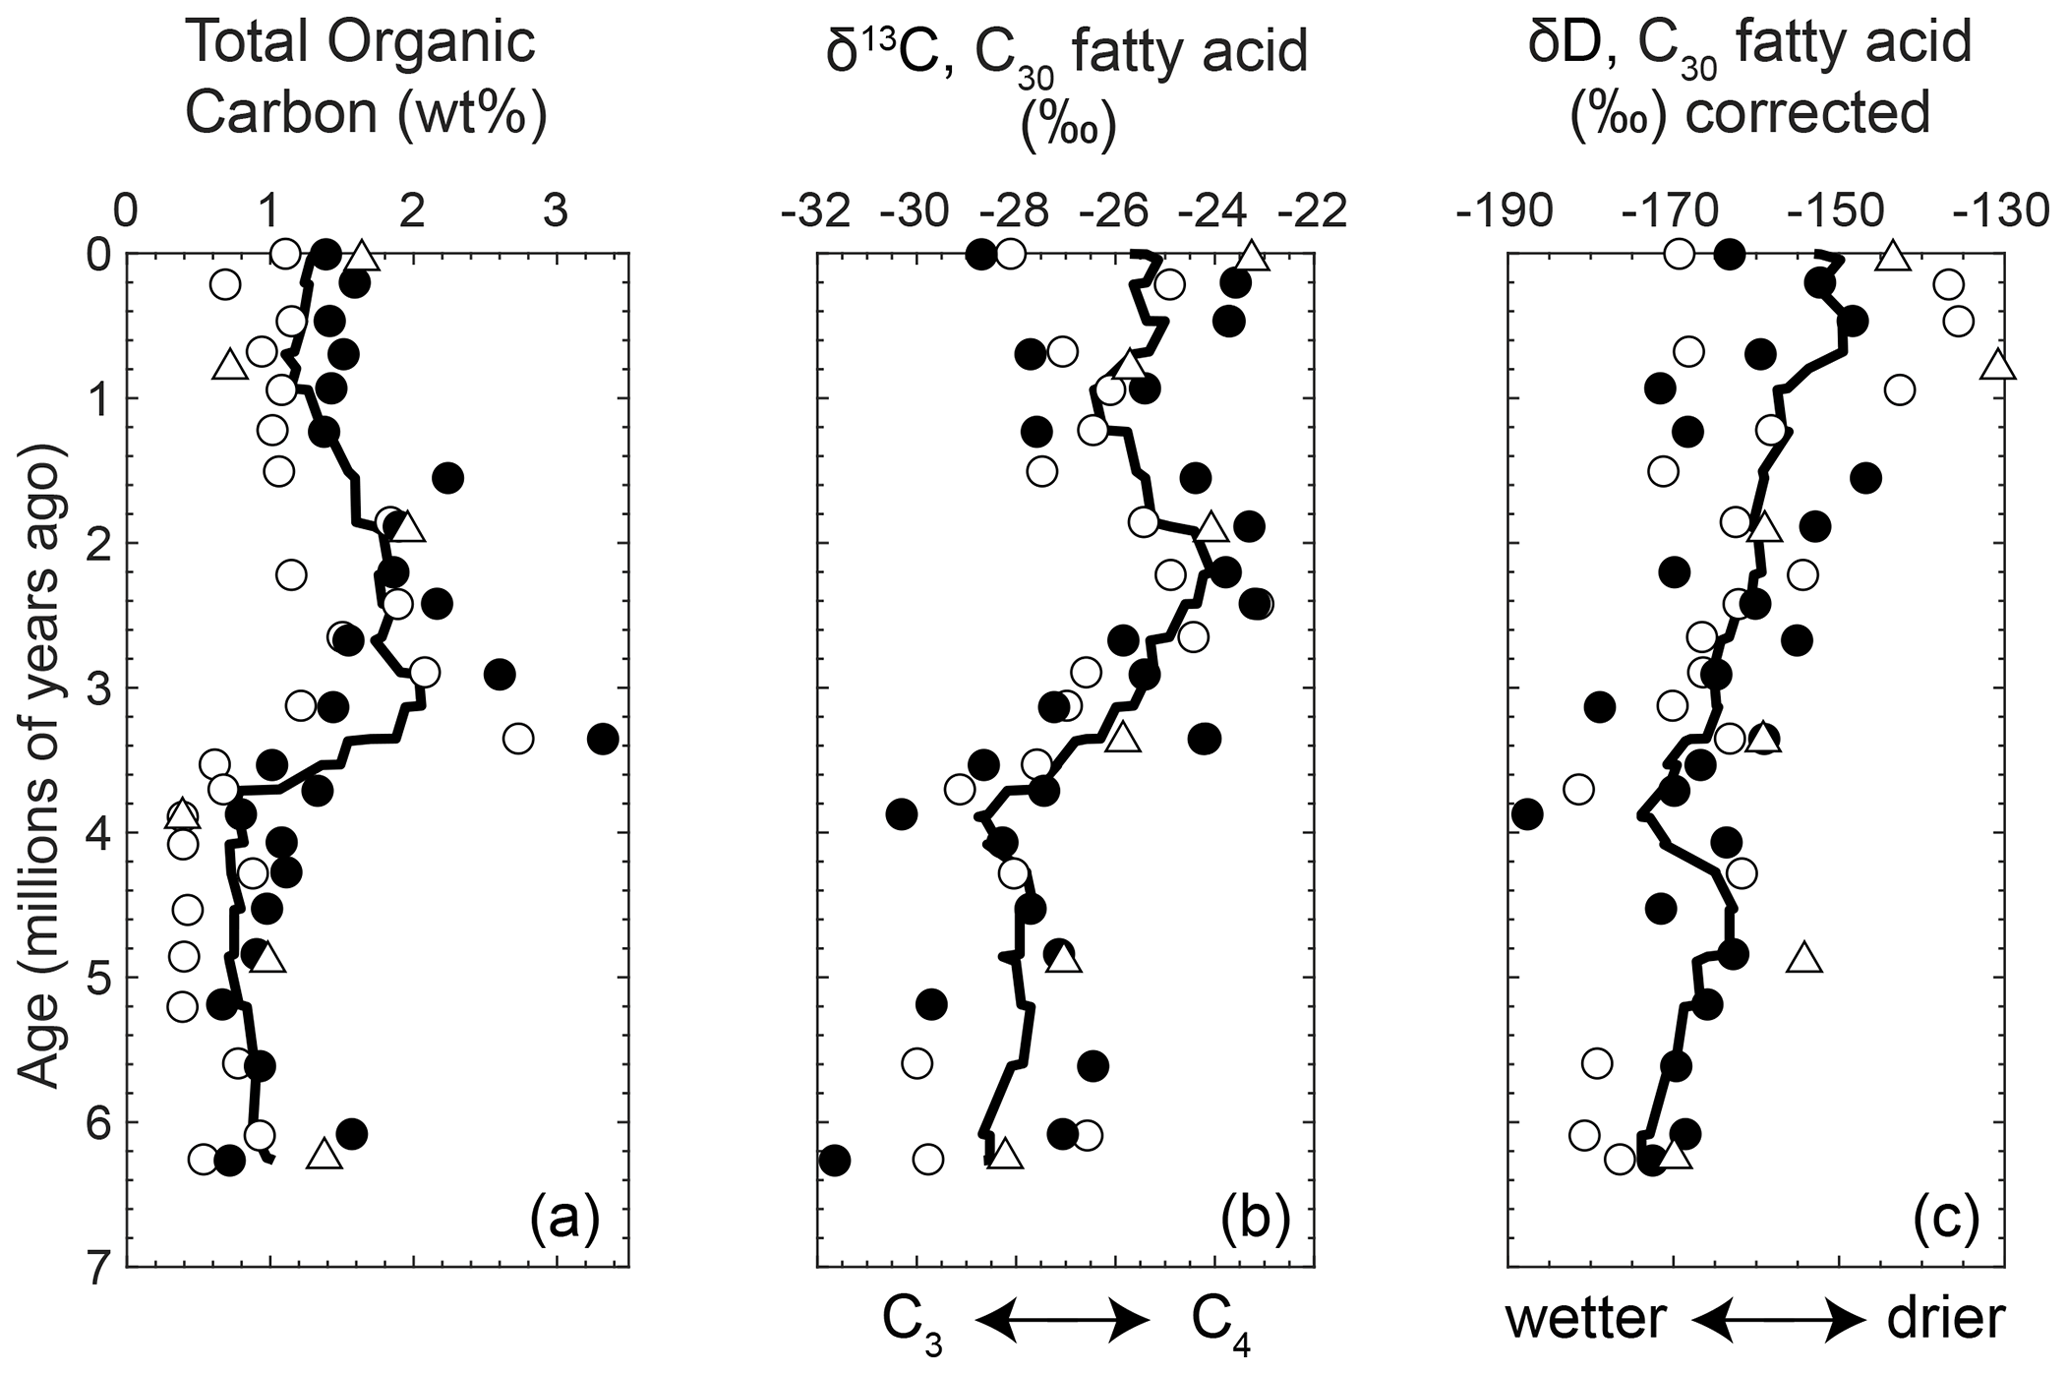
Figure 2Analyses of 57 samples from Site U1445 in the Bay of Bengal plotted with age (Ma) and (a) total organic carbon (wt %), (b) carbon isotope values of C30 fatty acids from leaf waxes (δ13CFA, ‰), and (c) hydrogen isotope values of C30 fatty acids from leaf waxes (δDFA, ‰). The black and white dots are pairs of samples from relatively dark and light layers, respectively, at a similar depth. Triangles are samples not in pairs. The black curves are a nine-point moving average of all samples.
4.1 C4 expansion on the Indian Peninsula
The δ13CFA of terrestrial plants is primarily a function of the photosynthetic pathway and isotopic composition of atmospheric CO2 (e.g., Farquhar et al., 1989). In this study, the 5 ‰ increase in δ13CFA is greater than the reconstructed δ13C of atmospheric CO2 (≤1 ‰; Tipple et al., 2010), suggesting that a correction for would only slightly adjust our results. Thus, we interpret δ13CFA as reflecting the amount of C4 relative to C3 vegetation produced in the CMZ.
From ∼6 Ma until ∼3.5 Ma, approximately 51 % to 81 % (mean 69 % ±9 % SD) of the vegetation in the CMZ utilized a C4 photosynthetic pathway (Fig. E1). Thus, the environmental threshold for the C4 photosynthetic pathway had already been crossed before the end of the late Miocene. Later in the mid-Pliocene, the reconstruction shows another distinct expansion reaching 64 % to 92 % (mean 81 % ±7 % SD) of C4 vegetation in the early Pleistocene (Fig. 2b). The change in vegetation from ∼3.5 to ∼1.5 Ma suggests multiple steps of C4 expansion in the CMZ, rather than a singular late-Miocene expansion. From ∼1.5 Ma to the present, the average proportion of C4 vegetation decreased and became more variable (58 % to 92 %, mean 76 % ±10 % SD; Fig. 2b), which may reflect the sensitivity of the region to glacial–interglacial variations observed in shorter records from this region (e.g., Zorzi et al., 2015, and references therein).
4.2 Aridification of the Indian Peninsula
After correcting for the effects of plant physiology (Sect. 2.4), the amount of precipitation and mixing of different air masses can each vary the hydrogen isotopic composition of leaf wax fatty acids (δDFA; e.g., Eglinton and Eglinton, 2008). The mixing of two air masses with unique δD values was recently observed to drive δD of rainfall in New Delhi, India, but, similar to the amount of precipitation, the relatively depleted δD corresponded to wetter conditions (Hein et al., 2017). Thus, we interpreted the δDFA in this study as a qualitative proxy for aridity or the relative amount of precipitation. The δDFA results suggest an overall drying of the CMZ on the Indian Peninsula over the past 6 Myr. The shorter-term scatter in the δDFA record may reflect higher frequency variations in aridity or rainfall.
4.3 Patterns of C4 expansion surrounding the Indian Ocean
In this section, we compare our record of C4 expansion with other compound-specific biomarker records of C4 expansion at sites in the Indian Ocean or the adjacent land and seas. Multiple proxy records document a late-Miocene C4 expansion in the Ganges or Brahmaputra river basins such as the Siwalik Group in northern Pakistan or BoB sites receiving outflow sediment (Fig. 3c, France-Lanord and Derry, 1994; Quade and Cerling, 1995; Cerling et al., 1997; Freeman and Colarusso, 2001; Sanyal et al., 2004; Behrensmeyer et al., 2007; Ghosh et al., 2017). Collectively, the reported timing of C4 expansions in the Himalaya region ranges from 9 to 5 Myr, most commonly 8 to 6 Myr (Behrensmeyer et al., 2007). Rather than a uniform timing, detailed sampling of various deposits around the Siwalik regions shows that C4 vegetation expansion was staggered amongst nearby sub-environments with different local conditions (Ghosh et al., 2017, and references therein). Another biomarker record documents a late-Miocene expansion in a wide continental region north and west of the Arabian Sea (Site 722; Figs. 1a, 3d; Huang et al., 2007). Once C4 vegetation expanded at each of these sites, the records suggest there is generally little or no systematic change in the amount of C4 vegetation after the late Miocene.
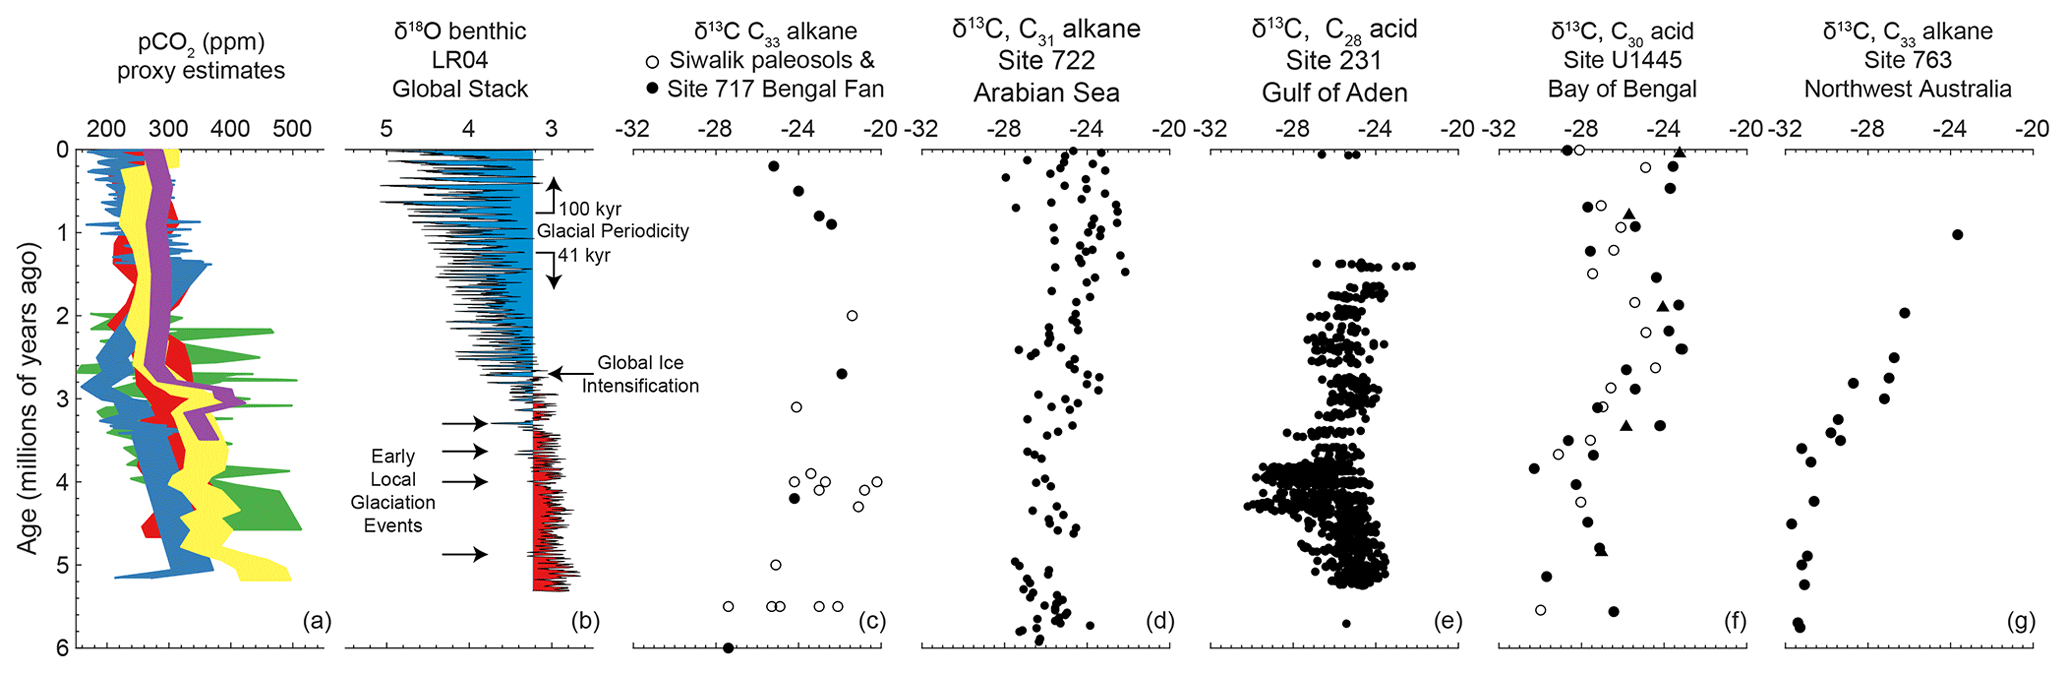
Figure 3(a) Proxy estimates of pCO2 over the past 6 Myr (green, δ11B, Bartoli et al., 2011; red, alkenone, Pagani et al., 2009; blue, B∕Ca Tripati et al., 2009; yellow, alkenone, Seki et al., 2010; purple, δ11B, Seki et al., 2010). (b) LR04 global stack of benthic δ18O records as a proxy for global ice volume (Lisiecki and Raymo, 2005) with arrows marking early glaciation events (De Schepper et al., 2014). Blue and red highlight values above and below modern δ18O, respectively. (c) δ13C of C33 alkanes from Siwalik paleosols in northern Pakistan (white dots) and from sediment at Site 717 in the Bengal Fan (black dots; Freeman and Colarusso, 2001). (d) δ13C of C31 alkanes at Site 722 in the Arabian Sea (Huang et al., 2007), which integrates vegetation variability from north and east of the Arabian Sea. (e) δ13C of C28 fatty acids at Site 231 in the Gulf of Aden, which records vegetation in East Africa (Feakins et al., 2013; Liddy et al., 2016). (f) δ13C of C30 fatty acid at Site U1445 in the Bay of Bengal, which records vegetation from the Mahanadi Basin on the Indian Peninsula (this study). (g) δ13C of C33 alkanes from northwest Australia (Andrae et al., 2018).
In contrast, the CMZ of the Indian Peninsula and a few other records around the Indian Ocean document an expansion of C4 vegetation during the Pliocene (Fig. 3). Marine deposits in the Gulf of Aden originate from northeast Africa and record a late-Miocene C4 expansion, followed by a relapse to predominantly C3 vegetation ∼4.3 Ma and a re-expansion of C4 plants in the Pliocene (Site 231; Figs. 1a, 3e; Feakins et al., 2005, 2013; Liddy et al., 2016). The Pliocene re-expansion is consistent with other records from tropical East Africa (e.g., Levin et al., 2004; Cerling et al., 2011). A C4 expansion in the Pliocene is also observed in northwest Australia (Site 763A; Fig. 3g; Andrae et al., 2018). There is little evidence of significant C4 vegetation prior to the Pliocene, suggesting a relatively late onset of C4 vegetation expansion in northwest Australia (Fig. 3). Additionally, there is evidence that East, South, and Central Asia experienced multiple steps of C4 expansion through the Pliocene (e.g., An et al., 2005; Passey et al., 2009; Zhou et al., 2014; Miao et al., 2017; Koutsodendris et al., 2019). Collectively, a significant regional expansion in the Pliocene, distinctly after the first late-Miocene expansion, is common at least amongst tropical East Africa, northwest Australia, Asia, and the Indian Peninsula.
4.4 Triggers of C4 expansion in the Pliocene
The adaptations of the C4 photosynthetic pathway provides a competitive advantage over C3 vegetation in environmental conditions with low pCO2, high temperature, high aridity, or extreme seasonality that can lead to frequent floods, droughts, and fires (e.g., Edwards et al., 2010, and references therein). Many studies hypothesize that the global expansion of C4 vegetation in the late Miocene was triggered by pCO2 decreasing below a temperature-dependent threshold (e.g. Polissar et al., 2019; Herbert et al., 2016, and references therein). During the Pliocene, decreasing pCO2 may have also contributed to the expansion of C4 vegetation (Fig. 3a; Pagani et al., 2009; Tripati et al., 2009; Seki et al., 2010; Bartoli et al., 2011). However, the heterogenous regional response of the Pliocene C4 expansion suggests pCO2 cannot be the only driver. Given that the Pliocene C4 expansion is observed in multiple regions surrounding the Indian Ocean that have highly seasonal rainfall, regional hydrodynamics likely played a role in the Pliocene C4 expansion.
In the modern era, a complex interplay of multiple modes of variability dictate the unique seasonal and multi-decadal precipitation patterns in the regions surrounding the Indian Ocean. For example, rainfall on the Indian Peninsula follows quintessential monsoon behavior, but it is also tied to the intertropical convergence zone (ITCZ), the Walker circulation, and the Indian Ocean dipole (IOD; Gadgil, 2003; Wang et al., 2017). The biannual rains of the (semi)arid tropical East Africa are related to the ITCZ, monsoon winds, the sea surface temperature (SST), and the Walker circulation (e.g., Williams and Funk, 2011; Tierney et al., 2015; Yang et al., 2015). Monsoon rains annually quench northern Australia, but the El Niño–Southern Oscillation (ENSO), the Walker circulation, and the amount of Indonesian Throughflow (ITF) better explain the precipitation in other parts of Australia (Ummenhofer et al., 2009, 2011a, b). Previous studies reason that changes in monsoon precipitation or the frequency of fires likely triggered local expansion of C4 vegetation (An et al., 2005; Passey et al., 2009; Zhou et al., 2014; Miao et al., 2017; Andrae et al., 2018). However, the sampling resolution of our million-year study cannot resolve these seasonal, decadal, or centennial rhythms in precipitation, so we examine the underlying processes driving variations in each of these modes of variability.
The physical mechanism of each of these modes of variability can be related back to atmospheric pressure gradients. Monsoons are classically defined as a seasonal wind reversal induced by the pressure gradient caused by differential heating of land and sea (Wang et al., 2017). Broadly, the ITCZ is formed by the convergence and uplift of air masses near the Equator due to differential heating between low and high latitudes and the formation of Hadley cells. The IOD and ENSO are cyclic changes in the zonal gradient across the Indian and Pacific oceans, respectively, and affect the Walker circulation. Variable Walker circulation affects ocean upwelling and thermocline depth, which in turn will influence sea surface temperature. Sea surface temperatures can interact with the atmosphere and reinforce or dampen the atmospheric pressure gradients affiliated with the monsoon, ITCZ, IOD, or ENSO dynamics. Changes in any combination of these atmospheric gradients may have altered the seasonal precipitation in the regions surrounding the Indian Ocean during the Pliocene (Fedorov et al., 2013; Wang et al., 2017).
What could have changed atmospheric pressure gradients in the Pliocene? Indonesian Throughflow was being restricted from 5 to 3 Ma and there is evidence for strengthening SST gradients during the Pliocene (Cane and Molnar, 2001; Wara et al., 2005; Karas et al., 2009; Ford et al., 2012; Zhang et al., 2014; Burls and Fedorov, 2017; Christensen et al., 2017; White and Ravelo, 2020). Changes in the zonal and meridional SST gradients would have affected atmospheric pressure gradients in and surrounding the Indian Ocean and modified seasonal precipitation patterns. At the same time, the onset of Northern Hemisphere glaciation likely also helped reorganize the atmospheric pressure gradients surrounding the Indian Ocean (e.g., Koutsodendris et al., 2019). Before the intensification of glaciation at 2.7 Ma, there is evidence of four early local glaciation events at 4.9–4.8, 4.0, 3.6, and 3.3 Ma (De Schepper et al., 2014). The latter two events are within the age model uncertainty of 3.5 Myr when C4 vegetation expands in various regions around the Indian Ocean. Thus, it is possible that the early local growth of ice, not the intensification of glaciation, altered the Siberian high or other atmospheric pressure gradients near the Indian Ocean, changing cyclic precipitation patterns that lead to a regional expansion in C4 vegetation.
On the Indian Peninsula, C4 vegetation expands gradually from 3.5 Ma until the mid-Pleistocene when the range of variability in C4 vegetation increases. The timing of the change coincides within uncertainty with the mid-Pleistocene transition (∼1.3 Ma) where the glacial periods transitioned from 41 to 100 kyr cycles. Although the trigger for the switch in cyclicity is unknown, the processes responsible for the change or the ice sheets themselves may have affected atmospheric gradients and the modes of climate variability that altered the dynamics of C4 expansion on the Indian Peninsula. The sampling resolution from 1.5 to 0 Ma in our study is too low to resolve the change in cyclicity. However, previous studies documenting variations in C4 vegetation relative to C3 since the last glacial maximum demonstrate the sensitivity of plant communities to recent glacial–interglacial cycles (Galy et al., 2008; Phillips et al., 2014; Zorzi et al., 2015, and references therein).
Our study provides a piece of the puzzle in unraveling the complexities of C4 vegetation expansion. Although C4 vegetation was established in the CMZ on the Indian Peninsula before the end of the Miocene, the results of this study show another significant expansion in the Pliocene (∼3.5 to 1.5 Myr). The latter expansion is not observed in many records from the orographically wet Himalayas, emphasizing the spatial heterogeneities in C4 vegetation response – even within the same monsoon system. However, other regions adjacent to the Indian Ocean, such as tropical East Africa, Asia, and northwest Australia, corroborate the observed expansion in the CMZ of the Indian Peninsula and show C4 vegetation patterns sensitive to the changes in hydroclimate during the Pliocene. The heterogeneous response suggests that pCO2 cannot be the exclusive driver of the expansion of the C4 vegetation in the Pliocene and changes in regional hydrodynamics likely contributed. Restriction of Indonesian Throughflow and the onset of Northern Hemisphere glaciation may have altered the atmospheric pressure gradients and the modes of variability that determine seasonal precipitation patterns in the continents surrounding the Indian Ocean, which may have caused the regional expansion of C4 vegetation in the Pliocene.
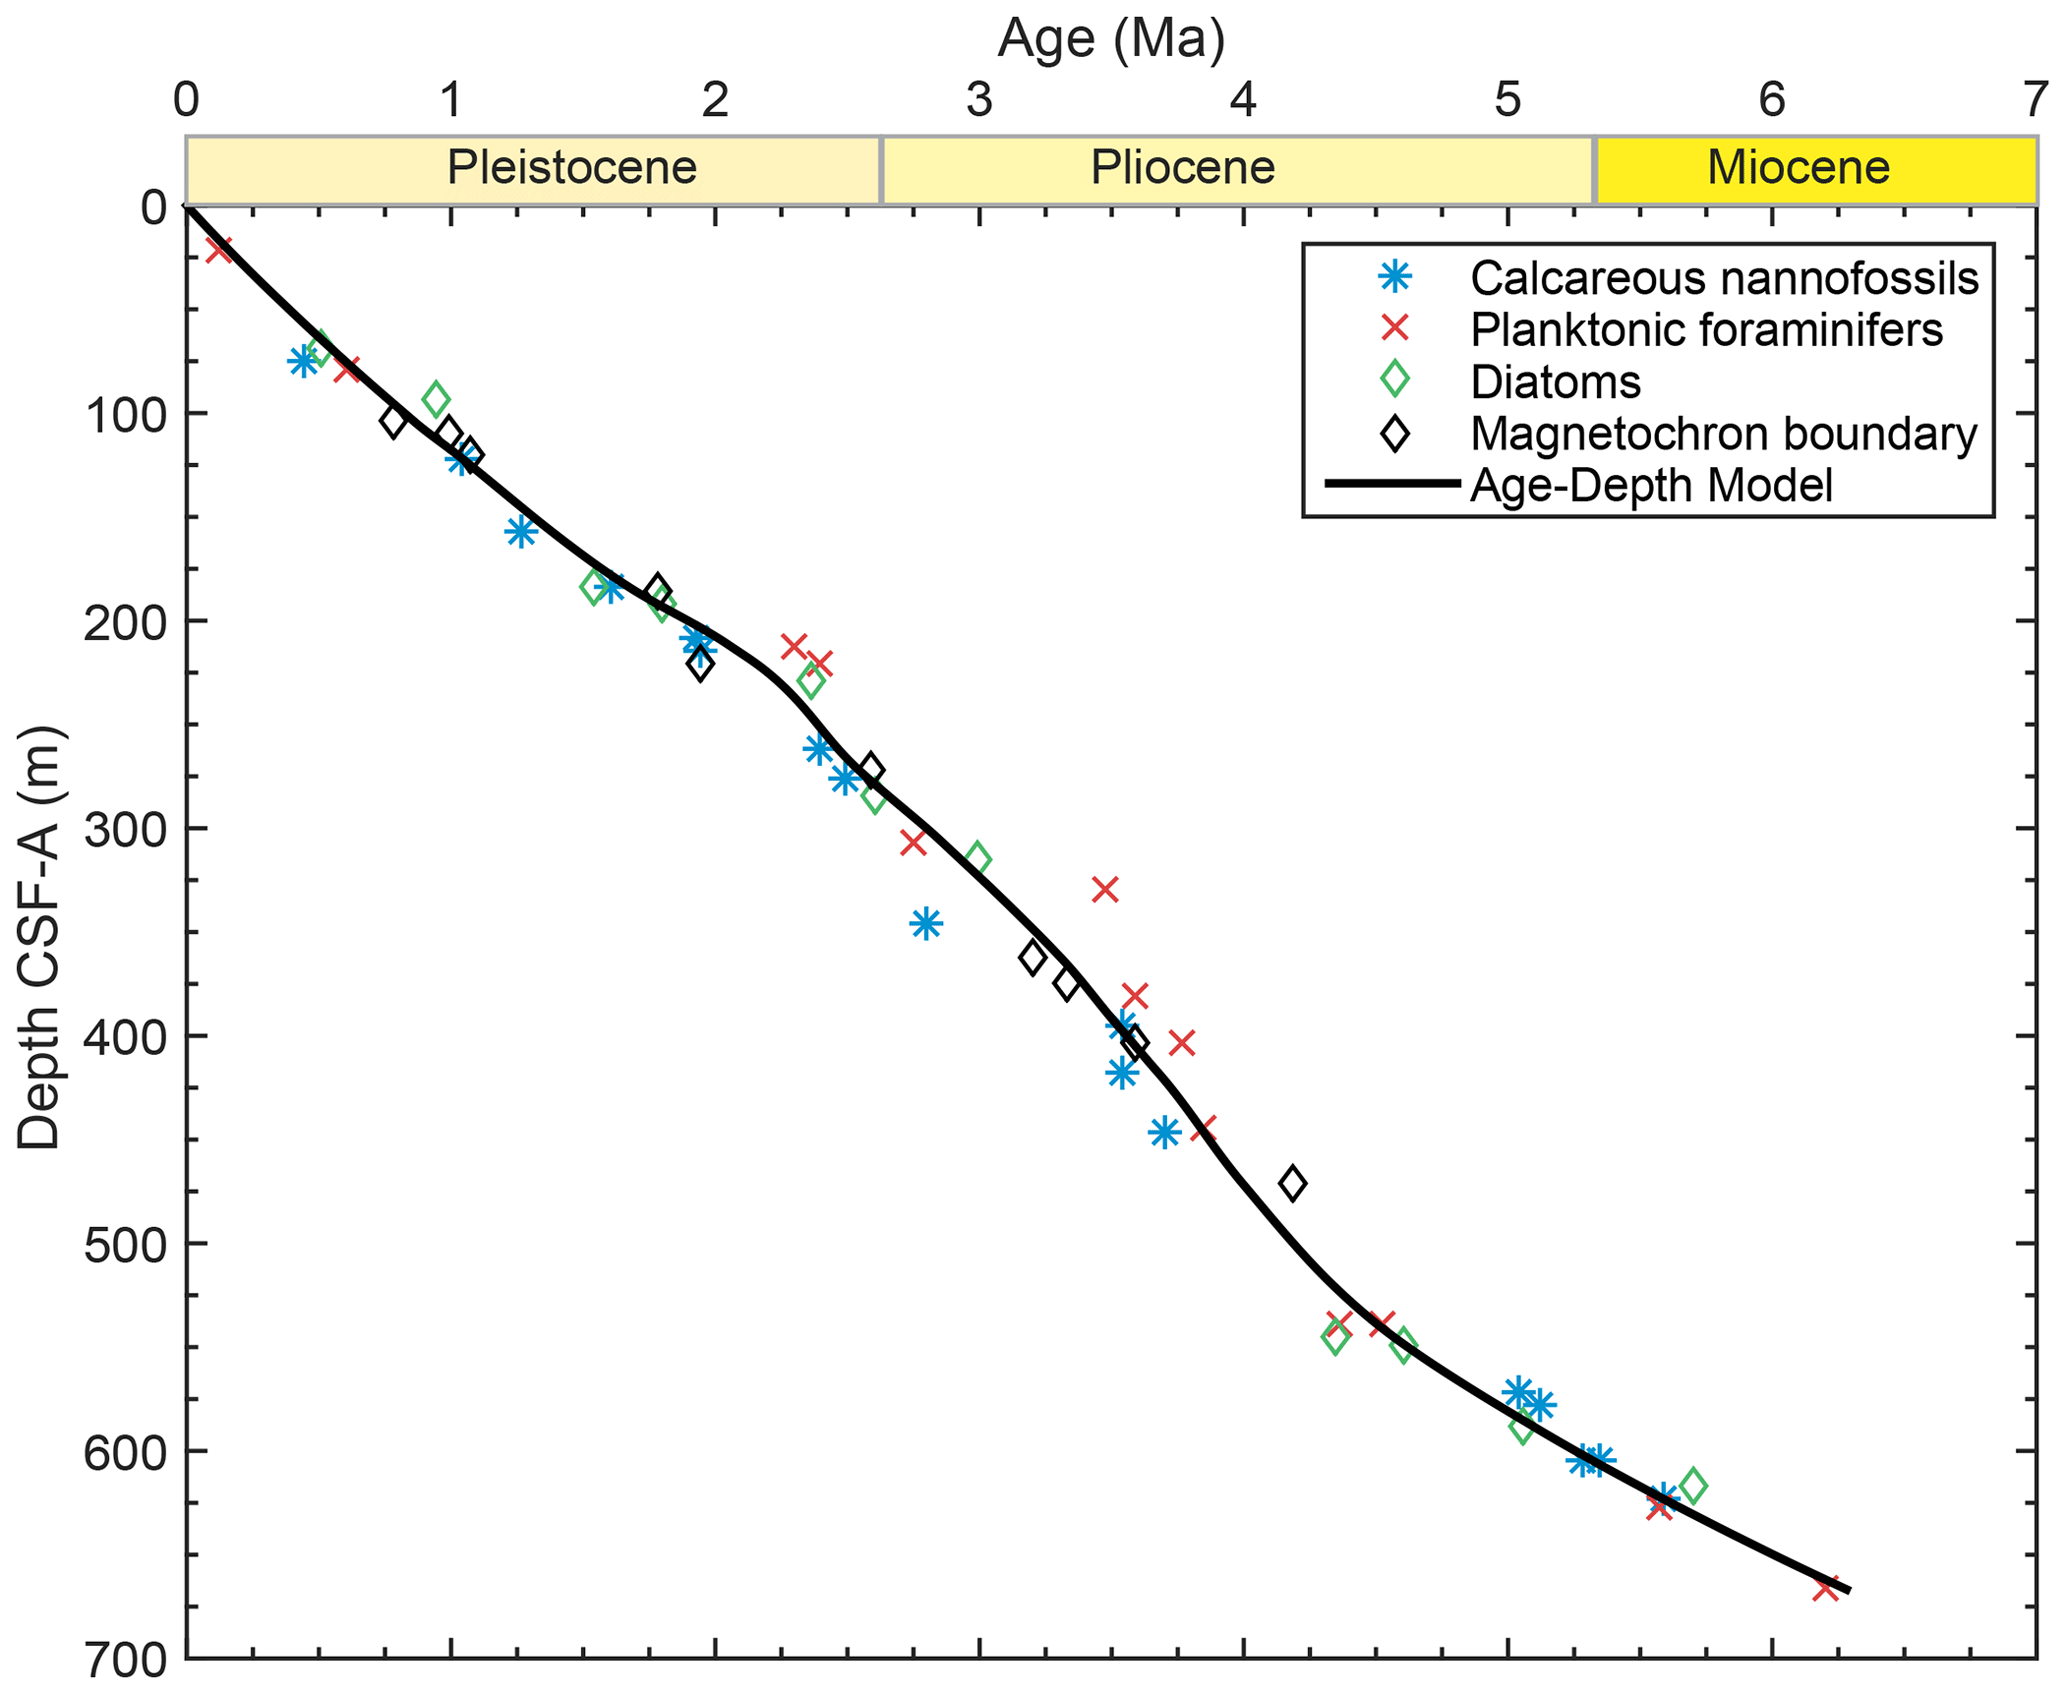
Figure A1Age–depth model for Site U1445. To determine the ages of our samples, we fit the biostratigraphic and magnetostratigraphic age constraints (Clemens et al., 2016) with an age–depth model using CLAM software in R (Blaauw, 2010). We ran iterations of the model with different types of fit and levels of smoothing, and we identified a locally weighted spline with 0.4 smoothing to best represent the trends observed in the age constraints. The differences between the age model's iterations are not significant and would not change the interpretations of this study.

Figure B1La–Th–Sc diagram of 30 sediment samples from the Bay of Bengal. Samples from IODP Site U1445 (blue squares) are plotted as well as IODP Site U1444 (green diamonds), National Gas Hydrate Program (NGHP) Site 19 (purple triangles), and NGHP Site 16 (brown circles) in the Bay of Bengal. Average upper continental crust (black square, Rudnick and Gao, 2014), post-Archean average Australian shale (black dot, Taylor and McLennan, 1985), and average mid-ocean ridge basalt (Gale et al., 2013) compositions are plotted for reference.
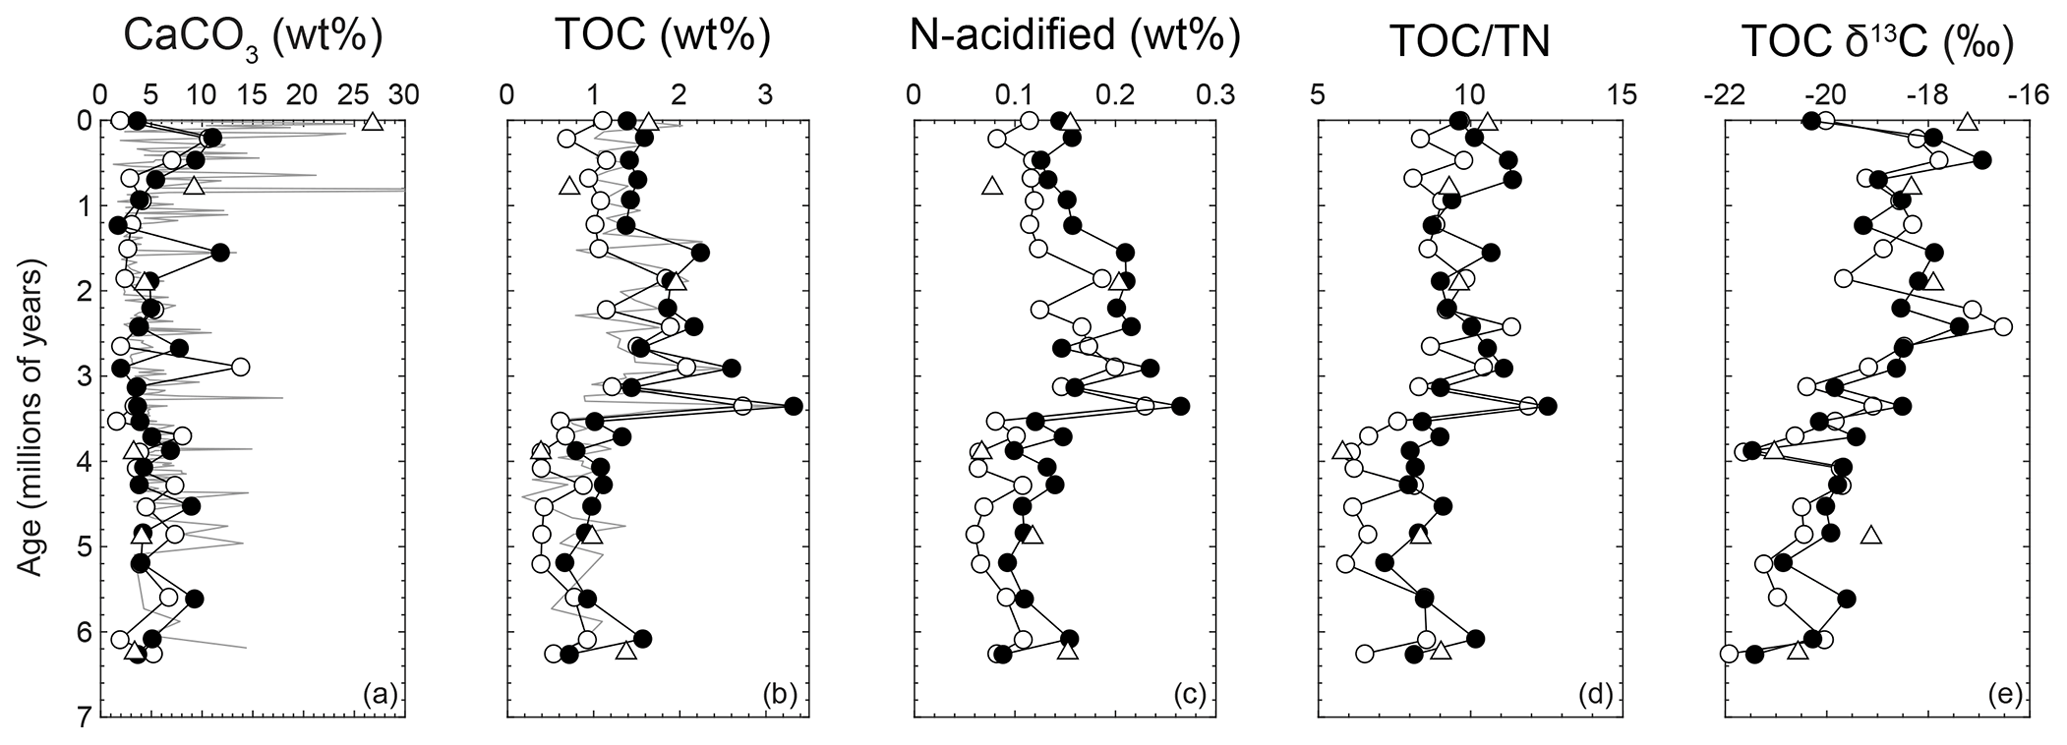
Figure C1Carbonate and bulk organic analyses at Site U1445. Analysis of 57 samples at IODP Site U1445 for (a) bulk calcium carbonate content (wt %) calculated as (total inorganic carbon × (8.33313CaCO3 wt∕C wt)), (b) total organic carbon concentration (wt %), (c) total acidified nitrogen content (wt %), (d) the ratio of total organic carbon to total nitrogen (TOC∕TN, wt % ∕ wt %), and (e) carbon isotopes of the total organic carbon (‰). Black dots represent visually darker layers relative to a lighter layer (white dot) at a similar depth. TOC∕TN shows a distinct increase in the mid-Pliocene, but it remains within the range of TOC∕TN expected for marine organic material.
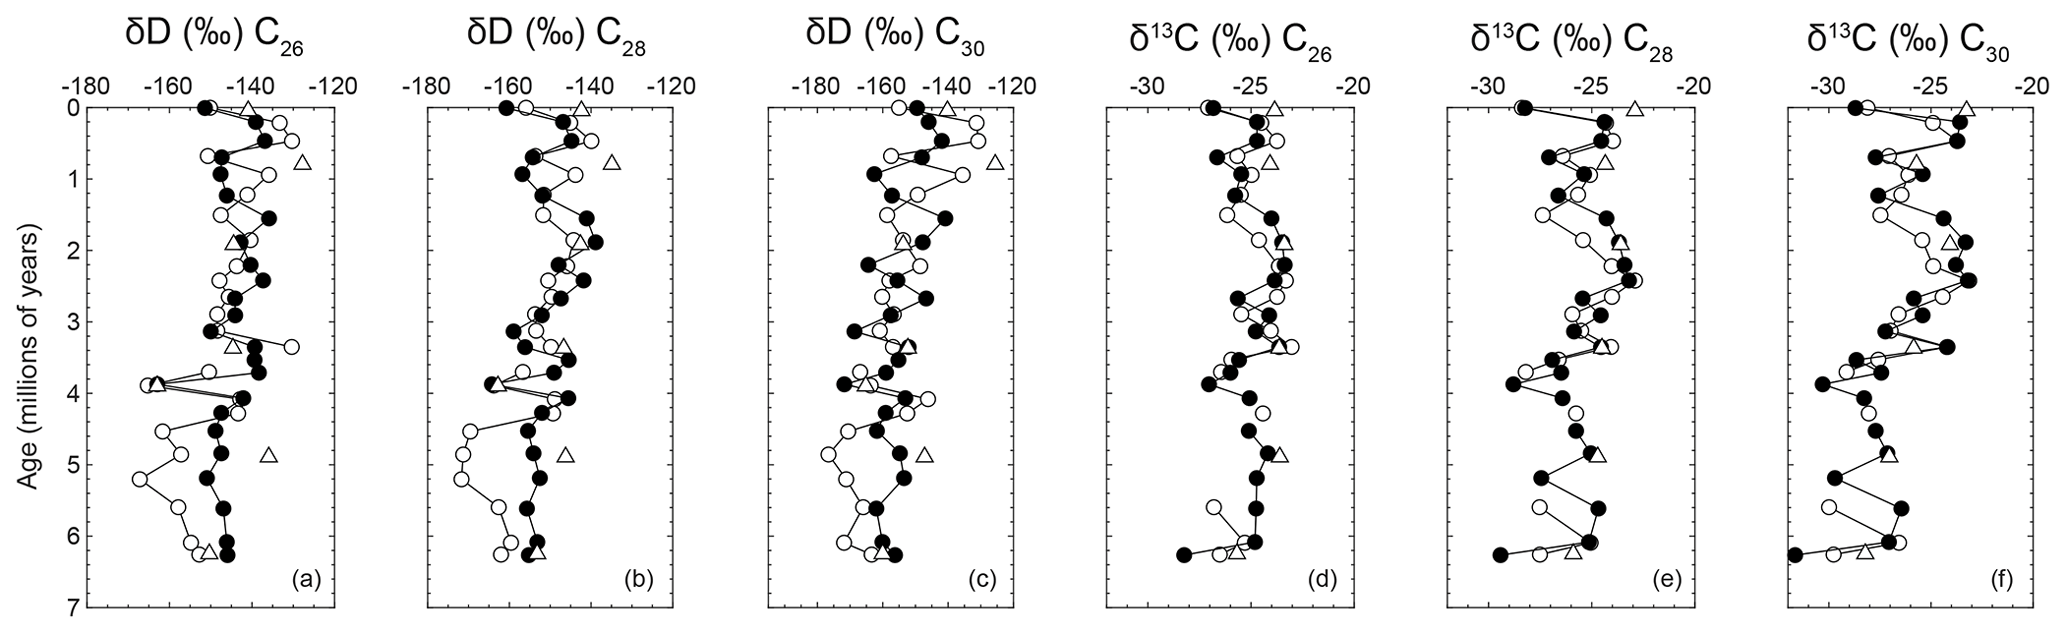
Figure D1Long-chain fatty acids from leaf waxes extracted from Site U1445. Plotted from left to right are hydrogen isotopes and then carbon isotopes of leaf wax fatty acids from chain lengths of C26, C28, and C30.
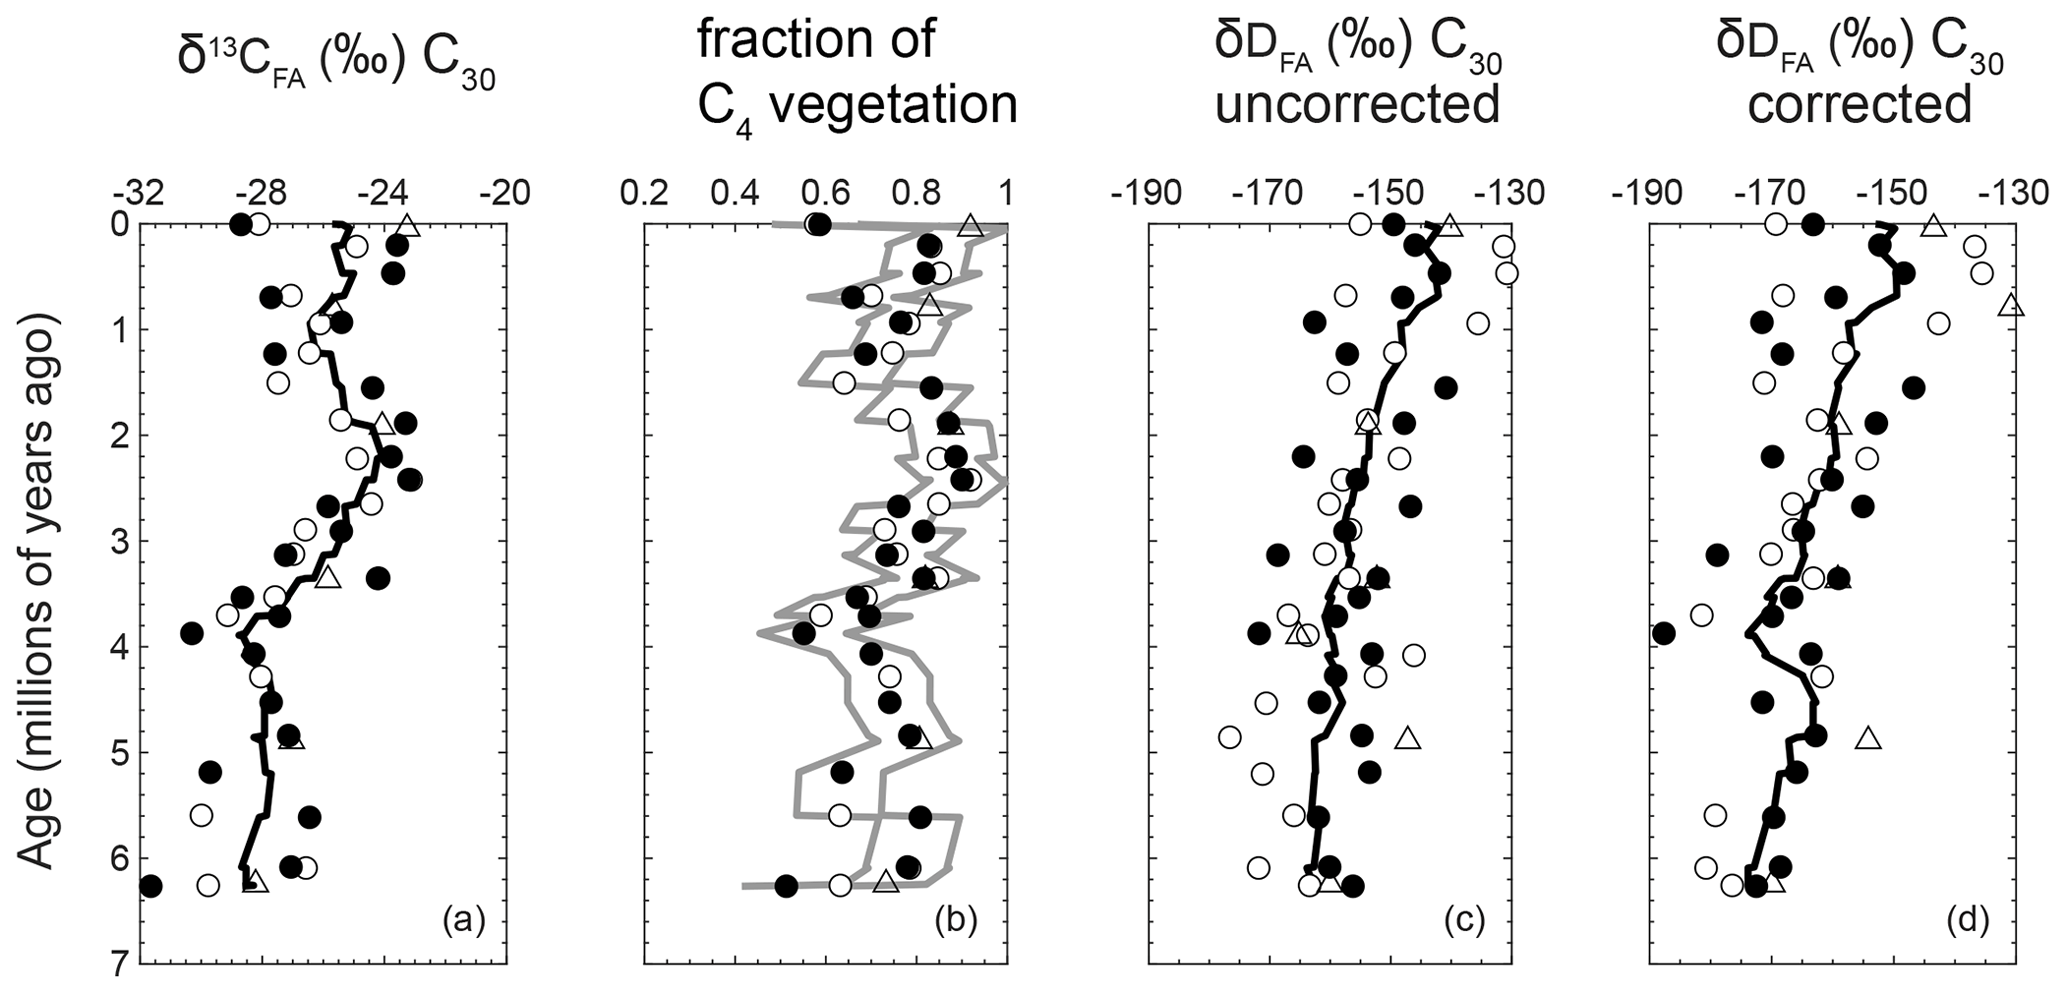
Figure E1Correcting δD for differences in fractionation due to plant physiology. (a) Raw, uncorrected δ13CFA plotted for comparison. (b) Calculated fraction of C4 vegetation with gray lines indicating the maximum and minimum boundaries. (c) Uncorrected δD data, plotted here for comparison. (d) The δD data corrected for differences between C3 and C4 plant physiologies.
The data are included in Tables S1–S3 in the Supplement and are publicly available in the PANGAEA database (https://doi.org/10.1594/PANGAEA.925085, Dunlea et al., 2020).
The supplement related to this article is available online at: https://doi.org/10.5194/cp-16-2533-2020-supplement.
AGD participated in the IODP Expedition 353 sampling party, performed the geochemical analyses, and lead writing and revisions of the paper. LG participated on IODP Expedition 353, was involved in the project's conceptualization, sample acquisition, and provided supervision. YH also participated in IODP Expedition 353, was involved in the project's conceptualization, provided resources and funding acquisition, advised on the methodology, provided supervision, and aided in interpretation of data.
The authors declare that they have no conflict of interest.
We thank Raj Kumar Singh (IIT Bhubaneswar, India) for providing Mahanadi sediment samples; Xian Wang, Rafael Tarozo, William C. Daniels, and Marcelo Da Rosa Alexandre at Brown University and Thomas Ireland at Boston University for their analytical assistance; and Steven Clemens, Kaustubh Thirumalai, Valier Galy, and Caroline C. Ummenhofer for discussions and advice. This research used samples and data provided by the International Ocean Discovery Program.
This research has been supported by the Ocean and Climate Change Institute Postdoctoral Scholarship at Woods Hole Oceanographic Institution to Ann Dunlea, and the U.S. National Science Foundation to Liviu Giosan (grant no. NSF OCE-0652315). USSSP post-cruise support was provided to Expedition 353 shipboard participants Liviu Giosan and Yongsong Huang.
This paper was edited by Alberto Reyes and reviewed by two anonymous referees.
An, Z., Huang, Y., Liu, W., Guo, Z., Clemens, S., Li, L., Prell, W., Youfeng, N., Yanjun, C., Weijian, Z., Benhai, L., Qingle, Z., Yunning, C., Xiaoke, Q., Hong, C., and Zhenkun, W.: Multiple expansions of C4 plant biomass in East Asia since 7Ma coupled with strengthened monsoon circulation, Geology, 33, 705, https://doi.org/10.1130/g21423.1, 2005.
Andrae, J. W., McInerney, F. A., Polissar, P. J., Sniderman, J. M. K., Howard, S., Hall, P. A., and Phelps, S. R.: Initial Expansion of C4 Vegetation in Australia During the Late Pliocene, Geophys. Res. Lett., 45, 4831–4840, https://doi.org/10.1029/2018GL077833, 2018.
Bartoli, G., Hönisch, B., and Zeebe, R. E.: Atmospheric CO2 decline during the Pliocene intensification of Northern Hemisphere glaciations, Paleocean., 26, 253–14, https://doi.org/10.1029/2010PA002055, 2011.
Behrensmeyer, A. K., Quade, J., Cerling, T. E., Kappelman, J., Khan, I. A., Copeland, P., Roe, L., Hicks, J., Stubblefield, P., Willis, B. J., and Latorre, C.: The structure and rate of late Miocene expansion of C-4 plants: Evidence from lateral variation in stable isotopes in paleosols of the Siwalik Group, northern Pakistan, Geol. Soc. Am. Bull., 119, 1486–1505, https://doi.org/10.1130/B26064.1, 2007.
Blaauw, M.: Methods and code for `classical' age-modeling of radiocarbon sequences, Quat. Geochron., 5, 512–518, https://doi.org/10.1016/j.quageo.2010.01.002, 2010.
Burls, N. J. and Fedorov, A. V.: Wetter subtropics in a warmer world: Contrasting past and future hydrological cycles, P. Natl. Acad. Sci. USA, 114, 12888–12893, https://doi.org/10.1073/pnas.1703421114, 2017.
Cane, M. A. and Molnar, P.: Closing of the Indonesian seaway as a precursor to east African aridification around 3–4 million years ago, Nature, 411, 157–162, https://doi.org/10.1038/35075500, 2001.
Cerling, T. E., Wang, Y., and Quade, J.: Expansion of C4 ecosystems as an indicator of global ecological change in the late Miocene, Nature, 361, 344–345, https://doi.org/10.1038/361344a0, 1993.
Cerling, T. E., Harris, J. M., MacFadden, B. J., Leakey, M. G., Quade, J., Eisenmann, V., and Ehleringer, J. R.: Global vegetation change through the Miocene/Pliocene boundary, Nature, 389, 153–158, https://doi.org/10.1038/38229, 1997.
Cerling, T. E., Wynn, J. G., Andanje, S. A., Bird, M. I., Korir, D. K., Levin, N. E., Mace, W., Macharia, A. N., Quade, J., and Remien, C. H.: Woody cover and hominin environments in the past 6 million years, Nature Geosci., 476, 51–56, https://doi.org/10.1038/nature10306, 2011.
Chakrapani, G. J. and Subramanian, V.: Factors controlling sediment discharge in the Mahanadi River Basin, India, J. Hydrol., 117, 169–185, https://doi.org/10.1016/0022-1694(90)90091-b, 1990.
Chikaraishi, Y. and Naraoka, H.: δD13C and δD relationships among three n-alkyl compound classes (n-alkanoic acid, n-alkane and n-alkanol) of terrestrial higher plants, Org. Geochem., 38, 198–215, https://doi.org/10.1016/j.orggeochem.2006.10.003, 2007.
Chikaraishi, Y., Naraoka, H., and Poulson, S. R.: Hydrogen and carbon isotopic fractionations of lipid biosynthesis among terrestrial (C3, C4 and CAM) and aquatic plants, Phytochemistry, 65, 1369–1381, https://doi.org/10.1016/j.phytochem.2004.03.036, 2004.
Christensen, B. A., Renema, W., Henderiks, J., De Vleeschouwer, D., Groeneveld, J., Castañeda, I. S., Reuning, L., Bogus, K., Auer, G., Ishiwa, T., McHugh, C. M., Gallagher, S. J., Fulthorpe, C. S., and IODP Expedition 356 Scientists: Indonesian Throughflow drove Australian climate from humid Pliocene to arid Pleistocene, Geophys. Res. Lett., 44, 6914–6925, https://doi.org/10.1002/2017GL072977, 2017.
Clemens, S. C., Kuhnt, W., LeVay, L. J., Anand, P., Ando, T., Bartol, M., Bolton, C. T., Ding, X., Gariboldi, K., Giosan, L., Hathorne, E. C., Huang, Y., Jaiswal, P., Kim, S., Kirkpatrick, J. B., Littler, K., Marino, G., Martinez, P., Naik, D., Peketi, A., Phillips, S. C., Robinson, M. M., Romero, O. E., Sagar, N., Taladay, K. B., Taylor, S. N., Thirumalai, K., Uramoto, G., Usui, Y., Wang, J., Yamamoto, M., and Zhou, L.: Indian Monsoon Rainfall, Proc. of IODP, 353, 101, https://doi.org/10.14379/iodp.proc.353.101.2016, 2016.
Daniels, W. C., Russell, J. M., Giblin, A. E., Welker, J. M., Klein, E. S., and Huang, Y.: Hydrogen isotope fractionation in leaf waxes in the Alaskan Arctic tundra, Geochim. Cosmochim. Ac., 213, 216–236, https://doi.org/10.1016/j.gca.2017.06.028, 2017.
De Schepper, S., Gibbard, P. L., Salzmann, U., and Ehlers, J.: A global synthesis of the marine and terrestrial evidence for glaciation during the Pliocene Epoch, Earth-Sci. Rev., 135, 83–102, https://doi.org/10.1016/j.earscirev.2014.04.003, 2014.
Dunlea, A. G., Murray, R. W., Sauvage, J., Spivack, A. J., Harris, R. N., and D'Hondt, S.: Dust, volcanic ash, and the evolution of the South Pacific Gyre through the Cenozoic, Paleocean., 30, 1078–1099, https://doi.org/10.1002/2015PA002829, 2015.
Dunlea, A. G., Giosan, L., and Huang, Y.: Organic geochemistry of Pliocene sediments in the core monsoon zone on the Indian Peninsula, PANGAEA, https://doi.org/10.1594/PANGAEA.925085, 2020.
Edwards, E. J., Osborne, C. P., Strömberg, C., Smith, S. A., and Consortium, C. G.: The origins of C4 grasslands: integrating evolutionary and ecosystem science, Science, 328, 587–591, https://doi.org/10.1126/science.1177216, 2010.
Eglinton, T. I. and Eglinton, G.: Molecular proxies for paleoclimatology, Earth Planet. Sci. Lett., 275, 1–16, https://doi.org/10.1016/j.epsl.2008.07.012, 2008.
Ehleringer, J. R. and Cerling, T. E.: Atmospheric CO2 and the ratio of intercellular to ambient CO2 concentrations in plants, Tree Physiology, 15, 105–111, 1995.
Ehleringer, J. R., Sage, R. F., Flanagan, L. B., and Pearcy, R. W.: Climate change and the evolution of C4 photosynthesis, Mar. Geol., 6, 95–99, https://doi.org/10.1016/0169-5347(91)90183-X, 1991.
Farquhar, G. D., Ehleringer, J. R., and Hubick, K. T.: Carbon isotope discrimination and photosynthesis, Annu. Rev. Plant Physiol. Plant Mol. Biol., 40, 503–537, https://doi.org/10.1146/annurev.pp.40.060189.002443, 1989.
Feakins, S. J., DeMenocal, P. B., and Eglinton, T. I.: Biomarker records of late Neogene changes in northeast African vegetation, Geology, 33, 977–4, https://doi.org/10.1130/G21814.1, 2005.
Feakins, S. J., Levin, N. E., Liddy, H. M., Sieracki, A., Eglinton, T. I., and Bonnefille, R.: Northeast African vegetation change over 12 m.y, Geology, 41, 295–298, https://doi.org/10.1130/G33845.1, 2013.
Fedorov, A. V., Brierley, C. M., Lawrence, K. T., Liu, Z., Dekens, P. S., and Ravelo, A. C.: Patterns and mechanisms of early Pliocene warmth, Nature Geosci., 496, 43–49, https://doi.org/10.1038/nature12003, 2013.
Ford, H. L., Ravelo, A. C., and Hovan, S.: A deep Eastern Equatorial Pacific thermocline during the early Pliocene warm period, Earth Planet. Sci. Lett., 355/356, 152–161, https://doi.org/10.1016/j.epsl.2012.08.027, 2012.
France-Lanord, C. and Derry, L. A.: δD13C of organic carbon in the Bengal Fan: Source evolution and transport of C3 and C4 plant carbon to marine sediments, Geochim. Cosmochim. Ac., 58, 4809–4814, https://doi.org/10.1016/0016-7037(94)90210-0, 1994.
Freeman, K. H. and Colarusso, L. A.: Molecular and isotopic records of C4 grassland expansion in the late miocene, Geochim. Cosmochim. Ac., 65, 1439–1454, https://doi.org/10.1016/s0016-7037(00)00573-1, 2001.
Gadgil, S.: The Indian Monsoon and its Variability, Annu. Rev. Earth Planet. Sci., 31, 429–467, https://doi.org/10.1146/annurev.earth.31.100901.141251, 2003.
Gale, A., Dalton, C. A., Langmuir, C. H., Su, Y., and Schilling, J.-G.: The mean composition of ocean ridge basalts, Geochem. Geophy. Geosy., 14, 489–518, https://doi.org/10.1029/2012GC004334, 2013.
Galy, V., François, L., France-Lanord, C., Faure, P., Kudrass, H., Palhol, F., and Singh, S. K.: Quaternary Sci. Rev., 27, 1396–1409, https://doi.org/10.1016/j.quascirev.2008.04.005, 2008.
Galy, V., France-Lanord, C., Peucker-Ehrenbrink, B., and Huyghe, P.: Sr-Nd-Os evidence for a stable erosion regime in the Himalaya during the past 12 Myr, Earth Planet. Sci. Lett., 290, 474–480, https://doi.org/10.1016/j.epsl.2010.01.004, 2010.
Ghosh, S., Sanyal, P., and Kumar, R.: Evolution of C4 plants and controlling factors: Insight from n-alkane isotopic values of NW Indian Siwalik paleosols, Org. Geochem., 110, 110–121, https://doi.org/10.1016/j.orggeochem.2017.04.009, 2017.
Giosan, L., Ponton, C., Usman, M., Blusztajn, J., Fuller, D. Q., Galy, V., Haghipour, N., Johnson, J. E., McIntyre, C., Wacker, L., and Eglinton, T. I.: Short communication: Massive erosion in monsoonal central India linked to late Holocene land cover degradation, Earth Surf. Dynam., 5, 781–789, https://doi.org/10.5194/esurf-5-781-2017, 2017.
Hein, C. J., Galy, V., Galy, A., France-Lanord, C., Kudrass, H., and Schwenk, T.: Post-glacial climate forcing of surface processes in the Ganges-Brahmaputra river basin and implications for carbon sequestration, Earth Planet. Sci. Lett., 478, 89–101, https://doi.org/10.1016/j.epsl.2017.08.013, 2017.
Herbert, T. D., Lawrence, K. T., Tzanova, A., Peterson, L. C., Caballero-Gill, R., and Kelly, C. S.: Late Miocene global cooling and the rise of modern ecosystems, Nat. Geosci., 9, 843–847, https://doi.org/10.1038/ngeo2813, 2016.
Huang, Y., Clemens, S. C., Liu, W., Wang, Y., and Prell, W. L.: Large-scale hydrological change drove the late Miocene C4 plant expansion in the Himalayan foreland and Arabian Peninsula, Geology, 35, 531–534, https://doi.org/10.1130/G23666A.1, 2007.
Karas, C., Nürnberg, D., Gupta, A. K., Tiedemann, R., Mohan, K., and Bickert, T.: Mid-Pliocene climate change amplified by a switch in Indonesian subsurface throughflow, Nat. Geosci., 2, 434–438, https://doi.org/10.1038/ngeo520, 2009.
Koutsodendris, A., Allstädt, F. J., Kern, O. A., Kousis, I., Schwarz, F., Vannacci, M., Woutersen, A., Appel, E., Berke, M. A., Fang, X., Friedrich, O., Hoorn, C., Salzmann, U., and Pross, J.: Late Pliocene vegetation turnover on the NE Tibetan Plateau (Central Asia) triggered by early Northern Hemisphere glaciation, Glob. Planet. Change, 180, 117–125, https://doi.org/10.1016/j.gloplacha.2019.06.001, 2019.
Levin, N. E., Quade, J., Simpson, S. W., Semaw, S., and Rogers, M.: Isotopic evidence for Plio-Pleistocene environmental change at Gona, Ethiopia, Earth Planet. Sci. Lett., 219, 93–110, https://doi.org/10.1016/S0012-821X(03)00707-6, 2004.
Liddy, H. M., Feakins, S. J., and Tierney, J. E.: Cooling and drying in northeast Africa across the Pliocene, Earth Planet. Sci. Lett., 449, 430–438, https://doi.org/10.1016/j.epsl.2016.05.005, 2016.
Lisiecki, L. E. and Raymo, M. E.: A Pliocene-Pleistocene stack of 57 globally distributed benthic δD18O records, Paleocean., 20, PA1003, https://doi.org/10.1029/2004PA001071, 2005.
Miao, Y., Warny, S., Clift, P. D., Liu, C., and Gregory, M.: Evidence of continuous Asian summer monsoon weakening as a response to global cooling over the last 8 Ma, Gondwana Res., 52, 48–58, https://doi.org/10.1016/j.gr.2017.09.003, 2017.
Murray, R., Miller, D. J., and Kryc, K.: Analysis of major and trace elements in rocks, sediments, and interstitial waters by inductively coupled plasma-atomic emission spectrometry (ICP-AES), ODP Tech. Note, 29, 1–27, 2000.
Pagani, M., Liu, Z., LaRiviere, J., and Ravelo, A. C.: High Earth-system climate sensitivity determined from Pliocene carbon dioxide concentrations, Nat. Geosci., 3, 27–30, https://doi.org/10.1038/ngeo724, 2009.
Passey, B. H., Ayliffe, L. K., Kaakinen, A., Zhang, Z., Eronen, J. T., Zhu, Y., Zhou, L., Cerling, T. E., and Fortelius, M.: Strengthened East Asian summer monsoons during a period of high-latitude warmth? Isotopic evidence from Mio-Pliocene fossil mammals and soil carbonates from northern China, Earth Planet. Sci. Lett., 277, 443–452, https://doi.org/10.1016/j.epsl.2008.11.008, 2009.
Phillips, S. C., Johnson, J. E., Giosan, L., and Rose, K.: Monsoon-influenced variation in productivity and lithogenic sediment flux since 110 ka in the offshore Mahanadi Basin, northern Bay of Bengal, Mar. Petrol. Geol., 58, 502–525, https://doi.org/10.1016/j.marpetgeo.2014.05.007, 2014.
Polissar, P. J., Rose, C., Uno, K. T., Phelps, S. R., and deMenocal, P.: Synchronous rise of African C4 ecosystems 10 million years ago in the absence of aridification, Nat. Geosci., 12, 657–660, https://doi.org/10.1038/s41561-019-0399-2, 2019.
Ponton, C., Giosan, L., Eglinton, T. I., Fuller, D. Q., Johnson, J. E., Kumar, P., and Collett, T. S.: Holocene aridification of India, Geophys. Res. Lett., 39, L03704, https://doi.org/10.1029/2011GL050722, 2012.
Quade, J. and Cerling, T. E.: Expansion of C4 grasses in the Late Miocene of Northern Pakistan: evidence from stable isotopes in paleosols, Palaeogeogr. Palaeoclimatol. Palaeoecol., 115, 91–116, https://doi.org/10.1016/0031-0182(94)00108-K, 1995.
Quade, J., Cater, J. M. L., Ojha, T. P., Adam, J., and Harrison, T. M.: Late Miocene environmental change in Nepal and the northern Indian subcontinent: Stable isotopic evidence from paleosols, Geol. Soc. Am. Bull., 107, 1381–1397, https://doi.org/10.1130/0016-7606(1995)107<1381:LMECIN>2.3.CO;2, 1995.
Rudnick, R. L. and Gao, S.: Composition of the Continental Crust, in: Treatise on Geochemistry, edited by: Holland, H. and Turekian, K., Elsevier, Amsterdam, The Netherlands, 1–51, 2014.
Sanyal, P., Bhattacharya, S. K., Kumar, R., Ghosh, S. K., and Sangode, S. J.: Mio-Pliocene monsoonal record from Himalayan foreland basin (Indian Siwalik) and its relation to vegetational change, Palaeogeogr. Palaeoclimatol. Palaeoecol., 205, 23–41, https://doi.org/10.1016/j.palaeo.2003.11.013, 2004.
Sarkar, S., Prasad, S., Wilkes, H., Riedel, N., Stebich, M., Basavaiah, N., and Sachse, D.: Monsoon source shifts during the drying mid-Holocene: Biomarker isotope based evidence from the core `monsoon zone' (CMZ) of India, Quat. Sci. Rev., 123, 144–157, https://doi.org/10.1016/j.quascirev.2015.06.020, 2015.
Seki, O., Foster, G. L., Schmidt, D. N., Mackensen, A., Kawamura, K., and Pancost, R. D.: Alkenone and boron-based Pliocene pCO2 records, Earth Planet. Sci. Lett., 292, 201–211, https://doi.org/10.1016/j.epsl.2010.01.037, 2010.
Sharma, R. S.: Cratons of the Indian Shield, in: Cratons and Fold Belts of India, edited by: Sharma, R. S., Springer, Berlin and Heidelberg, Germany, 41–115, 2009.
Smith, F. A. and Freeman, K. H.: Influence of physiology and climate on δD of leaf wax n-alkanes from C3 and C4 grasses, Geochim. Cosmochim. Ac., 70, 1172–1187, https://doi.org/10.1016/j.gca.2005.11.006, 2006.
Strömberg, C. A. E.: Evolution of Grasses and Grassland Ecosystems, Annu. Rev. Earth Planet. Sci., 39, 517–544, https://doi.org/10.1146/annurev-earth-040809-152402, 2011.
Taylor, S. R. and McLennan, S. M.: The Continental Crust: Its Composition and Evolution, Blackwell Scientific Publications, Oxford, UK, 1985.
Tierney, J. E., Ummenhofer, C. C., and DeMenocal, P. B.: Past and future rainfall in the Horn of Africa, Science Advances, 1, e1500682, https://doi.org/10.1126/sciadv.1500682, 2015.
Tipple, B. J., Meyers, S. R., and Pagani, M.: Carbon isotope ratio of Cenozoic CO2: A comparative evaluation of available geochemical proxies, Paleocean., 25, 129–11, https://doi.org/10.1029/2009PA001851, 2010.
Tripati, A. K., Roberts, C. D., and Eagle, R. A.: Coupling of CO2 and Ice Sheet Stability Over Major Climate Transitions of the Last 20 Million Years, Science, 326, 1394–1397, https://doi.org/10.1126/science.1178296, 2009.
Tripathy, G. R., Singh, S. K., and Ramaswamy, V.: Major and trace element geochemistry of Bay of Bengal sediments: Implications to provenances and their controlling factors, Palaeogeogr. Palaeoclimatol. Palaeoecol., 397, 20–30, https://doi.org/10.1016/j.palaeo.2013.04.012, 2014.
Ummenhofer, C. C., Sen Gupta, A., Taschetto, A. S., and England, M. H.: Modulation of Australian Precipitation by Meridional Gradients in East Indian Ocean Sea Surface Temperature, J. Climate, 22, 5597–5610, https://doi.org/10.1175/2009JCLI3021.1, 2009.
Ummenhofer, C. C., Sen Gupta, A., Briggs, P. R., England, M. H., McIntosh, P. C., Meyers, G. A., Pook, M. J., Raupach, M. R., and Risbey, J. S.: Indian and Pacific Ocean Influences on Southeast Australian Drought and Soil Moisture, J. Climate, 24, 1313–1336, https://doi.org/10.1175/2010JCLI3475.1, 2011a.
Ummenhofer, C. C., Sen Gupta, A., Li, Y., Taschetto, A. S., and England, M. H.: Multi-decadal modulation of the El Niño-Indian monsoon relationship by Indian Ocean variability, Environ. Res. Lett., 6, 034006, https://doi.org/10.1088/1748-9326/6/3/034006, 2011b.
Wang, P. X., Bin Wang, Cheng, H., Fasullo, J., Guo, Z., Kiefer, T., and Liu, Z.: The global monsoon across time scales: Mechanisms and outstanding issues, Earth-Sci. Rev., 174, 84–121, https://doi.org/10.1016/j.earscirev.2017.07.006, 2017.
Wara, M. W., Ravelo, A. C., and Delaney, M. L.: Permanent El Nino-Like Conditions During the Pliocene Warm Period, Science, 309, 758–761, https://doi.org/10.1126/science.1112596, 2005.
White, S. M. and Ravelo, A. C.: Dampened El Niño in the Early Pliocene Warm Period, Geophys. Res. Lett., 47, 40–15, https://doi.org/10.1029/2019GL085504, 2020.
Whiteside, J. H., Olsen, P. E., Eglinton, T. I., Cornet, B., McDonald, N. G., and Huber, P.: Pangean great lake paleoecology on the cusp of the end-Triassic extinction, Palaeogeogr. Palaeoclimatol. Palaeoecol., 301, 1–17, https://doi.org/10.1016/j.palaeo.2010.11.025, 2011.
Williams, A. P. and Funk, C.: A westward extension of the warm pool leads to a westward extension of the Walker circulation, drying eastern Africa, Clim. Dynam., 37, 2417–2435, https://doi.org/10.1007/s00382-010-0984-y, 2011.
Xie, S.-P., Xu, H., Saji, N. H., Wang, Y., and Liu, W. T.: Role of Narrow Mountains in Large-Scale Organization of Asian Monsoon Convection, J. Climate, 19, 3420–3429, https://doi.org/10.1175/jcli3777.1, 2006.
Yang, W., Seager, R., Cane, M. A., and Lyon, B.: The Annual Cycle of East African Precipitation, J. Climate, 28, 2385–2404, https://doi.org/10.1175/JCLI-D-14-00484.1, 2015.
Zhang, Y. G., Pagani, M., and Liu, Z.: A 12-Million-Year Temperature History of the Tropical Pacific Ocean, Science, 344, 84–87, https://doi.org/10.1126/science.1246172, 2014.
Zhou, B., Shen, C., Sun, W., Bird, M., Ma, W., Taylor, D., Liu, W., Peterse, F., Yi, W., and Zheng, H.: Late Pliocene-Pleistocene expansion of C4 vegetation in semiarid East Asia linked to increased burning, Geology, 42, 1067–1070, https://doi.org/10.1130/g36110.1, 2014.
Zorzi, C., Goñi, M. F. S., Anupama, K., Prasad, S., Hanquiez, V., Johnson, J., and Giosan, L.: Indian monsoon variations during three contrasting climatic periods: The Holocene, Heinrich Stadial 2 and the last interglacial-glacial transition, Quaternary Sci. Rev., 125, 50–60, https://doi.org/10.1016/j.quascirev.2015.06.009, 2015.