the Creative Commons Attribution 4.0 License.
the Creative Commons Attribution 4.0 License.
 | 23 Dec 2020
Holocene vegetation dynamics in response to climate change and hydrological processes in the Bohai region
Chen Jinxia
Shi Xuefa
Liu Yanguang
Qiao Shuqing
Yang Shixiong
Yan Shijuan
Lv Huahua
Li Jianyong
Li Xiaoyan
Li Chaoxin
Coastal vegetation both mitigates the damage inflicted by marine disasters on coastal areas and plays an important role in the global carbon cycle (i.e., blue carbon). Nevertheless, detailed records of changes in coastal vegetation composition and diversity in the Holocene, coupled with climate change and river evolution, remain unclear. To explore vegetation dynamics and their influencing factors on the coastal area of the Bohai Sea (BS) during the Holocene, we present high-resolution pollen and sediment grain size data obtained from a sediment core of the BS. The results reveal that two rapid and abrupt changes in salt marsh vegetation are linked with the river system changes. Within each event, a recurring pattern – starting with a decline in Cyperaceae, followed by an increase in Artemisia and Chenopodiaceae – suggests a successional process that is determined by the close relationship between Yellow River (YR) channel shifts and the wetland community dynamics. The phreatophyte Cyperaceae at the base of each sequence indicate lower saline conditions. Unchannelized river flow characterized the onset of the YR channel shift, caused a huge river-derived sediment accumulation in the floodplain and destroyed the sedges in the coastal depression. Along with the formation of a new channel, lateral migration of the lower channel stopped, and a new intertidal mudflat was formed. Pioneer species (Chenopodiaceae, Artemisia) were the first to colonize the bare zones of the lower and middle marsh areas. In addition, the pollen results revealed that the vegetation of the BS land area was dominated by broadleaved forests during the Early Holocene (8500–6500 BP) and by conifer and broadleaved forests in the Middle Holocene (6500–3500 BP), which was followed by an expansion of broadleaved trees (after 3500 BP). The pollen record indicated that a warmer Early and Late Holocene and colder Middle Holocene were consistent with previously reported temperature records for East Asia. The main driving factors of temperature variation in this region are insolation, the El Niño–Southern Oscillation and greenhouse gases forcing.
- Article
(9260 KB) - Full-text XML
- BibTeX
- EndNote


Coastal areas, where cities, populations and industries are clustered, are playing an increasingly critical role in trade globalization (Hemavathi et al., 2019). Because they are located between marine ecosystems and terrestrial ecosystems, coastal areas are prone to many natural hazards, such as flooding, storms and tsunamis (Hou and Hou, 2020). Coastal vegetation, which acts as a natural barrier, is widely distributed in coastal areas and could effectively mitigate the damage caused by marine disasters to the economy and environment of coastal areas (Zhang et al., 2018). Moreover, despite their relatively small global extent (between 0.5 and 1×10⁶ km2), coastal vegetation ecosystems, tidal marshes, mangroves and seagrasses play an important role in the global carbon cycle (Serrano et al., 2019; Spivak et al., 2019). Per unit area, their organic carbon sequestration rates exceed those of terrestrial forests by 1–2 orders of magnitude and contribute ∼50 % of carbon sequestered in marine sediments (Serrano et al., 2019). Hence, it is important to understand the long-term spatial–temporal dynamics of coastal vegetation, which are favorable for the global carbon cycle research and coastal restoration.
Climatic fluctuation, post-glacial sea level rise and changes in river discharge provoked dramatic habitat changes along coastal areas during the Late Pleistocene and Holocene (Neumann et al., 2010; Cohen et al., 2012; Pessenda et al., 2012; França et al., 2015). Presently, the relationship of sea level change and coastal vegetation (especially mangrove) evolution has been widely studied by many researchers (e.g., Engelhart et al., 2007; González and Dupont, 2009; França et al., 2012; Woodroffe et al., 2015; Hendy et al., 2016). In contrast, studies on the long-term dynamics of coastal vegetation, coupled with climate change and river evolution, are sparse. During the Holocene, the global rivers delivered large amounts of material to the ocean, the total suspended sediment delivered by all rivers to the ocean was approximately 13.5×10⁹ t annually (Milliman and Meade, 1983). The material transported by the rivers had huge impacts on the coastal ecosystem. Hence, a deeper understanding of correlations between coastal vegetation and river variables is required to better assess coastal vegetation responses to global warming in the future.
In the coastal areas of the Bohai Sea (BS), vegetation is dominated by warm temperate deciduous broadleaved forests and shrub grasslands (Wang et al., 1993). The Yellow River (YR), as one of the largest rivers in the world in terms of sediment discharge (Milliman and Meade, 1983), transports large amounts of sediment into the BS every year; hence, it has developed a delta complex in the west coastal region of the BS since 7000 BP (He et al., 2019). Deposition of the Yellow River delta (YRD) complex resulted in the formation of a vast area of floodplain and estuarine wetland (Xue et al., 1995; Cui et al., 2009; W. Z. Liu et al., 2009). Based on the study of coastal vegetation of the BS, it is helpful to understand the spatial and temporal drivers of ecological variability, and thus of the vegetation–climate and vegetation–river relationships, especially wetland dynamics. However, there have been few studies investigating the vegetation dynamics and their response to climate and river variables in the Bohai region.
Pollen records have been useful in terms of reconstructing vegetation dynamics and environmental changes associated with climatic changes in the geological record (Bao et al., 2007; Cohen et al., 2008; Giraldo-Giraldo et al., 2018). In this study, we carried out a detailed investigation of core sediments from Laizhou Bay in the BS. We analyzed pollen and grain size proxies at a high resolution and refined the chronology of the core by using 137Cs and accelerator mass spectrometry (AMS) 14C dates. With this in mind, the specific objectives of the current research are formulated as follows: (1) to reconstruct the vegetation evolution history in the Bohai region and (2) to tentatively discuss the effects of climate and environment on coastal vegetation (especially wetlands) during the Holocene.
2.1 Geographical settings
The BS, a shallow inland sea in China, is connected with the Yellow Sea via the narrow Bohai Strait (Fig. 1). The main rivers flowing into the BS are the YR, Haihe River, Luanhe River and Liaohe River. Among these, the YR is the largest and is the main source of sediments in this region. Over the past 2000 years, the YR has annually provided approximately 1.1×10⁹ t of sediment discharged into the BS (Milliman et al., 1987). This immense amount of sediment has resulted in the rapid seaward progradation of YRD and a rapid change in the location of the main distributaries in the lower delta plain.
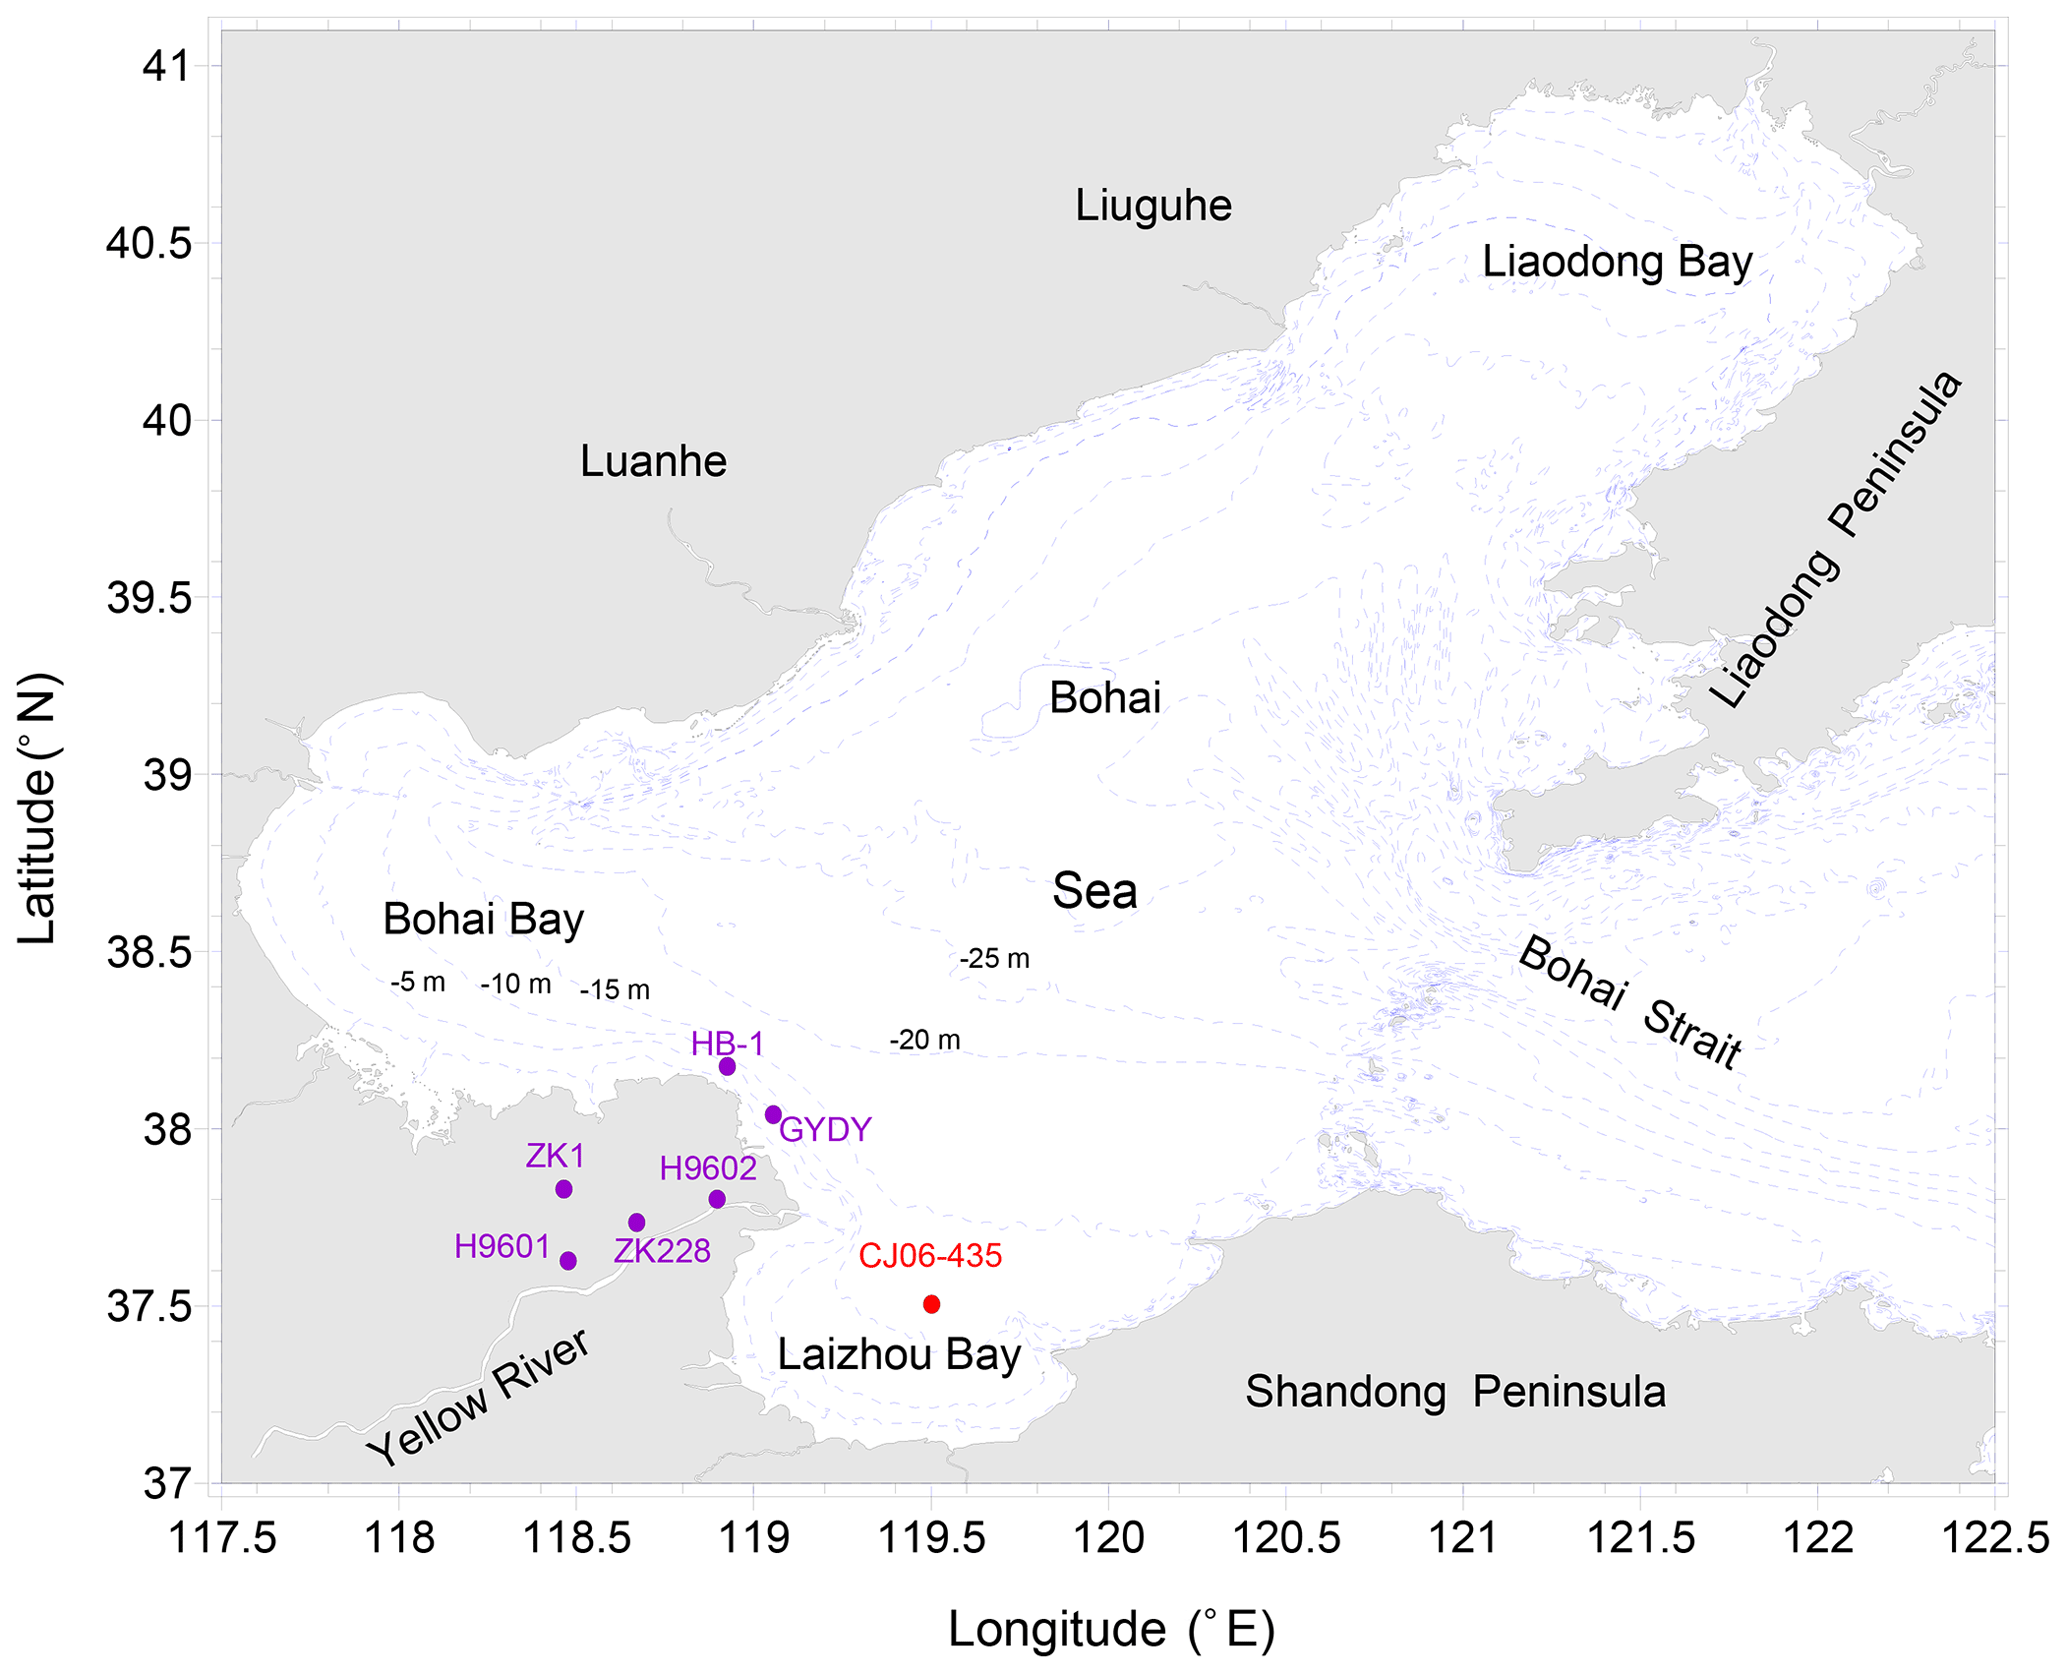
Figure 1Geographic map of the Bohai Sea, with locations of the core CJ06-435 site (red circle) and other sites referred to in this study (purple circles). Core references are as follows: H9601 and H9602 (Saito et al., 2000), ZK1 (Li et al., 2013), ZK228 (Xue et al.,1988), HB-1 (J. Liu et al., 2009), and GYDY (Liu et al., 2014).
The tidal current plays a critical role in the transportation and distribution of sediments in the BS. The tidal currents of the modern BS are dominated by semi-diurnal tides. The velocity of tidal currents varies from 20 to 80 cm s−1. Three strong tidal current areas are observed in the northern Bohai Strait, the central part of Bohai Bay and the eastern part of Liaodong Bay (Huang et al., 1999). In Laizhou Bay, close to the core location, the speed of tidal currents is weak (Gu and Xiu, 1996).
The wind waves off the YRD are dominated by the East Asian monsoon and show significant seasonal variations. The prevailing northerly winds are much stronger in winter than the dominant southerly winds in summer. Strong winter winds cause strong wind waves and thus strong bottom shear stresses that readily erode seabed sediment into water (Yang et al., 2011; Wang et al., 2014; Zhou et al., 2017).
The circulation of the BS is weak, and the mean flow velocity is small. In winter, the predominant extension of the Yellow Sea Warm Current (YSWC) intrudes and crosses the Bohai Strait, moving westward along the central part of the BS, and splits into two branches. One branch moves toward the northeast to form a clockwise gyre (Liaoxi Coastal Current, LXCC), and the other veers southward and then turns eastward along the southern coast to form a counterclockwise gyre (Lubei Coastal Current, LBCC). In summer the YSWC disappears in the BS, and eddies generated in the BS are stronger than in winter. During this time, the central eddy is missing, the eddy in Laizhou Bay is more pronounced, and the coastal current along the southern and western coastlines of the BS is established (Fig. 2; Liu et al., 2015; Yang et al., 2016).
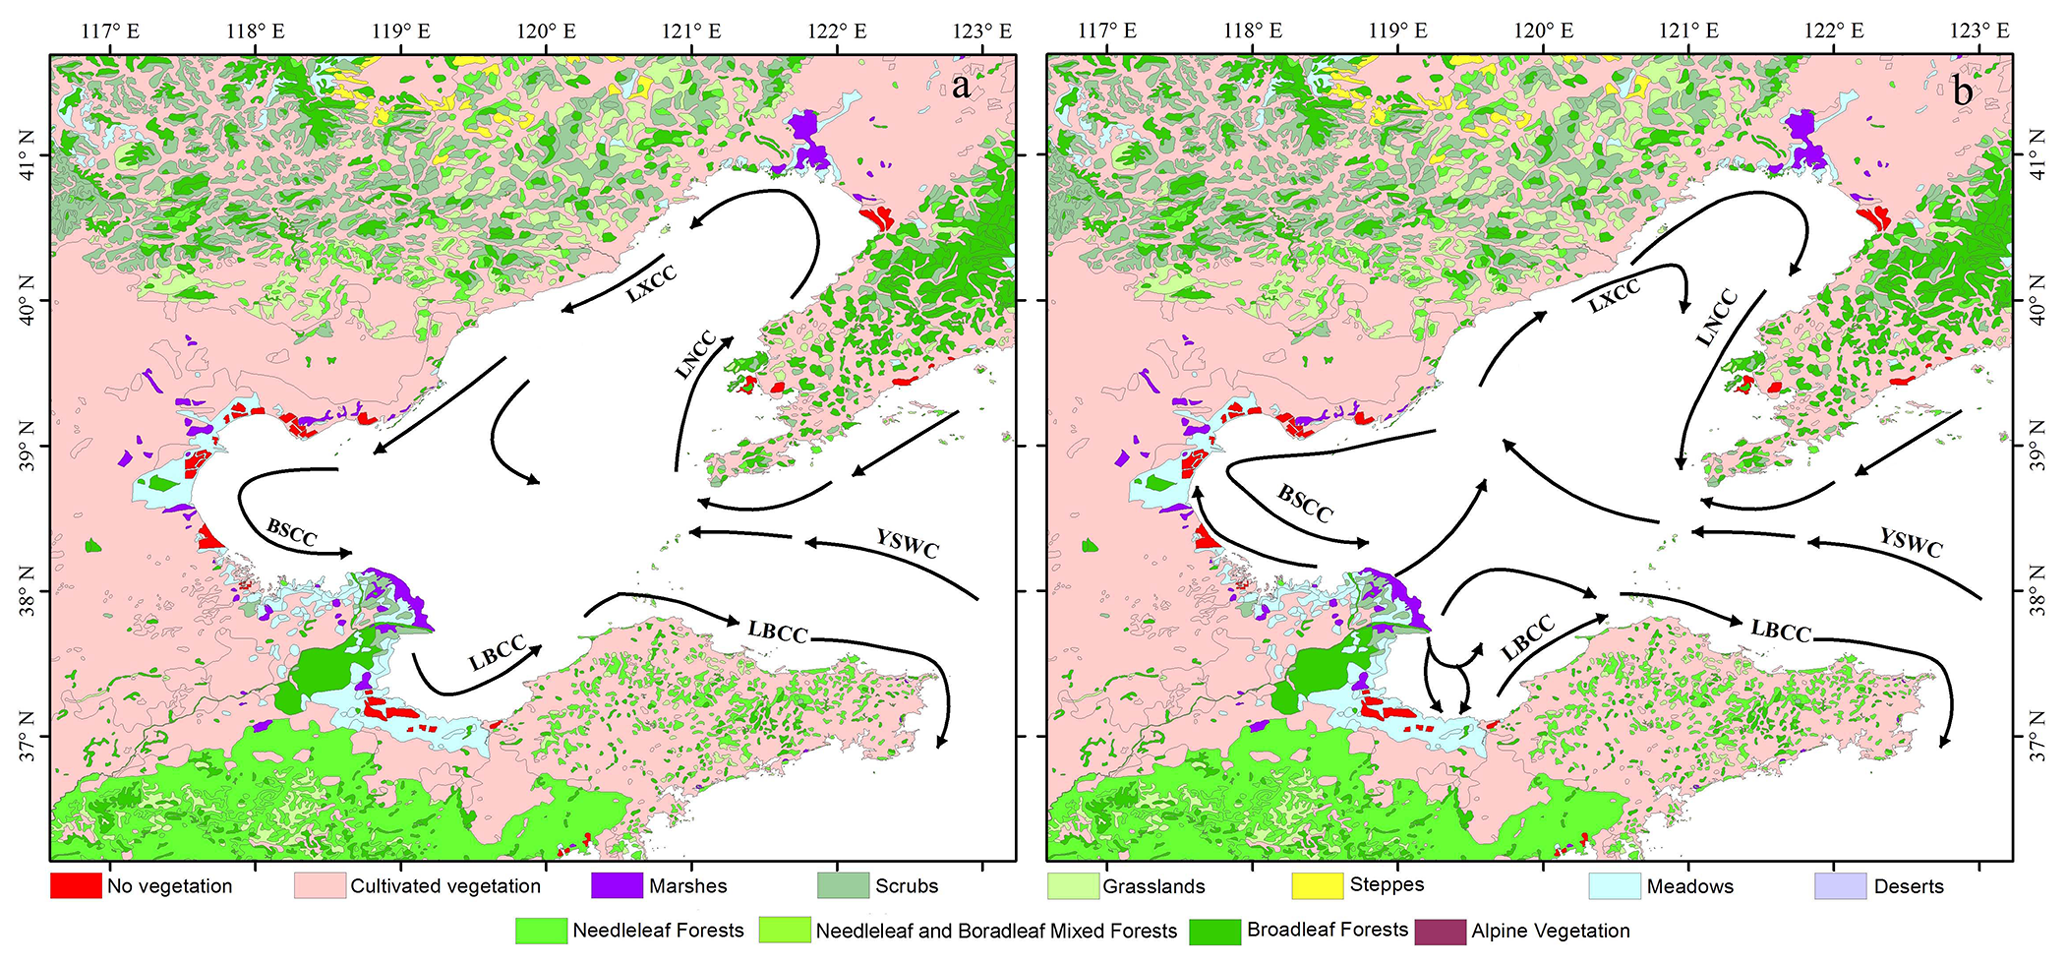
Figure 2Vegetation map around the Bohai Sea and the ocean current in the Bohai Sea during the summer (a) and winter (b) (YSWC: Yellow Sea Warm Current; BSCC: Bohai Sea Coastal Current; LNCC: Liaonan Coastal Current; LBCC: Lubei Coastal Current; LXCC: Liaoxi Coastal Current), modified from Qiao et al. (2010); the vegetation dataset comes from the Environmental and Ecological Science Data Center for West China, the National Natural Science Foundation of China, and the Institute of Botany, Chinese Academy of Sciences (http://www.nsii.org.cn/mapvege, last access: 11 December 2020), and is based on the Vegetation Atlas of China (1:1 000 000; Hou, 2001).
2.2 Climate and vegetation
The Bohai region lies in a zone of warm temperate monsoonal climate with distinctive seasons. The annual mean air temperature is 9.5–13.1 ∘C. The annual average precipitation is about 600 mm, and 60 %–70 % of the total annual precipitation occurs between June and August (Qiao et al., 2012). As the Liaodong Peninsula and Shandong Peninsula protrude into the sea, they are clearly influenced by its proximity and experience sufficient rainfall. There is less rainfall in the mountainous area of the northern area (Wang et al., 1993).
The regional vegetation is dominated by warm temperature deciduous broadleaved forests and shrub grasslands. Currently, natural vegetation only remains in the mountain areas because of widespread anthropogenic activities (e.g., cultivation and farming). The predominant deciduous broadleaved species belong to Quercus, such as Q. liaotungensis, Q. dentata, Q. acutissima and Q. mongolica. Co-dominant plants are Pinus, including P. densiflora that grows in the coastal humid area and P. tabuliformis that is distributed in the relatively dry North China Plain. In the plain area, apart from P. tabuliformis, there are some deciduous broadleaved trees, such as Ailanthus altissima, Koelreuteria paniculata, and Morus alba. Other broadleaved trees, Betula ermanii, Populus tremula, Acer spp., Tilia amurensis, and Carpinus turczaninowii are distributed in the hills and lowlands (Wang et al., 1993). The coastal wetlands are occupied by herbs and shrubs, such as Tamarix chinensis, Salix matsudana, S. integra, Phragmites australis, Aeluropus, Limonium sinense, Suaeda glauca, Typha orientalis and Acorus calamus (Wang et al., 1993; Li et al., 2007; Xu et al., 2010).
3.1 Coring, sub-sampling, and chronology
Core CJ06-435 was collected in Laizhou Bay in August 2007 by the R/V Kan407 of the Shanghai Bureau. The core site is located at 37.50∘ N, 119.52∘ E, at a water depth of 14.6 m (Fig. 1); the core had a length of 271 cm. In the laboratory, the core was split into two sections, photographed, macroscopically described and subsampled.
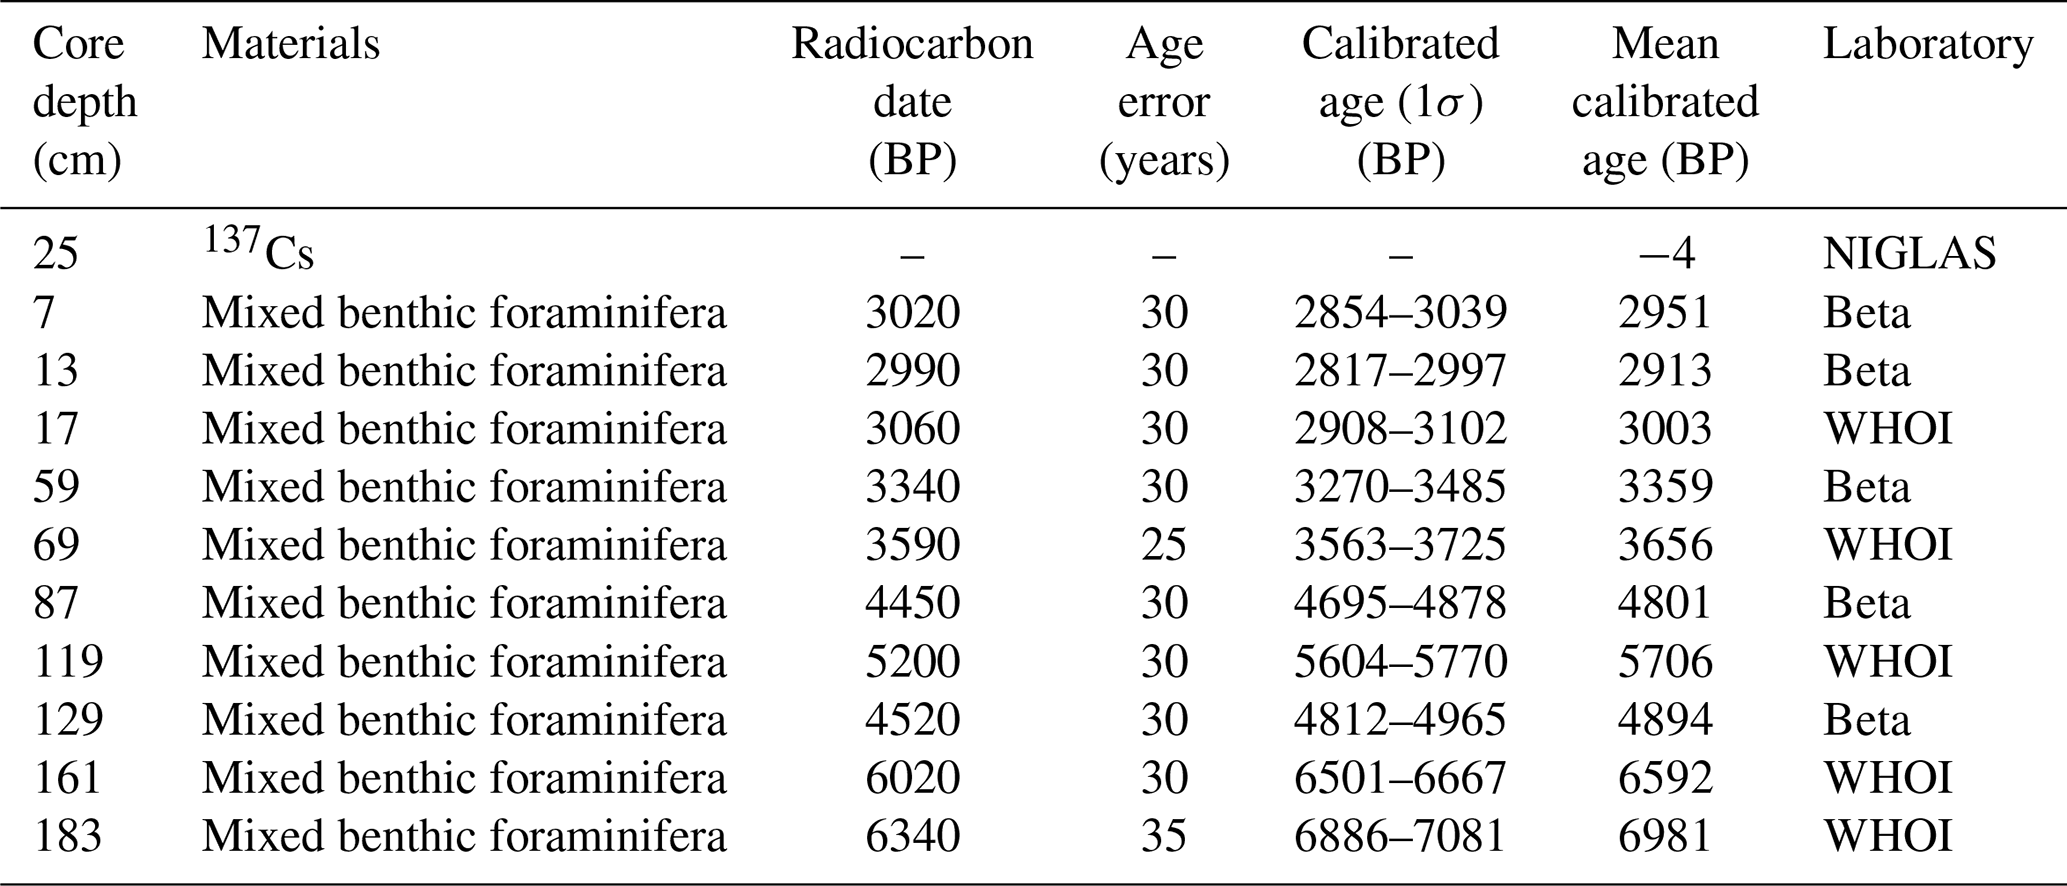
Isotopes 137Cs and 210Pb were measured employing EG&G Ortec Gamma Spectrometry at the Nanjing Institute of Geography and Limnology, Chinese Academy of Sciences (NIGLAS). The sediment samples were air-dried and pulverized. 137Cs and 210Pb concentrations were then determined from gamma emissions at 662 and 46.5 keV, respectively. In addition, a total of 10 samples consisting of foraminifera were obtained from the core for radiocarbon dating. The radiocarbon dating was conducted at the Woods Hole Oceanographic Institution (WHOI) and Beta Analytic Inc., USA. Radiocarbon dates were corrected for the regional marine reservoir effect ( years, a regional average value determined for the BS) and calibrated using the Calib 7.04 program (Stuiver et al., 2019) with 1 standard deviation of uncertainty (1.0×σ) (Table 1).
Table 1AMS radiocarbon dates from core CJ06-435 and one tie point corresponding to the deepest onset of 137Cs in environmental samples at measurable levels; for calibration in years before present (BP) 0=1950 CE.
3.2 Palynological and sediment grain size sample analysis
A total of 127 samples were selected for pollen analyses. Each sample was oven-dried at 60 ∘C for 24 h. The dry weight of the samples ranged from 2.5 to 13.9 g. Samples were chemically treated according to the procedure outlined by Faegri and Iversen (1989). Before treatment, a standard tablet of Lycopodium spores (mean spores per tablet) was added to each sample to aid in the calculation of palynological concentrations. Samples were treated with 15 % HCl solution to remove carbonates, boiled in 10 % KOH solution for 5 min to remove humic acids, and then treated with 40 % HF to remove silicates. The residue was mounted in glycerin jelly. Fossil pollen was identified and counted with a light microscope at 400× magnification. A minimum of 200 pollen grains were counted for each sample. The palynological concentrations of per gram sediment (PCP) were calculated using the following equation:
The percentage of each pollen type was calculated from the total sum of pollen and spores. The pollen diagram was produced using Tilia software, and the pollen assemblage zones were divided based on the results of a constrained cluster analysis (CONISS) within Tilia (Grimm, 1987).
Analysis of sediment grain size was performed at 2.0 cm intervals throughout the core using a Malvern Mastersizer 2000 instrument at the laboratory of the First Institute of Oceanography. The chemical procedure of grain size experimental pretreatment was consistent with the procedures described by Chen et al. (2019a). A solution of 30 % H2O2 and 1.0 mol L−1 HCl was added to decompose the organic matter and remove carbonates.
4.1 Chronological model
Measurements of 137Cs and 210Pb revealed activity at the top of the profile, indicating the recovery of recently deposited sediments. 137Cs is a bomb-derived radionuclide, first appearing in environmental samples at measurable levels around 1954 with the onset of nuclear weapon testing (Kirchner and Ehlers, 1998), and was most prevalent in 1963 (the year of maximum fallout from atmospheric weapon testing) (Palinkas and Nittrouer, 2007). Subsurface peaks are not discernible in 137Cs profiles of core CJ06-435 (Fig. 3). However, the deepest onset of 137Cs is an effective marker of the year 1954 (25 cm).
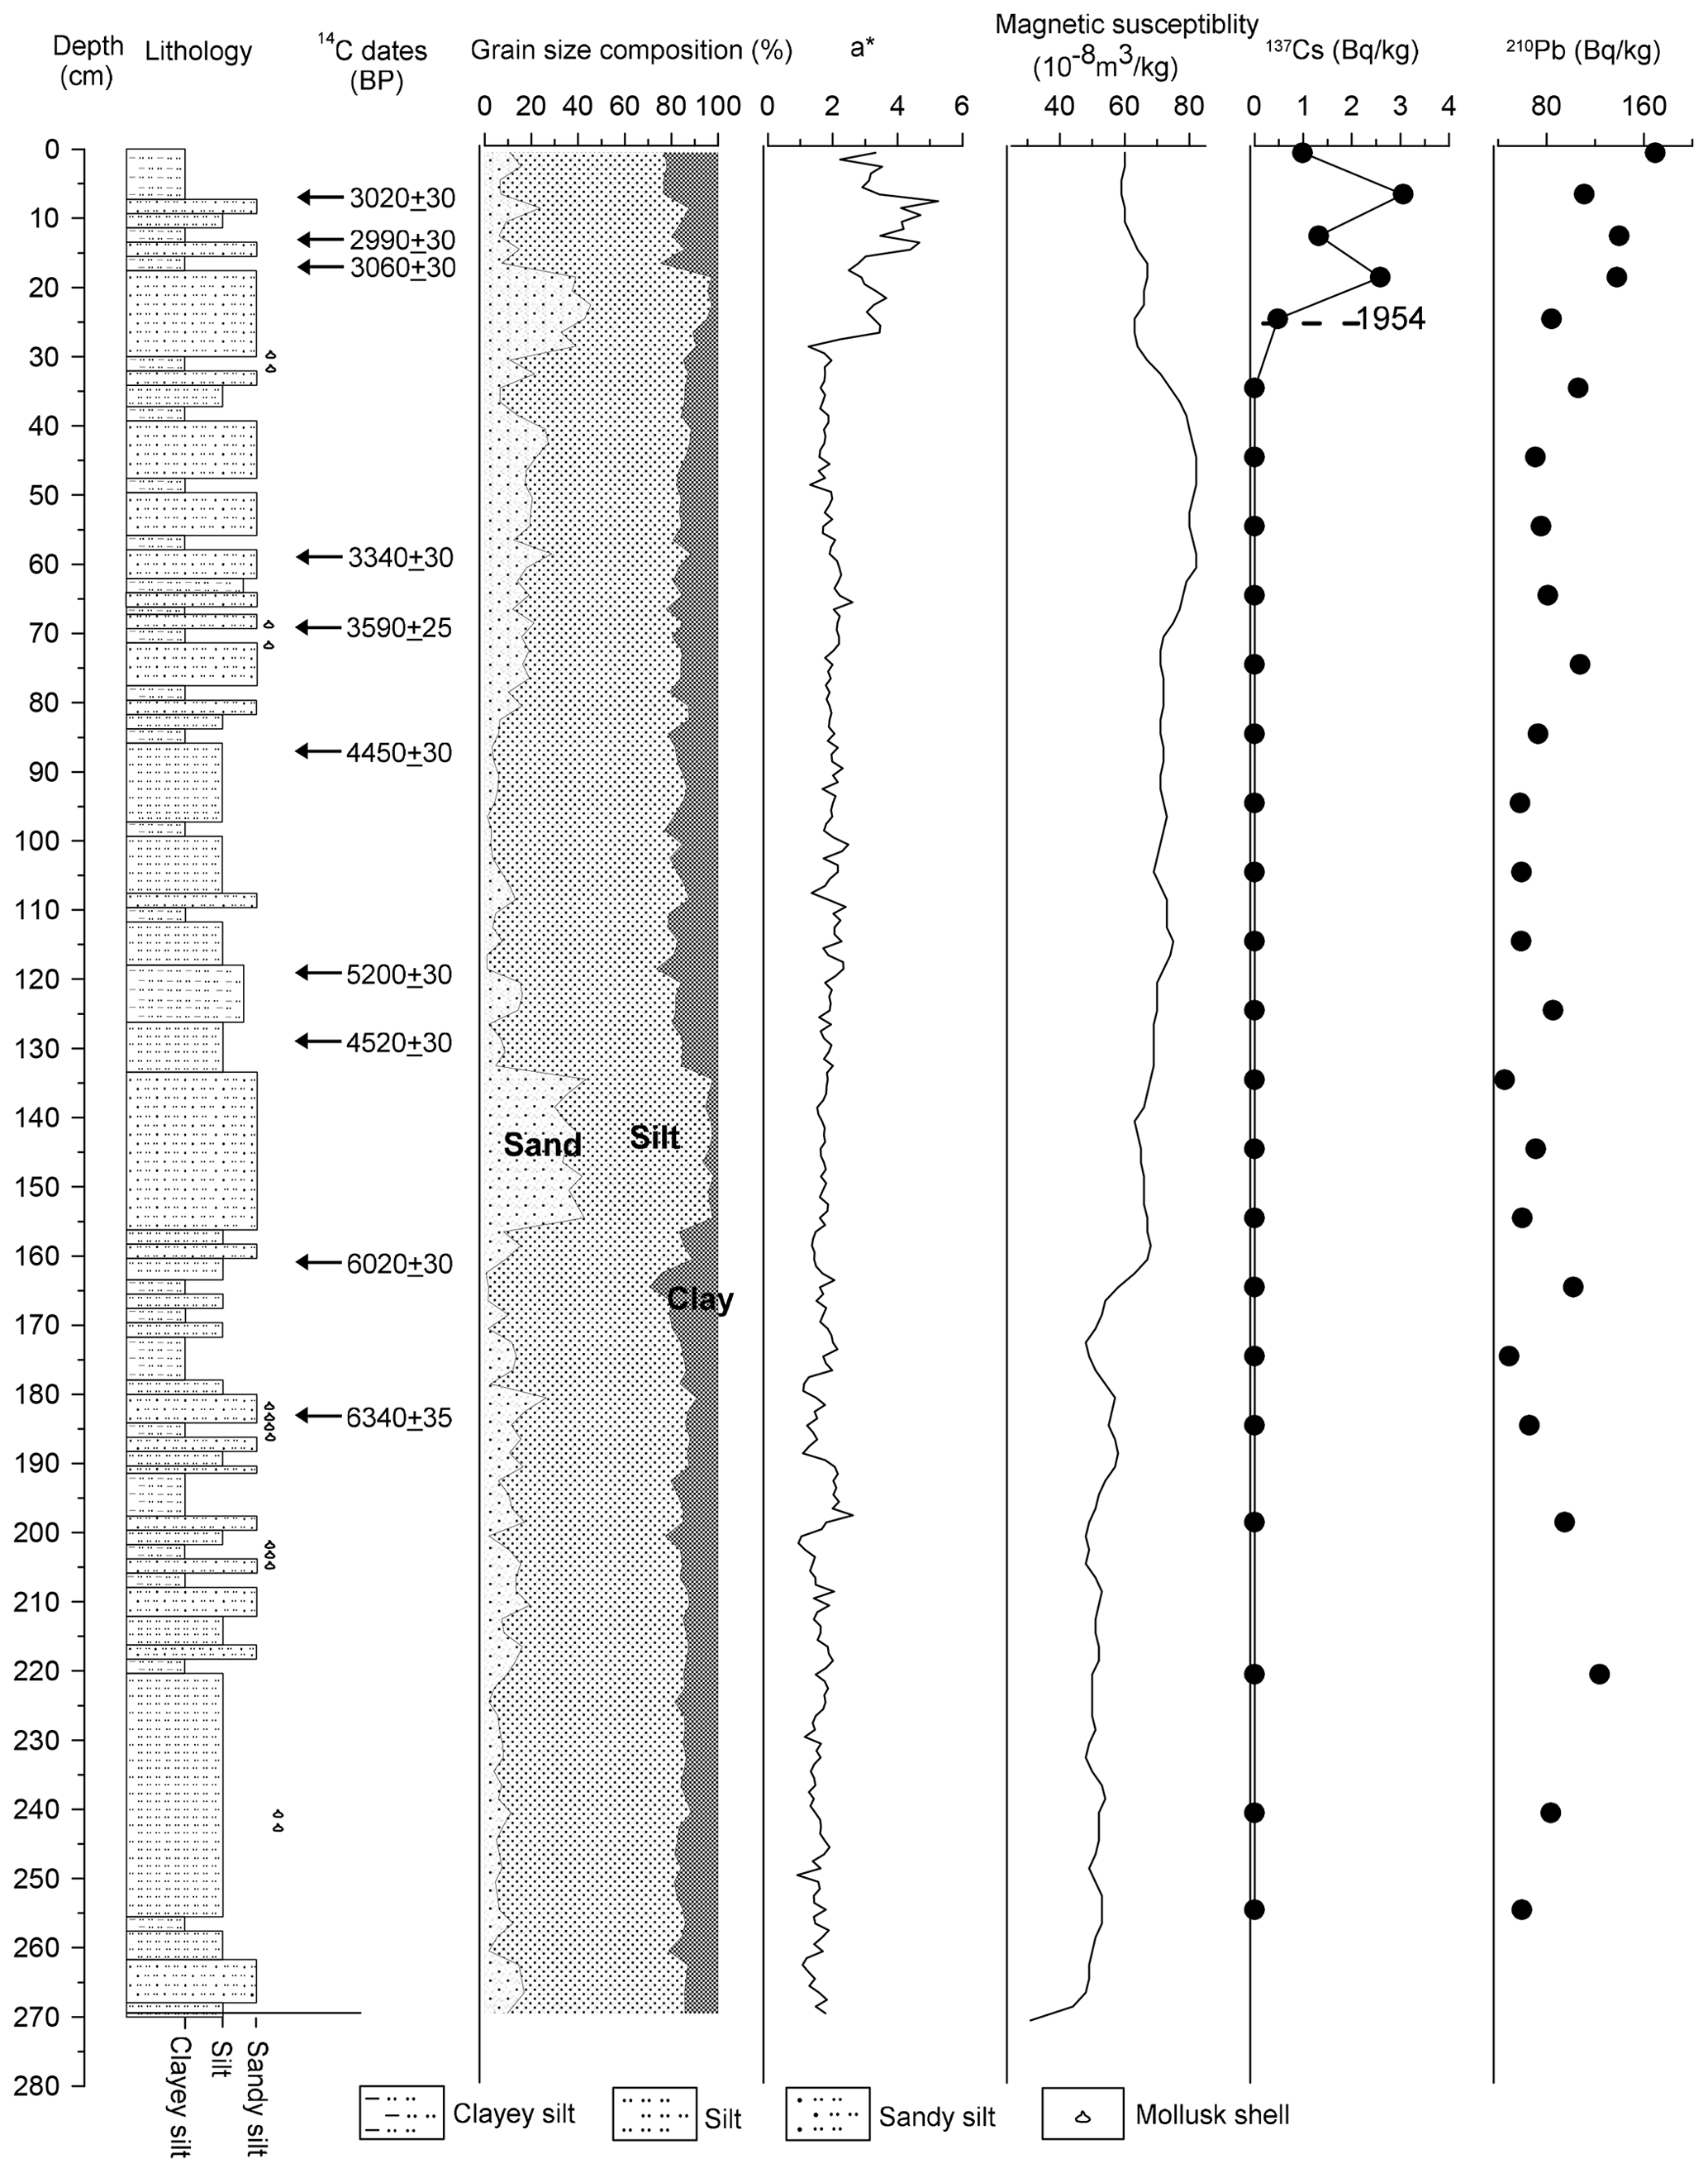
Figure 3Lithology, grain size, color reflectance a*, magnetic susceptibility, and activity profiles for 137Cs and 210Pb of core CJ06-435.
Often, the combined data of 137Cs and excess 210Pb have been used to calculate the sedimentation rates (Wu et al., 2015). Excess 210Pb shows a downward decline owing to the decay of 210Pb when the sediment stably accumulates for an appropriate period, and the excess 210Pb activity could be used to calculate the sedimentation rate. However, the excess 210Pb profiles of core CJ06-435 did not show a clear downward decline trend (Fig. 3), and excess 210Pb in the upper parts of the core is not that large when compared with the lower background values. Thus, the 210Pb data seemed to be unsuitable for estimating the sedimentation rate of core CJ06-435. The 137Cs-derived average sedimentation rate was 0.47 cm yr−1 in the upper 25 cm of core CJ06-435.
The results of AMS radiocarbon dating are shown in Table 1 and Fig. 3. Three samples above the 20 cm depth were not included in the age model because their 14C age was anomalously greater than the 137Cs dating. The dating point of 129 cm was eliminated because it appears to not to be reliable. According to the result of He et al. (2019), the calculated sedimentation rate (CSR) in the tidal flat and neritic area of the south BS ranged from 0.02 to 0.13 cm yr−1 before 2000 BP (calculation from cores H9601, H9602, ZK228, and ZK1, Fig. 1). If the 129 cm dating is correct, the CSR would be as high as 0.45 cm yr−1 in the section of 87–129 cm (4801–4894 BP) for core CJ06-435. It is apparently not reasonable because core CJ06-435 is offshore compared to the other cores (e.g., H9601, H9602, ZK228, and ZK1, Fig. 1) reported in previous researches (Xue et al., 1988; Saito et al., 2000; Li et al., 2013). It should have a lower CSR compared to those cores rather than an approximate 10-fold increase in CSR. The calibrated dates of several other samples are plotted against sediment depth and shown in Fig. 4.
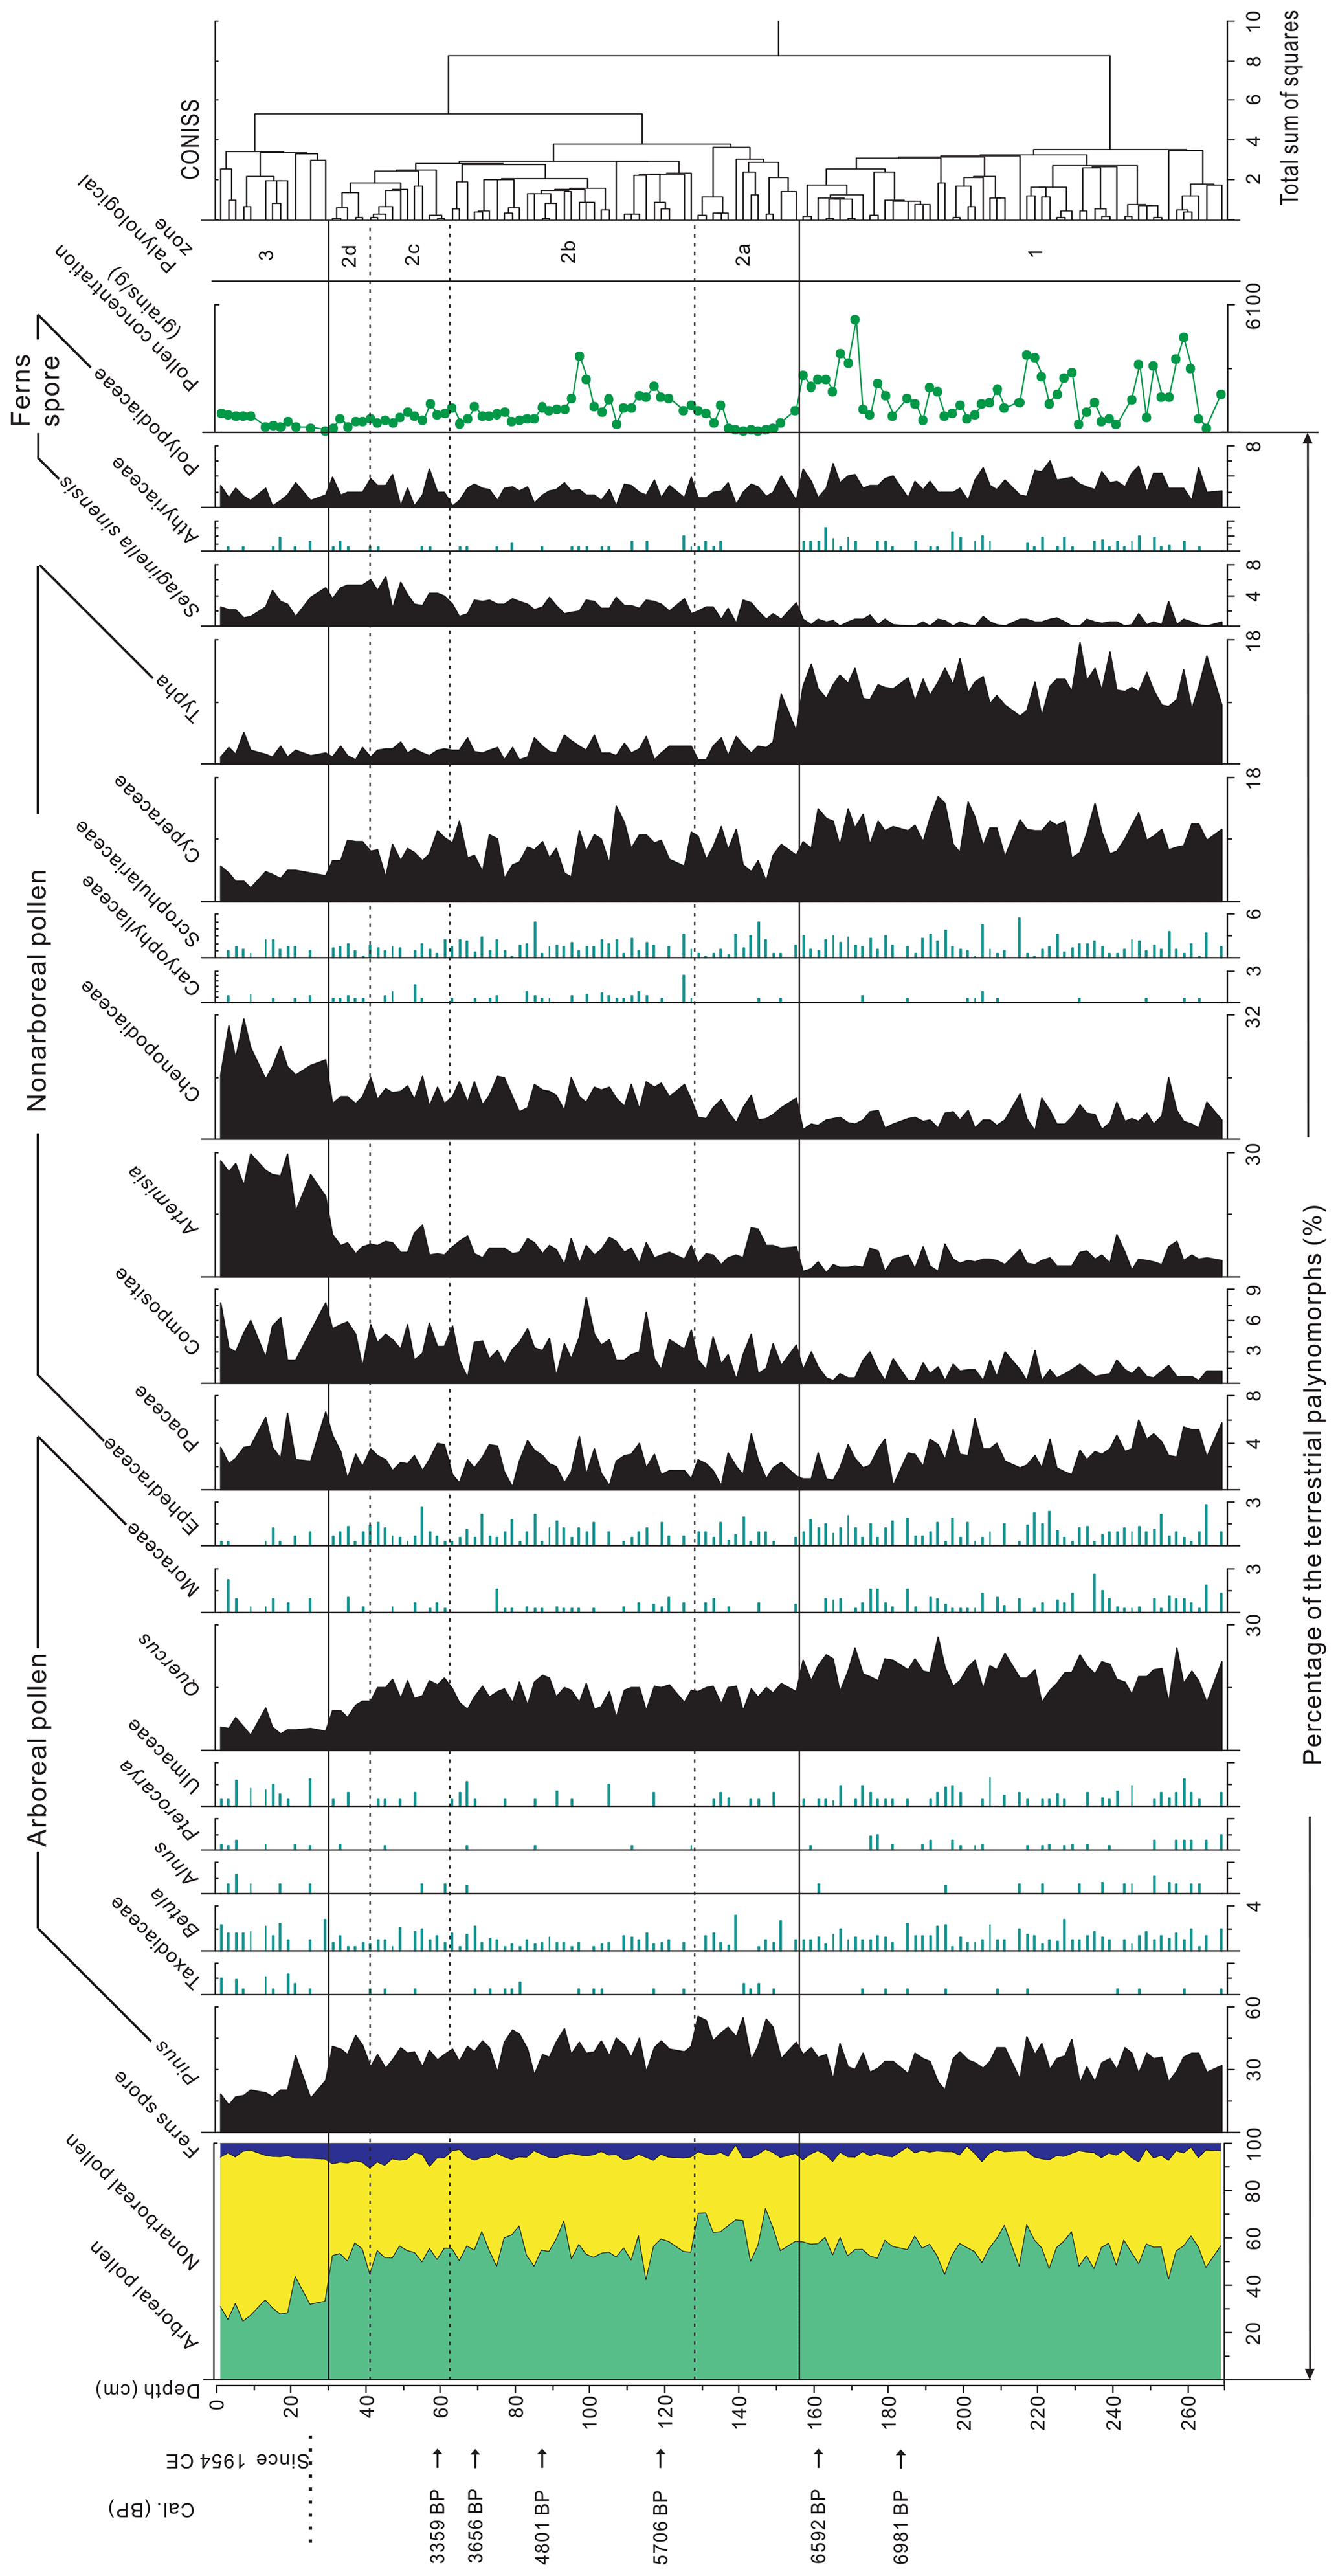
Figure 4Percentage diagram of the principal pollen taxa from core CJ06-435. Pollen zonation is based on CONISS results.
4.2 Sediment grain size distributions
The grain size parameters and component percentages show distinct variations. The mean grain size and the median grain size both show high values at depths of 271–160, 135–83, and 19–0 cm; lower values at a depth of 83–34 cm; and the lowest values at depths of 160–135 cm and 34–19 cm. There was a smaller proportion of clay in the lower profile (271–160 cm) than in the upper profile (160–0 cm, except for the two sections of 160–135 and 34–19 cm). The sequences of silt and sand contents showed a strong inverse association. There were high proportions of silt and low proportions of sand at depths of 271–222, 180–160, 135–83, 40–34, and 19–0 cm; lower proportions of silt and higher proportions of sand at depths of 222–180 and 83–40 cm; and the lowest proportions of silt and the highest proportions of sand occurred at depths of 160–135 and 34–19 cm (Fig. 3).
4.3 Palynology assemblage
A total of 71 pollen taxa were identified, among which Pinus, Quercus, Cyperaceae, and Typha were the most dominant taxa in the lower part (271–156 cm) of the core and Pinus, Quercus, Poaceae, Compositae, Artemisia, Chenopodiaceae, and Cyperaceae were the most dominant taxa in the upper part (156–0 cm) of the core. With respect to the fern spores, Selaginella sinensis and Polypodiaceae were dominant; however, their content was low throughout the core. With the aid of CONISS, the whole sequence was vertically divided into three zones, with zone 2 further divided into subzones 2a, 2b, 2c and 2d (Figs. 4 and 5).
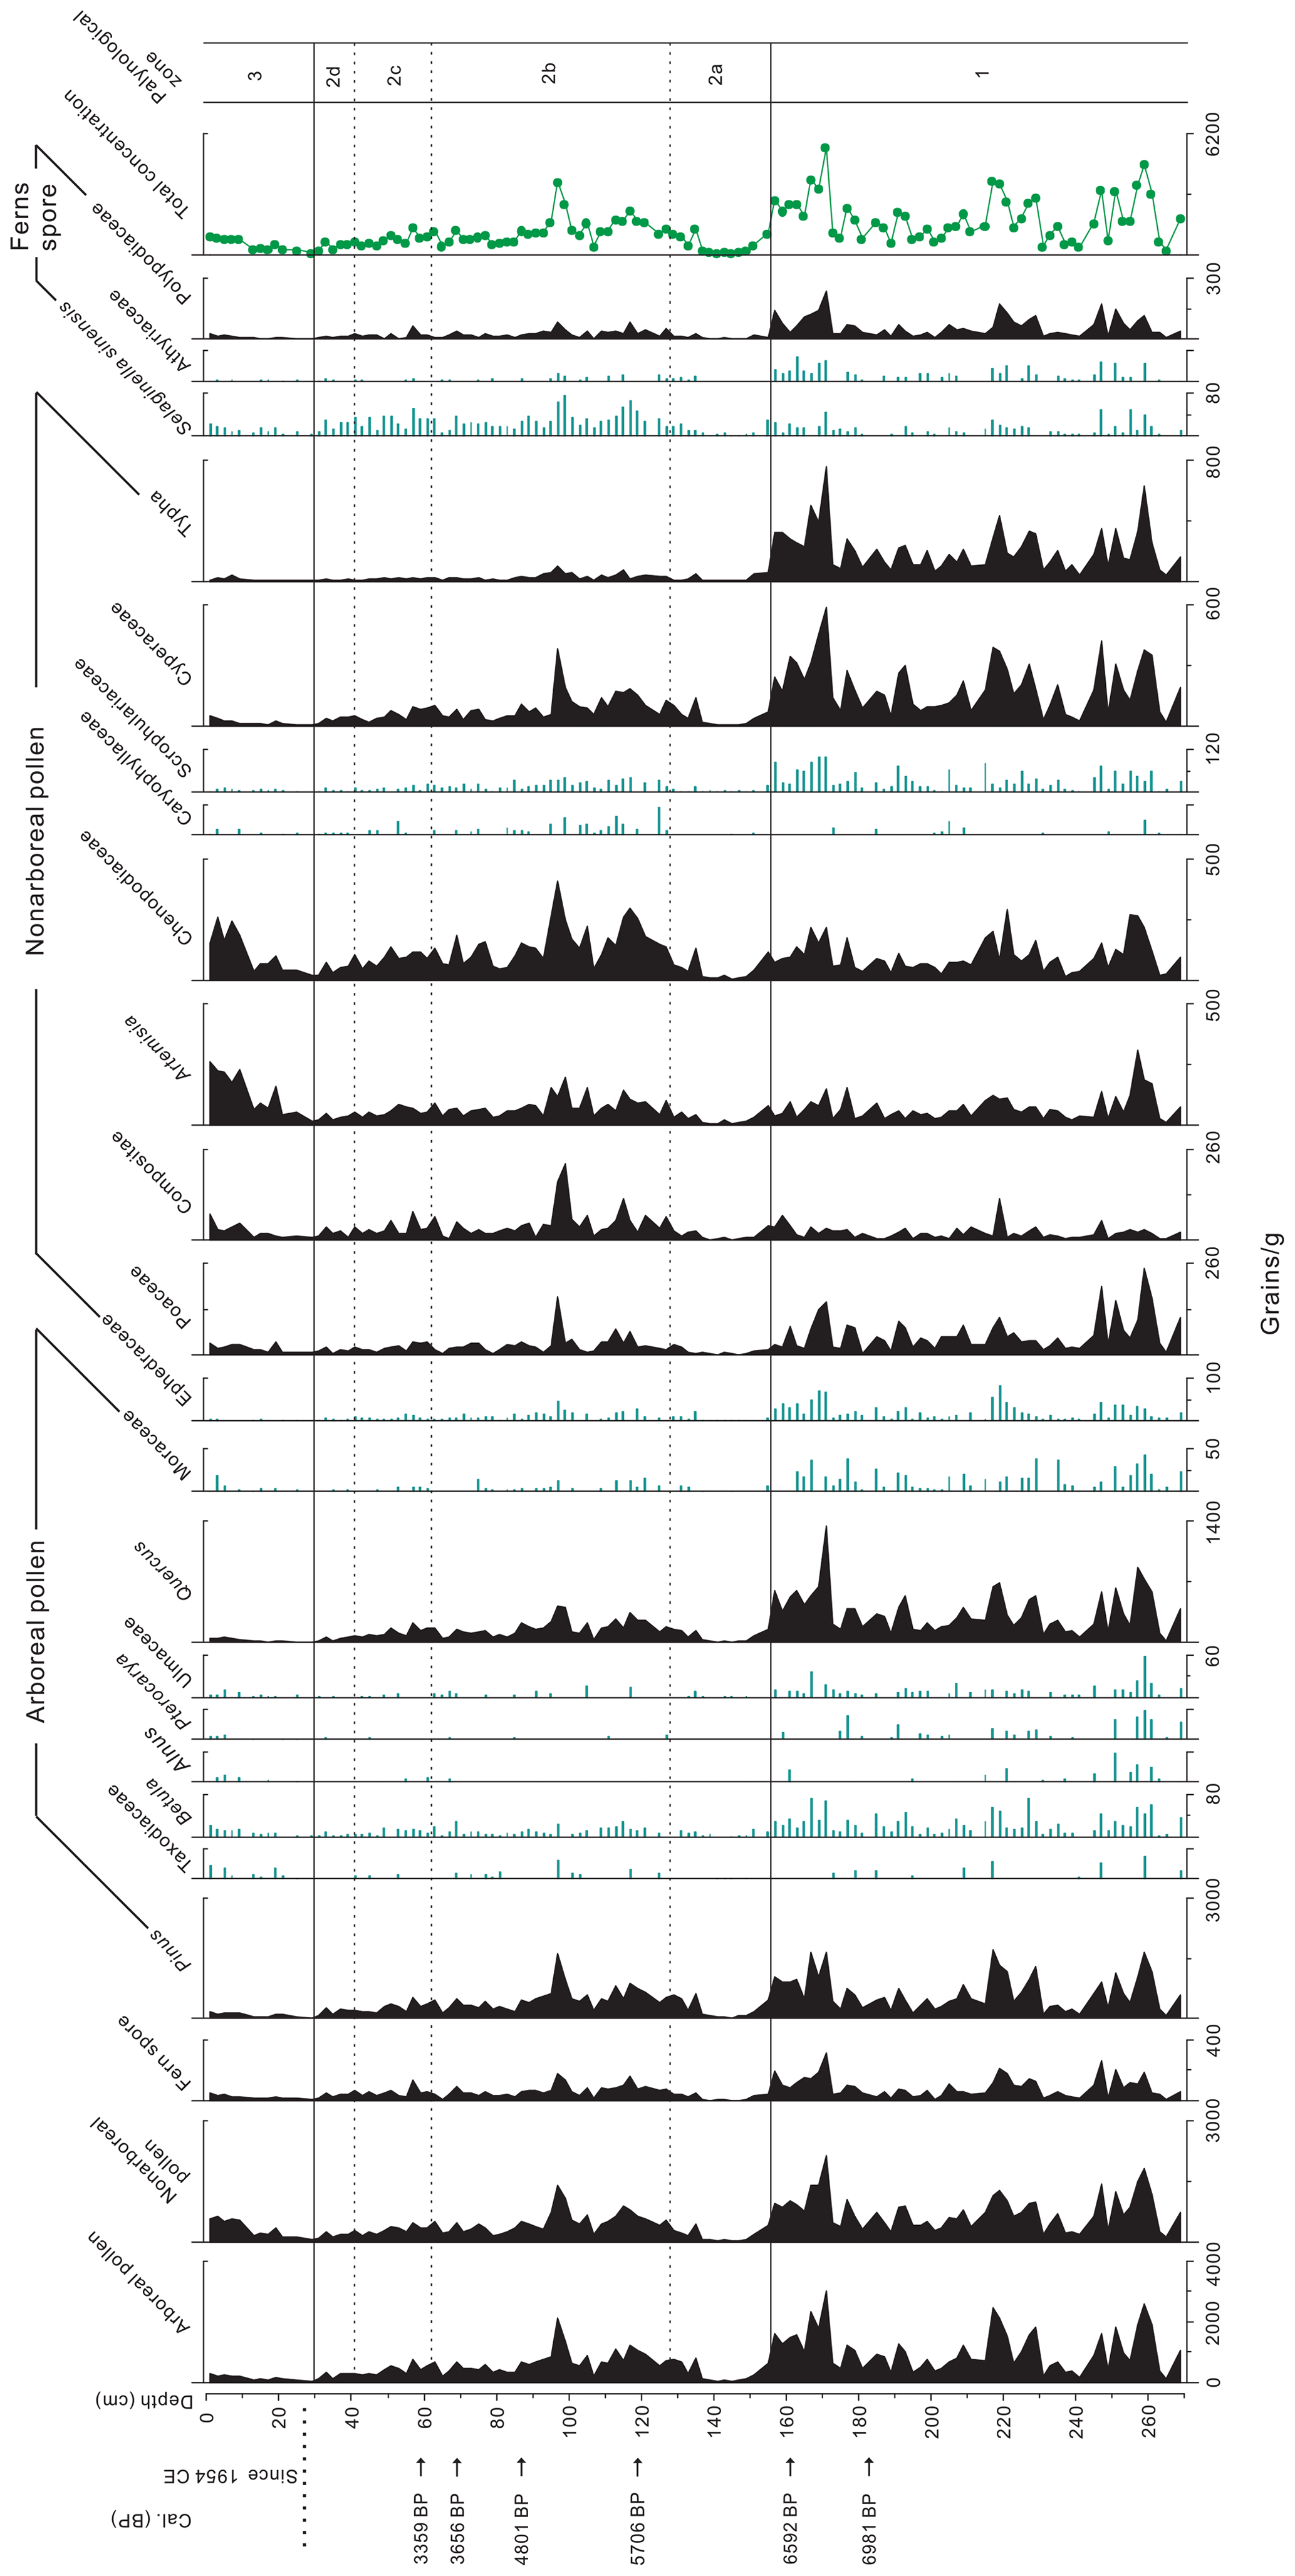
Figure 5Concentration diagram of the principal pollen taxa from core CJ06-435.
4.3.1 Palynological zone 1 (271–156 cm)
The palynological zone 1 was characterized by abundant broadleaved trees pollen, dominated by Quercus (mean 18.7 %), Betula, Alnus, Pterocarya, Ulmaceae and Moraceae (Fig. 4). Percentages of conifer pollen were relatively low compared with other zones: Pinus ranges from 19.7 % to 45.6 % (mean 33.6 %), and Taxodiaceae was present only occasionally. Compared to the other zones, the proportions of non-arboreal pollen types, Compositae (mean 1.2 %), Artemisia (mean 4.2 %) and Chenopodiaceae (mean 5.6 %) were lowest in this zone, whereas the proportions of Cyperaceae (mean 10.3 %) and Typha (mean 11.2 %) were highest in this zone. The palynological concentrations were high, varying between 6050 and 237 grains g−1 (Fig. 5).
4.3.2 Palynological zone 2 (156–30 cm)
Palynological zone 2 was divided into four subzones.
From depth of 156 to 128 cm (subzone 2a). The percentage of Pinus pollen reached its maximum (mean 46.6 %), whereas the percentage of broadleaved trees Quercus (16.1 %–9.5 %, mean 14 %), Betula, Alnus, Pterocarya, Ulmaceae and Moraceae decreased to different degrees. The proportions of non-arboreal pollen types, Compositae (mean 2.5 %), Artemisia (mean 6.6 %) and Chenopodiaceae (mean 7.4 %) were higher, whereas the percentages of Cyperaceae (mean 7.2 %) and Typha (mean 3.1 %) declined sharply (Fig. 4). Total pollen concentrations were lower than in zone 1, especially in the interval of 156–135 cm, where the value of total pollen concentrations (62–1306 grains g−1, mean 485 grains g−1) was at its minimum in the core (Fig. 5).
From depth of 128 to 63 cm (subzone 2b). Pinus (49.4 %–27.3 %) and Quercus (18.1 %–7.9 %, mean 13.5 %) pollen level decreased to a low point, and the relative abundance of Betula slightly increased. Occasionally, there were small amounts of Pterocarya, Ulmaceae and Moraceae. Non-arboreal pollen types, Compositae, Artemisia and Chenopodiaceae continuously increased to averages of 3.5 %, 6.7 %, and 12 %, respectively (Fig. 4). Pollen concentration increased up to a high abundance (mean 1260 grains g−1) in this subzone (Fig. 5).
From depth of 63 to 41 cm (subzone 2c). The percentage of Pinus pollen started to decrease steadily, and the percentage of Quercus (17.4 %–11.8%, mean 14.8 %), Betula, Alnus, Pterocarya and Ulmaceae pollen slightly increased. Similar to subzone 2b, this subzone had relatively high quantities of non-arboreal pollen, such as Compositae, Artemisia and Chenopodiaceae (Fig. 4). Pollen concentrations varied between 456 and 1381 grains g−1 (Fig. 5).
In contrast, subzone 2d (41–30 cm) was marked by a sudden decrease in the pollen of Quercus (9.8 %) and a steep increase in the pollen of Pinus (41.1 %), even though the percentages of the non-arboreal were the same as those of subzone 2c (Fig. 4).
4.3.3 Palynological zone 3 (30–0 cm)
This zone was characterized by the transition from dominance by the pollen of arboreal taxa to non-arboreal types. The percentage of Pinus and Quercus pollen decreased to the lowest level, averaging approximately 19.7 % and 5.5 %, respectively. Poaceae, Compositae, Artemisia, and Chenopodiaceae pollen increased, with average values of Artemisia and Chenopodiaceae reaching up to 24.6 % and 21.1 %, respectively (Fig. 4). The total pollen concentration declined to 188 grains g−1 in the lower part of the zone (30–19 cm) and then increased slightly (to approximately 621 grains g−1) at the top (Fig. 5).
5.1 Key terrestrial palynomorphs proxies of environmental and climatic change
In sediment core CJ06–435, both Pinus and Quercus pollen were the predominant pollen types among the arboreal taxa. In order to understand the pollen provenance, the pollen records in the surface sediments of Laizhou Bay were studied (Yang et al., 2016), and the concentration and percentage data of the main pollen species were presented on a regional map (Fig. 6). Pollen results of surface sediments revealed that higher values of Pinus and Quercus are usually found in the eastern part of Laizhou Bay, and the lowest values of Pinus and Quercus occur in the nearshore area outside the mouth of the YR (Fig. 6a and b). The distributions of Pinus and Quercus pollen in the surface sediments of Laizhou Bay are closely related to the distribution of the nearshore epicontinental vegetation. Except for the YRD, where there is swamp and cultivated land, the epicontinental region of the Laizhou Bay is surrounded by pine and oak forests. Among these, the land to the east of the Laizhou Bay (the Shandong Peninsula) belongs to the southern warm temperate zone and mainly supports a pine–oak forest dominated by Pinus densiflora and Q. acutissima (Wang et al., 1993). The land to the northeast of Laizhou Bay (the Liaodong Peninsula) belongs to the southern temperate zone, and it mainly supports a conifer and broadleaved mixed forest dominated by P. densiflora, Q. mongolica and Q. acutissima (Li et al., 2007; Xu et al., 2010). The ubiquitous distribution of these plants on the adjacent terrain explains why Pinus and Quercus are the most common pollen taxa in Laizhou Bay and why the highest concentration and percentage of Pinus and Quercus occurred in the eastern part of Laizhou Bay and the lowest values of Pinus and Quercus occurred on the nearshore area outside the mouth of the YR.
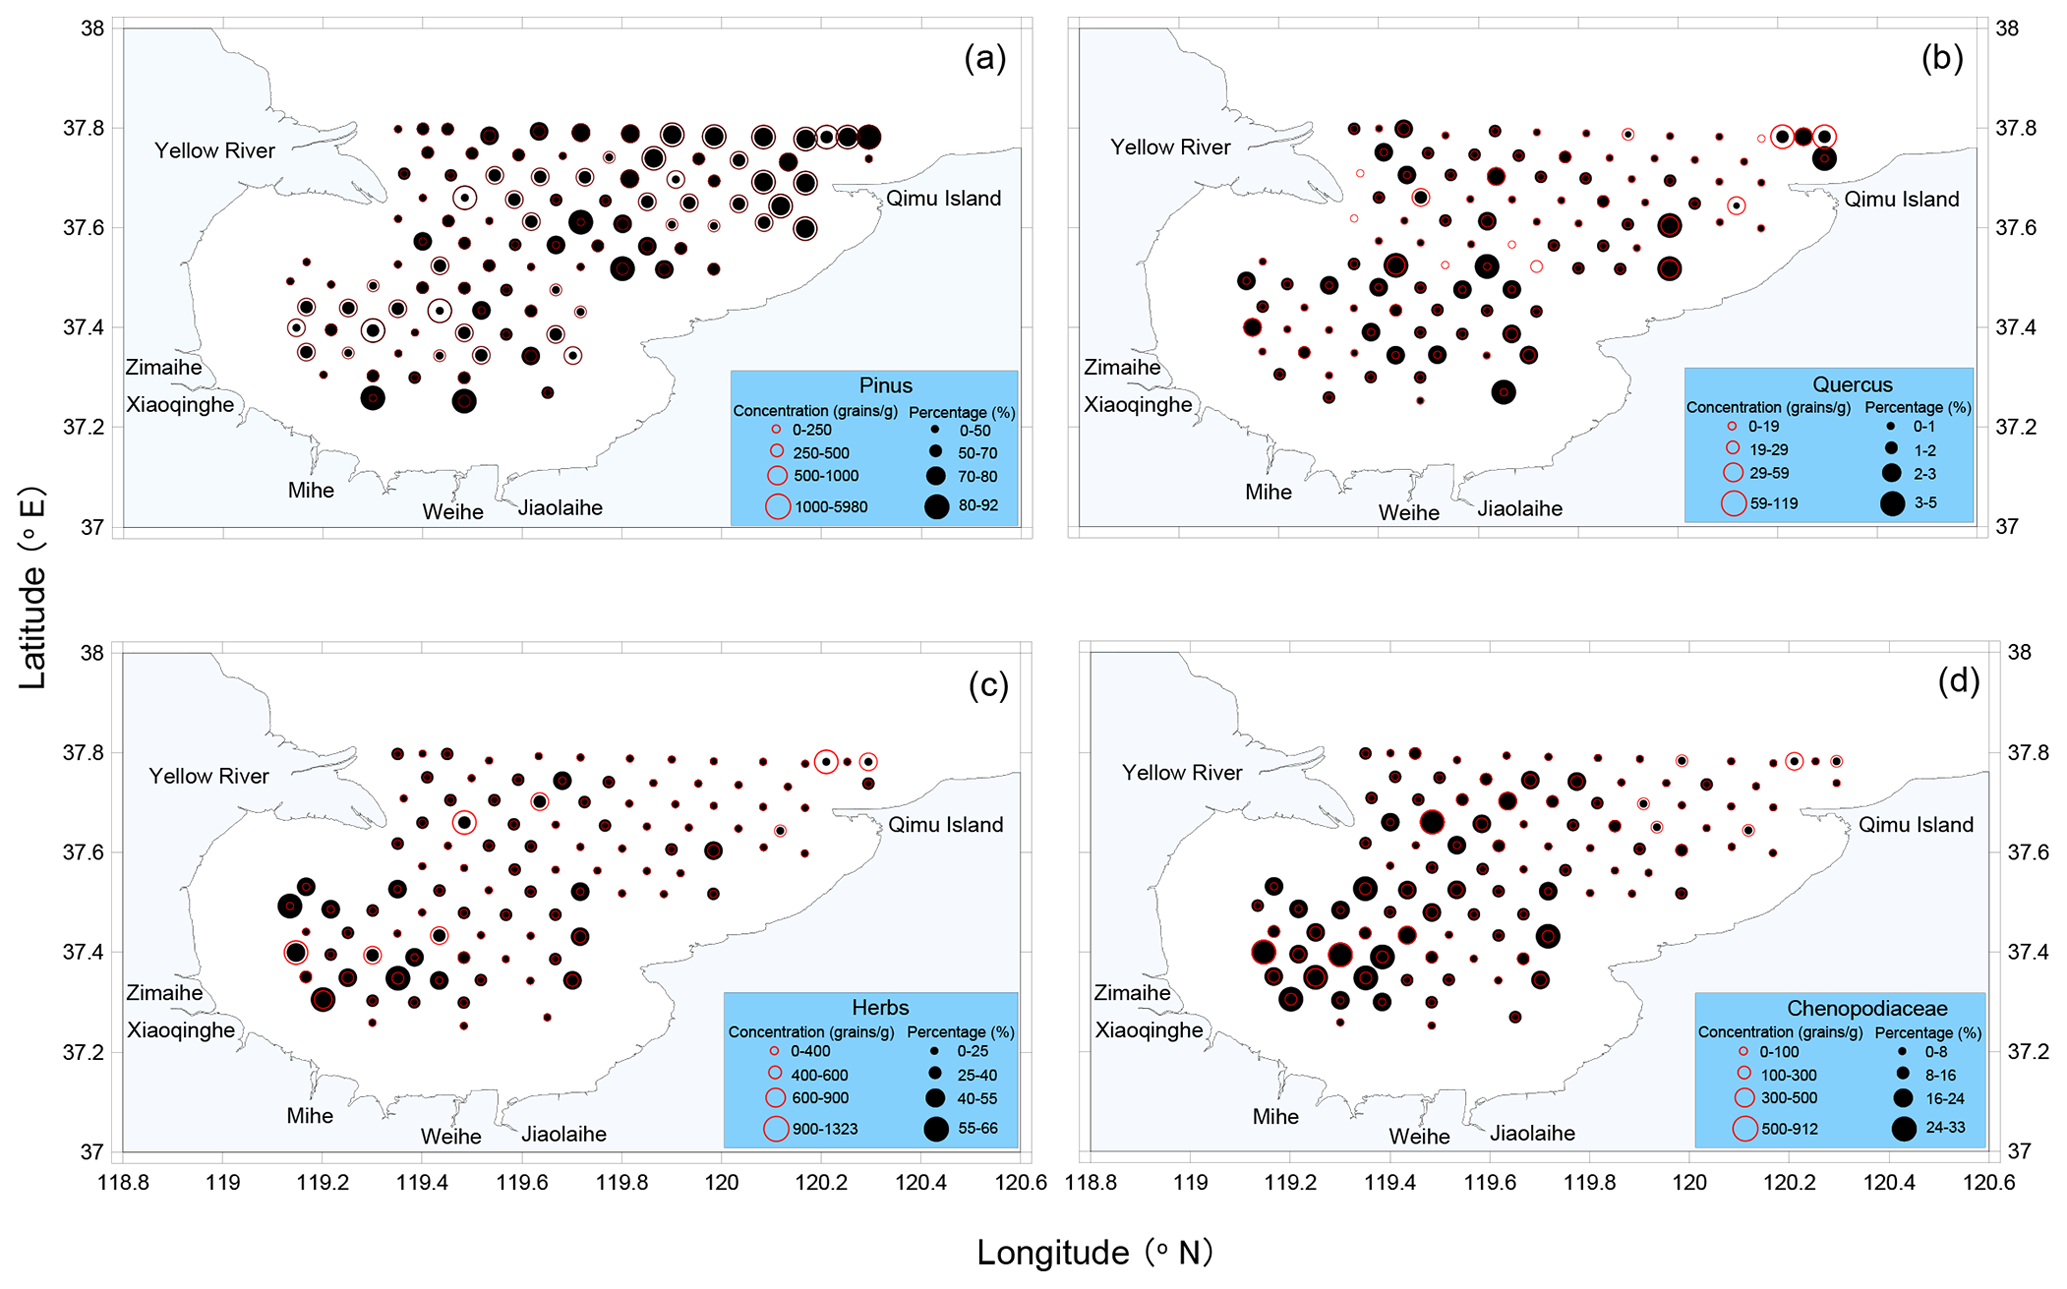
Figure 6Spatial distribution of modern pollen percentage (solid black circle, %) and concentration (open red circle, grains per gram) in Laizhou Bay, Bohai Sea (modified from Yang et al., 2016).
Previous studies have revealed that Pinus and Quercus were the most common components of the forests in northeast China (including the land areas surrounding the BS) during the Holocene. The variation of Pinus and Quercus contents were closely related to the change of temperature (Ren and Zhang, 1998; Yi et al., 2003; Li et al., 2004; Xu et al., 2014; Zhang et al., 2019). Ren and Zhang (1998) investigated pollen data from northeastern China and found that Quercus and Ulmus were the dominant components of the forests between 10 000 and 5000 BP, while Pinus were much sparser, indicating warmer and drier summers in northeastern China for the Early to Middle Holocene. A high-resolution 1000-year pollen record from the Sanjiaowan Marr Lake in northeastern China revealed that Quercus is an effective indicator for temperature reconstructions. Several notable cold periods, with lower Quercus frequencies, occurred at approximately 1200 CE, 1410 CE, 1580 CE, 1770 CE and 1870 CE (Zhang et al., 2019). Another 5350-year pollen record from an annually laminated maar lake in northeastern China revealed a decrease of Quercus and increases of the Pinus component; this indicates a cooling trend during the past 5350 years (Xu et al., 2014). Based on these results, we conclude that the variation of Pinus and Quercus pollen of core CJ06-435 may be also related to temperature change.
Herb pollen, especially Chenopodiaceae, also occupies an important position in core CJ06-435 (Fig. 4). The spatial distribution of herb pollen in surface sediment of Laizhou Bay suggests that a higher percentage and concentration occur in the nearshore area close to the YR estuary and the southwestern part of Laizhou Bay and that a low percentage and concentration are found in the eastern part of Laizhou Bay (Fig. 6c and d). The YR is the main sediment source of the BS. The annual mean sediment load of the YR was 1.08×10⁹ t before dam construction (Milliman and Meade, 1983), 70 %–90 % of which was deposited and formed a huge delta complex (Zhou et al., 2016). Natural vegetation in the modern YRD are dominated by wetland herbs, including Chenopodiaceae and Artemisia (Jiang et al., 2013). Furthermore, under the combined action of the ocean and rivers, alluvial plains and coast plains developed widely along the southern coast of Laizhou Bay. The terrestrial vegetation types in these areas change from a bare intertidal zone to seepweed swamp to reed swamp to cultivated land from the shoreline landward (Xu et al., 2010). Since the transportation distance for herb pollen is normally very short, the pollen percentage and concentration in samples close to the mouth of the YR and the southwestern part of Laizhou Bay are much higher than in other samples (Fig. 6c and d), indicating that herb pollen of Laizhou Bay is mainly derived from the plant communities of the coastal wetlands.
It is worth noting that the composition of fossil pollen in sediment depends not only on the composition of the vegetation from which the pollen originates but also on pollen dispersion, deposition and preservation. Pinus pollen is a bisaccate grain and has relatively high aerodynamic and hydrodynamic characteristics, meaning it can be transported efficiently by wind and water (Sander, 2001; Montade et al., 2011). Previous studies revealed that smaller amount of Pinus pollen are found nearshore, and larger amounts are found in the deep ocean (Mudie, 1982; Mudie and McCarthy, 1994; Zheng et al., 2011; Dai et al., 2014; Luo et al., 2014; Dai and Weng, 2015). In Laizhou Bay, although the distribution pattern of Pinus pollen is not entirely consistent with the previous results (the pollen content of Pinus increased with increasing distance from land), the distribution patterns of Pinus pollen concentration and percentage are more similar to broadleaved tree pollen (Quercus, Betula and Carpinus; Yang et al., 2016). However, in the eastern part of Laizhou Bay, Pinus pollen increased in a northeasterly direction away from the coast (Fig. 6a). Hence, concerning Pinus pollen data, caution is required because climate variation alone may not be responsible for the change of Pinus pollen in marine sediment. Aerodynamic and hydrodynamic conditions may also influence the amount of Pinus pollen in sediments.
In addition, because different pollen types are not equally well preserved (Havinga, 1967; Cheddadi and Rossignol-Strick, 1995), bias originating from poor preservation should be eliminated before using the net content of pollen grains to reconstruct paleovegetation. In this study, the pollen concentration ranged from 62 to 6050 grains g−1. Relatively low pollen concentrations were found in the two sections (160–135 and 34–19 cm); this was largely correlated to high sand contents as revealed by the lithology. The high portion of sand content is consistent with a low pollen concentration and a high percentage of Pinus pollen, especially in the lower section (150–135 cm). As the Pinus pollen is more resistant to degradation, the variations of total pollen concentration, as well as a higher percentage of Pinus pollen in this section, seem to be related to pollen preservation. But, as shown in Fig. 4, the highest percentage of Pinus pollen was recorded at a depth of 150–128 cm, with a low value at 148 cm, which is not completely in accordance with the high sand content section in the same core (160–135 cm). Similarly, for the upper section, a high sand content was recorded at a depth of 34–19 cm. However, the percentage of Pinus pollen is low in this section, except for a relatively high value at a depth of 23 cm. We thus suggest degradation is not a key point influencing the concentration of pollen and spore in the study area.
Previous research suggests that the sedimentation mechanisms of pollen and spores in marine water is similar to that of sediment with clay and fine silt grain size (Heusser, 1988). A recent investigation into the surface sediment from the BS shows high pollen concentration in sediments with a high proportion of fine particles such as clay and silty clay, while showing low pollen concentration in sediments with a high proportion of coarser sand particles (Yang et al., 2019). Yang et al. (2019) attributed the low pollen concentration in areas with a high sand content of the BS to the strong hydrodynamic suspension and screening for sediments and pollen. We conclude that the low pollen concentrations in the two sections (160–135 and 34–19 cm), correlated with high sand content, could be attributed to the hydrodynamic conditions rather than degradation.
5.2 Sedimentary records indicative of river channel shifts
The most important geological events on the northern Chinese coast after 7000 BP were the shift of YR channel and the formation of the YRD. The YR was easily plugged and breached, and therefore its lower reaches migrated because of its huge sediment load. The shifting of the lower reaches of the YR led to the formation of a new delta superlobe (He et al., 2019). Based on a study of cheniers and historical documents, nine YRD superlobes have been proposed by Xue and Cheng (1989) and Xue (1993) on the western shore of the BS. Among these, superlobe 1 (7000–5000 BP, He et al., 2019), superlobe 7 (11–1048 CE, Xue, 1993), and superlobe 10 (since 1855 CE) are positioned near the core area in this study. Information about some of these superlobe formations is recorded in core CJ06-435.
As shown in Fig. 8, herb percentage suddenly changes at 160 and 34 cm. Herb pollen in the sediment of Laizhou Bay is mainly derived from the coastal wetlands of the western BS. At 6000–7000 BP and in 1855 CE, the YR emptied into the BS after a natural course shift, forming two huge delta superlobes in the western part of the BS (Saito et al., 2000). Wetland plants are the most important vegetation type in the YRD (Jiang et al., 2013). The development of YRD wetland would change the amounts of herb pollen that was transported to the study site. In addition, the formation of the YRD caused the coastline to move closer to the position of the CJ06-435 core. Since most herb plants are small in size, their pollen grains are unable to disperse broadly (Chen et al., 2019b). The migration of the coastline would change the availability of herb pollen to the study site, and hence lead to variations in the amount of pollen. Therefore, combined with the age data, we conclude that the abrupt change of herb pollen percentage at 160 and 34 cm in core CJ06-435 is related to the formation of the YRD superlobe 1 and superlobe 10.
Compared with the pollen percentage, the pollen concentration can be interpreted in different ways. Namely, the percentage of different types of pollen is relative, whereas the pollen concentration is absolute, and it can directly reflect the amounts of pollen that were transported to the study area (Luo et al., 2013). It is crucial that a correct interpretation of pollen data is based on a percentage diagram as well as concentration. In core CJ06-435, the concentrations of herbs – especially Chenopodiaceae and Artemisia (Fig. 7f) – were higher at depths of 160–94 cm (6570–5000 BP) and 34–0 cm (after 1855 CE), except for the two sections of 160–135 cm and 34–19 cm. As mentioned in section 5.1, the extremely low pollen concentration in the sections at 160–135 and 34–19 cm was closely linked with the coarser sandy sediment. Combined with the results of pollen percentage and sediment grain size, we presumed that the higher herb pollen concentration in the periods of 6570–5000 BP (160–94 cm) and after 1855 CE (34–0 cm) reflects changes in hydrographic conditions. Pollen data of surface sediments revealed that higher herb pollen concentrations occur in the YR, and the value of these concentrations showed a decreasing trend starting from the river mouth toward the ocean. The distribution pattern of surface pollen revealed that the YR is a major carrier for most herb taxa in the sediment of Laizhou Bay (Yang et al., 2016). At the site of core CJ06-435, which is close to the mouth of the YR in Laizhou Bay, higher herb pollen concentrations in the Holocene samples may indicate increased fluvial discharge.

Figure 7(a–f) Vertical profiles of grain size parameters and halophytic and xerophytic herb (Chenopodiaceae and Artemisia) pollen percentages and concentrations in core CJ06-435 (Mz stands for mean grain size). (g) The location of Yellow River superlobe 1 (Lijin superlobe) and superlobe 10 (modern superlobe) (modified following Xue, 1993).
Sediment grain size provides direct information about changes of the sediment source and the sedimentary environment (Friedman and Sanders, 1978; Wu et al., 2015). The characteristics of grain size can be expressed by the grain size distribution curve, and usually the mean or median diameter is used (Xu, 1999). In this study, the value of mean grain size (Mz) showed that two major grain size boundaries occur at depths of 34 and 19 cm, separating a middle sedimentary unit (34–19 cm) that contains coarser sediment from the lower and upper sedimentary units that contain finer sediment (Fig. 7d). The sand content of the upper, middle, and lower layers was 11.2 %, 33.6 %, and 9 %, respectively (Fig. 7a); the silt content of these layers was 69 %, 58.6 %, and 76.1 %, respectively (Fig. 7b); and the clay content of these layers was 19.8 %, 7.8 %, and 14.8 %, respectively (Fig. 7c). On the basis of 137Cs chronology (Fig. 3), we speculate that these significant changes of grain size parameters at depths of 34 and 19 cm might represent a record of the channel shifts of the YR in 1855 and 1976 CE, respectively.
The sediment of Laizhou Bay mainly comes from the YR and other small rivers located in the southern part of Laizhou Bay (Zhang et al., 2017; Gao et al., 2018). Prior to 1855 CE, when the YR entered the Yellow Sea, the sediment contribution to the BS from other small rivers was relatively large. The fine fraction suspension sediment that was derived from other small rivers favors the hypothesis of fine sediment accumulation in core CJ06-435 during this period.
When the YR reentered the BS after 1855 CE, the dispersal of YR material contributed substantially to the sedimentation of the BS. It was reported that more than 80 % of the YR sediment discharges into the BS during the summer period (Bi et al., 2011). Owing to the barrier effect of the tidal shear front and the weak river flow, most of the river-delivered sediment is deposited on the offshore delta within 15 km of the river mouth (Wang et al., 2007; Bi et al., 2010). Only a small part of the fine clay fraction is transported by the coastal currents over long distances and deposited across or along the shore in summer (Wu et al., 2015). During the winter (October to March) season, the much stronger winter monsoon generates large waves, resulting in intensive sediment resuspension in the coastal region owing to the enhanced bottom shear stress (Yang et al., 2011; Bi et al., 2011). The resuspended sediment is transported southeastward along the coast of Laizhou Bay by the monsoon-enhanced coastal currents passing through the location of the sediment core CJ06-435. Therefore, after 1855 CE, the sediment of core CJ06-435 mainly included the fine fraction of the suspended sediment dispersed from the YR mouth, the resuspended sediment from the coastal area off the YR delta in the winter, and the locally resuspended sediment.
The accumulation of YR-suspended sediment during the summer season in Laizhou Bay was closely associated with the sediment dispersion pattern off the active delta lobe (Xing et al., 2016). The estuary of the YR, during most of the period 1855–1976 CE, was north of the modern YRD, and suspended sediment from the YR was transported northeastward to Bohai Bay and the central Bohai basin. The contribution of YR-suspended sediment to the sedimentation of core CJ06-435 was smaller, and the resuspended sediment became a dominant material source. During the winter, the large waves generated by the strong winds may result in intensive resuspension of the seabed sediment and lead to part of the coarse sediment in the YR mouth and Laizhou Bay being transported to the study area, which induces an evident increase in mean grain size and a decrease in the amount of fine sediment. After 1976 CE, the lower channel of the YR shifted to the Qingshuigou course in Laizhou Bay; the suspended sediments derived from the YR estuary were primarily driven southward and southeastward along the coast, leading an increasing transportation of most of the YR-suspended sediment into Laizhou Bay (Qiao et al., 2010). As a result, the dispersal of river-laden sediment contributed substantially to the sedimentation of core CJ06-435, with a fine sediment layer being formed in the upper part of the core.
The results inferred from our grain size data on the migrations of the YR lower channel since 1855 CE and their effects on the sedimentary environments of the adjacent BS are in accordance with the results of other studies from Laizhou Bay (Wu et al., 2015) and central BS (Hu et al., 2011). Based on the records of sediment core collected from Laizhou Bay, Wu et al. (2015) found that when the YR mouth approached the core location, the sediment became finer; otherwise, the active resuspension resulted in the accumulation of coarser sediment owing to strong hydrodynamics. The grain size results from the central mud areas of the BS also point to the conclusion that the sediment supply from the YR to the central BS was cut off because of the shift of the YR terminal course from the Diaokou source in outer Bohai Bay to the Qingshuigou course in Laizhou Bay in 1976, resulting in a significant increase in the proportion of sand in sediment of the central BS (Hu et al., 2011).
It is worth noting that the variation of grain size characteristics in the period of 6570–5000 BP is very similar to that after 1855 CE. As shown in Fig. 7d, the shift of Mz in the period of 6570–5000 BP also began with a significantly increased of Mz at 6570 BP (160 cm) when the YR flowed into the BS in northern Shandong province. This similar variation of grain size in the period of 6570–5000 BP (superlobe 1) and after 1855 CE (superlobe 10) implies that a similar YR channel shifting occurred during these two periods. However, further research is needed to reveal how the deltaic and neritic sea sedimentary environment was impacted by the river system.
5.3 Coastal salt marsh response to hydrological change
Two high-amplitude salt marsh vegetation shifts are displayed in the herb pollen record during 6570–5000 BP (superlobe 1) and after 1855 CE (superlobe 10), indicating rapid oscillations of environmental conditions in the coastal area of BS. Within single intervals of the YR superlobe, a recurrent and directional alternation of herb pollen taxa is observed in the following order: the shift of herb pollen data began with an abrupt decrease of Cyperaceae pollen, followed by a steep increase of Chenopodiaceae and Artemisia pollen (Fig. 8b).
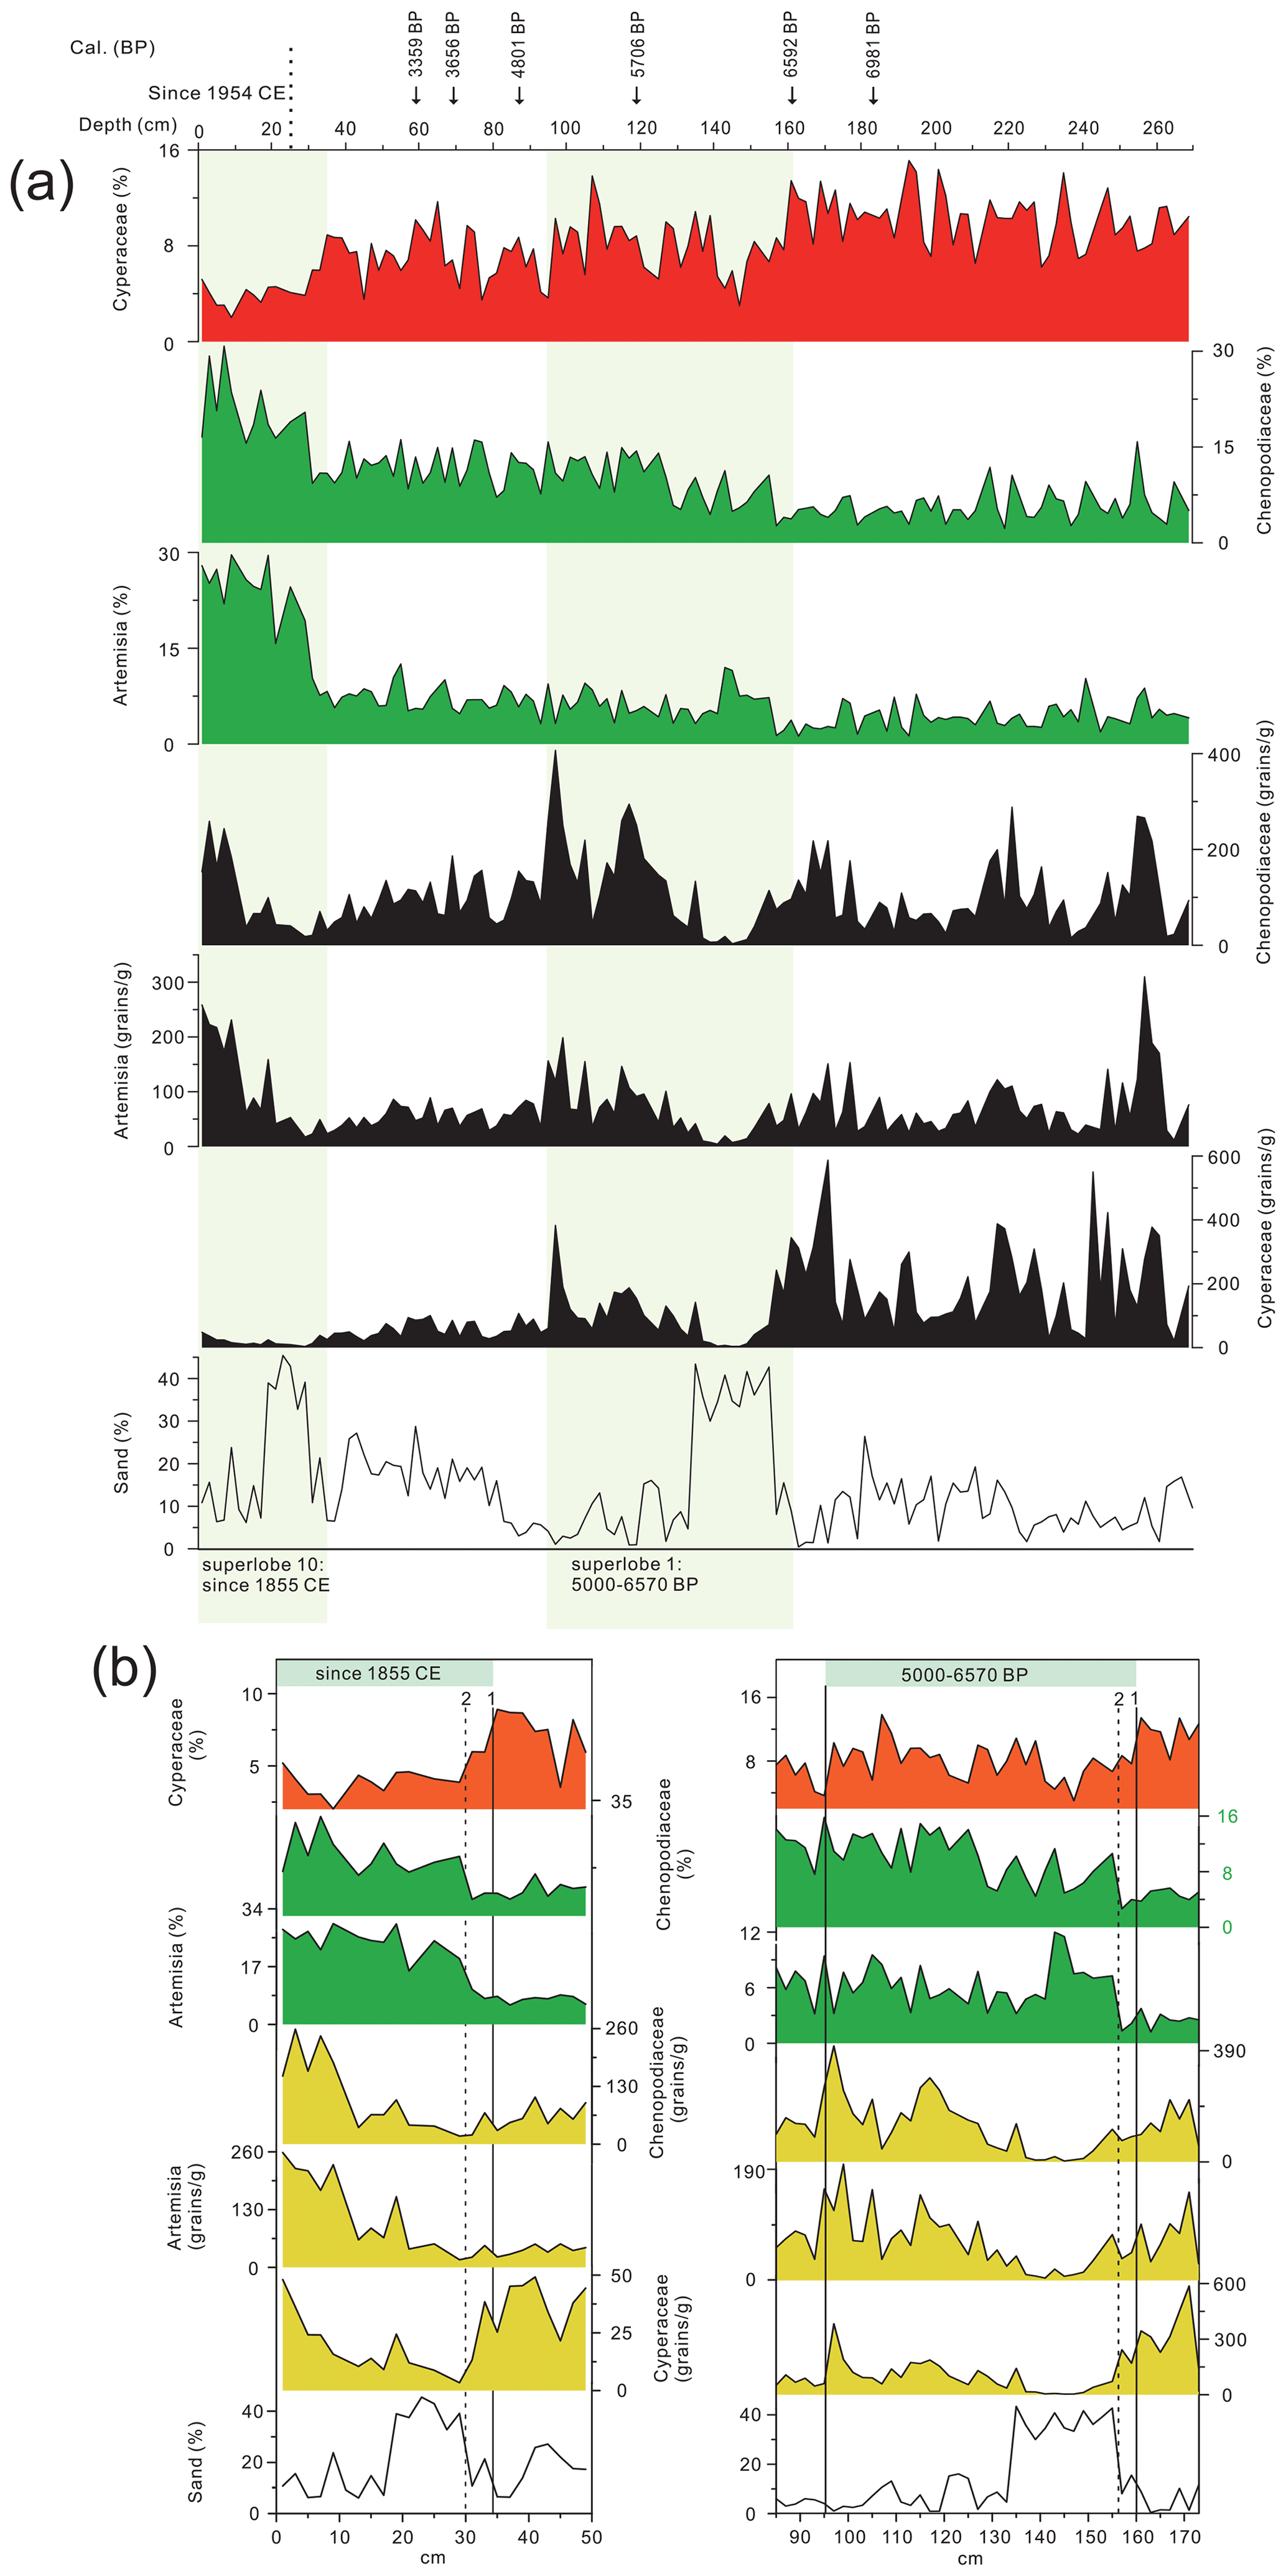
Figure 8(a) Correlating proxy to paleo-superlobe variation of the YR, from top to bottom: percentage of Cyperaceae, Chenopodiaceae, and Artemisia pollen; concentration of Chenopodiaceae, Artemisia, and Cyperaceae pollen; and sand percentage. (b) Detailed pollen and grain size profiles representing salt marsh species (Cyperaceae, Chenopodiaceae, Artemisia) relative abundances and hydrodynamic change during the formation of Yellow River superlobe 1 and 10. Pollen percentage of Cyperaceae, Chenopodiaceae and Artemisia from core CJ06-435 indicating the directional alternation of salt marshes along the Bohai Sea. The circled numeral “1” represents unchannelized river flow that characterized the onset of Yellow River channel shift, caused a large amount of river-derived sediment accumulation in the floodplain and destroyed the sedges in the coastal depression. The circled numeral “2” shows where there was a coinciding formation of a new channel, where lateral migration of the lower channel stopped and a new intertidal mudflat was formed. Pioneer species (Chenopodiaceae, Artemisia) first colonized bare zones of lower and middle marsh areas.
Cyperaceae, Chenopodiaceae, and Artemisia are the three plant families and genera that contain the important representatives of coastal salt marsh plants (Lu et al., 2006). In the salt marsh of the modern YRD, species composition of Cyperaceae, Chenopodiaceae, and Artemisia varies with salinity and soil moisture. Plant families such as Cyperaceae are mainly composed of hydrophytes and phreatophyte Eleocharis valleculosa, Cyperus rotundus, Scirpus planiculmis, S. triqueter, S. yagara, S. juncoides, and Juncellus serotinus (Pan and Xu, 2011). The presence of Cyperaceae necessarily indicates lower saline conditions, since hydrophytes and phreatophyte sedges typically colonize in the middle and upper part of the supralittoral zone, both sides along the riverbank, the coast of the lake, and the interfluvial lowlands of the paleo-river. These areas are far from the coastline, and the main type of soil is salinized soil with lower salinity (Zhang et al., 2009a; Xu, 2011). Chenopodiaceae are mainly composed of halophyte Suaeda glauca, S. salsa and Salicornia europaea. Artemisia mainly consist of halophyte and xerophyte Artemisia carvifolia, A. capillaris, and A. annua (Xing et al., 2003; Zhang et al., 2009b). In the modern YRD, halophytes are distributed in the intertidal zone mudflat and the outside margin part of the supralittoral zone. These areas are near the coastline, characterized by a high incidence of wave breaks and prolonged inundation regimes, where the main type of soil is saline (Zhang et al., 2009b). Therefore, in salt marsh plant communities, the variation in the amount of Cyperaceae, Chenopodiaceae, and Artemisia is often thought to reflect environmental gradients controlled by the distance from the coast, local topography, terrigenous material, and freshwater input (González and Dupont, 2009; Zhang et al., 2009a). The pollen record from the BS could provide evidence of coastal salt marsh development over decades to centuries of the response to environmental alternations during the period of hydrological change.
In the studied sequence, the YR flowed into the BS toward northern Shandong Province after a course shift. The lower river was initially braided upon relocation, as characterized by unchannelized river flow. At this initial stage, the river-derived sediment was largely accumulated in the floodplain and/or among the antecedent rivers owing to the lack of channelization (Wu et al., 2017), filling the coast of the lake, the interfluvial lowlands of the paleo-river, and the supralittoral zone, etc. This caused the destruction of hydrophytes and phreatophyte sedges in these areas. This process is indicated in our records by the significant decrease in the amount of Cyperaceae pollen percentages for superlobe 1 and superlobe 10 (Fig. 8b).
Eventually, natural channel adjustments resulted in the coalescence of multiple channels into a single channel (Wu et al., 2017). A large amount of river-derived sediment was deposited at the mouth of the YR, causing the progradation of the YRD. Because of the strong influence of the tides, the intertidal zone in the YRD was originally bare beach. Along with the seaward expansion of the newly formed beach, the influence of tides was weakening on the original bare beach wetland and the salinity of the original beach wetland began to decrease (Zhang et al., 2007). Pioneer species of salt marshes, e.g., Suaeda glauca, S. salsa and Salicornia europaea (Chenopodiaceae), first colonized this original bare beach (Zhang et al., 2009a). The significant increase of Chenopodiaceae in our pollen record (Fig. 8b) is, therefore, interpreted as the development of the S. glauca population.
5.4 Paleovegetation reconstruction and its climate significance
Based on the age model, the record between 3000 BP and 1855 CE of core CJ06-435 is somewhat confused because the CSR was extremely low (about 0.005 cm yr−1) from 3000 BP to 1855 CE. As reported in recent studies, the CSR of cores from the tidal flat and neritic sea of the south BS were in the range 0.02–0.13 cm yr−1 before 2000 BP (in cores H9601, H9602, ZK228 and ZK1, Fig. 1; He et al., 2019), 0.04–0.06 cm yr−1 between 2000 BP to 1855 CE (in cores ZK228, HB-1 and GYDY, Fig. 1; He et al., 2019), and 0.35–1.38 cm yr−1 since 1855 CE (Wu et al., 2015; Qiao et al., 2017; Xu et al., 2018). Although core CJ06-435 is offshore compared to the other cores (e.g., H9601, H9602, ZK228, HB-1, ZK1 and GYDY), and it should have a lower CSR compared to those cores. However, the difference of CSR between CJ06-435 and those cores reaches up to 10-fold. The reasonable explanation is that there might be some deposition hiatus between 3000 BP and 1855 CE of core CJ06-435. The calculated CSR in the upper layer (since 1855 CE, as calculated to 0.17–0.48 cm yr−1) and the lower layer (3000–8500 BP, as calculated to 0.016–0.057 cm yr−1) of core CJ06-435 are comparable to the nearby records by He et al. (2019) and Xu et al. (2018). Therefore, we only focused on the vegetation successions and climate change between 8500 and 3000 BP, and only gave a cautious discussion for the chronology uncertain interval in this study.
During the period from 8500 to 6500 BP (palynological zone 1, 271–156 cm), the palynofloral assemblages are mainly composed of the pollen of broadleaved trees, such as Quercus, Betula, Alnus and Ulmaceae, combined with the pollen of hydrophytes and phreatophyte Cyperaceae and Typha; of these, the pollen of Quercus and Typha are predominant (Figs. 4 and 5). In contrast, the pollen of halophytic and xerophytic herbs and conifer trees is scarce. The pollen assemblages encountered herein indicated that the vegetation of the BS land area consisted mainly of oak-rich temperate broadleaf deciduous forest, with some conifer trees on the uplands, and freshwater lakes and marshes dominating the coastal area, under the influence of a markedly warmer and wetter climate than the present. The highest values of AP pollen concentration (Fig. 5), reflecting a dense vegetation cover, also represent warm conditions during this period. The pollen data are comparable to that found from previous palynological studies carried out in northern China (e.g., Yi et al., 2003; Ren, 2007; Chen and Wang, 2012; Li et al., 2019) and northeastern China (e.g., Ren and Beug, 2002; Li et al., 2011; Stebich et al., 2015), from which a warm, wet climate corresponding to the Holocene Optimum was inferred. Under the influence of the Holocene Optimum, the forest cover evidently increased in northern and northeastern China (Ren, 2007). In the YR drainage area and Shandong Peninsula, the broadleaved deciduous forest thrived, accompanied by the presence of monsoonal evergreen forest and the abrupt decrease in the herbaceous taxa and conifers (Yi et al., 2003; Chen and Wang, 2012; Li et al., 2019).
During the period from 6500–5900 BP (palynological zone 2a, 156–128 cm), a climatic cooling period is identified by an increase of conifers (Pinus), combined with an abrupt reduction of broadleaved trees (Quercus, Betula, Alnus, Pterocarya, Ulmaceae, and Moraceae). Halophytic and xerophytic herbs taxa such as Compositae, Artemisia, and Chenopodiaceae also increase, while Cyperaceae and aquatic herbs Typha obviously decreased. The climate shifted from warm and wet to cool and dry, which may have caused the reduction of broadleaved deciduous forests, the expansion of conifer forests, and the gradual disappearance of freshwater lakes and marshes that had spread over the coastal area of the BS. This result is in good agreement with previous studies. A pollen record from the Shandong Peninsula revealed that Quercus content decreased, and herbs increased quickly following the Holocene Optimum, indicating a potential climate deterioration (Chen and Wang, 2012). A pollen record from Lake Bayanchagan in southern Inner Mongolia also showed that deciduous trees declined, conifers reached their maximum values and steppe vegetation remained relatively high during 6500–5100 BP, indicating cold and dry climate conditions (Jiang et al., 2006). It is worth noting that a vast delta complex began to build up in the western part of the BS after 6570 BP, which resulted in the increase of land area and development of the YR delta wetland. It can be concluded that the expansion of salt marsh during this period may be partly related to the formation of the YR delta complex.
During the period from 5900–3500 BP (palynological zone 2b, 128–63 cm), climate cooling and drying is observed by a reduction of broadleaved trees such as Quercus, Pterocarya, Ulmaceae, and Moraceae and a rising frequency of halophytic and xerophytic herbs (Artemisia and Chenopodiaceae) (Figs. 4 and 5). The cool, dry conditions probably caused the contraction of broadleaved forest and the expansion of halophytic and xerophytic herbs, which is similar to the findings of a study by Jiang et al. (2006). Based on the quantitative climatic reconstruction from pollen and algal data for Lake Bayanchagan, Jiang et al. (2006) found that broadleaved trees, such as Betula, Corylus, Ostryopsis and Ulmus further declined, whereas the amount of steppe vegetation increased. The reconstruction of mean annual temperature and total annual precipitation dropped to their minimum values during 5100–2600 BP.
Between 3500 and 3000 BP (63–56 cm), a warm climatic phase occurred, as suggested by an increase in the amount of pollen from broadleaved trees (Quercus, Betula, Alnus, Pterocarya and Ulmaceae), with low frequencies of conifer pollen (Pinus). Moreover, halophytic and xerophytic herb pollen, including Compositae, Artemisia and Chenopodiaceae, were still present at a high frequency (Figs. 4 and 5). Accordingly, the assemblages reveal that a warm, dry climate probably developed during this period.
From 3000 BP to 1855 CE (56–30 cm), as mentioned in the first paragraph of this section, the CSR was extremely low during the period from 3000 BP to 1855 CE (56–30 cm). We suggest that there might be some deposition hiatus and only tentatively discuss this section of the pollen record. This section begins with a relatively high percentage of broadleaved trees (Quercus, Betula, Alnus, Pterocarya and Ulmaceae) and low frequencies of conifer pollen (Pinus) (56–41 cm); this is consistent with the previous stage (3500–3000 BP, 63–56 cm). Afterward, there is a dramatic decrease in the occurrence of Quercus, quickly followed by a sudden increase in Pinus (41–30 cm, Figs. 4 and 5). These pollen data suggest that the climate was warm during the latter part of this period (56–41 cm, 3000 BP–1000 BP(?)), following the climate condition of previous stage (63–56 cm, 3500–3000 BP). In the earlier part of this period (41–30 cm, 1000 BP(?)–1855 CE), the sudden increase in Pinus and major reductions of Quercus are likely signs of human impacts on the natural vegetation, including deforestation and cultivation. Park and Kim (2015) interpreted the decrease in the percentage of Quercus and increase of Pinus in the late Holocene as marking the development of secondary vegetation under anthropogenic influence. Based on two boreholes palynological from the YRD, Yi et al. (2003) found a sudden reduction of Quercus, followed by a marked increase of Pinus after 1300 BP. Their research considered that this typical lag between the two taxa may indicate that after the clearance of the local broadleaved deciduous forests, the vegetation was replaced by a secondary pine forest.
After 1855 CE (palynological zone 3, 30–0 cm), a significant decline in broadleaved tree (Quercus) and conifer (Pinus) pollen, as well as an increase in the frequency of herb (Poaceae, Compositae, Artemisia and Chenopodiaceae) pollen may reflect the further strengthening of human disturbance on the vegetation and the expansion of intensive agricultural cultivation into forests of the BS coastal area. Moreover, after 1855 CE, the present YR began returning to the BS and forming a vast area of floodplain and estuarine wetland on the southwestern coast of the BS (Saito et al., 2000; Jiang et al., 2013). The variation of herb pollen may be partly related to the development of the modern YRD wetland.
5.5 Holocene temperature variations in north China and possible driving mechanisms
Many previous studies of northern and northeastern China have used the Quercus pollen percentage to infer regional temperature variation (Ren and Zhang, 1998; Yi et al., 2003; Li et al., 2004; Xu et al., 2014; Zhang et al., 2019). The Quercus pollen percentage from CJ06-435 core is consistent with previous studies, which also provide a regional air temperature reference. As shown in Fig. 9d, the percentage of Quercus pollen in CJ06-435 core indicates a warm Early Holocene from 8500 to 6500 BP, a cool Middle Holocene from 6500 to 3500 BP, and then a relatively warm Late Holocene. These climate changes were also apparent in the change of Quercus ∕ Pinus (Q∕P) ratio. The average Q∕P ratio was approximately 0.57 between 8500 and 6500 BP, changed to 0.33 between 6500 and 3500 BP, and then gradually increased (Fig. 9c).
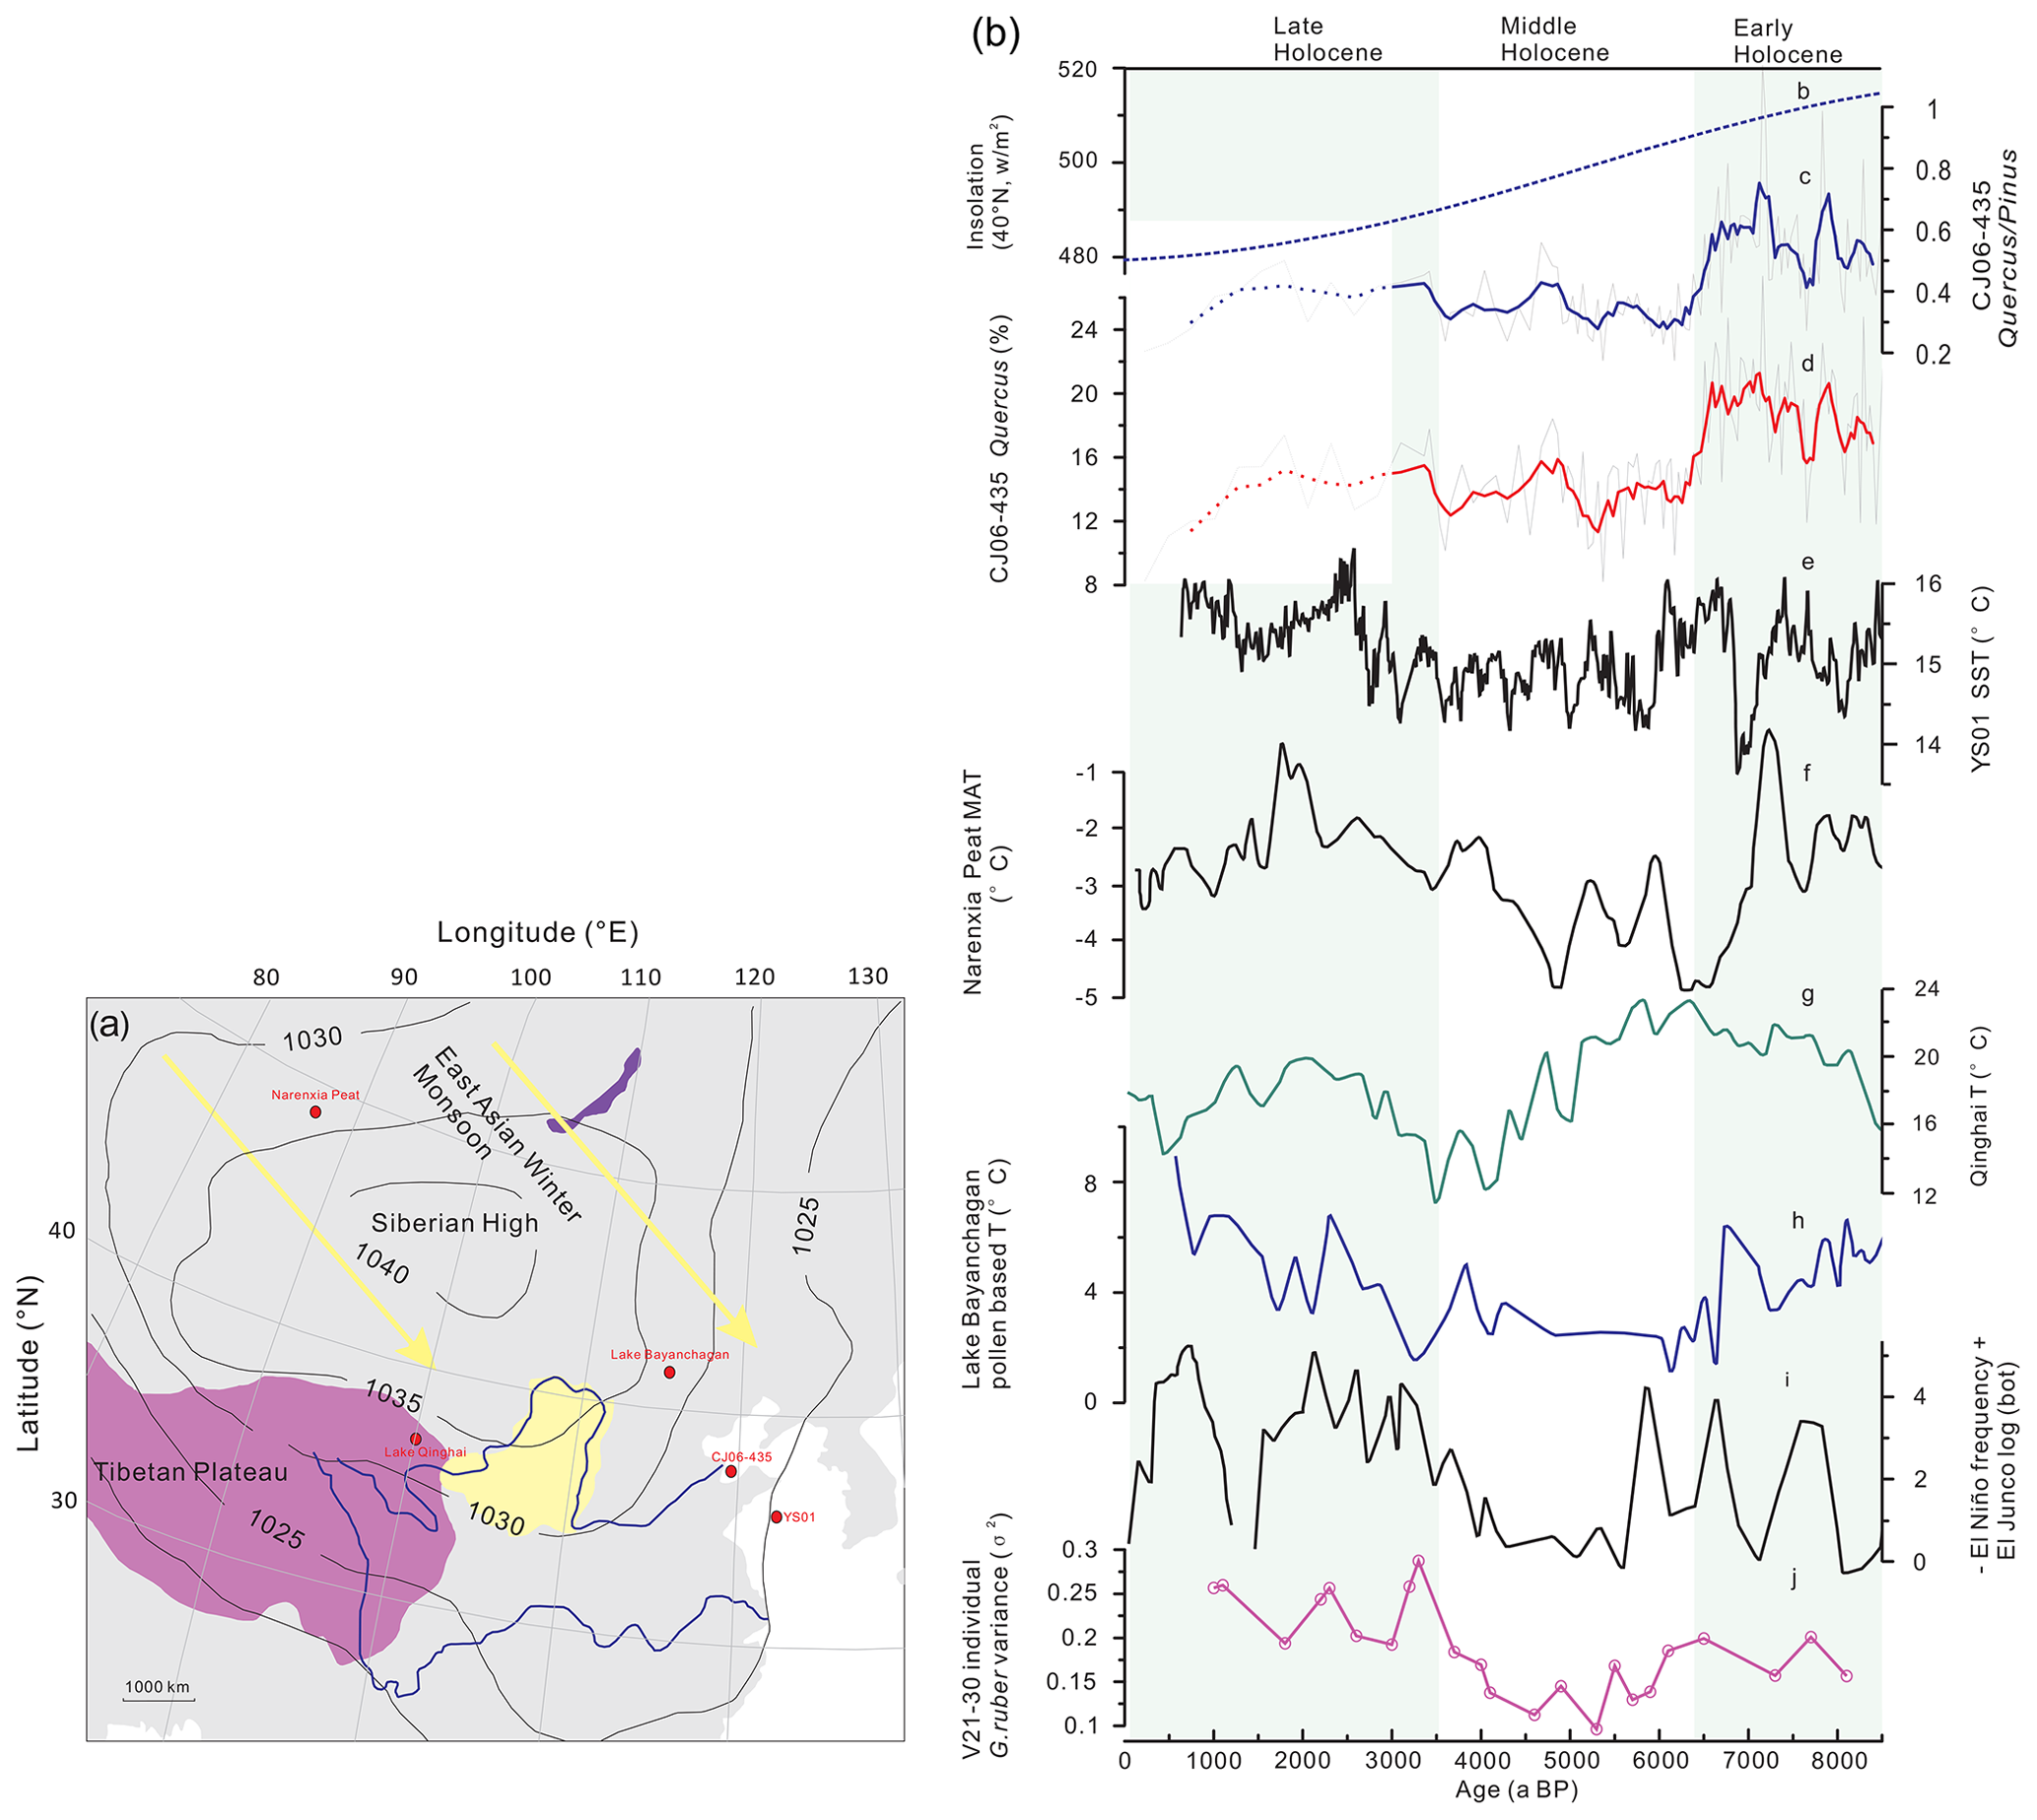
Figure 9Comparison of relevant Holocene temperature records with solar irradiance and El Niño–Southern Oscillation (ENSO) proxy records derived from the equatorial Pacific. (a) Locations of the sites where the Holocene temperature records are derived. The schematic large-scale diagram is modified from Hao et al. (2017). In the diagram, the purple area is the Tibetan Plateau, the yellow area is the Chinese Loess Plateau, and red circle refers to the corresponding study sites. (b) Summer (mean of June) insolation irradiance for the Northern Hemisphere (40∘ N). (c, d) Quercus ∕ Pinus (Q∕P) rate and Quercus pollen percentage records from core CJ06-435; the bold blue and bold red lines are the five-point running averages for Quercus ∕ Pinus and Quercus, respectively. As introduced in Sect. 5.4, there might be some deposition hiatus between 3000 BP and 1855 CE. Thus, Q∕P rate and Quercus pollen percentage records between 3000 BP and 1855 CE are for reference only. (e) sea surface temperature (SST) record from YS01 core in the south Yellow Sea (Jia et al., 2019). (f) Pollen-based mean annual temperature (MAT) record from Narenxia peat in the southern Altai Mountains (Feng et al., 2017). (g) inferred temperature record at Lake Qinghai (Hou et al., 2016). (h) Pollen-based mean annual temperature record from Lake Bayanchagan in Inner Mongolia, northern China (Jiang et al., 2006). (i) Botryococcene concentrations in the El Junco sediment, a proxy for frequency of El Niño events (Zhang et al., 2014). (j) Variance of δ18O values of individual planktonic foraminifera (G. ruber) in sediment core V21–30 from the Galápagos region, a proxy for ENSO variance (Koutavas and Joanides, 2012).
The pollen-based record of temperature evolution from core CJ06-435 is broadly in phase with published high-resolution sea surface temperature record from core YS01 (Fig. 9e) of the Yellow Sea, suggesting at least a local pattern of temperature variations during the Holocene. To investigate whether the temperature pattern was a local characteristic of the BS and Yellow Sea area or whether it was rather a regional pattern of East Asia as a whole, the pollen records of core CJ06-435 were compared with recently-published and relatively well-dated sequences from northern China, northwestern China, and the Tibetan Plateau (see Fig. 9a for site locations), including the sedimentary pollen-based temperature record from the Narenxia Peat within the Kanas Lake, northwestern China (Fig. 9f; Feng et al., 2017); the inferred temperature record at Lake Qinghai (Fig. 9g; Hou et al., 2016); and the lacustrine sedimentary pollen-based quantitative temperature record (the mean annual temperature) from Lake Bayanchagan in Inner Mongolia in northern China (Fig. 9h; Jiang et al., 2006). All three records indicate that the temperature was high between 8500 and 6000 BP, low between 6000 and 4000–3000 BP, and averagely high after 4000–3000 BP (Fig. 9f–h), this is consistent with the basic change pattern of our pollen-based temperature variation (Fig. 9c and d). The comparison of the five records demonstrates that the CJ06-435 core Quercus pollen percentage record is, at a minimum, of regional significance.
Insolation has been widely accepted as an important factor in Holocene climate variation. The covariation of Northern Hemisphere extratropical (30∘ to 90∘ N) temperature and local summer insolation on an orbital scale, and the long-term decrease of summer insolation make the especially pronounced cooling of the Northern Hemisphere extra-tropics during the Holocene (Marcott et al., 2013) appear reasonable. However, the general pattern of temperature variation revealed by our study is not entirely consistent with local mean annual insolation forcing (Fig. 9b). Our results indicated a cold Middle Holocene from 6500 to 3500 BP and a relatively warm Late Holocene. This temperature characterization of a cool Middle Holocene and a relatively warm Late Holocene is also seen in many proxy records in East Asia (Thompson et al., 1997; Jiang et al., 2006; Hou et al., 2016; Wu et al., 2016; Feng et al., 2017; Jia et al., 2019). The cooler Middle Holocene seen in East Asia could not solely be explained by the gradually decreasing summer insolation during the Holocene but might be related to other forcings.
We compared the pollen-based temperature record of core CJ06-435 (Fig. 9c and d) with the frequency of El Niño events reconstructed from the Botryococcene concentration in the El Junco Lake sediment (Fig. 9i; Zhang et al., 2014) and the ENSO variability reconstructed from δ18O values of individual planktonic foraminifera retrieved from deep-sea sediments (Fig. 9j; Koutavas and Joanides, 2012). As shown in Fig. 9, lower temperature periods in the Middle Holocene tended to occur during a period of low El Niño activity, and relatively high temperature periods in the Late Holocene tended to occur during a period of high El Niño activity, which indicates that there may be some link between the temperature of BS and Yellow Sea area and the ENSO system. Modern research suggests that ENSO can influence the evolution of temperature behavior over interannual to multi-decadal time ranges (Hoerling et al., 2008; Triacca et al., 2014). In East Asia, many studies have indicated that the East Asian winter monsoon and the ENSO are tightly coupled (Zhou et al., 2007; Cheung et al., 2012; An et al., 2017). Generally, the strength of winter monsoons and East Asian troughs weakens in an El Niño year, and the weakening could cause the observed winter half-year warming (Xu et al., 2005). On centennial and millennial timescales, using pollen data from Lake Moon in the central part of the Great Khingan Mountain Range, Wu et al. (2019) recently connected increased El Niño frequency with the decrease of winter monsoon activity in the East Asia, and the warming winter temperature in the Great Khingan Mountain Range since the Middle Holocene. Feng et al. (2017) founded that warm-phase ENSO was teleconnected with weakening of the Siberian High and that the weakening was a cause of the observed winter half-year warming in southern Siberia. Likewise, the results of this study, more or less indicating synchronicity between the climate change in northern China and ENSO activity, provide a possible linkage between the climate of northern China and oceanic forcing during the Middle to Late Holocene.
In addition, radiative forcing by greenhouse gases (GHGs) rose 0.5 W m−2 during the Middle to Late Holocene (Marcott et al., 2013), which would be expected to yield 1 ∘C warming at Kinderlinskaya Cave in the southern Ural Mountains from 7000 BP to the pre-industrial period (Baker et al., 2017). Recently, both winter insolation and GHG forcing have been proposed as the major driving factors for winter warming during the Holocene in the Siberian Arctic (Meyer et al., 2015) and the southern Ural Mountains (Baker et al., 2017). Similarly, summer warming in Central Asia during the Middle to Late Holocene, recorded by the alpine peat α-cellulose δ13C record from the Altai Mountains (Rao et al., 2019), has been proposed to be mainly driven by the enhanced GHG forcing and increasing human activities. Rao et al. (2020) suggested that GHG forcing was the dominant driver of the summer and winter warming trends since ∼5000 BP. The effects of GHG forcing are global. Hence, we suggest that enhanced GHG forcing may be an important driver for Middle to Late Holocene temperature variations of East Asia.
In summary, the temperature characterizations of a cool Middle Holocene and a relatively warm Late Holocene revealed by the East Asian records could be linked with the change of insolation, ENSO activity and GHG forcing. The cooler Middle Holocene may be related to a combination of the decreasing summer insolation, weak El Niño activity and relatively low GHG radiative forcing during this interval. Along with strengthened ENSO activity and enhanced GHG forcing in the late Holocene, there was increased temperature.
Through the palynological and grain size reconstruction of coastal area vegetation and environment in core CJ06-435, we were able to identify specific responses of plant communities to climatic (temperature, precipitation), hydrological and anthropogenic impacts. Our data elucidate the pattern and mechanisms driving coastal salt marsh succession at decade-to-century timescales. Two intervals of expanded salt marsh vegetation correspond to the formation of YR delta superlobes, indicating that soil development and salinity gradients are the main factors determining the vegetation dynamics of coastal wetland. Our pollen-based temperature index revealed a warm early Holocene (8500–6500 BP), a subsequent cool stage between 6500 and 3500 BP, and a slightly warming episode after 3500 BP. The reliability of the record, especially the cooler Middle Holocene, is further supported by several other temperature records from East Asia. We suggest that changes in insolation, ENSO activity and GHG forcing could have played an important role in the temperature evolution in East Asia.
The co-authors declare that all data included in this study are available upon request by contact with the corresponding author (email: jinxiachen@fio.org.cn).
CJ wrote the manuscript. SX and LY revised the manuscript. QS provided many constructive suggestions for the manuscript. YangS provided the pollen data of surface sediment. LJ use pollen data of core CJ06-435 as base for quantitative climate reconstruction. YanS, LH, LX and LC provided financial support for the collection of samples and obtained samples.
The authors declare that they have no conflict of interest.
We thank the crew of the R/V Kan407 for sampling. We also thank Nan Qingyun for improving this paper. This work was supported by the National Natural Science Foundation of China, the National Program on Global Change and Air–Sea Interaction, and the Taishan Scholar Program of Shandong (Xuefa Shi).
This research has been supported by the National Natural Science Foundation of China (grant nos. 41420104005, U1606401, and 41576054), the National Program on Global Change and Air–Sea Interaction (grant no. GASI-GEOGE-03), and the Taishan Scholar Program of Shandong.
This paper was edited by Julie Loisel and reviewed by two anonymous referees.
An, S. I., Kim, H. J., Park, W., and Schneider, B.: Impact of ENSO on East Asian winter monsoon during interglacial periods: Effect of orbital forcing, Clim. Dynam., 49, 3209–3219, 2017.
Bao, R., Alonso, A., Delgado, C., and Pagés, J.L.: Identification of the main driving mechanisms in the evolution of a small coastal wetland (Traba, Galicia, NW Spain) since its origin 5700 cal yr BP, Palaeogeogr. Palaeocl., Palaeoecol., 247, 296–312, 2007.
Baker, J. L., Lachniet, M. S., Chervyatsova, O., Asmerom, Y., and Polyak, V.: Holocene warming in western continental Eurasia driven by glacial retreat and greenhouse forcing, Nat. Geosci., 10, 430–435, https://doi.org/10.1038/NGEO2953, 2017.
Bi, N. S., Yang, Z. S., Wang, H. J., Hu, B. Q., and Ji, Y. J.: Sediment dispersion pattern off the present Huanghe (Yellow River) subdelta and its dynamic mechanism during normal river discharge period, Estuar. Coast. Shelf. S., 86, 352–362, 2010.
Bi, N. S., Yang, Z. S., Wang, H. J., Fan, D. J., Sun, X. X., and Lei, K.: Seasonal variation of suspended-sediment transport through the southern Bohai Strait, Estuar. Coast. Shelf. S., 93, 239–247, 2011.
Cheddadi, R. and Rossignol-Strick, M.: Improved preservation of organic matter and pollen in Eastern Mediterranean sapropels, Paleoceanography, 10, 301–309, 1995.
Chen, J. X., Nan, Q. Y., Li, T. G., Sun, R. T., Sun, H. J., and Lu, J.: Variations in the East Asian winter monsoon from 3500 to 1300?cal. yr BP in northern China and their possible societal impacts, J. Asian. Earth. Sci., 181, 103912, https://doi.org/10.1016/j.jseaes.2019.103912, 2019a.
Chen, J. X., Li, T. G., Nan, Q. Y., Shi, X. F., Liu, Y. G., Jiang, B., Zou, J.J., Selvaraj, K., Li, D. L., and Li, C. S.: Mid-late Holocene rainfall variation in Taiwan: A high-resolution multiproxy record unravels the dual influence of the Asian monsoon and ENSO, Palaeogeogr. Palaeocl., 516, 139–151, 2019b.
Chen, W. and Wang, W. M.: Middle-Late Holocene vegetation history and environment changes revealed by pollen analysis of a core at Qingdao of Shandong Province, East China, Quatern. Int., 254, 68–72, 2012.
Cheung, H. N., Zhou, W., Mok, H. Y., and Wu, M. C.: Relationship between Ural-Siberian blocking and the East Asian winter monsoon in relation to the Arctic Oscillation and the El Niño-Southern Oscillation, J. Climate., 25, 4242–4257, 2012.
Cohen, M. C. L., Lara, R. J., Smith, C. B., Angélica, R. S., Dias, B. S., and Pequeno, T.: Wetland dynamics of Marajó Island, northern Brazil, during the last 1000 years, Catena, 76, 70–77, 2008.
Cohen, M. C. L., Pessenda, L. C. R., Behling, H., Rossetti, D. d. F., França, M. C., Guimarães, J. T. F., Friaes, Y., and Smith, C. B.: Holocene palaeoenvironmental history of the Amazonian mangrove belt, Quaternary Sci. Rev., 55, 50–58, 2012.
Cui, B. S., Yang, Q. C., Yang, Z. F., and Zhang, K. J.: Evaluating the ecological performance of wetland restoration in the Yellow River Delta, China, Ecol. Eng., 35, 1090–1103, 2009.
Dai, L. and Weng, C. Y.: Marine palynological record for tropical climate variations since the late last glacial maximum in the northern South China Sea, Deep-Sea Res. Pt. II., 122, 153–162, 2015.
Dai, L., Weng, C. Y., Lu, J., and Mao, L. M.: Pollen quantitative distribution in marine and fluvial surface sediments from the northern South China Sea: new insights into pollen transportation and deposition mechanisms, Quatern. Int., 325, 136–149, 2014.
Engelhart, S. E., Horton, B. P., Roberts, D. H., Bryant, C. L., and Corbett, D. R.: Mangrove pollen of Indonesia and its suitability as a sea-level indicator, Mar. Geol., 242, 65–81, 2007.
Faegri, K. and Iversen, J.: Textbook of Pollen Analysis, John Wiley & Sons, Chichester, p. 328, 1989.
Feng, Z. D., Sun, A. Z., Abdusalih, N., Ran, M., Kurban, A., Lan, B., Zhang, D. L., and Yang, Y. P.: Vegetation changes and associated climatic changes in the southern Altai Mountains within China during the Holocene, Holocene, 27, 683–693, 2017.
França, M. C., Francisquini, M. I., Cohen, M. C. L., Pessenda, L. C. R., Rossetti, D. F., Guimarães, J. T. F., and Smith, C. B.: The last mangroves of Marajó Island–Eastern Amazon: Impact of climate and/or relative sea-level changes, Rev. Palaeobot. Palyno., 187, 50–65, 2012.
França, M. C., Alves, I. C. C., Castro, D. F., Cohen, M. C. L., Rossetti, D. F., Pessenda, L. C. R., Lorente, F. L., Fontes, N. A., Junior, A. Á. B., Giannini, P. C. F., and Francisquini, M. I.: A multi-proxy evidence for the transition from estuarine mangroves to deltaic freshwater marshes, Southeastern Brazil, due to climatic and sea-level changes during the late Holocene, Catena, 128, 155–166, 2015.
Friedman, G. M. and Sanders, J. E.: Principles of sedimentology, John Wiley and Sons, Inc, 1–792, 1978.
Gao, M. S., Guo, F., Hou, G. H., Qiu, J. D., Kong, X. H., Liu, S., Huang, X. Y., and Zhuang, H. H.: The evolution of sedimentary environment since late Pleistocene in Laizhou Bay, Bohai Sea, Geol. Chin., 45, 59–68, 2018 (in Chinese with English abstract).
Giraldo-Giraldo, M. J., Velásquez-Ruiz, C. A., and Pardo-Trujillo, A.: Late-Holocene pollen-based paleoenvironmental reconstruction of the El Triunfo wetland, Los Nevados National Park (Central Cordillera of Colombia), Holocene, 28, 183–194, 2018.
González, C. and Dupont, L. M.: Tropical salt marsh succession as sea-level indicator during Heinrich events, Quaternary Sci. Rev., 28, 939–946, 2009.
Grimm, E. C.: CONISS: a Fortran 77 program for stratigraphically constrained cluster analysis by the method of incremental sum of squares, Comput. Geosci., 13, 13–35, 1987.
Gu, Y. H. and Xiu, R. C.: On the current and storm flow in the Bohai Sea and their role in transporting deposited silt of the Yellow River, J. Oceanogr. Huanghai & Bohai Seas., 14, 1–6, 1996.
Hao, T., Liu, X. J., Ogg, J., Liang, Z., Xiang, R., Zhang, X. D., Zhang, D. H., Zhang, C., Liu, Q. L., and Li, X. G.: Intensified episodes of East Asian Winter Monsoon during the middle through late Holocene driven by North Atlantic cooling events: High-resolution lignin records from the South Yellow Sea, China, Earth. Planet. Sci. Lett., 479, 144–155, 2017.
Havinga, A. J.: Palynology and pollen preservation, Rev. Palaeobot. Palyno., 2, 81–98, 1967.
He, L., Xue, C. T., Ye, S. Y., Amorosi, A., Yuan, H. M., Yang, S. X., and Laws, E. A.: New evidence on the spatial-temporal distribution of superlobes in the Yellow River Delta Complex, Quaternary Sci. Rev., 214, 117–138, 2019.
Hemavathi, S., Manjula, R., and Ponmani, N.: Numerical Modelling and Experimental Investigation on the Effect of Wave Attenuation Due to Coastal Vegetation, in: Proceedings of the Fourth International Conference in Ocean Engineering (ICOE2018), edited by: Murali, K., Sriram, V., Samad, A., and Saha, N., Springer, Singapore, Lecture Notes in Civil Engineering, 23, 99–110, https://doi.org/10.1007/978-981-13-3134-3_9, 2019.
Hendy, I. L., Minckley, T. A., and Whitlock, C.: Eastern tropical Pacific vegetation response to rapid climate change and sea level rise: A new pollen record from the Gulf of Tehuantepec, southern Mexico, Quaternary Sci. Rev., 145, 152–160, 2016.
Heusser, L. E.: Pollen distribution in marine sediments on the continental margin off northern California, Mar. Geol., 80, 131–147, 1988.
Hoerling, M., Kumar, A., Eischeid, J., and Jha, B.: What is causing the variability in global mean land temperature?, Geophys. Res. Lett., 35, L23712, https://doi.org/10.1029/2008GL035984, 2008.
Hou, J. Z., Huang, Y. S., Zhao, J. T., Liu, Z. H., Colman, S., and An, Z. S.: Large Holocene summer temperature oscillations and impact on the peopling of the northeastern Tibetan Plateau, Geophys. Res. Lett., 43, 1323–1330, 2016.
Hou, X. Y.: Vegetation Atlas of China, Science Press, 1–280, 2001 (in Chinese).
Hou, W. and Hou, X. Y.: Spatial–temporal changes in vegetation coverage in the global coastal zone based on GIMMS NDVI3g data, Int. J. Remote. Sens., 41, 1118–1138, 2020.
Hu, L. M., Guo, Z. G., Shi, X. F., Qin, Y. W., Lei, K., and Zhang, G.: Temporal trends of aliphatic and polyaromatic hydrocarbons in the Bohai Sea, China: Evidence from the sedimentary record, Org. Geochem., 42, 1181–1193, 2011.
Huang, D. J., Su, J. L., and Backhaus, J. O.: Modelling the seasonal thermal stratification and baroclinic circulation in the Bohai Sea, Cont. Shelf. Res., 19, 1485–1505, 1999.
Jia, Y. H., Li, D. W., Yu, M., Zhao, X. C., Xiang, R., Li, G. X., Zhang, H. L., and Zhao, M. X.: High- and low-latitude forcing on the south Yellow Sea surface water temperature variations during the Holocene, Global Planet. Change, 182, 103025, https://doi.org/10.1016/j.gloplacha.2019.103025, 2019.
Jiang, D. J., Fu, X. F., and Wang, K.: Vegetation dynamics and their response to freshwater inflow and climate variables in the Yellow River Delta, China, Quatern. Int., 304, 75–84, 2013.
Jiang, W. Y., Guo, Z. T., Sun, X. J., Wu, H. B., Chu, G. Q., Yuan, B. Y., Hatte, C., and Guiot, J.: Reconstruction of climate and vegetation changes of Lake Bayanchagan (Inner Mongolia): Holocene variability of the east Asian monsoon, Quaternary Res., 65, 411–420, 2006.
Kirchner, G. and Ehlers, H.: Sediment Geochronology in Changing Coastal Environments: Potentials and Limitations of the 137Cs and 210Pb Methods, J. Coast. Res., 14, 483–492, 1998.
Koutavas, A. and Joanides, S.: El Niño-Southern Oscillation extrema in the Holocene and Last Glacial Maximum, Paleoceanography, 27, PA4208, https://doi.org/10.1029/2012PA002378, 2012.
Li, C. H., Wu, Y. H., and Hou, X. H.: Holocene vegetation and climate in Northeast China revealed from Jingbo Lake sediment, Quatern. Int., 229, 67–73, 2011.
Li, C. Y., Yan, L. Q., and Han, T. X.: Research on composition of wetland vegetation in Shandong, Shandong Forest Sci. Tech., 4, 27–29, 2007 (in Chinese with English abstract).
Li, G. G., Hu, B. Q., Bi, J. Q., Song, Z. L., Bu, R. Y., and Li, J. M.: Stratigraphic evolution of the Huanghe Delta (Bohai Sea) since the Late Quaternary and its paleoenvironmental implications: evidence from core ZK1, Acta Sedimentologica Sinica, 31, 1050–1058, 2013 (in Chinese with English abstract).
Li, M. Y., Zhang, S. R., Xu, Q. H., Xiao, J., and Wen, R. L.: Spatial patterns of vegetation and climate in the North China Plain during the Last Glacial Maximum and Holocene climatic optimum, Sci. China. Earth. Sci., 62, 1279–1287, 2019.
Li, X. Q., Zhou, J., Shen, J., Weng, C. Y., Zhao, H. L., and Sun, Q. L.: Vegetation history and climatic variations during the last 14 ka BP inferred from a pollen record at Daihai Lake, north-central China, Rev. Palaeobot. Palyno., 132, 195–205, 2004.
Liu, D. Y., Li, X., Emeis, K. C., Wang, Y. J., and Richard, P.: Distribution and sources of organic matter in surface sediments of Bohai Sea near the Yellow River Estuary, China, Estuar. Coast. Shelf. S., 165, 128–136, 2015.
Liu, J., Saito, Y., Wang, H., Zhou, L., and Yang, Z.: Stratigraphic development during the Late Pleistocene and Holocene offshore of the Yellow River delta, Bohai Sea, J. Asian. Earth. Sci., 36, 318–331, 2009.
Liu, S., Feng, A., Du, J., Xia, D., Li, P., Xue, Z., Hu, W., and Yu, X.: Evolution of the buried channel systems under the modern Yellow River delta since the last glacial maximum, Quatern. Int., 349, 327–338, 2014.
Liu, W. Z., Zhang, Q. F., and Liu, G. H.: Seed banks of a river–reservoir wetland system and their implications for vegetation development, Aquat. Bot., 90, 7–12, 2009.
Lu, J. J., He, W. S., Tong, C. F., and Wang, W.: Wetland Ecology, Higher Education Press, Beijing, 2006.
Luo, C. X., Chen, M. H., Xiang, R., Liu, J. G., Zhang, L. L., Lu, J., and Yang, M. X.: Characteristics of modern pollen distribution in surface sediment samples for the northern South China Sea from three transects, Quatern. Int., 286, 148–158, 2013.
Luo, C. X., Chen, M. H., Xiang, R., Liu, J. G., Zhang, L. L., Lu, J., and Yang, M. X.: Modern pollen distribution in marine sediments from the northern part of the South China Sea, Mar. Micropaleontol., 108, 41–56, 2014.
Marcott, S. A., Shakun, J. D., Clark, P. U., and Mix, A. C.: A reconstruction of regional and global temperature for the past 11,300 years, Science, 339, 1198–1201, 2013.
Meyer, H., Opel, T., Laepple, T., Dereviagin, A. Y., Hoffmann, K., and Werner, M.: Long-term winter warming trend in the Siberian Arctic during the mid- to late Holocene, Nat. Geosci., 8, 122–125, https://doi.org/10.1038/NGEO2349, 2015.
Milliman, J. D. and Meade, R. H.: World-wide delivery of river sediment to oceans, J. Geol., 91, 1–21, 1983.
Milliman, J. D., Qin, Y. S., Ren, M. E., and Saito, Y.: Man's influence on the erosion and transport of sediment by Asian rivers: the Yellow River (Huanghe) example, J. Geol., 95, 751–762, 1987.
Montade, V., Nebout, N. C., Kissel, C., and Mulsow, S.: Pollen distribution in marine surface sediments from Chilean Patagonia, Mar. Geol., 282, 161–168, 2011.
Mudie, P. J.: Pollen distribution in recent marine sediments, Eastern Canada, Can. J. Earth Sci., 19, 729–747, 1982.
Mudie, P. J. and McCarthy, F. M. G.: Pollen transport processes in the western North Atlantic: evidence from cross margin and north–south transects, Mar. Geol., 118, 79–105, 1994.
Neumann, F. H., Scott, L., Bousman, C. B., and As, L. V.: A Holocene sequence of vegetation change at Lake Eteza, coastal KwaZulu-Natal, South Africa, Rev. Palaeobot. Palyno., 162, 39–53, 2010.
Pan, Y. and Xu, J. W.: Studies on Resource and Flora of Aquatic Vascular Plants in Wetland of Yellow River Delta, J. Anhui. Agr. Sci., 39, 1642–1644, 2011 (in Chinese with English abstract).
Palinkas, C. M. and Nittrouer, C. A.: Modern sediment accumulation on the Po shelf, Adriatic Sea, Cont. Shelf. Res., 27, 489–505, 2007.
Park, J. and Kim, M.: Pollen-inferred late Holocene agricultural developments in the vicinity of Woljeong-ri, southwestern Korea, Quatern. Int., 384, 13–21, 2015.
Pessenda, L. C. R., Vidotto, E., De Oliveira, P. E., Busso Jr., A. A., Cohen, M. C. L., Rossetti, D. d. F., Ricardi-Branco, F., and Bendassolli, J. A.: Late Quaternary vegetation and coastal environmental changes at Ilha do Cardoso mangrove, southeastern Brazil, Palaeogeogr. Palaeocl., 363–364, 57–68, 2012.
Qiao, F. L., Gan, Z. J., and Sun, X. P.: Regional oceanography of China seas-physical oceanography, China Ocean Press, Beijing, 2012.
Qiao, S. Q., Shi, X. F., Zhu, A. M., Liu, Y. G., Bi, N. S., Fang, X. S., and Yang, G.: Distribution and transport of suspended sediments off the Yellow River (Huanghe) mouth and the nearby Bohai Sea, Estuar. Coast. Shelf. S., 86, 337–344, 2010.
Qiao, S. Q., Shi, X. F., Wang, G. Q., Zhou, L., Hu, B. Q., Hu, L. M., Yang, G., Liu, Y. G., Yao, Z. Q., and Liu, S. F.: Sediment accumulation and budget in the Bohai Sea, Yellow Sea and East China Sea, Mar. Geol., 390, 270–281, 2017.
Rao, Z. G., Huang, C., Xie, L. H., Shi, F. X., Zhao, Y., Cao, J. T., Gou, X. H., Chen, J. H., and Chen, F. H.: Long-term summer warming trend during the Holocene in central Asia indicated by alpine peat α-cellulose δ13C record, Quaternary Sci. Rev., 203, 56–67, 2019.
Rao, Z. G., Shi, F. X., Li, Y. X., Huang, C., Zhang, X. Z., Yang, W., Liu, L. D., Zhang, X. P., and Wu, Y.: Long-term winter/summer warming trends during the Holocene revealed by α-cellulose δ18O∕δ13C records from an alpine peat core from central Asia. Quaternary Sci. Rev., 232, 106217, https://doi.org/10.1016/j.quascirev.2020.106217, 2020.
Ren, G. Y.: Changes in forest cover in China during the Holocene, Veget. Hist. Archaeobot., 16, 119–126, 2007.
Ren, G. Y. and Zhang, L. S.: A preliminary mapped summary of Holocene pollen data for northeast China, Quaternary Sci. Rev., 17, 669–688, 1998.
Ren, G. Y. and Beug, H. J.: Mapping Holocene pollen data and vegetation of China, Quaternary Sci. Rev., 21, 1395–1422, 2002.
Saito, Y., Wei, H. L., Zhou, Y. Q., Nishimura, A., Sato, Y., and Yokota, S.: Delta progradation and chenier formation in the Huanghe (Yellow River) delta, China, J. Asian. Earth. Sci., 18, 489–497, 2000.
Sander, V. D. K.: Pollen distribution in marine sediments from the south-eastern Indonesian waters, Palaeogeogr. Palaeoclimatol. Palaeoecol., 171, 341–361, 2001.
Serrano, O., Lovelock, C. E., Atwood, T. B., Macreadie, P.I., Canto, R., Phinn, S., Arias-Ortiz, A., Bai, L., Baldock, J., Bedulli, C., Carnell, P., Connolly, R. M., Donaldson, P., Esteban, A., Ewers Lewis, C. J., Eyre, B. D., Hayes, M. A., Horwitz, P., Hutley, L. B., Kavazos, C. R. J., Kelleway, J. J., Kendrick, G. A., Kilminster, K., Lafratta, A., Lee, S., Lavery, P. S., Maher, D. T., Marbà, N., Masque, P., Mateo, M. A., Mount, R., Ralph, P. J., Roelfsema, C., Rozaimi, M., Ruhon, R., Salinas, C., Samper-Villarreal, J., Sanderman, J., Sanders, C. J., Santos, I., Sharples, C., Steven, A. D. L., Cannard, T., Trevathan-Tackett, S. M., and Duarte, C. M.: Australian vegetated coastal ecosystems as global hotspots for climate change mitigation, Nat. Commun., 10, 4313, doi10.1038/s41467-019-12176-8, 2019.
Spivak, A. C., Sanderman, J., Bowen, J. L., Canuel, E. A., and Hopkinson, C. S.: Global-change controls on soil-carbon accumulation and loss in coastal vegetated ecosystems, Nat. Geosci., 12, 685–692, 2019.
Stebich, M., Rehfeld, K., Schlütz, F., Tarasov, P. E., Liu, J. Q., and Mingram, J.: Holocene vegetation and climate dynamics of NE China based on the pollen record from Sihailongwan Maar Lake, Quaternary Sci. Rev., 124, 275–289, 2015.
Stuiver, M., Reimer, P. J., and Reimer, R. W.: CALIB 7.1, WWW program, available at: http://calib.org/calib/, last access: 19 February 2019.
Thompson, L. G., Yao, T. D., Davis, M. E., Henderson, K. A., Mosley-Thompson, E., Lin, P. N., Beer, J., Synal, H. A., Cole-Dai, J., and Bolzan, J. F.: Tropical climate instability: the last glacial cycle from a Qinghai-Tibetan ice core, Science, 276, 1821–1825, 1997.
Triacca, U., Pasini, A., Attanasio, A., Giovannelli, A., and Lippi, M.: Clarifying the Roles of Greenhouse Gases and ENSO in Recent Global Warming through Their Prediction Performance, J. Climate, 27, 7903–7910, 2014.
Wang, H., Yang, Z., Li, Y., Guo, Z., Sun, X., and Wang, Y.: Dispersal pattern of suspended sediment in the shear frontal zone off the Huanghe (Yellow River) mouth, Cont. Shelf. Res., 27, 854–871, 2007.
Wang, H. J., Wang, A. M., Bi, N. S., Zeng, X. M., and Xiao, H. H.: Seasonal distribution of suspended sediment in the Bohai Sea, China, Cont. Shelf. Res., 90, 17–32, 2014.
Wang, K. F.: Spore-pollen and algal assemblages in the sediments of the Bohai Sea and palaeoenvironments, Geological Publishing House, Beijing, 1993.
Woodroffe, S. A., Long, A. J., Milne, G. A., Bryant, C. L., and Thomas, A. L.: New constraints on late Holocene eustatic sea-level changes from Mahe, Seychelles, Quaternary Sci. Rev., 115, 1–16, 2015.
Wu, P., Xiao, X., Tao, S., Yang, Z., Zhang, H., Li, L., and Zhao, M.: Biomarker evidence for changes in terrestrial organic matter input into the Yellow Sea mud area during the Holocene, Sci. China. Earth. Sci., 59, 1216–1224, 2016.
Wu, X., Bi, N. S., Kanai, Y., Saito, Y., Zhang, Y., Yang, Z. S., Fan, D. J., and Wang, H. J.: Sedimentary records off the modern Huanghe (Yellow River) delta and their response to deltaic river channel shifts over the last 200 years, J. Asian. Earth. Sci., 108, 68–80, 2015.
Wu, X., Bi, N. S., Xu, J. P., Nittrouer, J. A., Yang, Z. S., Saito, Y., and Wang, H. J.: Stepwise morphological evolution of the active Yellow River (Huanghe) delta lobe (1976–2013): Dominant roles of riverine discharge and sediment grain size, Geomorphology, 292, 115–127, https://doi.org/10.1016/j.geomorph.2017.04.042, 2017.
Wu, J., Liu, Q., Cui, Q. Y., Xu, D. K., Wang, L., Shen, C. M., Chu, G. Q., and Liu, J. Q.: Shrinkage of East Asia winter monsoon associated with increased ENSO events since the mid-Holocene, J. Geophys. Res., 124, 3839–3848, 2019.
Xing, G. P., Wang, H. J., Yang, Z. S., and Bi, N. S.: Spatial and temporal variation in erosion and accumulation of the subaqueous Yellow River delta (1976–2004), J. Coast. Res., 74, 32–47, 2016.
Xing, S. Y., Xi, J. B., Zhang, J. F., Song, Y. M., and Ma, B. Y.: The basic characteristics and the main types of vegetation in the Yellow River delta region, J. Northeast. Forest. Univ., 31, 85–86, 2003 (in Chinese).
Xu, D. K., Lu, H. Y., Chu, G. Q., Wu, N. Q., Shen, C. M., Wang, C., and Mao, L. M.: 500-year climate cycles stacking of recent centennial warming documented in an East Asian pollen record, Sci. Rep.-UK., 4, 3611, https://doi.org/10.1038/srep03611, 2014.
Xu, J. X.: Grain-size characteristics of suspended sediment in the Yellow River, China, Catena, 38, 243–263, 1999.
Xu, J. W.: Research on Diversity of Aquatic Vascular Plants in Wetland of Yellow River Delta, Heilongjiang, Agr. Sci., 1, 36–38, 2011 (in Chinese with English abstract).
Xu, W. C., Ma, J. S., and Wang, W.: A review of studys on the influence of ENSO events on the climate in China, Sci. Meteorol. Sin., 25, 212–220, 2005.
Xu, Y. P., Zhou, S. Z., Hu, L. M., Wang, Y. H., and Xiao, W. J.: Different controls on sedimentary organic carbon in the Bohai Sea: River mouth relocation, turbidity and eutrophication, J. Marine. Syst., 180, 1–8, 2018.
Xu, Z. J., Zhang, X. L., Zhang, Z. H., and Zhang, W.: Analysis of the biodiversity characters of coastal wetlands in southern Laizhou Bay, Ecol. Env. Sci., 19, 367–372, 2010 (in Chinese with English abstract).
Xue, C., Cheng, G. D., and Zhou, Y. Q.: Relationship between Late Pleistocene and Early Holocene terrestrial deposits and sea level changes in Yellow River Delta area, Mar. Geol. Quat. Geol., 8, 63–73, 1988 (in Chinese with English abstract).
Xue, C. T.: Historical changes in the Yellow River delta, China, Mar. Geol., 113, 321–329, 1993.
Xue, C. T. and Cheng, G. D.: Shelly ridges in west coast of Bohai Sea and Holocene Yellow River Delta system, in: Quaternary Processes and Events in China Offshore and Onshore Areas, edited by: Yang, Z. G. and Lin, H. M., China Ocean Press, Beijing, 1989 (in Chinese with English abstract).
Xue, C. T., Zhu, X. H., and Lin, H. M.: Holocene sedimentary sequence, foraminifera and ostracoda in west coastal lowland of Bohai Sea, China, Quaternary Sci. Rev., 14, 521–530, 1995.
Yang, S. X., Li, J., Mao, L.M., Liu, K., Gao, M. S., Ye, S. Y., Yi, S., Zhou, L. Y., and Wang, F. F.: Assessing pollen distribution patterns and provenance based on palynological investigation on surface sediments from Laizhou Bay, China: an aid to palaeoecological interpretation, Palaeogeogr. Palaeocl., 457, 209–220, 2016.
Yang, S. X., Song, B., Ye, S. Y., Laws, E. A., He, L., Li, J., Chen, J. X., Zhao, G. M., Zhao, J. T., Mei, X., and Behling, H.: Large-scale pollen distribution in marine surface sediments from the Bohai Sea, China: Insights into pollen provenance, transport, deposition, and coastal-shelf paleoenvironment, Prog. Oceanog., 178, 102183, https://doi.org/10.1016/j.pocean.2019.102183, 2019.
Yang, Z. S., Ji, Y. J., Bi, N. S., Lei, K., and Wang, H. J.: Sediment transport off the Huanghe (Yellow River) delta and in the adjacent Bohai Sea in winter and seasonal comparison, Estuar. Coast. Shelf. S., 93, 173–181, 2011.
Yi, S., Saito, Y., Oshima, H., Zhou, Y. Q., and Wei, H. L.: Holocene environmental history inferred from pollen assemblages in the Huanghe (Yellow River) delta, China: climatic change and human impact, Quaternary Sci. Rev., 22, 609–628, 2003.
Zhang, G. S., Wang, R. Q., and Song, B. M.: Plant community succession in modern Yellow River Delta, China, J. Zhejiang Univ. Sci., 8, 540–548, 2007.
Zhang, H. X., Zhang, M. L., Xu, T. P., and Tang, J.: Numerical Investigations of Tsunami Run-Up and Flow Structure on Coastal Vegetated Beaches, Water, 10, 1776, https://doi.org/10.3390/w10121776, 2018.
Zhang, J. Y., Li, J., Yan, Y., Li, J. J., and Wan, X. Q.: A 1000-year record of centennial-scale cyclical vegetation change from Maar Lake Sanjiaolongwan in northeastern China, J. Asian. Earth. Sci., 176, 315–324, 2019.
Zhang, P., Hu, R. J., Zhu, L. H., Wang, P., Yin, D. X., and Zhang, L. J.: Distributions and contamination assessment of heavy metals in the surface sediments of western Laizhou Bay: Implications for the sources and influencing factors, Mar. Pollut. Bull., 119, 429-438, https://doi.org/10.1016/j.marpolbul.2017.03.046, 2017.
Zhang, X. L., Ye, S. Y., Yin, P., and Chen, D. J.: Characters and successions of natural wetland vegetation in Yellow River Delta, Ecol. Env. Sci., 18, 292–298, 2009a (in Chinese with English abstract).
Zhang, X. L., Ye, S. Y., Yin, P., and Yuan, H. M.: Flora characteristics of vascular plants of coastal wetlands in Yellow River Delta, Ecol. Env. Sci., 18, 600–607, 2009b (in Chinese with English abstract).
Zhang, Z. H., Leduc, G., and Sachs, J. P.: El Niño evolution during the Holocene revealed by a biomarker rain gauge in the Galápagos Islands, Earth. Planet. Sc. Lett., 404, 420–434, 2014.
Zheng, Z., Yang, S. X., Deng, Y., Huang, K. Y., Wei, J. H., Berne, S., and Suc, J. P.: Pollen record of the past 60 ka BP in the Middle Okinawa Trough: Terrestrial provenance and reconstruction of the paleoenvironment, Palaeogeogr. Palaeocl., 307, 285–300, 2011.
Zhou, L. Y., Liu, J., Saito, Y., Gao, M. S., Diao, S. B., Qiu, J. D., and Pei, S. F.: Modern sediment characteristics and accumulation rates from the delta front to prodelta of the Yellow River (Huanghe), Geo-Mar. Lett., 36, 247–258, 2016.
Zhou, W., Wang, X., Zhou, T.J., Li, C., and Chan, J. C. L.: Interdecadal variability of the relationship between the East Asian winter monsoon and ENSO, Meteorol. Atmos. Phys., 98, 283–293, 2007.
Zhou, Z., Bian, C., Wang, C., Jiang, W., and Bi, R.: Quantitative assessment on multiple timescale features and dynamics of sea surface suspended sediment concentration using remote sensing data, J. Geophys. Res.-Oceans., 122, 8739–8752, 2017.