the Creative Commons Attribution 4.0 License.
the Creative Commons Attribution 4.0 License.
 | 04 Nov 2020
Climate simulations and pollen data reveal the distribution and connectivity of temperate tree populations in eastern Asia during the Last Glacial Maximum
Suzanne Alice Ghislaine Leroy
Klaus Arpe
Uwe Mikolajewicz
Publications on temperate deciduous tree refugia in Europe are abundant, but little is known about the patterns of temperate tree refugia in eastern Asia, an area where biodiversity survived Quaternary glaciations and which has the world's most diverse temperate flora. Our goal is to compare climate model simulations with pollen data in order to establish the location of glacial refugia during the Last Glacial Maximum (LGM). Limits in which temperate deciduous trees can survive are taken from the literature. The model outputs are first tested for the present by comparing climate models with published modern pollen data. As this method turned out to be satisfactory for the present, the same approach was used for the LGM. Climate model simulations (ECHAM5 T106), statistically further downscaled, are used to infer the temperate deciduous tree distribution during the LGM. These were compared with available fossil temperate tree pollen occurrences.
The impact of the LGM on the eastern Asian climate was much weaker than on the European climate. The area of possible tree growth shifts only by about 2∘ to the south between the present and the LGM. This contributes to explaining the greater biodiversity of forests in eastern Asia compared to Europe. Climate simulations and the available, although fractional, fossil pollen data agree. Therefore, climate estimations can safely be used to fill areas without pollen data by mapping potential refugia distributions. The results show two important areas with population connectivity: the Yellow Sea emerged shelf and the southern Himalayas. These two areas were suitable for temperate deciduous tree growth, providing corridors for population migration and connectivity (i.e. less population fragmentation) in glacial periods. Many tree populations live in interglacial refugia, not glacial ones. The fact that the model simulation for the LGM fits so well with observed pollen distribution is another indication that the model used is good enough to also simulate the LGM period.
- Article
(2402 KB) - Full-text XML
-
Supplement
(529 KB) - BibTeX
- EndNote


Eastern Asian temperate deciduous forests boast the world's most diverse temperate deciduous forest flora (Donoghue and Smith, 2004; Qiu et al., 2011). They also contain the highest numbers of Tertiary relict taxa that have disappeared from Europe (Milne and Abbott, 2002; Svenning, 2003), such as Carya and Parrotia (Li and Del Tredici, 2008; Orain et al., 2013). The reason for this situation should be sought in the history of these forests through Quaternary glaciations and earlier. The last time these forests had a considerable reduction of their population or underwent a shift of their distribution was during the Last Glacial Maximum (LGM), i.e. 21 000 years ago. On different continents, this happened in different ways due to the climate of the area, the topography (including the orientation of the main mountain ranges that may act as geographical corridors or barriers), the location and extent of ice caps, and the extent of emerged coastal shelves. In Europe during the LGM, temperate deciduous forests, especially the warm–temperate tree species, died out in much of northern and central Europe and survived in refugia in the mountainous areas of the three southern peninsulas: Iberia, Italy and the Balkans, as well as in some smaller areas around the Black Sea and the southern Caspian Sea (Leroy and Arpe, 2007; Arpe et al., 2011).
Various methods have been used to establish the locations of glacial refugia of temperate deciduous trees during the LGM in eastern Asia. For example, population distributions have been published based on phylogenetic data in eastern Asia (Qian and Ricklefs, 2000) and based on biomization using palaeo-data for the Japanese archipelago (Takahara et al., 2000; Gotanda and Yasuda, 2008) as well as for China (Harrison et al., 2001). A disagreement regarding the location of temperate tree refugia in China, especially at its northern limit, has appeared: Harrison et al. (2001) proposed the northern limit of the temperate deciduous forest biome to have retreated far south (south of 35∘ N) versus Qian and Ricklefs (2000), who suggested an extension of the temperate forest over the emerged continental shelf. Qian and Ricklefs (2000) highlighted the important role played by physiography heterogeneity, climatic change and sea-level changes in allopatric speciation. According to the results of their ecological analysis, a temperate tree population extended across the emerged shelf and linked populations in China, Korea and Japan during glacial times. This led to the concept of interglacial fragmentation and refugia.
Additional information from phylogenetics of temperate deciduous trees should also be considered for phylogeography purposes. But few trees and bushes belonging to the deciduous forest have been analysed so far. A temperate deciduous bush, Ostryopsis davidiana, indicates multiple LGM refugia both south and north of the Qin Mountains (Tian et al., 2009).
To be complete, it should be mentioned that the distribution of key temperate tree biomes (discrete points) for the LGM can be found in Ni et al. (2014).
Our aim is to contribute to this debate on the northern limit of temperate deciduous trees by using another approach to ecology, biomization and phylogeography, i.e one based on climate model simulations. The results from this approach are validated by pollen data, whose amount has increased spectacularly since 2010. Distribution maps are then produced.
The climatic data, model and methods used in this study are described by Leroy and Arpe (2007) and Arpe et al. (2011) in more detail. Coupled ECHAM5–MPIOM atmosphere ocean model simulations were carried out, though with a very low horizontal resolution of T31 (i.e. a spectral representation which resolves waves down to 31∘ on any great circle on the Earth corresponding to approx. 3.75∘). In such a coupled model, the atmosphere as well as the ocean and vegetation were simulated to interact with each other and generate their own sea surface temperature (SST) and vegetation parameters. These SSTs and vegetation parameters were then used for uncoupled ECHAM5 T106 atmospheric simulations. The ECHAM models, including the coupled ocean model, were developed at the Max Planck Institute (MPI) for Meteorology in Hamburg.
The models were run with the present-day conditions concerning orography, solar radiation, ice cover and CO2 as well as under LGM conditions concerning the same parameters (e.g. atmospheric CO2 concentration at 185 ppm). Simulations for the present and the LGM with a T106 resolution (approx. 1.125∘ horizontal resolution) model with 39 atmospheric vertical levels were carried out with the ECHAM5 atmospheric model (Roeckner et al., 2003). The boundary data, e.g. the SST and vegetation parameters, were taken from the coupled ECHAM5–MPIOM atmosphere ocean dynamic vegetation model (Mikolajewicz et al., 2007) simulations, which have been made for the present and the LGM with a spectral resolution of T31 and 19 vertical levels. The experimental setup is largely consistent with the Paleoclimate Modelling Intercomparison Project phase 2 PMIP2 (Braconnot et al., 2007). These SSTs were corrected for systematic errors of the coupled run by adding the SST differences between observed SSTs and simulated ones for the present; the corrections are generally below 3 ∘C.
In Arpe et al. (2011), comparisons of the model-generated SSTs with other reconstructions, e.g. from the MARGO project (Kucera et al., 2005), were performed and good agreement was found. Differences to the CLIMAP (1981) reconstruction agree with findings by PMIP2 (Braconnot et al., 2007). Also, other information from the LGM gave further confidence in the performance of the model. In Arpe et al. (2011), the importance of high resolution is stressed. Therefore, we again use the T106 model. Intuitively one assumes that the model that provides good estimations for the present climate would also be best for simulating a climate with a different external forcing such as during the LGM. Indeed, Arpe et al. (2011) found good correspondence between pollen findings for the LGM and the estimation of possible tree growth for Europe, which increased confidence in that model. As the climate of eastern Asia is quite different to that of Europe, we try to find further evidence for the high performance of the model in eastern Asia.
It is generally assumed that results from model simulations become more robust when using an ensemble of different model simulations, but we did not do that. As the ECHAM models have been shown by Reichler and Kim (2008) to be the best, by including others we would only dilute our results because of very different results in different simulations (Tian and Jiang, 2016). Further, most of the available simulations are of much lower resolution than T106 used here, and which we believe is essential for a region of diverse topography such as eastern Asia. When combining the results of different models, an interpolation to a common grid is inevitable, and that creates some smoothing with a further loss of resolution.
Nevertheless, even a T106 model resolution might not be sufficient for our investigation. Kim et al. (2008) demonstrate the importance of high resolution with their model for the response of the eastern Asian summer monsoon under LGM conditions. Therefore, we did a downscaling to a 0.5∘ resolution. For that, the differences between the model simulations for the LGM and the present are added to a high-resolution present-day climatology. The climatology that seemed best for our investigation is that of Cramer and Leemans (Leemans and Cramer, 1991; Cramer, 1996), below abbreviated as C&L. With this method, the impact of possible systematic errors of the model is reduced. This method works only if the simulations are already reasonable; otherwise, it might happen that e.g. negative precipitation amounts may occur. We could use this method only for the precipitation and 2 m air temperature (T2m), while the winds had to be taken directly from the model simulations.
To improve the understanding of limitations in the climate data, estimates of the present climatology with data from the Global Precipitation Climate Center (GPCC) (Schneider et al., 2011; Becker et al., 2013; GPCC, 2013) and with data from the ECMWF Interim Reanalyses (ERA-Interim) (Dee et al., 2011; ECMWF, 2019) are used.
A lower CO2 concentration in the atmosphere during the LGM caused a decline in pollen production. Therefore, low pollen concentrations or influxes may already be indicative of the presence of trees (Ziska and Caulfield, 2000; Leroy, 2007). It should be noted that we are not working at the level of forests or biomes. Hence, it is considered that pollen sites will reliably indicate the survival of temperate deciduous trees (summer-green and broadleaf) if records have a subcontinuous curve of at least one temperate taxon such as deciduous Quercus, Ulmus, Carpinus or Tilia. The study focuses on the period of the LGM, hence on an age of 21±2 cal ka BP (Mix et al., 2001). The geographical areas of China, Japan, SE Russia, Korea and the Himalayas are explored. The dataset includes terrestrial and marine sites. A literature review of pollen data was made. It was first based on the large compilations of Cao et al. (2013), mainly for China, and of Gotanda and Yasuda (2008) for Japan. Then this was enlarged geographically with an update including more recent publications.
Modern pollen assemblages were used to check the validity of the tree growth limits chosen. The following databases were used: Zheng et al. (2014) for China and Gotanda et al. (2002) for Japan. This was complemented by local studies such as by Park (2011) and Park and Park (2015) for Korea and the Himalayas (Fuji and Sakai, 2002; Chung et al., 2010; Kotlia et al., 2010; Yi and Kim, 2010). It was not intended to be exhaustive. From these databases, occurrences of temperate deciduous trees (mainly deciduous Quercus and Ulmus, but also others such as Carya, Tilia and Carpinus) of at least 0.5 % were selected.
In our earlier investigations on glacial refugia of trees over Europe (Leroy and Arpe 2007; Arpe et al., 2011), limiting factors for possible tree growth were precipitation during summer, the mean temperature of the coldest months and the growing degree days (number of days with temperatures >5 ∘C) (GDD5); the latter is related to summer temperatures. The climate of eastern Asia is different to that of Europe, and a short review of its climate is therefore needed in order to adapt the limits.
The climate of eastern Asia is dominated by the monsoon (more information in Sect. S1 of the Supplement) and its very strong topographic variability. The latter makes it difficult to create a reliable climatology on a regular grid. This is demonstrated for air temperature (T2m) during December to February (DJF) by comparing the C&L climatology with a long-term mean from the ECMWF Interim Reanalysis (Dee et al., 2011; ECMWF, 2019) (ERA-Interim), a simulation for the present (CTR) and LGM simulations (Fig. 1).
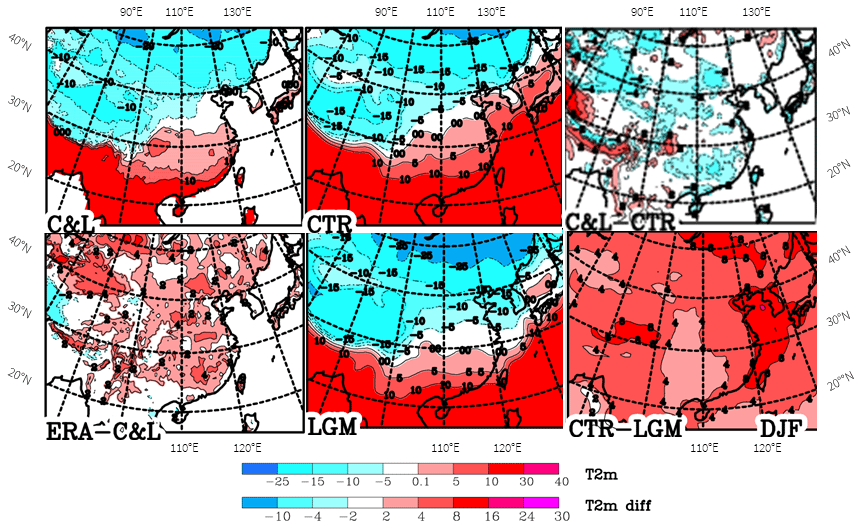
Figure 1Climatological mean distribution of T2m over eastern Asia for December to February (DJF). Values by Leemans and Cramer (1991) (C&L), the ECMWF reanalysis (ERA-Interim) and model simulations (CTR and LGM), as well as some differences between them.
Much stronger structures in the C&L climatology compared to the other climatologies can be seen (Fig. 1). Moreover, substantial differences are observed; e.g. the white band (−5 to 0 ∘C) is positioned about 5∘ further north in eastern Asia in ERA-Interim compared to C&L, with up to 4 ∘C warmer temperatures over a large part of eastern Asia (Fig. 1, ERA–C&L). For the Caspian region, Molavi-Arabshahi et al. (2016) showed how biases of several degrees Celsius in ERA-Interim can occur in mountainous areas when the topographic height in the ECMWF model and the real topography are different. So it is assumed that the warmer temperatures in ERA-Interim compared to C&L are due to this analysis system. The climate simulation for the present (Fig. 1, CTR) agrees similarly well with ERA-Interim and C&L, a little warmer than C&L and cooler than ERA-Interim (not shown).
A main purpose of different simulation periods (Fig. 1) is the display of changes from the LGM to the present (Fig. 1 lower right). Over the Yellow Sea, temperatures differ by up to 16 ∘C, as a large area of the ocean shelf emerged during the LGM, while the differences are much smaller for continental China, mainly 4 to 5 ∘C. These changes between the present and the LGM are overall much weaker than for Europe in winter (Fig. 2). Typical differences for continental central Europe are 8–15 ∘C, while they are only around 4–5 ∘C for the eastern Asian continent. One has to take into account that China is further south than central Europe; the central latitudes on the European map are 45 to 50∘ N, while for China they are 32 to 37∘ N, which contributes to explaining the large differences in the temperature change. Also, the proximity of the Fennoscandian ice sheet is of importance for the colder temperatures in Europe, as is weakening of the Gulf Stream, which presently supplies Europe with warmer temperatures. The strong temperature change over the Yellow Sea is a consequence of the larger heat capacity of the ocean, which limits the wintertime cooling under present-day conditions. During the LGM, this area emerged due to the lower sea level, which leads to much stronger wintertime cooling.
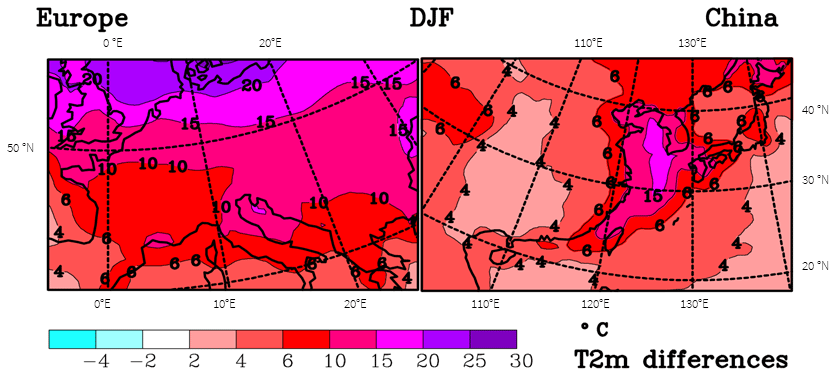
Figure 2Difference maps between simulated CTR and LGM T2m during winter (DJF) for Europe and eastern Asia.
The summer temperatures are shown in Fig. 3. ERA-Interim temperatures are often warmer by around 2 ∘C than the ones in the C&L climatology (Fig. 3, lower left panel); the arguments for this difference given above for DJF apply here as well. The differences between the present and the LGM in the simulations increase from China's east coast of 2–3 ∘C to up to 6 ∘C over Tibet. This is similar to what Tian and Jiang (2016) found in PMIP3 simulations; they state that the temperature drop in the LGM is too low compared to proxy data. The summer temperatures are being used to calculate the GDD5. For the small changes shown here, we do not expect GDD5 to impose more limitations for the LGM than for the present for tree growth.
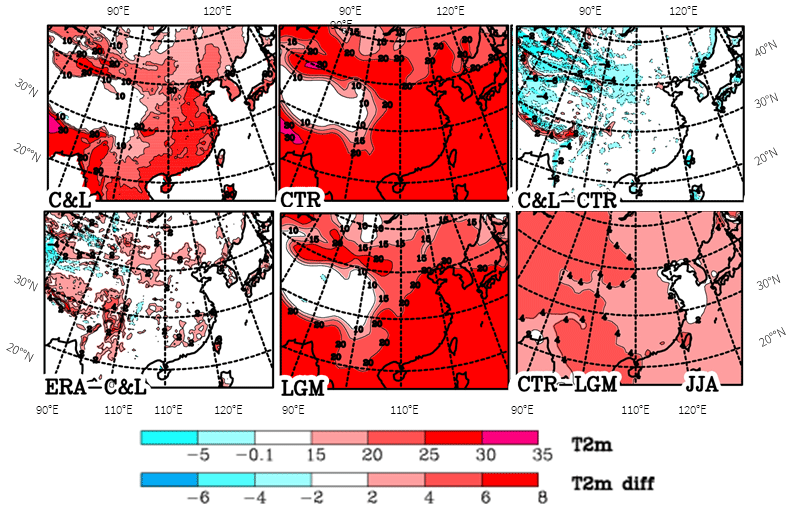
Figure 3Climatological mean distribution of temperature (T2m; ∘C) over eastern Asia for June, July and August (JJA). Values by Leemans and Cramer (1991) (C&L), the ECMWF reanalysis (ERA-Interim) and model simulations (CTR and LGM), as well as some differences between them.
The difference maps for CTR–LGM temperatures show values over the ocean (Figs. 1 to 3). These differences may have an important impact on continental temperatures. Therefore, it is interesting to compare these data with other estimates of the SST. For example, Annan and Hargreaves (2013) show annual means of SST differences of around 2 ∘C for the South China Sea, while our simulations have slightly larger values of 2.5 to 3 ∘C, though this falls within the uncertainty range given by Annan and Hargreaves (2013). A main difference is less cooling during the LGM in our estimates at the Gulf Stream and Kuroshio Current off the US and Japanese coasts (not shown as they are too far outside the area of interest).
Summer precipitation is an important limiting factor for possible tree growth (Fig. 4). The sharp gradient of precipitation along the southern slopes of the Himalayas in the three sets of analyses (the climatology by C&L and the long-term means from ERA-Interim and GPCC) is clearly marked. The general patterns agree in the three sets, though with some biases. C&L and GPCC agree best, probably because they are both based on precipitation observations at gauges. In contrast, ERA-Interim is a model product forced by a very large range and more evenly distributed observations; moreover, ERA-Interim does not use observed gauge precipitation. Differences between C&L and GPCC are mostly below 50 mm, especially in the northern areas where precipitation is moderate. The differences between C&L and ERA-Interim are also small in northern areas but can become quite large where the amounts of precipitation are large, mostly with ERA-Interim having larger precipitation amounts. The lower precipitation rates in ERA-Interim for Korea and southern Japan in contrast to C&L and GPCC are remarkable. Here the latter data are probably more accurate because this area is well-covered by observations (Fig. S2.3) and the ERA-Interim model may not be able to resolve the strong topographic structures. Many of the large uncertainties are probably due to the strong topographic structures over eastern Asia, which makes an analysis difficult and which is enhanced by a low density of observational sites over western China (more information on precipitation accuracy is presented in Sect. S2).
The systematic error of the model concerning China is due to the monsoon front being too far north by 2∘ of latitude (Fig. S1.2) and with a northward propagation too early in the season (Sect. S1). As we only use the differences between the present and LGM this systematic error is assumed to have only a minor impact on our results. Tian and Jiang (2016) found a general weakening of the summer monsoon in PMIP3 simulations, especially a decrease in precipitation in most of the simulations, but they do not go into the details shown in Sect. S1, which makes a comparison difficult. However, they noticed a large variability within the models. For the area used in Fig. S1.2, they show a decrease of 10 %–20 % in summer precipitation in the LGM compared to the control, which agrees with our simulation; it is strongest in June south of 32∘ N, though both CTR and LGM are too strong compared to ERA-Interim. In our simulation, the strengthening of precipitation and 850 hPa wind north of 32∘ N for March to August in the CTR and LGM simulations is stronger compared to ERA-Interim. This systematic error is assumed to have only a minor impact on our results. Indeed, most of the differences turn out to be less important for further use in this study, except higher precipitation over western China at 37∘ N on the northern slope of the Kunlun Shan in the C&L dataset, which is investigated in more detail in Sect. S2. Also in the area 105∘–110∘ E, 35∘–40∘ N, the drop in precipitation during the LGM may be important, as discussed below in Sect. 6.
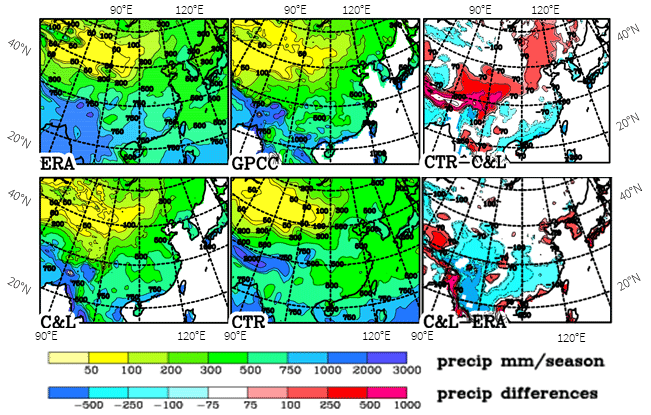
Figure 4Summer (JJA) precipitation over eastern Asia as analysed by Leemans and Cramer (1991) (C&L), ERA-Interim and GPCC and as simulated for the present (CTR). Differences between the various fields are shown. Units: millimetres per season.
Below we will concentrate on summer precipitation because that is the time when plants need water most. Other scientists use the annual mean precipitation as a limiting factor (e.g. Tian et al., 2016). When comparing the analyses with the model simulations for the present (CTR), one finds that the model fits the GPCC best and ERA-Interim least (Fig. 4) away from high mountain ranges where agreement between the different precipitation climatologies is very low. The amounts of precipitation in ERA-Interim are higher on a large scale than the others. For most of China south of 35∘ N, the precipitation in ERA-Interim is much lower than in the other climatologies. The belt with stronger precipitation at 25 to 35∘ N in CTR is assigned in Sect. S1 to an earlier northward propagation of the monsoon front in CTR compared to ERA-Interim that is weakened from the CTR to LGM, which results in a belt of largest differences between the present and the LGM of up to 150 mm (Fig. 5). Kim et al. (2008) found similar differences in their higher-resolution simulation, though spreading further north. In Sect. S1, it is shown that the monsoon, as represented by the wind direction, does not change much over the continent between the present and the LGM, and with the monsoon front propagating northward already in June the wind speeds increase. This is somewhat in contrast to results by Jiang and Lang (2010), who showed a reduction of the JJA wind speeds for the ensemble mean of model simulations (all with a much lower horizontal resolution than the one used here). The lower JJA precipitation during the LGM may also result from lower temperatures during the LGM when the atmosphere can carry only a lower amount of water vapour.
While Tian and Jiang (2016) found a general decrease in precipitation in PMIP3 simulations, we find it only for a belt at 29–36∘ N where the model already shows values that are too large for the present (CTR–C&L in Fig. 4).
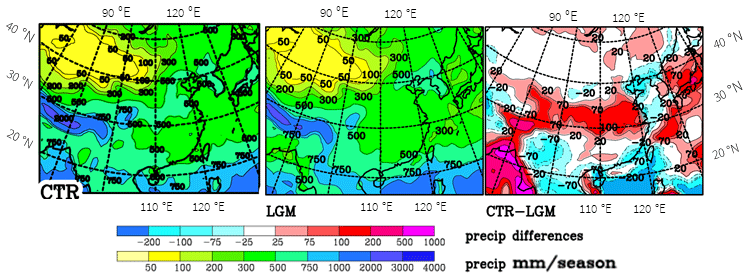
Figure 5Summer (JJA) precipitation simulated for eastern Asia and differences between CTR and LGM. Units: millimetres per season.
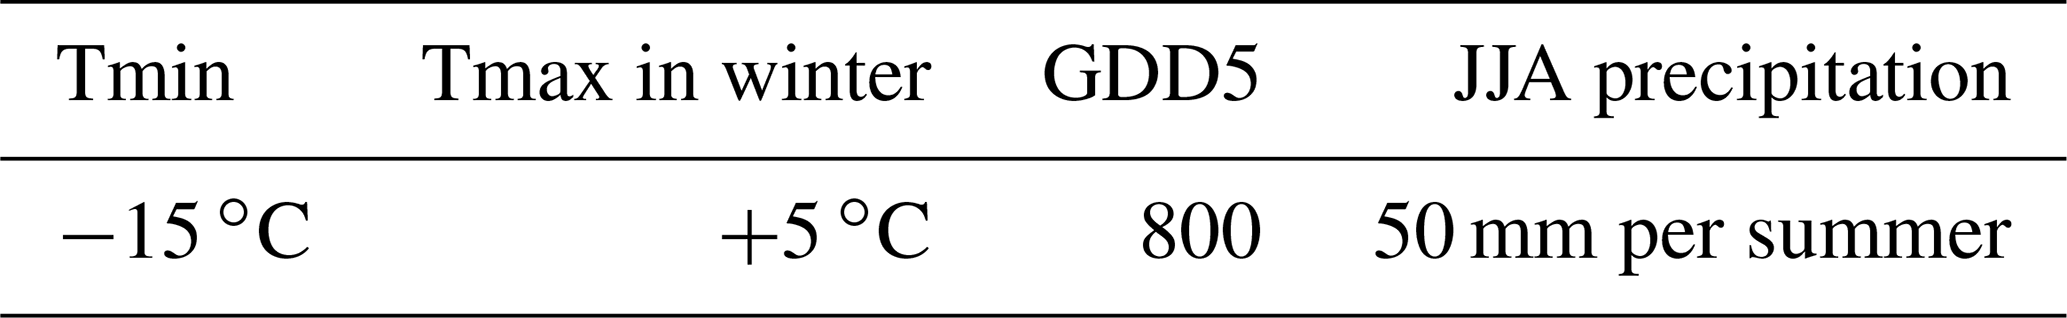
In Leroy and Arpe (2007) and Arpe et al. (2011), climatic data were combined to find the areas where temperate deciduous trees could survive due to limiting criteria and then compared with palaeo-data for such trees for Europe. The same method is now applied for eastern Asia. Europe is limited to the south by steppe and by the Mediterranean Sea. However, in eastern Asia, a vast subtropical area with deciduous temperate trees mixed with conifers and broadleaved evergreens (i.e. between biomes TEDE and WTEM of Ni et al., 2010) lies south of the temperate deciduous forest (Qiu et al., 2011). It was therefore essential to add a climatic limit to separate these two main vegetation types. In addition to the limits used for Europe, we add also a maximal winter temperature (Tmax), which the climatological temperature must fall below to allow deciduous trees to grow but not evergreen trees, as suggested by Sitch et al. (2003) and Roche et al. (2007) (Table 1). Sitch et al. (2003) require a less strong limit of −17 ∘C minimum temperature and +15.5 ∘C maximum temperature in the coldest month for temperate deciduous trees, but only for very few sites would such a relaxation of limits decrease the number of sites that fail the comparison with the climatological estimate. Roche et al. (2007) used Tmin ∘C and Tmax of +5 ∘C for temperate broadleaf forest. We regard a Tmin limit of −2 ∘C as only valid for warm-weather deciduous trees.
Table 1Limiting factors for temperate deciduous tree growth used in this study. Tmin: minimum temperature of the coldest month, Tmax: maximum temperature of the coldest month, GDD5: growing degree days for which the excess over 5 ∘C is accumulated for each day, JJA precipitation: accumulated summer precipitation.
When combining these limits with the climate data we arrive at the distribution shown in Fig. 6.
Only very few stations with observed pollen are outside (not within a distance of approximately three grid points, i.e. ∼150 km radius) the area of possible tree growth according to our criteria (filled markers; see also Table 2a and b for the LGM). For the present, 13 out of 380 stations with observed deciduous tree pollen do not fit the climate data for the present, most because of winter temperatures that are too cold (−20 to −23 ∘C), one (at 91∘ E, 31∘ N) because of a short summer (GDD5 < 600), two (both at 109∘ E, 18∘ N) because of winter temperatures that are too warm (>17 ∘C), and one (77∘ E, 37∘ N) because of a lack of summer precipitation and winter temperatures that are too cold, though these are near the given limits. South-eastern Japan is often too warm in winter for deciduous trees, though there are many observations in that area. These stations are, however, within three grid points of areas that are marked as suitable for their growth.
In Fig. 6 for the present, two areas marked by red ovals in western China at latitude 37∘ N indicate possible tree growth according to the climatic data, in which the precipitation in the C&L climatology (Fig. 4) exceeds that in ERA-Interim and GPCC considerably. Also, ERA-Interim and GPCC show relative maxima at 37∘ N in that area but shifted by 5∘ to the east. We believe that the precipitation from C&L is deficient here, as explained in Sect. S2.
In the South China Sea around 120∘ E, 28∘ N only one marker with observed tree pollen for the LGM is shown in Fig. 6, although around that position four cores are available (see Table 2 for details). All four observations agree with the possibility of trees according to the climate estimate. Because of the use of marine sediment, pollen must have been transported from the land, which is further discussed in the next section.
In eastern Asia, some species might have evolved which are hardier than those of the same genus present in Europe. Fang et al. (2009) show Ulmus pumila, a species that can withstand drought and extremely cold temperatures in winter (Solla et al., 2005), over large areas of northern China and SE Siberia. Ulmus has the most failures in our comparison with model data. Fang et al. (2009) show a wide spread of Tilia amurensis in NE China, SE Siberia and N Korea, which is also absent from Europe. This tree, like the elm, is extremely frost-hardy (Piggott, 2012).
A total of 35 pollen sites for the LGM were used (Table 2). There is a good overall fit between the climate data and the LGM pollen data. In Fig. 6b, only two filled markers not agreeing with climate data are found on the continent. The site of Huguangyan in the south has winter temperatures higher than 10 ∘C, which are too high for deciduous trees. In north-west China in the Tarim basin is another filled marker. The observation consists of only 1 % pollen for Ulmus. There, the winter temperatures are −17 ∘C, just outside the limit used here (Table 1) but within the limits suggested by Sitch et al. (2003). On Hokkaido a filled marker indicates disagreement between climate and pollen observations, but it is only slightly too cold in winter (−15.7 ∘C).
Four cores in the deep ocean in the South China Sea are marked in Table 2 and Fig. 6 as not agreeing with our given limits when using the downscaled climate data, but because of the deep sea the pollen must have been transported there. From Fig. 7, it can be concluded that the pollen could only have come with the north-easterly 10 m wind from Taiwan where Quercus was also found during the LGM (Table 2). As the present blooming period for Quercus variabilis, a widespread species of the deciduous forest, is January to March in Taiwan (Liao, 1996), the winds during March are shown in Fig. 7, assuming a slightly later blooming period during the cooler LGM than at present, though the wind fields for March and February are hardly different. When taking the wind at a higher level (850 hPa or around 1500 m), the wind is blowing more from the east in accordance with the Ekman spiral in the atmospheric boundary layer. Therefore, pollen must have travelled near the surface when coming from Taiwan or, if it arrived at higher levels, it may have come from the Philippines (Luzon); that, however, seems to be too far south for deciduous oak and, moreover, this area is not suggested in our estimate as having possible deciduous tree growth (Fig. 6).
Thus, the area boundaries for the present and for the LGM are only slightly different, with a shift for the LGM by 2 to 3∘ to the south of both the northern and southern limits, as well as an eastward shift of the western boundary. In northern China, Korea and north Japan (Hokkaido), differences result mainly from the winter minimum temperatures, as can be seen from Fig. 1 in which winter temperatures drop by more than 6 ∘C from the present to the LGM.
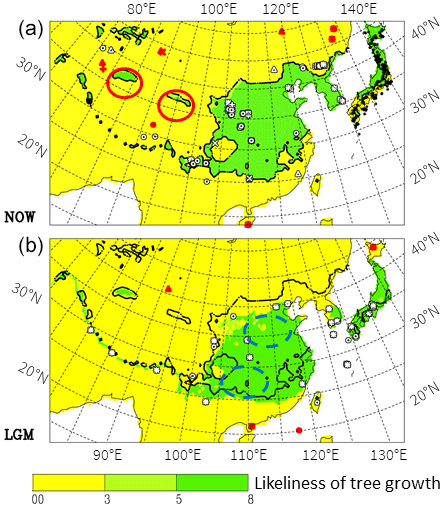
Figure 6Possible tree growth according to our limitations given in Table 1. Darker colours (green) mean that the climate data suggest possible tree growth. For easier comparison between the present (a) and the LGM (b), the limits for the present are copied as a solid line into the LGM panel. Markers indicate where and which tree pollen of deciduous trees are found. Markers: circles – Quercus, squares – Tilia, triangles – Ulmus, plus – Juglans and stars – more than one taxon. For modern-day sites in Japan only dots are used for clarity of the plot. Open markers indicate that, at least within a distance of approximately three grid points (∼150 km radius), the climate data suggest possible tree growth; otherwise, filled (red) markers are used. Red and blue (dashed) ovals show areas of interest mentioned in the text.
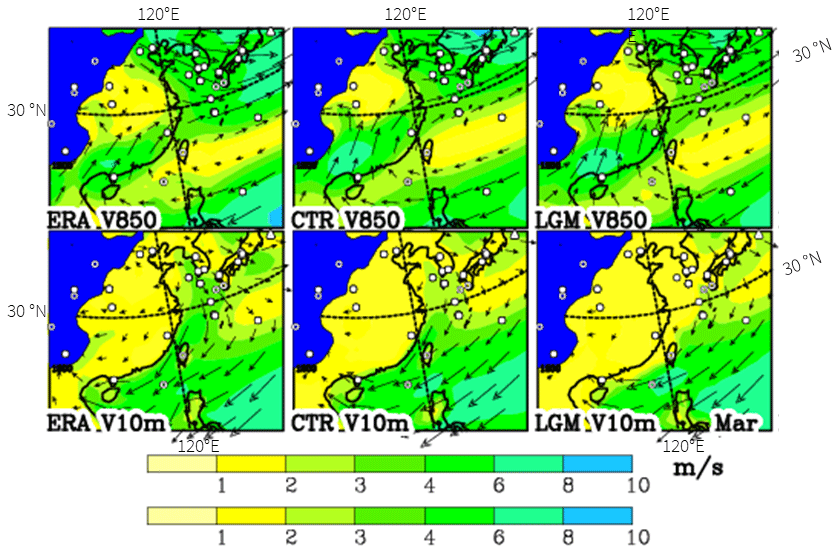
Figure 7Winds at 10 m (V10m) and at 850 hPa (V850) for March as analysed (ERA-Interim) and simulated for the present (CTR) and LGM. All panels show the prevailing north-easterlies. Areas with topography above the 850 hPa level are shaded in blue. Observational sites for the LGM are indicated by markers.
Table 2Selected sites with observed pollen during the LGM. Quercus includes deciduous Quercus and Lepidobalanus; Ulmus includes Ulmus–Zelkova; and “others” include Carya, Tilia and Carpinus. “Agree” means that the observations agree with our estimates of possible tree growth as shown in Fig. 6 or 8.
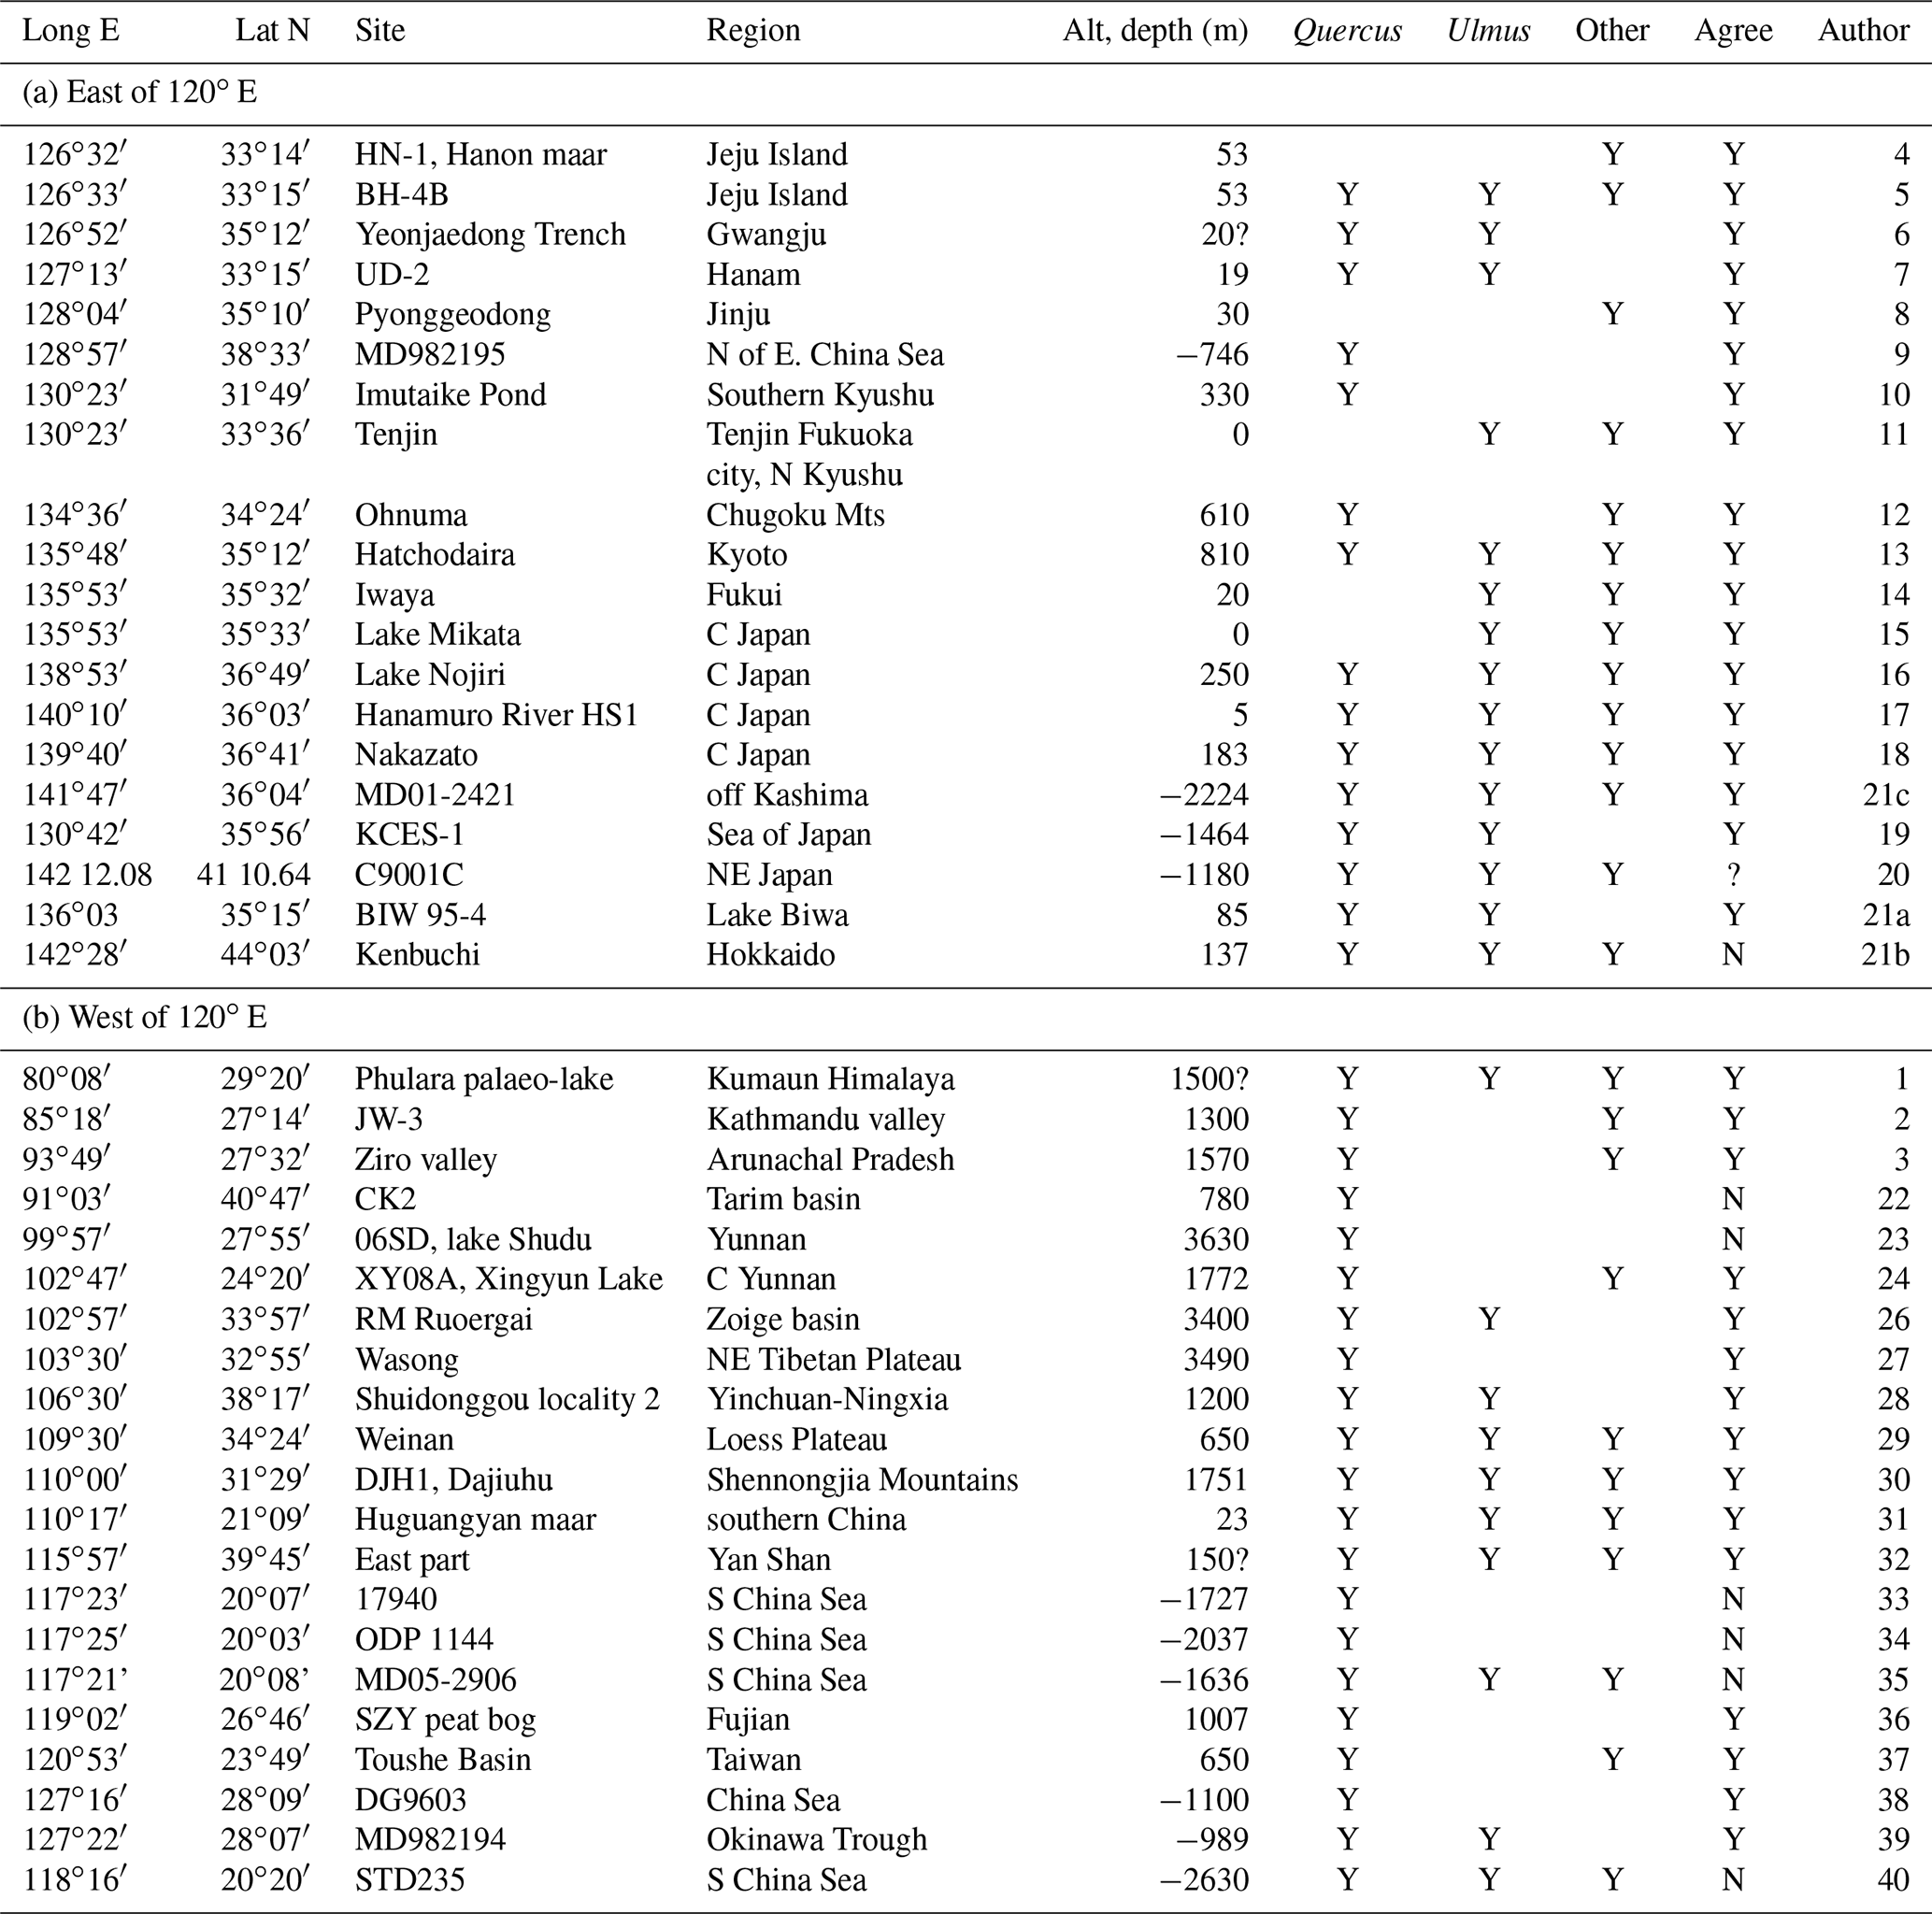
Authors: 1: Kotlia et al. (2010); 2: Fuji and Sakai (2002); 3: Bhattacharyya et al. (2014); 4: Park and Park (2015); 5: Chung (2007); 6: Chung et al. (2010); 7: Yi and Kim (2010); 8: Chung et al. (2006); 9: Kawahata and Ohshima (2004); 10: Shimada et al. (2014); 11: Kuroda and Ota (1978); 12: Miyoshi and Yano (1986); 13: Takahara and Takeoka (1986); 14: Takahara and Takeoka (1992); 15: Nakagawa et al. (2002); 16: Kumon et al. (2003); 17: Momohara et al. (2016); 18: Nishiuchi et al. (2017); 19: Chen et al. (2016); 20: Sugaya et al. (2016); 21a: Hayashi et al. (2010); 21b: Igaraachi and Zarov (2011); 21c Igarachi (2009); 22: Yang et al. (2013); 23: Cook et al. (2011); 24: Chen et al. (2014) and Chen et al. (2015) IPS abstract; 26: Shen et al. (2005); 27: Yan et al. (1999); 28: Liu et al. (2011); 29: Sun et al. (1996); 30: Li et al. (2013); 31: Wang et al. (2012), Lu et al. (2003); 32: Xu et al. (2002); 33: Sun and Li (1999); Sun et al. (2000); 34: Sun et al. (2003); 35: Dai et al. (2015); 36: Yue et al. (2012); 37: Liew et al. (2006); 38: Xu et al. (2010); 39: Zheng et al. (2013); 40: Yu et al. (2017).
The downscaling method used here does not allow us to present values over the emerged shelf of the Yellow Sea during the LGM, when the mean sea level was 120 m below the present one (Lambeck et al., 2014). Therefore, in Fig. 8, the possible tree distribution is shown using model data without downscaling, when the high spatial resolution is lost and more impacts from systematic errors of the model may be expected. However, fortunately, such impacts can hardly be seen when comparing Fig. 6 with Fig. 8, except for the present along the southern slopes of the Himalayas and the southern border of possible tree growth, where T2m from C&L is lower than that of CTR (also than that from ERA-Interim), leading to a better fit with pollen data when using T2m from C&L.
The results show two areas worth discussing in terms of population connectivity: one is over the Yellow Sea emerged shelf and one along the south of the Himalayan range.
The northern limit of temperate deciduous trees assumed by previous research (Harrison et al., 2001, their Fig. 1) is much further south (30–35∘ N) than what is found here. Therefore, population connectivity over the shelf was rejected by Harrison et al. (2001). It should be mentioned that the results by Harrison et al. (2001) were based on the model available at that time, which had a lower resolution and was also based on observational data available at that time; these have improved considerably since then. Indeed, 80 % of the sites used in the current investigation were published post-2001. Moreover, the Harrison et al. (2001) study is based on biomes, not tree occurrences. Three arguments can be presented now to support this connectivity.
Firstly, the model results clearly show the connectivity of tree populations between China, Korea and Japan during the LGM over the emerged shelf. This connectivity takes place because the limit for possible tree growth in our investigation (darker areas in Fig. 8 and Fig. 6) still reaches quite far north (40∘ N), which is in accordance with pollen data.
A second argument is the presence of deciduous trees at sites located around the shelf in amounts suggesting more than a simple tree presence, perhaps even woodlands or forests. In several places around the emerged shelf the percentages of temperate deciduous trees indeed exceed 10%. These include the Yeonjaedong swamp in Korea, with 20 %–30 % deciduous Quercus and 7 %–20 % Ulmus–Zelkova (Chung et al., 2010), the two sites at the Jeju Island maar lake (Chung, 2007; Park and Park, 2015), the Tenjin peatland in Japan, with 12 % deciduous Quercus, 8 % Carpinus and 2.5 % Tilia (Kuroda and Ota, 1978), and the marine cores DG9603 and MD982194, with 15 % deciduous Quercus (Xu et al., 2010).
Thirdly, information derived from recent phylogenetic investigations is supportive of the occurrence of deciduous trees on the emerged shelf. For example, the phylogeography of one of the most widely distributed deciduous species in eastern Asia, the oak Quercus variabilis, clearly suggests the occurrence of land bridges over the East China Sea (Chen et al., 2012). Around the East China Sea, other phylogenetic data indicate both mixing and the absence of mixing between populations depending on plant type (Qi et al., 2014). The occurrence of mixing indicates that contacts were possible across the emerged shelf (e.g. Tian et al., 2016); while the absence of mixing for other species indicates that not all species mixed, it certainly does not suggest a total absence of migration for other species. It appears, therefore, that the East China Sea acted as a filter, letting some through but not others (Qi et al., 2014).
The eastern Asian case is very different from Europe, where fragmentation is the rule in the LGM. In Europe (Fig. 2), the temperatures were much lower than at present (8 to 15 ∘C) compared to eastern Asia (3 to 5 ∘C), and therefore the shift of possible temperate deciduous tree growth is much smaller in eastern Asia than in Europe. Phylogenetic results in eastern Asia are indeed in favour of the hypothesis of species surviving both in the north and the south of China (Qian and Ricklefs, 2000) and not of species surviving only in the south (Harrison et al., 2001). The basic expansion–contraction model of vegetation belts in Europe was much less important in eastern Asia (Qiu et al., 2011) due to the smaller Asian ice cap and different topography (López-Pujol et al., 2011). Eastern Asian biodiversity was therefore preserved across the Ice Ages, owing not only to the more moderate lowering of temperatures but also to the better connectivity between populations.
One remaining question is whether the pollen found in the emerged shelf of the Yellow Sea is produced locally or remotely. According to the Harrison et al. (2001) study, these pollen grains must have come from the southern part of China. Yu et al. (2004) have tried to calculate such long-distance transports. For Quercus and Ulmus they found transports of up to 6∘ latitude–longitude in any direction. This would be too short for transport from China south of 30∘ S. Also, the high pollen percentages at the observed sites speak against such long-distance transport.
We are not convinced that the Yu et al. (2004) calculations are robust enough to use their results in our investigation, especially as their Fig. 3 does not agree with plant distributions by Fang et al. (2009). Therefore, the wind fields for the present as analysed by the ECMWF (ERA-Interim) and as simulated by our model for the LGM were investigated. In Sect. S1 and in Fig. 7, it is shown that ERA-Interim and the simulation for the present agree quite well, at least for the wind directions, which makes us confident that we can use the model simulations for the LGM.
The winds at 10 m and 850 hPa for March, a central month for the blooming of Quercus variabilis, are shown in Fig. 7 for the present (ERA-Interim), the CTR and the LGM. Over the emerged shelf of the Yellow Sea, the 10 m winds are very light from the north-west during the LGM (much stronger in ERA-Interim because of the lower surface friction over the sea). For the higher level of 850 hPa, all datasets show very similar distributions, all with north-westerlies. Long-distance transport of deciduous tree pollen would have come from NE China, an area that Harrison et al. (2001) assume to be void of deciduous trees, though some recent studies (including the present one) indicate the opposite (Yu et al., 2004). Further on in the year, the 850 hPa winds blow from the south-west, starting in April and fully crossing the 30∘ N latitude in May (similar to CTR in Fig. S1.1), i.e. transport from mainland China would have been possible though a little late for the main blooming of deciduous oak. In Sect. S1, it is shown for the present that the simulations suffer from a progression of the monsoon front that is too early, which suggests that the turn of the wind to south-westerlies may have also occurred later for the LGM, thus leading to less likely transport from mainland China.
The source for the pollen found in the emerged Yellow Sea is not completely clear, but May is late for the blooming season in central China (for Taiwan it is January to March). Therefore, local production or transport from northern China is more likely, supporting our argument that the emerged Yellow Sea was occupied by deciduous trees during the LGM, as indicated by Fig. 8.
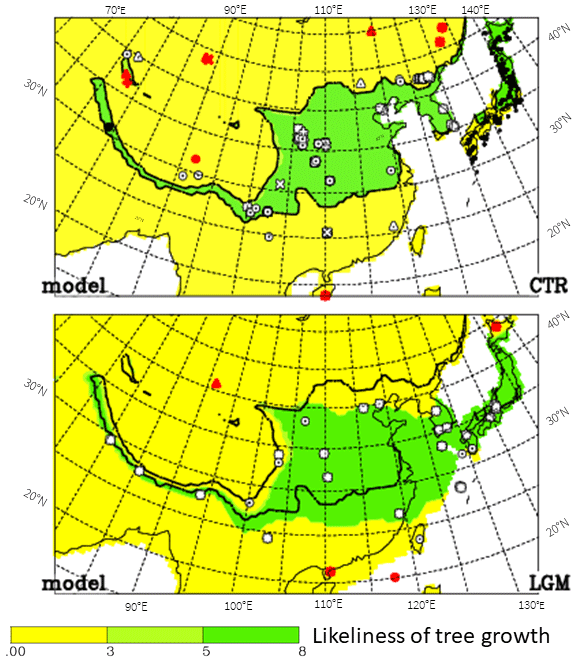
Figure 8Same as Fig. 6 using model data without downscaling. The Yellow Sea is shown as land in the LGM.
Another important population connectivity result is that the Himalayas were more favourable to temperate deciduous trees in the LGM and provided the possibility of a quasi-continuous band of temperate forest at its southern slope, which is beneficial for the spreading and diffusion of genes (e.g. for Chinese mole shrew, He et al., 2016), more so than in the present (Fig. 6). Three observational sites that are currently available support this chain of possible tree growth during the LGM. For the present, this link does not exist because of winter temperatures that are too warm (warmer than 5 ∘C in the C&L climatology). Along the slopes of the high Himalayas it is most likely that there is a level at which the temperature would be below 5 ∘C (an issue which needs further investigation).
Two significant cases occur in which population connectivity was higher, indicating less population fragmentation, in glacial than in interglacial periods. So, it appears that many tree populations currently live in interglacial refugia.
During the LGM the precipitation and temperature were lower than at present, but which was more important for tree growth cannot be said with certainty. Tian et al. (2016) stated that “annual precipitation is considered as the most important determinant”, and in our study we have some indication to agree with that. In Figs. 6 and 8, there is a cluster of pollen findings over central China (105–110∘ E, 35–40∘ N) for the present but not for the LGM. In this area the temperature does not change much (Figs. 2 and 3), but the summer precipitation decreases substantially (Fig. 5). This change is only slightly reflected by the boundaries of possible tree growth in Fig. 6 (north of 40∘ N). The lack of observational sites with tree pollen is not proof because it could be due to many reasons, but the massive change in occurrence is suggestive that we should have perhaps increased summer precipitation requirements for tree growth (Table 1). This can, however, also indicate reduced water use efficiency of the trees during the LGM due to lower atmospheric CO2.
Finally, this investigation shows that the model simulations suggest possible tree growth where pollen grains of such trees are found. This leads to the possibility of using the model data to fill gaps between observational sites by way of maps. Such gaps especially occur around 30–37∘ N, 105–120∘ E and 25–30∘ N, 110–115∘ E, i.e. the provinces Hupeh to Kiangsu and Hunan (ovals in Fig. 6b).
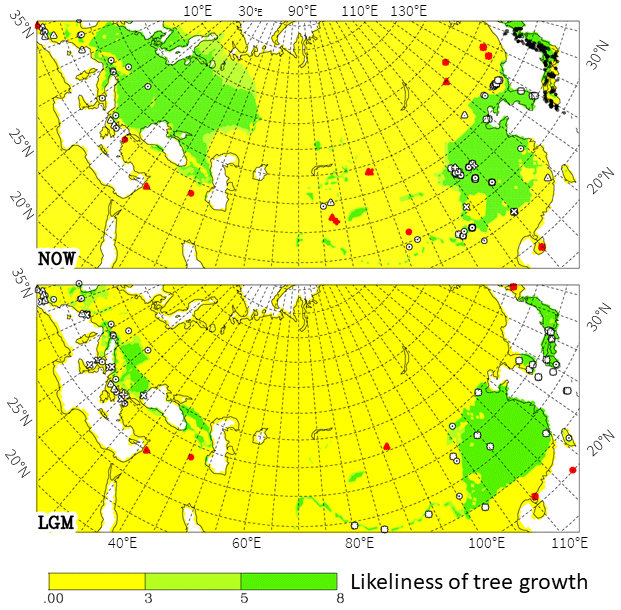
Figure 9Same as Fig. 6 for the whole of Eurasia. Pollen data for Europe have been described by Arpe et al. (2011). Darker colours (green) are areas in which trees are able to grow according to model data. Lighter green indicates areas where not all criteria are completely fulfilled.
By extending the view of our investigation to the whole of Eurasia (Fig. 9), a stronger link between China and Europe is shown during the LGM than at present. Along the foot of the Himalayas, a continuum existed, but westwards of it, a gap north of Afghanistan (probably going back to the Tertiary) is still maintained, inhibiting a total link across Eurasia. This continuum is broken for the present climate by model results because winter temperatures exceed 7 ∘C, hence being too warm for temperate deciduous trees.
Generally, the estimates of possible temperate deciduous tree growth in the LGM in eastern Asia from model simulations agree with fossil pollen observations. Therefore, the model estimates can fill the areas without observations. The results in the form of LGM distribution maps are considered robust enough, as model simulations for the present are within the range of climate estimates. Nevertheless, we are aware of some uncertainties in the climate of eastern Asia, and we can safely say they are not a limitation of this study.
During the LGM, major connectivities between populations are found, which is in agreement with observations, i.e. less tree population fragmentation. This is especially visible in two places. Firstly, the link between China, Korea and Japan is clear. Sufficient new pollen studies around and on the emerged Yellow Sea shelf are now available, confirming the results of the model. They suggest the presence of temperate deciduous trees, perhaps even woodlands, in the area.
Secondly, connectivity during the glacial period occurred at the southern slope of the Himalayan chain, favouring genetic flow in interglacial refugia. Currently, this link does not exist because of winter temperatures there that are too warm. Our simulations cannot be taken as proof of this hypothesis, as one cannot imagine that along the Himalayan chain there would not be a level at which winter temperatures do not exceed 5 ∘C, also for the present day; a higher-resolution dataset would be able to show how wide and continuous such a corridor of possible tree growth would be in the present.
Another outcome of this research is the contribution to the conservation agenda (López-Pujol et al., 2001). The areas of LGM refugia often match areas of present hotspots of biodiversity. Hence, the distribution of temperate forest obtained in our investigation can serve as a guide to establish nature parks for plants and animals. Moreover, the difference between the LGM and present distribution contributes to the understanding of the rate of distribution change (as well as genetic flow), which is important to monitor in light of possible climatic change.
The model version is already widely known and available. We have clearly described what has been done, and the follow-up programmes are written in Fortran. This can be requested from Klaus Arpe if wanted.
Table 2 provides a list of all observational sites and observational tree pollen data. Most of the other data are referred to by giving the website. It does not seem feasible to provide the model simulation data in a simple way. They can be obtained from Klaus Arpe in GRIB format.
The supplement related to this article is available online at: https://doi.org/10.5194/cp-16-2039-2020-supplement.
SAGL looked after conceptual issues, collected the data and wrote the paper. KA wrote most of the paper, prepared the figures, and was responsible for meteorological and climatological issues. UM provided the model simulations. JW provided observational tree pollen data. SAGL was responsible for the overall research and collected the pollen data with help from JW. KA was responsible for the meteorology and climatology aspects as well as most of the programming and writing the paper. UM provided the climate model simulations, and JW contributed to the data search and Chinese aspects.
The authors declare that they have no conflict of interest.
Jing Zheng (Fujian Agriculture and Forestry University) started collecting the LGM data during a post-doctoral stay with Suzanne Leroy at Brunel University, London. Uwe Mikolajewicz acknowledges funding from the German Federal Ministry of Education and Research within the research framework for sustainable development (FONA3, FKZ 01LP1502A).
The article processing charges for this open-access publication were covered by the Max Planck Society.
This paper was edited by Helen McGregor and reviewed by two anonymous referees.
Annan, J. D. and Hargreaves, J. C.: A new global reconstruction of temperature changes at the Last Glacial Maximum, Clim. Past, 9, 367–376, https://doi.org/10.5194/cp-9-367-2013, 2013.
Arpe, K., Leroy, S. A. G., and Mikolajewicz, U.: A comparison of climate simulations for the last glacial maximum with three different versions of the ECHAM model and implications for summer-green tree refugia, Clim. Past, 7, 91–114, https://doi.org/10.5194/cp-7-91-2011, 2011.
Becker, A., Finger, P., Meyer-Christoffer, A., Rudolf, B., Schamm, K., Schneider, U., and Ziese, M.: A description of the global land-surface precipitation data products of the Global Precipitation Climatology Centre with sample applications including centennial (trend) analysis from 1901–present, Earth Syst. Sci. Data, 5, 71–99, https://doi.org/10.5194/essd-5-71-2013, 2013.
Bhattacharyya, A., Mehrotra, N., Shah, S. K., Basavaiah, N., Chaudhary, V., Singh, I. B., and Singh, I. B.: Analysis of vegetation and climate change during Late Pleistocene from Ziro Valley, Arunachal Pradesh, Eastern Himalaya region, Quaternary Sci. Rev., 101, 111–123, 2014.
Braconnot, P., Otto-Bliesner, B., Harrison, S., Joussaume, S., Peterchmitt, J.-Y., Abe-Ouchi, A., Crucifix, M., Driesschaert, E., Fichefet, Th., Hewitt, C. D., Kageyama, M., Kitoh, A., Laîné, A., Loutre, M.-F., Marti, O., Merkel, U., Ramstein, G., Valdes, P., Weber, S. L., Yu, Y., and Zhao, Y.: Results of PMIP2 coupled simulations of the Mid-Holocene and Last Glacial Maximum – Part 1: experiments and large-scale features, Clim. Past, 3, 261–277, https://doi.org/10.5194/cp-3-261-2007, 2007.
Cao, X., Ni, J., Herzschuh, U., Wang, Y., and Zhao, Y.: A late Quaternary pollen dataset from eastern continental Asia for vegetation and climate reconstructions: Set up and evaluation, Palaeobot. Palyno., 194, 21–37, 2013.
Chen, D., Zhang, X., Kang, H., Sun X., Yin S., Du, H., Yamanaka, N., Gapare, W., Wu, H. X. and Li, C.: Phylogeography of Quercus variabilis Based on Chloroplast DNA Sequence in East Asia: Multiple Glacial Refugia and Mainland-Migrated Island Populations, PloS One, 7, e47268, https://doi.org/10.1371/journal.pone.0047268, 2012.
Chen, J., Liu, Y., Shi, X., Bong-Chool, S., Zou, J., and Yao, Z.: Climate and environmental changes for the past 44 ka clarified in the Ulleung Basin, East Sea (Japan Sea), Quaternary Int., 402, 73–80, 2016,
Chen, W.-Y., Su, T., Adams, J. M., Jacques, F. M. B., Ferguson, D. K., and Zhou, Z.-K: Large-scale dataset from China gives new insights into leaf margin–temperature relationships, Palaeogeogr. Palaeoclim., 402, 73–80, 2014.
Chen, X. M., Chen, F., Zhou, A., Wu, D., Chen, J., and Huang, X.: Vegetation history, climatic changes and Indian summer monsoon evolution during the last 36400 years documented from sediments of Xingyun Lake, south-west China, 13th International Paleolimnological Symposium, Lanzhou, China, 4–7 August 2015, volume of abstracts, 162–163, 2015.
Chung, C.-H.: Vegetation response to climate change on Jeju Island, South Korea, during the last deglaciation based on pollen record, Geosci. J., 11, 147–155, 2007.
Chung, C.-H., Lim, H. S., and Yoon, H. I.: Vegetation and climate changes during the Late Pleistocene to Holocene inferred from pollen record in Jinju area, South Korea, Geosci. J., 10, 423–431, 2006.
Chung, C.-H., Lim, H. S., and Lee, H. J.: Vegetation and climate history during the late Pleistocene and early Holocene inferred from pollen record in Gwangju area, South Korea, Quaternary Int., 227, 61–67, 2010.
CLIMAP: Seasonal reconstructions of the Earth's surface at the last glacial maximum, Geological Society of America, Map Chart Ser., MC-36, 1981.
Cook, C. G., Jones, R. T., Langdon, P. G., Leng, M. G., and Zhang, E: New insights on Late Quaternary Asian palaeomonsoon variability and the timing of the Last Glacial Maximum in southwestern China, Quaternary Sci. Rev., 30, 808–820, 2011
Cramer, W.: The climate data base of monthly normal for globally gridded climate variables, available at: http://www.pik-potsdam.de/~cramer/climate.html (last access: 28 October 2020), 1996.
Dai, L., Weng, C., and Limi, M.: Patterns of vegetation and climate change in the South China Sea during the last glaciation inferred from marine palynological records, Paleogeogr. Paleoclimatol. Paleoecol., 440, 249–258, 2015.
Dee, D. P., Uppala, S. M., Simmons, A. J., Berrisford, P., Poli, P., Kobayashi, S., Andrae, U., Balmaseda, M. A., Balsamo, G., Bauer, P., Bechtold, P., Beljaars, A. C. M., van de Berg, L., Bidlot, J., Bormann, N., Delsol, C., Dragani, R., Fuentes, M., Geer, A. J., Haimberger, L., Healy, S. B., Hersbach, H., Hólm, E.V., Isaksen, L., Kållberg, P., Köhler, M., Matricardi, M., McNally, A. P., Monge-Sanz, B. M., Morcrette, J.-J., Park, B.-K., Peubey, C., de Rosnay, P., Tavolato, C., Thépaut, J.-N., and Vitart, F: The ERA-Interim reanalysis: configuration and performance of the data assimilation system, Q. J. Roy. Meteorol. Soc., 137, 553–597, https://doi.org/10.1002/qj.828, 2011.
Donoghue, M. J. and Smith, S. A.: Patterns in the assembly of temperate forests around the Northern Hemisphere, Philos. Trans. R. Soc. Lond. B, 359, 1633–1644, 2004.
ECMWF: Climate reanalysis, ERA interim, synoptic monthly means, available at: https://apps.ecmwf.int/datasets/data/interim-full-mnth/levtype=sfc/, last access: 8 October 2019.
Fang, J., Wang, Z., and Tang, Z.: Atlas of woody plants in China, Higher Education Press, Beijing, pp. 2020, 2009.
Fuji, R. and Sakai, H.: Paleoclimatic changes during the last 2.5 myr recorded in the Kathmandu Basin, central Nepal Himalayas, J. Asian Earth Sci., 20, 255–266, 2002.
Gotanda, K. and Yasuda, Y.: Spatial biome changes in southwestern Japan since the Last Glacial Maximum, Quaternary Int., 184, 84–93, 2008.
Gotanda, K., Nakagawa, T., Tarasov, P., Kitagawa, J., Inoue, Y., and Yasuda, Y.: Biome classification from Japanese pollen data: application to modern-day and Late Quaternary samples, Quaternary Sci. Rev., 21, 647–657, 2002.
GPCC: download GPCC products, available at: ftp://ftp-anon.dwd.de/pub/data/gpcc/html/download_gate.html (last access: 1 December 2014), 2013.
Harrison, S. P., Yu, G., Takahara, H., and Prentice, I. C. : Diversity of temperate plants in east Asia, Nature, 413, 129–130, 2001.
Hayashi, R., Takahara, H., Hayashida, A., and Takemura, K.: Millennial-scale vegetation changes during the last 40,000 yr based on a pollen record from Lake Biwa, Japan, Quaternary Res., 74, 91–99, 2010.
He, K., Hu, N.-Q., Chen, X., Li, J.-T., and Jiang, X.-L. : Interglacial refugia preserved high genetic diversity of the Chinese mole shrew in the mountains of southwest China, Heredity, 116, 23–32, 2016.
Igarachi, Y.: Pollen record in core MD01-2421 off Kashima, North Pacific: correlation with the terrestrial polen record since MIS 6, J. Geol. Soc. Japan, 115, 357–366, 2009.
Igarachi, Y. and Zharov, A. E.: Climate and vegetation change during the late Pleistocene and early Holocene in Sakhalin and Hokkaido, northeast Asia, Quaternary Int., 237, 24–31, 2011.
Jiang, D. and Lang, X.: Last Glacial Maximum East Asian Monsoon: Results of PMIP Simulations, J. Climate, 23, 5030–5038, https://doi.org/10.1175/2010JCLI3526.1, 2010.
Kawahata, H. and Ohshima, H: Vegetation and environmental record in the northern East China Sea during the late Pleistocene, Global Planet Change, 41, 251–273, 2004.
Kim, S.-J., Crowley, T. J., Erickson, D. J., Govindasamy, B., Duffy, P. B., and Lee, B. Y.: High-resolution climate simulation of the last glacial maximum, Clim. Dynam., 31, 1–16, https://doi.org/10.1007/s00382-007-0332-z, 2008.
Kotlia, B. S., Sanwal, J., Phartiyal, B., Joshi, L., Trivedi, A., and Sharma, C.: Late Quaternary climatic changes in the eastern Kumaun Himalaya, India, as deduced from multi-proxy studies, Quaternary Int., 213, 44–55, 2010.
Kucera, M., Weinelt, M., Kiefer, T., Pflaumann, U., Hayes, A., Chen, M. T., Mix, A. C., Barrows, T. T., Cortijo, E., Duprat, J., Juggins, S., and Waelbroeck, C.: Reconstruction of Sea-Surface Temperatures from Assemblages of Planktonic Foraminifera: Multi-Technique Approach Based on Geographically Constrained Calibration Data Sets and Its Application to Glacial Atlantic and Paci?c Oceans, Quaternary Sci. Rev., 24, 951–998, 2005.
Kumon, F., Kawai, S., and Inouchi, Y.: Climate Changes between 25000 and 6000 yrs BP Deduced from TOC, TN, and Fossil Pollen Analyses of a Sediment Core from Lake Nojiri, Central Japan, The Quaternary Res., 42, 13–26, 2003.
Kuroda, T. and Ota, T.: Palynological study of the late Pleistocene and Holocene deposits of the Tenjin area, Fukuoka City, northern Kyushu, part 1, The Quaternary Res., 17, 1–14, 1978 (in Japanese with English summary).
Lambeck, K., Rouby, H., Purcell, A., Sun, Y., and Sambridge, M.: Sea level and global ice volumes from the Last Glacial Maximum to the Holocene, P. Natl. Acad. Sci., 111, 43, 15296–15303, 2014.
Leemans, R. and Cramer, W.: The IIASA database for mean monthly values of temperature, precipitation and cloudiness of a global terrestrial grid, International Institute (IIASA), RR-91-18, 1991.
Leroy, S. A. G.: Progress in palynology of the Gelasian-Calabrian Stages in Europe: ten messages, Rev. Micropaléontol., 50, 293–308, 2007.
Leroy, S. and Arpe, K.: Glacial refugia for summer-green trees in Europe and S-W Asia as proposed by ECHAM3 time slice atmospheric model simulations, J. Biogeogr., 34, 2115–2128, 2007.
Li, J. and Del Tredici, P.: The Chinese Parrotia: A Sibling Species of the Persian Parrotia, Arnoldia, 66, 2–9, 2008.
Li, J., Zheng, Z., Huang, K., Yang, S., Chase, B., Valsecchi, V., Carré, M., and Cheddadi, R.: Vegetation changes during the past 40,000 years in Central China from a long fossil record, Quaternary Int., 310, 221–226, 2013.
Liao, J. C.: Fagaceae, in: Flora of Taiwan. Volume 2. 2nd edition, edited by: Boufford, D. E., Hsieh, C. F., Huang, T. C., Ohashi, H., Yang, Y. P., and Lu, S. Y., Taipei, Taiwan: Editorial Committee of Flora of Taiwan, 114–115, 122, 1996.
Liew, P.-M., Huang, S.-Y., and Kuo, C.-M.: Pollen stratigraphy, vegetation and environment of the last glacial and Holocene – A record from Toushe Basin, central Taiwan, Quaternary Int., 147, 16–33, 2006.
Liu, D., Gao, X., Wang, X., Zhang, S., Pei, S., and Chen, F.: Palaeoenvironmental changes from sporopollen record during the later Late Pleistocene at Shuidonggou locality 2 in Yinchuan, Ningxia, J. Palaeogeography, 13, 467–472, 2011 (in Chinese with English abstract).
López-Pujol, J., Zhang, F.-M., Sun, H.-Q., Ying, T.-S., and Ge, S.: Mountains of southern China as “Plant Museums” and “Plant Craddles”: evolutionary and conservation insights, Mountain Res. Develop., 31, 261–269, 2011.
Lu, H.-Y., Liu, J.-Q., Chu, G.-Q., Gu, Z.-Y., Negendank, J., Schettler, G., and Mingram, J.: A study of pollen and environment in the Huguangyan maar lake since the last glaciation, Acta Palaeontol. Sinica, 42, 284–291, 2003.
Mikolajewicz, U., Vizcaino, M., Jungclaus, J., and Schurgers, G.: Effect of ice sheet interactions in anthropogenic climate change simulations, Geophys. Res. Lett., 34, L18706, https://doi.org/10.1029/2007GL031173, 2007.
Milne, R. I. and Abbott, R. J.: The Origin and Evolution of Tertiary Relict Floras, Adv. Bot. Res., 38, 281–314, 2002.
Mix, A. C., Bard, E., and Schneider, R.: Environmental processes of the ice age: land, oceans, glaciers (EPILOG), Quaternary Sci. Rev., 20, 627–657, 2001.
Miyoshi, N. and Yano, N.: Late Pleistocene and Holocene vegetation history of Ohnuma moor in the Chugoku Mountains, western Japan, Rev. Palaeobot. Palyno., 46, 355–376, 1986.
Molavi-Arabshahi, M., Arpe, K., and Leroy, S. A. G.: Precipitation and temperature of the south-west Caspian Sea region during the last 55 years, their trends and teleconnections with large-scale atmospheric phenomena, Int. J. Climatol., 36, 2156–2172, https://doi.org/10.1002/joc.4483, 2016.
Momohara, A., Yoshida, A., Kudo, Y., and Nishiuchi, Okitsu S.: Paleovegetation and climatic conditions in a refugium of temperate plants in central Japan in the Last Glacial Maximum, Quaternary Int., 425, 38–48, 2016.
Nakagawa, T., Tarasov, P. E., Nishida, K., Gotanda, K., and Yasuda, Y.: Quantitative pollen-based climate reconstruction in central Japan: application to surface and Late Quaternary spectra, Quaternary Sci. Rev., 21, 2099–2113, 2002.
Ni, J., Yu, G., Harrison, S. P., and Prentice, I. C.: Palaeovegetation in China during the late Quaternary: biome reconstructions based on a global scheme of plant functional types, Palaeogeogr. Palaeoclimatol. Palaeoecol., 289, 44–61, 2010.
Ni, J., Cao, X., Jeltsch, F., and Herzschuh, U.: Biome distribution over the last 22,000 yr in China, Palaeogeogr. Palaeocl., 409, 33–47, 2014.
Nishiuchi, R., Momohara, A., Osato, S., and Endo, K: Temperate deciduous broadleaf forest dynamics around the last glacial maximum in a hilly area in the northern Kanto district, central Japan, Quaternary Int., 455, 113–125, 2017.
Orain, R., Lebreton, V., Russo Ermolli, E., Combourieu-Nebout, N., and Sémah, A.-M.: Carya as marker for tree refuges in southern Italy (Boiano basin) at the Middle Pleistocene, Palaeogeogr. Palaeocl., 369, 295–302, 2013.
Park, J.: A modern pollen-temperature calibration data set from Korea and quantitative temperature reconstructions for the Holocene, The Holocene, 21, 1125–1135, 2011.
Park, J. and Park, J.: Pollen-based temperature reconstructions from Jeju island, South Korea and its implication for coastal climate of East Asia during the late Pleistocene and early Holocene, Palaeogeogr. Palaeocl., 417, 445–457, 2015.
Piggott, D.: Lime-trees and Basswoods: A Biological Monograph of the Genus Tilia, 395 pp., Cambridge University Press, Cambridge, UK, 2012.
Qi, X. S., Yuan, N., Comes, H. P., Sakaguchi, S., and Qiu, Y. X.: A strong `filter' effect of the East China Sea land bridge for East Asia's temperate plant species: inferences from molecular phylogeography and ecological niche modelling of Platycrater arguta (Hydrangeaceae), BMC Evolut. Biol., 14, 16 pp., 2014.
Qian, H. and Ricklefs, R. E.: Large-scale processes and the Asian bias in species diversity of temperate plants, Nature, 407, 180–182, 2000.
Qiu, Y. X., Fu, C. X., and Comes, H. P.: Plant molecular phylogeography in China and adjacent regions: Tracing the genetic imprints of Quaternary climate and environmental change in the world's most diverse temperate flora,. Mole. Phylog. Evolut., 59, 225–244, 2011.
Reichler, T. and Kim, J.: How Well do Coupled Models Simulate Today's Climate?, B. Am. Meteorol. Soc., 89, 303–311, 2008.
Roche, D. M., Dokken, T. M., Goosse, H., Renssen, H., and Weber, S. L.: Climate of the Last Glacial Maximum: sensitivity studies and model-data comparison with the LOVECLIM coupled model, Clim. Past, 3, 205–224, https://doi.org/10.5194/cp-3-205-2007, 2007.
Roeckner, E., Bäuml, G., Bonaventura, L., Brokopf, R., Esch, M., Giorgetta, M., Hagemann, S., Kirchner, I., Kornblueh, L., Manzini, E., Rhodin, A., Schlese, U., Schulzweida, U., and Tompkins, A.: The atmospheric general circulation model ECHAM5, Part I: Model description, Max Planck Institute for Meteorology, Hamburg, Report no. 349, 2003.
Schneider, U., Becker, A., Finger, P., Meyer-Christoffer, A., Rudolf, B., and Ziese, M.: GPCC Full Data Reanalysis Version 6.0 at 0.5: Monthly Land-Surface Precipitation from Rain-Gauges built on GTS-based and Historic Data, https://doi.org/10.5676/DWD_GPCC/FD_M_V6_050, 2011.
Shen, C., Tang, L., Wang, S., Li, C., and Liu, K.: The Pollen Records and time scale from the RM of the Zoige Basin, northeastern Qinghai-Tibetan Plateau, Chinese Sci. Bull., 50, 553–562, 2005.
Shimada, M., Takahara, H., Imura, R., Haraguchi, T., Yonenobu, H. I., Hayashida, A., and Yamada, K.: Vegetation history based on pollen and charcoal analyses since the Last Glacial Maximum in southern Kyushu, Japan, EPPC Padua Italy 26–21 August 2014, abstract book p. 253, 2014.
Sitch, S., Smith, B., Prentice, I. C., Arneth, A., Bondeau, A., Cramer, W., Kaplan, J. O., Levis, S., Lucht, W., Sykes, M. T., Thonicke, K., and Venevsky, S.: Evaluation of ecosystem dynamics, plant geography and terrestrial carbon cycling in the LPJ Dynamic Global Vegetation Model, Global Change Biol., 9, 161–185, 2003.
Solla, A., Martin, J. A., Corral, P., and Gil, L.: Seasonal changes in wood formation of Ulmus pumila and U. minor and its relation with Dutch elm disease, New Phytol., 166, 1025–1034, 2005.
Sugaya, M., Okuda, M., and Okada, M.: Quantitative paleoclimate reconstruction based on a 130 ka pollen record from teC9001C core off NE Japan, Quaternary Int., 397, 404–416, 2016.
Sun, X. J. and Li, X.: A pollen record of the last 37 ka in deep sea core 17940 from the northern slope of the South China Sea, Mar. Geol., 156, 227–244, 1999.
Sun, X. J., Song, C. Q., and Wang, F. Y.: Vegetation history of the Southern Loess Plateau of China during the last 100,000 years based on pollen data, Acta Botanica Sinica, 38, 982–988, 1996 (in Chinese with English summary).
Sun, X., Li, X., Luo, Y., and Chen, X.: The vegetation and climate at the last glaciation on the emerged continental shelf of the South China Sea, Palaeogeogr. Palaeocl., 160, 301–316, 2000.
Sun, X., Luo, Y, Huang, F., Tian, J., and Wang, P.: Deep-sea pollen from the South China Sea: Pleistocene indicators of East Asian monsoon, Mar. Geol., 201, 97–118, 2003.
Svenning, J.-C.: Deterministic Plio-Pleistocene extinctions in the European cool-temperate tree flora, Ecol. Lett., 6, 646–653, 2003.
Takahara, H. and Takeoka, M.: Vegetational changes since the last Glacial maximum around the Hatchodaira Moor, Kyoto, Japan, Japan J. Ecol., 6, 105–116, 1986.
Takahara, H. and Takeoka, M.: Vegetation history since the last glacial period in the Mikata lowland, the Sea of Japan area, western Japan, Ecol. Res., 7, 371–386, 1992.
Takahara, H., Sugita, S., Harrison, S. P., Miyoshi, N., Morita, Y., and Uchiyama, T.: Pollen-based reconstructions of Japanese biomes at 0, 6000 and 18,000 14C yr BP, J. Biogeogr., 27, 665–683, 2000.
Tian, B., Liu, R., Wang, L., Qiu, Q., Chen, K., and Liu, J.: Phylogeographic analyses suggest that a deciduous species (Ostryopsis davidiana Decne., Betulaceae) survived in northern China during the Last Glacial Maximum, J. Biogeogr., 36, 2148–2155, 2009.
Tian, F., Cao, X., Dallmeyer, A., Ni, J., Zhao, Y., Wang, Y., and Herzschuh, U.: Quantitative woody cover reconstructions from eastern continental Asia of the last 22 kyr reveal strong regional peculiarities, Quaternary Sci. Rev., 137, 33–44, 2016.
Tian, Z. and Jiang, D.: Revisiting last glacial maximum climate over China and east Asian monsoon using PMIP3 simulations, Palaeogeogr. Palaeocl. Palaeocol., 453, 115–126, 2016.
Wang, S., Lu, H., Han, J., Chu, G., Liu, J., and Negendank, J. F. W.: Palaeovegetation and palaeoclimate in low-latitude southern China during the Last Glacial Maximum, Quaternary Int., 248, 79–85, 2012.
Xu, D., Lu, H., Wu, N., and Liu, Z.: 30 000-Year vegetation and climate change around the East China Sea shelf inferred from a high-resolution pollen record, Quaternary Int., 227, 53–60, 2010.
Xu, G., Yang, X., Ke, Z., Li Nag, W., and Yang, Z.: Environment Changes in Yanshan Mountain Area during the Latest Pleistocene, Geogr. Terri. Res., 18, 4 pp., 2002.
Yan, G., Wang, F. B., Shi, G. R., and Li, S. F.: Palynological and stable isotopic study of palaeoenvironmental changes on the northeastern Tibetan plateau in the last 30,000 years, Palaeogeogr. Palaeoclim. Palaeocl., 153, 147–159, 1999.
Yang, D., Peng, Z., Luo, C., Liu, Y., Zhang, Z., Liu, W., and Zhang, P.: High-resolution pollen sequence from Lop Nur, Xinjiang, China: Implications on environmental changes during the late Pleistocene to the early Holocene, Palaeobot. Palyno., 192, 32–41, 2013.
Yi, S. and Kim, S.-J.: Vegetation changes in western central region of Korean Peninsula during the last glacial (ca. 21.1–26.1 cal kyr BP), Geosci. J., 14, 1–10, 2010.
Yu, G., Ke, X., Xue, B., and Ni, J.: The relationships between the surface arboreal pollen and the plants of the vegetation in China, Palaeobot. Palyno., 129, 187–198, 2004.
Yu, S., Zheng, Z., Chen, Z., Jing, X., Kershaw, P., Moss, P., Peng, X., Zhang, X., Chen, C., Zhou, Y., Huang, K., and Gan, H.: A last glacial and deglacial pollen record from the northern South China Sea: New insight into coastal-shelf paleoenvironment, Quaternary Sci. Rev., 157, 114–128, 2017.
Yue, Y., Zheng, Z., Huang, K., Chevalier, M., Chase, B. M., Carré, M., Ledru, M.-P., and Cheddadi, R.: A continuous record of vegetation and climate change over the past 50,000 years in the Fujian Province of eastern subtropical China, Palaeogeogr. Palaeocl., 365–366, 115–123, https://doi.org/10.1016/j.palaeo.2012.09.018, 2012.
Zheng, Z., Huang, K., Deng, Y., Cao, L., Yu, S., and Suc, J.-P.: A 200 ka pollen record from Okinawa Trough: Paleoenvironment reconstruction of glacial-interglacial cycles, Sci. China Earth Sci., 56, 1731–1747, 2013.
Zheng, Z., Wei, J., Huang, K., Xu, Q., Lu, H., Tarasov, P., Luo, C., Beaudouin, C., Deng, Y., Pan, A., Zheng, Y., Luo, Y., Nakagawa, T., Li, C., Yang, S., Peng, H., and Cheddadi, R.: East Asian pollen database: modern pollen distribution and its quantitative relationship with vegetation and climate, J. Biogeogr., 41, 1819–1832, https://doi.org/10.1111/jbi.12361, 2014.
Ziska, L. H. and Caulfield, F. A.: Rising CO2 and pollen production of common ragweed (Ambrosia artemisiifolia), a known allergy inducing species: implications for public health, Aust. J. Plant Physiol., 27, 893–898, 2000,
- Abstract
- Introduction
- Material and methods
- Climate of eastern Asia
- Comparing pollen information with climatic data
- Possible tree growth during the LGM
- LGM connectivity and distribution mapping
- Conclusions
- Code availability
- Data availability
- Author contributions
- Competing interests
- Acknowledgements
- Financial support
- Review statement
- References
- Supplement