the Creative Commons Attribution 4.0 License.
the Creative Commons Attribution 4.0 License.
 | 19 Aug 2020
Changes in high-intensity precipitation on the northern Apennines (Italy) as revealed by multidisciplinary data over the last 9000 years
Stefano Segadelli
Veronica Rossi
Margherita Aguzzi
Silvia Marvelli
Marco Marchesini
Alessandro Chelli
Roberto Francese
Maria Teresa De Nardo
Sandro Nanni
Several record-breaking precipitation events have struck the mountainous area of the Emilia–Romagna region (northern Apennines, Italy) over the last 10 years. As a consequence, severe geomorphological processes such as debris avalanches and debris flows, shallow landslides, and overbank flooding have affected the territory, causing severe damage to human-made structures. The unusual intensity of these phenomena prompted an investigation into their frequency in the past, beyond instrumental time. In the quest for an understanding of whether these phenomena are unprecedented in the region, peat bog and lake deposits were analyzed to infer the frequency of extreme precipitation events that may have occurred in the past. We present the results of a dedicated field campaign performed in summer 2017 at Lake Moo in the northern Apennines, a 0.15 km2 peat bog located at an altitude of 1130 m a.s.l. During the extreme precipitation event of 13–14 September 2015, several debris flows generated by small streams affected the Lake Moo plain. In such a small drainage basin (<2 km2), high-density floods can be triggered only by high-intensity precipitation events. The sedimentary succession (ca. 13 m thick) was studied through the drilling of two cores and one trench. The sequence, characterized by clusters of coarse-grained alluvial deposits interbedded with organic-rich silty clays and peat layers, was analyzed by combining sedimentological, pollen, microanthracological and pedological data with radiocarbon dating (AMS 14C) in an innovative multidisciplinary approach for this area. Original data acquired during the field campaign were also correlated with other specific paleoclimatic proxies available in the literature for the northern Apennines area. We discover that the increase in extreme paleoflooding, associated with coarse-grained deposits similar to the ones observed recently, correlates well with the warm phases of the Holocene Thermal Maximum and with the ongoing warming trend observed that started at the beginning of the last century.
- Article
(9804 KB) - Full-text XML
-
Supplement
(286 KB) - BibTeX
- EndNote


High-intensity precipitation (HIP) events, also known as torrential rainstorms for their capacity to generate flash floods in small streams, represent a significant component of the Mediterranean water cycle. More than half of the annual precipitation is concentrated in a few major precipitation events (e.g., Frei and Schär, 1998; Isotta et al., 2014). Better knowledge of their expected frequency (and maximum intensity) is crucial for planning adequate hydraulic defenses and sustainable water resource management in the present and future climate.
Under the threat of global warming, a growing number of studies have investigated the link between a temperature rise in air masses and the intensity of extreme precipitation, highlighting spatial and seasonal differences across the globe (e.g., Lehmann et al., 2015; Papalexiou and Montanari, 2019). There is a consensus that HIP events are increasing with global warming, while mean precipitation could decrease in some regions (Berg et al., 2013). Myhre et al. (2019) show that HIP over Europe almost doubles per degree of warming due to the combined effect of increasing frequency (the major driver) and an increase in intensity.
At the local scale, different responses of weather patterns and limitations in moisture availability can alter the uniform expected rise in HIP due to the increase in saturation water vapor pressure (6 % K−1–7 % K−1) (e.g., Westra et al., 2014; Prein et al., 2017). For example, in the Swiss Alps Scherrer et al. (2016) found a significant increase in daily extreme precipitation indices since the beginning of the last century (i.e., between 1901 and 2014), while Brugnara and Maugeri (2019) documented regional differences in HIP trends across the whole Alpine area. These results suggest that instrumental data do not cover a suitable period to infer reliable local changes in HIP frequency.
The investigation of sedimentary archives, like peat bogs and lakes, allow for the verification of the hypothesized linkage between extreme precipitation and temperatures in the distant past, substantially widening the period during which we can verify this relationship.
In the literature there is ample documentation of the use of these sedimentary archives to infer chronologies of past flood events (Zavala et al., 2006, 2011; Giguet-Covex et al., 2012; Gilli et al., 2013; Glur et al., 2013; Stoffel et al., 2013, 2016; Wirth, 2013; Wirth et al., 2013; Anselmetti et al., 2014; Longman et al., 2017; Schillereff et al., 2014; Swierczynski et al., 2017; Ahlborn et al., 2018; Wilhelm et al., 2012, 2018; Zavala and Pan, 2018), alongside others such as tree rings (Ballesteros-Cánovas et al., 2015), speleothems (Regattieri et al., 2014; Zanchetta et al., 2011), and torrential fans and cones (Schneuwly-Bollschweiler et al., 2013).
Interestingly, over the Alpine area a synchronization between increasing flood frequency and Holocene cooling periods characterized by cold and wet summers, like the Little Ice Age (LIA), has been documented by several studies (e.g., Glur et al., 2013; Henne et al., 2018). Other authors reported that under warm paleoclimate conditions floods in the Alps became rarer but stronger in intensity, highlighting the complexity of this issue (Giguet-Covex et al., 2012; Brönnimann et al., 2018a). Alpine data mostly derive from lacustrine sedimentary successions that are known to be influenced by a combination of factors (e.g., precipitation intensity, duration, seasonality, and changes in atmospheric circulation and land use) that might overshadow the physically based relationship between temperature increase and extreme precipitation events (Utsumi et al., 2011; Brönnimann et al., 2018b).
In contrast, less attention was paid to the Holocene flood activity in the northern Apennines area (N Italy in Fig. 1), which has a different precipitation climatology compared to the inner Alpine region. Indeed, the link between cold summers and high values of flood frequency appears more logical for the Alpine region, which shows a precipitation maximum in the summer. In contrast, in the northern Apennines area, precipitation maxima occur in autumn, with more than 60 % of the annual total precipitation concentrated in a few days characterized by severe meteorological events (Isotta et al., 2014).
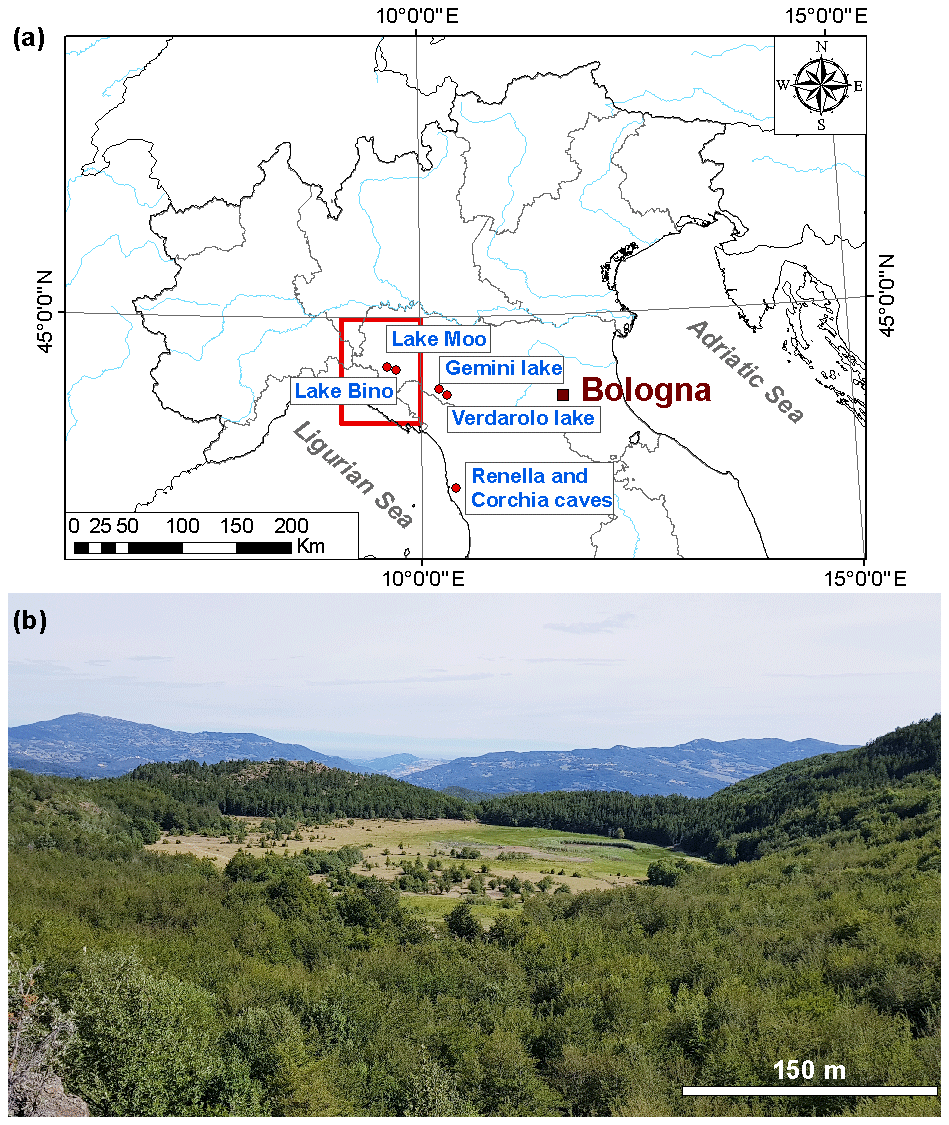
Figure 1(a) Location map of the Lake Moo plain. The area affected by the extreme precipitation event of 13 and 14 September 2015 is highlighted by the red rectangle. (b) View of the Lake Moo landscape from the southern side.
Focusing the analysis on the Emilia–Romagna region (ER region; Fig. 1), an increase in the interannual variability of torrential rainfall has been observed over the last 10 years with marked or even exceptional droughts, such as those occurring in 2012 and 2017 (Grazzini et al., 2012), followed by years of record-breaking rainfall (2014 and 2018). Between September 2014 and September 2015, the ER region was affected by three events of exceptional intensity with an estimated return period of several centuries (Grazzini et al., 2016).
To consolidate HIP trends on the N Apennines area, we analyzed the Holocene sedimentary succession of a small-sized peat bog (Lake Moo in Fig. 1) through the application of a multidisciplinary approach that integrates sedimentological and environmental data (e.g., pollen-derived paleovegetation patterns) with climatological observations and physical arguments.
Lake Moo is in the proximity of the main N Apennines crest that is very exposed to moist maritime airflow coming from the central Mediterranean Sea. The dimension of the drainage basin is small (total area <2 km2), and the modern anthropogenic impact is low as the site belongs to the Natura 2000 network (site code and name: IT4020008 – Monte Ragola, Lago Moo, Lago Bino). Moreover, the activation of debris flows (sensu Hungr et al., 2014) during a severe flash-flood event occurred on 13–14 September 2015, with an estimated rainfall intensity of 112 mm every 3 h over the Lake Moo basin (Segadelli et al., 2020; Grazzini et al., 2016), offering the unique opportunity to use these recent deposits as an archetype of past events. According to the literature (Milliman and Syvitski, 1992; Mulder and Syvitski, 1995; Mutti et al., 1996), in such a small drainage basin high-density floods can be triggered only by HIP events lasting long enough for the water to infiltrate and mobilize large quantities of debris. All these geomorphological features make Lake Moo an ideal site to investigate past changes in HIP events in terms of sedimentary expression, frequency and forcing factors. This research addresses the following questions.
- a.
Are the recent events unprecedented on a millennial timescale (i.e., the Holocene period)?
- b.
Is the frequency of HIP events coupled with (paleo)temperature variations?
2.1 Geographic and climate context
The Lake Moo plain (44∘37′29′′ N, 9∘32′25′′ E), about 0.15 km2 wide, is located near the boundary between the Emilia–Romagna and Liguria regions (Piacenza province, Italy; Fig. 1a) in the upper valley of the Nure stream at an altitude of 1130 m above sea level (a.s.l.). A high tree cover density characterizes the present-day catchment area (i.e., the total woodland cover is 65.55 %; Corticelli et al., 2011), with a high richness of plant species and an exceptional concentration of protected mountain taxa of particular phytogeographical interest. The vegetation landscape shows the widespread occurrence of Fagus sylvatica, locally interrupted by grazing areas and blueberry moorlands with the presence of rare Juniperus nana and Sorbus chamaemespilus. Reforestation of Pinus nigra is also documented (Fig. 1b).
Present-day climate conditions primarily reflect the interaction of the prevalent atmospheric flow and the mountain range surrounding the Lake Moo plain. The proximity to the Ligurian Sea (about 40 km SW) makes the location particularly favorable to orographic precipitation enhancement in the case of moisture-laden southerly flow. The most precipitation is usually observed in spring and autumn, with a marked peak in early autumn. In this period we observe a particular synergy of midlatitude synoptic disturbances, becoming more frequent towards the cold seasons, and strong convective systems still developing over the warm Mediterranean Sea at the end of summer and in autumn (Grazzini et al., 2020); this is a situation very favorable for the genesis of extreme precipitation events in the area.
2.2 Geological and geomorphological setting
The study area mainly consists of extensively fractured serpentinites that represent the accreted fragments of the Ligure–Piemonte oceanic basin separating the European and Adria plates during the Middle–Upper Jurassic (Marroni et al., 2010). The ultramafic rocks are bordered by polygenic breccias made of blocks of limestones or marly limestones embedded within a fine-grained matrix (Mt. Ragola Complex, late Santonian–early Campanian; Elter et al., 1997).
The geomorphological landscape includes flat areas and steep slopes located at different altitudes. On the former, marshy environments commonly occur recording the last filling phases of small lacustrine basins, some of which still exist as Lake Moo and Lake Bino (Figs. 1–2). However, the origin of Lake Moo is still a matter of debate as some authors point to a glacial origin (Elter et al., 1997; Marchetti and Fraccia, 1988; Carton and Panizza, 1988), while others have interpreted the basin as the expression of Holocene deep-seated gravitational slope deformations (Geological, Seismic and Soil Service of the Emilia–Romagna Region, 2012) mainly controlled by changes in the incision rates of the Nure stream (Elter et al., 1997). The complexity of past and present morphological processes is likely enhanced by the superposition of lithological units with strong mechanical contrast, such as ophiolites and the underlying a predominantly clayey unit (Elter et al., 1997).
3.1 Field investigation
Taking into account the criteria indicated by Gilli et al. (2013) and Schillereff et al. (2014), Lake Moo shares several advantageous characteristics for the reconstruction of Holocene flood activity:
-
steep slopes (average inclination of 24∘) composed of deposits highly susceptible to erosion (i.e., polygenic and monogenic breccias with a pelitic matrix – the Mt. Ragola Complex; Elter et al., 1997; Fig. 2);
-
absence of lacustrine basins in the upstream part of the catchment;
-
small drainage basin area (1.94 km2);
-
one dominant inflow into the lake;
-
lack of regulated flow structures; and
-
lack of natural pre-lake sediment storage zones.
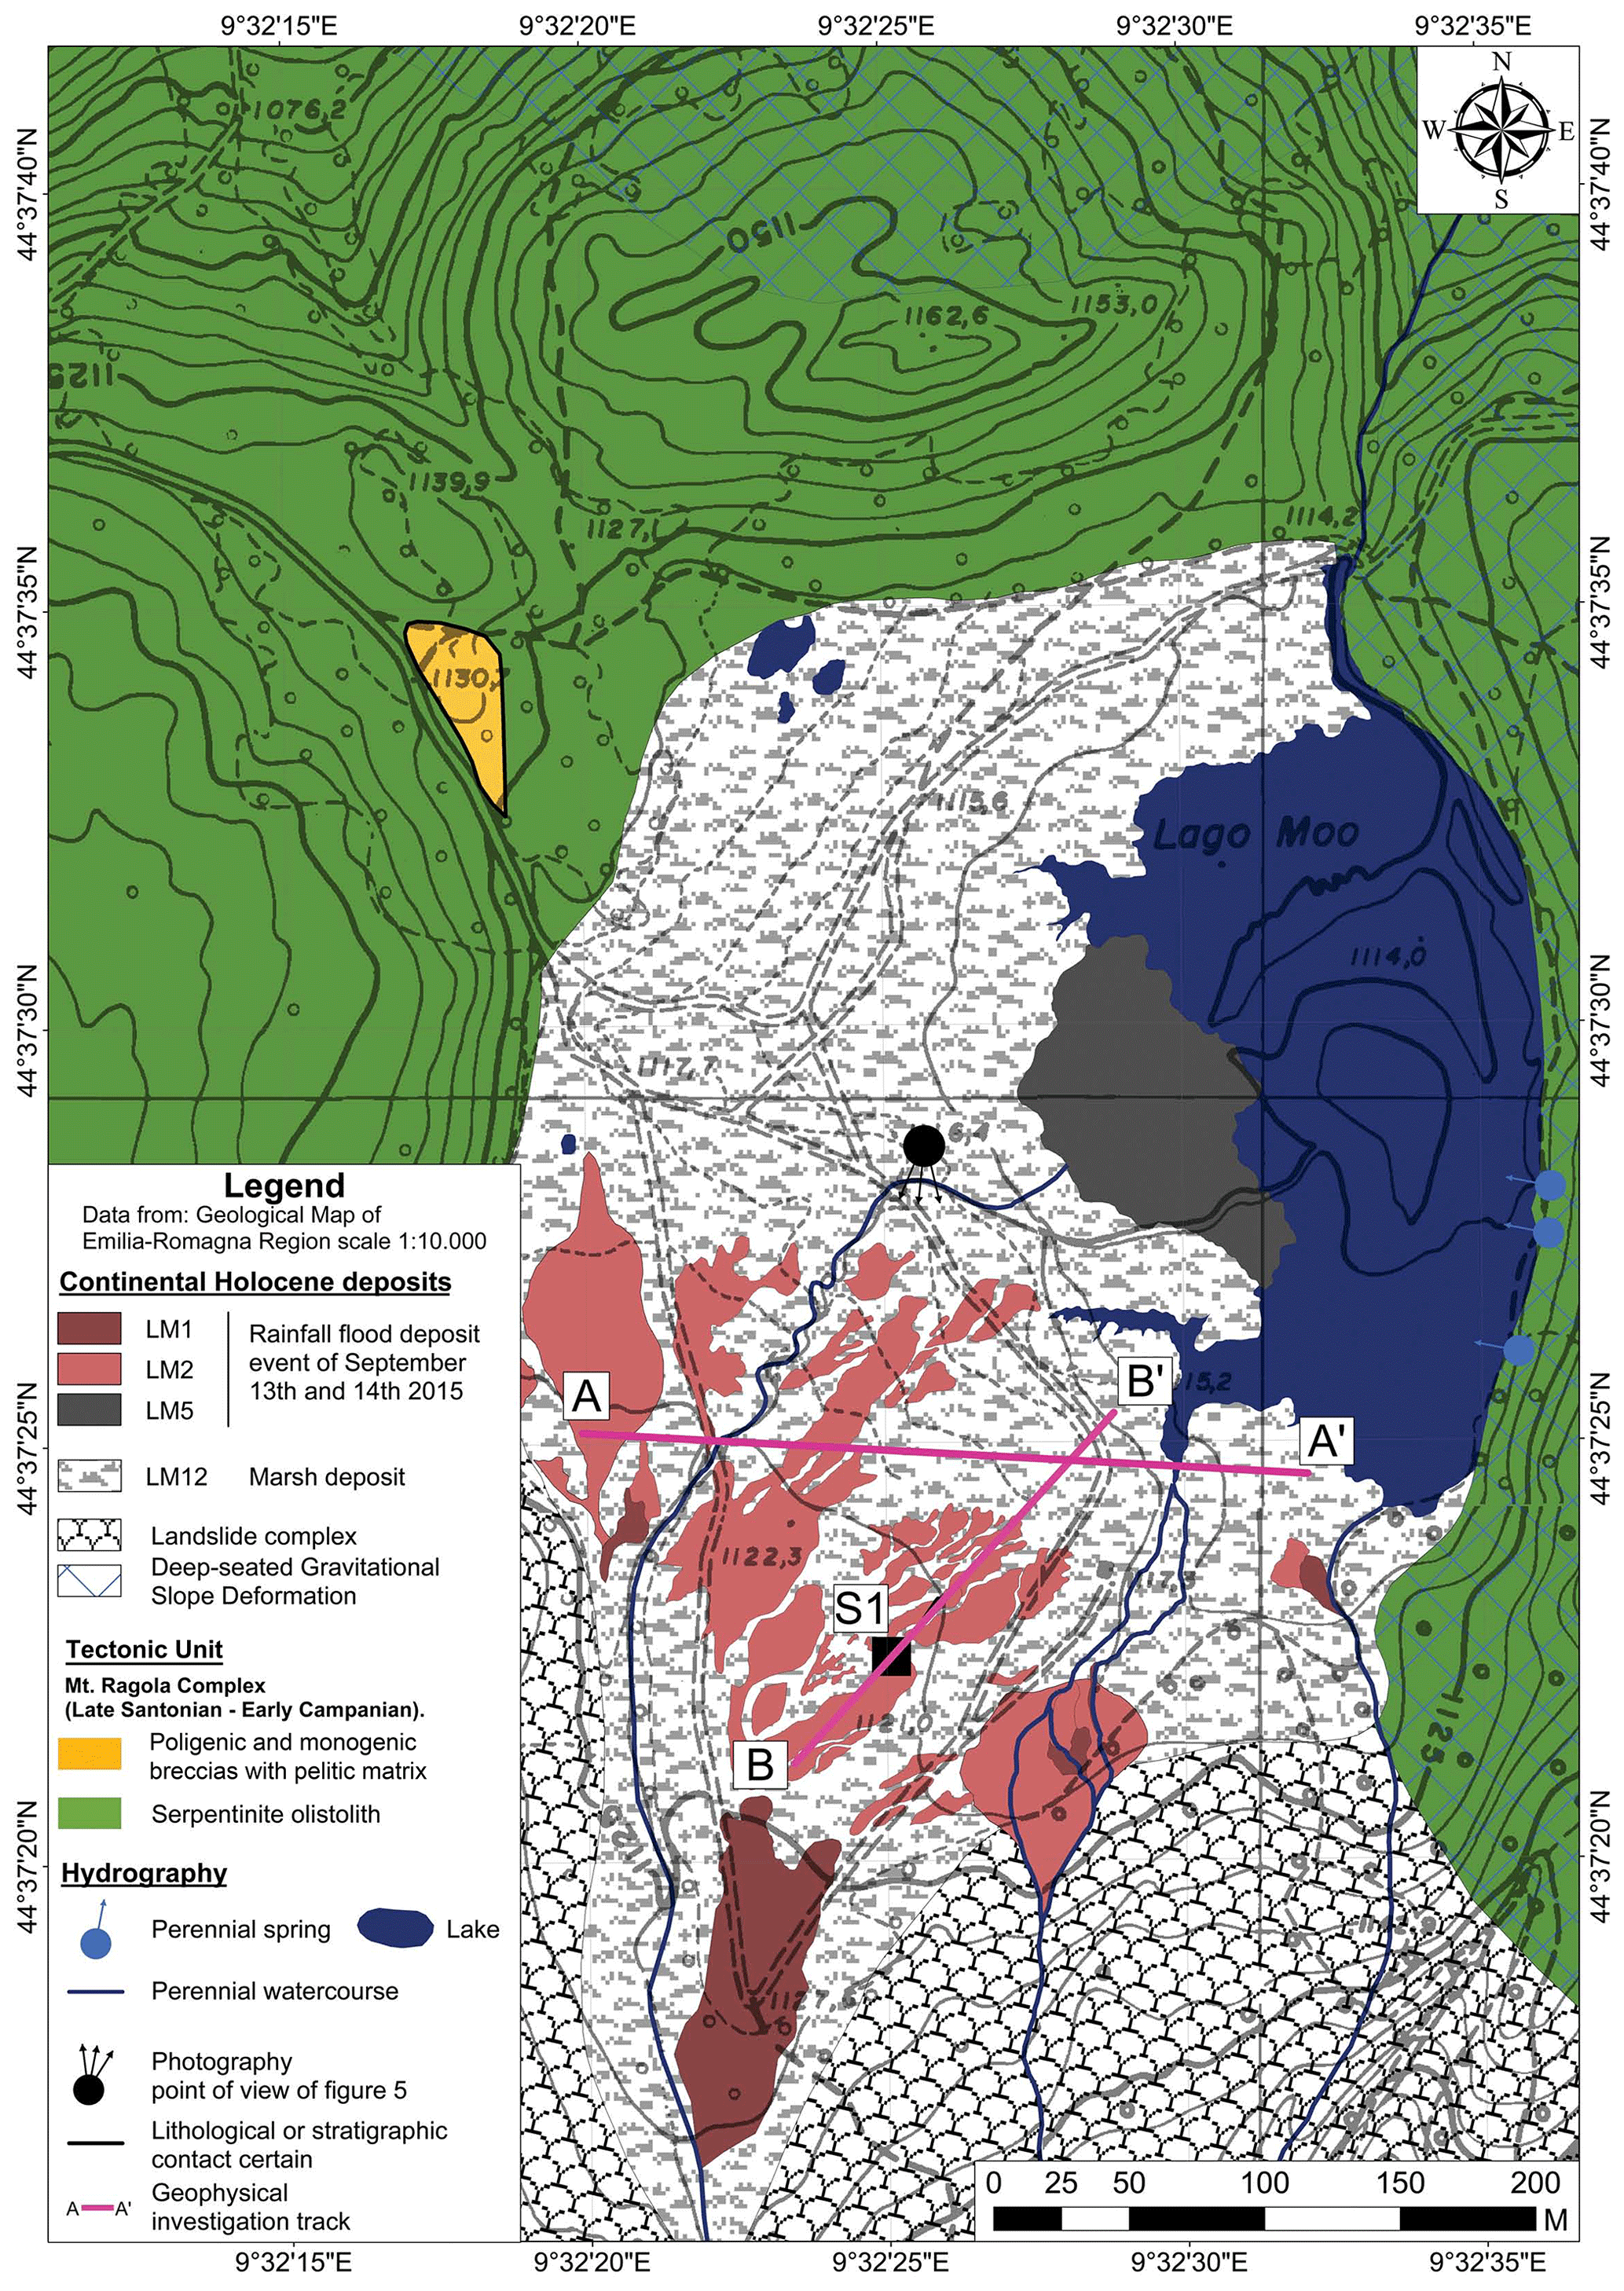
Figure 2Geomorphological map showing the main geological units and the hydrological elements of the Lake Moo plain. The detailed mapping of flood deposits formed during the recent HIP event (13–14 September 2015), the location of the geognostic investigations and the geophysical survey tracks are also reported. Original data from the field campaign are overlaid on the geological database of the Emilia–Romagna region.
The field campaign led to the acquisition of two sedimentary cores (S1 and S2), 14 and 6 m long, respectively, and one trench (T1) to investigate the sedimentary succession capped by the high-density flood deposits formed during the recent HIP event (13–14 September 2015). The location of the cores and the trench benefited from a detailed geomorphological map (Fig. 2) and a high-resolution reflection seismic survey (Fig. SUP1 in the Supplement), both originally produced for this research. The latter provided useful information about the lake-basin-floor morphology and the thickness of the infilling succession.
The two cores, S1 and S2, were obtained using a continuous drilling system that guaranteed an undisturbed stratigraphy and a high recovery percentage (about 90 %). A trench (6 m long, 3 m wide, 2 m deep) was excavated between the two coring sites, allowing for a detailed analysis of the most recent deposits.
We focused our attention on the longest core (S1) that shows the complete record of the Lake Moo infilling succession, as it reaches the ophiolite bedrock. Therefore, all the laboratory analyses (grain size, radiocarbon and palynological analysis) were undertaken on core S1, while the other core (S2) and the trench were used to support the stratigraphic reconstruction. Elevation and geographic coordinates of reference core S1 were acquired using a Garmin eTrex 10 GPS receiver: 1120.2 m a.s.l. and 44∘37′25′′ N–9∘32′43′′ E, respectively.
3.2 Facies analysis and chronology
Facies characterization of the Lake Moo sedimentary succession was mainly performed by integrating the observable macroscopic physical characteristics (i.e., grain size, sedimentary structures, Munsell chart color and types of bounding surfaces) with the grain size data available for the reference core S1. The interpretation in terms of depositional environments also benefited from the precise position of the core(s) with respect to the spill point of Lake Moo and the application of the facies tract concept. The latter strongly supported the interpretation of the coarse-grained intervals encountered throughout the studied succession. Specifically, a facies tract is defined as the association of genetic facies that can be observed within the flood deposits along with the downslope motion transformation (Lowe, 1982; Mutti, 1992; Mutti et al., 1996). Thus, the application of the facies tract concept, if framed into the stratigraphy of the core(s), may allow for the reconstruction of how flood deposits changed through time at a fixed location (Figs. 3, 4).
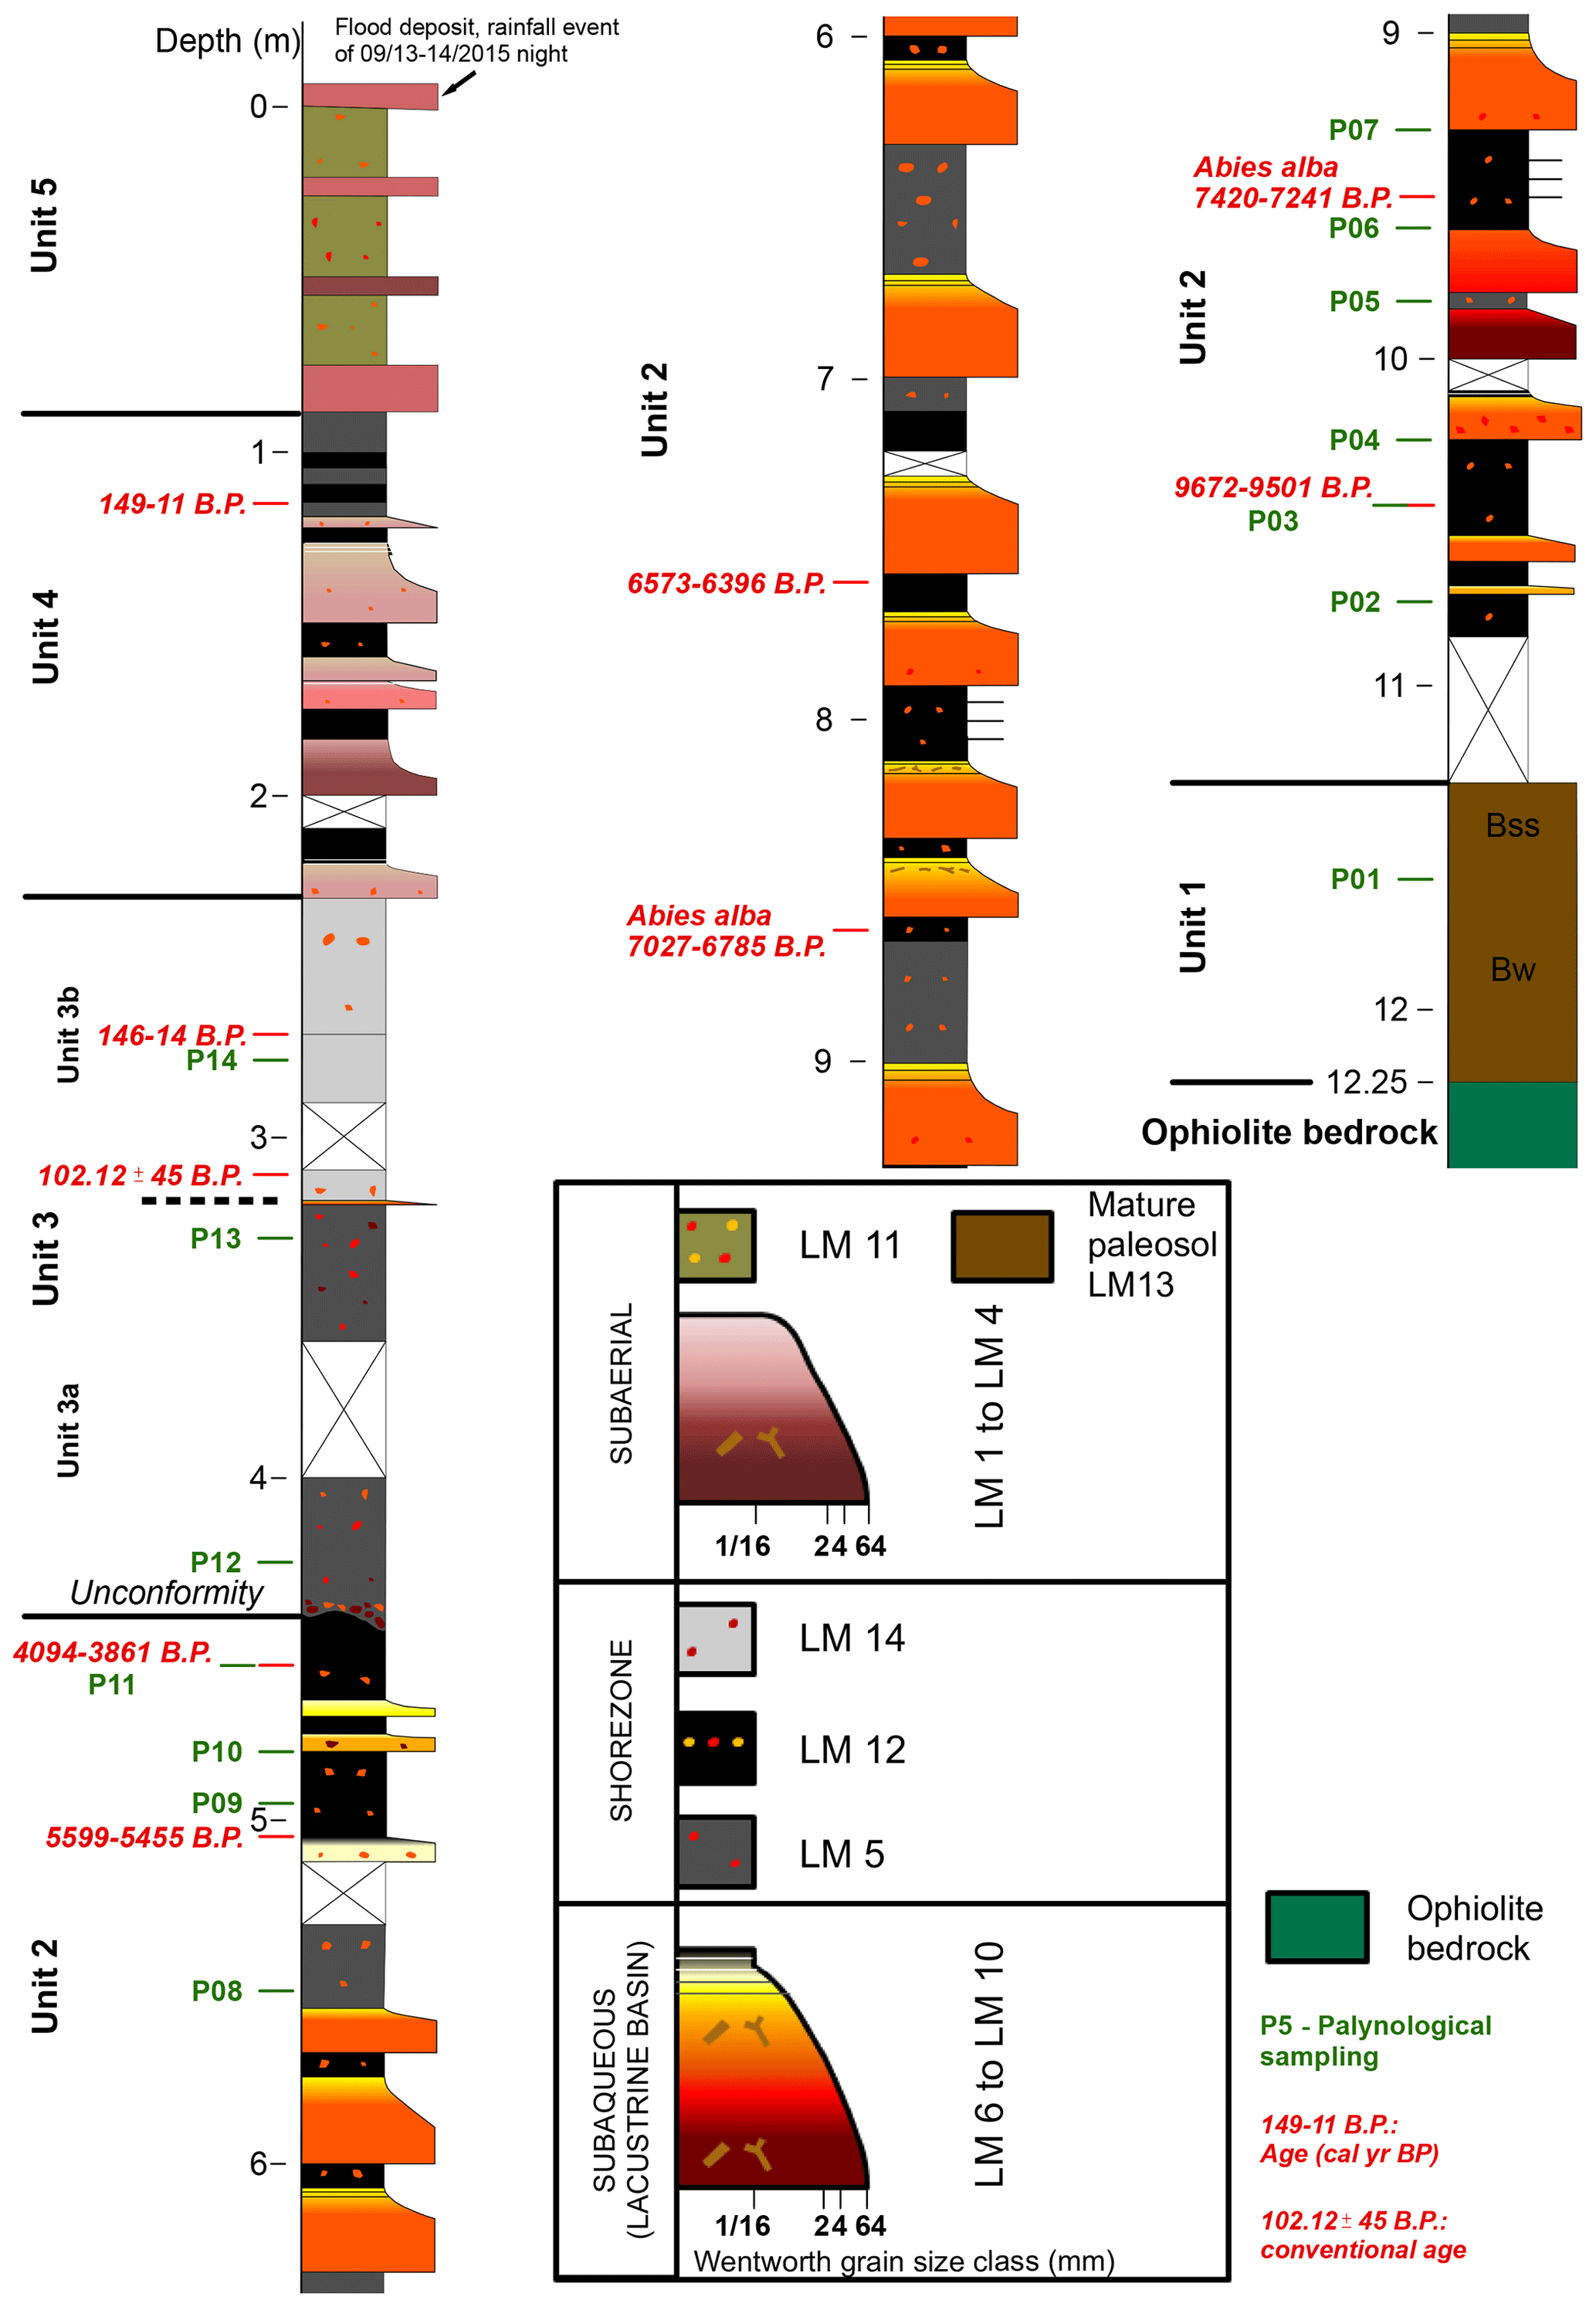
Figure 3Sedimentological features and lithofacies characterization of the reference core S1. Radiocarbon dates, palynological and grain size samples, and stratigraphic units (described in Sect. 4.2) are also reported.
The abundance of wood remains and peaty layers within the sedimentary succession under examination supported the development of a robust chronological framework. A total of 12 samples were selected from the reference core S1 and radiocarbon dated at the CEDAD Laboratory of the University of Salento (Italy). The data are available in Table TS1 (in the Supplement), and the conventional 14C ages were converted into calendar years using the OxCal software version 3.10 (Reimer et al., 2013).
An age–depth model was also constructed using linear interpolation. Coarse-grained intervals were not excluded from the processing because of the difficulty to evaluate the exact thickness of the deposits interpretable as instantaneous events. Indeed, the upper limit of coarse-grained intervals commonly appears transitional toward finer sediments, and, in a few cases, some intervals for a total thickness of 107 cm were not recovered.
3.3 Pollen and microanthracological analysis
In order to refine facies characterization and highlight past vegetation changes at the study site, pollen analyses were carried out on 14 samples collected from the core S1. We focused the analyses on two key stratigraphic intervals formed during periods of well-known different paleoclimate (and paleotemperature) conditions: (i) Interval 1 (ca. 10.5–9 m of core depth), covering the period between ca. 9600 and 7300 cal yr BP, thus centered on the Holocene Thermal Maximum – HTM (Renssen et al., 2012), and (ii) Interval 2 (ca. 5.5–4.5 m of core depth), recording the final stages of HTM and the following cooling period between ca. 5500 and 3800 cal yr BP. In these two stratigraphic intervals, samples were collected from fine-grained layers following a mean sampling resolution of ca. 30 cm.
A standard methodology already tested for pollen substrates was applied with some minor modifications (Lowe et al., 1996). The method includes a series of laboratory treatments: about 8–10 g of sample was treated in 10 % Na pyrophosphate to deflocculate the sediment matrix; a Lycopodium tablet was added to calculate the pollen concentration (expressed as pollen grains per gram), the sediment residue was subsequently washed through a 7 µm sieve. The sample was resuspended in HCl 10 % to remove calcareous material and subjected to Erdtman acetolysis; a heavy liquid separation method was then introduced using Na metatungstate hydrate with a specific gravity of 2.0 and centrifugation at 2000 rpm for 20 min. Following this procedure, the retained fractions were treated with 40 % hydrogen fluoride for 24 h, and then the sediment residue was washed in distilled water and after in ethanol with glycerol; the final residue was desiccated and mounted on slides using glycerol jelly and finally sealed with paraffin.
Identification of the samples was performed at ×400 magnification, and only difficult pollen, such as Triticum, Avena or Hordeum types, was observed at ×1000 magnification.
Determination of pollen grains was based on the Palinoteca of the “Centro Agricoltura Ambiente – CAA G. Nicoli” laboratory (Italy), atlases and a vast amount of specific morpho-palynological literature. Names of the families, genus and species of plants conform to the classifications of Italian Flora proposed by Pignatti (2017–2019) and European Flora (Tutin et al., 1964–1993). The pollen terminology was based on Berglund and Ralska-Jasiewiczowa (1986), Faegri and Iversen (1989), and Moore et al. (1991) with slight modifications that tend to simplify plant nomenclature. The term “taxa” is used in a broad sense to indicate both the systematic categories and the pollen morphological types (Beug, 2004). For each sample, at least 500 pollen grains were counted, and the identified taxa have been expressed as percentages of the total pollen sum that includes only terrestrial pollen, no fern spores and no aquatic plants.
On the basis of vegetational and ecological characteristics, the following main pollen groups were identified: conifers (Pinus–Abies alba), deciduous trees (this group includes quercetum taxa – Quercus, Carpinus betulus, Corylus avellana, Fraxinus, Ostrya carpinifolia, Tilia and Ulmus + other deciduous trees), meadow (this group mainly comprises Fabaceae and Asteroideae, Caryophyllaceae, Cichorioideae and Poaceae), anthropogenic indicators (e.g., Cerealia, Chenopodium, Convolvulus arvensis, Plantago, Urtica) and “alia”, which includes all taxa excluded from previous groups. The group of hygro + aquatic plants was also distinguished. It includes hygrophilous herbs (e.g., Cyperaceae), helophytes and hydrophytes (i.e., Lemna, Junchus, Nymphaea, Phragmites, Potamogeton and Sparganium), which are considered a good proxy for humid conditions typical of wetlands.
The 14 samples prepared for pollen analysis were also investigated for the identification of microcharcoals. Microanthracological analysis has been used to track past changes in fire history, likely connected to anthropogenic activities (Vescovi et al., 2010). A point-count estimation of microscopic charcoal abundance was carried out, and charcoal fragments encountered during pollen counting were recorded in four size classes based on the long axis length: 10–50, 50–125, 125–250, >250 µm (Whitlock and Millspaugh, 1996; Clark, 1982; Patterson et al., 1987; Whitlock and Larsen, 2001; Fisinger et al., 2008). The former two classes were interpreted to be windblown transported, hence giving information about regional fire events, whereas the latter two were considered the result of local vegetation burning (Vittori Antisari et al., 2015).
Pollen and microcharcoal results are presented in Sect. 5 to support facies stratigraphy and to discuss controlling factors on flood activation.
3.4 Temperature reconstruction and modern climatological dataset
Central to our study is the availability of a reliable (paleo)temperature dataset for the chronological period recorded by the Lake Moo sedimentary succession. In this respect, the Holocene paleoclimate reconstruction conducted by Samartin et al. (2017) on the nearby Lake Verdarolo represents a very important reference. The Lake Verdarolo site is located at 1390 m a.s.l., 270 m higher and 54 km SE from Lake Moo (Fig. 1), in a very similar climatic context. The authors reconstructed the mean July air temperature using a chironomid-based inference model developed through a combination of data extracted from more than 200 lakes in Norway and the Swiss Alps (Heiri et al., 2011). This vegetation-independent paleotemperature reconstruction is the first for the northern Apennines, and it agrees with that of Gemini Lake (1350 m a.s.l. elevation and 48 km SE from Lake Moo) as well as several other records coming from central Italy (Samartin et al., 2017).
Modern temperature and precipitation time series (1961–2018) at Lake Verdarolo and Lake Moo were derived from the gridded high-resolution dataset of Emilia–Romagna (Eraclito4), described in Antolini et al. (2016). Trend estimation and a Mann–Kendall significance trend test were computed with the pyMannKendall package (Hussain et al., 2019).
4.1 Holocene stratigraphy
4.1.1 Sedimentary facies
A total of 14 lithofacies (LM1 to LM14) have been identified within the infilling succession of the Lake Moo basin. A detailed lithological description of each lithofacies is reported below.
-
LM1 to LM2 includes a clast-supported deposit with a thickness ranging between 5 and 15 cm. Fine boulders to coarse cobbles with abundant coarse- to fine-grained sand matrix, showing a low degree of sorting, occur. Polygenic clasts have low sphericity and a very angular shape. Wood fragments locally occur. The basal and top contacts are sharp, and the basal one occasionally shows evidence of erosion.
-
LM3 to LM4 includes a clast-supported deposit with a thickness ranging between 5 and 15 cm. It is composed of fine cobbles to coarse pebbles with a very fine sand to silt matrix. Polygenic clasts have low sphericity and a subangular shape. Scraps of wood are encountered. The basal and top contacts are sharp, and the basal one occasionally shows evidence of erosion.
-
LM5 is a massive matrix-supported deposit composed of medium pebbles to granules embedded within a very fine sand to silt matrix. Polygenic clasts have low sphericity and a subangular shape. Scraps of wood are encountered. The basal and top contacts are sharp, and the basal one occasionally shows evidence of erosion.
-
LM6 to LM8 is generally a clast-supported, poorly sorted deposit with a thickness ranging between 10 and 30 cm. Polygenic clasts and massive or crudely graded angular to subangular fine pebbles to very fine granules occur. Crudely horizontal laminae are locally recorded on top. Fragments of wood can be encountered at the base of the layers. The basal contact is sharp and occasionally shows evidence of erosion; the upper boundary is transitional.
-
LM9 to LM10 shows massive or crudely fining-upward graded very coarse to fine sands with a low degree of sorting. The total thickness ranges between 5 and 20 cm. Evidence of a planar lamination and scattered wood fragments is found close to the upper boundary, which is transitional. The basal contact is sharp.
-
LM11 is fine sandy loam to clayey loam, showing a dark grayish brown color (10YR 4/2 or 10YR 3/2). Polygenic fine to medium pebbles aligned with low sphericity and a very angular shape occur. Both basal and top contacts are sharp.
-
LM12 is a silty deposit of dark color (10YR 3/1) with a high content of decomposed organic matter. Occasional fine to medium pebbles aligned with low sphericity and very angular shape occasionally occur.
-
LM13 is a loam to silty clay deposit showing a coarse angular blocky structure and dark olive gray color (5Y3/2), with yellowish brown (10YR5/6) due to the presence of iron oxides. The deposit is deprived of calcium carbonate, and a field pH 5.5 value was recorded.
-
LM14 includes massive clayey silts with a low amount of decomposed organic matter and a dark greenish gray color (5G 4\1). Scattered polygenic clasts (fine pebbles) with low sphericity and a very angular shape are recorded. Both basal and top contacts are sharp.
In terms of sedimentary processes, the coarse-grained LM1–LM10 lithofacies have been interpreted as flood deposits triggered by HIP events in the catchment area (Milliman and Syvitski, 1992; Mulder and Syvitski, 1995; Mutti et al., 1996). Particularly, the identified lithofacies were grouped according to their features (i.e., grain size, color, sedimentary structures) and the facies tract concept (Lowe, 1982; Mutti, 1992; Mutti et al., 1996), distinguishing three main depositional settings along an idealized transect (Fig. 4): subaerial (LM1 to LM4), marginal (LM5) and subaqueous–lacustrine (LM6 to LM10).
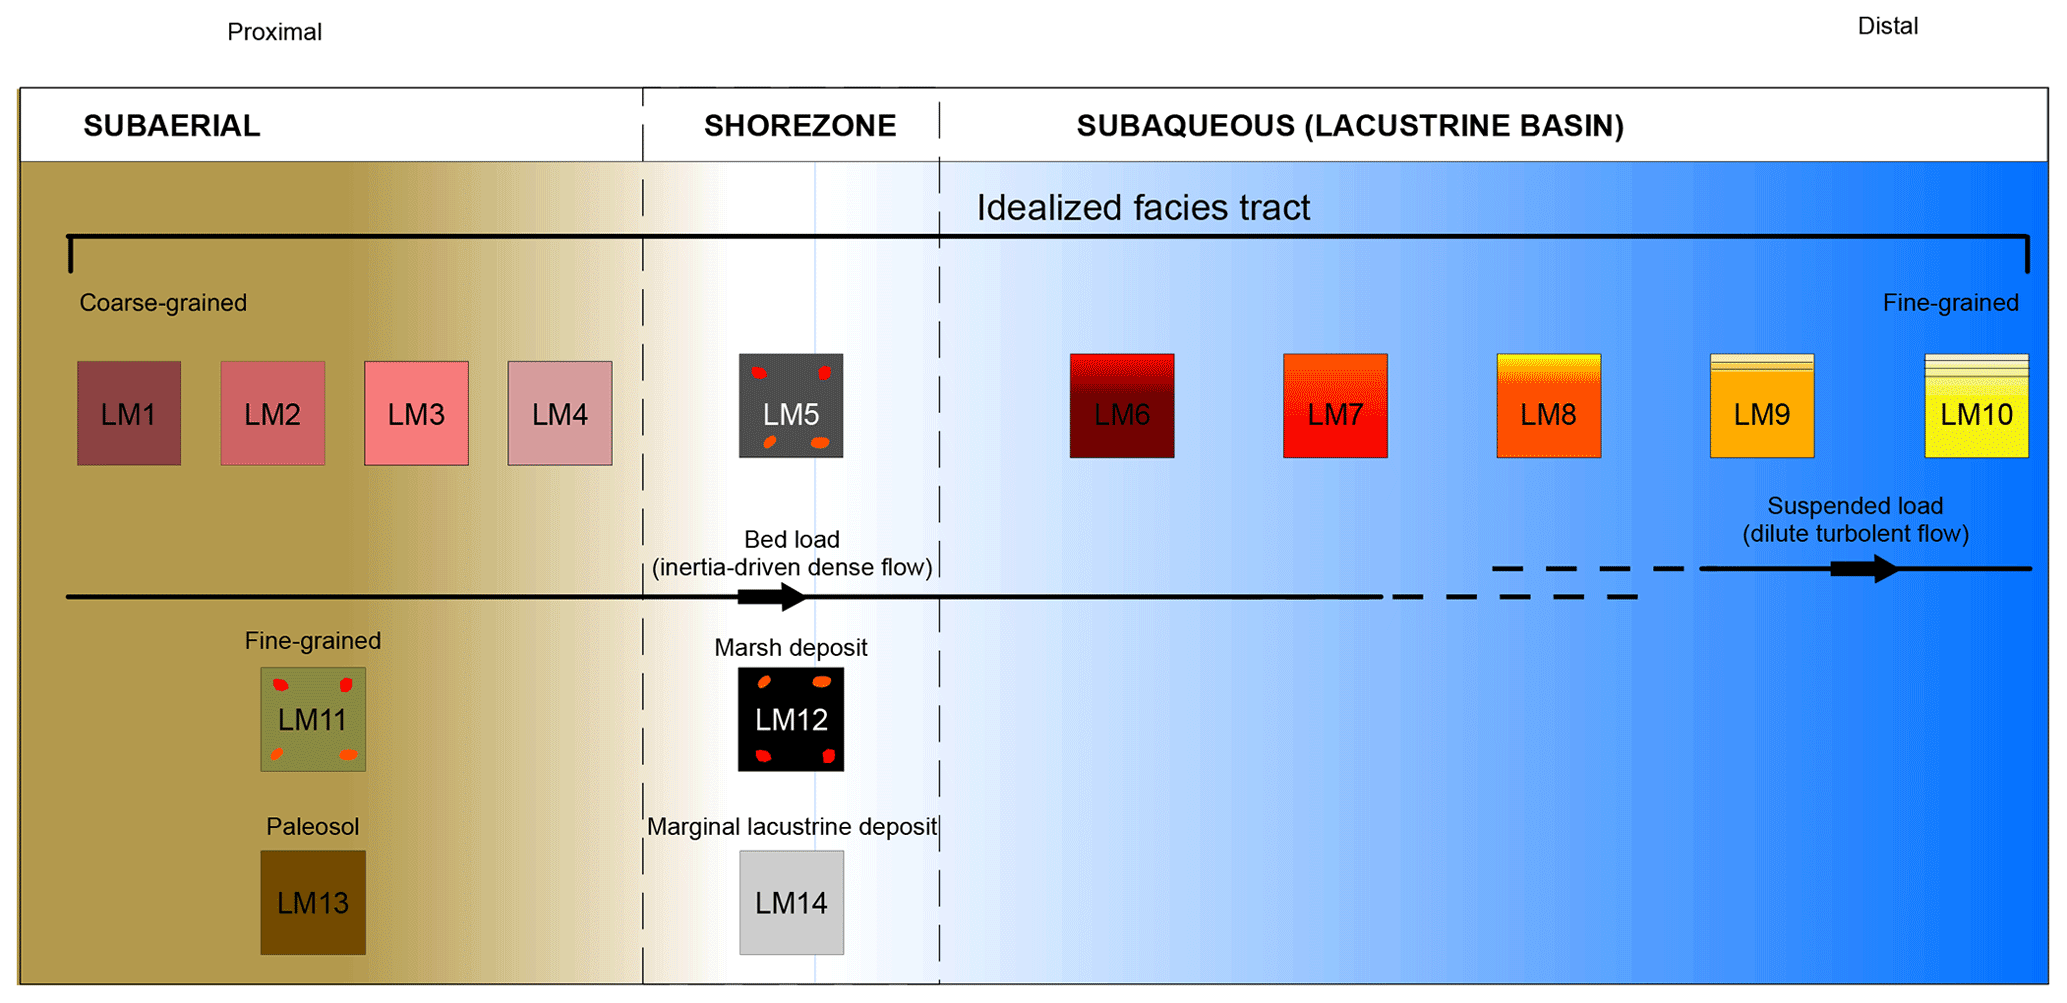
Figure 4Idealized genetic facies tract showing the 14 lithofacies (LM1–LM14) identified within the reference core S1, whose stratigraphy is reported in Fig. 3.
The fine-grained facies (LM11-LM14 in Figs. 3, 4) also form two main groups. The first group includes LM11 and LM13 (paleosol) that are characterized by features indicative of subaerial conditions; the second group consists of LM12 (i.e., peaty deposits) and LM14, deposited along the marginal zone of the (paleo)lake under low-energy conditions and different degrees of organic matter enrichment.
4.1.2 Stratigraphic units
Above the ophiolite bedrock, five informal stratigraphic units have been distinguished within core S1 and are described as follows (Fig. 3). Each unit is interpreted in terms of depositional environment.
Unit 1 (12.25–11.30 m). This 95 cm thick unit is exclusively represented by the LM13 lithofacies that is, in turn, composed of two main horizons indicative of a mature paleosol. The lowermost horizon (Bw), recorded between 12.25 and 11.60 m, corresponds to weathered deposits overlain by a 30 cm thick slickensides horizon (Bss). This unit is interpreted as a residual pedogenized colluvium marking the base of a structural depression produced by gravitational block sliding.
Unit 2 (11.30–4.4 m). This ca. 7 m thick unit is characterized by the presence of several very coarse intervals (LM6–LM8) showing a thickness of about 10–30 cm locally capped by sandy layers (LM9–LM10). Silty deposits with a variable organic matter content, accompanied by a scarce (LM12) or moderate (LM5) occurrence of pebbles and granules, separate the coarse-grained intervals. This unit, which is capped by a marked unconformity surface, is interpreted as a relatively shallow lacustrine environment subjected to several flood events of remarkable intensity.
Unit 3 (4.4–2.3 m). This unit, ca. 2 m thick, shows sharp boundaries and the occurrence of two subunits (3a and 3b). The lowermost subunit 3a, ranging between 4.4 and 3.2 m, is exclusively represented by silty deposits with scattered pebbles and granules, several wood fragments, and a mottled-like appearance corresponding to the LM5 lithofacies. These deposits are attributed to a marginal lacustrine environment subject to sporadic floods. Upwards, marginal lacustrine clayey deposits (LM14) capped the sequence (subunit 3b), documenting a period of apparent flood inactivity.
Unit 4 (2.3–0.9 m). This 1.4 m thick unit is composed of alternating coarse-grained (LM3–LM4) and fine-grained deposits (LM12 and LM11) that record the following:
-
the disappearance of truly lacustrine deposits that are replaced by subaerial ones through an erosional surface that marks the lower boundary of Unit 4 (the stratigraphic depth of this boundary is in accordance with the altitude of the spill point of Lake Moo at 1116 m a.s.l.); and
-
the return of several centimeter-thick flood deposits (LM3–LM4).
Unit 5 (0.9–0 m). This unit is characterized by the presence of several layers of very coarse sediments (LM1–LM2) separated by finer deposits (LM11). An erosional contact separates Unit 4 from Unit 5, which includes the flood deposits produced by the rainfall event that occurred on 13 and 14 September 2015 (Figs. 3, 5).
As a whole, we interpret the lacustrine succession as an infill of a structural depression produced by gravitational block sliding that was induced by post-glacial fluvial incision (Elter et al., 1997).
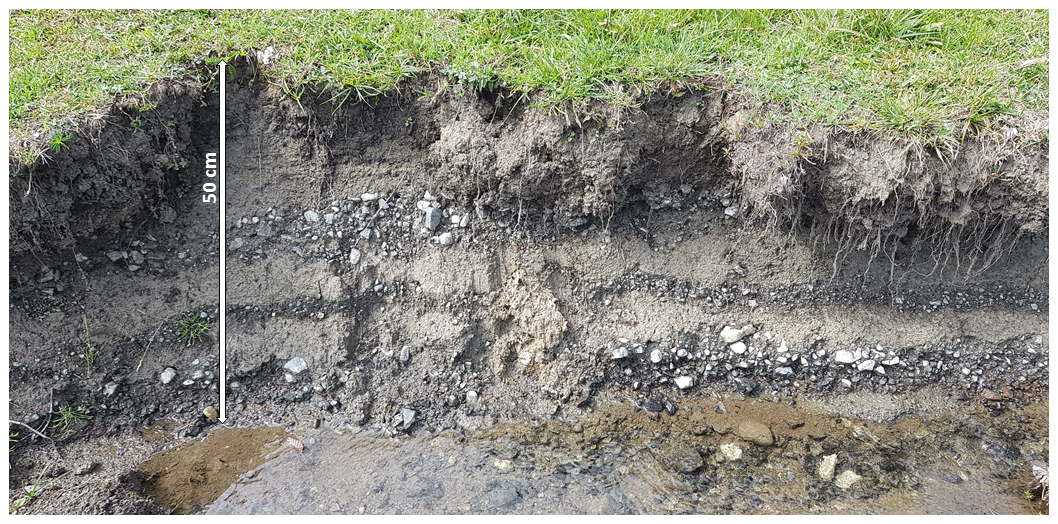
Figure 5Representative photograph of the trench (see Fig. 2 for location), showing the uppermost 50 cm thick sedimentary succession. Though the exposure is quite small, the graded pebble–sand couplets belonging to Unit 5 can be interpreted as a sheet-flood deposit.
4.2 Age–depth model
The age–depth model, based on 8 out of 12 14C dates available for the S1 core (Table TS1 in the Supplement), indicates that the sedimentary succession above the bedrock encompasses almost all of the Holocene period (about the last 10 kyr; Fig. 6). Three ages (at 9.60, 3.10 and 2.40 m of core depth) were excluded as they show evidence of contamination (i.e., ages younger than 1950 CE), while one sample collected at 2.35 m was not datable due to a very low organic matter content. The selected calibrated ages are stratigraphically coherent and mainly derived from wood fragments and peaty deposits. In order to reduce the potential bias due to long-lived plants and reworking processes, small twigs were selected (Oswald et al., 2005) from fine-grained deposits and identified when possible (e.g., Pinus and Abies alba). Due to the small dimension of the basin and the ophiolite prevalence in the drainage area (Fig. 2), we consider the hard-water effect on peats negligible.
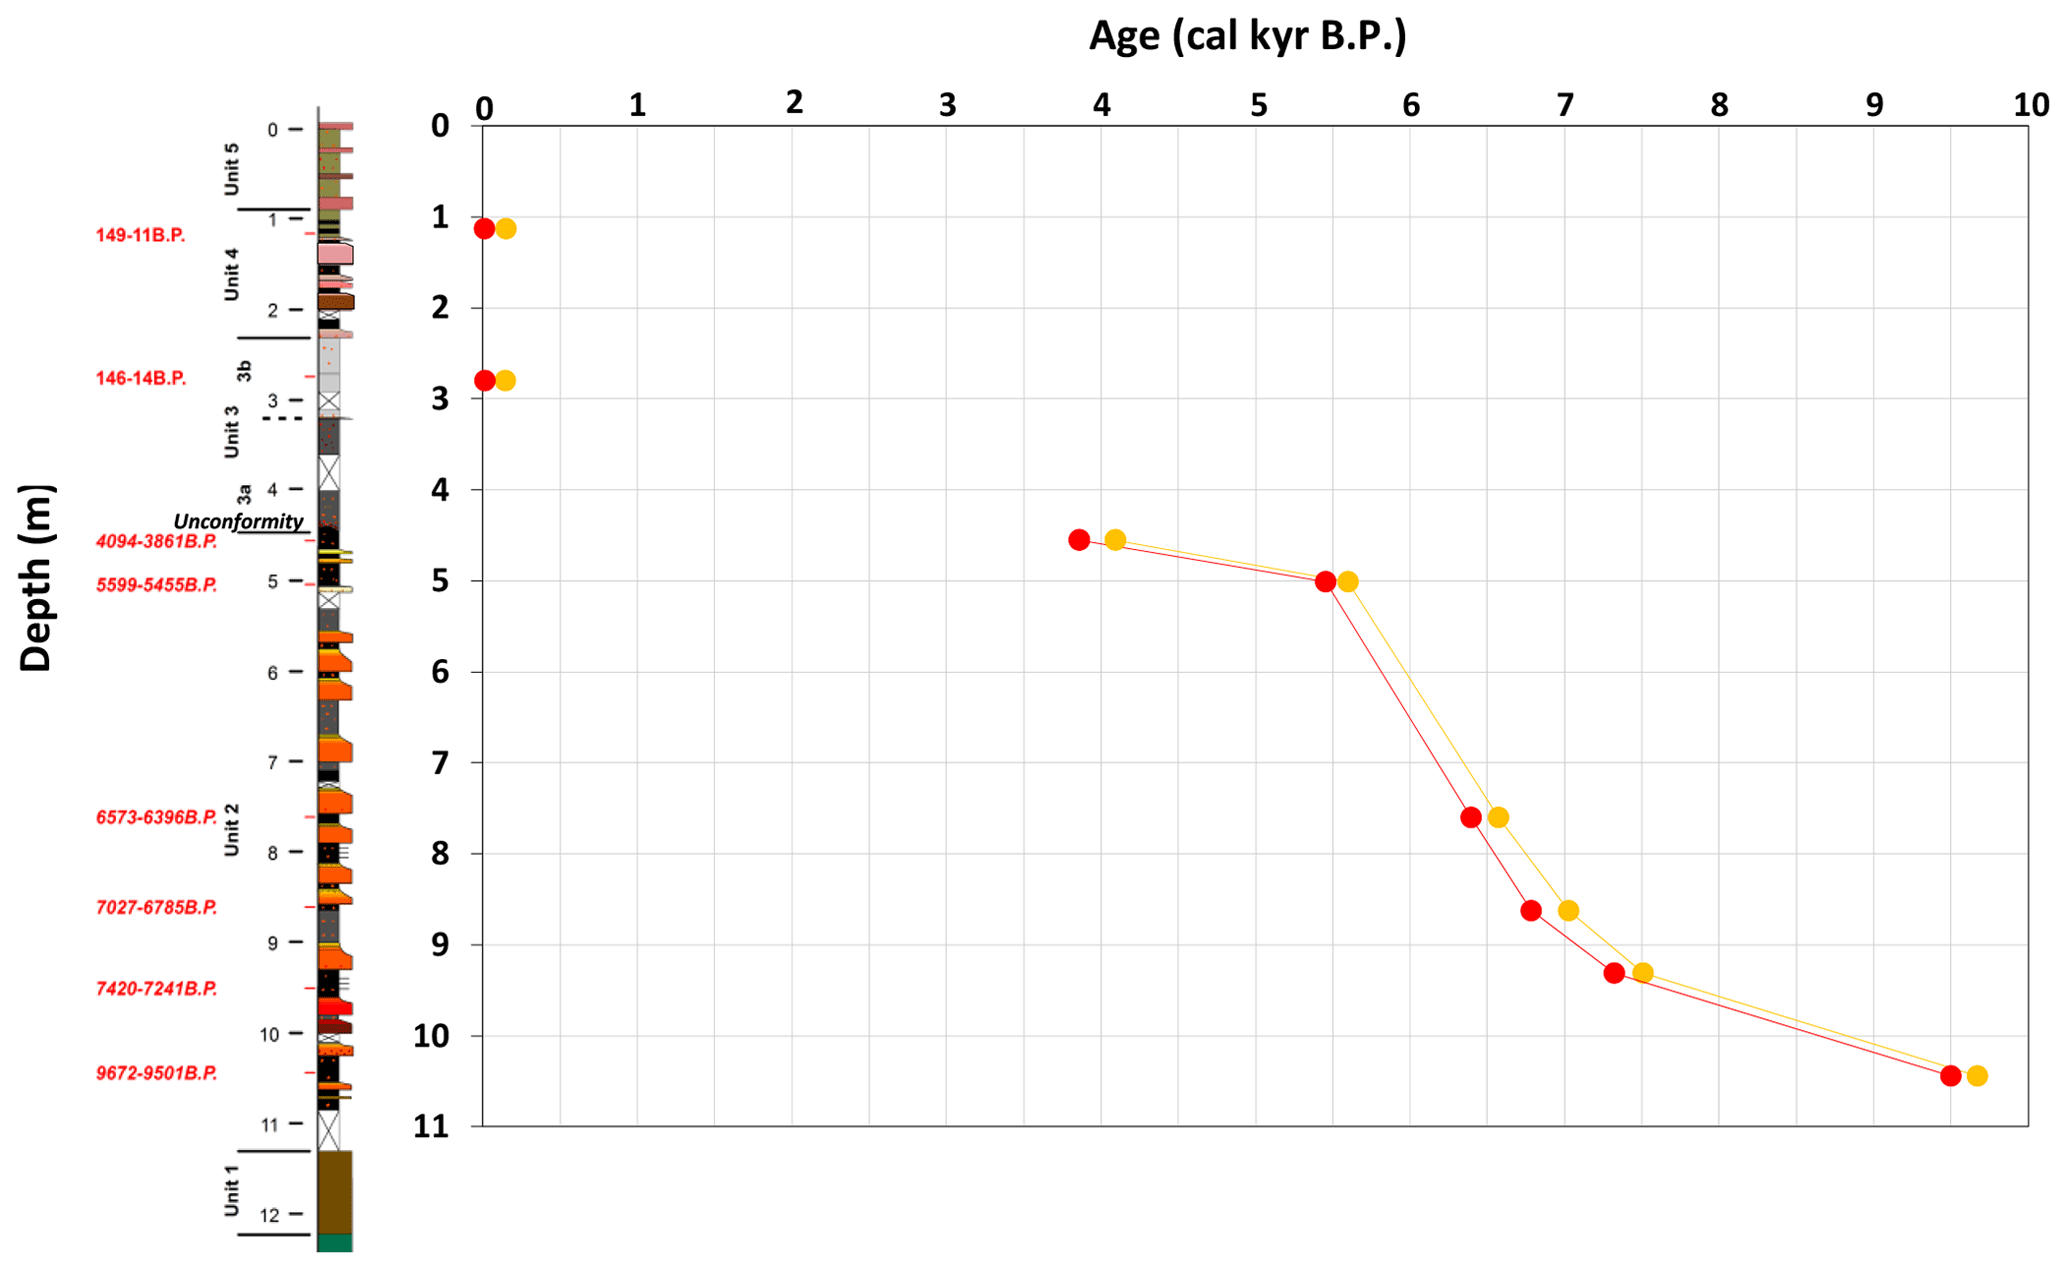
Figure 6S1 core stratigraphy and the age–depth model obtained from radiocarbon dates. Red and orange lines represent the 2-sigma probability envelope.
The resulting age–depth model suggests the occurrence of four main stratigraphic intervals in terms of sedimentation rates. The lowermost interval (about 9.5–7.3 cal kyr BP) denotes a mean accumulation rate of ca. 0.50 mm yr−1 that increases up to ca. 2.38 mm yr−1 within the overlying section dated around 7.3–5.5 cal kyr BP. A change in the accumulation rate occurs at around 5 m with a drop to ca. 0.3 mm yr−1 between the 5.5 and 4.0 cal kyr BP interval. Between ca. 4.5 and 3 m, the deposit shows an uncertain chronology due to the lack of reliable radiocarbon dates and the occurrence of an unconformity surface at around 4.5 m, at the contact between Units 2 and 3 (Figs. 3, 6). During recent times (the last 146–14 cal yr BP), the accumulation rate has increased, reaching ca. 12 mm yr−1.
As a basis for discussion we assemble, and temporally synchronize, the Lake Moo data with the most relevant paleoclimate proxy available from the literature, focusing on the N Apennines paleoarchives (Figs. 1, 7). As a whole, the Holocene infilling succession of the lacustrine basin (i.e., Units 2–3) is composed of an alternation of centimeters- to meters-thick, coarse-grained flood deposits and silts characterized by a variable amount of organic matter (Sect. 4.1. and 4.2.; Figs. 3, 4, 7). The coarse intervals are particularly well-developed and frequent within the portion of stratigraphic Unit 2, which is chronologically correspondent to the HTM (Holocene Thermal Optimum), constrained between ca. 9 and 5 kyr cal BP in the nearby Lake Verdarolo (Samartin et al., 2017, in Fig. 7a; Sect. 3.4). Interestingly, stable oxygen isotope records from the nearby Apuan Alps (Corchia caves; Fig. 1) document that, within the same time interval, the wettest conditions were observed (I and II humid periods in Fig. 7b) with a peak between ca. 8500 and 7500 cal yr BP (I humid period; Regattieri et al., 2014; Zanchetta et al., 2011). This precipitation peak is in phase with a clastic layer dated to 8.2 and 7.1 cal kyr BP, indicative of a period of enhanced cave flooding triggered by high-magnitude precipitation events (Zhornyak et al., 2011). The authors attribute this maximum fluvial activity to an increase in strong convective episodes like the one that affected the Versilia region in 1996 (see Cacciamani et al., 2000, for a description of the Versilia flood event).

Figure 7Stratigraphy of core S1, main palynological features and microcharcoal content. Relative abundances of the pollen groups that are explained in the text (Sect. 3.3) are reported along with the frequencies of hygrophilous herbs and aquatics. Asterisks point to samples containing coprophilous fungi and other spores like Sporormiella, Dicrocoelium and Ascaris. These data are compared with the most relevant paleoclimate reconstructions available from the literature for the area of interest. (a) Reconstructed mean July air temperature from Lake Verdarolo (from Samartin et al., 2017); (b) δ18O speleothem records and reconstructed precipitation trends (mean anomaly time series) from Corchia cave (slightly modified from Combourieu et al., 2013; Zanchetta et al., 2011; Zhornyak et al., 2011); and (c) June (red) to December (blue) insolation values reported for 45∘ N (from Samartin et al., 2017). Main Holocene climate phases and events are also shown (Regattieri et al., 2014). Available radiocarbon ages are reported as calibrated years BP.
Climatic simulations (monthly temperature and precipitation) for the mid-Holocene climatic conditions (Tinner et al., 2013) show higher precipitation in autumn over the northern Apennines. We speculate that the precipitation increases, also reflected in high-frequency flood activity, could have occurred during a phase of a progressive reduction in the Hadley cell, paralleled by a reduction in subtropical high pressure after the insolation peak (Fig. 7c). This would lead to enhanced meteorological activity over the Mediterranean area due to the midlatitude weather systems, especially at the transition towards the cold season. Although in decline, the presence of the African monsoon (Skinner and Poulsen, 2016) could also have contributed to enriching subtropical air masses in the water vapor potentially extractable by midlatitude synoptic disturbances. Accordingly, Krichak et al. (2015) documented how this mechanism is relevant for modern extremes in precipitation in the Mediterranean; moreover, the events occurring in the autumn months are characterized by a greater transport of water vapor from the subtropical Atlantic, even across North Africa.
With the end of the HTM, a drastic decrease in flood activity is documented at Lake Moo, as the coarse intervals are abruptly reduced in number and thickness within the uppermost portion of Unit 2 (ca. 5.5–3.8 kyr BP). This stratigraphic trend is reasonably interpreted as the expression of a decrease in the frequency of HIP events over the study area under cooler and less humid climate conditions (Fig. 7). The limit between Unit 2 and Unit 3 corresponds to an unconformity that marks the passage to a marginal lacustrine succession of uncertain age, at least for the lowermost portion (subunit 3a). This interpretation is supported by palynological data, which show high values of herbaceous hygrophytes (mainly Cyperaceae) and aquatic species.
The upper subunit 3b, dated around 146–14 cal yr BP, is almost deprived of coarse materials, documenting a period of apparent flood inactivity at Lake Moo (Figs. 3, 7). This is followed by a reactivation of flood processes from ca. 1800 CE (i.e., coarse-grained flood deposits within Units 4–5; Figs. 3, 7) with a minimum of 5 events to a maximum of 12 events every 100 years, as the confidence range associated with the calibrated age at 2.80 m is rather wide (146–14 cal yr BP; Fig. 7). Despite the low degree of precision affecting radiocarbon ages younger than 200 years, this renewed increase in flood activity fits well with the instrumental record that points to a significant increase in record-breaking (from 3 to 24 h accumulations) precipitation events in the northern Apennines (Libertino et al., 2019) starting from the second half of the last century. These phenomena seem to be responsible for the replacement of lake deposits by subaerial ones through an erosional contact (Unit 4 lower boundary).
To compare the most recent stratigraphic units (Units 4–5) with quantitative climate data, the instrumental temperature values, available since the second half of the last century from the Eraclito ER dataset, has been added to the Verdarolo curve. The overlap with the latest part of the Verdarolo curve confirms the good accuracy of the reconstruction technique in this region (Fig. 8). The recent sharp temperature increase is striking if compared with the whole Holocene, and the current July temperature is comparable with the maximum temperature reached at HTM over the study area. The actual trend of July temperature, estimated over the period 1961–2018 from monthly mean values, is +4.3 ∘C in 100 years. The trend is statistically significant, with p value = 0.0004 (see Sect. 3.4), and more than double the maximum temperature gradient found in the Verdarolo curve at +2 ∘C per 100 years at the end of the Little Ice Age (1850–1900). From Figs. 6 and 7, we observe flood intensification corresponding to periods of rising temperatures. This is testified by the exceptionally high accumulation rate estimated on the recent period for Units 4–5 (Fig. 6; Sect. 4.3), a rate of about 1 m per 100 years calculated since ca. 1800 CE. The recent increase in flood activity is also supported by instrumental data, wherein we also observe an emerging trend (not yet significant) of precipitation intensity increase (as both a daily maximum and monthly cumulative values) in the autumn months (Fig. 9).
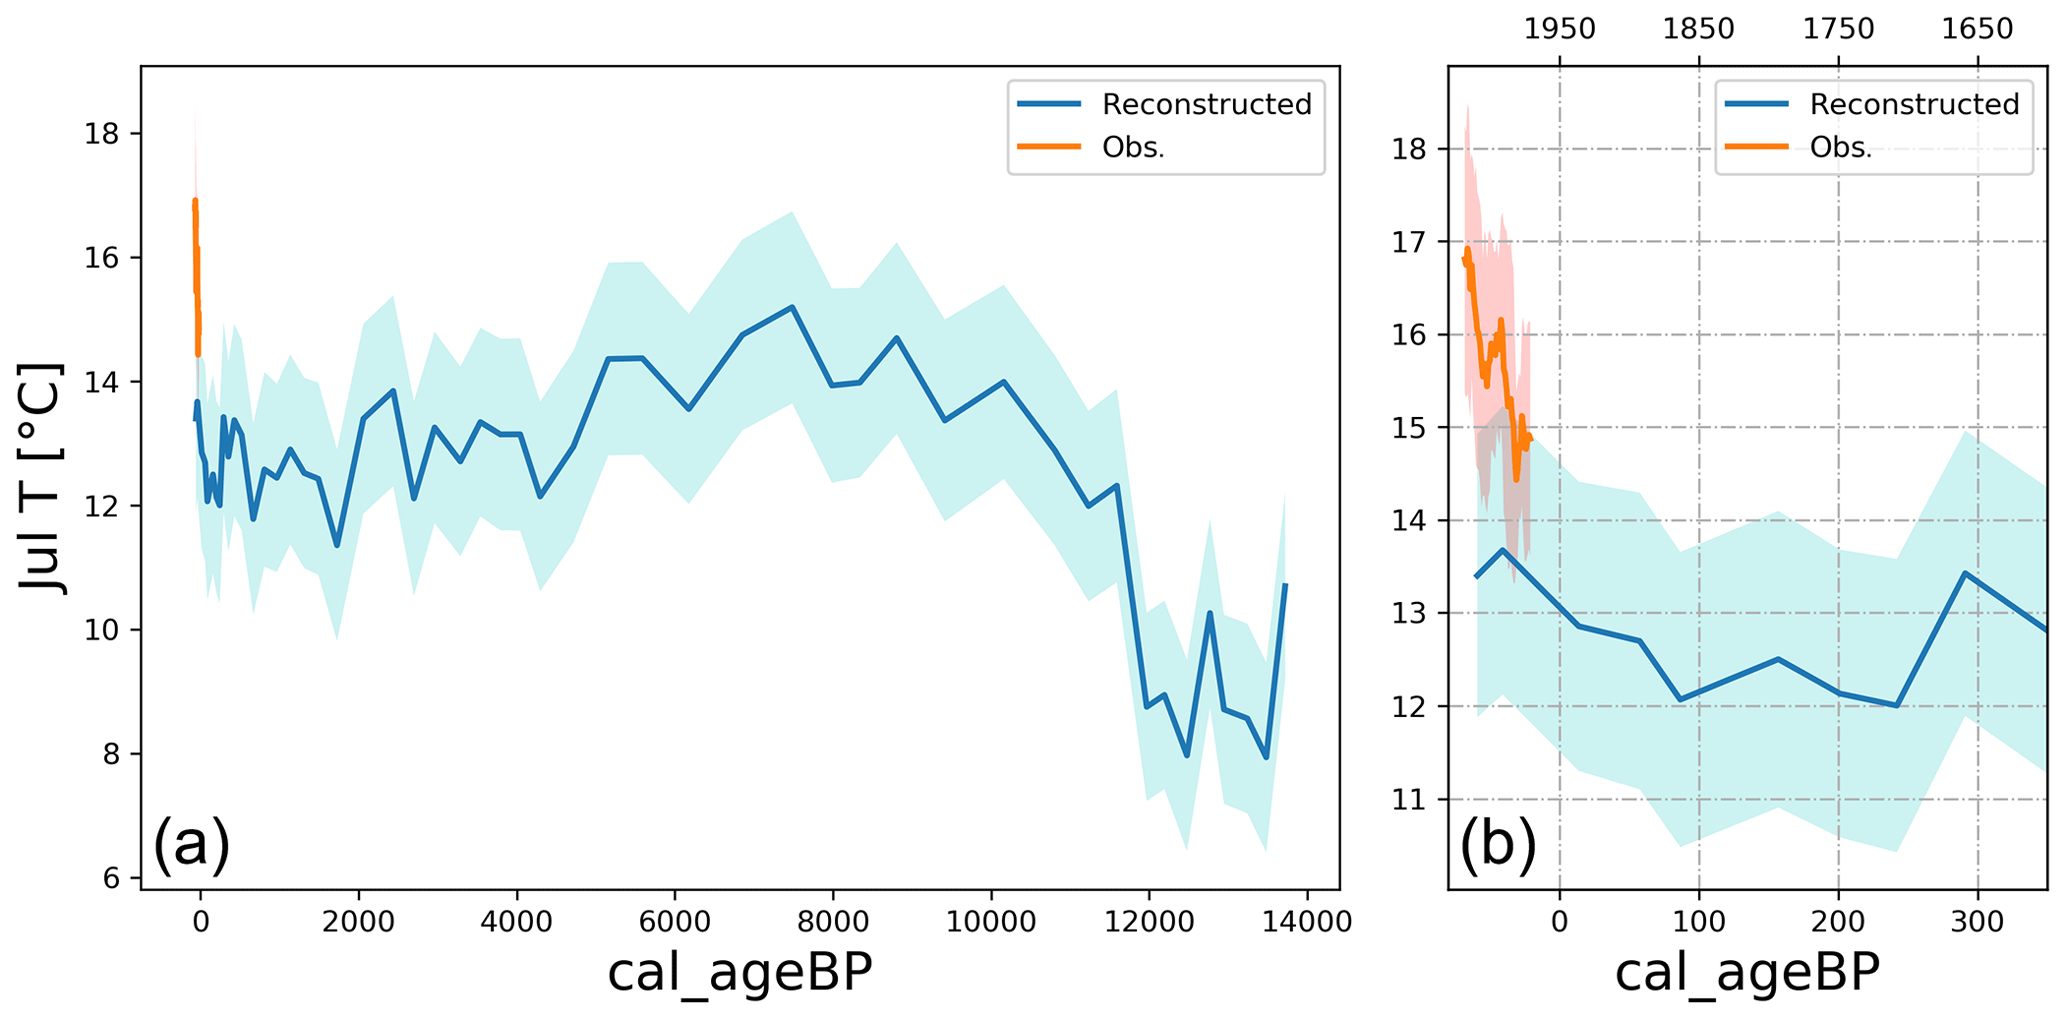
Figure 8Comparison of current data and reconstructed July mean temperature at the Lake Verdarolo site (see Fig. 1 for location). The blue line is the reconstructed temperature, and the shaded area is the sample-specific estimated standard error associated with the temperature reconstruction based on the chironomid assemblage from Samartin et al. (2017). The orange line represents the July mean temperature (1961–2018) retrieved for the grid cell of Lake Verdarolo from the Emilia–Romagna climate reanalysis Eraclito (11-year running average). The shaded orange area is ± 1 standard deviation. The full available period is reported on the left, while a zoom into the most recent period (since 1600 CE) is shown on the right.
5.1 Holocene flood activity, paleotemperature changes and HIP events
A positive link emerges correlating Holocene (July) paleotemperatures, precipitation intensity reconstructions and flood history (Fig. 7) at the study site, as the stratigraphic units showing the highest frequency of coarse-grained flood deposits (i.e., Units 2, 4 and 5) invariably fall into periods of higher temperatures (i.e., HTM and the post-LIA time). This strongly supports the hypothesis that greater warmth favors the occurrence of extreme precipitation events, probably more frequently at the end of the summer–autumn as already reported by other authors (e.g., Marcott et al., 2013; Giguet-Covex et al., 2012). Although the process attribution and the geographical uniformity of the HTM wet phase are still a matter of debate, the abundance of coarse-grained flood deposits within the Lake Moo record around 9.5–5.5 kyr BP suggests a precipitation increase also identified in other sites of the central and southern Mediterranean (Magny et al., 2012b).
However, local factors such as changes in vegetation cover (i.e., tree cover percentage) due to human disturbance and fires could have significantly contributed to enhancing slope erosion and then influenced the Lake Moo sedimentary record, partly weakening our reconstruction of the temperature–HIP–flood activity relationship at the Holocene scale. In order to overcome this issue, we explored and compared the pollen and microcharcoal content of two key intervals (I1 and I2 in Figs. 7, 10) that are characterized by a different flood record (high versus low flood activity) formed during consecutive periods of distinct climate conditions: the HTM and the following cooling. The difference in mean temperature between I1 and I2, obtained by averaging the corresponding chronological intervals in the Verdarolo paleotemperature curve, is +1.3 ∘C, while the maximum difference reaches +3.1 ∘C (Fig. 8).
For the post-LIA interval, in particular since 1950 CE, no significant contribution to debris mobilization can be attributed to vegetation landscape changes along the slopes as Lake Moo is a protected area characterized by dense forests (Corticelli et al., 2011; Sect. 2.1). Consistently, the most recent pollen sample (P14 yielding an age of 146–14 cal yr BP; Fig. 7) shows a tree cover of about 80 %.
The main considerations arising from the in-depth analysis of I1 and I2 are the following.
-
For I1 (ca. 9.5–7 kyr BP; 10.5–9 m of core depth), the woody component (i.e., tree cover percent) is invariably higher than the herbaceous one, and it shows a value of 80 % on average. The conifers, mainly represented by pines and silver fir, are dominant with respect to the deciduous trees (e.g., Corylus avellana and Quercus), reaching a maximum of 95 % within the P4 sample dated between 9.3 and 9.1 cal kyr BP. Interestingly, Abies alba shows the highest percentages (ca. 15 %–55 %) within the chronological interval that corresponds to the warmest period of the HTM (Figs. 7, 10; Samartin et al., 2017). Moreover, A. alba reaches the peak of ca. 55 % during the HTM wettest conditions (around 7.5–7.3 cal kyr BP; I1 humid period in Fig. 7), as reconstructed by several authors (Regatieri et al., 2014; Zanchetta et al., 2011; Zhornyak et al., 2011) from the Apuan Alps speleothems. This trend is consistent with the fact that A. alba is a warm-temperature tree with a preference for high moisture availability (Tinner et al., 2013), as clearly documented within the nearby Lake Greppo record (Vescovi et al., 2010, confirming higher rainfall accumulation already highlighted by lake-level dynamics from the Jura Mountains and central–northern Italy; Magny et al., 2004, 2009, 2012b). Although no specific inferences can be made on past water levels of Lake Moo, it is interesting to note that the low amount of hygrophytes and aquatics (Fig. 7) is fully consistent with highstand conditions. Anthropogenic indicator taxa (Fig. 7), as well as the anthropogenic index (AI; Fig. 10), show very low values throughout the interval, documenting a negligible human impact on the area in accordance with the extremely low content of microcharcoals (0.01–0.13 mm2 g−1; Fig. 10). Besides, the coarser microcharcoals (>125 µm) are not recorded, suggesting no significant local fires. A slightly higher amount of anthropogenic indicator taxa occurs within sample P6, dated between 8070 and 7880 ca yr BP; this is interpreted as an effect of categorization difficulties about spontaneous taxa such as Artemisia vulgaris type, Chenopodium, Plantago and Urtica.
Palynological data, combined with the stratigraphic interpretation of the S1 core, support our hypothesis that warmer and wetter conditions typical of the HTM led to a high amount of HIP and then high flood activity in the basin, independently of local factors. The presence of an extensive vegetation cover along the slopes implies the need for even more intense rainfall to trigger a debris mobilization that leads to the deposition of thick, coarse-grained layers containing pebbles with remarkable diameters (LM6, LM7 and LM8 in Fig. 10).
-
For I2 (ca. 5.5–3.8 kyr BP.; 5.5–4.5 m of core depth), tree cover reduction (ranging between ca. 87.4 % and 45.1 %; Figs. 7, 9), in favor of grassland expansion, characterizes this interval that sees a fall in A. alba percentages (commonly less than 10 %) and a high amount of meadow taxa (mainly Poaceae, Cichorioideae and Asteroideae; Fig. 7). The growth in hygrophytes and aquatics (up to ca. 18.2 %) is consistent with a marginal lacustrine environment and then a relative lowering of the water level. Both anthropogenic indicator taxa and AI increase, up to ca. 7.3 % and 16.2 %, respectively (Figs. 7, 9), suggesting a moderate degree of human impact on the vegetation cover (i.e., tree cover changes). This impact is probably due to pastoral activities more than agriculture as few cereal grains are locally encountered (less than 4 %). Accordingly, the meadow (pasture) taxa are abundant, and coprophilous fungi and others spores (Sporormiella, Dicrocoelium and Ascaris; Figs. 7, 9) are sporadically found. By contrast, microcharcoal remains very low in amount, pointing to little fire activity.
Although pollen-derived vegetation features (i.e., decrease in tree cover and a moderate degree of human impact) document local conditions more favorable for debris flow activation with respect to those characterizing I1, this interval shows low flood activity with few and thin (<5 cm) sandy deposits (LM9 to LM10 in Fig. 10). Integrating the I2 stratigraphic record with pollen data, such low flood activity most likely reflects a low frequency (and intensity) of HIP events during a cooler and less humid period (Figs. 7, 9).

Figure 9Monthly mean 2 m temperature (a), accumulated precipitation (b) and maximum daily precipitation (c) for 1961–1990 (blue) and 1991–2018 (green) computed over the Lake Moo site grid cell of the Eraclito reanalysis (grid cell 258, Ferriere Municipality). Confidence intervals at 95 % significance (black vertical segments) are computed with a bootstrapping method (1000 iterations) as part of the Seaborn Python library.
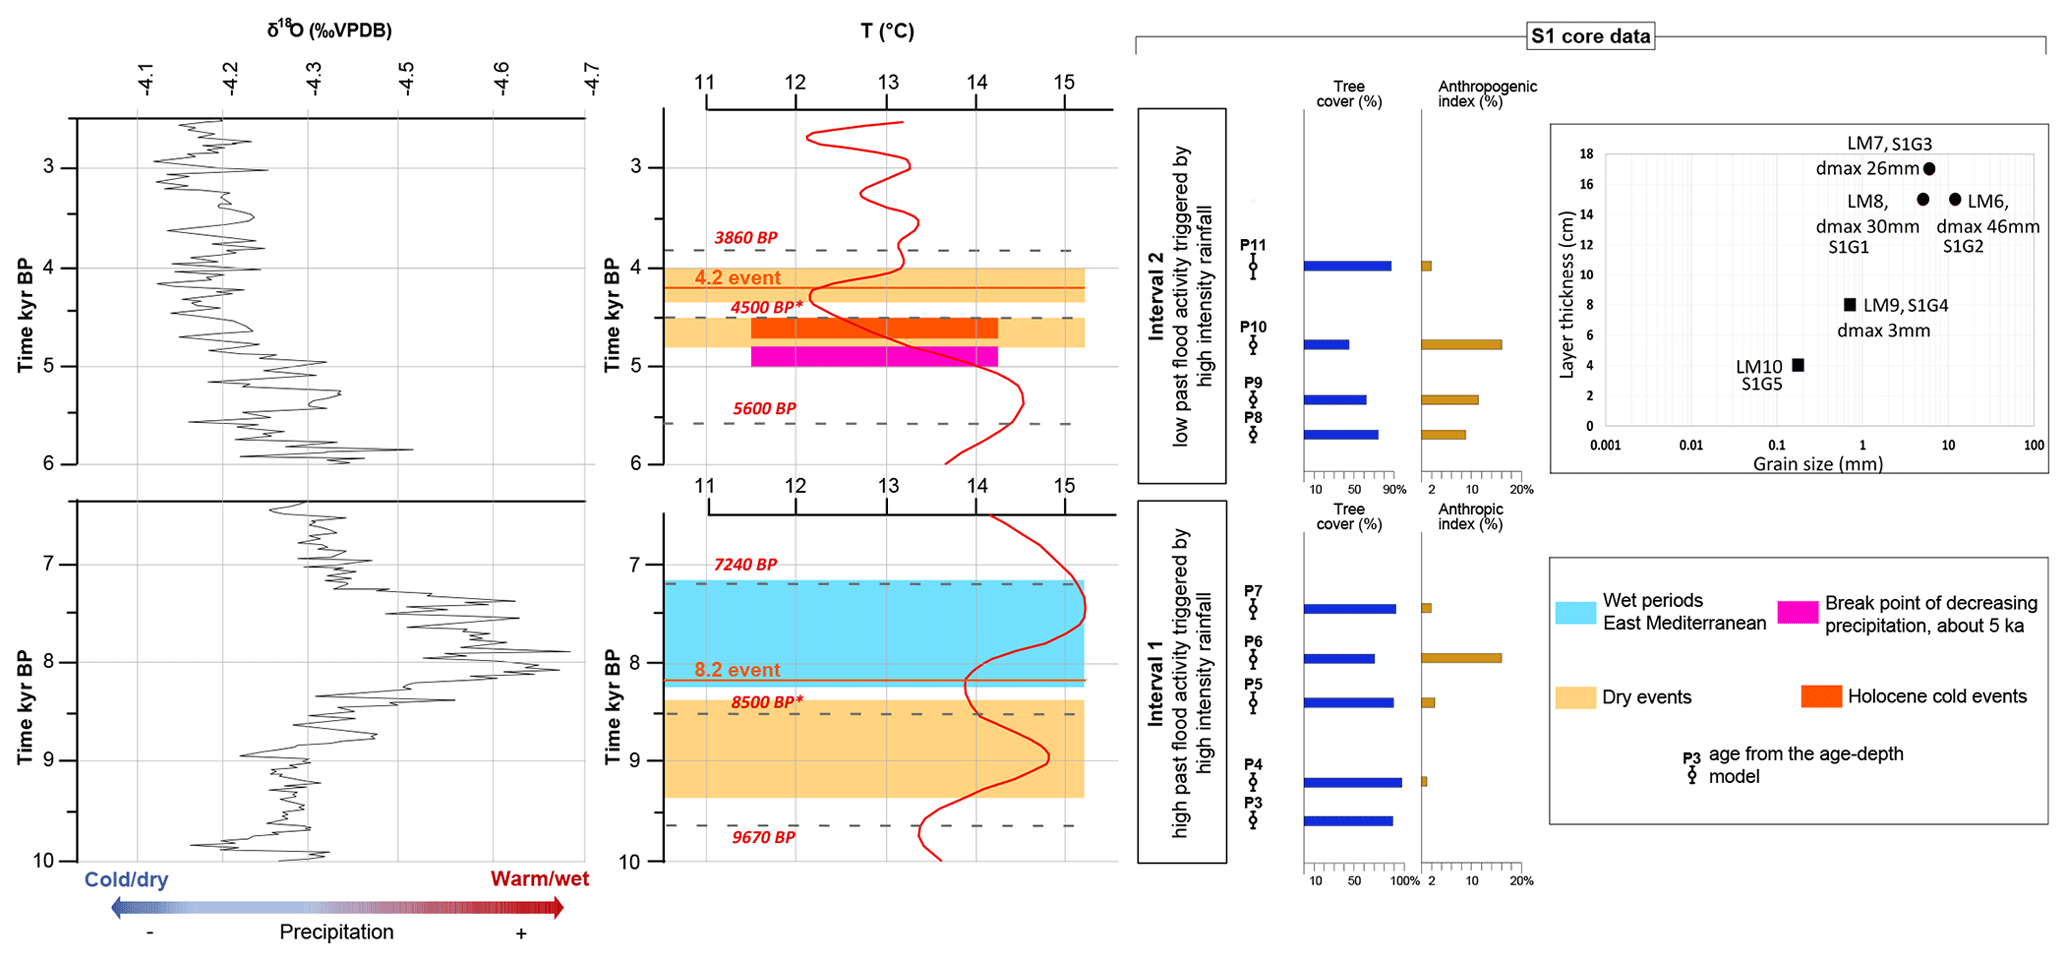
Figure 10Sedimentological and palynological features of two key stratigraphic intervals (Intervals 1 and 2) from the reference core S1. These features are compared with the most relevant paleoclimate data available from the literature for the area of interest (for references, please see Fig. 7). The anthropogenic index (AI) has been calculated as (anthropogenic indicator ∕ tree percentage)⋅100 following Accorsi et al. (1999). Asterisks point to samples containing coprophilous fungi and other spores like Sporormiella, Dicrocoelium and Ascaris. Core S1 sample ages derive from the age–depth model reported in Fig. 6. P samples correspond to the pollen samples; LM labels refer to the lithofacies explained in the text (Sect. 4.1) and in Figs. 3–4; dmax corresponds to the maximum diameter.
The paleoenvironmental–paleovegetation features characterizing the Interval 2 persists up-core, in correspondence to Unit 3 that records apparent flood inactivity (Figs. 3, 7). The uppermost sample P14 likely tracks a strong increment of A. alba.
Placing present climate conditions into a geological perspective, beyond the instrumental era, is essential for understanding changes in the hydrological cycle induced by anthropogenic climate warming, complementing projections of model simulations. Physical reasons and regional climate reconstructions are consistently pointing to an increase in precipitation intensity when water vapor is not limited. In the last decade, record-breaking rainfall events have frequently occurred around the world. This trend is emerging with variable strength in different areas. Therefore, in the attempt to build confidence in the extreme precipitation trend, we extended our analysis, passing from the instrumental to the geological timescale (i.e., the Holocene period). This choice implies a robust multidisciplinary approach, which includes, in addition to climate and meteorological data, proxy and expertise coming from the geological, geomorphological, stratigraphic and palynological–microanthracological area.
The major outcomes of our work can be summarized as follows.
-
The matching of instrumental temperature data and paleoenvironmental data allow us to affirm that current summer temperature is comparable with the temperature recorded in the northern Apennines during the HTM. The current temperature trend computed from the monthly values of July temperature at the Lake Verdarolo site over the period 1961–2018 is +4.3 ∘C per 100 years (highly statistically significant), and it is likely to be one of the highest recorded in the Holocene.
-
The stratigraphic units showing a high frequency of coarse-grained flood deposits are Unit 2, deposited in the HTM, and Units 4 and 5, which belong to the post-LIA time. Both periods are characterized by higher temperatures. The human impact is almost absent in the HTM and very low in the post-LIA time, especially in the last part of the 20th century. This strongly supports the hypothesis that greater warmth favors the occurrence of extreme precipitation events. In particular, the recent sedimentation rate computed since ca. 1800 CE (post-LIA) is at least 1 m per 100 years. This high value of the sedimentation rate has to be correlated with the presence of numerous coarse-grained levels within Units 4 and 5, after a period of absence of flood deposits in subunit 3b. This difference in flood layers must be linked to an increase in HIP over the Lake Moo basin since we could not attribute it to any other changes in physiographic or vegetation dynamics (i.e., tree cover). During the HTM and current time, the forested area coverage around Lake Moo has persisted at high values, and this factor is considered disadvantageous for debris mobilization. On the contrary, during about 6–4 kyr BP we did not find any increase in coarse-grained layers from flood events, even though the forested area declined significantly and the anthropogenic impact increased.
-
HIP increase in response to higher temperature is already detectable in observation series. We found evidence that this also occurred in the past, especially during the HTM, as testified by the higher deposition of coarse-grained levels. A comparison with the past helps to understand future projections for the area. However, we are aware that past evolution cannot be taken as a perfect analogy for the future due to the different forcing and consequent response of the climate system (D'Agostino et al., 2019). As temperature will continue to increase in the Mediterranean area, precipitation intensity would keep increasing over the northern Apennines. We hypothesize that precipitation intensity increase will be more evident in months with cooler and moist air masses, like in autumn and in winter, when moisture availability is not limited. An increase in precipitation maxima in autumn months is already emerging on the northern Apennines.
The Lake Moo basin proves to be an ideal study area to achieve a reconstruction between high-intensity precipitation and debris flow due to its position relative to the dominant atmospheric flow and favorable geological, geomorphological and vegetation characteristics. Further investigations, in association with other analogous sites along the northern Apennines crest, are planned to provide a multi-site assessment of the dynamics of past extreme precipitation events.
Original data acquired during the field campaign (including pollen counts, radiocarbon analysis and photos) are available on the open data repository of ARPAE Emilia–Romagna (https://arpaeprv.datamb.it/dataset/lake-moo, Grazzini et al., 2019).
The supplement related to this article is available online at: https://doi.org/10.5194/cp-16-1547-2020-supplement.
SS and FG developed the idea and the research activity planning and execution. SN, MA and MTDN have taken care of the administrative aspects. All authors, except for SN and MTDN, contributed to field activity. Granulometric analysis was conducted by AC. Pollen analysis was conducted by SM and MM; data elaboration and figures were created by VR, SM and MM. SS, FG and VR prepared the paper with contributions from all co-authors. FG provided management and coordination.
The authors declare that they have no conflict of interest.
We are very grateful for all comments received in the public discussion; in particular, we thank reviewers Picotti and Tinner for their useful suggestions. Finally, we thank Francesca Staffilani (Geological, Seismic and Soil Service, Emilia–Romagna region) for the pedological data interpretation.
This research has been supported by the Regional Agency of Civil Protection and the Geological, Seismic and Soil Survey of the Emilia-Romagna Region in the framework of the cooperation agreement with ARPAE-SIMC.
This paper was edited by Keely Mills and reviewed by Vincenzo Picotti and Willy Tinner.
Accorsi, C. A., Bandini Mazzanti, M., Forlani, L., Mercuri, A. M., and Trevisan Grandi, G.: An overview of Holocene forest pollen flora/vegetation of the Emilia Romagna region – Northern Italy, Archivio Geobotanico, 5, 3–27, 1999.
Ahlborn, M., Armon, M., Ben Dor, Y., Neugebauer, I., Schwab, M. J., Tjallingii, R., Shoqeir, J. H., Morin, E., Enzel, Y., and Brauer, A.: Increased frequency of torrential rain storms during a regional late Holocene eastern Mediterranean drought, Quaternary Res., 89, 425–431, https://doi.org/10.1017/qua.2018.9, 2018.
Anselmetti, F., Wirth, S. B., Glur, L., and Gilli, A.: Holocene flood frequency as reconstructed by lake sediments from multiple archives: A record influenced by solar forcing and atmospheric circulation patterns, in: Late Pleistocene and Holocene climatic variability in the Carpathian-Balkan region, Abstracts Volume, edited by: Mindrescu, M. and Gradinaru, I., Special Issue, Scientific Annals of Stefan cel Mare University of Suceava Geography Series, 24, 1–2, 2014.
Antolini, G., Auteri, L., Pavan, V., Tomei, F., Tomozeiu, R., and Marletto, V.: A daily high-resolution gridded climatic data set for Emilia-Romagna, Italy, during 1961–2010, Int. J. Climatol., 36, 1970–1986, https://doi.org/10.1002/joc.4473, 2016.
Ballesteros-Cánovas, J. A., Stoffel, M., St. George, S., and Hirschboeck, K.: A review of flood records from tree rings, Prog. Phys. Geogr., 39, 1–23, https://doi.org/10.1177/0309133315608758, 2015.
Berg, P., Moseley, C., and Haerter, J. O.: Strong increase in convective precipitation in response to higher temperatures, Nature Geosci., 6, 181–185, https://doi.org/10.1038/ngeo1731, 2013.
Berglund, B. E. and Ralska-Jasiewiczowa, M.: Pollen analysis and pollen diagrams, in: Handbook of Holocene Palaeoecology and Palaeohydrology, edited by: Berglund, B. E., Chichester, John Wiley & Sons, 455–484, 1986.
Beug, H. J.: Leifaden der Pollenbestimmungen für Mitteleuropa und angrenzende Gebiete, Pfeil, München, 2004.
Brönnimann, S., Rohr, C., Stucki, P., Summermatter, S., Bandhauer, M., Barton, Y., Fischer, A., Froidevaux, P., Germann, U., Grosjean, M., Hupfer, F., Ingold, K., Isotta, F., Keiler, M., Martius, O., Messmer, M., Mülchi, R., Panziera, L., Pfister, L., Raible, C. C., Reist, T., Rössler, O., Röthlisberger, V., Scherrer, S., Weingartner, R., Zappa, M., Zimmermann, M., and Zischg, A. P.: 1868 – L'alluvione che cambiò la Svizzera: Cause, conseguenze e insegnamenti per il futuro, Geographica Bernensia, G94, 52, https://doi.org/10.4480/GB2018.G94.02, 2018a.
Brönnimann, S., Rajczak, J., Fischer, E. M., Raible, C. C., Rohrer, M., and Schär, C.: Changing seasonality of moderate and extreme precipitation events in the Alps, Nat. Hazards Earth Syst. Sci., 18, 2047–2056, https://doi.org/10.5194/nhess-18-2047-2018, 2018b.
Brugnara, Y. and Maugeri, M.: Daily precipitation variability in the southern Alps since the late 19th century, Int. J. Climatol., 39, 3492–3504, https://doi.org/10.1002/joc.6034, 2019.
Cacciamani, C., Cesari, D., Grazzini, F, Paccagnella, T., and Pantone, M.: Numerical Simulation of Intense Precipitation Events South of the Alps: Sensitivity to Initial Conditions and Horizontal Resolution, Meteorol. Atmos. Phys., 72, 147–159, https://doi.org/10.1007/s007030050012, 2000.
Carton, A. and Panizza, M. (Eds.): Il paesaggio fisico dell'Alto Appennino Emiliano, Grafis Edizioni, Bologna, Italia, 1988.
Clark, R. L.: Point count estimation of charcoal in pollen preparations and thin sections of sediments, pollen et spores, 24, 523–553, ISSN 0375-9636, Pollen et spores, 1982.
Combourieu-Nebout, N., Peyron, O., Bout-Roumazeilles, V., Goring, S., Dormoy, I., Joannin, S., Sadori, L., Siani, G., and Magny, M.: Holocene vegetation and climate changes in the central Mediterranean inferred from a high-resolution marine pollen record (Adriatic Sea), Clim. Past, 9, 2023–2042, https://doi.org/10.5194/cp-9-2023-2013, 2013.
Corticelli, S., Garberi, M. C., Mariani, M. C., and Masi, S.: Uso del suolo 2008, available at: http://geoportale.regione.emilia-romagna.it/it/download/dati-e-prodotti-cartografici-preconfezionati/pianificazione-e-catasto/uso-del-suolo-1/2008-coperture-vettoriali-uso-del-suolo-edizione-2011 (last access: August 2020), 2011.
D'Agostino, R., Bader, J., Bordoni, S., Ferreira, D., and Jungclaus, J.: Northern Hemisphere monsoon response to mid-Holocene orbital forcing and greenhouse gas-induced global warming, Geophys. Res. Lett., 46, 1591–1601, https://doi.org/10.1029/2018GL081589, 2019.
Elter, P., Ghiselli, F., Marroni, M., and Ottria, G. (Eds.): Note illustrative del Foglio 197 “Bobbio” della Carta Geologica d'Italia alla scala 1:50.000, Istituto Poligrafico e Zecca dello Stato, Roma, Italia, 1997.
Faegri, K. and Iversen, J.: Textbook of Pollen analysis, edited by: Faegri, K., Kaland, P. E., and Krzywinski, K., John Wiley & Sons Ltd, Chichester, UK, Ed. 4, 348 pp., ISBN 0471937193, 1989.
Finsinger, W., Tinner, W., and Hu, F. S.: Rapid and accurate estimates of microchacoal in pollen slide, in: Charcoals from the Past, edited by: Fiorentino, G. and Magri, D., BAR int Ser., 121–124, 2008.
Frei, C. and Schär, C.: A precipitation climatology of the Alps from high-resolution rain-gauge observations, Int. J. Climatol., 18, 873–900, https://doi.org/10.1002/(SICI)1097-0088(19980630)18:8<873::AID-JOC255>3.0.CO;2-9, 1998.
Geological, Seismic and Soil Service of the Emilia-Romagna Region: Landslide characteristics in Emilia-Romagna (data available at: https://ambiente.regione.emilia-romagna.it/en/geologia/temi/dissesto-idrogeologico/le-caratteristiche-dei-fenomeni-franosi-in-emilia-romagna, last access: 4 April 2020), 2012.
Giguet-Covex, C., Arnaud, F., Dirk, E., Jérôme, P., Laurent, M., Pierre, F., Fernand, D., Pierre-Jérôme, R., Bruno, W., and Jean-Jacques, D.: Frequency and intensity of high-altitude floods over the last 3.5ka in northwestern French Alps (Lake Anterne), Quaternary Res., 77, 12–22, https://doi.org/10.1016/j.yqres.2011.11.003, 2012.
Gilli, A., Anselmetti, F. S., Glur, L., and Wirth S. B.: Lake Sediments as Archives of Recurrence Rates and Intensities of Past Flood Events, in: Dating Torrential Processes on Fans and Cones, Advances in Global Change Research, edited by: Schneuwly-Bollschweiler, M., Stoffel, M., and Rudolf-Miklau, F., Springer Science Business Media, Dordrecht, Holland, 225–242, https://doi.org/10.1007/978-94-007-4336-6_15, 2013.
Glur, L., Wirth, S. B., Büntgen, U., Gilli, A., Haug, G. H., Schär, C., Beer, J., and Anselmetti, F. S.: Frequent floods in the European Alps coincide with cooler periods of the past 2500 years, Nature Sci. Rep., 3, 2770, https://doi.org/10.1038/srep02770, 2013.
Grazzini, F., Pratizzoli, W., and Tomei, F.: Drought and big snow, are extreme events the new normal? Ecoscienza, 1, available at: https://www.arpae.it/dettaglio_documento.asp?id=3674&idlivello=1171 (last access: August 2020), 2012 (in Italian).
Grazzini, F., Segadelli, S., and Fornasiero, A.: Precipitazioni estreme ed effetti al suolo sul reticolo minore: il caso del 14 Settembre 2015, Technical report ARPAE-SIMC/SGSS Emilia-Romagna, 27 pp., available at: https://www.arpae.it/dettaglio_notizia.asp?id=8017&idlivello=32 (last access: August 2020), 2016 (in Italian).
Grazzini, F., Segadelli, S., Marvelli, S., Marchesini, M., and Rossi, V.: Lake Moo Datasets, ARPAE, https://arpaeprv.datamb.it/dataset/lake-moo (last access: August 2020), 2019.
Grazzini, F., Craig, J. G., Keil, C., Antolini, G., and Pavan V.: Extreme precipitation events over Northern Italy: Part (I) a systematic classification with machine learning techniques, Q. J. Roy. Meteorol. Soc., 146, 69–85, https://doi.org/10.1002/qj.3635, 2020.
Heiri, O., Brooks, S. J., Birks, H. J. B., and Lotter, A. F.: A 274-lake calibration data-set and interference model for chironomid-based summer air temperature reconstruction in Europe, Quaternary Sci. Rev., 30, 3445–3456, 2011.
Henne, P. D., Bigalke, M., Büntgen, U., Colombaroli, D., Conedera, M., Feller, U., Frank, D., Fuhrer, J., Grosjean, M., Heiri, O., Luterbacher, J., Mestrot, A., Rigling, A., Rössler, O., Rohr, C., Rutishauser, T., Schwikowski, M., Stampfli, A., Szidat, S., Theurillat, J. P., Weingartner, R., Wilcke, W., and Tinner, W.: An empirical perspective for understanding climate change impacts in Switzerland, Reg. Environ. Change, 18, 205–221, https://doi.org/10.1007/s10113-017-1182-9, 2018.
Hussain, M. and Mahmud, I.: pyMannKendall: a python package for non parametric Mann Kendall family of trend tests, Journal of Open Source Software, 4, 1556, https://doi.org/10.21105/joss.01556, 2019.
Hungr, O., Leroueil, S., and Picarelli, L.: The Varnes classification of landslide types, an update, Landslides, 11, 167–194, https://doi.org/10.1007/s10346-013-0436-y, 2014.
Isotta, F., Frei, C., Weilguni, V., Percec Tadic, M., Lassègues, P., Rudolf, B., Pavan, V., Cacciamani, C., Antolini, G., Ratto, S. M., Munari, M., Micheletti, S., Bonati, V., Lussana, C., Ronchi, C., Panettieri, E., Marigo, G., and Vartacnik, G.: The climate of daily precipitation in the Alps: development and analysis of a high-resolution grid dataset from pan-Alpine rain-gauge data, Int. J. Climatol., 34, 1657–1675, https://doi.org/10.1002/joc.3794, 2014.
Krichak, S. O., Barkan, J., Breitgand, J. S., Gualdi, S., and Feldstein, S.: The role of the export of tropical moisture into midlatitudes for extreme precipitation events in the Mediterranean region, Theor. Appl. Climatol., 121, 499–515, https://doi.org/10.1007/s00704-014-1244-6, 2015.
Lehmann, J., Coumou, D., and Frieler, K.: Increased record-breaking precipitation events under global warming, Clim. Change, 132, 501, https://doi.org/10.1007/s10584-015-1434-y, 2015.
Longman, J., Ersek, V., Veres, D., and Salzmann, U.: Detritical events and hydroclimate variability in the Romanian Carpathians during the mid-to-late Holocene, Quaternary Sci. Rev., 167, 78–95, 2017.
Libertino, A., Ganora, D., and Claps, P.: Evidence for increasing rainfall extremes remains elusive at large spatial scales: The case of Italy, Geophys. Res. Lett., 46, 7437–7446, https://doi.org/10.1029/2019GL083371, 2019.
Lowe, D. R.: Sediment gravity flows; Depositional models with special reference to the deposits of high-density turbidity currents, J. Sediment. Petrol., 52, 279–297, 1982.
Lowe, J. J., Accorsi, C. A., Bandini Mazzanti, M., Bishop, V., Van der Kaars, S., Forlani, L., Mercuri, A. M., Rivalenti, C., Torri, P., and Watson, C.: Pollen stratigraphy of sediment sequences from carter lakes Albano and Nemi (near Rome) and from the central Adriatic, spanning the interval from oxygen isotope stage 2 to the present day, Mem. Ist. Ital. Idrobiol., 55, 71–98, 1996.
Magny, M.: Holocene climate variability as reflected by mid-European lake-level fluctuations and its probable impact on prehistoric human settlements, Quaternary Int., 113, 65–79, 2004.
Magny, M., Galop, D., Bellintani, P., Desmet, M., Didier, J., Hass, J. N., Martinelli, N., Pedrotti, A., Scandolari, S., Stock, A., and Vannière, B.: Late-Holocene climatic variability south of the Alps as recorded by lake-level fluctuations at Lake Ledro, Trentino, Italy, Holocene, 19, 575–589, 2009.
Magny, M., Joannin, S., Galop, D., Vanniere, B., Haas, J. N., Bassetti, M., Bellintani, P., Scandolari, R., and Desmet, M.: Holocene palaeohydrological changes in the northern Mediterranean borderlands as reflected by the lake-level record of Lake Ledro, northeastern Italy, Quaternary Res., 77, 382–396, 2012a.
Magny, M., Peyron, O., Sadori, L., Ortu, E., Zanchetta, G., Vannière, B., and Tinner, W.: Contrasting patterns of precipitation seasonality during the Holocene in the south- and north-central Mediterranean, J. Quaternary Sci., 27, 290–296, https://doi.org/10.1002/jqs.1543, 2012b.
Marchetti, G. and Fraccia, R.: Carta geomorfologica dell'alta Val Nure, Appennino piacentino, Scala 1:25.000, in: Il paesaggio fisico dell'Alto Appennino Emiliano, Regione Emilia-Romagna, edited by: Carton, A. and Panizza, M., Grafis Edizioni, Bologna, Italia, 1988.
Marcott, S., Shakun, J., Clark, P. U., and Mix, A. C.: A Reconstruction of Regional and Global Temperature for the Past 11,300 Years, Science, 339, 1198–1201, https://doi.org/10.1126/science.1228026, 2013.
Marroni, M., Meneghini, F., and Pandolfi, L.: Anatomy of the Ligure-Piemontese subduction system: evidence from Late Cretaceous-middle Eocene convergent margin deposits in the Northern Apennines, Italy, International Geology Review, 52, 1160–1192, https://doi.org/10.1080/00206810903545493, 2010.
Milliman, J. D. and Syvitski, J. P. M.: Geomorphic/Tectonic Control of Sediment Discharge to the Ocean: The Importance of Small Mountainous Rivers, J. Geol., 100, 525–544, https://doi.org/10.1086/629606, 1992.
Moore, P. D., Webb, J. A., and Collinson, M. E.: Pollen Analysis, Oxford, 1991.
Mulder, T. and Syvitski, J. P. M.: Turbidity Currents Generated at River Mouths during Exceptional Discharges to the World Oceans, J. Geol., 103, 285–299, https://doi.org/10.1086/629747, 1995.
Mutti, E.: Turbidite Sandstones, San Donato Milanese, Agip-Istituto di Geologia, Università di Parma, 275 pp., 1992.
Mutti, E., Davoli, G., Tinterri, R., and Zavala, C.: The importance of ancient fluvio-deltaic systems dominated by catastrophic flooding in tectonically active basins, Memorie di Scienze Geologiche, Università di Padova, 48, 233–291, 1996.
Myhre, G., Alterskjær, K., Stjern, C. W., Hodnebrog, Ø., Marelle, L., Samset, B. H., Sillmann, J., Schaller, N., Fischer, E., Schulz, M., and Stohl, A.: Frequency of extreme precipitation increases extensively with event rareness under global warming, Sci. Rep., 9, 16063, https://doi.org/10.1038/s41598-019-52277-4, 2019.
Oswald, W. W., Anderson, P. M., Brown, T. A., Brubaker, L. B., Hu, F. S., Lozhkin, A. V., Tinner, W., and Kaltenrieder, P.: Effects of sample mass and macrofossil type on radiocarbon dating of arctic and boreal lake sediments, The Holocene, 15, 758–767, 2005.
Papalexiou, S. M. and Montanari, A.: Global and regional increase of precipitation extremes under global warming, Water Resour. Res., 55, 4901–4914, https://doi.org/10.1029/2018WR024067, 2019.
Patterson, W. A., Edwards, K. J., and Maguire, D. J.: Microscopic charcoal as a fossil indicator of fire, Quaternary Sci. Rev., 6, 3–23, https://doi.org/10.1016/0277-3791(87)90012-6, 1987.
Pignatti, S.: Flora d'Italia, Edagricole-New Business Media, Milano, Vol 1–Vol 4, 2017–2019.
Prein, A. F., Rasmussen, R. M., Ikeda, K., Liu, C., Clark, M. P., and Holland, G. J.: The future intensification of hourly precipitation extremes, Nature Clim. Change, 7, 48–52, https://doi.org/10.1038/nclimate3168, 2017.
Regattieri, E., Zanchetta, G., Drysdale, R. N., Isola. I., Hellstrom, J. C., and Dallai, L.: Lateglacial to Holocene trace element record (Ba, Mg, Sr) from Corchia Cave (Apuan Alps, central Italy): paleoenvironmental implications, J. Quaternary Sci., 29, 381–392, https://doi.org/10.1002/jqs.2712, 2014.
Reimer, P. J., Bayliss, A., Warren Beck, J., Blackwell, P. G., Ramsey, C. B., Buck, C. E., Cheng, H., Edwards, R. L., Friedrich, M., Grootes, P. M., Guilderson, T. P., Haflidason, H., Hajdas, I., Hatté, C., Heaton, T. J., Hoffmann, D. L., Hogg, A. G., Hughen, K. A., Kaiser, K. F., Kromer, B., Manning, S. W., Niu, M., Reimer, R. W., Richards, D. A., Scott, E. M., Southon, J. R., Staff, R. A., Turney, C. S. M., and van der Plicht, J.: IntCal13 and Marine13 Radiocarbon Age Calibration Curves 0–50,000 Years cal BP, Radiocarbon, 55, 1869–1887, https://doi.org/10.2458/azu_js_rc.55.16947, 2013.
Renssen, H., Seppä, H., Crosta, X., Goosse, H., and Roche, D. M.: Global characterisation of the Holocene Thermal Maximum, Quaternary Sci. Rev., 48, 7–19, 2012.
Samartin, S., Heiri, O., Joos, F., Renssen, H., Franke, J., Brönnimann, S., and Tinner, W.: Warm Mediterranean mid-Holocene summers inferred from fossil midge assemblages, Nature Geosci., 10, 207–212, https://doi.org/10.1038/NGEO2891, 2017.
Scherrer, S. C., Fischer, E. M., Posselt, R., Liniger, M. A., Croci-Maspoli, M., and Knutti, R.: Emerging trends in heavy precipitation and hot temperature extremes in Switzerland, J. Geophys. Res.-Atmos., 121, 2626–2637, https://doi.org/10.1002/2015JD024634, 2016.
Schillereff, D., Chiverrell, R. C., Macdonald, N., and Hooke, J. M.: Flood stratigraphies in lake sediments: A review, Earth-Sci. Rev., 135, 17–37, https://doi.org/10.1016/j.earscirev.2014.03.011, 2014.
Schneuwly-Bollschweiler, M., Stoffel, M., and Rudolf-Miklau, F. (Eds.): Dating Torrential Processes on Fans and Cones. Methods and Their Application for Hazard and Risk Assessment, Springer, https://doi.org/10.1007/978-94-007-4336-6, 2013.
Segadelli, S., Grazzini, F., Adorni, M., De Nardo, M. T., Fornasiero, A., Chelli, A., and Cantonati, M.: Predicting Extreme-Precipitation Effects on the Geomorphology of Small Mountain Catchments: Towards an Improved Understanding of the Consequences for Freshwater Biodiversity and Ecosystems, Water, 12, 79, https://doi.org/10.3390/w12010079, 2020.
Skinner, C. B. and Poulsen, C. J.: The role of fall season tropical plumes in enhancing Saharan rainfall during the African Humid Period, Geophys. Res. Lett., 43, 349–358, https://doi.org/10.1002/2015GL066318, 2016.
Stoffel, M., Butler, D. R., and Corona, C.: Mass movements and tree rings: A guide to dendrogeomorphic field sampling and dating, Geomorphology, 200, 106–120, https://doi.org/10.1016/j.geomorph.2012.12.017, 2013.
Stoffel, M., Wyzga, B., and Marston, R. A.: Floods in mountain environments: A synthesis, Geomorphology, 272, 1–9, https://doi.org/10.1016/j.geomorph.2016.07.008, 2016.
Swierczynski, T., Ionita, M., and Pino, D.: Using archives of past floods to estimate future flood hazards, Eos, 98, https://doi.org/10.1029/2017EO066221, 2017.
Tinner, W., Colombaroli D., Heiri, O., Henne, P., Steinacher, M., Untenecker, J., Vescovi, E., Allen, J., Carraro, G., Conedera, M., Joos, F., Lotter, A., Luterbacher, J., Samartin, S., and Valsecchi, V.: The past ecology of Abies alba provides new perspectives on future responses of silver fir forests to global warming, Ecol. Monogr., 83, 419–439, 2013.
Tutin, T. G., Heywood, V. H., Burges, N. A., and Valentine, D. H.: Flora Europaea, Cambridge University Press, 1964–1993.
Utsumi, N., Seto, S., Kanae, E., Maeda, E., and Oki, T.: Does higher surface temperature intensify extreme precipitation?, Geophys. Res. Lett., 38, L16708, https://doi.org/10.1029/2011GL048426, 2011.
Vescovi, E., Ammann, B., Ravazzi, C., and Tinner, W.: A new Late-glacial and Holocene record of vegetation and fire history from Lago del Greppo, northern Apennines, Italy, Vegetation History and Archaeobotany, 19, 219–233, https://doi.org/10.1007/s00334-010-0243-5, 2010.
Vittori Antisari, L., Bianchini, G., Cremonini, S., Di Giuseppe, D., Falsone, G., Marchesini, M. Marvelli, S., and Vianello, G.: Multidisciplinary study of a Lateglacial-Holocene sedimentary sequence near Bologna (Italy): insights on natural and anthropogenic impacts on the landscape dynamics, J. Soils Sediments, 16, 645–662, https://doi.org/10.1007/s11368-015-1266-4, 2015.
Westra, S., Fowler, H. J., Evans J. P., Alexander, L. V., Berg, P., Johnson, F., Kendon, E. J., Lenderink, G., and Roberts, N. M.: Future changes to the intensity and frequency of short duration extreme rainfall, Rev. Geophys., 52, 522–555, https://doi.org/10.1002/2014RG000464, 2014.
Whitlock, C. and Larsen, C.: Charcoal as a fire proxy, in: Terrestrial, algal, and siliceous indicators, edited by: Smol J. P., Birks, H. J. B., and Last, W. M., Dordrecht: Kluwer , 75–97, 2001.
Whitlock, C. and Millspaugh, S. H.: Testing the assumptions of fire-history studies: an examination of modern charcoal accumulation in Yellowstone National Park, USA, The Holocene, 6, 7–15, https://doi.org/10.1177/095968369600600102, 1996.
Wilhelm, B., Arnaud, F., Sabatier, P., Crouzet, C., Brisset, E., Chaumillon, E., Disnar, J. R., Guiter, F., Malet, E., Reyss, J. L., Tachikawa, K., Bard, E., and Delannoy, J. J.: 1400 years of extreme precipitation patterns over the Mediterranean French Alps and possible forcing mechanism, Quaternary Res., 78, 1–12, https://doi.org/10.1016/j.yqres.2012.03.003, 2012.
Wilhelm, B., Ballesteros-Cànovas, J. A., Macdonald, N., Toonen, W. H. J., Baker, V., Barriendos, M., Benito, G., Brauer, A., Corella, J. P., Denniston, R., Glaser, R., Ionita, M., Kahle, M., Liu, T., Luetscher, M., Macklin, M., Mudelsee, M., Muṅoz, S., Schulte, L., George, S. St., Stoffel, M., and Wetter, O.: Interpreting historical, botanical, and geological evidence to aid preparations for future floods, WIREs Water, 6, 1–22, https://doi.org/10.1002/wat2.1318, 2018.
Wirth, S. B.: The Holocene Flood History of the Central Alps Reconstructed from Lacustrine Sediments: Frequency, Intensity and Controlling Climate Factors, Ph.D. thesis, ETH Zürich Bibliography, Switzerland, 179 pp., https://doi.org/10.3929/ethz-a-009775044, 2013.
Wirth, S. B., Glur, L., Gilli, A., and Anselmetti, F. S.: Holocene flood frequency across the Central Alps – solar forcing and evidence for variations in North Atlantic atmospheric circulation, Quaternary Sci. Rev., 80, 112–128, https://doi.org/10.1016/j.quascirev.2013.09.002, 2013.
Zanchetta, G., Isola, I., Piccini, L., and Dini, A.: The Corchia Cave (Alpi Apuane) a 2 Ma long temporal window on the earth climate, Technical Periodicals of National Geological Survey of Italy – ISPRA, Geological Field Trips, 3, 55 pp., https://doi.org/10.3301/GFT.2011.02, 2011.
Zavala, C. and Pan, S.: Hyperpycnal flows and hyperpycnites: Origin and distinctive characteristics, Lithologic Reservoirs, 30, 1–27, https://doi.org/10.3969/j.issn.1673-8926.2018.01.001, 2018.
Zavala, C., Ponce, J. J., Arcuri, M., Drittanti, D., Freije, H., and Asensio, M.: Ancient Lacustrine Hyperpycnites: A Depositional Model from a Case Study in the Rayoso Formation (Cretaceous) of West-Central Argentina, J. Sediment. Res., 76, 41–59, https://doi.org/10.2110/jsr.2006.12, 2006.
Zavala, C., Arcuri, M., Di Meglio, M., Gamero Diaz, H., and Contreras, C.: A Genetic Facies Tract for the Analysis of Sustained Hyperpycnal Flow Deposits, in: Sediment transfer from shelf to deep water – Revisiting the delivery system, edited by: Slatt, R. M. and Zavala, C., AAPG Studies in Geology, 61, 31–51, 2011.
Zhornyak, L. V., Zanchetta, G., Drysdale, R. N., Hellstrom, J. C., Isola, I., Regattieri, E., Piccini, L., Baneschi, I., and Couchoud, I.: Stratigraphic evidence for a “pluvial phase” between ca 8200–7100 ka from Renella cave (Central Italy), Quaternary Sci. Rev., 30, 409–417, https://doi.org/10.1016/j.quascirev.2010.12.003, 2011.