the Creative Commons Attribution 4.0 License.
the Creative Commons Attribution 4.0 License.
 | 20 Aug 2020
Elevated CO2, increased leaf-level productivity, and water-use efficiency during the early Miocene
Tammo Reichgelt
William J. D'Andrea
Ailín del C. Valdivia-McCarthy
Bethany R. S. Fox
Jennifer M. Bannister
John G. Conran
William G. Lee
Daphne E. Lee
Rising atmospheric CO2 is expected to increase global temperatures, plant water-use efficiency, and carbon storage in the terrestrial biosphere. A CO2 fertilization effect on terrestrial vegetation is predicted to cause global greening as the potential ecospace for forests expands. However, leaf-level fertilization effects, such as increased productivity and water-use efficiency, have not been documented from fossil leaves in periods of heightened atmospheric CO2. Here, we use leaf gas-exchange modeling on a well-preserved fossil flora from early Miocene New Zealand, as well as two previously published tropical floras from the same time period, to reconstruct atmospheric CO2, leaf-level productivity, and intrinsic water-use efficiency. Leaf gas-exchange rates reconstructed from early Miocene fossils, which grew at southern temperate and tropical latitudes when global average temperatures were 5–6 ∘C higher than today, reveal that atmospheric CO2 was ∼450–550 ppm. Early Miocene CO2 was similar to projected values for 2040 CE and is consistent with an Earth system sensitivity of 3–7 ∘C to a doubling of CO2. The Southern Hemisphere temperate leaves had higher reconstructed productivity than modern analogs, likely due to a longer growing season. This higher productivity was presumably mirrored at northern temperate latitudes as well, where a greater availability of landmass would have led to increased carbon storage in forest biomass relative to today. Intrinsic water-use efficiency of both temperate and tropical forest trees was high, toward the upper limit of the range for modern trees, which likely expanded the habitable range in regions that could not support forests with high moisture demands under lower atmospheric CO2. Overall, early Miocene elevated atmospheric CO2 sustained globally higher temperatures, and our results provide the first empirical evidence of concomitant enhanced intrinsic water-use efficiency, indicating a forest fertilization effect.
- Article
(2511 KB) - Full-text XML
-
Supplement
(746 KB) - BibTeX
- EndNote


Terrestrial plants comprise 450 Gt of carbon, representing 80 % of Earth's dry carbon (C) biomass (Bar-On et al., 2018). Globally, plants draw down ∼120 Gt of atmospheric C per year through photosynthesis, representing the largest annual C flux on Earth (Beer et al., 2010). Total plant biomass is believed to be determined in large part by atmospheric carbon dioxide concentrations (Ca), and it is predicted that future increases in Ca will have a three-pronged effect on the terrestrial biosphere: (1) increased global temperatures will shift the boundaries of climate zones and thereby the potential forest expanse (Rubel and Kottek, 2010); (2) productivity will increase because global photosynthesis is C limited and increased Ca will have a fertilization effect on the terrestrial biosphere (Zhu et al., 2016); and (3) elevated Ca will increase plant water-use efficiency and reduce the threshold for physiological drought (Cernusak, 2020), making more land area available for biosphere expansion (Zhou et al., 2017). Plant fossils record the effect of past changes in climate, including CO2 enrichment, and thus fossil floras provide insight into changes in the carbon cycle and their effects on the terrestrial biosphere from a natural, whole-ecosystem perspective.
The Miocene has been considered problematic for our understanding of Earth system sensitivity (ESS) to Ca because most proxy-based Ca estimates indicate concentrations near 300 ppm (Foster et al., 2017), close to pre-industrial values, yet global temperatures were 5–6 ∘C higher than modern ones (Hansen et al., 2013). Enhanced radiative forcing is required to maintain such elevated early Miocene temperatures (Herold et al., 2010; Hansen et al., 2013), and without elevated Ca, climate models cannot achieve such high global temperatures in the Miocene (Henrot et al., 2010). The early Miocene also had an expanded biosphere compared to today, including woody vegetation in locations that are currently too cold and/or too dry for forests (e.g., Askin and Raine, 2000; Herold et al., 2010). A biosphere of the magnitude observed in the early Miocene fossil record requires elevated temperatures and plant water-use efficiency, suggesting Ca levels higher than estimated by most existing proxy reconstructions (Herold et al., 2010; Henrot et al., 2010). Importantly, plant-based Ca reconstructions have challenged the consensus of low Ca in the early Miocene (Kürschner and Kvaček, 2009; Reichgelt et al., 2016; Tesfamichael et al., 2017; Londoño et al., 2018) and previous interpretations of alkenone-based Ca proxies are being disputed (Bolton et al., 2016; Witkowski et al., 2019).
We applied plant gas-exchange modeling (Franks et al., 2014) to fossil leaves from the early Miocene (∼23 Ma) rainforest ecosystem from southern New Zealand preserved in the Foulden Maar deposit (Bannister et al., 2012; Reichgelt et al., 2013; Conran et al., 2014; Lee et al., 2016) to reconstruct carbon assimilation rates (An), intrinsic water-use efficiency (iWUE; the ratio between carbon assimilation and stomatal conductance to water), and the Ca levels required to maintain these values. The same analyses were performed on previously published leaf δ13C and micromorphological measurements from two early Miocene fossil floras from Ethiopia (Tesfamichael et al., 2017) and Panama (Londoño et al., 2018). These two studies were incorporated here because they represent a similar time period (early Miocene) and the authors applied the same gas-exchange methodology. Because An, iWUE, and Ca are interdependent (Farquhar et al., 1980; Drake et al., 1997), we reconstructed these variables in concert for each fossilized leaf recovered from these forest ecosystems. This allows us to make inferences concerning carbon availability, productivity, and water balance in the forest.
2.1 Site description
Foulden Maar (Fig. 1a) is a unique Konservat-Lagerstätte with abundantly preserved plants and insects (Kaulfuss et al., 2015; Lee et al., 2016) in southern New Zealand (45.527∘ S, 170.219∘ E). It was formed in an ancient maar-diatreme lake (Fig. 1b) at the Oligocene–Miocene boundary (Fox et al., 2015; Kaulfuss, 2017) and consists of ∼100 kyr of annually laminated diatomite (Lindqvist and Lee, 2009; Fox et al., 2016). The Foulden Maar diatreme complex is part of the larger late Oligocene–late Miocene Waipiata Volcanic Field that produced a variety of maar volcanoes and scoria cones (Németh and White, 2003). Plant fossils used in this study were collected from a ∼183 m long drill core (Fig. 1c). The Lauraceae-dominated rainforest (Bannister et al., 2012) surrounding the lake grew at a paleolatitude of ∼50∘ S (Fig. 1a). The climate was marginally subtropical with a mean annual temperature of ∼18 ∘C, similar to modern-day climates at 30∘ S (Reichgelt et al., 2019). The length of the growing season in this climate was ∼10 months, compared to 5–6 months today, as reconstructed from the surface exposure macrofossil assemblage using the Climate Leaf Analysis Multivariate Program (Reichgelt et al., 2013).
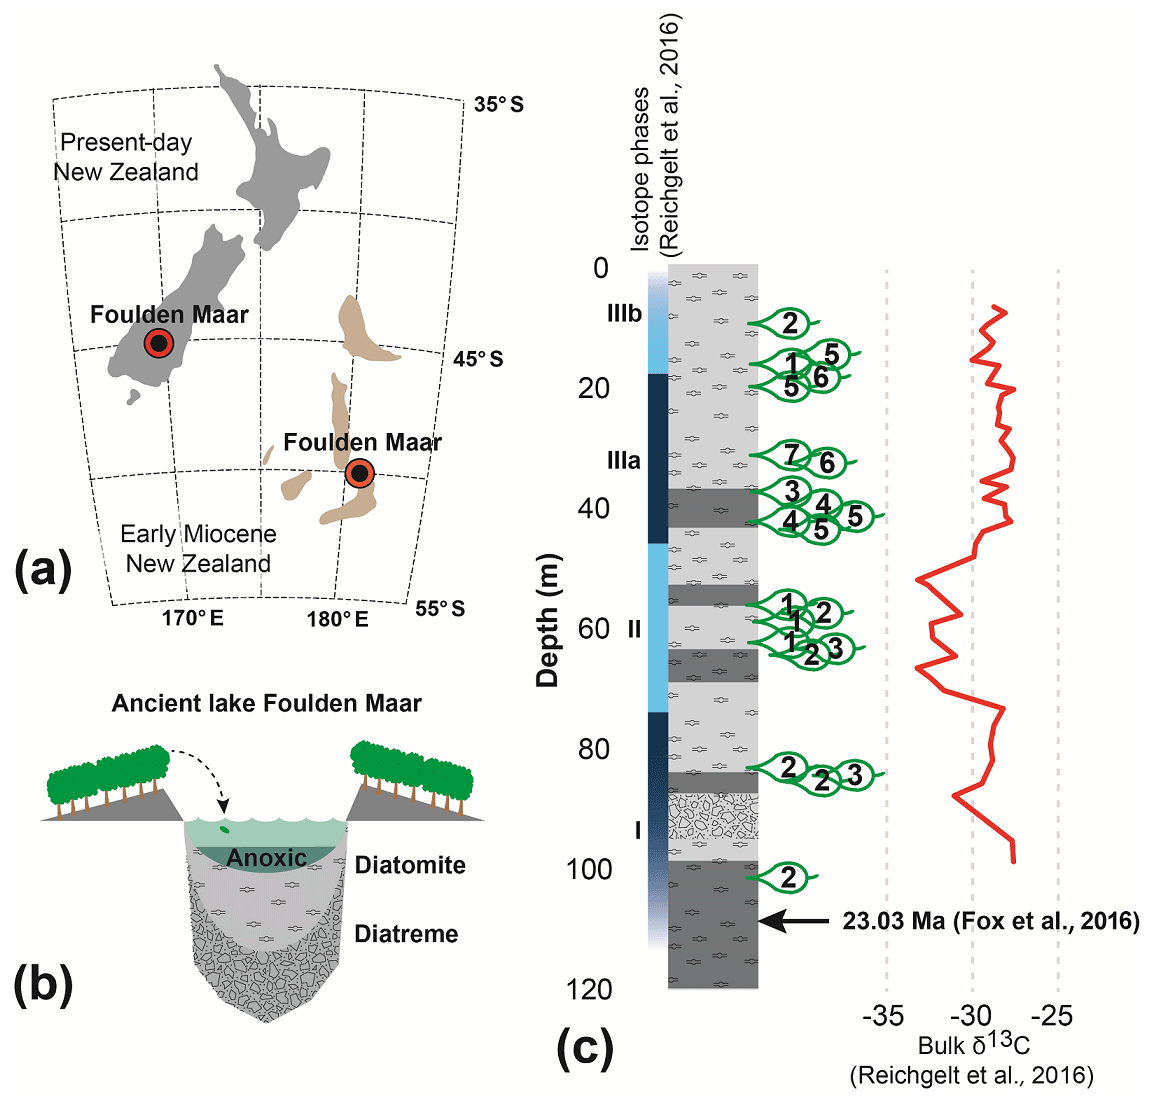
Figure 1Foulden Maar site information. (a) Location of the Foulden Maar deposit and paleogeographic reconstruction of early Miocene New Zealand (Boyden et al., 2011; Lee et al., 2014). (b) Schematic reconstruction of the Foulden Maar depositional environment. (c) Stratigraphic column of the Foulden Maar core (Fox et al., 2015), with sample locations and bulk organic δ13C (Reichgelt et al., 2016).
2.2 Fossil leaf anatomy and paleoecology
Mummified fossil leaves were extracted from turbidite deposits that occur frequently within the Foulden Maar diatomite core (Fox et al., 2015). The diatomite is loosely consolidated, allowing mummified leaves to be extracted using a combination of water and scalpels. After extraction, the leaves were cut into three pieces: one for bulk δ13C analysis, one for stomatal conductance measurements, and a third as a reference specimen. Leaf δ13C was measured using a Costech elemental combustion system (EA) coupled to a Delta V Plus IRMS (Thermo). In order to place measured δ13C on the VPDB (Vienna Pee Dee Belemnite) scale, we calibrated measurements using a two-point isotope calibration based on the USGS40 and USGS41 standards. Measurement uncertainty was calculated by replicating ∼15 samples two or three times and applying averaged uncertainty to the remaining leaves. For stomatal density and geometry measurements the leaves were soaked in hydrogen peroxide (H2O2) with up to 40 % dilution, with tetra-sodium pyrophosphate salt crystals (Na4P2O7⋅10[H2O]), on a boiling plate at 40–50 ∘C for 1–2 h (Bannister et al., 2012). When the adaxial and abaxial cuticle layer could be separated, the leaf layers were cleaned of mesophyll cell debris using small paintbrushes and both layers were stained with <0.5 % Crystal Violet (C25N3H30Cl) and mounted on glass slides with glycerin jelly. Stomatal conductance and geometry measurements were made on pictures at 100× magnification using TSView 7.1.1.2 microscope imaging software on a Nikon Optiphot. Leaves were often fragmented and the cuticle wrinkled because the leaves were deposited in turbidites. Moreover, there was strong divergence in overall cell and stomatal density because we made measurements on all species recovered from the sediments. To avoid systematic errors arising from wrinkled cuticle, differing leaf architecture between species, or low cell counts (Retallack and Conde, 2020), each picture was given a standard bounding box (0.3×0.3 mm) on which cells were counted, to calculate stomatal density. The number of cells in each bounding box ranged from 100 to 750, strongly dependent on species. Five to eight pictures were taken of each leaf to constrain errors in cell density. Stomatal size measurements were made using ImageJ 1.48v software (Schneider et al., 2012).
Eighteen distinct leaf morphotypes were identified from the Foulden Maar drill core. Descriptions and justification for identification are found in the Supplement. Species identifications are provided, where possible, based on paleobotanical studies from the Foulden Maar surface exposures. Known species recovered from the Foulden Maar drill core are Litsea calicarioides (Fig. S1a in the Supplement), Cryptocarya taieriensis (Fig. S1b), C. maarensis (Fig. S1i), Beilschmiedia otagoensis (Fig. S2a) (Lauraceae) (Bannister et al., 2012), Laurelia otagoensis (Fig. S2h) (Atherospermataceae) (Conran et al., 2013), and Hedycarya pluvisilva (Fig. S2i) (Monimiaceae) (Conran et al., 2016). Otherwise, tentative genus or family identifications or, for leaves that could not be assigned a plant group, unspecified morphotypic qualifiers are provided. These will henceforth be referred to as “C” (Fig. S1c), cf. Myrtaceae (Fig. S1d), cf. Ripogonum (Fig. S1e), cf. Myrsine (Fig. S1f), “H” (Fig. S1g), cf. Elaeocarpaceae/Cunoniaceae (Fig. S1h), cf. Dysoxylum (Fig. S2b), cf. Cryptocarya (Fig. S2c), “O” (Fig. S2d), “P” (Fig. S2e), “Q” (Fig. S2f), and cf. Endiandra (Fig. S2g).
We made 375 anatomical and 80 carbon isotope measurements on 72 organically preserved fossil leaves representing the 18 species collected from the Foulden Maar deposit (Fig. 1a). The affinities of modern living relatives of the plant types at Foulden Maar strongly suggest that during the Miocene the site was characterized by a multi-layered closed-canopy rainforest ecosystem (Reichgelt et al., 2013; Conran et al., 2014). In order to determine atmospheric carbon (Ca), intrinsic water-use efficiency (iWUE), and carbon assimilation rates (An), the ecological strategies of the individual fossil species at Foulden Maar need to first be established (Reichgelt and D'Andrea, 2019). Understory species rarely experience light saturation and utilize respired CO2 that has already undergone isotopic fractionation; both conditions influence gas-exchange modeling results (Royer et al., 2019). Therefore, Ca reconstructed from understory species cannot be considered indicative of true global Ca. Here, we determine whether a fossil leaf type was likely in the canopy or the understory based on (1) leaf δ13C, (2) leaf cell density, and (3) sinuosity of the epidermal cell walls. A large range of leaf δ13C in a single species is indicative of different levels of light saturation, which indicates that this species may preferentially occur in the subcanopy or in the understory (Graham et al., 2014). Leaves in the canopy, experiencing light saturation, divide epidermal cells rapidly compared to leaves in the shade, leading to high cell densities and relatively high leaf mass per area in sun-exposed leaves (Šantrůček et al., 2014). Finally, a high level of anticlinal cell wall sinuosity has been interpreted as indicative of low-light conditions (Kürschner, 1997; Bush et al., 2017). We consider these three lines of evidence occurring in concert as indicative of a canopy or subcanopy ecological preference.
2.3 Modeling gas exchange
Atmospheric carbon dioxide (Ca), plant photosynthesis (An), and intrinsic water-use efficiency (iWUE) are tightly linked (Farquhar et al., 1980; Drake et al., 1997), which allows us to solve for these parameters iteratively, through anatomical and carbon isotope (δ13C) measurements of the fossil leaves. The Franks et al. (2014) gas-exchange model solves for Ca, by iteratively reconstructing An and leaf conductance to atmospheric carbon (Gc), using a Monte Carlo approach. This means that every Ca reconstruction has an associated An and Gc value.
in which Ci∕Ca represents the ratio of intercellular carbon to atmospheric carbon, which can be reconstructed using known leaf fractionation processes: fractionation caused by diffusion (a), carboxylation (b), and fractionation caused by the preferential uptake of 12C to 13C in photosynthesis (Δ), which is also influenced by the rate at which the leaf is photosynthesizing (Farquhar et al., 1982).
Here, a=4.4 ‰ and b=29 ‰ (Farquhar et al., 1982; Roeske and O'Leary, 1984). Δ can be calculated from the δ13C of the air, derived from Tipple et al. (2010) and measurements of leaf δ13C (Farquhar and Richards, 1984; Farquhar et al., 1989). Leaf and air δ13C used in the Franks et al. (2014) model are presented in Table S1.
Gc is determined by the maximum capacity for conductance of a leaf surface (Gmax), the ratio of operational conductance to Gmax (ζ), boundary layer conductance (Gb), and mesophyll conductance (Gm) (Franks et al., 2014).
Gb, ζ, and Gm are all changeable under natural conditions (e.g., Schuepp, 1993; Niinemets et al., 2009; Londoño et al., 2018), and it is highly disputed if these variables can be determined from fossil leaf material at all (e.g., McElwain et a., 2016; Soh et al., 2017). However, we adopt a standardized approach put forward by Franks et al. (2014) to obtain input for these variables. mol m−2 s−1, (Franks et al., 2009; Dow et al., 2014), and Gm is determined using an empirical calibration (Evans and Von Caemmerer, 1996).
Gmax is determined using predominantly measurable anatomical features of the fossil leaf cuticle (Franks and Beerling, 2009): stomatal density (SD), maximum aperture surface area (amax), pore depth (pd), and the ratio of diffusivity of CO2 in air over the molar volume of air (d∕v), here taken as 0.000714 mol m−1 s−1 (Marrero and Mason, 1972).
In this equation, SD can be measured directly from the leaf, pd is assumed to be the same as guard cell width (gcw), and amax is determined assuming a circular opening for the aperture, with the measurable pore length (pl) as the diameter (Franks et al., 2014).
Measurements of SD, gcw, and pl used in the Franks et al. (2014) gas-exchange model are presented in Table S1.
Because An is required to solve Gm, Gc is solved iteratively, though Gc is largely determined by measurable anatomical parameters. However, An is also solved iteratively, as it is dependent on Ca and the carbon saturation value (Γ), set to 40 ppm (Franks et al., 2013).
in which A0 is the photosynthetic rate of a modern model species that can represent the fossil species' photosynthetic rate and Ca0 is the atmospheric carbon dioxide level at which A0 was measured. A0 for each fossil species was derived from the compilation of photosynthetic rates presented in Reichgelt and D'Andrea (2019). For fossil leaves with known modern relatives, we constrained the possible A0 range by only including modern relatives within the same family or order, i.e., Lauraceae for Litsea calicarioides, Cryptocarya taieriensis, C. maarensis, cf. Cryptocarya, Beilschmiedia otagoensis and cf. Endiandra, Myrtaceae for cf. Myrtaceae, Liliales for cf. Ripogonum, Primulaceae for cf. Myrsine, Elaeocarpaceae and Cunoniaceae for cf. Elaeocarpaceae/Cunoniaceae, Meliaceae for cf. Dysoxylum, Atherospermataceae for Laurelia otagoensis, and Laurales for Hedycarya pluvisilva. Then, following the method of constraining A0 of modern living relatives presented in Reichgelt and D'Andrea (2019), only A0 values of plants with similar growth forms to the fossil plants and growing in similar light environments as Foulden Maar were included. A0 and Ca0 used in the Franks et al. (2014) model, and associated ecology of fossil leaf types is shown in Table S2.
The Franks et al. (2014) gas-exchange model thus iteratively solves for Ca, An, and Gc. However, only leaves derived from canopy trees are likely to represent these values at light saturation. Moreover, plants in the understory assimilate a mix of atmospheric and respired CO2, which has already undergone fractionation processes, making the calculated Ci∕Ca problematic. Therefore, we present the results for Ca, An, and Gc of leaf types most likely to be derived from canopy trees separately, as they are more likely to not have a systematic skew.
iWUE is defined as the ratio between An and stomatal conductance to water (Feng, 1999).
Due to the different rates at which carbon dioxide and water vapor diffuse in air, a transformation of Gc is required to calculate Gw.
Finally, cumulative annual carbon uptake through photosynthesis (Atot) can be calculated in grams of carbon per square meter per year by transferring from moles to grams, including a measure for the relative time the leaf is assimilating carbon (ζ) and the length of the growing season.
Here, tg is the length of the growing season in months, which we can derive from the fossil plant assemblage (Reichgelt et al., 2019) using the method of Spicer et al. (2009). Gw, Atot, and iWUE values for Litsea calicarioides, Cryptocarya taieriensis, C. maarensis, cf. Elaeocarpaceae/Cunoniaceae, and cf. Myrtaceae are presented in Table S3. The modern reference An and Gw data are derived from Maire et al. (2015), which, using transform functions 9 and 11, we also used to calculate iWUE and Atot.
2.4 Comparison to Earth system sensitivity
ESS to Ca is the amount of temperature increase expected under a doubling of atmospheric CO2. This sensitivity is likely not static in Earth's history and is dependent on, among other aspects, continental configuration and ocean circulation patterns (Royer, 2016). Here, we estimate global surface temperature for the early Miocene following the approach of Hansen et al. (2013). We then use these temperature estimates along with a broad range of commonly cited Neogene ESSs, of 3–7 ∘C (Hansen et al., 2013; Royer, 2016), to provide a model for the expected early Miocene Ca. Following this model ultimately means that a doubling of Ca compared to pre-industrial levels is expected when an increase in global average surface temperatures (Ts) of 3–7 ∘C compared to modern values occurs.
Compiled deep-sea benthic foraminifera δ18O data of the last 30 million years (Zachos et al., 2001) were averaged into 20 kyr time bins. Deep-sea temperatures (Td) were then calculated using the linear transfer functions of Hansen et al. (2013), which depend on the presence of sea ice.
Ts was then calculated for the post-Pliocene period using
For the Pliocene,
And for the pre-Pliocene period we assumed that Ts changed linearly with Td, by a factor of 1.5.
Ca based on an ESS range of 3–7 ∘C was then calculated using the resulting Ts.
Ts[x] is the calculated average global surface temperature at time x, Ts[0] is the modern-day average global surface temperature, and 310 represents pre-industrial Ca.
3.1 Southern temperate rainforest paleoecology
Modern-day Lauraceae rainforests in New Zealand have a single dominant canopy tree, Beilschmiedia tawa, and its farthest southern extent is ∼42∘ S (Leathwick, 2001), which is the farthest southern occurrence of any arborescent Lauraceae species in the world. Rainforests further south in New Zealand are usually dominated by Nothofagaceae or Podocarpaceae, and the only modern-day forests at ∼50∘ S are the Magellanic Subpolar Forests in southern South America. Low-growing Podocarpaceae or Nothofagaceae forests, similar to modern forests in southern New Zealand and southern South America, dominated Antarctic vegetation during the early Miocene (Askin and Raine, 2000), and the Foulden Maar rainforest included at least 10 Lauraceae species (Bannister et al., 2012), emphasizing the expanded biosphere potential in the early Miocene compared to today (Herold et al., 2010).
We identify Litsea calicarioides, Cryptocarya maarensis, C. taieriensis, cf. Elaeocarpaceae/Cunoniaceae, and cf. Myrtaceae as the most probable canopy components because they lack characteristics typical of understory components: (1) the large range of leaf δ13C values and relatively low overall leaf δ13C values (Graham et al., 2014), (2) low cell densities (Kürschner, 1997; Bush et al., 2017) (Fig. 2a, b), and (3) the undulating or sinuous cell walls (Kürschner, 1997; Bush et al., 2017). Modern-day Litsea calicaris in New Zealand is also part of the canopy, though rarely dominant (De Lange, 2020), whereas Cryptocarya is extinct in New Zealand. Members of Elaeocarpaceae, Cunoniaceae and Myrtaceae in modern-day New Zealand, such as Weinmannia racemosa (Cunoniaceae) and Metrosideros robusta (Myrtaceae), can attain heights of over 25 m (De Lange, 2020).
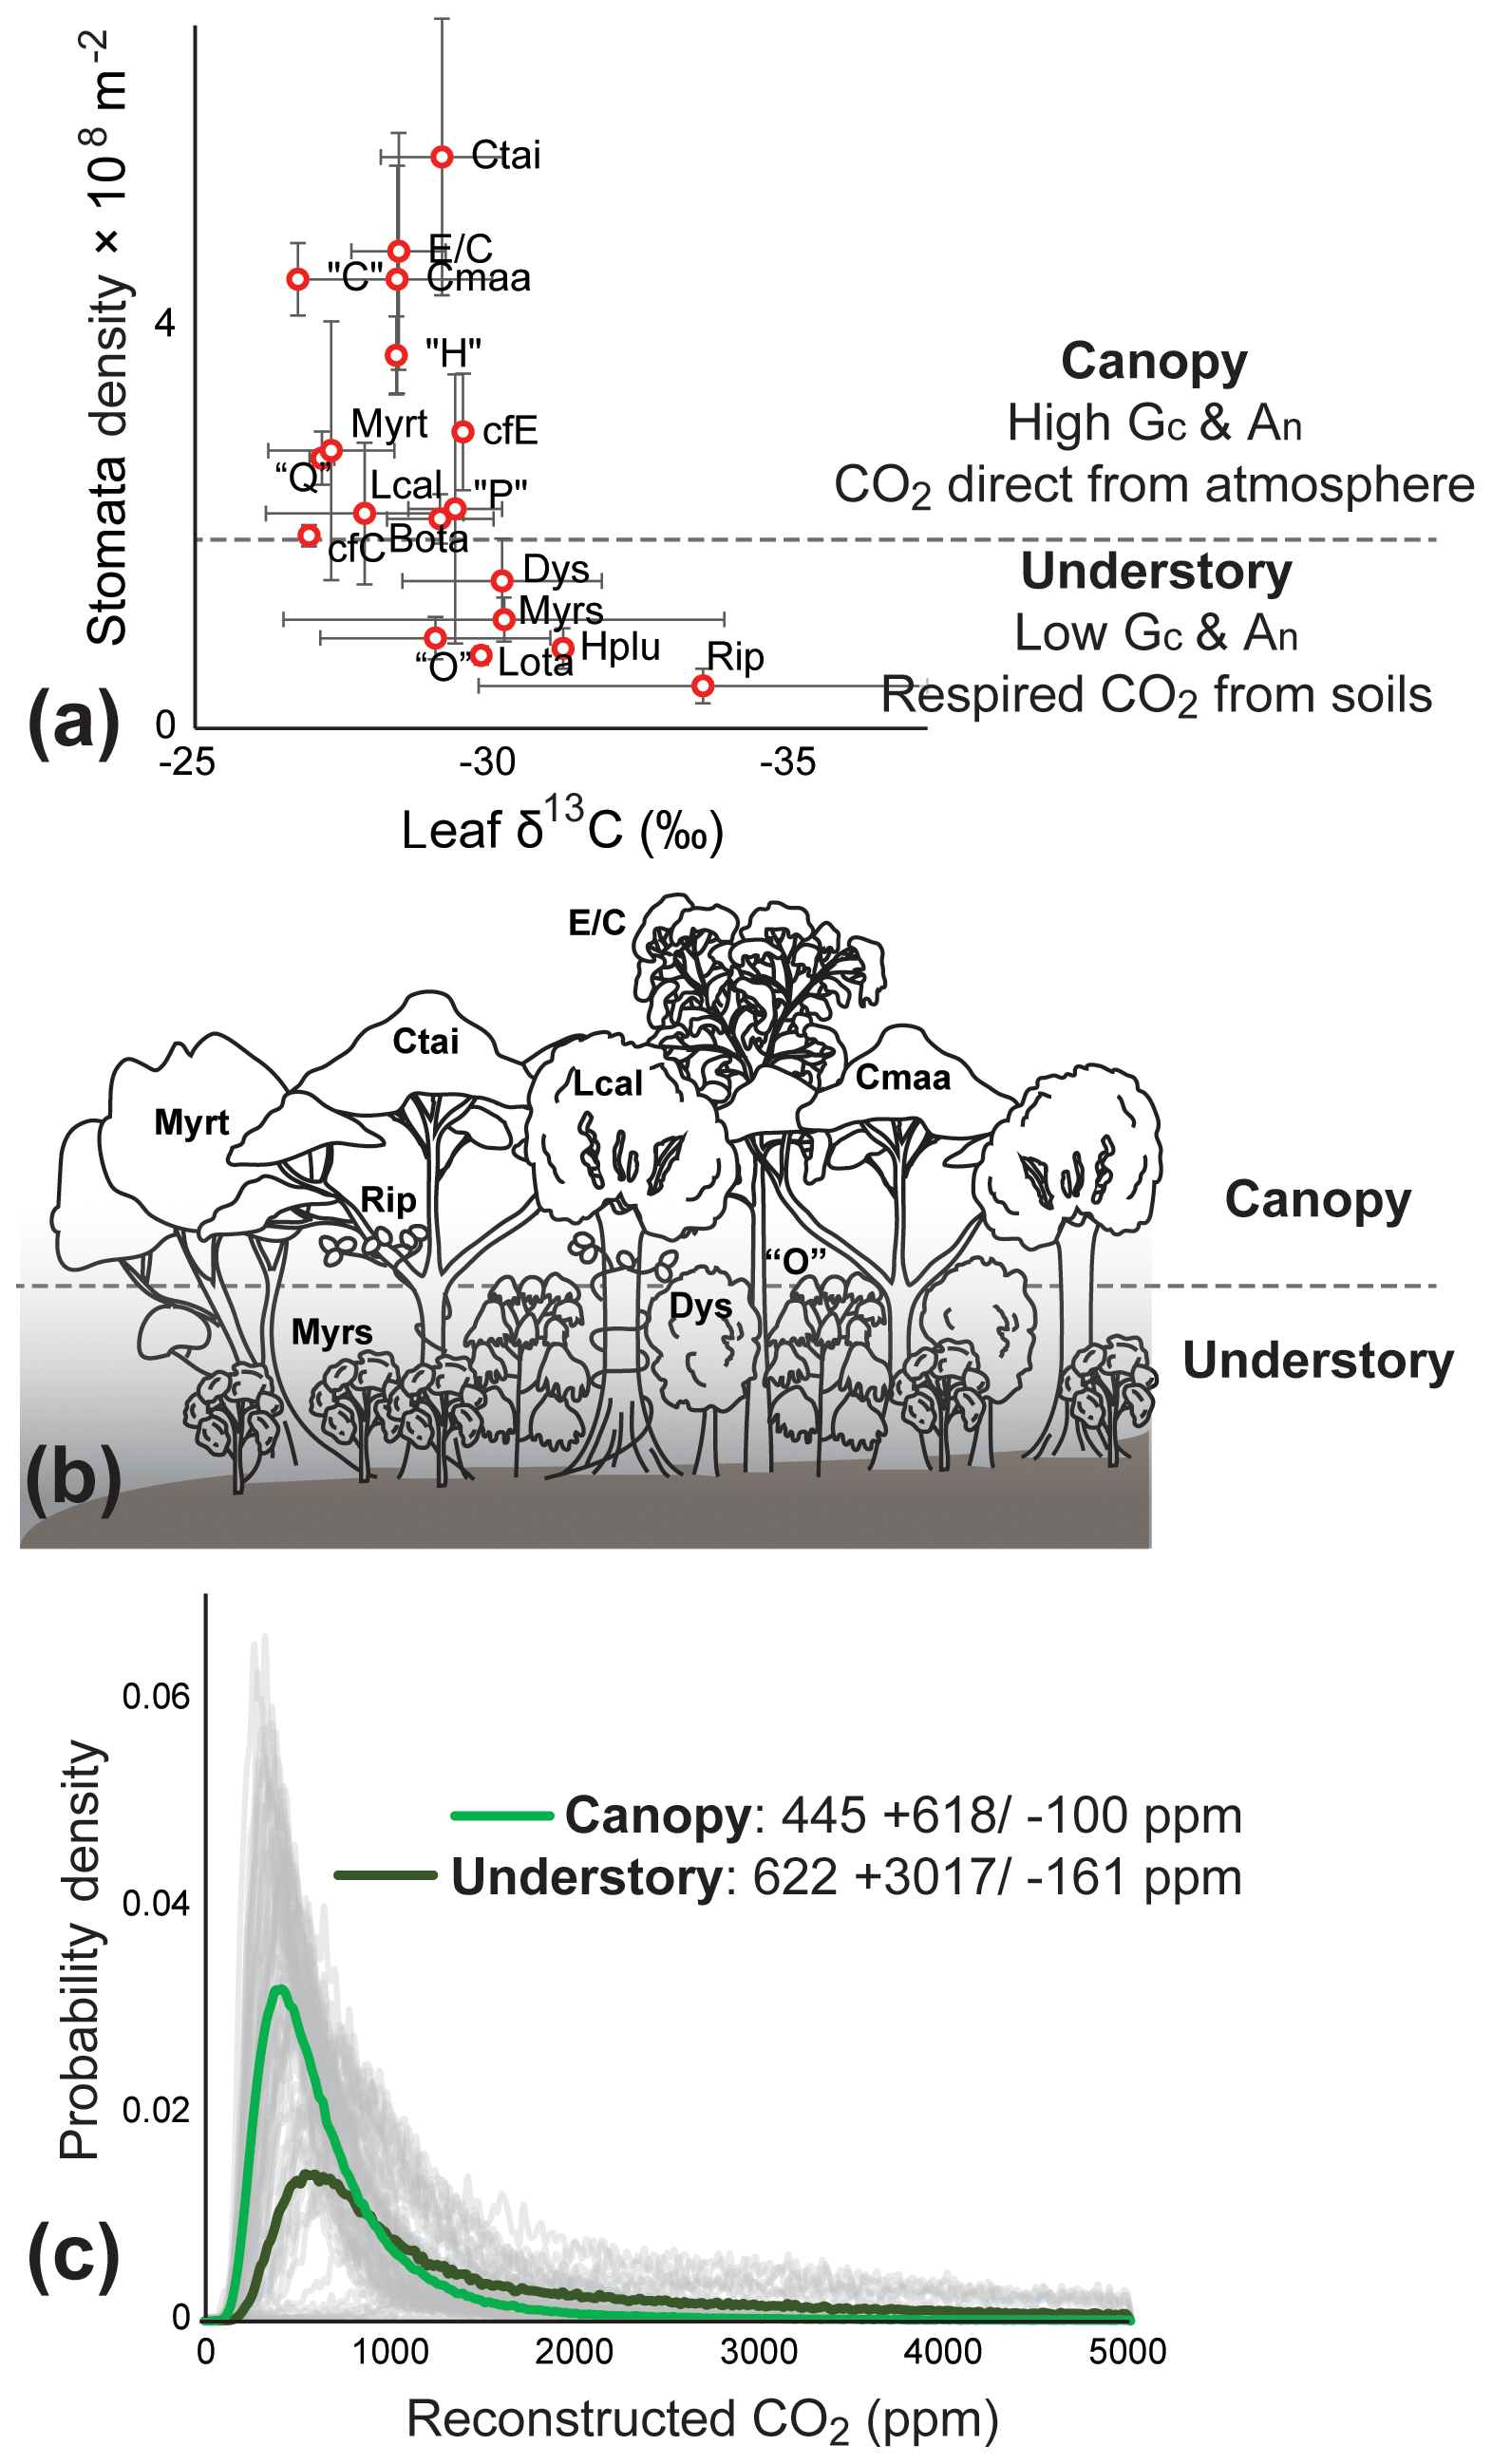
Figure 2Foulden Maar paleoecology and atmospheric CO2 reconstructions. (a) δ13C values and stomatal density (error bars representing ±1σ) from the fossil leaves of Foulden Maar provide constraints to distinguish canopy leaf types from understory because understory leaves tend to have a high range of δ13C and low cell density (Graham et al., 2014; Bush et al., 2017). (b) Paleoecological reconstruction of the dense rainforest at Foulden Maar with a canopy comprising Litsea calicarioides (Lcal), Cryptocarya taieriensis (Ctai), C. maarensis (Cmaa), cf. Elaeocarpaceae/Cunoniaceae (E/C), and cf. Myrtaceae (Myrt) and an understory comprising cf. Myrsine (Myrs), cf. Ripogonum (Rip), cf. Dysoxylum (Dys), and leaf type “O”. Hedycarya pluvisilva (Hplu), Laurelia otagoensis (Lota), Beilschmiedia otagoensis (Bota), cf. Cryptocarya (cfC), cf. Endiandra (cfE), and leaf types “C”, “H”, “P”, and “Q” could not be ecologically placed with certainty. (c) Probability density distributions of Ca reconstructions from canopy (thick light green line) and understory components (thick dark green line) using a gas-exchange model (Franks et al., 2014). Grey curves represent the probability distribution of 10 000 Monte Carlo reconstructions on a single fossil leaf.
The most likely subcanopy or understory taxa were cf. Ripogonum, cf. Myrsine, “O”, and cf. Dysoxylum, because leaf fossils of these types have low overall leaf δ13C, relatively low cell densities, and sinuous or undulating cells (Figs. S1e, f, S2b, d). Ripogonum scandens in modern-day New Zealand is a twining forest liana, often found in the understory; Myrsine comprises several species of shrubs and small trees, whereas Dysoxylum spectabile in modern-day New Zealand is a medium-sized tree (De Lange, 2020). The affinity of morphotype “O” is unclear but likely represents a now extinct plant group in New Zealand. Hedycarya pluvisilva, Laurelia otagoensis, cf. Cryptocarya, cf. Endiandra, Beilschmiedia otagoensis, “C”, “H”, “P”, and “Q” all displayed some variation in features that are typical of understory or canopy components and occurred in relatively low abundance, and they are therefore considered of uncertain ecological affinity.
3.2 Earliest Miocene CO2
Gas-exchange modeling (Franks et al., 2014) of canopy leaves throughout the Foulden Maar core indicates that Ca (±1σ) was ppm, whereas reconstructed Ca from understory elements yields values of ppm (Fig. 2c), consistent with understory plants assimilating respired CO2 that has undergone prior fractionation processes, as well as experiencing elevated levels of Ca under the canopy (Graham et al., 2014; Royer et al., 2019). Prior work on the Foulden Maar core established three different phases based on bulk organic δ13C (Fig. 1c), fatty acid δ13C, and fatty acid δD: Phase I (80–105 m depth) with high δ13C and low δD, Phase II (55–65 m depth) with low δ13C and high δD, and Phase III (0–45 m depth) with high δ13C and low δD (Reichgelt et al., 2016). Phase III can be further subdivided into phases IIIa (30–45 m depth) and IIIb (0–20 m depth), as Phase IIIa exhibits a period of low fatty acid δ13C and high δD which is not expressed in bulk organic δ13C (Reichgelt et al., 2016). Gas-exchange modeling on leaves from these phases (Fig. 1c) suggests that during phases II and IIIa, Ca may have been elevated ( and ppm, respectively) compared to Phase I and Phase IIIb ( and ppm, respectively) (Fig. 3). Although gas-exchange modeling input reconstructed differing Ca between phases, differences in overall conductance parameters, such as stomatal density and leaf δ13C, are not apparent (Table S1), despite differences in bulk δ13C, fatty acid δ13C, and δD (Reichgelt et al., 2016). This is likely the result of non-uniform species responses to environmental changes in a complex multi-layered rainforest ecosystem, such as at Foulden Maar.
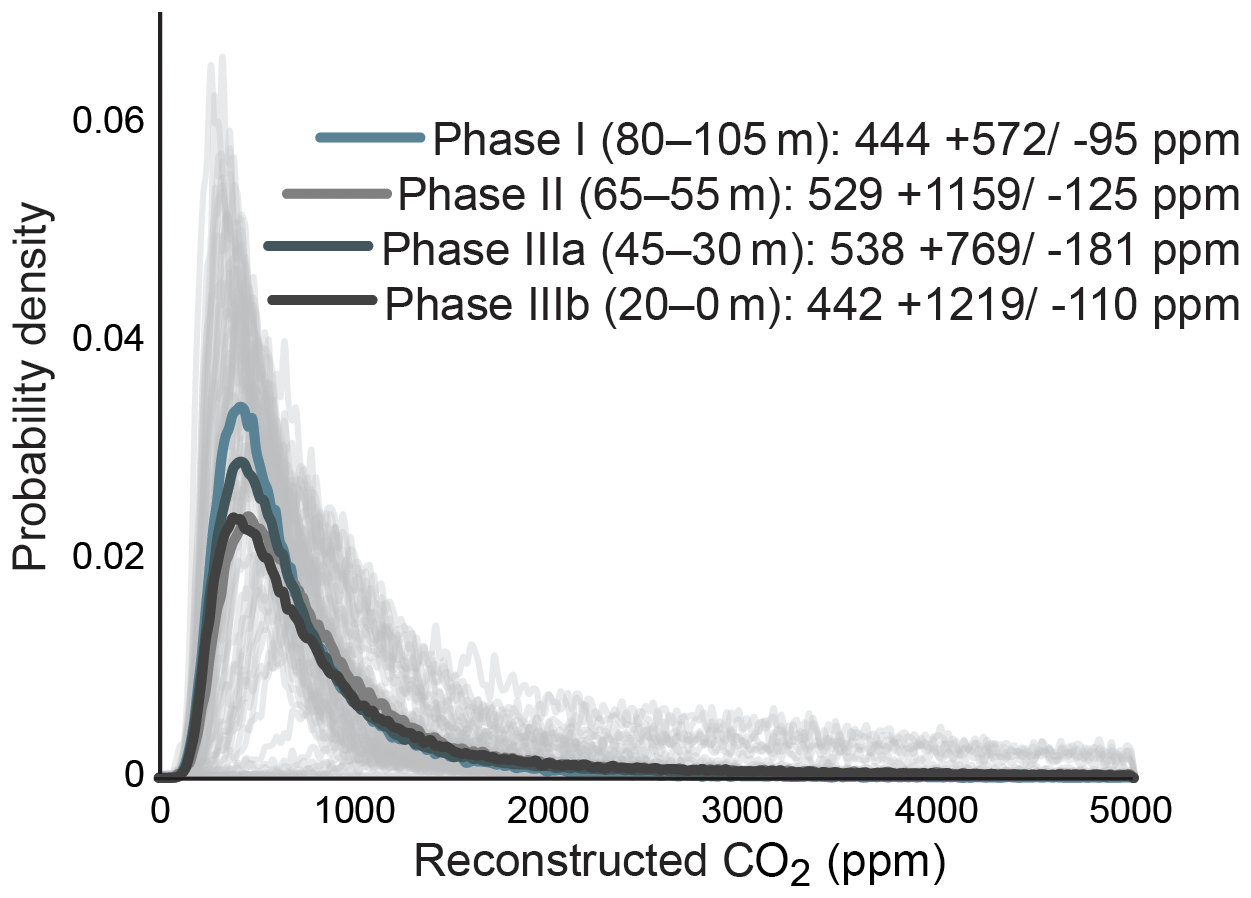
Figure 3Probability density distributions of Ca reconstructions using a gas-exchange model (Franks et al., 2014), divided by bulk carbon isotope phases (Fig. 1c).
The advantage of using gas-exchange modeling to reconstruct Ca from multiple species is that the uncertainty is quantified and constrained, greatly reducing the potential for systematic error in the final estimate (Reichgelt and D'Andrea, 2019; Royer et al., 2019). Along with the enhanced accuracy comes a more comprehensive appraisal of uncertainty than is achieved using other proxy approaches (Fig. 4). Proxy error propagation is based on mechanistic variability, grounded in known physical and physiological limits of plant gas exchange that are understood to be universal (Franks et al., 2014). This differs from empirical proxies, whose uncertainty representation is based on the calibration error of modern-day observations without mechanistic constraints. Our canopy Ca estimate ( ppm, Fig. 2c) is independent of calibration error, based on universal gas-exchange mechanisms, and represents plant vegetative organs of multiple plant species that directly interacted with the available pool of atmospheric carbon dioxide. Previous Ca estimates from the Oligocene–Miocene boundary based on boron isotopes and paleosol carbonates are generally lower than our estimates (Ji et al., 2018; Greenop et al., 2019) (Fig. 4b), whereas Ca estimates based on stomatal index and recent alkenone-based Ca estimates are more similar to our results (Kürschner et al., 2008; Super et al., 2018).
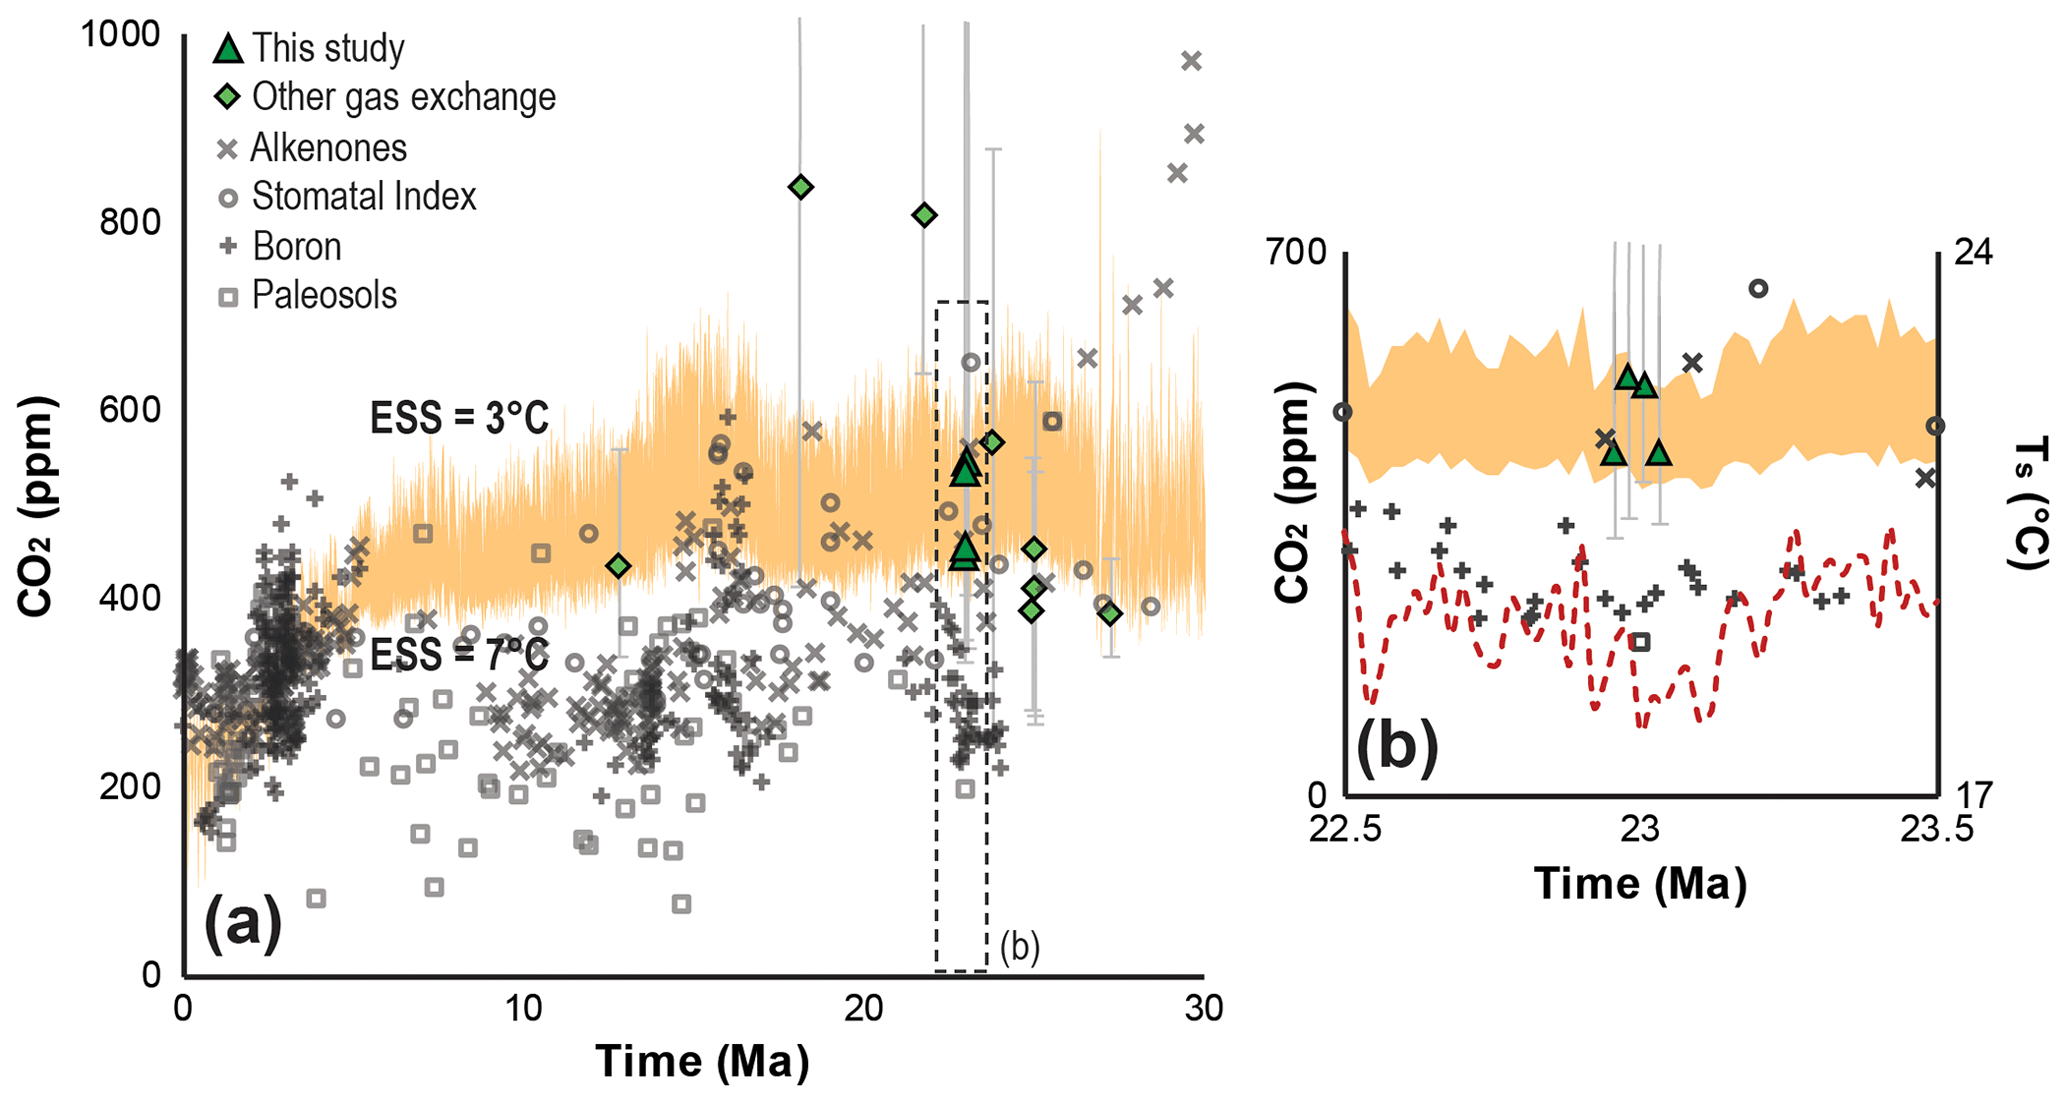
Figure 4Neogene Earth system sensitivity (ESS) and Ca reconstructions. Calculated Ca levels for an ESS range of 3–7 ∘C (orange shaded area) for the last 30 Myr (a) and for the interval between 22.5 and 23.5 Ma (b); the red dashed line in panel (b) indicates the global average surface temperature (Ts) in the earliest Miocene (Hansen et al., 2013). The ESS envelope was determined using deep-sea δ18O of benthic foraminifera (Zachos et al., 2001) and the transform function approach from Hansen et al. (2013) (Supplement). Proxy-based Neogene Ca reconstructions are derived from a previously published compilation (Foster et al., 2017) and are supplemented with more recently published data (Ji et al., 2018; Londoño et al., 2018; Super et al., 2018; Greenop et al., 2019; Moraweck et al., 2019; Steinthorsdottir et al., 2019). Error bars on gas-exchange-based proxy estimates represent ±1σ.
Reconstructions of globally elevated temperatures of 5–6 ∘C in the early Miocene (Hansen et al., 2013) with a Ca of ∼300 ppm (Ji et al., 2018; Greenop et al., 2019) upset the expected ESS to Ca during this period (Henrot et al., 2010). Geochemical Ca proxy estimates consistently produce Ca estimates that are too low to satisfy ESS to Ca prior to the Pliocene (Royer, 2016) (Fig. 4a, b). Estimates from the fossil-leaf-based stomatal index proxy for Ca (Kürschner et al., 2008) on the other hand do indicate a positive correlation between temperature and Ca in the Neogene (Fig. 4a). At present, there are too few studies that reconstruct Ca using gas-exchange modeling to allow for a full comparison to other Ca proxies; however, our Ca estimates of ∼450–550 ppm are in line with the ESS to Ca in the early Miocene (Fig. 4a, b), based on modeling experiments (Herold et al., 2010; Henrot et al., 2010). Moreover, thus far, Neogene Ca estimates reconstructed using gas-exchange methods (Reichgelt et al., 2016; Tesfamichael et al., 2017; Londoño et al., 2018; Moraweck et al., 2019) appear to agree with the suggested ESS to Ca (Fig. 4a, b).
Bulk organic and leaf-wax δ13C values reveal a ∼4 ‰ decrease at Foulden Maar over a 10 m interval at the beginning of Phase II (55–65 m depth), likely representing a time period of <10 kyr (Fox et al., 2016). This shift in isotopic composition suggests a substantial change in the global carbon cycle (Reichgelt et al., 2016). The mode of reconstructed values in this study suggests an increase of ∼450 to 550 from Phase I to Phase II (Fig. 3). The Ca values stay near 550 ppm throughout Phase II and Phase IIIa, representing a 20–40 kyr time period (Fig. 3). Absolute dating of Foulden Maar based on paleomagnetic reversals in the core, annual lamination of lake sediments, and basalt-derived Ar∕Ar dates indicates that the deposition of the Foulden Maar sediment coincided with the termination of the earliest Miocene (Mi-1) glaciation of Antarctica (Fox et al., 2016). Interestingly, an increase in Ca from ∼450 to ∼550 ppm at the termination of Mi-1 is consistent with modeling studies indicating that Ca>500 ppm is necessary to terminate a large-scale Antarctic glaciation (DeConto et al., 2008). We note that with the current data available, it is not possible to exclude the possibility that modeled Ca changes in the record were influenced by canopy density changes or regional hydroclimate. However, our observations from Foulden Maar are inconsistent with hydrological, ecological, or Ca changes as the sole driver of plant physiological response (Reichgelt et al., 2016), and it is more likely that two or more of these parameters changed in concert.
3.3 Elevated CO2 and the early Miocene biosphere
The Foulden Maar Miocene rainforest was primarily evergreen (Lee et al., 2016). The main Miocene canopy trees at Foulden Maar, Litsea calicarioides, Cryptocarya taieriensis, C. maarensis, cf. Elaeocarpaceae/Cunoniaceae, and cf. Myrtaceae, had relatively high iWUE (Miocene iWUE first quartile Q1–third quartile Q3 =70–101) compared to modern evergreen trees (evergreen iWUE Q1–Q3=31–73) (Fig. 5a). Reconstructed iWUE from tropical early Miocene plants (Tesfamichael et al., 2017; Londoño et al., 2018) is slightly higher (Q1–Q3=80–125) (Fig. 5a). The difference between reconstructed Miocene iWUE and that of modern deciduous trees is greater still (deciduous iWUE Q1–Q3=27–52), consistent with the expectation that increased Ca favors evergreen trees (Niinemets et al., 2011; Soh et al., 2019). In the method of reconstruction used here, iWUE is ultimately an expression of leaf δ13C and conductance (see Methods Sect. 2.3). Therefore, similar to reconstructed Ca, iWUE may be sensitive to environmental factors other than Ca. For example, leaf δ13C can change in response to edaphic conditions and precipitation (e.g., Kohn, 2016; Cornwell et al., 2018), as well as vapor pressure deficit (VPD) (Franks et al., 2013). The climate of Foulden Maar in the early Miocene was warm-temperate to subtropical, compared to the cool-temperate forests in southern New Zealand today (Reichgelt et al., 2019). Though reconstructed relative humidity at Foulden Maar is within the range of modern New Zealand forest biomes, the average monthly VPD was 500–700 Pa, compared to 250–450 Pa today (Fig. S3), which may result in a similar reconstructed iWUE as under elevated Ca (Franks et al., 2013). However, the reconstructed ecosystem at Foulden Maar is a broad-leaved humid rainforest (Bannister et al., 2012), which likely had a high annual moisture surplus (Reichgelt et al., 2019). Increased water-use efficiency in response to relatively high VPD compared to modern values would only be a positive trade-off if water availability were limiting. Additionally, reconstructed iWUE from both temperate and tropical early Miocene floras is high compared to modern values, suggesting a global signal, such as would be expected in globally elevated Ca, not from VPD, as the early Miocene tropics would not be warmer than today (Herold et al., 2010). Most importantly, the modern iWUE data (Fig. 5a) are from a global database that includes environments with annual moisture deficits (Maire et al., 2015). Because reconstructed early Miocene iWUE is higher even than modern plants experiencing high VPD, we argue that VPD differences cannot explain the high iWUE values of the early Miocene and that increased efficiency due to higher Ca is the best explanation.
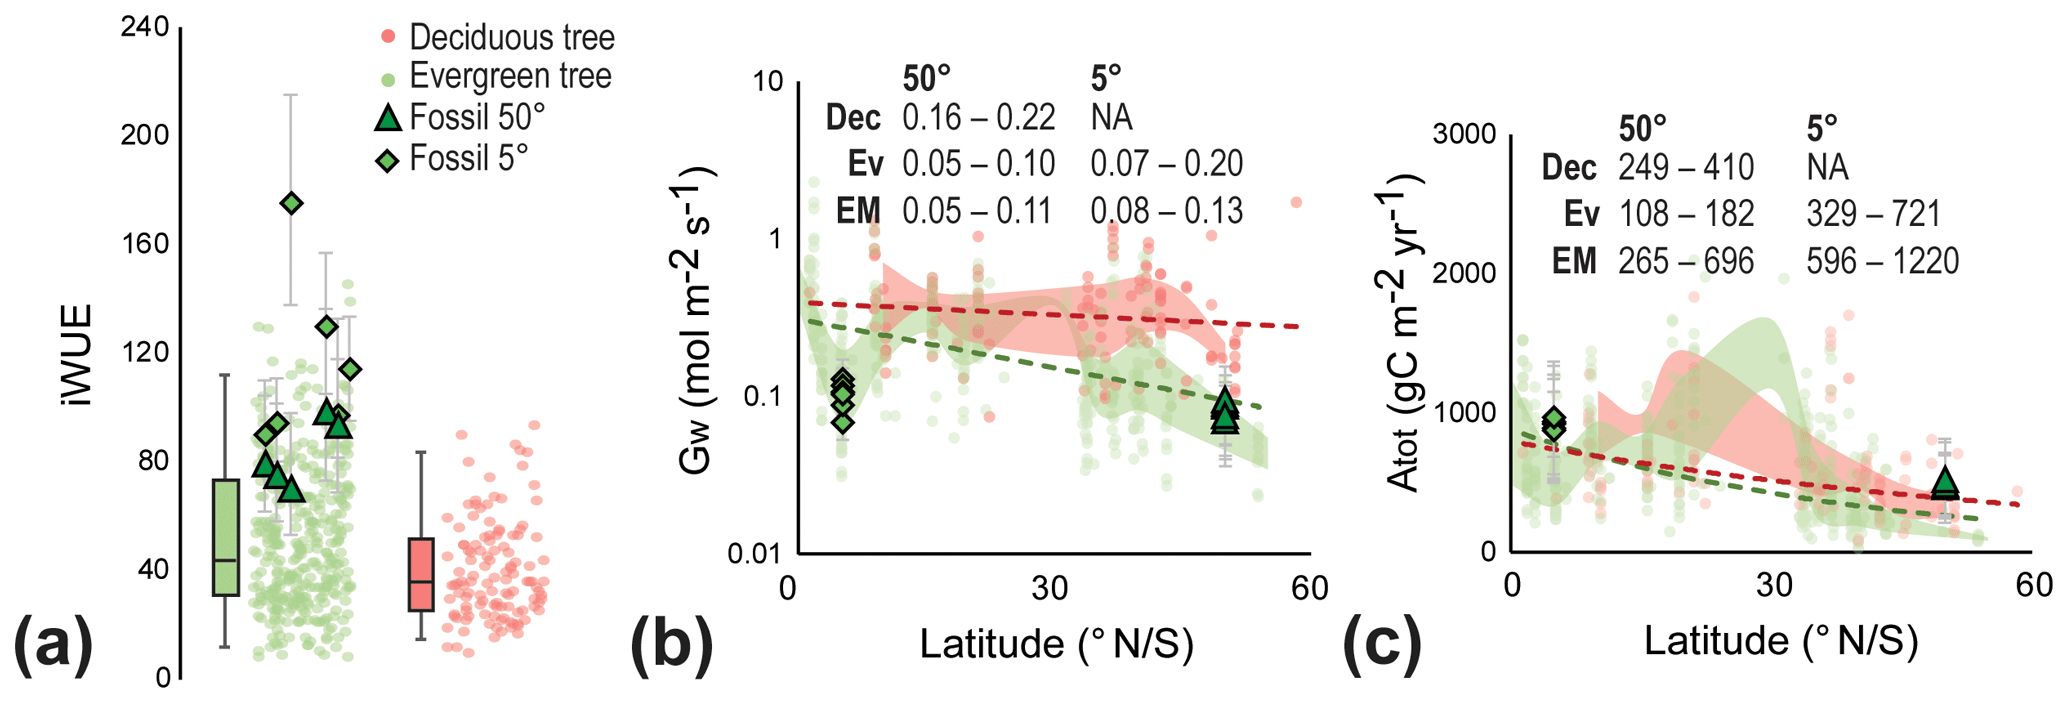
Figure 5Early Miocene leaf-level physiological parameters of canopy trees. (a) Intrinsic water-use efficiency (iWUE) of evergreen (green circles) and deciduous trees (red circles) based on modern leaf-level measurements (Maire et al., 2015) and fossil reconstructions (green triangles and diamonds). Error bars on fossil-derived data indicate ±1σ; box-and-whisker plots indicate the median, first, and third quartile (Q1 and Q3) and 95 % confidence interval of modern leaves of canopy trees. Individual data points are randomized on the x axis for a clearer depiction of the distribution. (b) Conductance to water (Gw) from modern evergreen (Ev) and deciduous (Dec) trees (Maire et al., 2015) and early Miocene fossils (EM) from different latitudes. The shaded red and green areas indicate the Q1–Q3 range of modern evergreen and deciduous trees, respectively, and the dashed lines indicate the overall linear trend with latitude. Text in panel is the Q1–Q3 range for each group, grouped in 5∘ latitude bins. (c) Total annual carbon flux per unit leaf area (Atot) from modern evergreen (Ev) and deciduous (Dec) trees (Maire et al., 2015) and fossils (EM) from different latitudes. The shaded red and green areas indicate the Q1–Q3 range of modern evergreen and deciduous trees, respectively, and the dashed lines indicate the overall exponential trend with latitude. Text in panel is the Q1–Q3 range for each group, grouped in 5∘ latitude bins.
In contrast to iWUE, reconstructed conductance to water (Gw) for Miocene trees is similar to the modern-day range at the same latitude (Fig. 5b), a somewhat surprising result because Gw is expected to be reduced in high Ca climates (Franks and Beerling, 2009). Studies on modern forests also suggest the absence of a reduction of Gw to enhanced Ca (Yang et al., 2016; Gimeno et al., 2018) or even an increase in the Gw (Frank et al., 2015). A longer growing season together with increasing VPD was proposed to explain increasing Gw in modern European forests (Frank et al., 2015). Similarly, a relatively high water flux from the forest to the atmosphere due to high water supply (Reichgelt et al., 2019) and high VPD (Fig. S3) could explain the broad similarity in the range of modern and early Miocene Gw, despite higher Ca. The early Miocene Gw from tropical latitudes is within the range of modern evergreen tropical trees, though relatively low (Early Miocene Q1–Q3: 0.08–0.13 mol m−2 s−1; modern evergreen Q1–Q3: 0.07–0.2 mol m−2 s−1) (Fig. 5b).
A longer growing season likely resulted in the high total annual carbon flux (Atot) to the biosphere reconstructed for Foulden Maar (Fig. 5c). Early Miocene trees at 50∘ S likely assimilated AtotQ1–Q3=265–696 g C m−2 yr−1, in comparison to AtotQ1–Q3=108–182 g C m−2 yr−1 in modern evergreen forests, and AtotQ1–Q3=249–410 g C m−2 yr−1 in modern deciduous forests at the same latitude (Fig. 5c). Early Miocene tropical trees appear to have a slightly higher total annual carbon flux (AtotQ1–Q3=596–1220 g C m−2 yr−1) than today (AtotQ1–Q3=329–721 g C m−2 yr−1), which, with a year-round growing season in the early Miocene (like today), is likely attributable to a leaf-level fertilization effect, similar to what is observed in modern carbon fertilization experiments (Norby et al., 2003; Bader et al., 2013; Yang et al., 2016). Although this estimate cannot take the number of leaves per unit area into account, these results suggest enhanced leaf-level productivity during higher than modern Ca in the early Miocene.
The methods used in this study provide an alternate approach to controlled carbon fertilization experiments, such as the Free Air Carbon Enrichment (FACE) experiments (e.g., Long et al., 2004), toward investigating the effect of increased Ca on the biosphere. FACE experiments provide data on the physiological effects of carbon enrichment on species that evolved under, or had thousands of years to adapt to, pre-industrial Ca (≈280 ppm), and the physiological changes detected in canopy species are measured as a direct response or over leaf generations (e.g., Norby et al., 2003; Yang et al., 2016). By contrast, our data provide an insight into species that evolved under higher than pre-industrial Ca and had many generations of individuals to adapt to incrementally slow changes. The direct, or multi-year, physiological response of modern forest trees to enhanced Ca is non-linear and non-uniform (e.g., Long et al., 2004; Ainsworth and Long, 2005), and therefore further investigations into the physiology of ancient plants operating in high-CO2 worlds are needed to reveal the complexity of plant responses over evolutionary timescales.
Leaf-level gas-exchange-derived Ca estimates suggest that early Miocene atmospheric CO2 was higher than pre-industrial levels at 450–550 ppm, providing further evidence of relatively high early Miocene global temperatures maintained by high atmospheric CO2 (Kürschner et al., 2009; Tesfamichael et al., 2017; Super et al., 2018; Londoño et al., 2018; Moraweck et al., 2019). Our reconstrcuted Ca values fall in a range that would be expected for an Earth system sensitivity of 3–7 ∘C (Hansen et al., 2013; Royer, 2016). A potential shift in atmospheric CO2 from 450 to 550 and back to 450 is recorded in the 100 kyr of sedimentation and leaf deposition at Foulden Maar. A disruption of the regional carbon and hydrological cycle was also recorded in leaf-wax δ13C and δD (Reichgelt et al., 2016) and may be linked to the Antarctic deglaciation at the termination of the Mi-1 (DeConto et al., 2008; Fox et al., 2015; Liebrand et al., 2017).
The first record is provided of increased Miocene leaf-level intrinsic water-use efficiency in both temperate New Zealand and the tropics, and we provide evidence for increased leaf-level productivity in temperate New Zealand. Enhanced productivity and water-use efficiency on other landmasses in temperate latitudes during the early Miocene, such as North America, Australia, and Asia, would have had a major impact on the global carbon and water cycles. Our gas-exchange results from New Zealand, supplemented with results from Ethiopia (Tesfamichael et al., 2017) and Panama (Londoño et al., 2018), provide empirical evidence for high water-use efficiency in the globally warmer world of the early Miocene, associated with elevated Ca. Tropical trees with high water-use efficiency compared to modern levels would have likely facilitated forest survival in climates where currently tropical savannas and grasslands exist. These high water-use efficiency forests in the tropics likely persisted until the late Miocene, when reduced Ca (Mejía et al., 2017) started favoring the expansion of grasslands, in particular C4 grasslands which are more efficient under low Ca and high temperatures (Strömberg, 2011; Polissar et al., 2016).
Emission scenarios suggest that atmospheric CO2 will reach our reconstructed early Miocene values of 450 ppm by 2030–2040 CE. While the global temperature response may lag behind the Ca increase and forest habitat expansion is hampered by the slow dispersal and growth rate of climax forest trees and anthropogenic influence (e.g., forest fragmentation and fire), early Miocene water-use efficiency and productivity estimates provide insight into future-biosphere potential, as well as into selective pressures that influence the types of plants that may proliferate under future elevated Ca.
All raw measurement data on fossil leaves generated for this paper are available in the Supplement. Raw measurements on fossil leaves from Ethiopia (Tesfamichael et al., 2017) and Panama (Londoño et al., 2018), δ18O measurements (Zachos et al., 2001), and iWUE, Gw, and An measurements on modern plants (Maire et al., 2015) are available through the cited original works.
The supplement related to this article is available online at: https://doi.org/10.5194/cp-16-1509-2020-supplement.
TR and WJD'A conceived of the idea and performed data analyses. BRSF and DEL collected the sediment core, BRSF and TR sampled the sediment core, and JGC and JMB identified fossil leaf taxa. AdCVM and TR gathered data from fossil leaves. TR and WJD'A wrote the paper, and all authors contributed to the final paper.
The authors declare that they have no conflict of interest.
We thank the Gibson family for kindly allowing us access to the site. Wei Huang, Andy Juhl, and Nicole DeRoberts are acknowledged for technical support. Gregory Retallack and an anonymous reviewer are acknowledged for their insightful comments that greatly improved this paper in the review process.
This research has been supported by the Royal Society of New Zealand Marsden Fund (grant no. 11-UOO-043), the National Science Foundation (grant no. EAR13-49659), the G. Unger Vetlesen Foundation, and the Lamont-Doherty Earth Observatory Summer Internship Program for Undergraduates.
This paper was edited by Zhengtang Guo and reviewed by Gregory Retallack and one anonymous referee.
Ainsworth, E. A. and Long, S. P.: What have we learned from 15 years of free-air CO2 enrichment (FACE)? A meta-analytic review of the responses of photosynthesis, canopy properties and plant production to rising CO2, New Phytol., 165, 351–372, 2005.
Askin, R. A. and Raine, J. I.: Oligocene and early Miocene terrestrial palynology of the Cape Roberts drillhole CRP-2/2A, Victoria Land Basin, Antarctica, Terra Antartica, 7, 493–501, 2000.
Bader, M. K.-F., Leuzinger, S., Keel, S. G., Siegwolf, R. T. W., Hagedorn, F., Schleppi, P., and Körner, C.: Central European hardwood trees in a high CO2 future: synthesis of an 8-year forest canopy CO2 enrichment project, J. Ecol., 101, 1509–1519, 2013.
Bannister, J. M., Conran, J. G., and Lee, D. E.: Lauraceae from rainforest surrounding an early Miocene maar lake, Otago, southern New Zealand, Rev. Palaeobot. Palyno., 178, 13–34, 2012.
Bar-On, Y. M., Philips, R., and Milo, R.: The biomass distribution on Earth, P. Natl. Acad. Sci. USA, 115, 6506–6511, 2018.
Beer, C., Reichstein, M., Tomelleri, E., Ciais, P., Jung, M., Carvalhais, N., Rödenbeck, C., Arain, M. A., Baldocchi, D., Bonan, G. B., Bondeau, A., Cescatti, A., Lasslop, G., Lindroth, A., Lomas, M., Luyssaert, S., Margolis, H., Oleson, K. W., Roupsard, O., Veenendaal, E., Viovy, N., Williams, C. J., Woodward, F. I., and Papale, D.: Terrestrial gross carbon dioxide uptake: Global distribution and covariation with climate, Science, 329, 834–838, 2010.
Bolton, C. T., Hernández-Sánchez, M. T., Fuertes, M.-Á., González-Lemos, S., Abrevaya, L., Mendez-Vicente, A., Flores, J.-A., Probert, I., Giosan, L., Johnson, J., and Stoll, H. M.: Decrease in coccolithophore calcification and CO2 since the middle Miocene, Nat. Commun., 7, 1–13, 2016.
Boyden, J. A., Müller, R. D., Gurnis, M., Torsvik, T. H., Clark, J. A., Turner, M., Ivey-Law, H., Watson, R. J., and Cannon, J. S.: Next-generation plate-tectonic reconstructions using GPlates, in: Geoinformatics: Cyberinfrastructures for the Solid Earth Sciences, edited by: Keller, G. R., and Baru, C., Cambridge University Press, Cambridge, UK, 2011.
Bush, R. T., Wallace, J., Currano, E. D., Jacobs, B. F., McInerney, F. A., Dunn, R. E., and Tabor, N. J.: Cell anatomy and leaf δ13C as proxies for shading and canopy structure in a Miocene forest from Ethiopia, Palaeogeogr. Palaeocl., 485, 593–604, 2017.
Cernusak, L. A.: Gas exchange and water-use efficiency in plant canopies, Plant Biology, 22, 52–67, 2020.
Conran, J. G., Bannister, J. M., and Lee, D. E.: Fruits and leaves with cuticle of Laurelia otagoensis sp. nov. (Atherospermataceae) from the early Miocene of Otago (New Zealand), Alcheringa, 37, 1–14, 2013.
Conran, J. G., Lee, W. G., Lee, D. E., Bannister, J. M., and Kaulfuss, U.: Reproductive niche conservatism in the isolated New Zealand flora over 23 million years, Biol. Letters, 10, 20140647, https://doi.org/10.1098/rsbl.2014.0647, 2014.
Conran, J. G., Bannister, J. M., Mildenhall, D. C., and Lee, D. E.: Hedycarya macrofossils and associated Planarpollenites pollen from the early Miocene of New Zealand, Am. J. Bot., 103, 938–956, 2016.
Cornwell, W. K., Wright, I. J., Turner, J., Maire, V., Barbour, M. M., Cernusak, L. A., Dawson, T., Ellsworth, D., Farquhar, G. D., Griffiths, H., Keitel, C., Knohl, A., Reich, P. B., Williams, D. G., Bhaskar, R., Cornelissen, J. H. C., Richards, A., Schmidt, S., Valladares, F., Körner, C., Schulze, E.-D., Buchmann, N., and Santiago, L. S.: Climate and oils together regulate photosynthetic carbon isotope discrimination within C3 plants worldwide, Global Ecol. Biogeogr., 27, 1056–1067, 2018.
DeConto, R. M., Pollard, D., Wilson, P. A., Pälike, H., Lear, C. H., and Pagani, M.: Thresholds for Cenozoic bipolar glaciation, Nature, 455, 652–656, 2008.
De Lange, P. J.: Fact Sheet (content continuously updated). New Zealand Plant Conservation Network, available at: https://www.nzpcn.org.nz, last access: 27 May 2020.
Dow, G. J., Bergmann, D. C., and Berry, J. A.: An integrated model of stomatal development and leaf physiology, New Phytol., 201, 1218–1226, 2014.
Drake, B. G., Gonzàlez-Meler, M. A., and Long, S. P.: More efficient plants: A consequence of rising atmospheric CO2?, Annu. Rev. Plant Phys., 48, 606–639, 1997.
Evans, J. R. and Von Caemmerer, S.: Carbon dioxide diffusion inside leaves, Plant Physiol., 110, 339–346, 1996.
Farquhar, G. D. and Richards, R. A.: Isotopic composition of plant carbon correlates with water-use efficiency of wheat genotypes, Aust. J. Plant. Physiol., 11, 539–552, 1984.
Farquhar, G. D., von Caemmerer, S., and Berry, J. A.: A biochemical model of photosynthetic CO2 assimilation in leaves of C3 species, Planta, 149, 78–90, 1980.
Farquhar, G. D., O'Leary, M. H., and Berry, J. A.: On the relationship between carbon isotope discrimination and the intercellular carbon dioxide concentration in leaves, Aust. J. Plant. Physiol., 9, 121–137, 1982.
Farquhar, G. D., Ehleringer, J. R., and Hubick, K. T.: Carbon isotope discrimination and photosynthesis, Annu. Rev. Plant Phys., 40, 503–537, 1989.
Foster, G. L., Royer, D. L., and Lunt, D. J.: Future climate focing potentially without precedent in the last 420 million years, Nat. Commun., 8, 14845, https://doi.org/10.1038/ncomms14845, 2017.
Feng, X.: Trends in intrinsic water-use efficiency of natural trees for the past 100–200 years: a response to atmospheric CO2 concentration, Geochim. Cosmochim. Ac., 63, 1891–1903, 1999.
Fox, B. R. S., Wartho, J.-A., Wilson, G. S., Lee, D. E., Nelson, F. E., and Kaulfuss, U.: Long-term evolution of an Oligocene/Miocene maar lake from Otago, New Zealand, Geochem. Geophys. Geosy., 16, 59–76, 2015.
Fox, B. R. S., Wilson, G. S., and Lee, D. E.: A unique annually laminated maar lake sediment record shows orbital control of Southern Hemisphere midlatitude climate across the Oligocene-Miocene boundary, Geol. Soc. Am. Bull., 128, 609–626, 2016.
Frank, D. C., Poulter, B., Saurer, M., Esper, J., Huntingford, C., Helle, G., Treydte, K., Zimmermann, N. E., Schleser, G. H., Ahlström, A., Ciais, P., Friedlingstein, P., Levis, S., Lomas, M., Sitch, S., Viovy, N., Andreu-Hayles, L., Bednarz, Z., Berninger, F., Boettger, T., D'Alessandro, H., Kalela-Brundin, M., Krapiec, M., Leuenberger, M., Loader, N. J., Marah, H., Masson-Delmotte, V., Pazdur, A., Pawelczyk, S., Pierre, M., Planells, O., Pukiene, R., Reynolds-Henne, C. E., Rinne, K. T., Saracino, A., Sonninen, E., Stievenard, M., Switsur, V. R., Szczepanek, E., Szychowska-Krapiec, L., Todaro, L., Waterhouse, J. S., and Weigl, M.: Water-use efficiency and transpiration across European forests during the Anthropocene, Nat. Clim. Change, 5, 579–583, 2015.
Franks, P. J. and Beerling, D. J.: Maximum leaf conductance driven by CO2 effects on stomatal size and density over geologic time, P. Natl. Acad. Sci. USA, 106, 10343–10347, 2009.
Franks, P. J., Drake, P. L., and Beerling, D. J.: Plasticity in maximum stomatal conductance constrained by negative correlation between stomatal size and density: an analysis using Eucalyptus globulus, Plant Cell Environ., 32, 1737–1748, 2009.
Franks, P. J., Adams, M. A., Amthor, J. S., Barbour, M. M., Berry, J. A., Ellsworth, D. S., Farquhar, G. D., Ghannoum, O., Lloyd, J., McDowell, N. G., Norby, R. J., Tissue, D. T., and von Caemmerer, S.: Sensitivity of plants to changing atmospheric CO2 concentration: from the geological past to the next century, New Phytol., 197, 1077–1094, 2013.
Franks, P. J., Royer, D. L., Beerling, D. J., van de Water, P. K., Cantrill, D. J., Barbour, M. M., and Berry, J. A.: New constraints on atmospheric CO2 concentration for the Phanerozoic, Geophys. Res. Lett., 41, 4685–4694, 2014.
Gimeno, T. E., McVicar, T. R., O'Grady, A. P., Tissue, D. T., and Ellsworth, D. S.: Elevated CO2 did not affect the hydrological balance of a mature native Eucalyptus woodland, Global Change Biol., 24, 3010–3024, 2018.
Graham, H. V., Patzkowsky, M. E., Wing, S. L., Parker, G. G., Fogel, M. L., and Freeman, K. H.: Isotopic characteristics of canopies in simulated leaf assemblages, Geochim. Cosmochim. Ac., 144, 82–95, 2014.
Greenop, R., Sosdian, S. M., Henehan, M. J., Wilson, P. A., Lear, C. H., and Foster, G. L.: Orbital forcing, ice volume, and CO2 across the Oligocene–Miocene transition, Paleoceanography and Paleoclimatology, 34, 316–628, 2019.
Hansen, J., Sato, M., Russell, G., and Kharecha, P.: Climate sensitivity, sea level and atmospheric carbon dioxide, Philos. T. Roy. Soc. A, 371, 20120294, https://doi.org/10.1098/rsta.2012.0294, 2013.
Henrot, A.-J., François, L., Favre, E., Butzin, M., Ouberdous, M., and Munhoven, G.: Effects of CO2, continental distribution, topography and vegetation changes on the climate at the Middle Miocene: a model study, Clim. Past, 6, 675–694, https://doi.org/10.5194/cp-6-675-2010, 2010.
Herold, N., Müller, R. D., and Seton, M.: Comparing early to middle Miocene terrestrial climate simulations with geological data, Geosphere, 6, 952–961, 2010.
Ji, S., Nie, J., Lechler, A., Huntington, K. W., Heitmann, E. O., and Breecker, D. O.: A symmetrical CO2 peak and asymmetrical climate change during the middle Miocene, Earth Planet. Sc. Lett., 499, 134–144, 2018.
Kaulfuss, U.: Crater stratigraphy and the post-eruptive evolution of Foulden Maar, southern New Zealand, New Zeal. J. Geol. Geop., 60, 410–432, 2017.
Kaulfuss, U., Lee, D. E., Barratt, B. I. P., Leschen, R. A. B., Larivière, M.-C., Dlussky, G. M., Henderson, I. M., and Harris, A. C.: A diverse fossil terrestrial arthropod fauna from New Zealand: evidence from the early Miocene Foulden Maar fossil lagerstätte, Lethaia, 48, 299–308, 2015.
Kohn, M.J.: Carbon isotope discrimination in C3 land plants is independent of natural variations in , Geophysical Perspective Letters, 2, 35–43. 2016.
Kürschner, W. M.: The anatomical diversity of recent and fossil leaves of the durmast oak (Quercus petraea Lieblein/Q. pseudocastanaea Goeppert) – implications for their use as biosensors of palaeoatmospheric CO2 levels, Rev. Palaeobot. Palyno., 96, 1–30, 1997.
Kürschner, W. M. and Kvaček, Z.: Oligocene-Miocene CO2 fluctuations, climatic and palaeofloristic trends inferred from fossil plant assemblages in central Europe, B. Geosci., 84, 189–202, 2009.
Kürschner, W. M., Kvaček, Z., and Dilcher, D. L.: The impact of Miocene atmospheric carbon dioxide fluctuations on climate and the evolution of terrestrial ecosystems, P. Natl. Acad. Sci. USA, 105, 449–453, 2008.
Leathwick, J. R.: New Zealand's potential forest pattern as predicted from current species-environment relationships, New Zeal. J. Bot., 39, 447–464, 2001.
Lee, D. E., Lindqvist, J. K., Beu, A. G., Robinson, J. H., Ayress, M. A., Morgans, H. E. G., and Stein, J. K.: Geological setting and diverse fauna of a Late Oligocene rocky shore ecosystem, Cosy Dell, Southland, New Zeal. J. Geol. Geop., 57, 195–208, 2014.
Lee, D. E., Kaulfuss, U., Conran, J. G., Bannister, J. M., and Lindqvist, J. K.: Biodiversity and palaeoecology of Foulden Maar: an early Miocene Konservat-Lagerstätte deposit in southern New Zealand, Alcheringa, 40, 525–541, 2016.
Liebrand, D., de Bakker, A. T. M., Beddow, H. M., Wilson, P. A., Bohaty, S. M., Ruessink, G., Pälike, H., Batenburg, S. J., Hilgen, F. J., Hodell, D. A., Huck, C. E., Kroon, D., Raffi, I., Saes, M. J. M., van Dijk, A. E., and Lourens, L. J.: Evolution of the early Antarctic ice ages, P. Natl. Acad. Sci. USA, 114, 3867–3872, 2017.
Lindqvist, J. K. and Lee, D. E.: High-frequency paleoclimate signals from Foulden Maar, Waipiata Volcanic Field, southern New Zealand: An Early Miocene varved lacustrine diatomite deposit, Sediment. Geol., 222, 98–110, 2009.
Londoño, L., Royer, D. L., Jaramillo, C. A., Escobar, J., Foster, D. A., Cárdenas-Rozo, A. L., and Wood, A.: Early Miocene CO2 estimates from a Neotropical fossil leaf assemblage exceed 400 ppm, Am. J. Bot., 105, 1929–1937, 2018.
Long, S. P., Ainsworth, E. A., Rogers, A., and Ort, D. R.: Rising atmospheric carbon dioxide: Plants FACE the future, Annu. Rev. Plant Biol., 55, 591–628, 2004.
Maire, V., Wright, I. J., Prentice, I. C., Batjes, N. H., Bhaskar, R., van Bodegom, P. M., Cornwell, W. K., Ellsworth, D. S., Niinemets, Ü., Ordonez, A., Reich, P. B., and Santiago, L. S.: Global effects of soil and climate on leaf photosynthetic traits and rates, Global Ecol. Biogeogr., 24, 706–717, 2015.
Marrero, T. R. and Mason, E. A.: Gaseous diffusion coefficients, J. Phys. Chem. Ref. Data, 1, 3–118, 1972.
McElwain, J. C., Montañez, I. P., White, J. D., Wilson, J. P., and Yiotis, C.: Was atmospheric CO2 capped at 1000 ppm over the past 300 million years?, Palaeogeogr. Palaeocl., 441, 653–658, 2016.
Mejía, L. M., Méndez-Vicente, A., Abrevaya, L., Lawrence, K. T., Ladlow, C., Bolton, C., Cacho, I., and Stoll, H.: A diatom record of CO2 decline since the late Miocene, Earth Planet. Sc. Lett., 479, 18–33, 2017.
Moraweck, K., Grein, M., Konrad, W., Kvaček, J., Kovar-Eder, J., Neinhuis, C., Traiser, C., and Kunzmann, L.: Leaf traits of long-ranging Paleogeone species and their relationship with depositional facies, climate an atmospheric CO2 level, Palaeontogr. Abt. B, 298, 93–172, 2019.
Németh, K. and White, J. D. L.: Reconstructing eruption processes of a Miocene monogenetic volcanic field from vent remnants: Waipiata Volcanic Field, South Island, New Zealand, J. Volcanol. Geoth. Res., 124, 1–21, 2003.
Niinemets, Ü., Díaz-Espejo, A., Flexas, J., Galmés, J., and Warren, C. R.: Role of mesophyll diffusion conductance in constraining potential photosynthetic productivity in the field, J. Exp. Bot., 60, 2249–2270, 2009.
Niinemets, Ü., Flexas, J., and Peñuelas, J.: Evergreens favored by higher responsiveness to increased CO2, Trends Ecol. Evol., 26, 136–142, 2011.
Norby, R. J., Sholtis, J. D., Gunderson, C. A., and Jawdy, S. S.: Leaf dynamics to a deciduous forest canopy: no response to elevated CO2, Oecologia, 136, 574–584, 2003.
Polissar, P. J., Rose, C., Uno, K. T., Phelps, S. R., and DeMenocal, P.: Synchronous rise of African C4 ecosystems 10 million years ago in the absence of aridification, Nat. Geosci., 12, 657–660, 2016.
Reichgelt, T., Kennedy, E. M., Mildenhall, D. C., Conran, J. G., Greenwood, D. R., and Lee, D. E.: Quantitative palaeoclimate estimates for Early Miocene southern New Zealand: Evidence from Foulden Maar, Palaeogeography, Palaeoclimatology, Palaeoecology, 378, 36–44, 2013.
Reichgelt, T. and D'Andrea, W. J.: Plant carbon assimilation rates in atmospheric CO2 reconstructions, New Phytol., 223, 1844–1855, 2019.
Reichgelt, T., D'Andrea, W. J., and Fox, B. R. S.: Abrupt plant physiological changes in southern New Zealand at the termination of the Mi-1 event reflect shifts in hydroclimate and pCO2, Earth Planet. Sc. Lett., 455, 115–124, 2016.
Reichgelt, T., Kennedy, E. M., Conran, J. G., Lee, W. G., and Lee, D. E.: The presence of moisture deficits in Miocene New Zealand, Global and Planetary Change, 172, 268–277, 2019.
Retallack, G. J. and Conde, G. D.: Deep time perspective on rising atmospheric CO2, Global Planet. Change, 189, 103177, https://doi.org/10.1016/j.gloplacha.2020.103177, 2020.
Roeske, C. A. and O'Leary, M. H.: Carbon isotope effects on the enzyme-catalyzed carboxylation of ribulose bisphosphate, Biochemistry-US, 23, 6275–6284, 1984.
Royer, D. L.: Climate sensitivity in the geologic past, Annu. Rev. Earth Pl. Sci., 44, 277–293, 2016.
Royer, D. L., Moynihan, K. M., McKee, M. L., Londoño, L., and Franks, P. J.: Sensitivity of a leaf gas-exchange model for estimating paleoatmospheric CO2 concentration, Clim. Past, 15, 795–809, https://doi.org/10.5194/cp-15-795-2019, 2019.
Rubel, F. and Kottek, M.: Observed and projected climate shifts 1901–2100 depicted by world maps of the Köppen-Geiger climate classification, Meteorol. Z., 19, 135–141, 2010.
Šantrůček, J., Vráblová, M., Šimková, M., Hronková, M., Drtinová, M., Květoň, J., Vrábl, D., Kubásek, J., Macková, J., Wiesnerová, D., Neuwithová, J., and Schreiber, L.: Stomatal and pavement cell density linked to leaf internal CO2 concentration, Ann. Bot.-London, 114, 191–202, 2014.
Schneider, C. A., Rasband, W. S., and Eliceiri, K. W.: NIH Image to ImageJ: 25 years of image analysis, Nat. Methods, 9, 671–675, 2012.
Schuepp, P. H.: Transley Review No. 59 Leaf boundary layers, New Phytol., 125, 477–507, 1993.
Soh, W. K., Wright, I. J., Bacon, K. L., Lenz, T. I., Steinthorsdottir, M., Parnell, A. C., and McElwain, J. C.: Palaeo leaf economics reveal a shift in ecosystem function associated with the end-Triassic mass extinction event, Nat. Plants, 3, 17104, https://doi.org/10.1038/nplants.2017.104, 2017.
Soh, W. K., Yiotis, C., Murray, M., Parnell, A. C., Wright, I. J., Spicer, R. A., Lawson, T., Caballero, R., and McElwain, J. C.: Rising CO2 drives divergence in water use efficiency of evergreen and deciduous plants, Science Advances, 5, eaax7906, https://doi.org/10.1126/sciadv.aax7906, 2019.
Spicer, R. A., Valdes, P. J., Spicer, T. E. V., Craggs, H. J., Srivastrava, G., Mehrotra, R. C., and Yang, J.: New developments in CLAMP: Calibration using global gridded meteorological data, Palaeogeogr. Palaeocl., 283, 91–98, 2009.
Steinthorsdottir, M., Vajda, V., and Pole, M. S.: Significant transient pCO2 perturbation at the New Zealand Oligocene–Miocene transition recorded by fossil plant stomata, Palaeogeogr. Palaeocl., 515, 152–161, 2019.
Strömberg, C. A. E.: Evolution of grasses and grassland ecosystems, Annu. Rev. Earth Pl. Sci., 39, 517–544, 2011.
Super, J. R., Thomas, E., Pagani, M., Huber, M., O'Brien, C., and Hull, P. M.: North Atlantic temperature and pCO2 coupling in the early-middle Miocene, Geology, 46, 519–522, 2018.
Tesfamichael, T., Jacobs, B. F., Tabor, N. J., Michel, L., Currano, E. D., Feseha, M., Barclay, R. S., Kappelman, J., and Schmitz, M.: Settling the issue of ”decoupling” between atmospheric carbon dioxide and global temperature: [CO2]atm reconstructions across the warming Paleogene-Neogene divide, Geology, 45, 999–1002, 2017.
Tipple, B. J., Meyers, S. R., and Pagani, M.: Carbon isotope of Cenozoic CO2: A comparative evaluation of available geochemical proxies, Paleoceanography, 25, PA3202, https://doi.org/10.1029/2009PA001851, 2010.
Witkowski, C. R., Agostini, S., Harvey, B. P., van der Meer, M. T. J., Sinninghe Damsté, J. S., and Schouten, S.: Validation of carbon isotope fractionation in algal lipids as a pCO2 proxy using a natural CO2 seep (Shikine Island, Japan), Biogeosciences, 16, 4451–4461, https://doi.org/10.5194/bg-16-4451-2019, 2019.
Yang, Y., Donohue, R. J., McVicar, T. R., Roderick, M. L., and Beck, H. E.: Long-term CO2 fertilization increases vegetation productivity and has little effect on hydrological partitioning in tropical rainforests, J. Geophys. Res.-Biogeo., 121, 2125–2140, 2016.
Zachos, J. C., Pagani, M., Sloan, L., Thomas, E., and Billups, K.: Trends, rhythms, and aberrations in global climate 65 Ma to present, Science, 292, 686–693, 2001.
Zhou, S., Yu, B., Shwalm, C. R., Ciais, P., Zhang, Y., Fisher, J. B., Michalak, A. M., Wang, W., Poulter, B., Huntzinger, D. N., Niu, S., Mao, J., Jain, A., Ricciuto, D. M., Shi, X., Ito, A., Wei, Y., Huang, Y., and Wang, G.: Response of water use efficiency to global environmental change based on output from terrestrial biosphere models, Global Biogeochem. Cy., 31, 1639–1655, 2017.
Zhu, Z., Piao, S., Myneni, R. B., Zeng, Z., Canadell, J. G., Ciais, P., Sitch, S., Friedlingstein, P., Arneth, A., Cao, C., Cheng, L., Kato, E., Koven, C., Li, Y., Lian, X., Liu, Y., Liu, R., Mao, J., Pan, Y., Peng, S., Peñuelas, J., Poulter, B., Pugh, T. A. M., Stocker, B. D., Viovy, N., Wang, X., Wang, Y., Xiao, Z., Yang, H., Zaehle, S., and Zeng, N.: Greening of the Earth and its drivers, Nat. Clim. Change, 6, 791–795, 2016.