the Creative Commons Attribution 4.0 License.
the Creative Commons Attribution 4.0 License.
 | 16 Jun 2020
Application and evaluation of the dendroclimatic process-based model MAIDEN during the last century in Canada and Europe
Jeanne Rezsöhazy
Hugues Goosse
Joël Guiot
Fabio Gennaretti
Etienne Boucher
Frédéric André
Mathieu Jonard
Tree-ring archives are one of the main sources of information to reconstruct climate variations over the last millennium with annual resolution. The links between tree-ring proxies and climate have usually been estimated using statistical approaches, assuming linear and stationary relationships. Both assumptions may be inadequate, but this issue can be overcome by ecophysiological modelling based on mechanistic understanding. In this respect, the model MAIDEN (Modeling and Analysis In DENdroecology) simulating tree-ring growth from daily temperature and precipitation, considering carbon assimilation and allocation in forest stands, may constitute a valuable tool. However, the lack of local meteorological data and the limited characterization of tree species traits can complicate the calibration and validation of such a complex model, which may hamper palaeoclimate applications. The goal of this study is to test the applicability of the MAIDEN model in a palaeoclimate context using as a test case tree-ring observations covering the 20th century from 21 Eastern Canadian taiga sites and 3 European sites. More specifically, we investigate the model sensitivity to parameter calibration and to the quality of climatic inputs, and we evaluate the model performance using a validation procedure. We also examine the added value of using MAIDEN in palaeoclimate applications compared to a simpler tree-growth model, i.e. VS-Lite. A Bayesian calibration of the most sensitive model parameters provides good results at most of the selected sites with high correlations between simulated and observed tree growth. Although MAIDEN is found to be sensitive to the quality of the climatic inputs, simple bias correction and downscaling techniques of these data improve significantly the performance of the model. The split-sample validation of MAIDEN gives encouraging results but requires long tree ring and meteorological series to give robust results. We also highlight a risk of overfitting in the calibration of model parameters that increases with short series. Finally, MAIDEN has shown higher calibration and validation correlations in most cases compared to VS-Lite. Nevertheless, this latter model turns out to be more stable over calibration and validation periods. Our results provide a protocol for the application of MAIDEN to potentially any site with tree-ring width data in the extratropical region.
- Article
(5993 KB) - Full-text XML
-
Supplement
(1219 KB) - BibTeX
- EndNote


Instrumental data inform on past climate only back to the 19th century, because few continuous records exist before this period (Harris et al., 2014; University of East Anglia Climatic Research Unit, CRU, 2017). Complementary, indirect climate records from natural archives such as tree rings offer a longer-term perspective. In this context, dendroclimatology, defined as the science that allows for the inference of past climates from tree rings, enables climate reconstructions at high temporal resolution (annual) over several centuries or millennia (Fritts, 1976; Hughes et al., 2011). Thanks to the availability of tree-ring observations in many regions, they represent the main data source in most large-scale hemispheric reconstructions covering the last millennium (e.g. Cook et al., 1999; Jones et al., 2009; Mann et al., 2009; Wilson et al., 2016; Anchukaitis et al., 2017; PAGES 2k Consortium, 2017; Esper et al., 2018; St. George and Esper, 2019).
Reconstructing past climate on the basis of tree rings first requires us to establish a relationship between measured variables, such as tree ring width or density, and climate. This has been classically done using statistical approaches (Fritts, 1976; Cook and Kairiukstis, 1990) and often reducing the problem to empirical linear relationships. Consequently, numerous temperature reconstructions are based on multiple linear regressions, calibrated using temperature during the instrumental period (e.g. Fritts, 1991; Jones et al., 1998; Mann et al., 1999, 2008). When using those statistical models for the entire period covered by dendroclimatic data, we assume both linear and stationary relationships (Guiot et al., 2014), while those assumptions may be inadequate for many records (Briffa et al., 1998; Wilson and Elling, 2004; Wilson et al., 2007; D'Arrigo et al., 2008).
Process-based tree-growth models are able to overcome those limitations of statistical models by explicitly representing the processes at the origin of the recorded signal (Guiot et al., 2014). They are also one kind of a larger group of models called proxy system models (PSMs). PSMs simulate the development of measured variables (here in tree rings) based on climatic variables as inputs. They integrate a simplified representation of the mechanisms governing the relationship between climate and observations used to capture palaeoclimatic information (Evans et al., 2013). These models can be applied in an inverse mode to estimate the climatic conditions that gave rise to the measured characteristics (Guiot et al., 2014; Boucher et al., 2014). Alternatively, they can be forced by climate model results (direct mode), thereby allowing us to compare model results with indirect climate records and without the need to reconstruct the climate from these observations (Evans et al., 2013; Dee et al., 2016). In addition to major advantages for model–data comparisons, proxy system models can facilitate the assimilation of proxy data in long climate model runs (Dee et al., 2016; Goosse, 2016). In palaeoclimatology, the objective of data assimilation is to optimally combine the results of one climate model and the observations to obtain an estimate of the state of the climate system as accurate as possible (Kalnay, 2003). This technique is now used regularly to obtain reanalyses, providing estimates of different climatic variables, such as temperature, precipitation, and atmospheric and ocean circulation for the last decades. Similar procedures are being developed in palaeoclimatology (e.g. Goosse et al., 2012; Franke et al., 2017; Tardif et al., 2018). However, so far, physically based tree-ring PSMs have not been used in published reconstructions based on data assimilation using actual data. This implies additional uncertainties when reconstructing temperatures.
Several models developed to simulate tree growth have been applied in dendroclimatology (Guiot et al., 2014). Among them, the VS-Lite model is a deterministic numerical model that simulates the primary response of ring width to climate based on the principle of limiting climatic factors (i.e. temperature and soil moisture; Tolwinski-Ward et al., 2011). Because of its simplicity and the small number of inputs required, it has been used in a wide range of conditions in a large number of palaeoclimate studies (e.g. Breitenmoser et al., 2014; Lavergne et al., 2015; Dee et al., 2016; Steiger and Smerdon, 2017; Seftigen et al., 2018; Fang and Li, 2019). However, VS-Lite is not able to reproduce tree-growth observations for numerous sites, particularly when the dependence on climatic conditions is complex (Breitenmoser et al., 2014). More comprehensive models such as the full Vaganov–Shashkin model (Vaganov et al., 2006) or MAIDEN (Modeling and Analysis In DENdroecology; Misson, 2004) could be more adapted to those conditions. One of the strengths of the MAIDEN model is to include the influence of atmospheric CO2 concentration on growth. This is essential when we know that the atmospheric concentration of CO2 increased by 30 % during the last 50 years (Myhre et al., 2013; Boucher et al., 2014). As models are calibrated over this recent period, not taking into account CO2 concentration could potentially induce stationarity problems, which can, ultimately, have an impact on the calibration of parameters, such as the ones related to temperature or water use efficiency that can covary with CO2. Unfortunately, those more comprehensive models including explicitly complex biological processes such as photosynthesis and carbon allocation may need careful initialization and calibration for each set. They may thus require specific information on the sites that may not be available. This may then hamper a systematic application of the model to a large number of sites as done for instance with VS-Lite (Breitenmoser et al., 2014).
Before applying a mechanistic model to a wide range of tree-ring records covering the past centuries, testing its applicability over the 20th century when data allow for an estimation of the model skill appears necessary, which is the goal of our study. For a specific study site, local meteorological data and measurements of several ecophysiological variables allow for a precise calibration of many individual processes included in the model. However, this is a rare case and likely one of the main limitations in the application of the model to a wide range of sites and soil conditions or when driven by climate model results that have known biases (Flato et al., 2013). We first present in Sect. 2.1 the two dendroclimatic models that are compared in this study, namely the complex model MAIDEN and the more simple model VS-Lite. MAIDEN and VS-Lite are applied to selected sites of the Northern Hemisphere (described in Sect. 2.2), covering a range of environmental conditions and tree species. A first set of data consists of a large number of sites from the same region with similar environmental conditions but with low in situ replication, while a second set only contains a few sites but with good replication. In this way, we test the applicability of MAIDEN to two datasets contrasted in terms of site documentation. This allows us to evaluate the extent to which MAIDEN can be applied. We compare the calibration methods adopted for VS-Lite (Tolwinski-Ward et al., 2013) and MAIDEN (Hartig et al., 2019) in Sect. 2.3. Different strategies to select the value for the most sensitive parameters of the MAIDEN model as well as the sensitivity of parameter calibration to the quality of climatic inputs are tested in Sect. 3.1, 3.2 and 3.3. Finally, we compare calibration and validation statistics of both models and discuss their applicability to a wide range of sites and species in Sect. 3.4 and 3.5.
2.1 Tree-growth models
2.1.1 The MAIDEN model
The dendroclimatic model MAIDEN has initially been developed by Misson (2004). It explicitly includes biological processes, namely photosynthesis and carbon allocation to different tree compartments, to simulate an annual tree-growth increment. The model uses daily climatic inputs (i.e. CO2 atmospheric concentration, precipitation, and minimum and maximum air temperature). Up to now, MAIDEN has been applied in the Mediterranean (Gea-Izquierdo et al., 2015) and temperate regions (Misson, 2004; Boucher et al., 2014), in the Eastern Canadian taiga (Gennaretti et al., 2017), and in Argentina (Lavergne et al., 2017). Currently, there are two versions of the model: from Gea-Izquierdo et al. (2015), developed for the Mediterranean forests, and Gennaretti et al. (2017), for boreal tree species. A unified version from those two versions has also been developed by Fabio Gennaretti (unpublished). In this study, all tests have been conducted using the unified version of MAIDEN. This unified version gives the opportunity to choose between the version from Gennaretti et al. (2017) or from Gea-Izquierdo et al. (2015) and, if needed, to test equations from both versions to evaluate their impact. However, here, only the version from Gennaretti et al. (2017) is used as it is the most adapted to the selected sites.
MAIDEN simulates photosynthesis on a daily basis and allocates the daily available carbon from photosynthesis and stored non-structural carbohydrates to different pools (leaves, roots, stem and storage). The allocation is based on functional rules defined following the ongoing phenological phase (five phases per year: winter 1 with no accumulation of growing degree-days (GDD), winter 2 with active GDD accumulation, budburst, summer and fall). At the end of the year, the model sums all the daily carbon inputs allocated to the stem to get an annual tree-growth increment (yearly Dstem, hereafter Dstem, in grams of carbon per square metre of stand per year). Dstem is assumed to be proportional to tree-ring growth so that we can build simulated tree-ring index time series and compare it with tree-ring width (hereafter TRW) observations (Sect. 2.3.1) (Gea-Izquierdo et al., 2015; Gennaretti et al., 2017). The structure of the MAIDEN model is provided online (https://figshare.com/articles/MAIDEN_ecophysiological_forest_model/5446435/1, last access: 17 November 2019; Gennaretti, 2017), and its modules are available upon request.
Tree-ring observation site and climate station (corresponding to a single location or grid cell as a function of the climatic dataset) constants of the MAIDEN model (Table S1) are derived from observations, as far as possible. For practical reasons, we were not able to retrieve slope and aspect information from a digital elevation model, for example, because it requires field knowledge of the site and for each sample, which we cannot systematically obtain given our global-scale goals. Thus, slope and aspect constants are set to zero. The soil is divided into four layers (1–15; 15–30; 30–65; 65–100 cm). Clay and sand fractions are extracted from the Harmonized World Soil Database (hereafter HWSD) v1.2 at 30 arcsec resolution (FAO/IIASA/ISRIC/ISSCAS/JRC, 2012) at the nearest cell with observed value, which is always at a distance smaller than 100 km to the site and assigned as follows: 1–30 cm parameters from the HWSD for the two first soil layers in MAIDEN; 30–100 cm parameters from the HWSD for the two deepest soil layers in MAIDEN. Soil layer thickness is fixed at the same value for all sites, as for fine root fractions.
2.1.2 The VS-Lite model
VS-Lite was developed by Tolwinski-Ward et al. (2011) as a simplified version of the full Vaganov–Shashkin model (Vaganov et al., 2006). The model reproduces the primary response of ring width to climate using an approach based on the limiting factors principle (i.e. temperature and soil moisture) and on threshold growth response functions. It does not model any biological processes explicitly so it cannot be considered fully mechanistic. The model needs monthly climate data (cumulated precipitations and average temperature) as input as well as latitude of the study site. The main output of VS-Lite used here is a unitless annual tree-growth increment (Tolwinski-Ward et al., 2011).
2.2 Study sites and climate data
2.2.1 Study sites
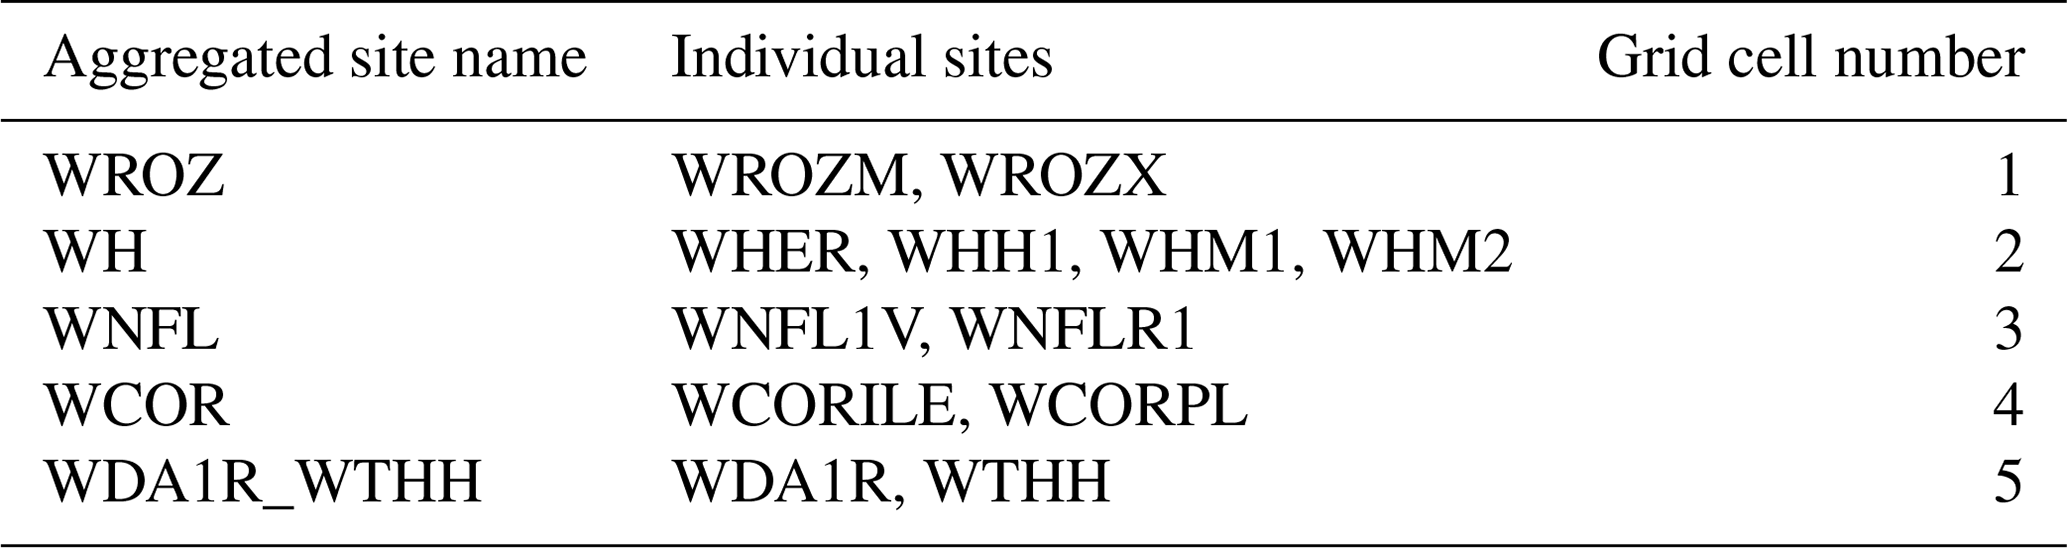
A network of tree-ring width chronologies of Picea mariana collected in similar conditions is available for the Eastern Canadian taiga (Nicault et al., 2014; Boucher et al., 2017; http://dendro-qc-lab.ca/trw.html, last access: 30 March 2019). We use here the tree-ring series directly derived from this compilation, without any modification. The chronologies have been previously standardized using the age-band regional curve standardization (or RCS) method proposed by Briffa et al. (2001) and further applied to a similar boreal dataset by Nicault et al. (2014). We also use the Eastern Canadian taiga chronology for Picea mariana from Gennaretti et al. (2017) (hereafter QC_taiga), standardized using a site-specific RCS (Gennaretti et al., 2014b). The latter is highly replicated (Gennaretti et al., 2014b) compared to the other Eastern Canadian sites from Nicault et al. (2014) and Boucher et al. (2017), which cover a broader spatial range, and provides additional observations to calibrate the model. From this network, we have only selected sites from Nicault et al. (2014) and Boucher et al. (2017) ending at least in 2000, with an expressed population signal (defined as the amount of variance of a population chronology infinitely replicated explained by a finite subsample; Buras, 2017) equal to or above 0.8, and replication equal to or above 15. We have also kept the site from Gennaretti et al. (2017) as a control site. At the end of the selection process, we get 21 sites (Fig. 1a). In order to increase replication, the Canadian sites from Nicault et al. (2014) and Boucher et al. (2017) are aggregated based on a 1∘ grid by averaging tree-ring width chronologies (Fig. 1b). From this, we get five aggregated sites (Table 1). Note that QC_taiga is not included into the aggregation process to keep it as a reference. The aggregation allows us to get relatively good intersite correlations inside the same 1∘ grid, ranging from 0.442 to 0.732 with an average of 0.558. This observational network represents an archetypal example of a singular species that covers an important hydroclimatic gradient. Sites located along the western (near James Bay, WNFLV1, Fig. 1a) and eastern (near Labrador sea, WL32, Fig. 1a) margins of the study area present the warmest growing seasons in the network (864 growing degree-days above 5 ∘C for the 1976–2005 period; Hutchinson et al., 2009). Sites located in the centre of the Quebec–Labrador peninsula (WHM2, Fig. 1a) present a much shorter growing season (692 growing degree-days above 5 ∘C), much like the sites located further north (WLECA, Fig. 1a, 573 growing degree-days above 5 ∘C). Annual precipitation increases from west to east, passing from 668 mm (WNFLV1, Fig. 1a) to 907 mm (WL32, Fig. 1a), and significantly decreases with latitude, reaching only 567 mm at WLECA (Fig. 1a) for the 1976–2005 period (Hutchinson et al., 2009). This makes this network a relevant candidate for our calibration and validation exercises.

Figure 1Location of (a) 21 Eastern Canadian taiga sites (20 sites from Nicault et al., 2014, and Boucher et al. (2017) and 1 site called here QC_taiga from Gennaretti et al., 2017) (b) aggregated Eastern Canadian taiga sites from Nicault et al. (2014) and Boucher et al. (2017) based on a 1∘ grid (red numbered grid cells). Background map from Hunter (2007).
Table 1Aggregated Eastern Canadian taiga sites based on the individual sites from Nicault et al. (2014) and Boucher et al. (2017) (Fig. 1a and b).
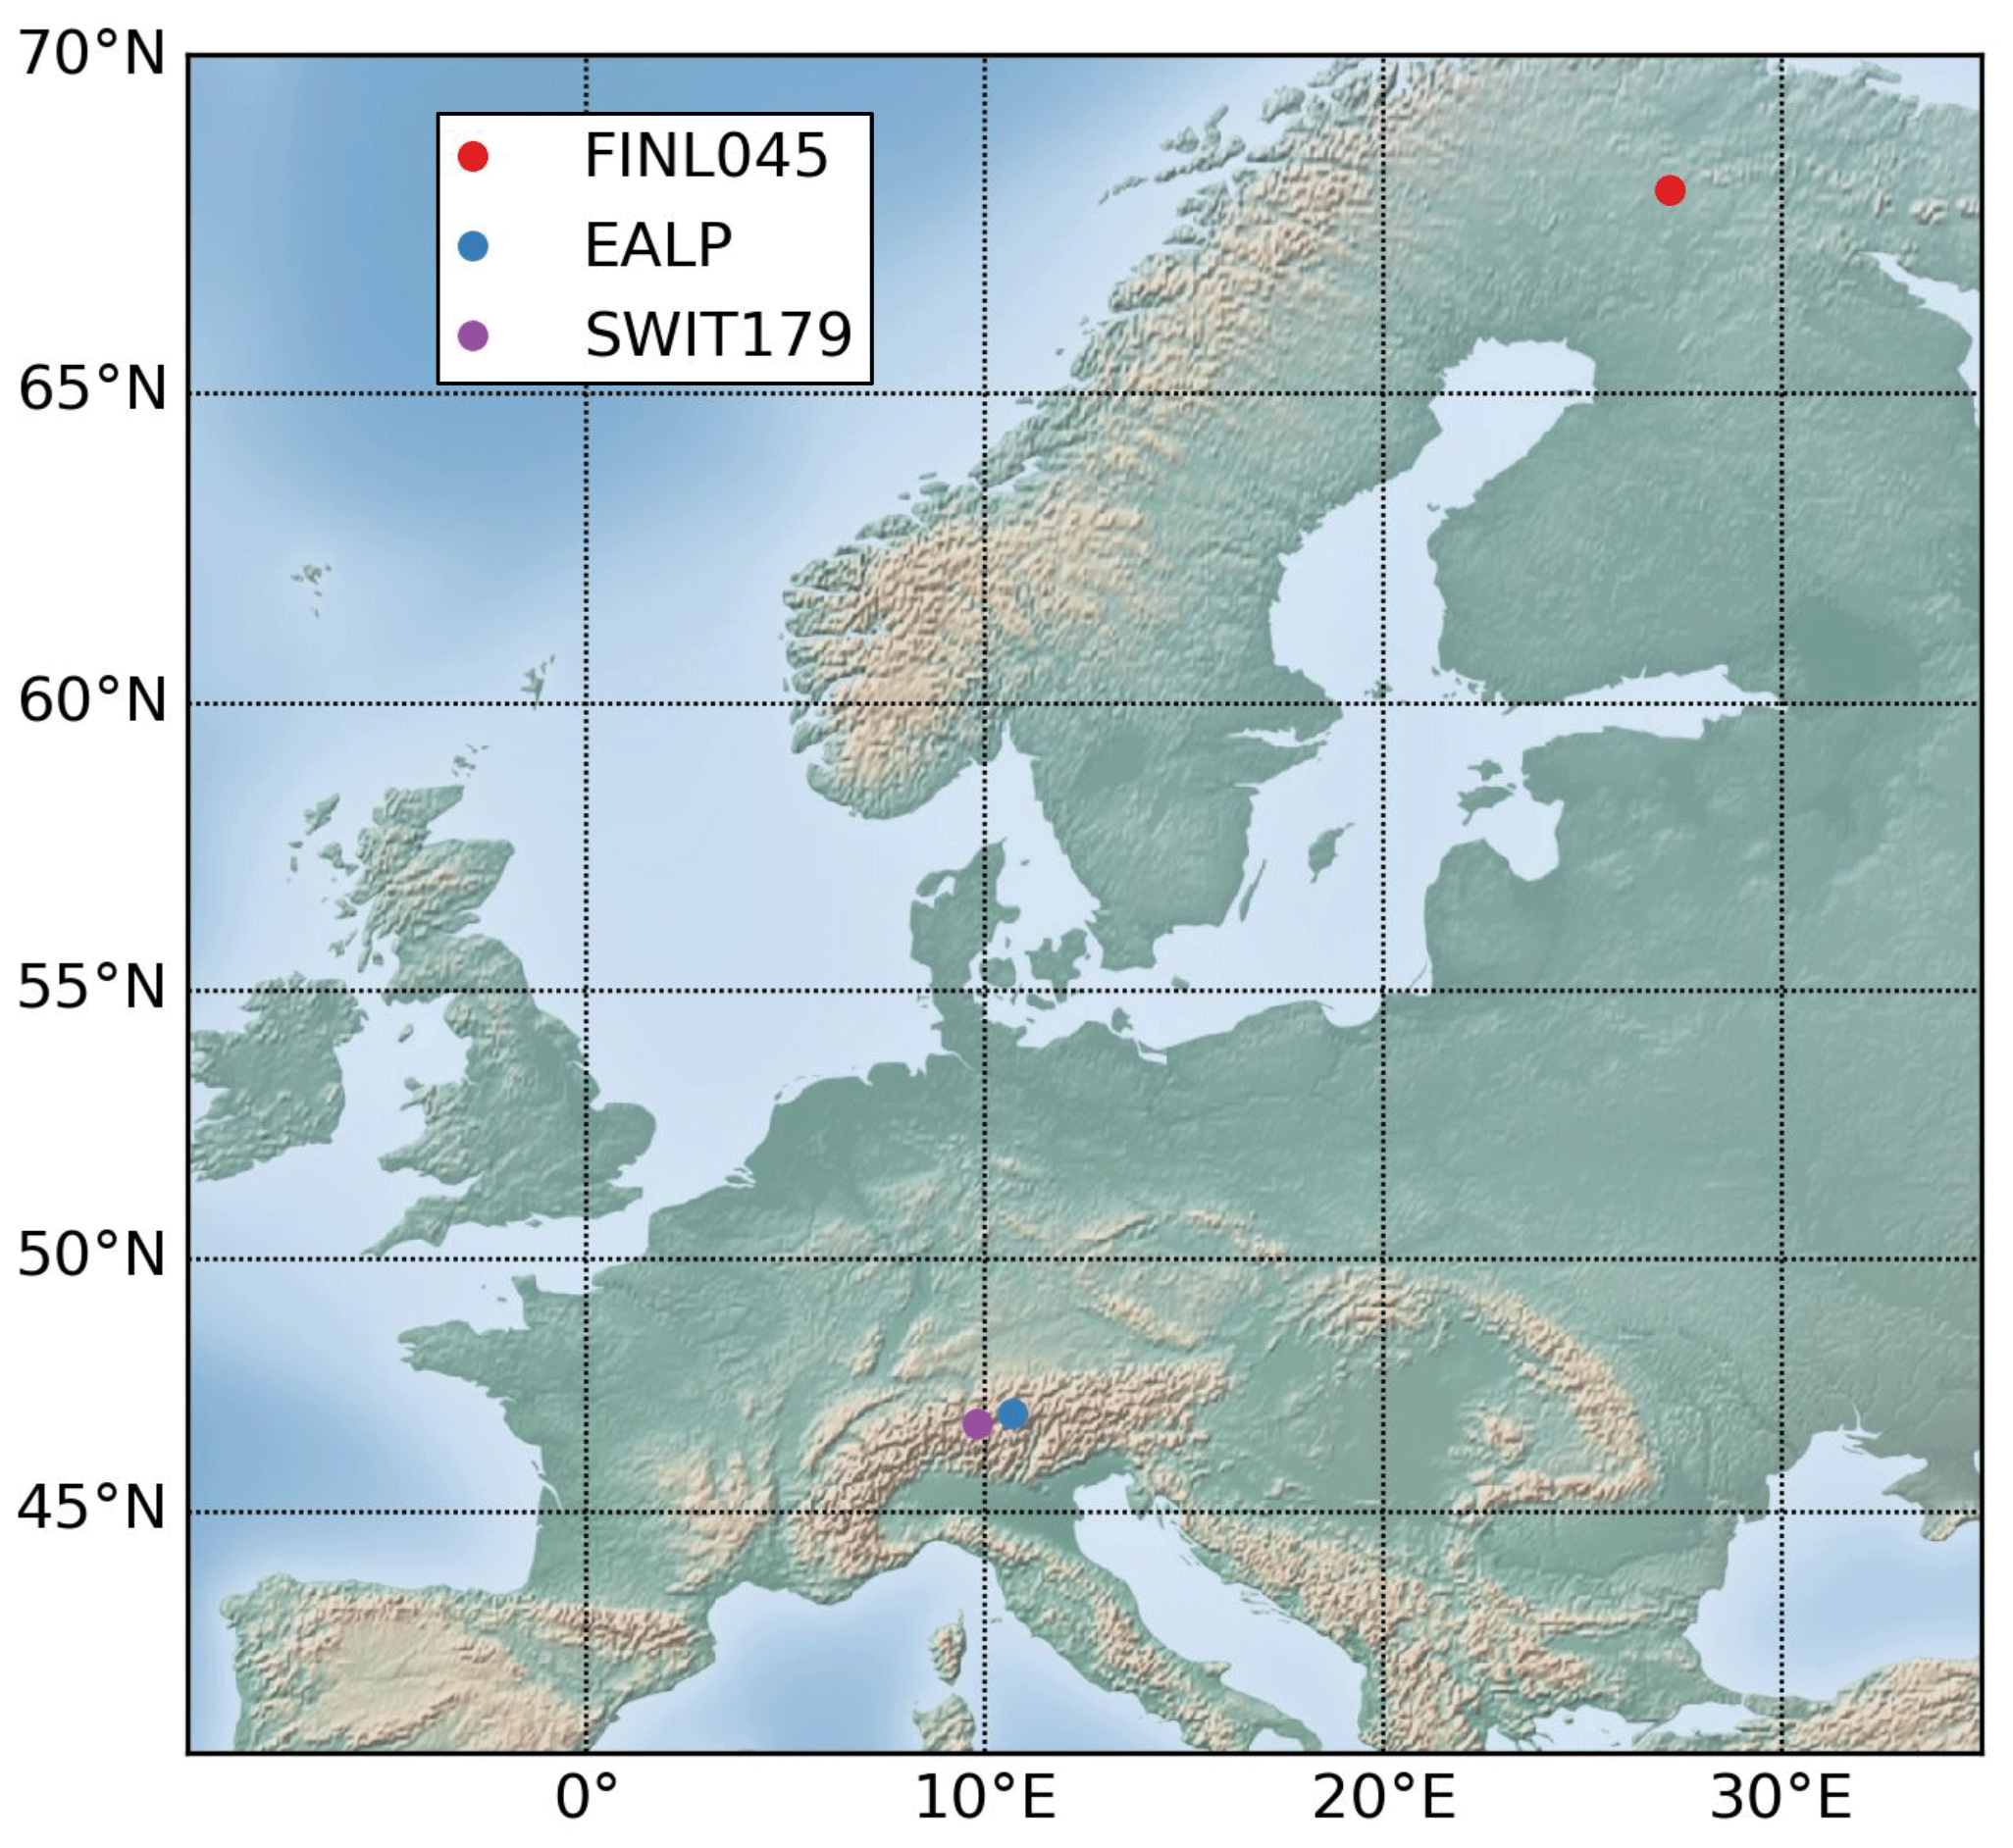
Three additional tree-ring width chronologies (hereafter European sites) are used to perform tests on sites with good replication, especially at the European Alps site, and long nearby series from meteorological stations (Fig. 2): EALP (47∘ N, 10.7∘ E; 2050 m; European Alps; Pinus cembra and Larix decidua; Büntgen et al., 2011; processed data available in the PAGES 2k database; PAGES 2k Consortium, 2017); SWIT179 (46.77∘ N, 9.82∘ E; 1800 m; Picea abies; standardized with a cubic-smoothing spline with a 50 % frequency cut-off at 35 years; Seftigen et al., 2018; unprocessed data archived at the International Tree Ring Data Bank, https://www.ncdc.noaa.gov/data-access/paleoclimatology-data, last access: 12 January 2019) and FINL045 (68.07∘ N, 27.2∘ E; Pinus sylvestris; standardized using a spline with a 50 % frequency cut-off response at 32 years; Babst et al., 2013; processed data available in the Supplement of Babst et al., 2013). Similarly to the Eastern Canadian taiga chronologies, the tree-ring series were not modified here. Those three European sites exemplify a situation where we only have access to individual sites with different species and from different environmental conditions that are not part of a larger network of tree-ring width observations.
2.2.2 Climate data
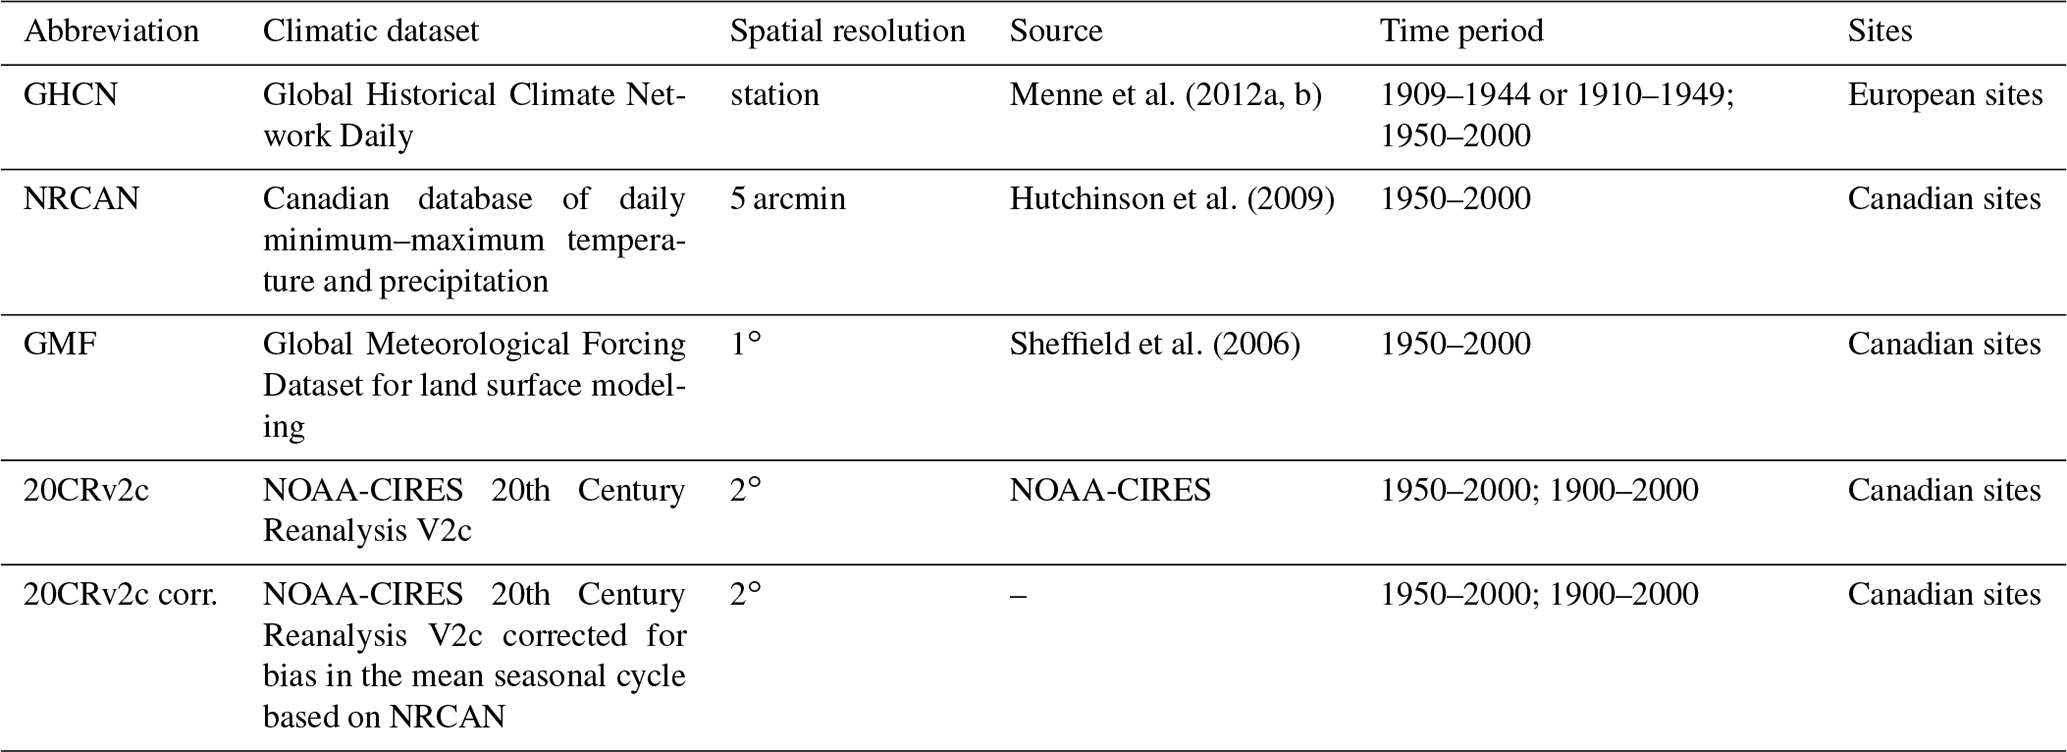
Daily climatic inputs are needed to run MAIDEN (Sect. 2.1.1). Monthly climatic inputs for VS-Lite are computed from those daily data. Note that monthly-average temperature has been computed by averaging daily maximum and minimum temperatures, which could lead to a small bias. Three daily climatic datasets with different spatial resolution (Table 2) were selected for our analysis on the Eastern Canadian taiga network (Fig. 1a and b). First, a dataset at a high spatial resolution of 5 min from the gridded interpolated Canadian database of daily minimum–maximum temperature and precipitation (Hutchinson et al., 2009, hereafter NRCAN). The Global Meteorological Forcing Dataset for land surface modeling (v1) (http://hydrology.princeton.edu/data.php, last access: 4 January 2019; Sheffield et al., 2006) at 1∘ resolution is used as a mid-resolution climatic dataset (hereafter GMF). The NOAA-CIRES 20th Century Reanalysis V2c (https://www.esrl.noaa.gov/psd/data/gridded/data.20thC_ReanV2c.monolevel.html, last access: 4 January 2019) at 2∘ resolution is used as a low-resolution dataset (hereafter 20CRv2c). Finally, the 20CRv2c dataset was modified to match the monthly-mean seasonal cycle of the high-resolution dataset NRCAN (hereafter 20CRv2c corr.). This simple bias correction and downscaling to the location of the site is done by removing the difference between the monthly-mean seasonal cycle of 20CRv2c (2∘) and NRCAN (5 arcmin) from the maximum and minimum temperature data. In order to avoid negative values, daily precipitations are multiplied by the ratio between the monthly-mean seasonal cycle of NRCAN (5 arcmin) and 20CRv2c (2∘). The time series are extracted from the grid cells nearest to the studied individual sites. The climatic data are averaged over the individual site data for the aggregated Eastern Canadian sites (Table 1).
Menne et al. (2012a, b)Hutchinson et al. (2009)Sheffield et al. (2006)Table 2Description of all daily climatic datasets used in this study (abbreviation, climatic dataset, spatial resolution and source), time periods on which MAIDEN and VS-Lite simulations are performed with each specific climatic dataset (Time period), and sites where climate data are used (sites). European and Canadian sites refer to Figs. 1 and 2, respectively.
The Global Historical Climate Network Daily (Table 2; see Table S2 for details on selected stations; Menne et al., 2012a, b; hereafter GHCN) is used to perform analysis on the European sites (FINL045, EALP, SWIT179, Fig. 2).
Daily atmospheric CO2 concentration data are linearly interpolated from the annual data from Sato and Schmidt (https://data.giss.nasa.gov/modelforce/ghgases/, last access: 3 December 2018).
2.3 Calibration
2.3.1 The MAIDEN model
We have developed a protocol to systematically and automatically calibrate the model through a Bayesian procedure with Markov Chain Monte Carlo sampling carried out using the DREAMzs algorithm (Hartig et al., 2019). The calibration procedure focusses on the most sensitive parameters of the model identified in Gennaretti et al. (2017): 6 parameters influencing the simulated stand growth primary production and 12 parameters involved in the modelling of the daily quantity of carbon allocated to different tree compartments (Table S3). Those 6+12 parameters are calibrated by comparison between simulated Dstem and tree-ring width observations. The comparison relies on the computation of the model likelihood defined as the sum of the logarithms of the normal probability densities of the residuals between the model simulation and the observations. The prior distributions of the 6+12 parameters are assumed to be uniform over an acceptable range, as in Gennaretti et al. (2017). The calibration procedure is made up of three steps. During the first step, we calibrate the 12 carbon allocation parameters, while fixing the 6 photosynthesis parameters to arbitrary values in their acceptable ranges. We run three Markov chains of 10 000 iterations with a five-iteration thinning (i.e. we only consider one random sample out of five) to calibrate the parameters. During the second step, we fix the 12 carbon allocation parameters at the values obtained from the first step. We calibrate the 6 photosynthesis parameters by also running three Markov chains of 10 000 iterations with a five-iteration thinning. Finally, during the third step, the 6 photosynthesis parameters are fixed at the values obtained from the second step, and the 12 carbon allocation parameters are calibrated, by running three Markov chains of 30 000 iterations, with a five-iteration thinning as well. Each of those nine chains starts from random initial values of the parameters in their acceptable ranges. At the end of each calibration step, we select the set of parameters with the highest posterior (maximum a posteriori value or MAP, Hartig et al., 2019) from all iterations considering a burn-in period (i.e. the number of initial iterations of a chain that are not considered in the calibration) of 1000 iterations (first and second steps) and 3000 iterations (third step). At the end of the calibration process, we thus have 6 calibrated parameters from the second calibration step and 12 carbon allocation parameters from the third one. The calibration method has been tested for convergence of Markov chains with Gelman–Rubin statistical indicators (Hartig et al., 2019).
The MAIDEN model was calibrated at the 21 Eastern Canadian taiga sites and at the 5 aggregated sites over the 1950–2000 time period using the high- (NRCAN), mid- (GMF) and low-resolution (20CRv2c) datasets as inputs, as well as the bias-corrected low-resolution dataset (20CRv2c corr.), and over the 1900–2000 time period using the 20CRv2c and 20CRv2c corr. datasets as climatic inputs. MAIDEN was also calibrated at the three European sites using GHCN station data over 1950–2000 (FINL045; EALP; SWIT179), 1909–1944 (FINL045) and 1910–1949 (EALP and SWIT179). Calibrated parameters values for the 1950–2000 time period are available in Tables S4–S7. Parameter posterior frequency distributions for the NRCAN (5 arcmin) high-resolution climatic dataset are available in Figs. S1–S58. Pearson correlation coefficients between observed TRW and simulated Dstem were computed, as well as the corresponding confidence level. To compare observed and simulated tree-ring growth data after the optimization of the model parameters, both observed tree-ring width series and simulated time series have been normalized to unitless indexes. Ideally, an exhaustive quantitative evaluation of MAIDEN would require a comparison of the variable simulated by MAIDEN to represent tree-growth directly with observations. However, this would imply the use of other tree-growth observations such as tree-ring density measurements, while tree-ring width represents the most widely available tree-growth observations, which makes it a relevant candidate given our global-scale goals. The disadvantage is that this normalization forbids us to assess error in the variance. This is why we only analyse the correlations for simplicity as using other metrics like the RMSE would not help us in this aspect.
2.3.2 The VS-Lite model
The VS-Lite parameters are calibrated at each location following a Bayesian approach described in Tolwinski-Ward et al. (2013). In this study, four VS-Lite parameters, corresponding to the lower and upper temperature (respectively T1 and T2 in Tolwinski-Ward et al., 2011) and soil moisture (respectively M1 and M2 in Tolwinski-Ward et al., 2011) thresholds of the model have been optimized. The other parameters were fixed to default values. The method is based on a standard Markov chain Monte Carlo approach, a Metropolis–Hastings algorithm embedded within a Gibbs sampler. The VS-Lite model was calibrated at the same sites and over the same time periods as MAIDEN, using the same climatic data (Sect. 2.3.1). Calibrated parameters values for the 1950–2000 period are available in Tables S8–S11. Pearson correlation coefficients between TRW observations and simulated tree-growth indexes were also computed. Observed time series have been normalized to unitless indexes as well.
Running MAIDEN takes around 2.5 s on one CPU for a 50-year time span, while running VS-Lite takes around 0.30 s. Currently, calibrating MAIDEN with our method takes around 18 h on one CPU for a site due to the high number of iterations and calibrated parameters, while the calibration method used for VS-Lite and developed by Tolwinski-Ward et al. (2013) takes only a few seconds.
2.4 Validation
Split-sample validation are performed by dividing the available data into two subperiods: one for calibration and one for validation, and vice versa. In order to test the influence of time series length, we validate the two models for both short (1950–1974 and 1975–2000) and long (1909–1944 and 1950–2000 or 1910–1949 and 1950–2000) time periods. For each validation experiment, Pearson correlation coefficients between observed TRW and simulated tree-growth indexes were computed, as well as the corresponding confidence level.
Split-sample validation was preferred over other validation methods such as h-block jackknife, which are computationally intensive. Additionally, removing years may be inappropriate for the validation because of the autocorrelation characterizing yearly TRW observations. Similar problems arise from a bootstrap technique (Gea-Izquierdo et al., 2017).
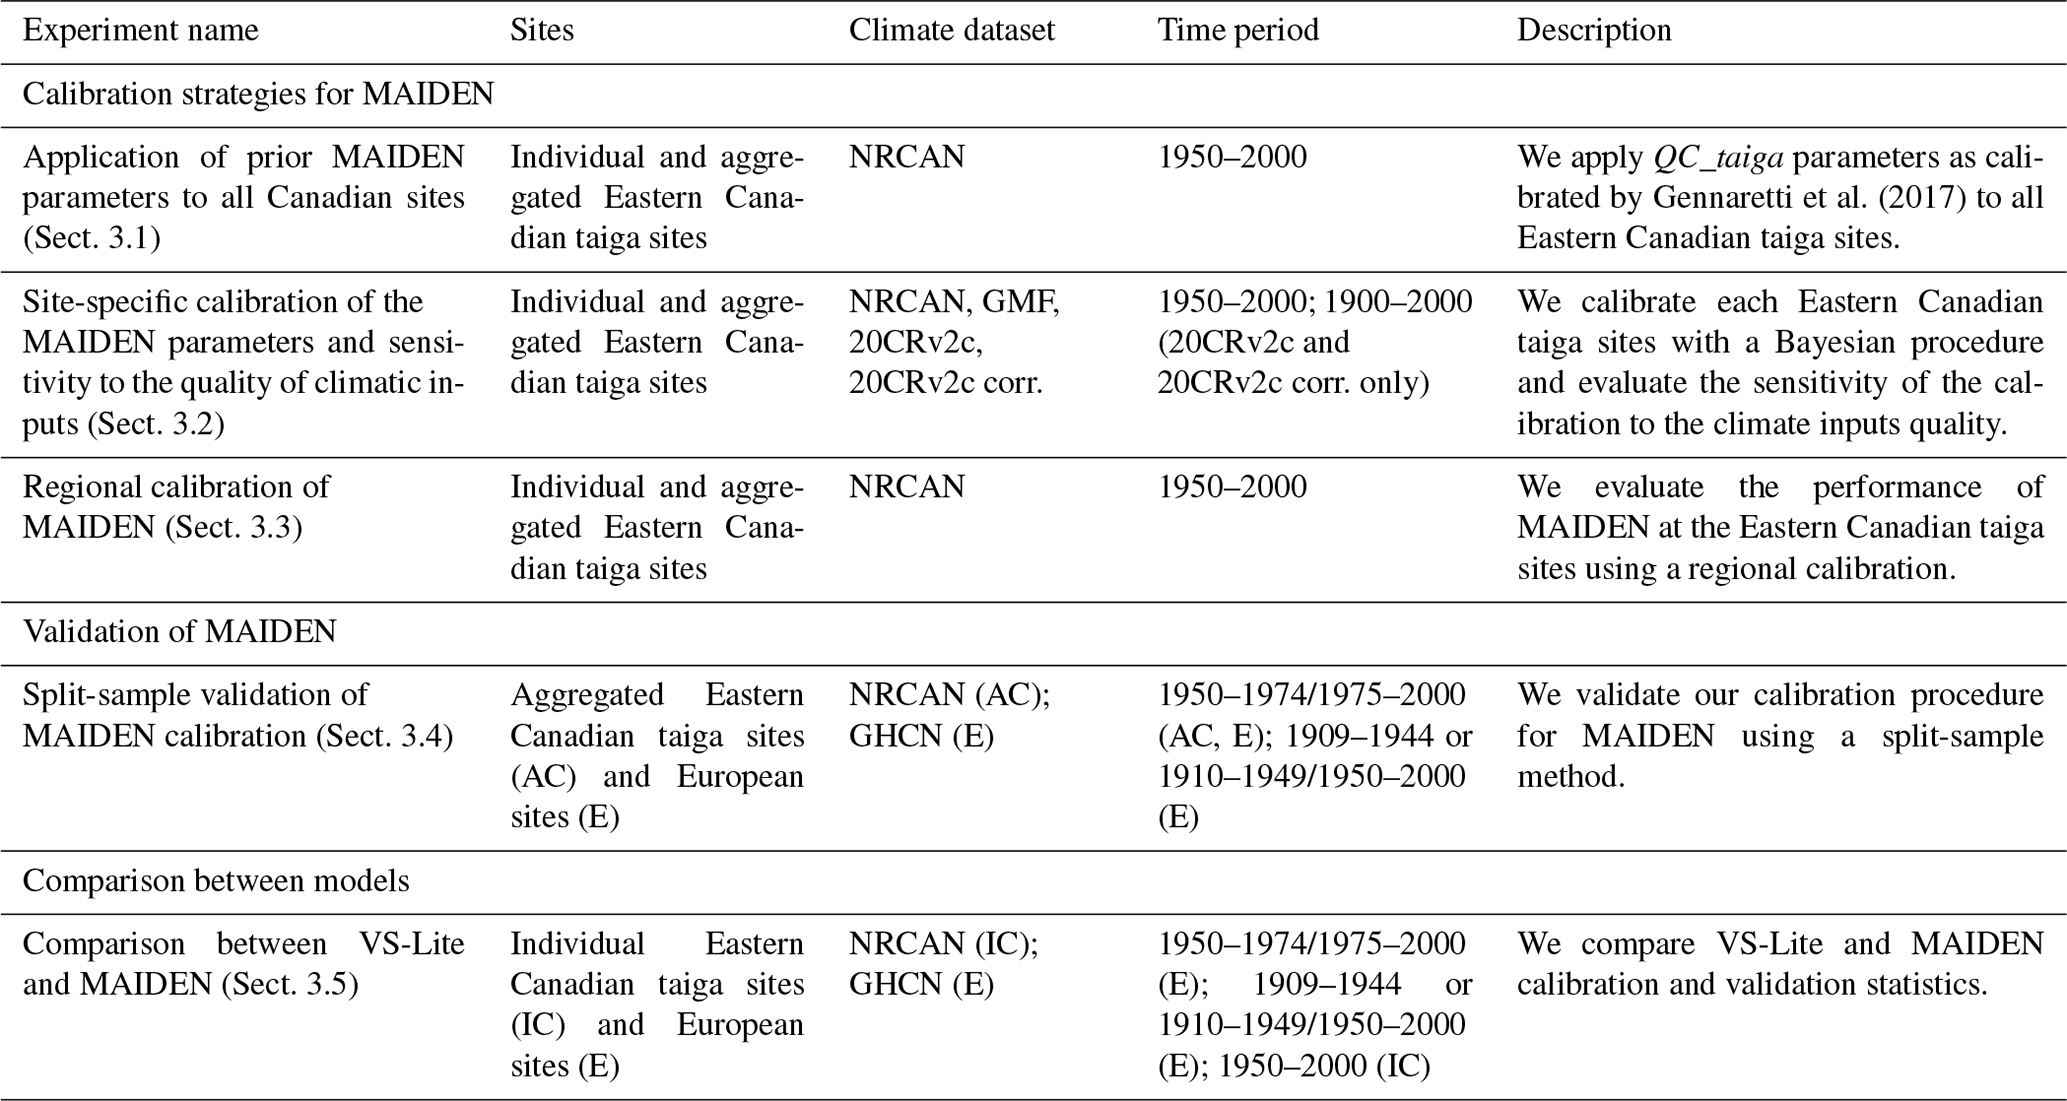
Our results and discussion are structured into five sections that allow us to fulfil our objective of testing the applicability of MAIDEN over the 20th century (Table 3). At first, we want to determine the best set of parameters for MAIDEN at our study sites and test the sensitivity of calibration to the quality of climatic inputs (Sect. 3.1, 3.2 and 3.3). In a context of palaeoclimate model–data comparison, where MAIDEN will be driven by climate model outputs at low resolution, this is a crucial point of our analysis. For example, bias correction and downscaling techniques could be good options to improve the robustness of the model calibration if the model is sensitive to the quality of climatic inputs.
Gennaretti et al. (2017)Table 3Description of each experiment performed in our study: experiment name, sites and climate dataset used for the experiment, time period of the experiment, and short description of the experiment. Information on climate datasets can be found in Table 2. Individual and aggregated Eastern Canadian taiga sites refer to Fig. 1 and European sites refer to Fig. 2.
We first test the possibility of using calibrated parameters from a well-documented site at other similar sites in terms of environment (here the Eastern Canadian taiga) and tree species (here Picea mariana) in Sect. 3.1. Another option is to calibrate each site individually, as in Sect. 3.2 following the calibration protocol detailed in Sect. 2.3.1. We thirdly test in Sect. 3.3 an alternative calibration method which consists of calibrating the MAIDEN model over the mean of a tree-ring width observations network with similar environmental conditions and then applying the resulting calibrated parameters to the individual sites. From another perspective, this experiment could also be seen as an alternative method for the validation of the MAIDEN model when the climate and/or tree-ring width observation time series are too short for a split-sample validation. In this case, the individual sites are considered nearly independent validation data. To test the sensitivity of the model to the quality of climatic inputs, we have selected four climatic datasets at different spatial resolutions (Sect. 2.2.2, Table 2) that will be used in Sect. 3.2 to drive MAIDEN at the Eastern Canadian taiga sites. As a second sensitivity experiment, we have applied the parameters calibrated with MAIDEN using the high-resolution climatic data (NRCAN) to the Eastern Canadian taiga sites driven by the low-resolution data without or with bias correction (20CRv2c and 20CRv2c corr.).
The validation of MAIDEN in Sect. 3.4 is essential to evaluate the robustness of the calibration. The last section of our study consists of comparing the performance of the complex model MAIDEN with the performance of the simple model VS-Lite so as to assess the benefits of using a complex tree-growth model as MAIDEN for past climate reconstruction compared to a simple one (Sect. 3.5).
3.1 Application of prior MAIDEN parameters to all Canadian sites
At first, the QC_taiga parameters as calibrated by Gennaretti et al. (2017) (12 carbon allocation and 6 photosynthesis parameters) were applied to the other 20 Eastern Canadian sites and 5 aggregated sites from Nicault et al. (2014) and Boucher et al. (2017) using the NRCAN (5 arcmin) climate data (Table 2) over the 1950–2000 time period. Correlations between observations and simulations with MAIDEN using QC_taiga calibrated parameters (Fig. 3) are low and non-significant at most sites. Several reasons can explain the low skill of MAIDEN using those parameters. These results could be linked to the lower replication level at the sites from Nicault et al. (2014) and Boucher et al. (2017) – even when aggregated – compared to the site from Gennaretti et al. (2017) that weakens the climatic signal in the series. This may also be due to a high sensitivity of parameter calibration to an unstable climate–species relationship among sites that are different from each other in many aspects (such as soil type, vegetation, nutrient availability). Additionally, the long-term trends of forest growth in the Eastern Canadian taiga mostly depend on the past fire history (e.g. Payette et al., 2008; Gennaretti et al., 2014a; Erni et al., 2017). This represents the main natural disturbance factor that has shaped the North American boreal ecosystem by determining forest structure and composition as well as carbon stocks and interacting with climate on a long timescale. Yet, MAIDEN does not account for disturbances. To evaluate the effect of those disturbances on our experiment, the long-term decadal trends have been removed in both observations and simulations following Gennaretti et al. (2017) (Fig. S59). With only the high-frequency signal, the agreement between TRW observations and simulations with MAIDEN using QC_taiga calibrated parameters is far better for most individual and aggregated sites.
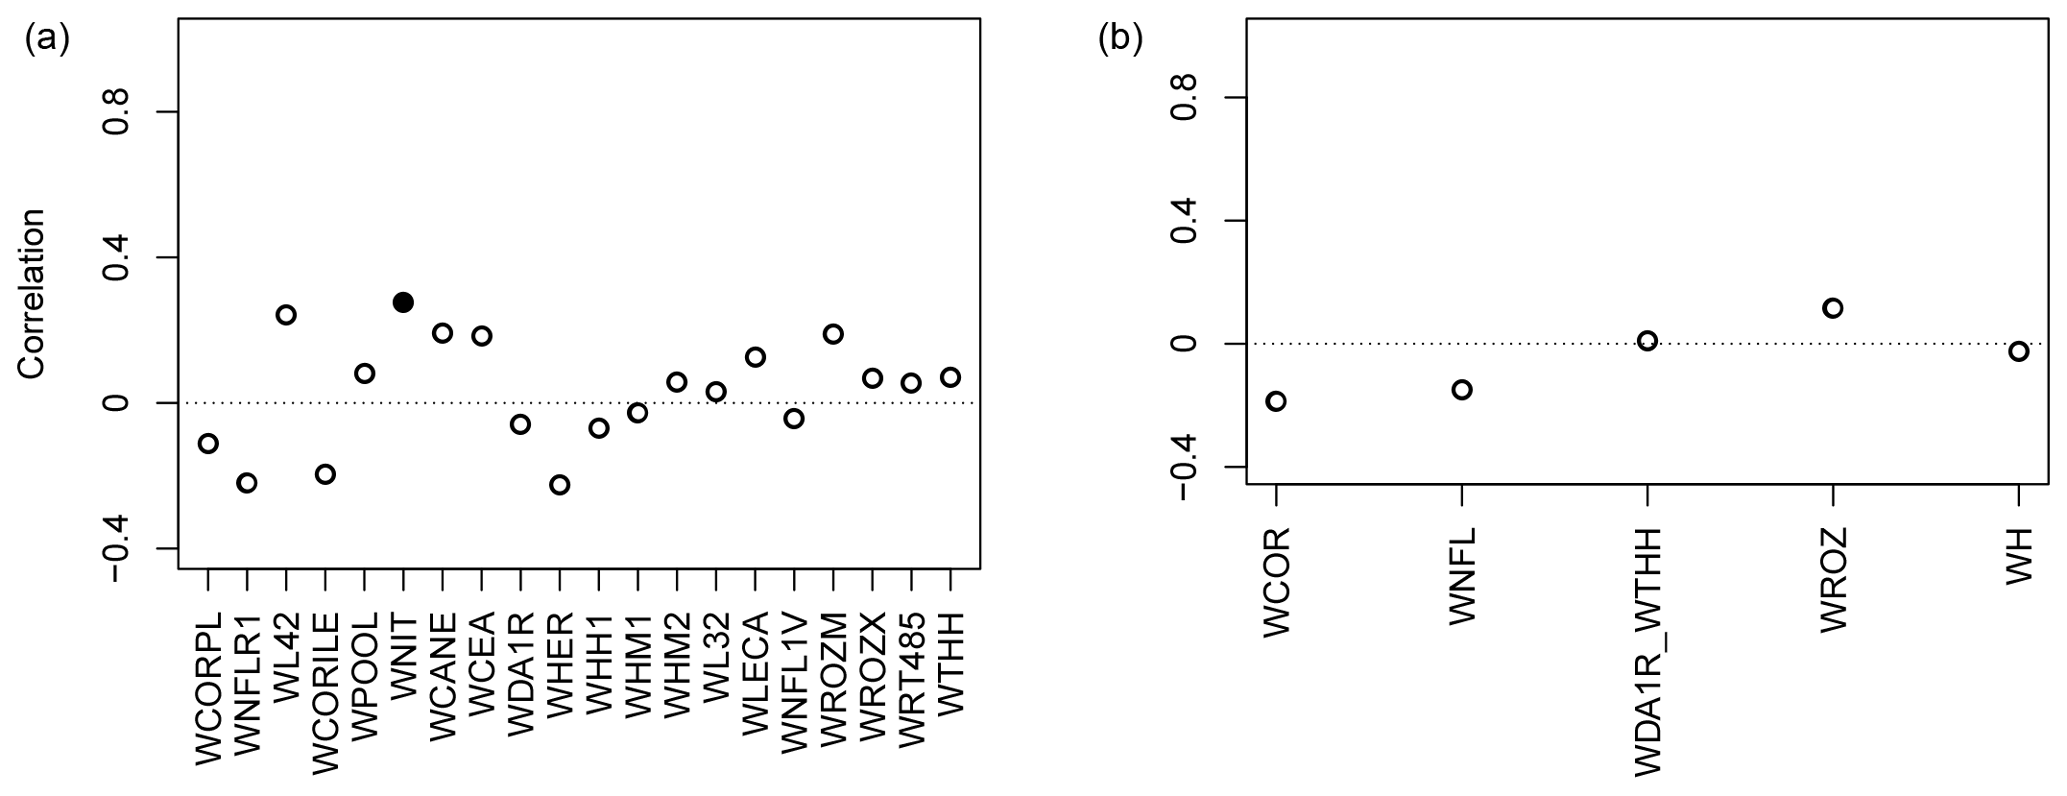
Figure 3Pearson correlation coefficients between tree-growth observations and simulations at the Eastern Canadian taiga sites (Fig. 1) with MAIDEN using NRCAN (5 arcmin) as climatic inputs (Table 2) for the 1950–2000 period with QC_taiga calibrated parameters from Gennaretti et al. (2017). Individual (a) and aggregated sites (b). White inner circles stand for non-significant correlations (p value > 0.05). Plain circles stand for significant correlations (p value < 0.05).
3.2 Site-specific calibration of the MAIDEN parameters and sensitivity to the quality of climatic inputs
A second option is to calibrate each of the 21 Eastern Canadian taiga sites as well as the 5 aggregated Eastern Canadian taiga sites (Fig. 1) using the calibration procedure detailed in Sect. 2.3.1. Correlations between tree-growth observations and simulations with MAIDEN for the 1950–2000 calibration period at the Eastern Canadian taiga sites are good and significant for all the climatic datasets (Fig. 4a). Correlations are in general slightly higher for the higher-resolution datasets (NRCAN (5 arcmin) and GMF (1∘) datasets, with an average correlation of 0.62 and 0.65, respectively, compared with 0.57 for 20CRv2c (2∘) and 0.61 for 20CRv2c corr. (2∘)). At the aggregated sites (Fig. 5a), correlations for each dataset increase a little bit compared to the average of individual correlations, but the general picture is the same. The bias correction (20CRv2c corr. (2∘)) can slightly improve correlations for the 20CRv2c (2∘) climatic dataset in some cases (e.g. WL42 and WROZM). Consequently, those results do not indicate that using higher-resolution datasets effectively increase correlations. This is likely due to the calibration procedure that might be able to compensate for specific biases in each climatic dataset. This implies large variations of calibrated parameters between experiments (Figs. S60 and S61), questioning the robustness of the selected values. The calibration method can also compensate potential biases of tree-ring observations and of sampling procedures, which have important impacts on long-term decadal trends (e.g. biases due to disturbance origin and tree selection criteria) (Johnson and Abrams, 2009; Gennaretti et al., 2014a; Duchesne et al., 2019).
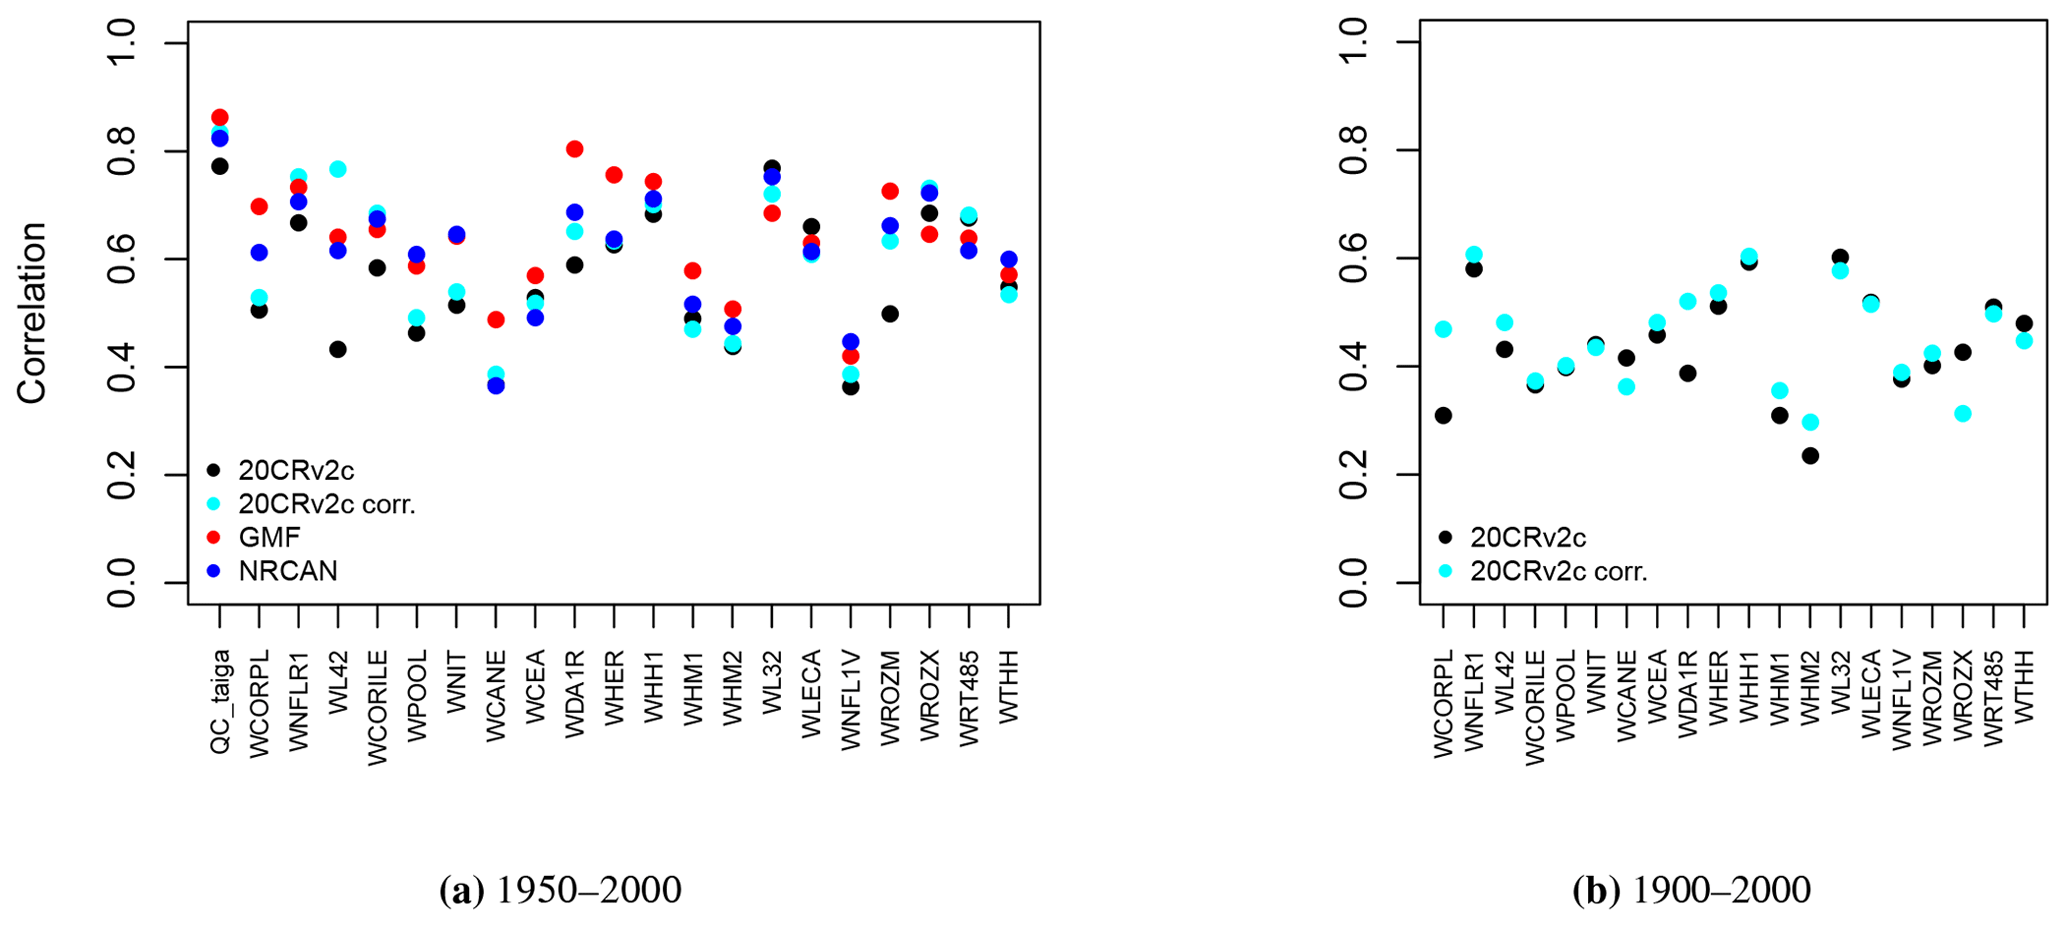
Figure 4Pearson correlation coefficients between tree-growth observations and simulations at the Eastern Canadian taiga sites (Fig. 1a) with MAIDEN using the different climatic datasets described in Table 2 as inputs for the 1950–2000 (a) and 1900–2000 (b) calibration periods. White inner circles stand for non-significant correlations (p value > 0.05). Here, all circles are plain because correlations are all significant.
Many potential biases of tree-ring observations due to the specific physiology of selected trees – that may not be representative of forest processes – and the chronology building process exist that may dampen the comparison with what MAIDEN simulates, i.e. forest carbon accumulation and not forest demographic processes (Johnson and Abrams, 2009; Duchesne et al., 2019). Ideally, considering those biases, we should find a better way to transform tree-ring data in time series with meaningful units to improve model–data comparisons. For example, Gennaretti et al. (2018) compute a wood biomass production index, which is closer to what MAIDEN simulates. This implies that we have access to both tree-ring width and density measurements.
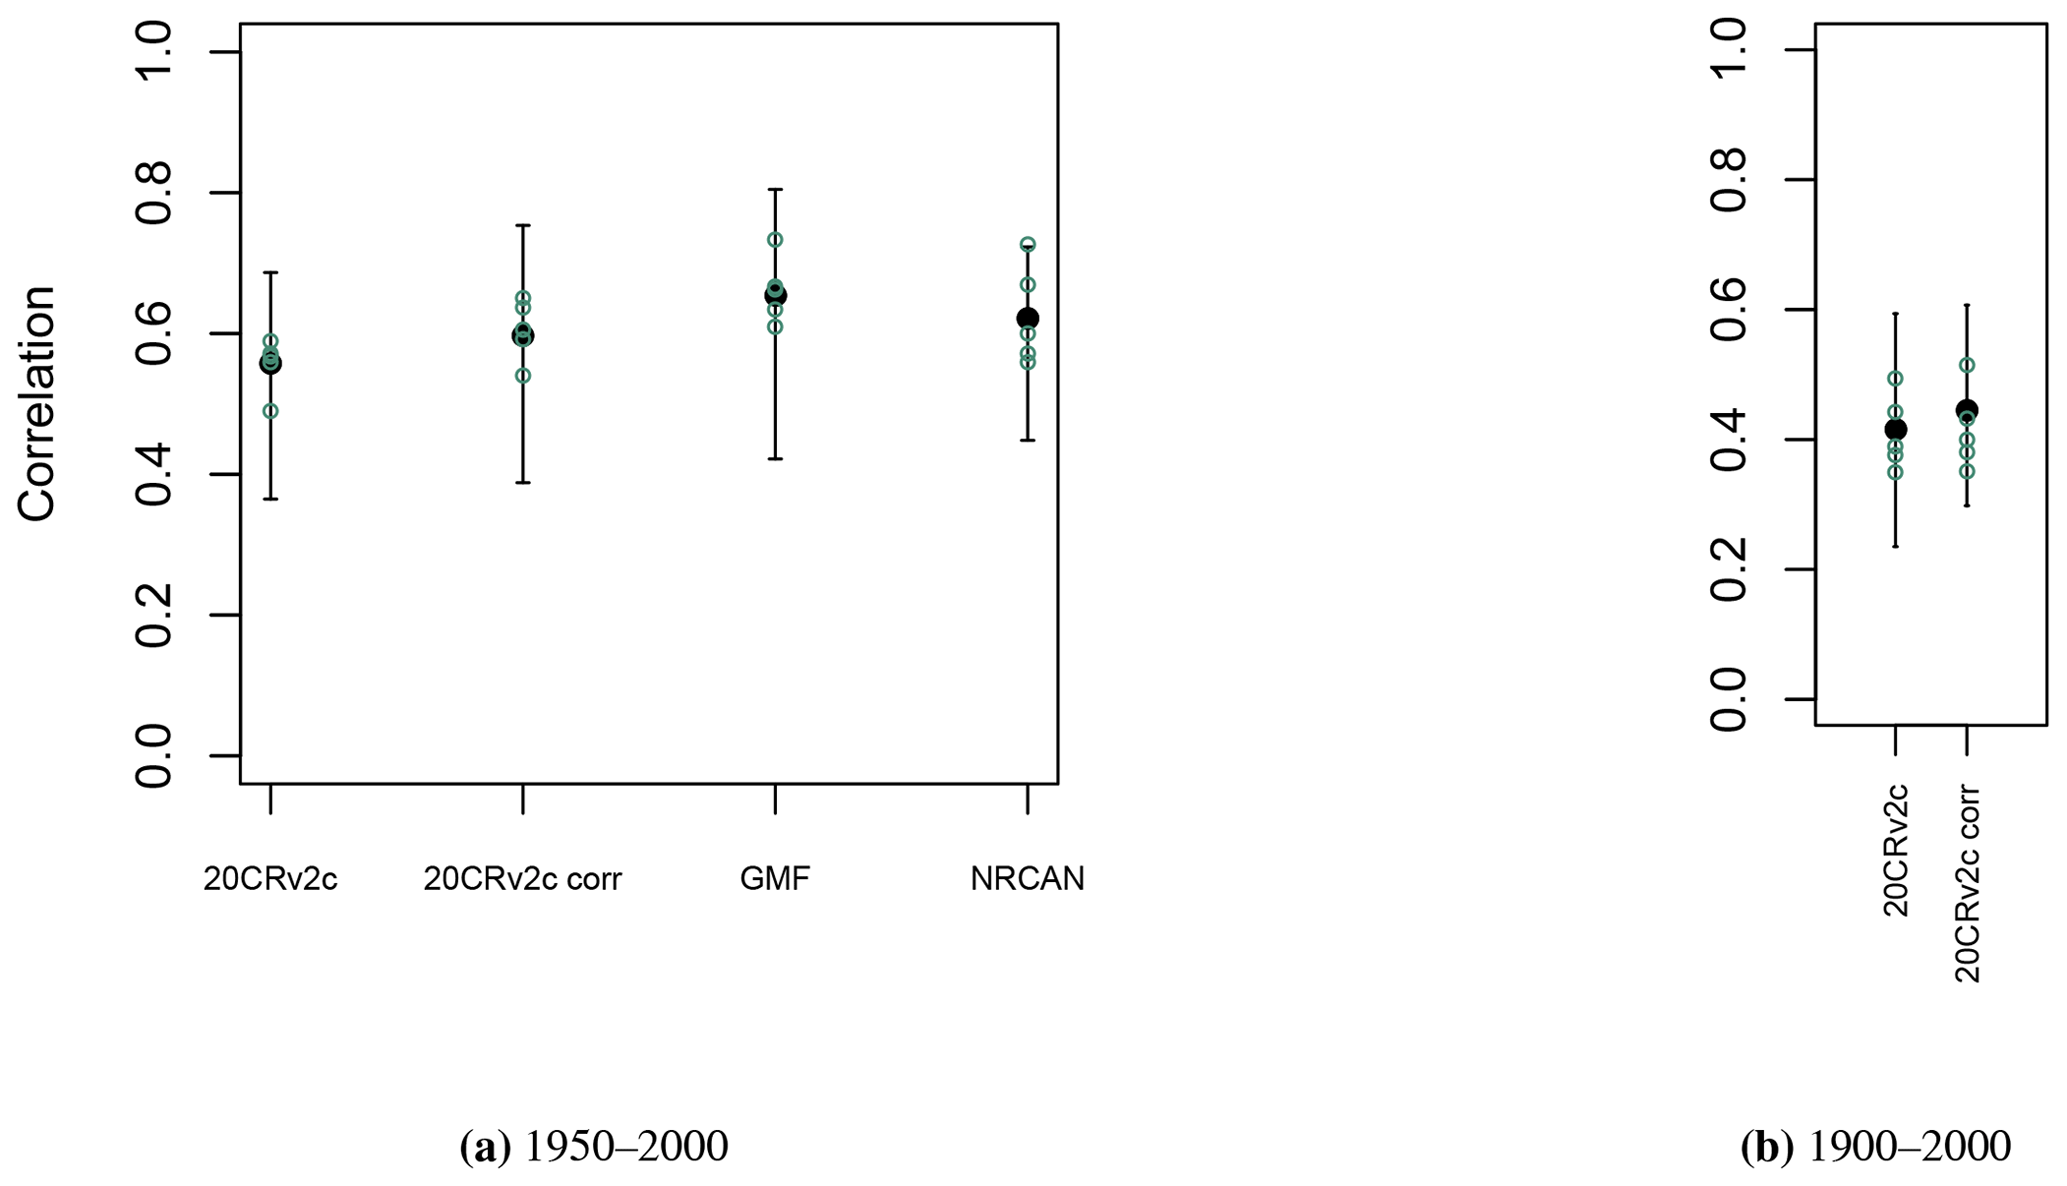
Figure 5Pearson correlation coefficients (aggregated Eastern Canadian taiga sites (Fig. 1b), green circles), and mean and range of correlations (individual Eastern Canadian taiga sites used in aggregation (Fig. 1a and b), in black) between tree-growth observations and simulations with MAIDEN using the different climatic datasets described in Table 2 as inputs for the 1950–2000 (a) and 1900–2000 (b) calibration periods.
Pearson correlation coefficients between TRW observations and tree-growth index simulations by MAIDEN for the 1900–2000 calibration period (Fig. 4b) are in most cases lower than those of the 1950–2000 calibration period. The bias correction can slightly improve correlations in some cases, but the latter stay smaller. At the aggregated sites (Fig. 5b), correlations for each dataset decrease slightly compared to the mean of individual correlations. The low correlation for the whole 20th century can be explained by the large uncertainty of the 20CRv2c (2∘) climatic dataset before 1950 there, as measured by the large spread of the 20CRv2c ensemble spread at that time (Fig. S62).
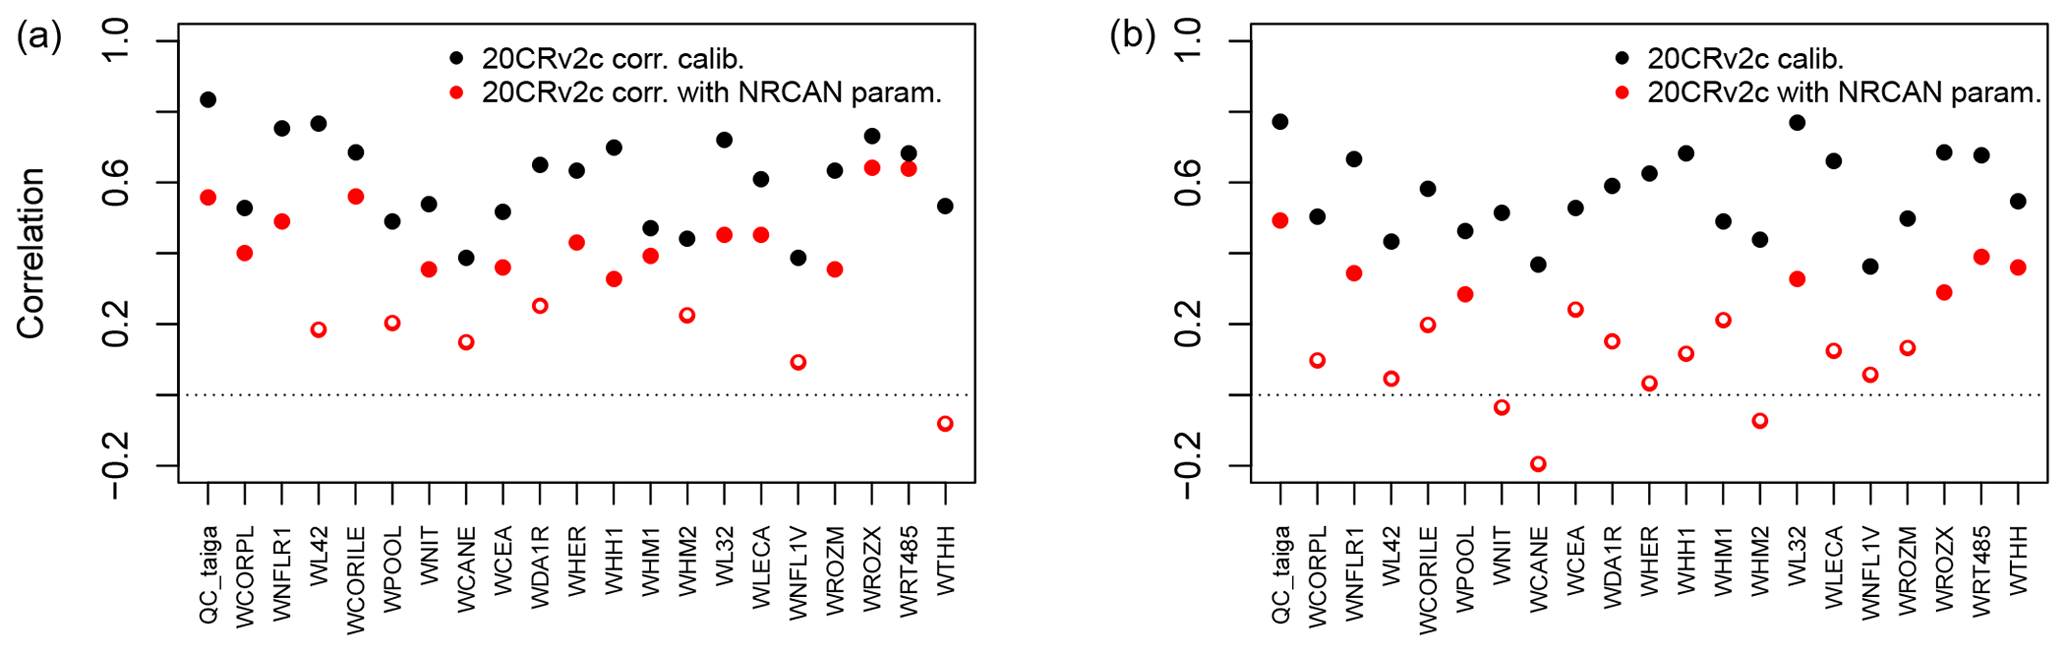
Figure 6Pearson correlation coefficients between tree-growth observations and simulations at the Eastern Canadian taiga sites (Fig. 1a) with MAIDEN using the 20CRv2c corr. (2∘) (a) or 20CRv2c (2∘) (b) climatic dataset for the 1950–2000 period with parameters calibrated using NRCAN (5 arcmin) (with NRCAN param.) climatic inputs and with parameters calibrated using 20CRv2c corr. (2∘) (a) or 20CRv2c (2∘) (b) (calib.) climatic inputs (Table 2). White inner circles stand for non-significant correlations (p value > 0.05).
When applying the parameters calibrated using the highest resolution dataset, NRCAN (5 arcmin), as climatic inputs to the Eastern Canadian taiga sites driven by the 20CRv2c (2∘) dataset (Fig. 6b, in red), correlations are on average much lower. Mean correlation is 0.17 in that case compared to 0.57 when the parameters are calibrated using 20CRv2c (2∘) as climatic inputs. With the 20CRv2c corr. (2∘) dataset as climatic inputs – i.e. the low-resolution dataset corrected for bias in the mean seasonal cycle – (Fig. 6a, in red) we see that the performance of the MAIDEN model when applying NRCAN (5 arcmin) parameters is less good compared to the case when the parameters are calibrated using 20CRv2c corr. (2∘) as climatic inputs (in black). Nevertheless, correlations are far better than with 20CRv2c (2∘) (Fig. 6b, in red). Indeed, the mean correlation is 0.36 when applying NRCAN (5 arcmin) parameters and 0.61 when applying 20CRv2c corr. (2∘) parameters. Consequently, the bias correction of the 20CRv2c (2∘) increases the robustness of the calibration of the MAIDEN parameters. Additionally, this shows that the MAIDEN model parameter calibration is highly sensitive to the quality of the climatic dataset used as inputs.
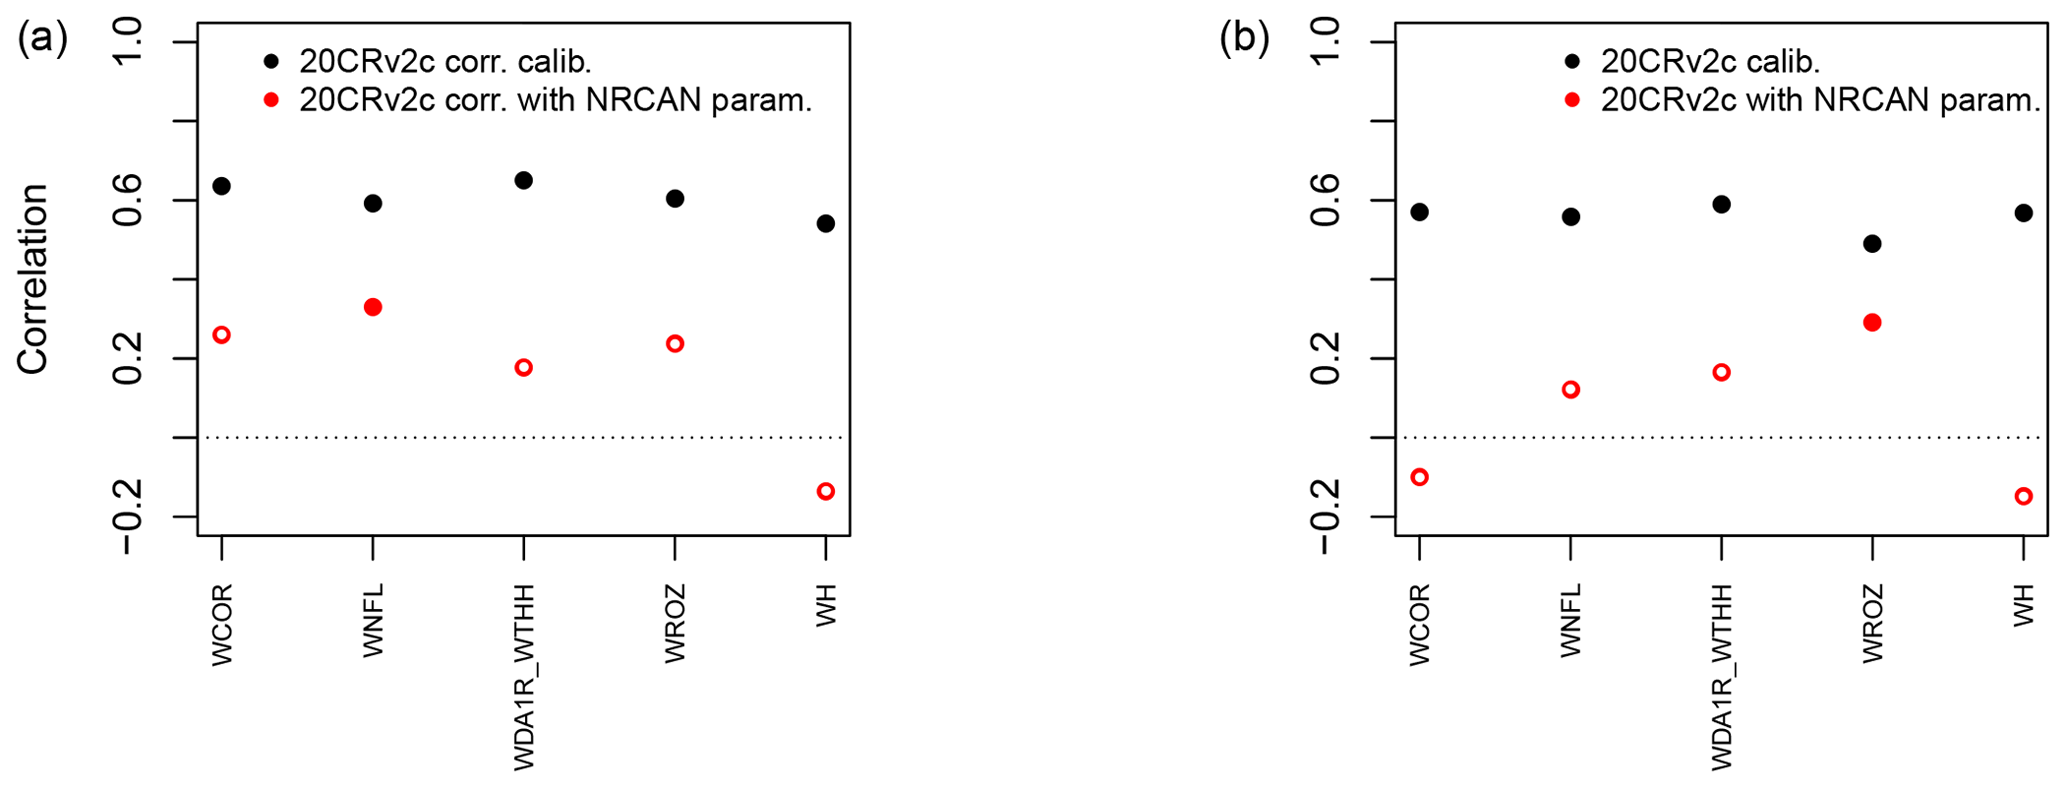
Figure 7Pearson correlation coefficients between tree-growth observations and simulations at the aggregated Eastern Canadian taiga sites (Fig. 1b) with MAIDEN using the 20CRv2c corr. (2∘) (a) or 20CRv2c (2∘) (b) climatic dataset for the 1950–2000 period with parameters calibrated using NRCAN (5 arcmin) (with NRCAN param.) climatic inputs and with parameters calibrated using 20CRv2c corr. (2∘) (a) or 20CRv2c (2∘) (b) (calib.) climatic inputs (Table 2). White inner circles stand for non-significant correlations (p value > 0.05).
At the aggregated sites (Fig. 7), the general picture is the same but with far lower correlations. The mean correlations are 0.07 when applying the parameters calibrated using NRCAN (5 arcmin) to the aggregated sites driven by 20CRv2c (2∘) dataset and 0.56 when the parameters are calibrated using 20CRv2c (2∘). With the 20CRv2c corr. (2∘) dataset as climatic inputs, mean correlations are respectively 0.18 and 0.61 with NRCAN (5 arcmin) and 20CRv2c corr. (2∘) parameters. Those results would require a case-by-case analysis as it seems that higher replication does not provide better performance in this specific experiment.
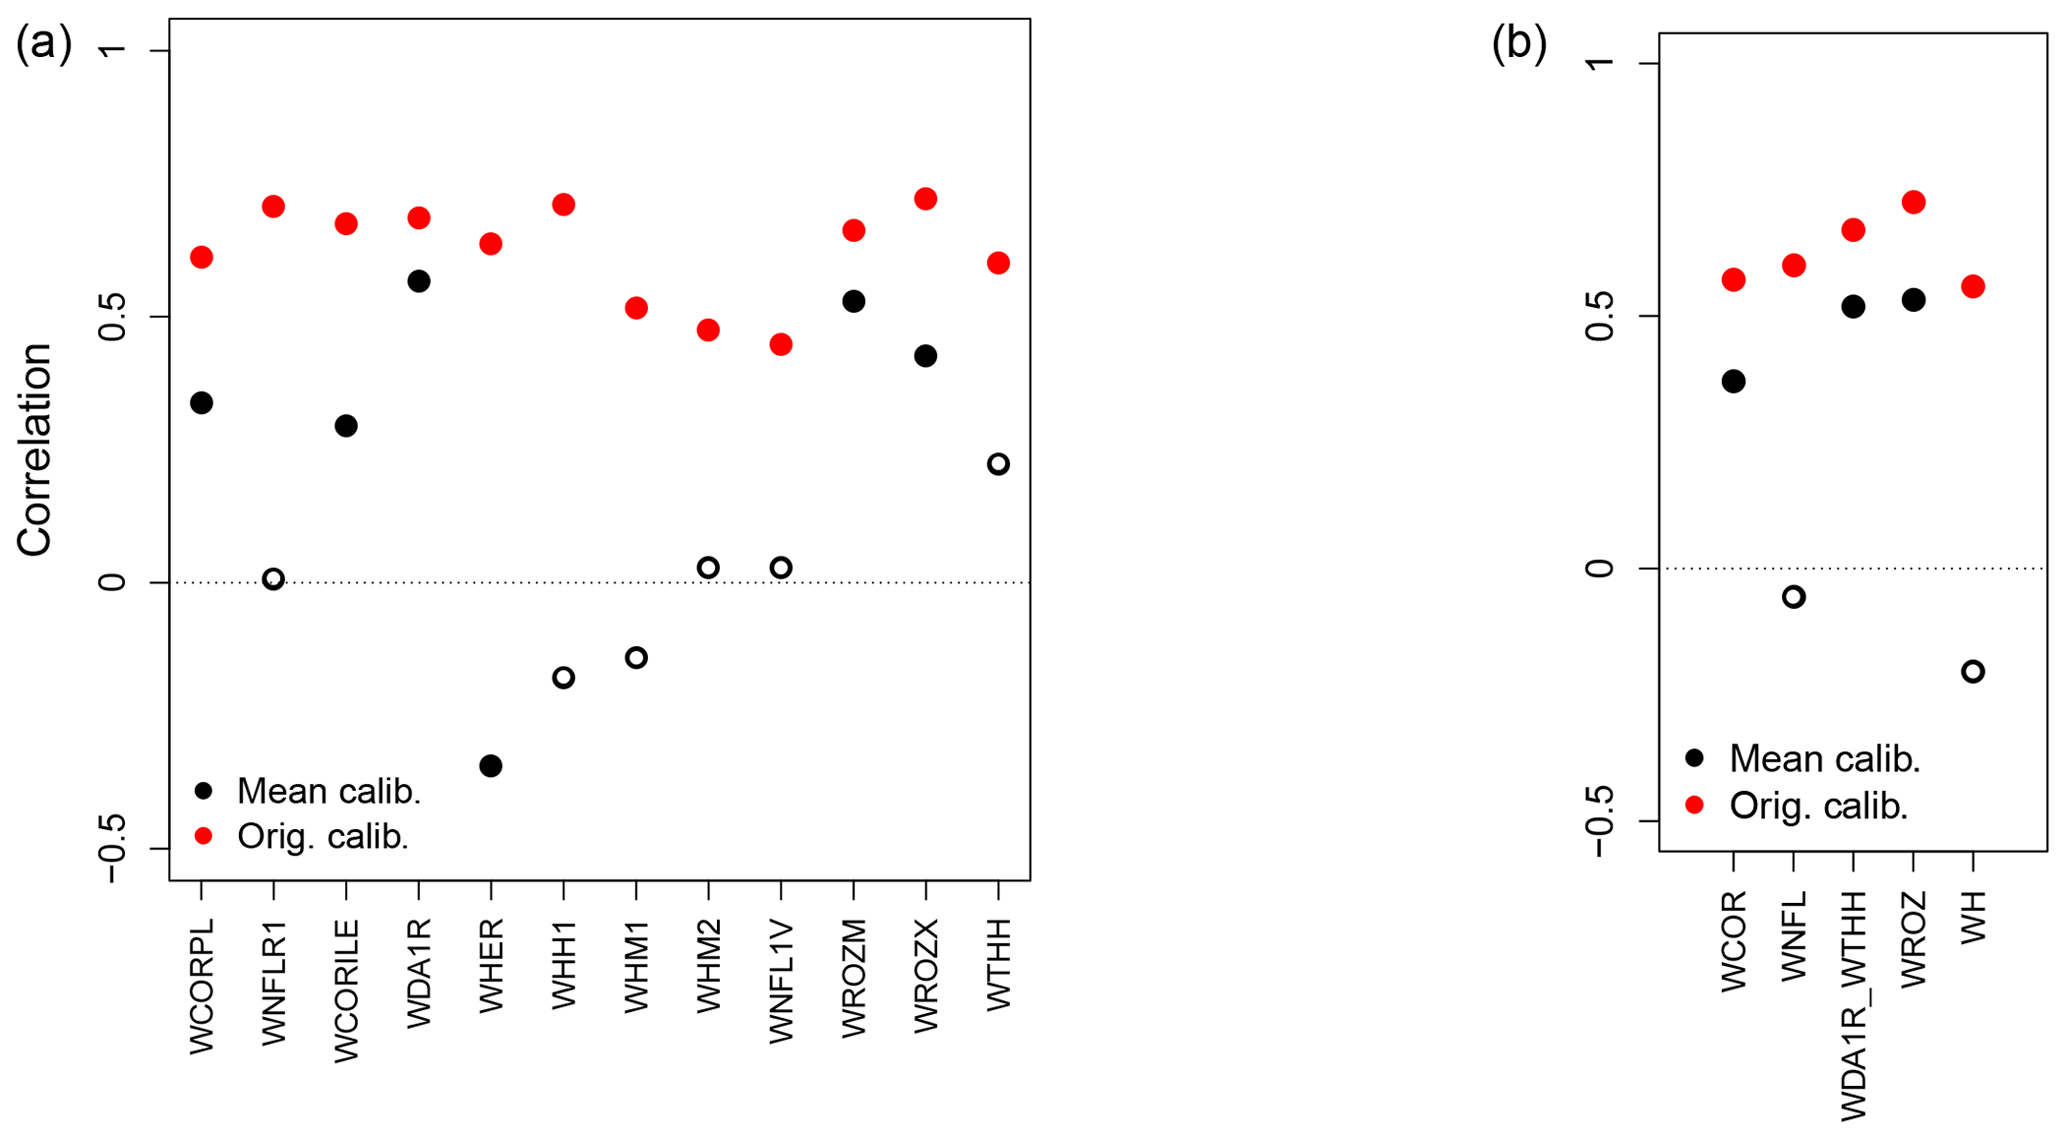
Figure 8Pearson correlation coefficients between tree-growth observations and simulations at the individual (a) and aggregated Eastern Canadian taiga sites (b) (Fig. 1a and b) with MAIDEN using the NRCAN (5 arcmin) climatic dataset (Table 2) with site-specific calibration of the parameters (Orig. calib., in red) and with parameters calibrated based on the mean of the observed TRW time series (Mean calib.) for the 1950–2000 period. White inner circles stand for non-significant correlations (p value > 0.05).
Table 4Pearson correlation coefficients between tree-growth observations and simulations at the European sites (Fig. 2) with MAIDEN and VS-Lite using GHCN as climatic inputs (Table 2) for the 1950–1974 and 1975–2000 and for the 1910–1949 (EALP, SWIT179) or 1909–1944 (FINL045) and 1950–2000 calibration and validation periods and vice versa.
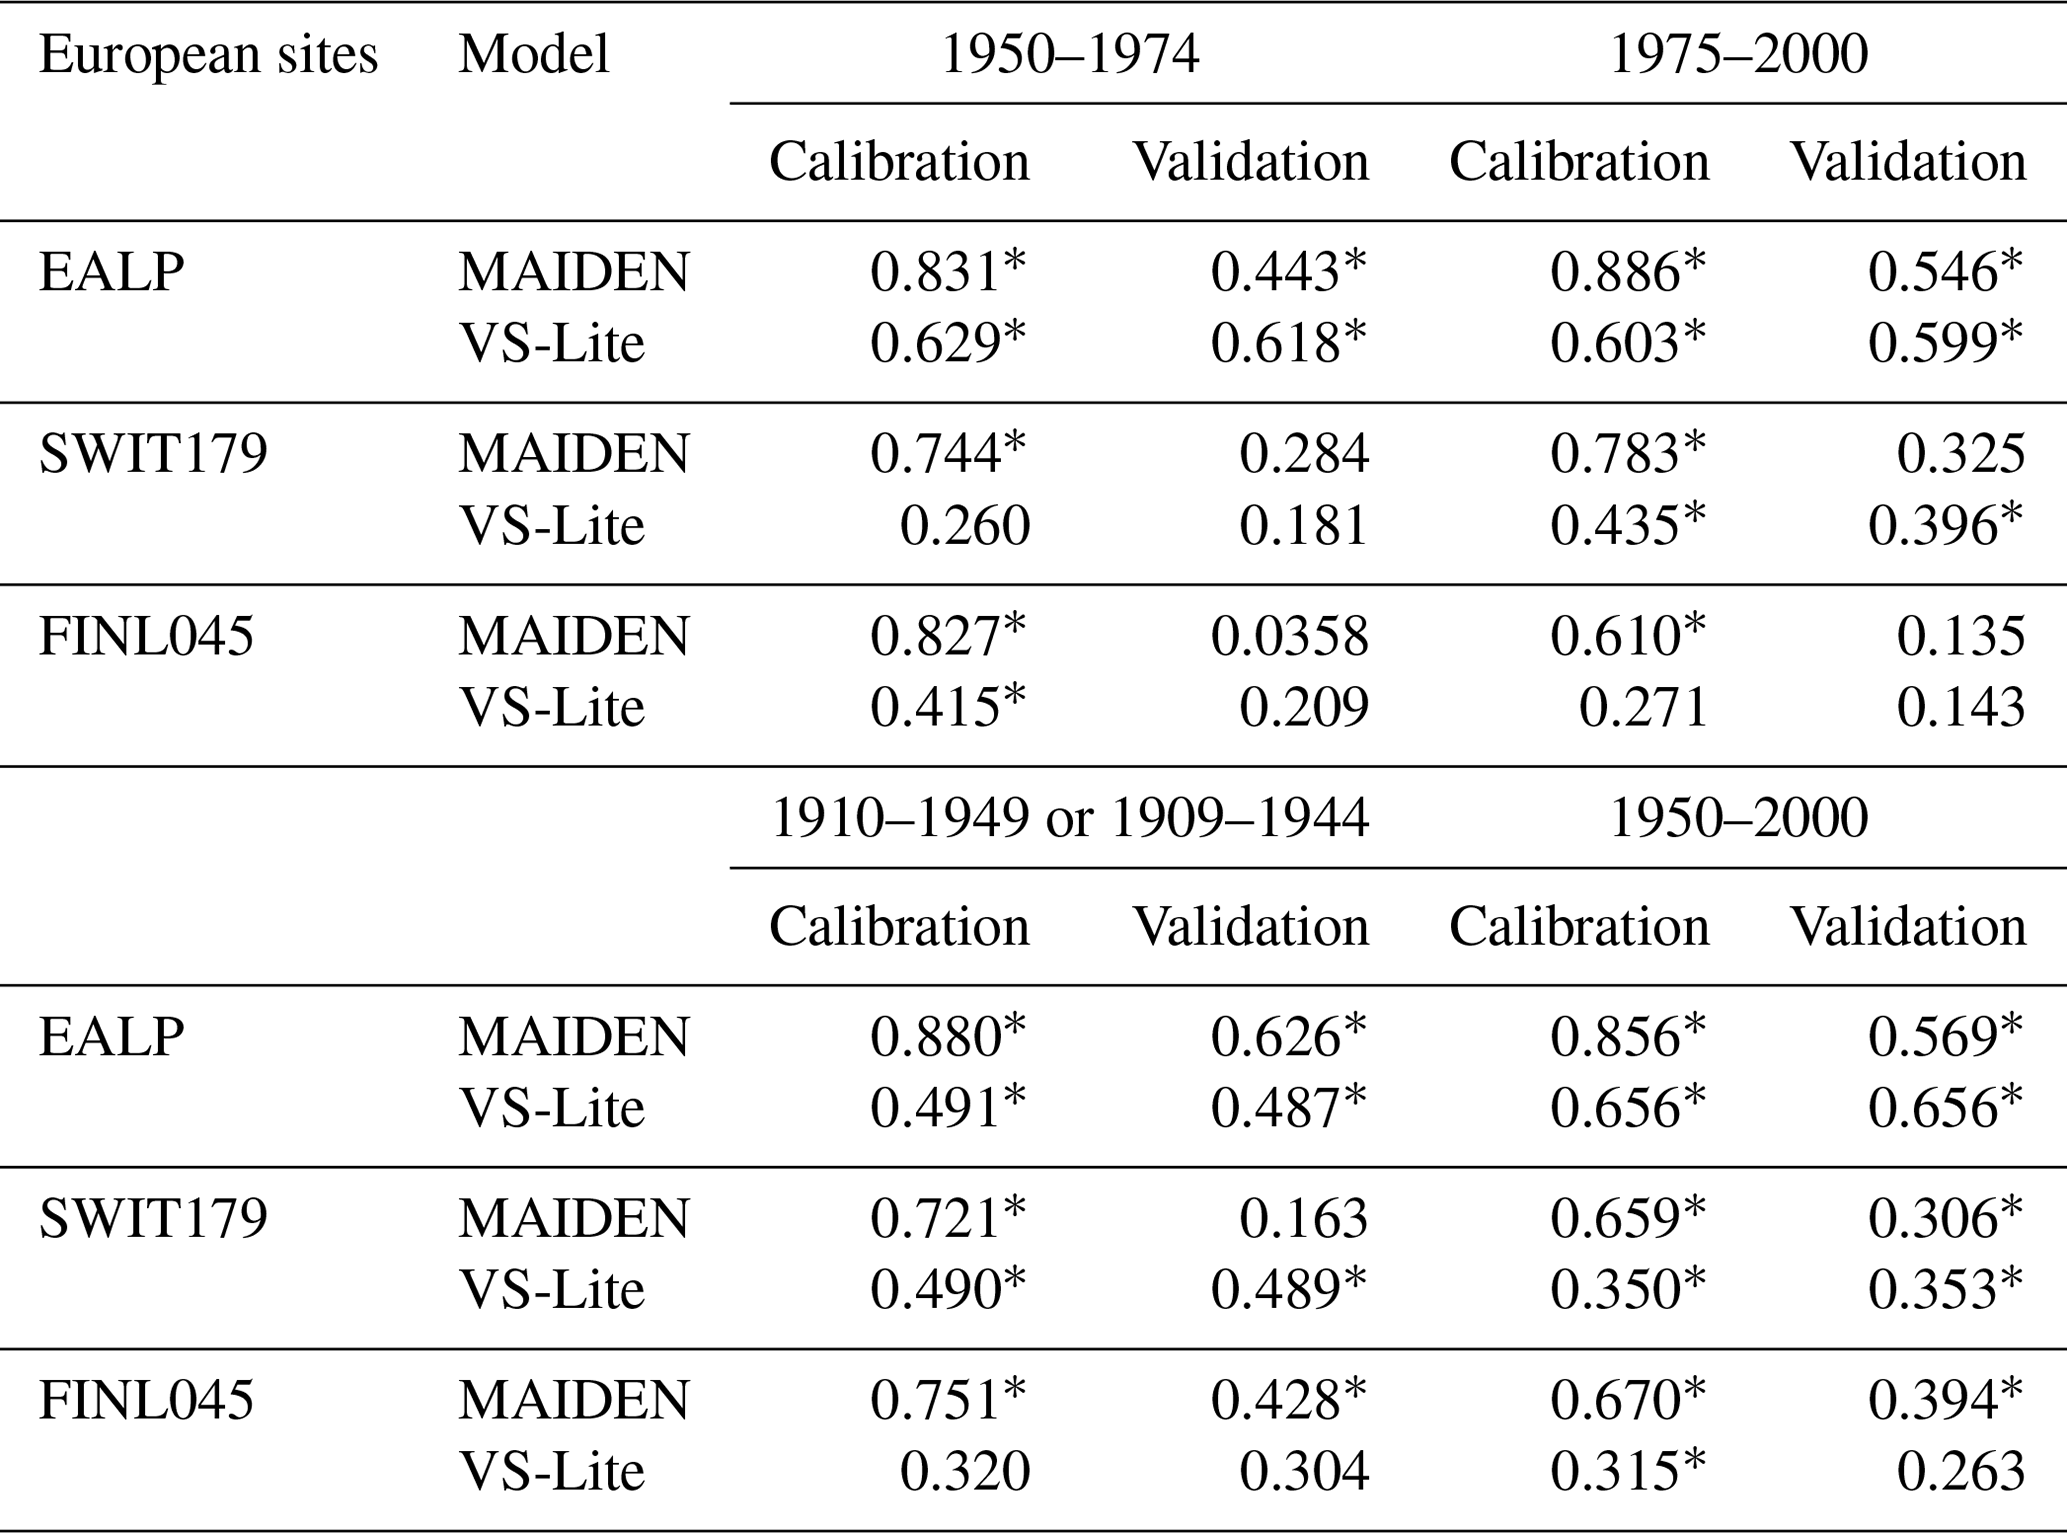
Asterisks stand for significant correlations (p value < 0.05).
Table 5Pearson correlation coefficients between tree-growth observations and simulations at the aggregated Eastern Canadian sites (Fig. 1b) with MAIDEN using NRCAN (5 arcmin) as climatic inputs (Table 2) for the respectively 1950–1974 and 1975–2000 calibration and validation periods and vice versa.
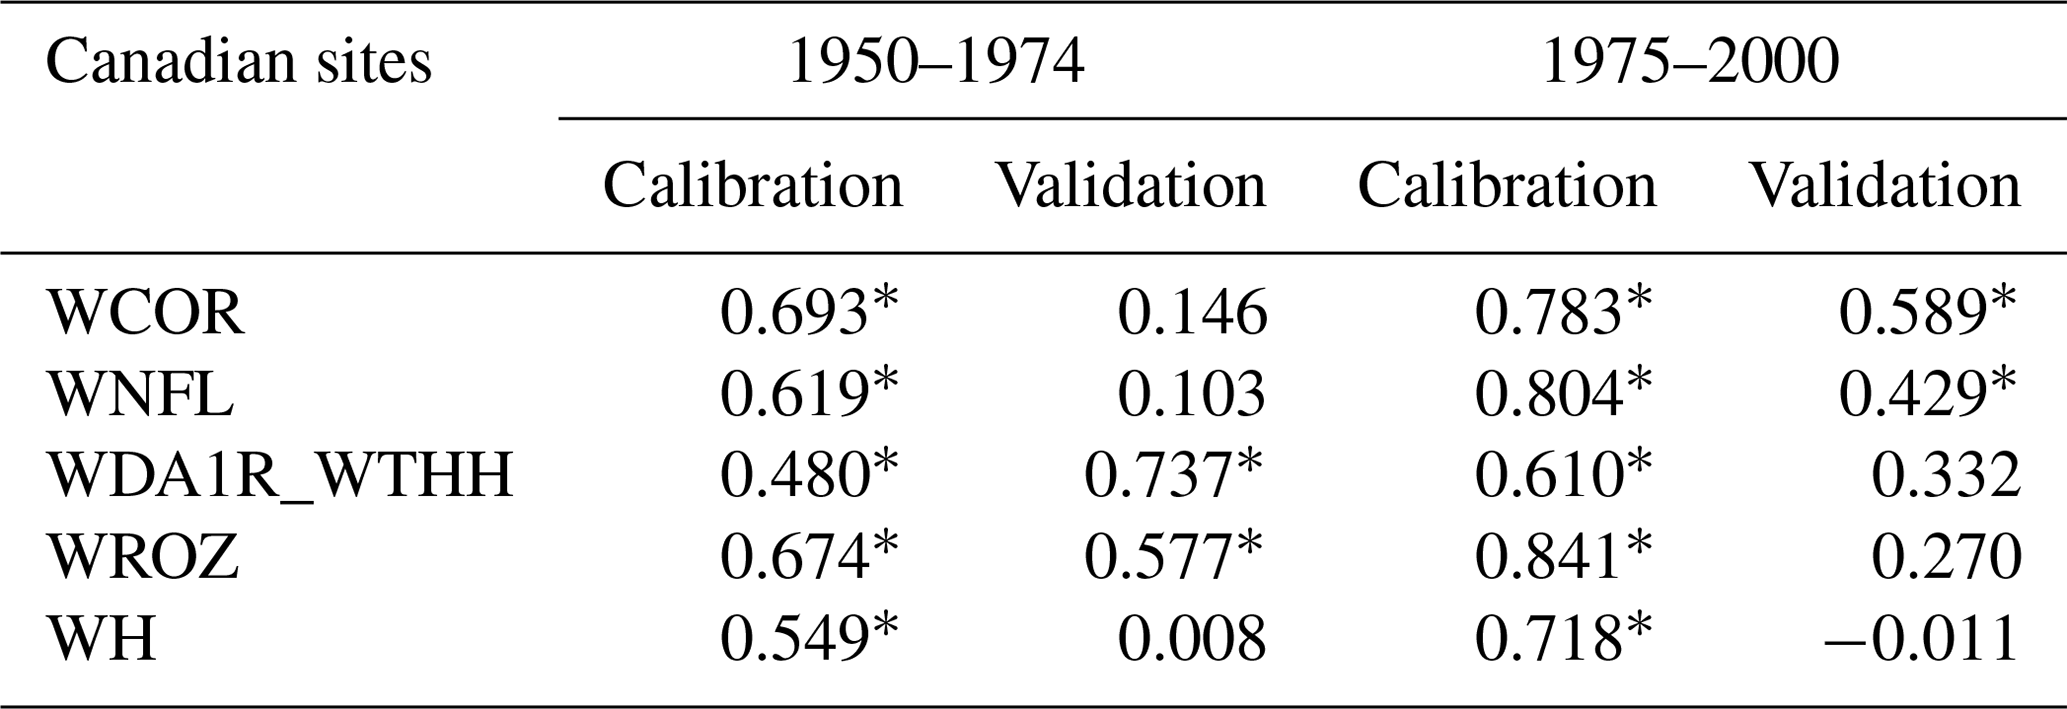
Asterisks stand for significant correlations (p value < 0.05).
3.3 Regional calibration of MAIDEN
At last, we apply the parameters calibrated against the mean of TRW observations from the 20 Eastern Canadian taiga sites (Fig. 8) to the five aggregated sites (Fig. 8b) and to the individual sites used in the aggregation procedure (Fig. 8a). For this experiment, we use the NRCAN (5 arcmin) climate data (Sect. 2.2.2, Table 2) averaged over individual sites for each aggregated site (Table 1). The main parameters linked to site conditions and control parameters (Table S1) are fixed to their mode (soil parameters), mean (site latitude, elevation and isohyet, station elevation and isohyet) or common value (exp_site, slope and aspect parameters). Overall, correlations between TRW observations and simulations by MAIDEN with parameters calibrated based on the mean of the observed TRW time series are low and non-significant for the individual sites (Fig. 8a). At the more replicated aggregated sites (Fig. 8b), correlations between TRW observations and simulations get better with three significant correlations out of five sites. However, this result should be viewed in parallel with the individual correlations (Fig. 8a) and sites implied in the aggregation (Table 1). Indeed, aggregated sites with higher correlations are made up of individual sites with higher correlations as well. It means that probably not only higher replication is at the origin of higher correlations for most aggregated sites but also the specific conditions at each individual site, as well as site ecological history, as previously mentioned (Sect. 3.1).
3.4 Split-sample validation of MAIDEN calibration
Depending on the available years, we have selected different time periods at the European sites (Table 4) and at the aggregated Eastern Canadian taiga sites (Table 5), using each period once for the calibration and once for the validation. At the European sites, 25 years is clearly a period of time that is too short to get robust results, while the validation is generally successful for the longer period as indicated by the significant correlations – except in one case – (Table 4). Similarly, at the aggregated Eastern Canadian sites – where we only have 50 years of reliable climate data (see Sect. 3.2) – a 25-year subperiod is not enough for a robust calibration and validation (Table 5). However, even on the long time period (Table 4), we can see a clue of some overfitting, especially at the SWIT179 site, where the correlation for the validation period is far lower compared to the correlation for the calibration period. Those results show that because of the large number of parameters, the validation of MAIDEN is difficult. It requires long observation series, but the skill of the model still decreases significantly for the validation period.
3.5 Comparison with VS-Lite
On average, over the 1950–2000 calibration period at the individual Eastern Canadian taiga sites, VS-Lite has lower correlations for the highest-resolution dataset (NRCAN) compared with MAIDEN, i.e. 0.106 and 0.62 mean correlations for VS-Lite and MAIDEN, respectively (Fig. 9). Results for the other climatic datasets over the 1950–2000 period (GMF (1∘), 20CRv2c (2∘) and 20CRv2c corr. (2∘)) and over the 1900–2000 calibration period (20CRv2c (2∘) and 20CRv2c corr. (2∘) climatic datasets) also show lower correlations compared to MAIDEN (Fig. S63). As for split-sample validation over the long time period, the performance of VS-Lite is more stable (less fall of validation from calibration correlation) compared with MAIDEN (Table 4) even if correlations are, except for SWIT179, lower than MAIDEN. Similarly, over the short time period, the performance of VS-Lite is less good than over the long time period but still more stable than MAIDEN (Table 4). Compared to VS-Lite, MAIDEN has shown lower skill over short-time-period validation, which indicates that we should only use MAIDEN when a long enough period is available for validation. As for a long validation period, MAIDEN has shown a stronger decrease in correlations compared to VS-Lite but still with higher correlations than VS-lite on average. This would indicate that the MAIDEN calibration is not always prone to overfitting.
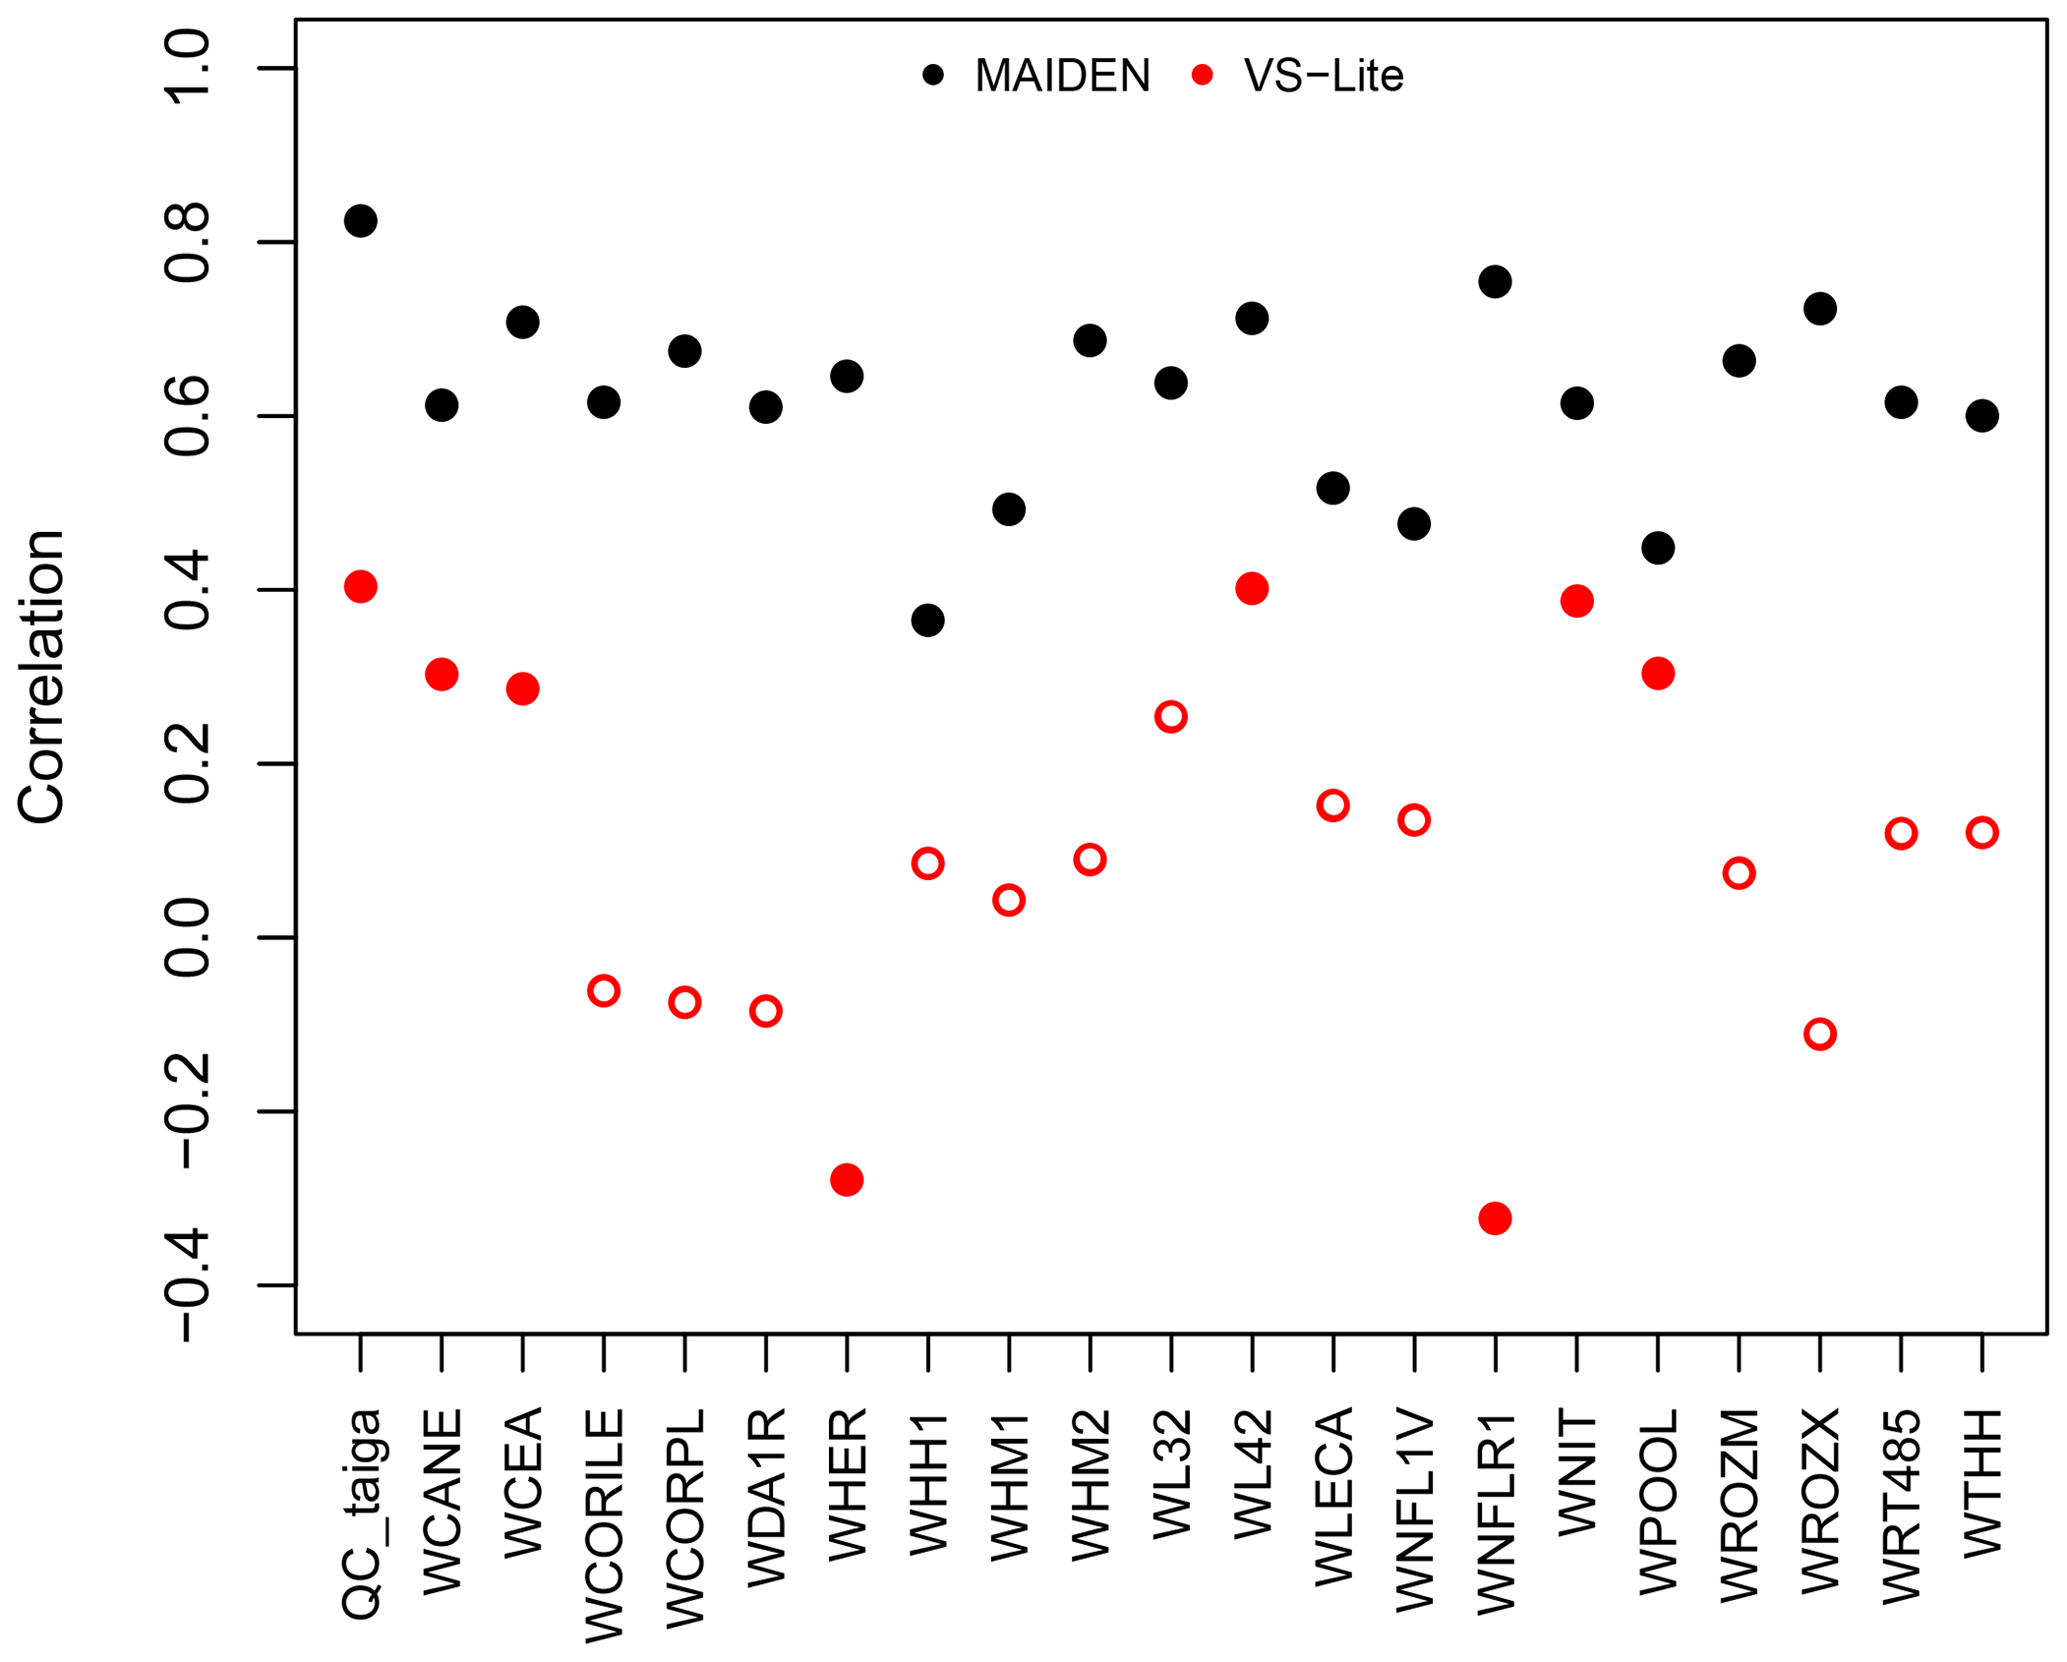
Figure 9Pearson correlation coefficients between tree-growth observations and simulations at the Eastern Canadian taiga sites (Fig. 1a) with VS-Lite (in red) and MAIDEN (in black) using NRCAN (5 arcmin) as climatic inputs (Table 2) for the 1950–2000 calibration period. White inner circles stand for non-significant correlations (p value > 0.05).
As our objective is to provide a first test of our calibration methodology using only a few sets of tree-ring sites, the obtained results only give an incomplete view of the MAIDEN model performance and its comparison with VS-Lite, focussing over a limited range of climate regimes. More experiments in different conditions are required in the future to exhaustively evaluate and compare the performance of both models.
In this paper we have tested the applicability of the ecophysiological tree-growth model MAIDEN for potential dendroclimatological applications during the 20th century at 21 Eastern Canadian taiga sites and 3 European sites using tree-ring width observations. Our results provide a protocol for the application of MAIDEN to potentially any site with tree-ring width data in the extratropical region, i.e. from climatic data selection to validation, through automatized Bayesian calibration of the most sensitive parameters. As the ultimate goal is to use MAIDEN in a context of palaeoclimatic reconstruction, forced by low-resolution climate models outputs, we also analysed the sensitivity of the model to parameter calibration and to the quality of climatic inputs. The performance of MAIDEN was compared to the one of a simple tree-growth model, VS-Lite, to evaluate the advantages of using a complex tree-growth model for past climate reconstruction.
Different strategies have been tested to select the value for the most sensitive parameters of the MAIDEN model. When applying calibrated parameters from a well-documented site at other sites with the same species and similar environmental conditions, very low correlations between tree-ring width observations and simulations by the MAIDEN model are found. However, when removing the long-term trend to account for the past disturbance history of these sites that is not represented in MAIDEN, correlations get higher. In the future, this strategy can be used by selecting sites carefully to avoid disturbances. At our study sites, the Bayesian calibration of the most sensitive parameters of the model can provide good and significant correlations between tree-growth observations and simulations.
Secondly, sensitivity of the MAIDEN model parameter calibration to the quality of the climatic data used as inputs has been highlighted. In a context of palaeoclimatic applications, where MAIDEN will be driven by climate model outputs at low resolution, bias-correction and downscaling techniques could be good options to improve climate inputs and calibration quality, thereby leading to reasonable correlations with observed tree-ring width.
Our split-sample validation experiments are encouraging. However, when a calibration interval of only a few decades is available, the calibration displays large overfitting for individual sites as indicated by the very low correlation with observations over the validation period. Similar split-sample experiments on longer series show much better results, with potentially some overfitting but still with relatively high and generally significant correlations over the validation period. When working with a network of similar sites, the alternative validation technique, i.e. applying calibrated parameters from the mean of a network of tree-ring width observation series with the same species and environmental conditions to the individual sites, should be preferred if not enough data (climate and TRW observations) are available for split-sample validation.
Lastly, at our study sites, MAIDEN has shown higher calibration and validation correlations in most cases compared to VS-Lite. VS-Lite correlations over the calibration period are especially far lower for sites with low replication (i.e. the Eastern Canadian taiga sites from Nicault et al., 2014, and Boucher et al., 2017). However, VS-Lite stays more stable over both calibration and validation periods. Consequently, VS-Lite has a lower ability to reproduce tree growth at our sites but is less prone to overfitting than MAIDEN. Most importantly, we have shown that to limit overfitting, MAIDEN should not be used with short and low-replicated tree-ring width observation time series. VS-Lite is less risky to use in such situations as there is potentially less overfitting in the calibration and probably easier to apply over a large network of tree-ring width time series. However, VS-Lite does not include CO2 nor biological processes and may thus not be able to take into account changes in conditions between the recent calibration period and the more distant past.
In the future, MAIDEN will be applied at a larger spatial scale in a systematic way, using the protocol that has been developed here, by selecting hundreds of sites from the commonly used databases in palaeoclimate reconstruction based on tree-ring proxies, covering a wide range of environmental conditions and tree species, such as PAGES 2k (PAGES 2k Consortium, 2017) and NTREND (Wilson et al., 2016; Anchukaitis et al., 2017). This broader analysis will allow us to refine the protocol developed here in order to identify the sites where MAIDEN can be successfully applied and estimate the uncertainty associated with the use of MAIDEN for many more different sites.
Although some limitations could remain in our calibration protocol, we have shown the ability of MAIDEN to simulate tree-growth index time series that can fit robustly tree-ring width observations under certain conditions (well-replicated tree-ring width observation time series, high-resolution or downscaled climate data, long time period), as well as its potential to be used as a complex mechanistic proxy system model in palaeoclimatic applications and more specifically in data assimilation.
The structure of MAIDEN (Misson, 2004; Gea-Izquierdo et al., 2015; Gennaretti et al., 2017) is provided online (https://figshare.com/articles/MAIDEN_ecophysiological_forest_model/5446435/1, last access: 17 November 2019; Gennaretti, 2017) and its modules are available upon request. The VS-Lite model code is available at the National Oceanic and Atmospheric Administration's Paleoclimatology World Data Center (https://www.ncdc.noaa.gov/paleo-search/reports/all?dataTypeId=59&search=true, last access: 3 October 2018). The Eastern Canadian taiga tree-ring width data from Nicault et al. (2014) and Boucher et al. (2017) can be downloaded from http://dendro-qc-lab.ca/trw.html (last access: 30 March 2019). The European chronologies are also available online: the EALP tree-ring width data (Büntgen et al., 2011) can be accessed through the PAGES 2k database (https://doi.org/10.1038/sdata.2017.88, PAGES 2k Consortium, 2017); unprocessed SWIT179 tree-ring width data are archived at the International Tree Ring Data Bank (https://www.ncdc.noaa.gov/data-access/paleoclimatology-data, last access: 12 January 2019); the FINL045 tree-ring width data are available in the supplementary materials of Babst et al. (2013). The Global Meteorological Forcing Dataset for land surface modeling (v1) (Sheffield et al., 2006) can be downloaded from http://hydrology.princeton.edu/data.php (last access: 4 January 2019). The NOAA-CIRES 20th Century Reanalysis V2c can be downloaded from https://psl.noaa.gov/data/gridded/data.20thC_ReanV2c.monolevel.html (last access: 4 January 2019). The gridded interpolated Canadian database of daily minimum–maximum temperature and precipitation (Hutchinson et al., 2009) are available upon request. The Global Historical Climate Network daily station data (Menne et al., 2012a, b) are available online (https://www.ncdc.noaa.gov/ghcnd-data-access, last access: 10 January 2019). Annual atmospheric CO2 concentration data from Sato and Schmidt can be downloaded from https://data.giss.nasa.gov/modelforce/ghgases/ (last access: 3 December 2018). All results from this paper are available upon request.
The supplement related to this article is available online at: https://doi.org/10.5194/cp-16-1043-2020-supplement.
This study is part of JR's thesis under the supervision of HG and JG. JR, HG and JG designed the study. JR performed the analysis, wrote the paper and made the figures. FG provided scripts and expertise that have made the work with MAIDEN possible. EB and FG provided the Eastern Canadian taiga tree-ring width data. HG and JG supervised the statistical analyses. FG and EB provided advice and expertise on the preparation and interpretation of the Eastern Canadian taiga sites experiments. FA and MJ contributed to the calibration of the MAIDEN model by sharing their codes and expertise. All authors have contributed to the improvement of the paper.
The authors declare that there is no conflict of interest.
Jeanne Rezsöhazy is F.R.S–FNRS research fellow, Belgium (grant no. 1.A841.18); Hugues Goosse is research director at F.R.S.–FNRS, Belgium; Joël Guiot is research director at CNRS, France. Fabio Gennaretti was funded by the “Ministère des Forêts, de la Faune et des Parcs” of Quebec (grant no. 142332177-D). The constitution of the network of black spruce sites used in this study was funded by National Sciences and Engineering Research council of Canada (NSERC). Computational resources have been provided by the supercomputing facilities of the Université catholique de Louvain (CISM/UCL) and the Consortium des Équipements de Calcul Intensif en Fédération Wallonie Bruxelles (CÉCI) funded by the Fond de la Recherche Scientifique de Belgique (F.R.S.–FNRS) under convention 2.5020.11 and by the Walloon Region.
This research has been supported by the Fonds De La Recherche Scientifique – FNRS (grant no. 1.A841.18). This publication has received partial funding from Laboratory of Excellence OT-Med (project ANR-11-LABEX-0061, A*MIDEX project 11-IDEX-0001-02) as well as from F.R.S-FNRS and Fonds de recherche Société et culture Québec through the ClimHuNor project (grant no. R.60.03.18.F).
This paper was edited by Hans Linderholm and reviewed by Vladimir Shishov and one anonymous referee.
Anchukaitis, K. J., Wilson, R., Briffa, K. R., Büntgen, U., Cook, E. R., D'Arrigo, R., Davi, N., Esper, J., Frank, D., Gunnarson, B. E., Hegerl, G., Helama, S., Klesse, S., Krusic, P. J., Linderholm, H. W., Myglan, V., Osborn, T. J., Zhang, P., Rydval, M., Schneider, L., Schurer, A., Wiles, G., and Zorita, E.: Last millennium Northern Hemisphere summer temperatures from tree rings: Part II, spatially resolved reconstructions, Quaternary Sci. Rev., 163, 1–22, https://doi.org/10.1016/j.quascirev.2017.02.020, 2017. a, b
Babst, F., Poulter, B., Trouet, V., Tan, K., Neuwirth, B., Wilson, R., Carrer, M., Grabner, M., Tegel, W., Levanic, T., Panayotov, M., Urbinati, C., Bouriaud, O., Ciais, P., and Frank, D.: Site- and species-specific responses of forest growth to climate across the European continent, Global Ecol. Biogeogr., 22, 706–717, https://doi.org/10.1111/geb.12023, 2013. a, b, c
Boucher, É., Guiot, J., Hatté, C., Daux, V., Danis, P.-A., and Dussouillez, P.: An inverse modeling approach for tree-ring-based climate reconstructions under changing atmospheric CO2 concentrations, Biogeosciences, 11, 3245–3258, https://doi.org/10.5194/bg-11-3245-2014, 2014. a, b, c
Boucher, E., Nicault, A., Arseneault, D., Bégin, Y., and Karami, M. P.: Decadal variations in Eastern Canada's taiga wood biomass production forced by ocean-atmosphere interactions, Sci. Rep., 7, 1–13, https://doi.org/10.1038/s41598-017-02580-9, 2017. a, b, c, d, e, f, g, h, i, j, k
Breitenmoser, P., Brönnimann, S., and Frank, D.: Forward modelling of tree-ring width and comparison with a global network of tree-ring chronologies, Clim. Past, 10, 437–449, https://doi.org/10.5194/cp-10-437-2014, 2014. a, b, c
Briffa, K. R., Schweingruber, F. H., Jones, P. D., Osborn, T. J., Harris, I. C., Shiyatov, S. G., Vaganov, E. A., and Grudd, H.: Trees tell of past climates: but are they speaking less clearly today?, Philos. T. R. Soc. Lond. B, 353, 65–73, https://doi.org/10.1098/rstb.1998.0191, 1998. a
Briffa, K. R., Osborn, T. J., Schweingruber, F. H., Harris, I. C., Jones, P. D., Shiyatov, S. G., and Vaganov, E. A.: Low-frequency temperature variations from a northern tree ring density network, J. Geophys. Res.-Atmos., 106, 2929–2941, https://doi.org/10.1029/2000JD900617, 2001. a
Büntgen, U., Tegel, W., Nicolussi, K., McCormick, M., Frank, D., Trouet, V., Kaplan, J. O., Herzig, F., Heussner, K.-U., Wanner, H., Luterbacher, J., and Esper, J.: 2500 Years of European Climate Variability and Human Susceptibility, Science, 331, 578–582, https://doi.org/10.1126/science.1197175, 2011. a, b
Buras, A.: A comment on the expressed population signal, Dendrochronologia, 44, 130–132, https://doi.org/10.1016/j.dendro.2017.03.005, 2017. a
Cook, E. R. and Kairiukstis, L.: Methods of dendrochronology: Applications in the Environmental Sciences, Kluwer Academic, Boston, https://doi.org/10.1016/0048-9697(91)90076-q, 1990. a
Cook, E. R., Meko, D. M., Stahle, D. W., and Cleaveland, M. K.: Drought reconstructions for the continental United States, J. Climate, 12, 1145–1163, https://doi.org/10.1175/1520-0442(1999)012{<}1145:drftcu{>}2.0.co;2, 1999. a
D'Arrigo, R., Wilson, R., Liepert, B., and Cherubini, P.: On the 'Divergence Problem' in Northern Forests: A review of the tree-ring evidence and possible causes, Global Planet. Change, 60, 289–305, https://doi.org/10.1016/j.gloplacha.2007.03.004, 2008. a
Dee, S. G., Steiger, N. J., Emile-Geay, J., and Hakim, G. J.: On the utility of proxy system models for estimating climate states over common era, J. Adv. Model. Earth Sy., 8, 1164–1179, https://doi.org/10.1002/2016MS000677, 2016. a, b, c
Duchesne, L., Houle, D., Ouimet, R., Caldwell, L., Gloor, M., and Brienen, R.: Large apparent growth increases in boreal forests inferred from tree-rings are an artefact of sampling biases, Sci. Rep., 9, 1–9, https://doi.org/10.1038/s41598-019-43243-1, 2019. a, b
Erni, S., Arseneault, D., Parisien, M. A., and Bégin, Y.: Spatial and temporal dimensions of fire activity in the fire-prone eastern Canadian taiga, Glob. Change Biol., 23, 1152–1166, https://doi.org/10.1111/gcb.13461, 2017. a
Esper, J., George, S. S., Anchukaitis, K., D'Arrigo, R., Ljungqvist, F., Luterbacher, J., Schneider, L., Stoffel, M., Wilson, R., and Büntgen, U.: Large-scale, millennial-length temperature reconstructions from tree-rings, Dendrochronologia, 50, 81–90, https://doi.org/10.1016/j.dendro.2018.06.001, 2018. a
Evans, M. N., Tolwinski-Ward, S. E., Thompson, D. M., and Anchukaitis, K. J.: Applications of proxy system modeling in high resolution paleoclimatology, Quaternary Sci. Rev., 76, 16–28, https://doi.org/10.1016/j.quascirev.2013.05.024, 2013. a, b
Fang, M. and Li, X.: An Artificial Neural Networks-Based Tree Ring Width Proxy System Model for Paleoclimate Data Assimilation, J. Adv. Model. Earth Sy., 11, 892–904, https://doi.org/10.1029/2018MS001525, 2019. a
FAO/IIASA/ISRIC/ISSCAS/JRC: Harmonized World Soil Database (version 1.2). FAO, Rome, Italy and IIASA, Laxenburg, Austria, 2012. a
Flato, G., Marotzke, J., Abiodun, B., Braconnot, P., Chou, S., Collins, W., Cox, P., Driouech, F., Emori, S., Eyring, V., Forest, C., Gleckler, P., Guilyardi, E., Jakob, C., Kattsov, V., Reason, C., and Rummukainen, M.: Evaluation of Climate Models, in: Climate Change 2013: The Physical Science Basis. Contribution of Working Group I to the Fifth Assessment Report of the Intergovernmental Panel on Climate Change, Cambridge University Press, Cambridge, United Kingdom and New York, USA., https://doi.org/10.1017/CBO9781107415324, 2013. a
Franke, J., Brönnimann, S., Bhend, J., and Brugnara, Y.: A monthly global paleo-reanalysis of the atmosphere from 1600 to 2005 for studying past climatic variations, Sci. Data, 4, 1–19, https://doi.org/10.1038/sdata.2017.76, 2017. a
Fritts, H. C.: Tree rings and climate, Academic Press, London, 1976. a, b
Fritts, H. C.: Reconstructing large-scale climatic patterns from tree-ring data: A diagnostic analysis, University of Arizona Press, Tucson, Arizona, USA, 1991. a
Gea-Izquierdo, G., Guibal, F., Joffre, R., Ourcival, J. M., Simioni, G., and Guiot, J.: Modelling the climatic drivers determining photosynthesis and carbon allocation in evergreen Mediterranean forests using multiproxy long time series, Biogeosciences, 12, 3695–3712, https://doi.org/10.5194/bg-12-3695-2015, 2015. a, b, c, d, e
Gea-Izquierdo, G., Nicault, A., Battipaglia, G., Dorado-Liñán, I., Gutiérrez, E., Ribas, M., and Guiot, J.: Risky future for Mediterranean forests unless they undergo extreme carbon fertilization, Glob. Change Biol., 23, 2915–2927, https://doi.org/10.1111/gcb.13597, 2017. a
Gennaretti, F.: MAIDEN ecophysiological forest model, figshare, Software, https://doi.org/10.6084/m9.figshare.5446435.v1, 2017. a, b
Gennaretti, F., Arseneault, D., and Bégin, Y.: Millennial disturbance-driven forest stand dynamics in the Eastern Canadian taiga reconstructed from subfossil logs, J. Ecol., 102, 1612–1622, https://doi.org/10.1111/1365-2745.12315, 2014a. a, b
Gennaretti, F., Arseneault, D., Nicault, A., Perreault, L., and Begin, Y.: Volcano-induced regime shifts in millennial tree-ring chronologies from northeastern North America, P. Natl. Acad. Sci. USA, 111, 10077–10082, https://doi.org/10.1073/pnas.1324220111, 2014b. a, b
Gennaretti, F., Gea-Izquierdo, G., Boucher, E., Berninger, F., Arseneault, D., and Guiot, J.: Ecophysiological modeling of photosynthesis and carbon allocation to the tree stem in the boreal forest, Biogeosciences, 14, 4851–4866, https://doi.org/10.5194/bg-14-4851-2017, 2017. a, b, c, d, e, f, g, h, i, j, k, l, m, n, o, p
Gennaretti, F., Boucher, E., Nicault, A., Gea-Izquierdo, G., Arseneault, D., Berninger, F., Savard, M. M., Bégin, C., and Guiot, J.: Underestimation of the Tambora effects in North American taiga ecosystems, Environ. Res. Lett., 13, 3, https://doi.org/10.1088/1748-9326/aaac0c, 2018. a
Goosse, H.: An additional step toward comprehensive paleoclimate reanalyses, J. Adv. Model. Earth Sy., 6, 1501–1503, https://doi.org/10.1002/2016MS000739, 2016. a
Goosse, H., Crespin, E., Dubinkina, S., Loutre, M. F., Mann, M. E., Renssen, H., Sallaz-Damaz, Y., and Shindell, D.: The role of forcing and internal dynamics in explaining the “Medieval Climate Anomaly”, Clim. Dynam., 39, 2847–2866, https://doi.org/10.1007/s00382-012-1297-0, 2012. a
Guiot, J., Boucher, E., and Gea-Izquierdo, G.: Process models and model-data fusion in dendroecology, Front. Ecol. Evol., 2, 1–12, https://doi.org/10.3389/fevo.2014.00052, 2014. a, b, c, d
Harris, I., Jones, P. D., Osborn, T. J., and Lister, D. H.: Updated high-resolution grids of monthly climatic observations – the CRU TS3.10 Dataset, Int. J. Climatol., 34, 623–642, https://doi.org/10.1002/joc.3711, 2014. a
Hartig, F., Minunno, F., and Paul, S.: BayesianTools: General-Purpose MCMC and SMC Samplers and Tools for Bayesian Statistics. R package version 0.1.6, available at: https://github.com/florianhartig/BayesianTools, last access: 3 November 2019. a, b, c, d
Hughes, M. K., Swetnam, T. W., and Diaz, H. F.: Dendroclimatology: Progress and Prospects, vol. 11, Springer, New York, 2011. a
Hunter, J. D.: Matplotlib: A 2D graphics environment, Comput. Sci. Eng., 9, 90–95, https://doi.org/10.1109/MCSE.2007.55, 2007. a, b
Hutchinson, M. F., McKenney, D. W., Lawrence, K., Pedlar, J. H., Hopkinson, R. F., Milewska, E., and Papadopol, P.: Development and testing of Canada-wide interpolated spatial models of daily minimum-maximum temperature and precipitation for 1961–2003, J. Appl. Meteorol. Clim., 48, 725–741, https://doi.org/10.1175/2008JAMC1979.1, 2009. a, b, c, d, e
Johnson, S. E. and Abrams, M. D.: Age class, longevity and growth rate relationships: Protracted growth increases in old trees in the eastern United States, Tree Physiol., 29, 1317–1328, https://doi.org/10.1093/treephys/tpp068, 2009. a, b
Jones, P. D., Briffa, K. R., Barnett, T. P., and Tett, S. F. B.: High-resolution palaeoclimatic records for the last millennium, Holocene, 4, 455–471, 1998. a
Jones, P. D., Briffa, K. R., Osborn, T. J., Lough, J. M., Van Ommen, T. D., Vinther, B. M., Luterbacher, J., Wahl, E. R., Zwiers, F. W., Mann, M. E., Schmidt, G. A., Ammann, C. M., Buckley, B. M., Cobb, K. M., Esper, J., Goosse, H., Graham, N., Jansen, E., Kiefer, T., Kull, C., Küttel, M., Mosley-Thompson, E., Overpeck, J. T., Riedwyl, N., Schulz, M., Tudhope, A. W., Villalba, R., Wanner, H., Wolff, E., and Xoplaki, E.: High-resolution palaeoclimatology of the last millennium: A review of current status and future prospects, Holocene, 19, 3–49, https://doi.org/10.1177/0959683608098952, 2009. a
Kalnay, E.: Atmospheric Modeling, Data Assimilation and Predictability, Cambridge University Press, New York, USA, 2003. a
Lavergne, A., Daux, V., Villalba, R., and Barichivich, J.: Temporal changes in climatic limitation of tree-growth at upper treeline forests: Contrasted responses along the west-to-east humidity gradient in Northern Patagonia, Dendrochronologia, 36, 49–59, https://doi.org/10.1016/j.dendro.2015.09.001, 2015. a
Lavergne, A., Gennaretti, F., Risi, C., Daux, V., Boucher, E., Savard, M. M., Naulier, M., Villalba, R., BÉgin, C., and Guiot, J.: Modelling tree ring cellulose δ118O variations in two temperature-sensitive tree species from North and South America, Clim. Past, 13, 1515–1526, https://doi.org/10.5194/cp-13-1515-2017, 2017. a
Mann, M. E., Bradley, R. S., and Hughes, M. K.: Northern Hemisphere temperatures during the past millennium, Geophys. Res. Lett., 26, 759–762, 1999. a
Mann, M. E., Zhang, Z., Hughes, M. K., Bradley, R. S., Miller, S. K., Rutherford, S., and Ni, F.: Proxy-based reconstructions of hemispheric and global surface temperature variations over the past two millennia, P. Natl. Acad. Sci. USA, 105, 13252–13257, https://doi.org/10.1073/pnas.0805721105, 2008. a
Mann, M. E., Zhang, Z., Rutherford, S., Bradley, R. S., Hughes, M. K., Shindell, D., Ammann, C., Faluvegi, G., and Ni, F.: Global Signatures and Dynamical Origins of the Little Ice Age and Medieval Climate Anomaly, Science, 326, 1256–1260, https://doi.org/10.1126/science.1177303, 2009. a
Menne, M., Durre, I., Korzeniewski, B., McNeal, S., Thomas, K., Yin, X., Anthony, S., Ray, R., Vose, R., Gleason, B., and Houston, T.: Global Historical Climatology Network – Daily (GHCN-Daily), Version 3.24, NOAA National Climatic Data Center, 2012a. a, b, c
Menne, M. J., Durre, I., Vose, R. S., Gleason, B. E., and Houston, T. G.: An overview of the global historical climatology network-daily database, J. Atmos. Ocean. Tech., 29, 897–910, https://doi.org/10.1175/JTECH-D-11-00103.1, 2012b. a, b, c
Misson, L.: MAIDEN: a model for analyzing ecosystem processes in dendroecology, Can. J. Forest Res., 34, 874–887, https://doi.org/10.1139/x03-252, 2004. a, b, c, d
Myhre, G., Shindell, D., Bréon, F.-M., Collins, W., Fuglestvedt, J., Huang, J., Koch, D., Lamarque, J.-F., Lee, D., Mendoza, B., Nakajima, T., Robock, A., Stephens, G., Takemura, T., and Zhang, H.: Anthropogenic and Natural Radiative Forcing, in: Climate Change 2013: The Physical Science Basis. Contribution of Working Group I to the Fifth Assessment Report of the Intergovernmental Panel on Climate Change, Cambridge University Press, Cambridge, United Kingdom and New York, USA, https://doi.org/10.1017/CBO9781107415324.018, 2013. a
Nicault, A., Boucher, E., Tapsoba, D., Arseneault, D., Berninger, F., Bégin, C., DesGranges, J., Guiot, J., Marion, J., Wicha, S., and Bégin, Y.: Spatial analysis of black spruce (Picea mariana (Mill.) B.S.P.) radial growth response to climate in northern Québec – Labrador Peninsula, Canada, Can. J. Forest Res., 45, 343–352, https://doi.org/10.1139/cjfr-2014-0080, 2014. a, b, c, d, e, f, g, h, i, j, k, l
PAGES 2k Consortium: A global multiproxy database for temperature reconstructions of the Common Era, Sci. Data, 4, 1–33, https://doi.org/10.1038/sdata.2017.88, 2017. a, b, c, d
Payette, S., Filion, L., and Delwaide, A.: Spatially explicit fire-climate history of the boreal forest-tundra (Eastern Canada) over the last 2000 years, Philos. T. Roy. Soc. B, 363, 2301–2316, https://doi.org/10.1098/rstb.2007.2201, 2008. a
Seftigen, K., Frank, D. C., Björklund, J., Babst, F., and Poulter, B.: The climatic drivers of normalized difference vegetation index and tree-ring-based estimates of forest productivity are spatially coherent but temporally decoupled in Northern Hemispheric forests, Global Ecol. Biogeogr., 27, 1352–1365, https://doi.org/10.1111/geb.12802, 2018. a, b
Sheffield, J., Goteti, G., and Wood, E. F.: Development of a 50-year high-resolution global dataset of meteorological forcings for land surface modeling, J. Climate, 19, 3088–3111, https://doi.org/10.1175/JCLI3790.1, 2006 (data available at: http://hydrology.princeton.edu/data.php, last access: 4 January 2019). a, b, c
St. George, S. and Esper, J.: Concord and discord among Northern Hemisphere paleotemperature reconstructions from tree rings, Quaternary Sci. Rev., 203, 278–281, https://doi.org/10.1016/j.quascirev.2018.11.013, 2019. a
Steiger, N. J. and Smerdon, J. E.: A pseudoproxy assessment of data assimilation for reconstructing the atmosphereocean dynamics of hydroclimate extremes, Clim. Past, 13, 1435–1449, https://doi.org/10.5194/cp-13-1435-2017, 2017. a
Tardif, R., Hakim, G. J., Perkins, W. A., Horlick, K. A., Erb, M. P., Emile-Geay, J., Anderson, D. M., Steig, E. J., and Noone, D.: Last Millennium Reanalysis with an expanded proxy database and seasonal proxy modeling, Clim. Past, 15, 1251–1273, https://doi.org/10.5194/cp-15-1251-2019, 2019. a
Tolwinski-Ward, S. E., Evans, M. N., Hughes, M. K., and Anchukaitis, K. J.: An efficient forward model of the climate controls on interannual variation in tree-ring width, Clim. Dynam., 36, 2419–2439, https://doi.org/10.1007/s00382-010-0945-5, 2011. a, b, c, d, e
Tolwinski-Ward, S. E., Anchukaitis, K. J., and Evans, M. N.: Bayesian parameter estimation and interpretation for an intermediate model of tree-ring width, Clim. Past, 9, 1481–1493, https://doi.org/10.5194/cp-9-1481-2013, 2013. a, b
University of East Anglia Climatic Research Unit, Harris, I. C., and Jones, P. D.: CRU TS4.01: Climatic Research Unit (CRU) Time-Series (TS) version 4.01 of high-resolution gridded data of month-by-month variation in climate (Jan. 1901–Dec. 2016), Centre for Environmental Data Analysis, https://doi.org/10.5285/58a8802721c94c66ae45c3baa4d814d0, 2017.
Vaganov, E. A., Hughes, M. K., and Shashkin, A.: Growth dynamics of conifer tree rings, Springer, Berlin Heidelberg New York, 2006. a, b
Wilson, R. and Elling, W.: Temporal instability in tree-growth/climate response in the Lower Bavarian Forest region: Implications for dendroclimatic reconstruction, Trees-Struct. Funct., 18, 19–28, https://doi.org/10.1007/s00468-003-0273-z, 2004. a
Wilson, R., D'Arrigo, R., Buckley, B., Büntgen, U., Esper, J., Frank, D., Luckman, B., Payette, S., Vose, R., and Youngblut, D.: A matter of divergence: Tracking recent warming at hemispheric scales using tree ring data, J. Geophys. Res.-Atmos., 112, 1–17, https://doi.org/10.1029/2006JD008318, 2007. a
Wilson, R., Anchukaitis, K., Briffa, K. R., Büntgen, U., Cook, E., D'Arrigo, R., Davi, N., Esper, J., Frank, D., Gunnarson, B., Hegerl, G., Helama, S., Klesse, S., Krusic, P. J., Linderholm, H. W., Myglan, V., Osborn, T. J., Rydval, M., Schneider, L., Schurer, A., Wiles, G., Zhang, P., and Zorita, E.: Last millennium northern hemisphere summer temperatures from tree rings: Part I: The long term context, Quaternary Sci. Rev., 134, 1–18, https://doi.org/10.1016/j.quascirev.2015.12.005, 2016. a, b