the Creative Commons Attribution 4.0 License.
the Creative Commons Attribution 4.0 License.
 | 18 Jun 2018
Assessing the impact of large volcanic eruptions of the last millennium (850–1850 CE) on Australian rainfall regimes
Stephanie A. P. Blake
Sophie C. Lewis
Allegra N. LeGrande
Ron L. Miller
Explosive volcanism is an important natural climate forcing, impacting global surface temperatures and regional precipitation. Although previous studies have investigated aspects of the impact of tropical volcanism on various ocean–atmosphere systems and regional climate regimes, volcanic eruptions remain a poorly understood climate forcing and climatic responses are not well constrained. In this study, volcanic eruptions are explored in particular reference to Australian precipitation, and both the Indian Ocean Dipole (IOD) and El Niño–Southern Oscillation (ENSO). Using nine realisations of the last millennium (LM) (850–1850 CE) with different time-evolving forcing combinations, from the NASA GISS ModelE2-R, the impact of the six largest tropical volcanic eruptions of this period are investigated. Overall, we find that volcanic aerosol forcing increased the likelihood of El Niño and positive IOD conditions for up to four years following an eruption, and resulted in positive precipitation anomalies over north-west (NW) and south-east (SE) Australia. Larger atmospheric sulfate loading during larger volcanic eruptions coincided with more persistent positive IOD and El Niño conditions, enhanced positive precipitation anomalies over NW Australia, and dampened precipitation anomalies over SE Australia.
- Article
(8203 KB) - Full-text XML
- BibTeX
- EndNote


Volcanic eruptions have significant impacts on weather and climate variability through the injection of volcanogenic material into the atmosphere. Sulfate aerosols, formed through the reaction of SO2 and OH− in the volcanic cloud, decrease incoming shortwave radiation, and if injected into the stratosphere, can generate a global response (Driscoll et al., 2012; LeGrande et al., 2016). Previous studies have identified relationships between volcanism and surface and tropospheric cooling (Driscoll et al., 2012), local stratospheric warming (Wielicki et al., 2002), strengthening of the Arctic Oscillation and Atlantic meridional overturning circulation (Oman et al., 2005; Stenchikov et al., 2006, 2009; Shindell et al., 2004), and negative global precipitation anomalies (Gillet et al., 2004; Iles et al., 2013). The present study focuses on the under-studied relationship between large, globally significant tropical eruptions in the last millennium (850–1850 CE) and Australian precipitation. This was undertaken via the examination of the direct radiative aerosol effect and the feedbacks of two tropical modes that strongly influence Australian rainfall: the El Niño–Southern Oscillation (ENSO) and Indian Ocean Dipole (IOD).
ENSO's effect on Australian precipitation has long been recognised. El Niño events typically cause averaged precipitation deficits, while La Niña events cause positive precipitation anomalies (Meyers et al., 2007; Pepler et al., 2014). In addition, a statistical relationship has been demonstrated between explosive tropical volcanism and ENSO where large tropical eruptions can increase the likelihood and amplitude of an El Niño event in following years, followed by a weaker La Niña state (Adams et al., 2003). Further work by Mann et al. (2005), Emile-Geay et al. (2008), McGregor et al. (2010), Wahl et al. (2014) and Predybaylo et al. (2017) supported this result. Pausata et al. (2015) and Stevenson et al. (2016) identified that a radiative forcing threshold value of more than 15 W m−2 is required to affect the ENSO, and that high latitude Northern Hemisphere eruptions, in addition to tropical eruptions, are capable of doing so, as long as the forcing is asymmetric with regards to the equator.
The relationship between volcanic forcing and ENSO has been attributed to two contrasting, though not unrelated, mechanisms. The dynamical thermostat mechanism (Clement et al., 1996), whereby a uniform reduction of the surface heat flux due to volcanism causes warming of the eastern equatorial Pacific, was identified as the driver of ENSO's response to volcanism by Mann et al. (2005) and Emile-Geay et al. (2008). Conversely, a shift in the intertropical convergence zone (ITCZ) induced by strong radiative forcing was accredited in more recent studies (Pausata et al., 2015; Stevenson et al., 2016). Preconditioning does impact the severity of the ENSO response. Predybaylo et al. (2017) found that years with an initial central Pacific ENSO phase show the largest statistical impact from Pinatubo-sized eruptions, and that summer eruptions coincided with a more pronounced El Niño response.
Despite the understanding that volcanism can trigger or amplify El Niño events in the following years, the exact relationship between ENSO and volcanic forcing is still debated. McGregor and Timmermann (2011) and Zanchettin et al. (2012) reported an enhanced probability of La Niña events occurring in the immediate years after a volcanic eruption, rather than El Niño, while several other studies (Self et al., 1997; Robock, 2000; Ding et al., 2014) found no relationship between ENSO and volcanic forcing. Robock (2000) argued that both El Chichon and Pinatubo reached their peak forcing after the initiation of El Niño events, indicating a coincidental relationship. Other studies (Driscoll et al., 2012; Lewis and Karoly, 2014; Lewis and LeGrande, 2015; Predybaylo et al., 2017) have, however, pointed out challenges in determining long-term characteristics of ENSO due to short instrumental records. It is also difficult to determine its relationship to volcanic forcing owing to variable representations of both ENSO and volcanic aerosols in GCMs (global climate models).
Comparatively little research has gone into determining the effects of volcanic forcing on the Indian Ocean Dipole (IOD), despite its known climatic impacts on Indian Ocean basin countries, such as Australia, South Africa, India, and Indonesia (Cheung and Abram, 2016). The IOD is the zonal sea surface temperature (SST) gradient between the tropical western Indian Ocean (WIO) and the tropical south eastern Indian Ocean (EIO) (Roxy et al., 2011), defined by the dipole mode index (DMI). Positive IOD (pIOD) states typically cause averaged precipitation deficits over Australia, and negative IOD (nIOD) states cause a surplus (Meyers et al., 2007; Pepler et al., 2014). While ENSO is often considered primarily responsible for triggering Australian droughts, the IOD has been shown to have an equal, if not larger, impact on heavily populated areas of Australia; all significant southeastern Australian droughts during the 20th century have shown a larger response to pIOD events than El Niño events (Ummenhofer et al., 2009).
Cheung and Abram (2016) found that the DMI shows a statistically significant correlation to volcanic forcing, with a negative IOD (nIOD) occurring immediately after an eruption and a positive IOD (pIOD) one year later. Maher et al. (2015) found a similar relationship, with coinciding El Niño and pIOD events occurring 6–12 months after the peak of volcanic forcing. The response of the IOD to volcanic forcing has been hypothesised to result from either the IOD's relationship with ENSO (Cheung and Abram, 2016), or the volcanically induced reduction of the Asian monsoon (Anchukaitis et al., 2010; Zambri et al., 2017).
The direct radiative effect of volcanic aerosols has been found to cause global precipitation deficits for up to 5 years post-eruption (Robock and Lui, 1994; Iles et al., 2013, 2015; Gillett et al., 2004; Gu and Adler, 2011; Soden et al., 2002; Joseph and Zeng, 2011; Schneider et al., 2009; Timmreck et al., 2012). However, these deficits have been shown to vary seasonally (Joseph and Zeng, 2011), and cause positive precipitation anomalies over the north-west (NW) and south-east (SE) of Australia in the Southern Hemisphere (SH) winter and early spring (July to September), despite significant precipitation deficits in the summer (Joseph and Zeng, 2011; Schneider et al., 2009). This study explores these relationships between volcanic eruptions and Australian rainfall during JASON (July–November), with reference to the direct radiative effect and the feedback effects of the ENSO and IOD.
2.1 Simulations
To understand the response of the IOD, ENSO and Australian precipitation to volcanic forcing in the last millennium, we analysed nine ensembles from the NASA GISS ModelE2-R (hereafter simply GISS) (Schmidt et al., 2014). The GISS ensemble was run for the pre-industrial part of the last millennium (LM), from 850 to 1850 CE, which is defined by the Coupled Model Intercomparison Project Phase 5 (CMIP5) (Taylor et al., 2012). GISS is run at 2 degrees × 2.5 degrees horizontal resolution, with 40 vertical levels up to 0.1 hPa. The “non-interactive” atmospheric composition model, or NINT, is coupled with the dynamic Russell ocean model (Schmidt et al., 2014).
Evaluations of the accuracy of ENSO, IOD, surface temperature, precipitation and volcanic aerosols modelled in GISS have been conducted by Flato et al. (2013), Schmidt et al. (2014), Moise et al. (2015) and Miller et al. (2015). Global temperature observed at the surface, middle troposphere, and lower stratosphere are all accurate to within 2 standard deviations in the historical ensemble (Miller et al., 2015), with GISS surface temperatures agreeing with observations in all areas of interest to this study to within 2 ∘C and correctly simulating surface cooling following volcanic eruptions (Flato et al., 2013; Miller et al., 2015). In the Southern Ocean some systematic deficiencies cause large SST biases, however overall biases remain below 0.7–0.8 ∘C (Schmidt et al., 2014).
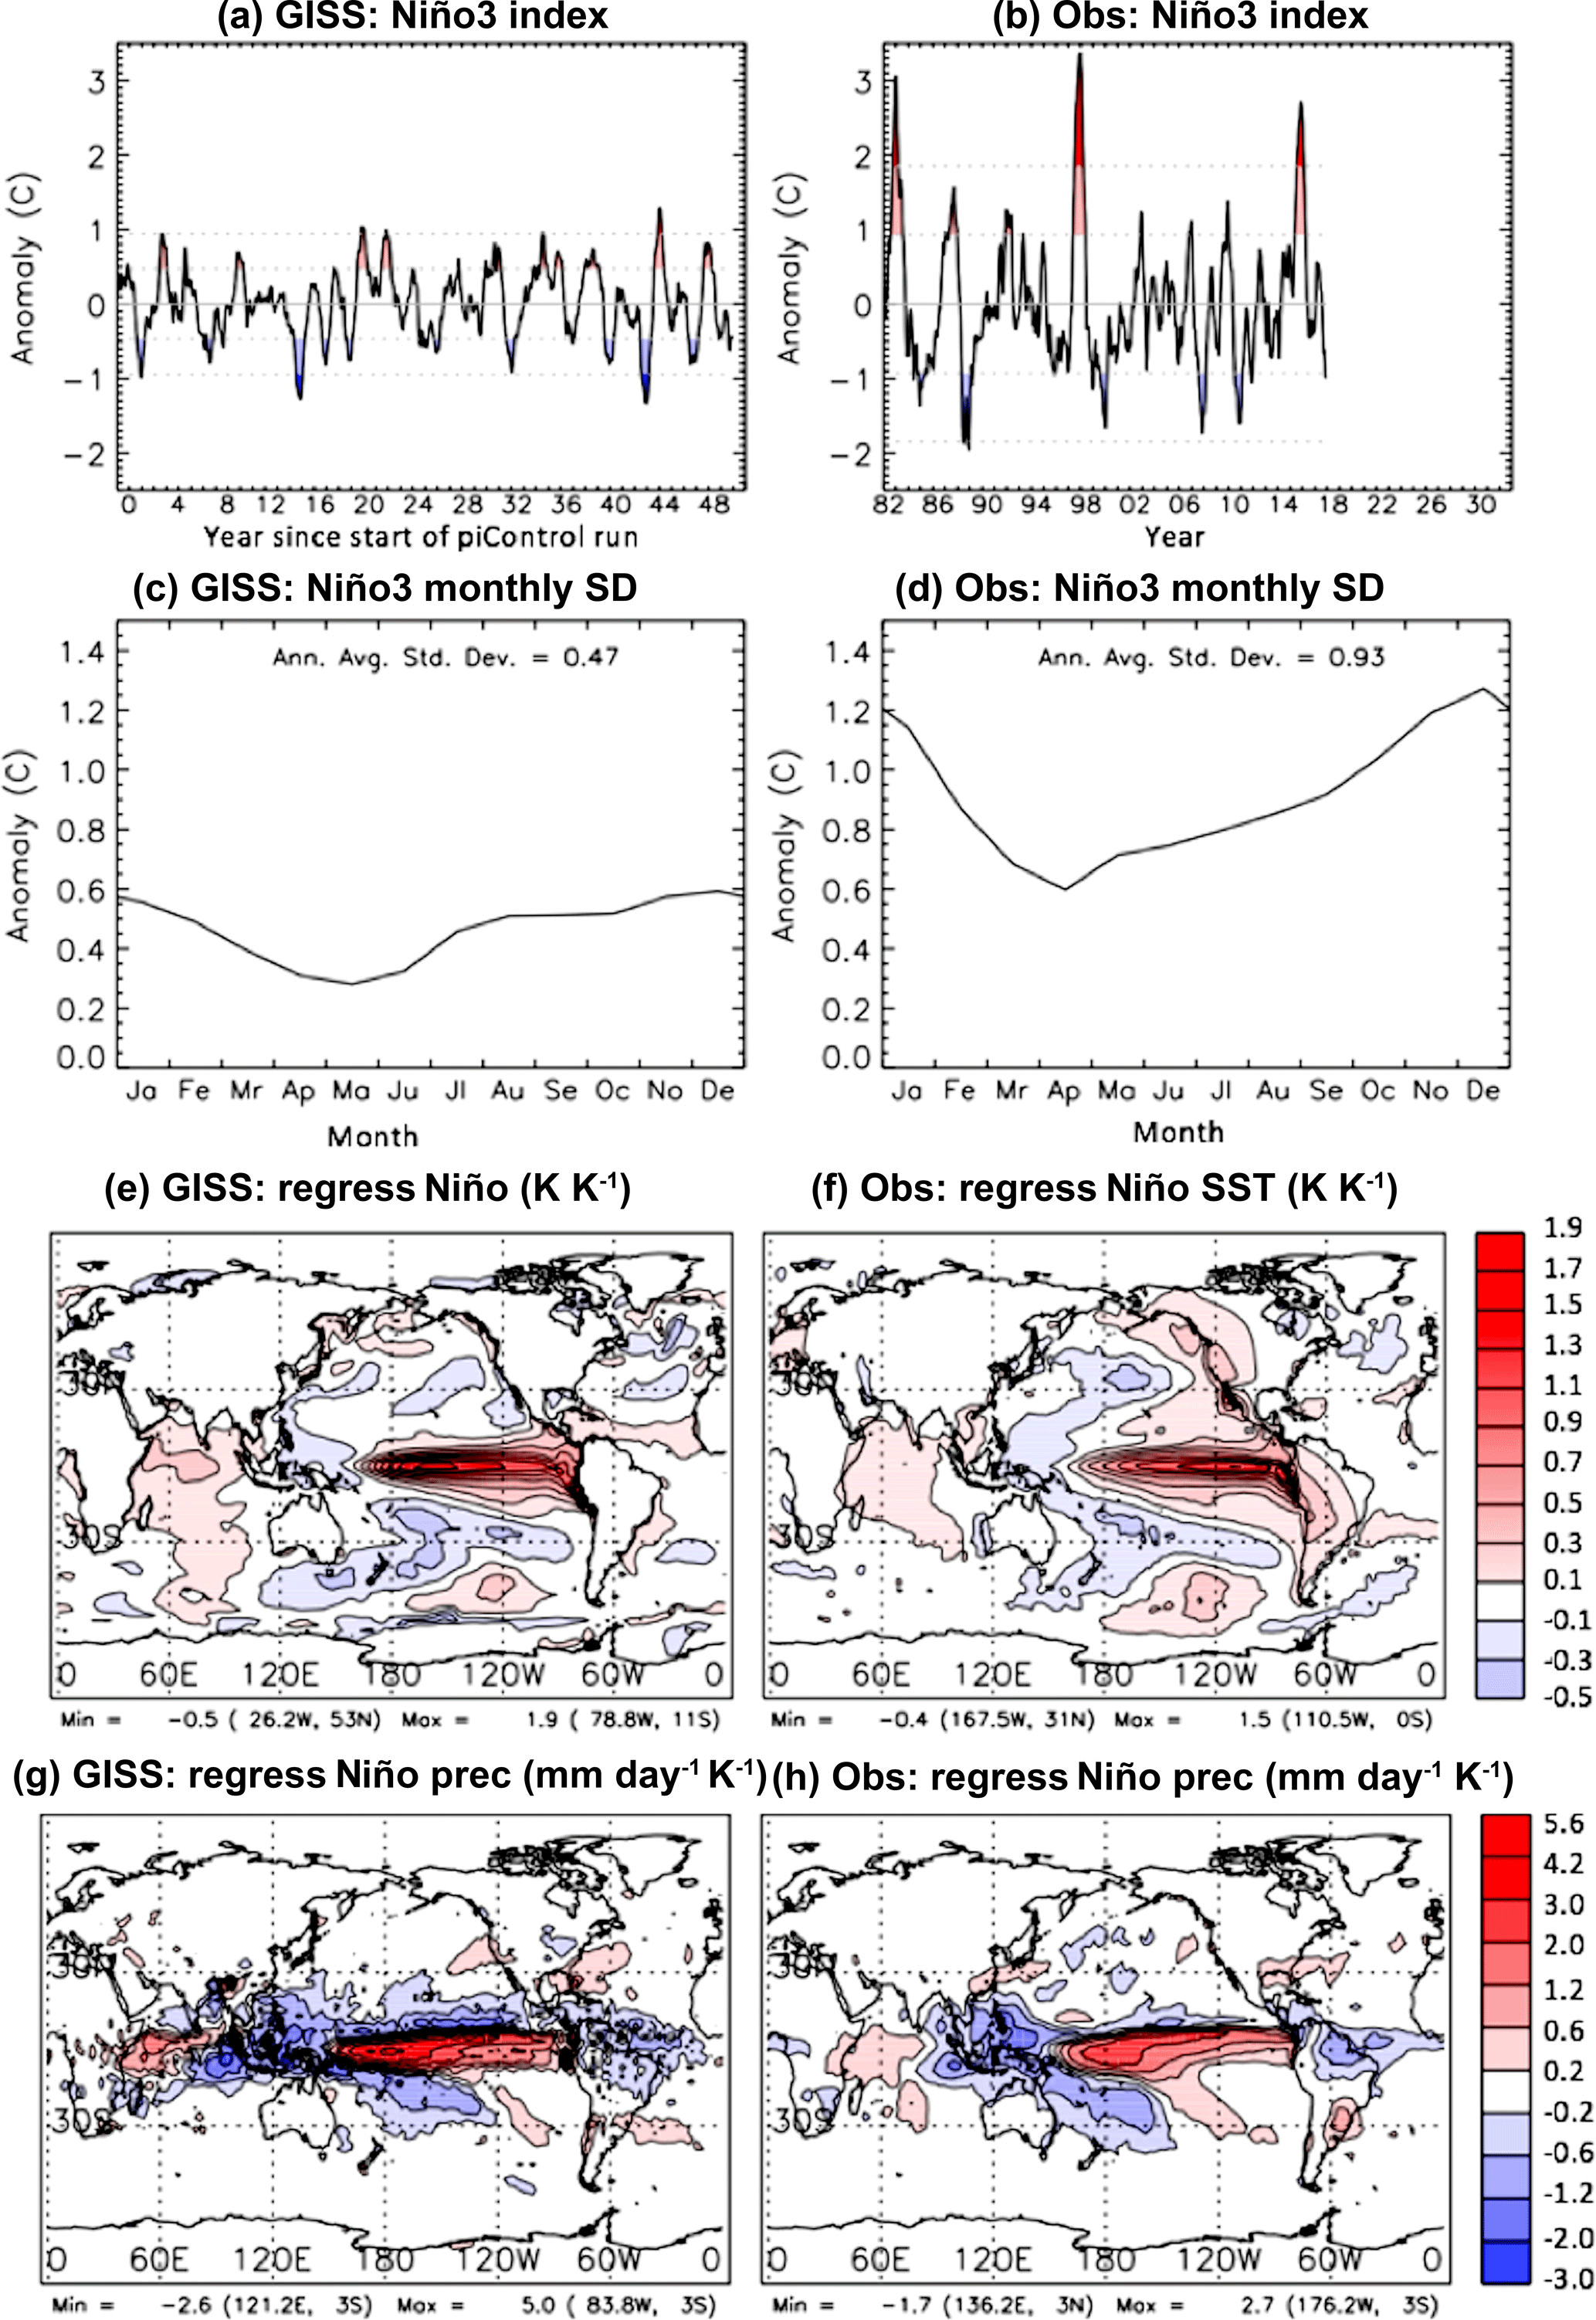
Figure 1Evaluation of GISS model ENSO variability against Reynold's Optimum Interpolation Sea Surface Temperature (OISST, 1982–2017) and GPCP (1979–2017) observations. Model values are calculated using the first 50 years of the E2-R piControl simulation, where forcings are absent. (a–b) NINO3 index created from a spatial average of GISS and Reynolds SST between 150 and 90∘ W and 6∘ S to 6∘ N. The meridional extent used to construct the NINO3 index is typically 5∘ S to 5∘ N, but is broadened here to correspond to the archival grid for GISS SST. The index is constructed from monthly anomalies with no smoothing. (c–d) Seasonality of ENSO variability, defined as the standard deviation of the NINO3 index for each month. (e–f) The sensitivity of SST to NINO3.4 index derived by linear regression. (g–h) The sensitivity to the NINO3.4 index derived by linear regression.
Mean global precipitation is too high during the historical period, particularly around the tropics, when compared to observations (Schmidt et al., 2014); however, the spatial pattern of precipitation agreed with trends calculated from Global Precipitation Climatology Project retrievals (Miller et al., 2015). Australian precipitation had a spatial–temporal root square mean error (RSME) of ∼ 1 mm day−1 and the model was deemed to provide good representations of surface temperature and precipitation over the entirety of Australia (Moise et al., 2015).
GISS captures the basic east–west structure of the tropical Pacific well, and follows the trend of the NINO3.4 index with the greatest accuracy between 2 and 3 years of an ENSO event (Flato et al., 2013; Schmidt et al., 2014). Calculation of the NINO3 index (150–90∘ W and 6∘ N–6∘ S) for GISS and the Reynolds OISST (https://www.ncdc.noaa.gov/oisst, last access: 17 February 2018) observations for the first 50 years of the GISS piControl displayed an underestimation of ENSO intensity in GISS (Fig. 1a, b), meaning the modelled SST anomalies were about half as large as those observed. However, variability throughout the year is consistent with observations (Fig. 1c, d). Furthermore, regression of the index onto SST shows the global spatial pattern is in good agreement with observations, including the positive IOD index typically observed during ENSO events (Fig. 1e, f). Similar regression of the NINO3 index against precipitation (Fig. 1g, h) also shows spatial concurrence between GISS and GPCP (https://precip.gsfc.nasa.gov/, last access: 17 February 2018) observations, displaying the precipitation dipole over the Indian Ocean associated with the IOD.
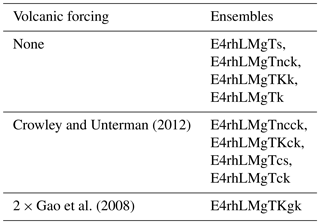
Five ensembles were forced with volcanic forcing while four were not in order to compare the effect of volcanic aerosols with non-volcanically influenced scenarios. Of the five run with volcanic forcing, four were forced with Crowley and Unterman (2013)'s aerosol optical depth data (CR), and one with double the Ice-core Volcanic Index 2 by Gao et al. (2008) (2 × G) (see Table 1 for experiment summary). The LM was chosen for analysis as the period contains the majority of the large tropical volcanic eruptions recorded in these datasets. The GISS model is forced with prescribed aerosol optical depth (AOD) from 15 to 35 km, with a 4 layer vertical (15–20, 20–25, 25–30, and 30–35 km) and 24 layer (8∘) longitudinally independent latitude, with Reff (effective radius) specified as per Sato et al. (1993). The LM simulations also include transient solar and land use histories that differ between ensembles. However, as this analysis primarily focuses on the immediate post-volcanic response, the impact of these smaller amplitude and slow varying forcings is likely to be insignificant (Colose et al., 2016).
Table 2The six largest tropical eruptions of the last millennium and their total global stratospheric sulfate injection (Tg) as recorded by Gao et al. (2008), revised in 2012.
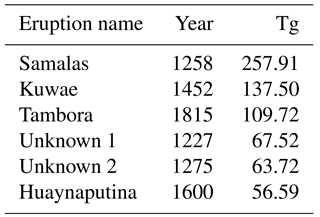
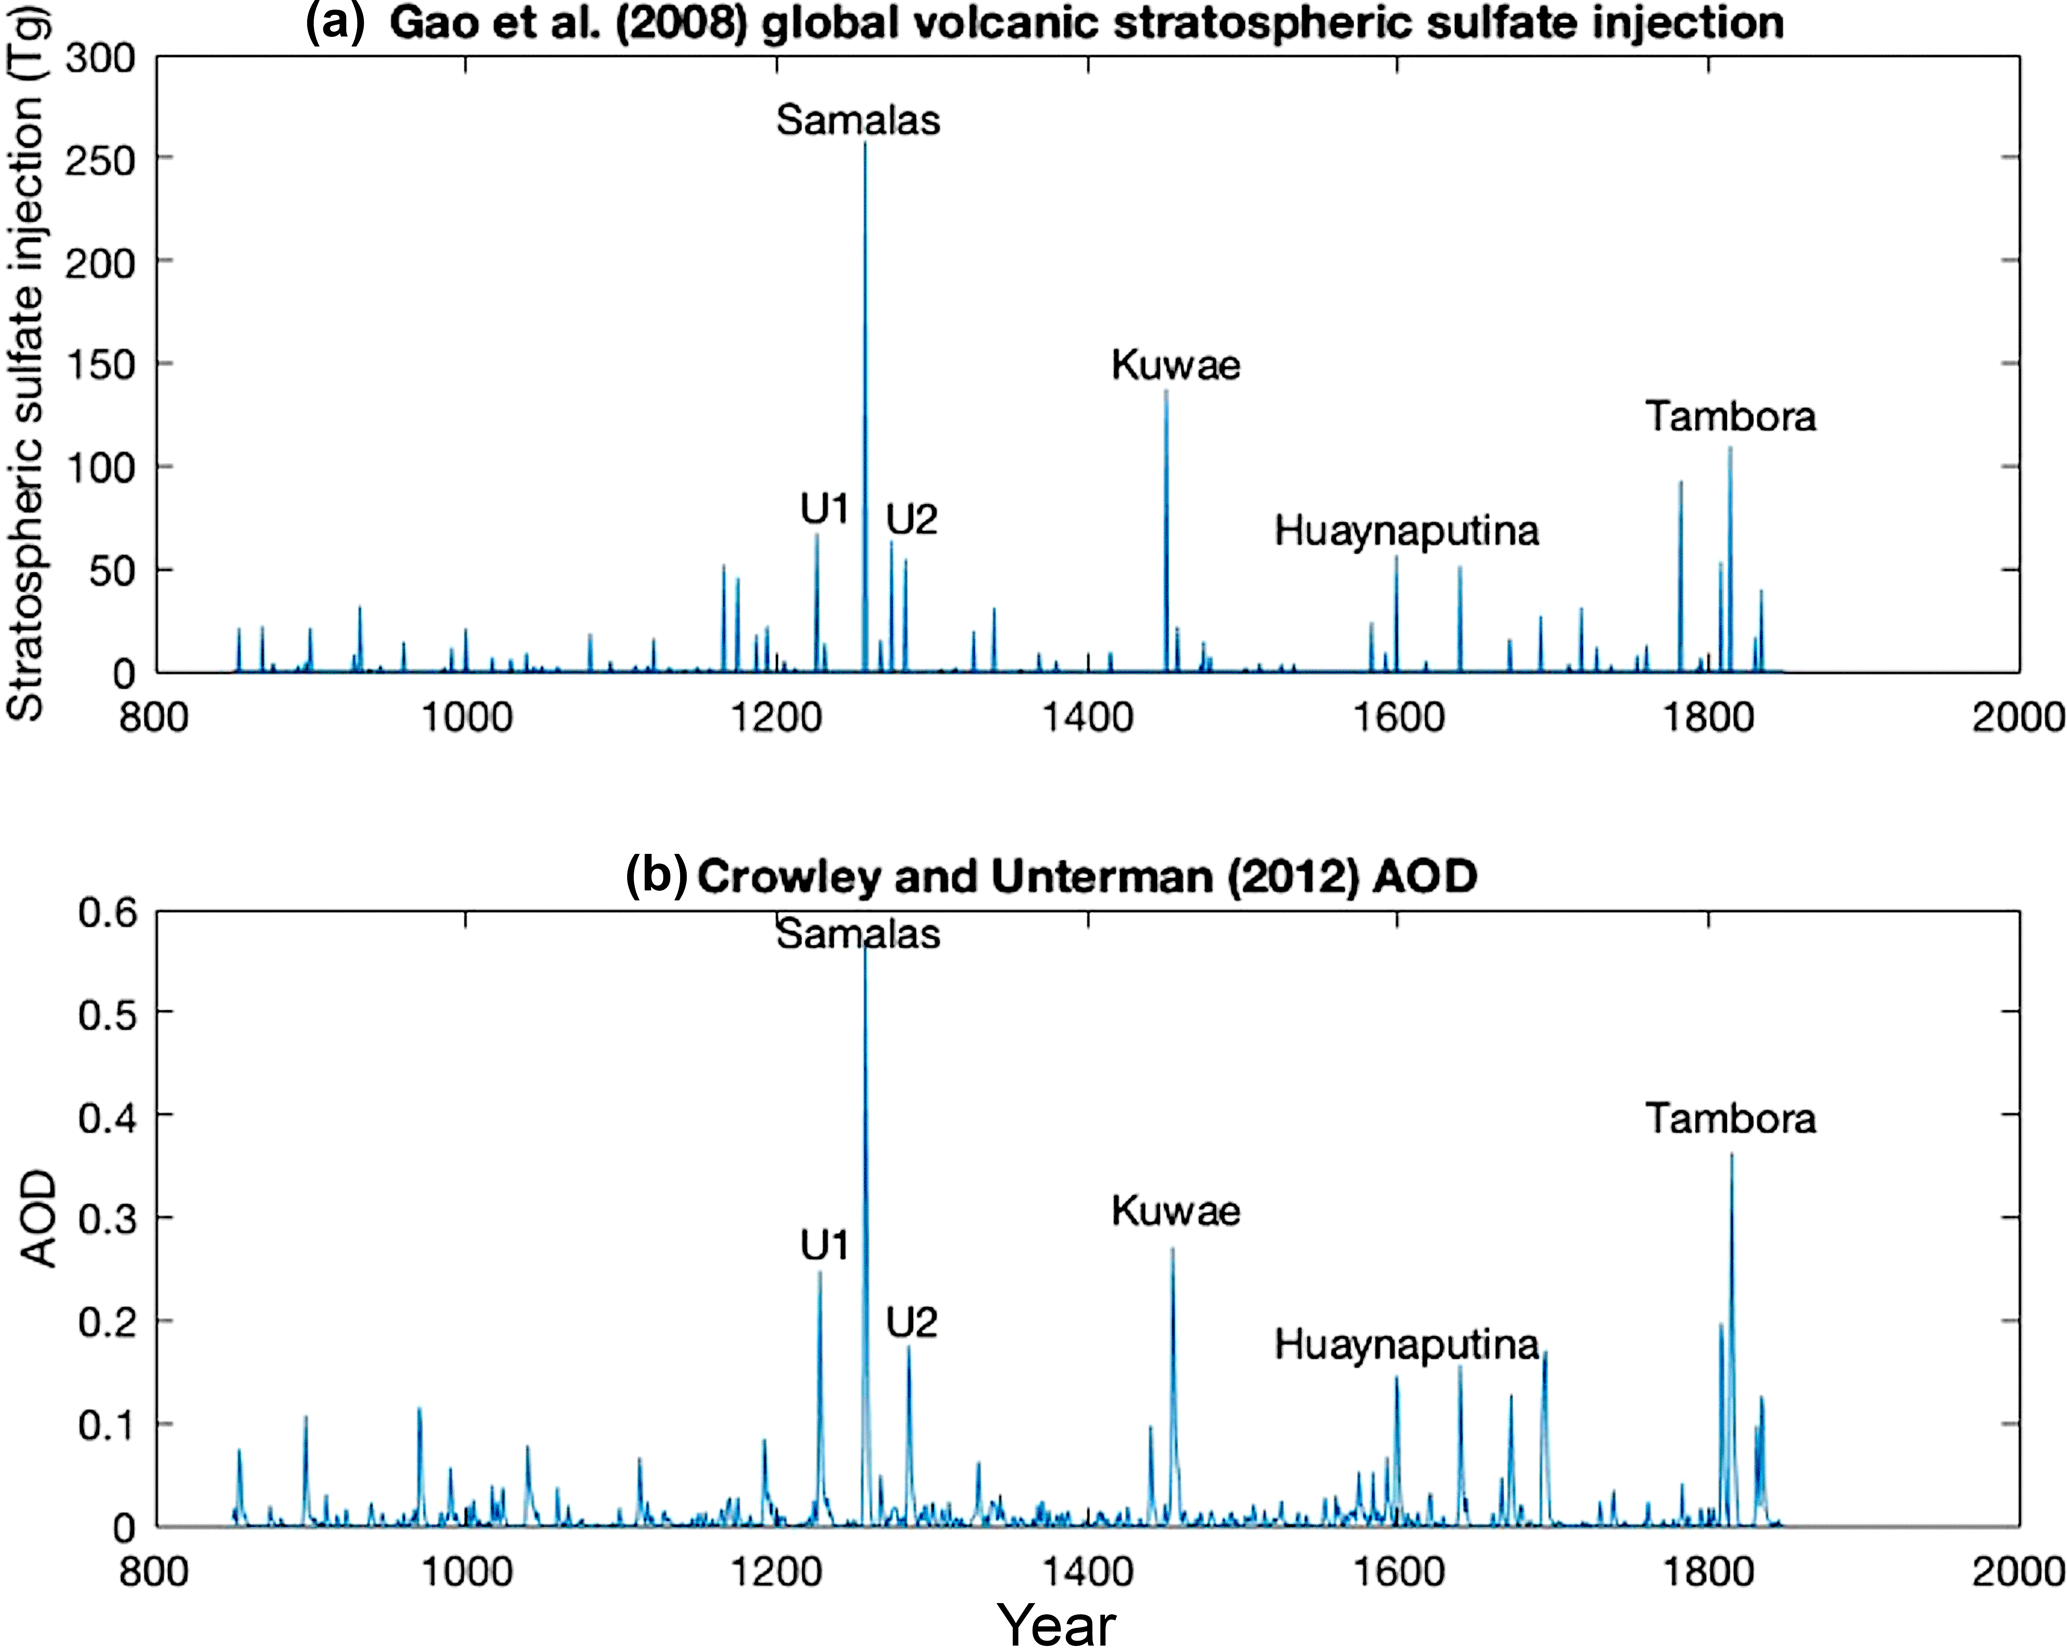
Figure 2Time series of volcanic forcing from Gao et al. (2008) (a) and Crowley and Unterman (2012) (b). The specific subset of volcanic eruptions investigated is labelled.
2.2 Methods
First, the six largest tropical eruptions between 850 and 1850 CE were identified by the magnitude of their total global stratospheric sulfate aerosol injection (Tg) from the IVI2 Version 2 dataset, revised in 2012 (Gao et al., 2008), and the years surrounding eruption were extracted for analysis (see Table 2 and Fig. 2). Eruptions were deemed as tropical if volcanic aerosols were present in significant amounts in both hemispheres. The Kuwae eruption is included within the analysed eruptions, and is dated to 1452 CE. While this year contains the bi-hemispheric deposition from the Kuwae eruption in both volcanic datasets used in this study, it is important to note that Sigl et al. (2013) recently constructed an ice core record of volcanism that dates the Kuwae eruption to 1458/1459 CE, with another smaller eruption occurring at 1452. However, for the purposes of this paper Kuwae will be considered as the 1452 deposition event.
We explored anomalous conditions in the ENSO, the IOD and Australian rainfall. For the ENSO, the period December–February (DJF) was examined using the NINO3.4 index (Trenberth, 1997), defined by the averaged sea surface temperature (SST) anomalies between 5∘ N–5∘ S and 170–120∘ W. When analysing the IOD, the JASON period was examined due to the tendency for pIODs to develop and mature over these months (Weller et al., 2014). The IOD was measured using the dipole mode index (DMI), which subtracts the averaged SST in the EIO (90–110∘ E; 10∘ S–0) from the averaged SST in the WIO (50–70∘ E; 10∘ S–10∘ N).
Australian precipitation was processed to find the anomalies of each season and year relative to the long-term mean over the JASON period. Analyses were conducted on area-averaged rainfall for the south-eastern Australian (132.5–155∘ E; 27.5–45∘ S) and north-western Australian (110–132.5∘ E; 10–27.5∘ S) regions. The south-east and north-west were chosen for analysis as the effect of the IOD on Australian precipitation is largest in, and potentially limited to, these general areas (Ashok et al., 2003).
The response of these large-scale modes of variability and rainfall are investigated using an epoch approach. For each major identified eruption, a response was defined by subtracting a reference period (the mean of 5 years pre-eruption) from the eruption year and the 6 years following eruption individually. A reference period of 5 years was chosen as it minimised the effect of trends or low-frequency climate variability (Iles et al., 2013). Mode specific graphs (IOD, ENSO, Australian precipitation) focused on the 9 years surrounding eruption (years −2 to 6, with year 0 being the year of eruption). The mean of all six eruptions in each ensemble were calculated for individual years to reduce the noise associated with single eruptions, and then the mean of all ensembles included in each forcing category were compared (CR, 2 × G, or “None”).
The significance of the climatic response was assessed by comparing volcanically forced ensembles to the “None” ensemble. The post eruption “None” ensemble anomalies represent random sampling and have no physical relation to any eruption; thus, their annual averages can be compared with those of the volcanically forced runs. One test of significance is shown by the 0.6 standard deviation threshold which represents the magnitude exceeded by natural variations only 5 % of the time; this is identified by the two-variable t-test threshold for the CR runs. The threshold for the 2 × G runs is slightly higher (0.9 standard deviation) due to the smaller number of forced simulations.
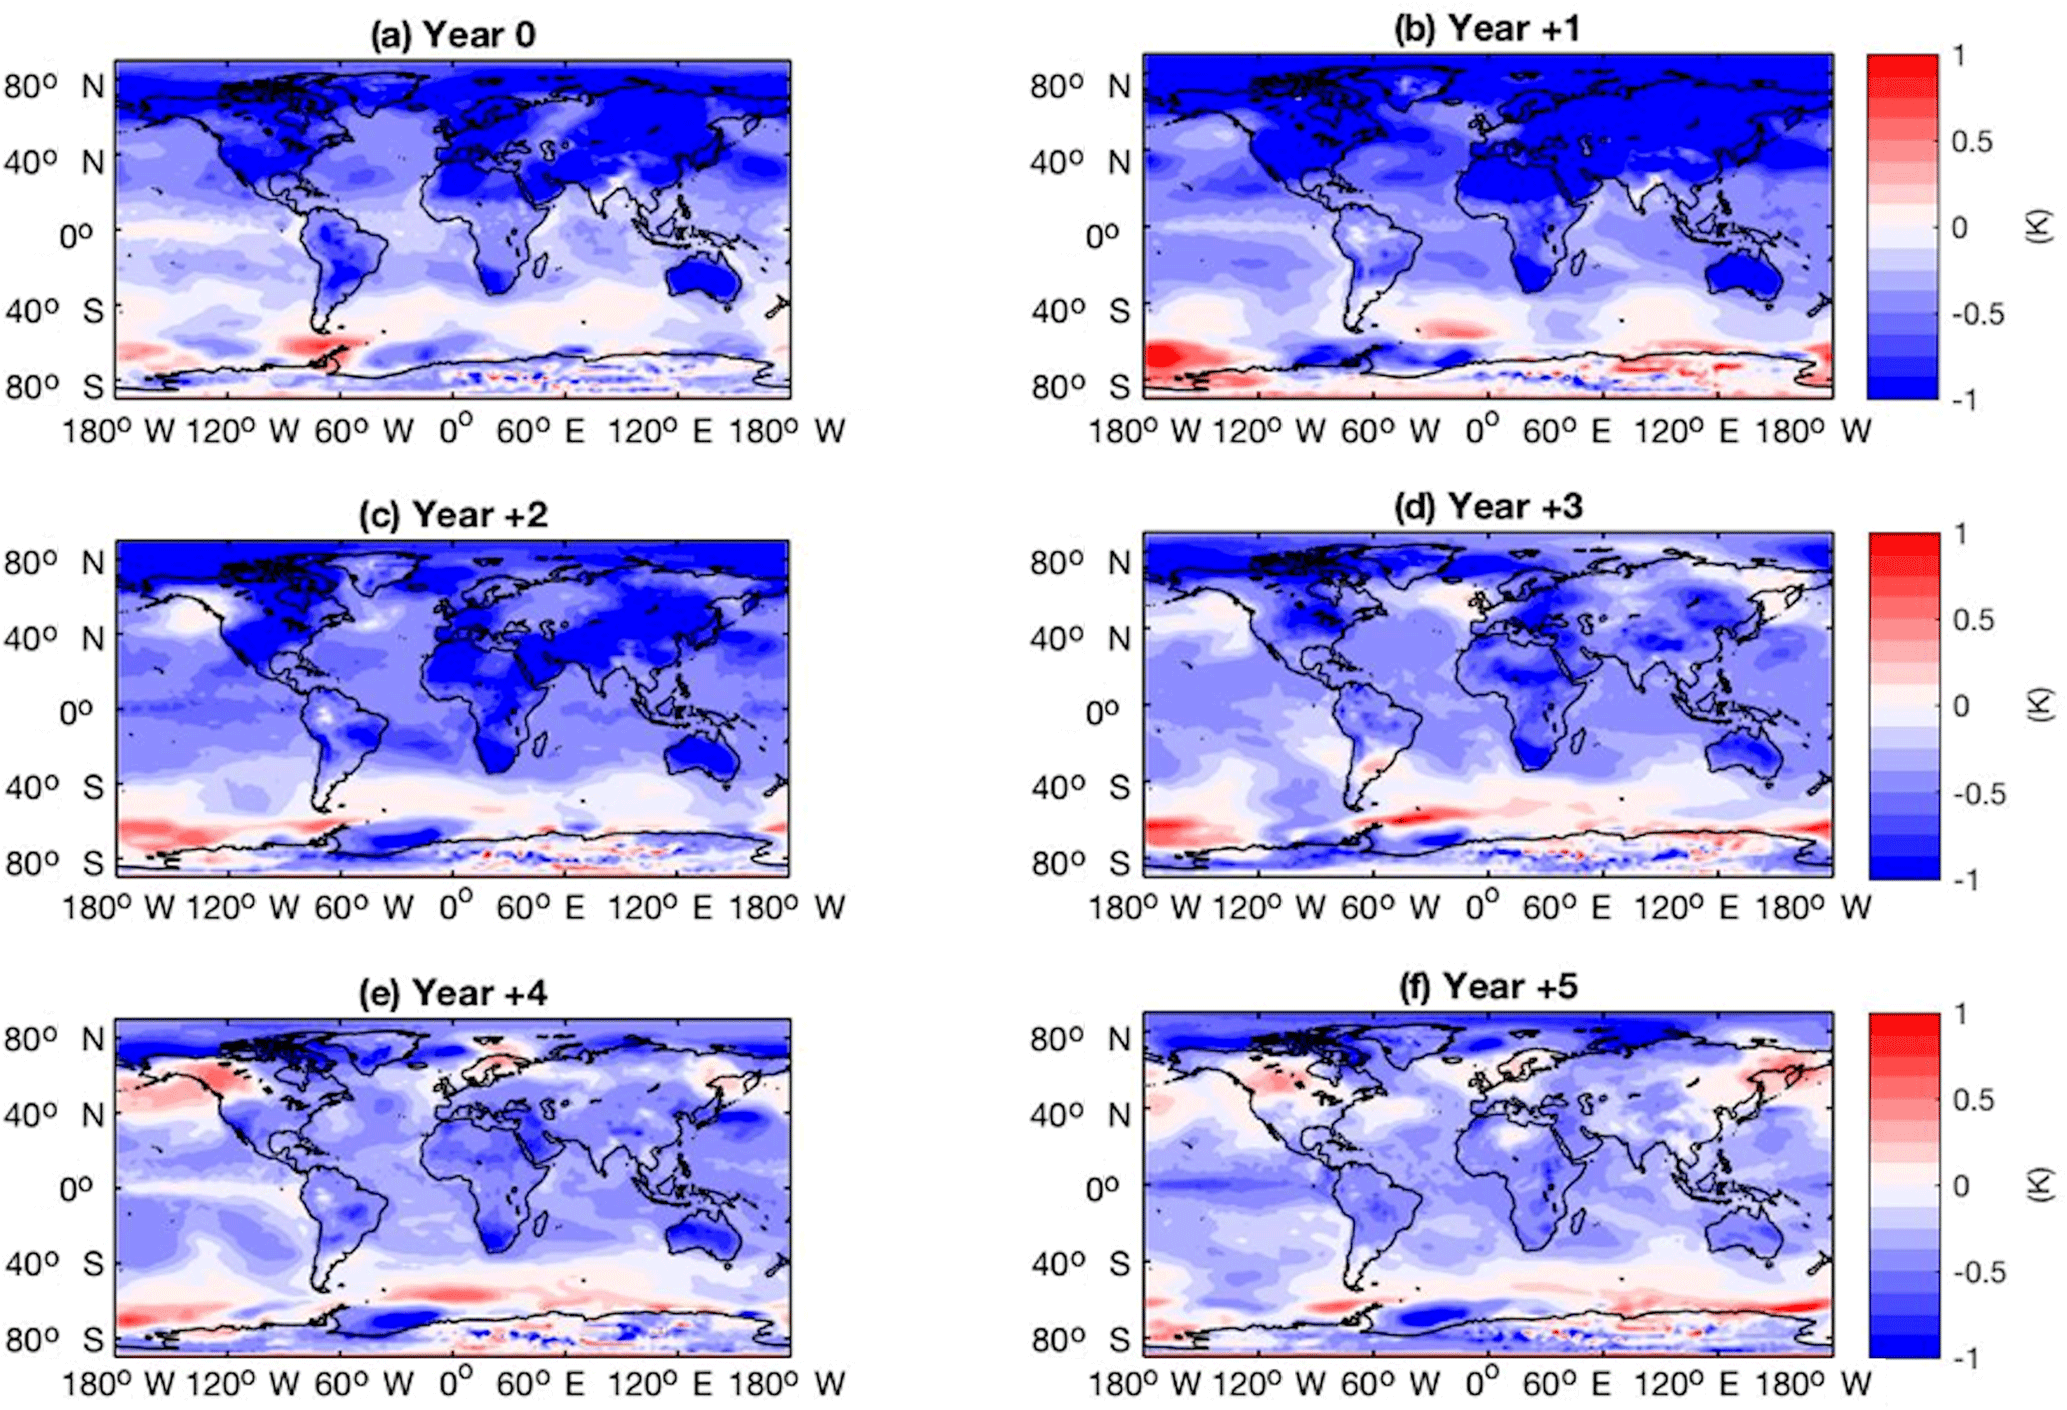
Figure 3Global SST anomalies (K) in response to the CR forcings, showing multi-ensemble mean response over JASON averaged across all analysed eruptions for years 0 to +5 after eruption.
One ambiguity with this statistical test is that the anomaly of the “None” ensemble doesn't directly correspond in time to the anomaly of the volcanic simulations. As an alternative test, which only uses the volcanic ensemble, we calculated the likelihood that unforced variability could result in an anomaly relative to the five year average prior to eruption (Ruxton, 2006). An anomaly magnitude exceeding 0.49 standard deviations results from unforced variability in the CR simulations only 5 % of the time, indicating that our applied threshold is conservative. More generally, these statistical tests should be viewed as a guide rather than an intrinsic boundary for distinguishing post-eruption anomalies from unforced variations; this is due to the subjectively chosen threshold of significance (here, 5 %) and assumptions inherent to each test.
The global SST response for the CR forcing group predominantly shows surface cooling anomalies (Fig. 3). More specifically, cooling occurs in the Northern Hemisphere from years 0 to 3, while the south Atlantic, Indian, and Pacific oceans show mostly minor warming. The uniform reduction and redistribution of surface temperature causes an El Niño-like warming temperature gradient in years 0, 1, and 4 post eruption. In the Southern Hemisphere, cooling is most pronounced over land masses, particularly Australia and the southern tip of Africa.
The DMI response showed a significant pIOD condition one year after major eruptions in all volcanically forced ensembles that persists from year +1 to +4, followed by an abrupt negative IOD (nIOD) in year +5 (Fig. 4). This response can also be seen in Fig. 3, where the EIO region shows larger and more widespread cooling anomalies than the WIO region in years 1, 2, and 4. This response contrasts to the non-volcanically forced ensembles, which show neither a prolonged pIOD nor nIOD condition.
The response of the DMI to the largest and smallest eruptions were also extracted. Figure 5 show the mean DMI response to the 1258 Samalas eruption (257.91 Tg) and the 1600 Huaynaptina eruption (56.59 Tg). Our results show that while both eruptions caused a significant simulated pIOD at year 1, the larger 1258 Samalas eruption persisted with a significant pIOD condition in years 2 and 4, while the 1600 Huaynaptina eruption did not.
The mean NINO3.4 multi-volcano response to ensemble forcing showed a statistically significant El Niño-like response for all 6 years following eruption, with a peak at year 3 in both the CR and 2 × G ensembles (Fig. 6). The non-volcanically forced ensemble group showed neither a significant El Niño nor La Niña tendency, with the NINO3.4 index remaining within . The index also showed an increase in the intensity and endurance of post-volcanic El Niño events between the Samalas and Huaynaptina eruptions (Fig. 7). The Samalas eruption was followed by an El Niño that endured for 3 years, from years 1 to 3, peaking at a NINO3.4 anomaly of 0.68 in year 3, while Huaynaptina peaked at 0.53 in year 2 from an El Niño that endured for 2 years.
Figure 8 shows the mean precipitation response of all volcanically forced ensembles. Precipitation deficits can be seen in the tropics in years 0–2, the most substantial and widespread of which occur in the Asian monsoonal area and the western Pacific Basin. Bands of decreased precipitation also occur at approximately 40∘ S, between 0 and 40∘ N in the North Atlantic Ocean and between 40 and 80∘ N over northern America and Europe. The Southern Hemisphere subtropics appear to have a slight increase in precipitation in years 0–2, most prominently over Australia and southernmost Africa, while the southern polar region (60–90∘ S) shows only variable minor precipitation anomalies occurring in all 6 years post eruption.
Ensembles with volcanic forcing showed an increase in precipitation over south-east (Fig. 11) and north-west (Fig. 9) Australia between JASON. Both areas showed predominantly positive anomalies in years 0–4 post-eruption, with the largest response seen between years 0 and 2. Southeastern Australia also showed large positive precipitation anomalies in year −1 resulting from unforced variability. Northwestern Australia (Fig. 9) displayed larger positive precipitation anomalies between years 0 and 2 than SE Australia (Fig. 11) in the CR ensemble mean, and in years 0 and 2 in the 2 × G ensemble mean.
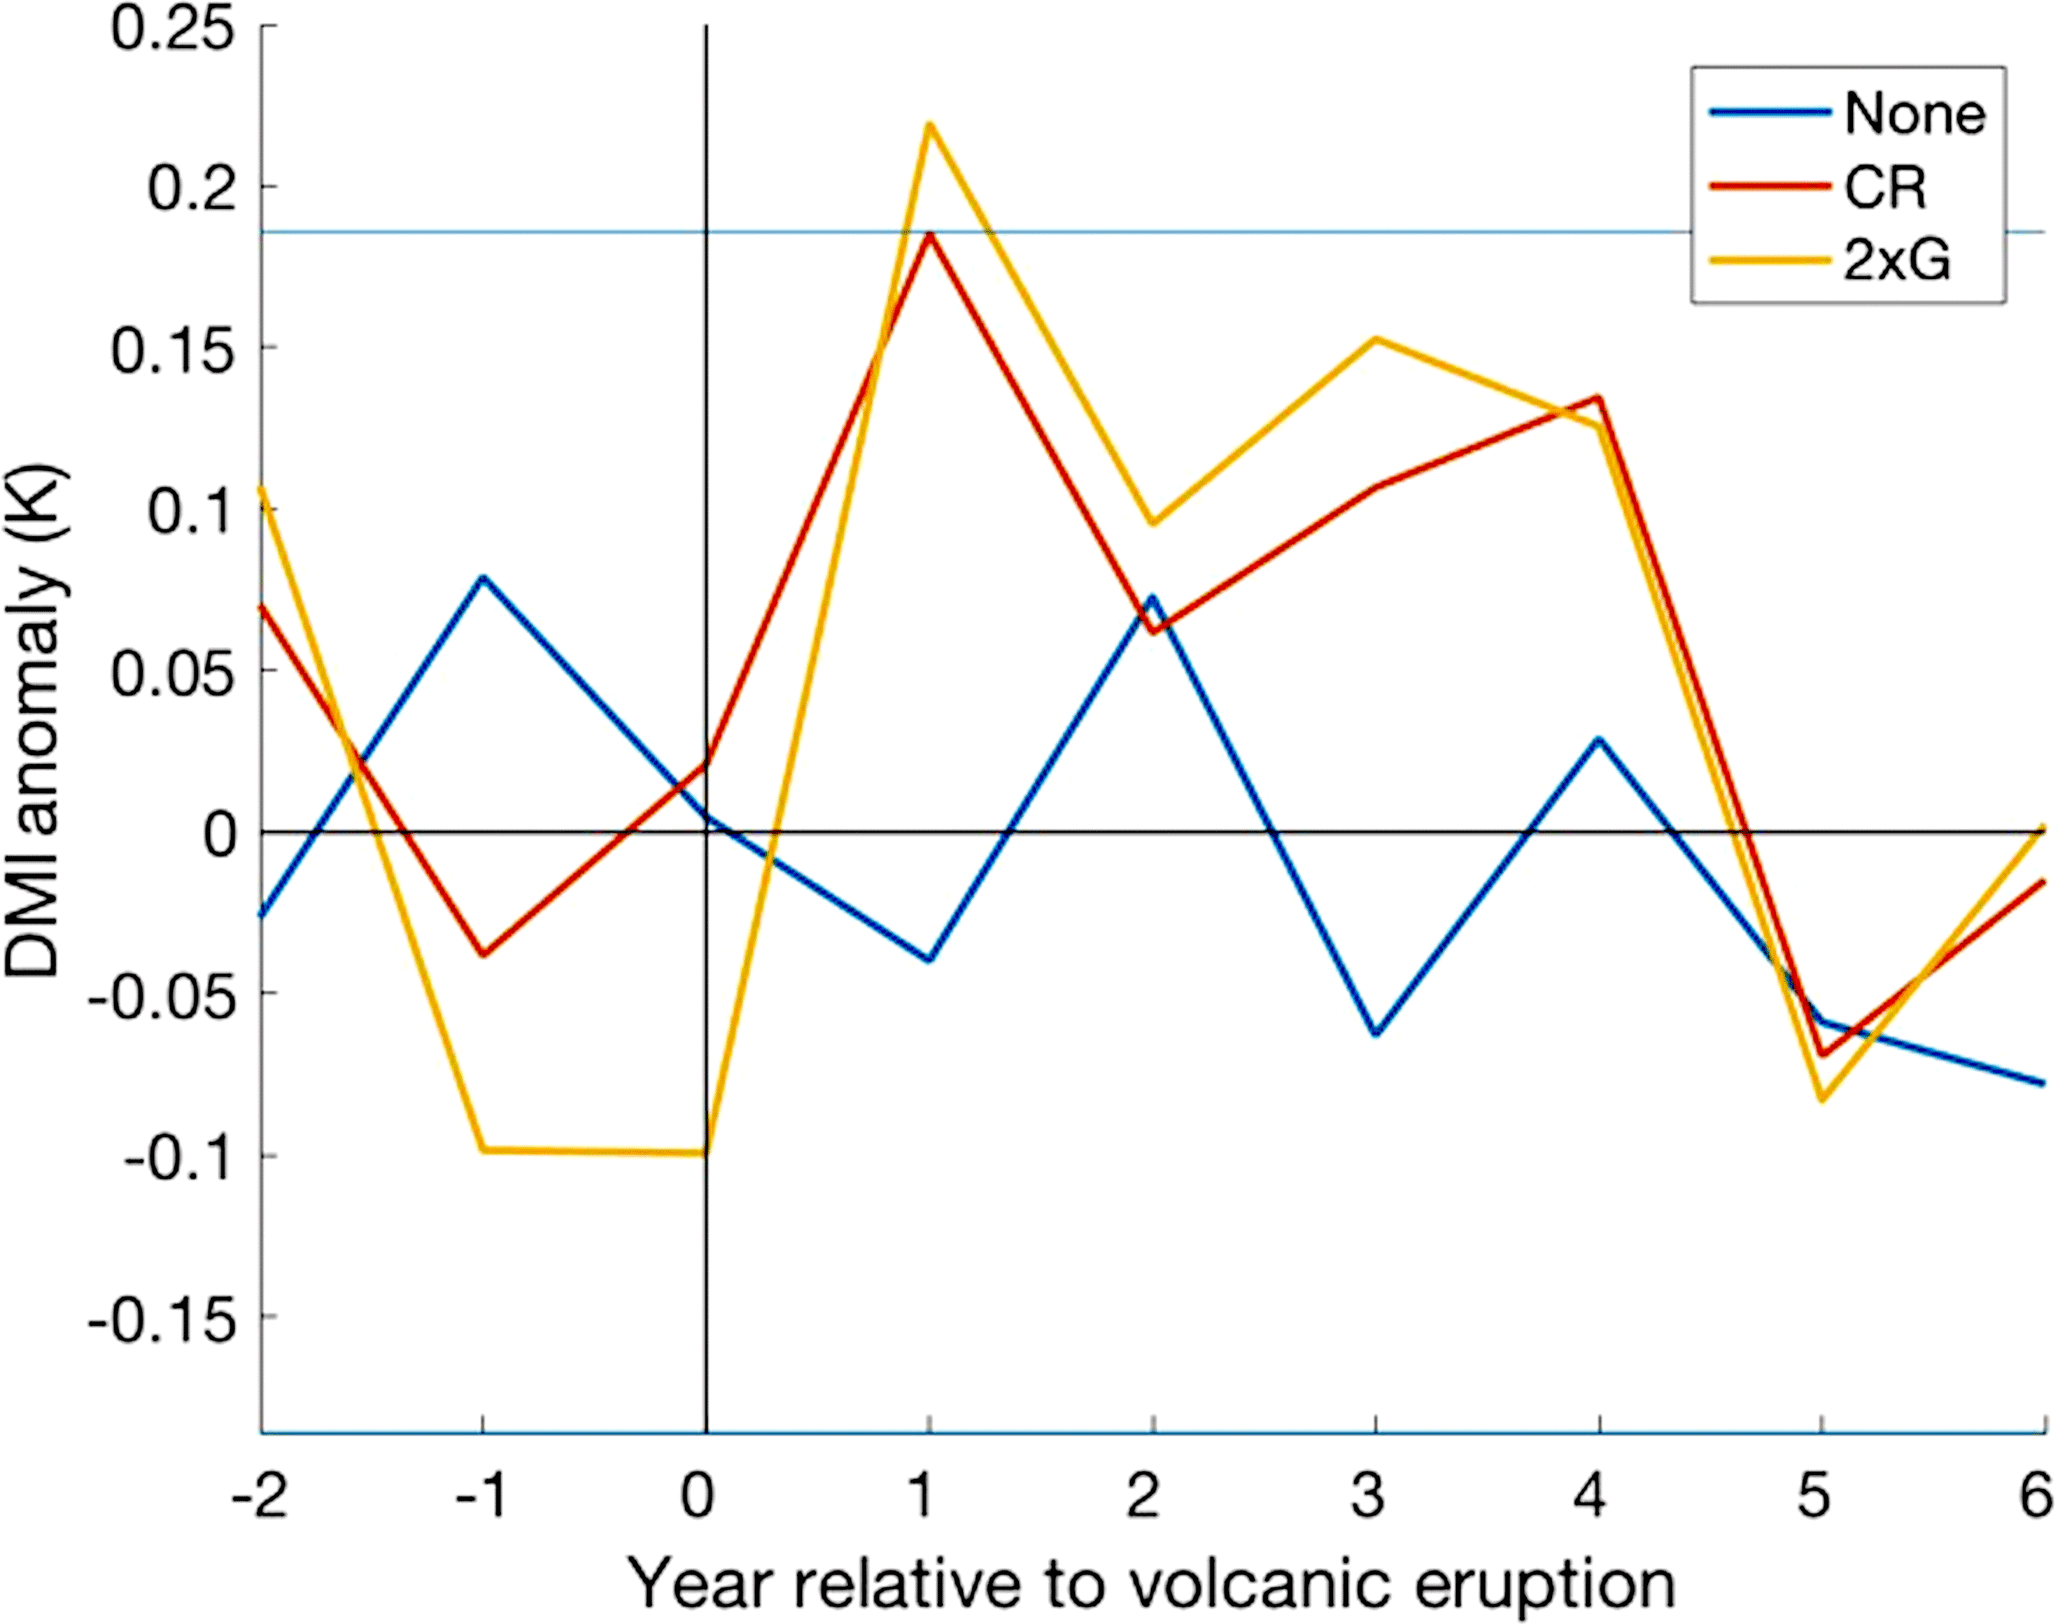
Figure 4Multi-ensemble and multi-volcano mean DMI (dipole mode index) response to CR and “None” forcing groups and multi-volcano mean DMI response to the 2 × G forcing group over July–November (JASON). Significance was tested using the 0.6 standard deviation threshold (horizontal blue lines), and by comparing the CR and 2 × G ensembles to those without volcanic forcing.
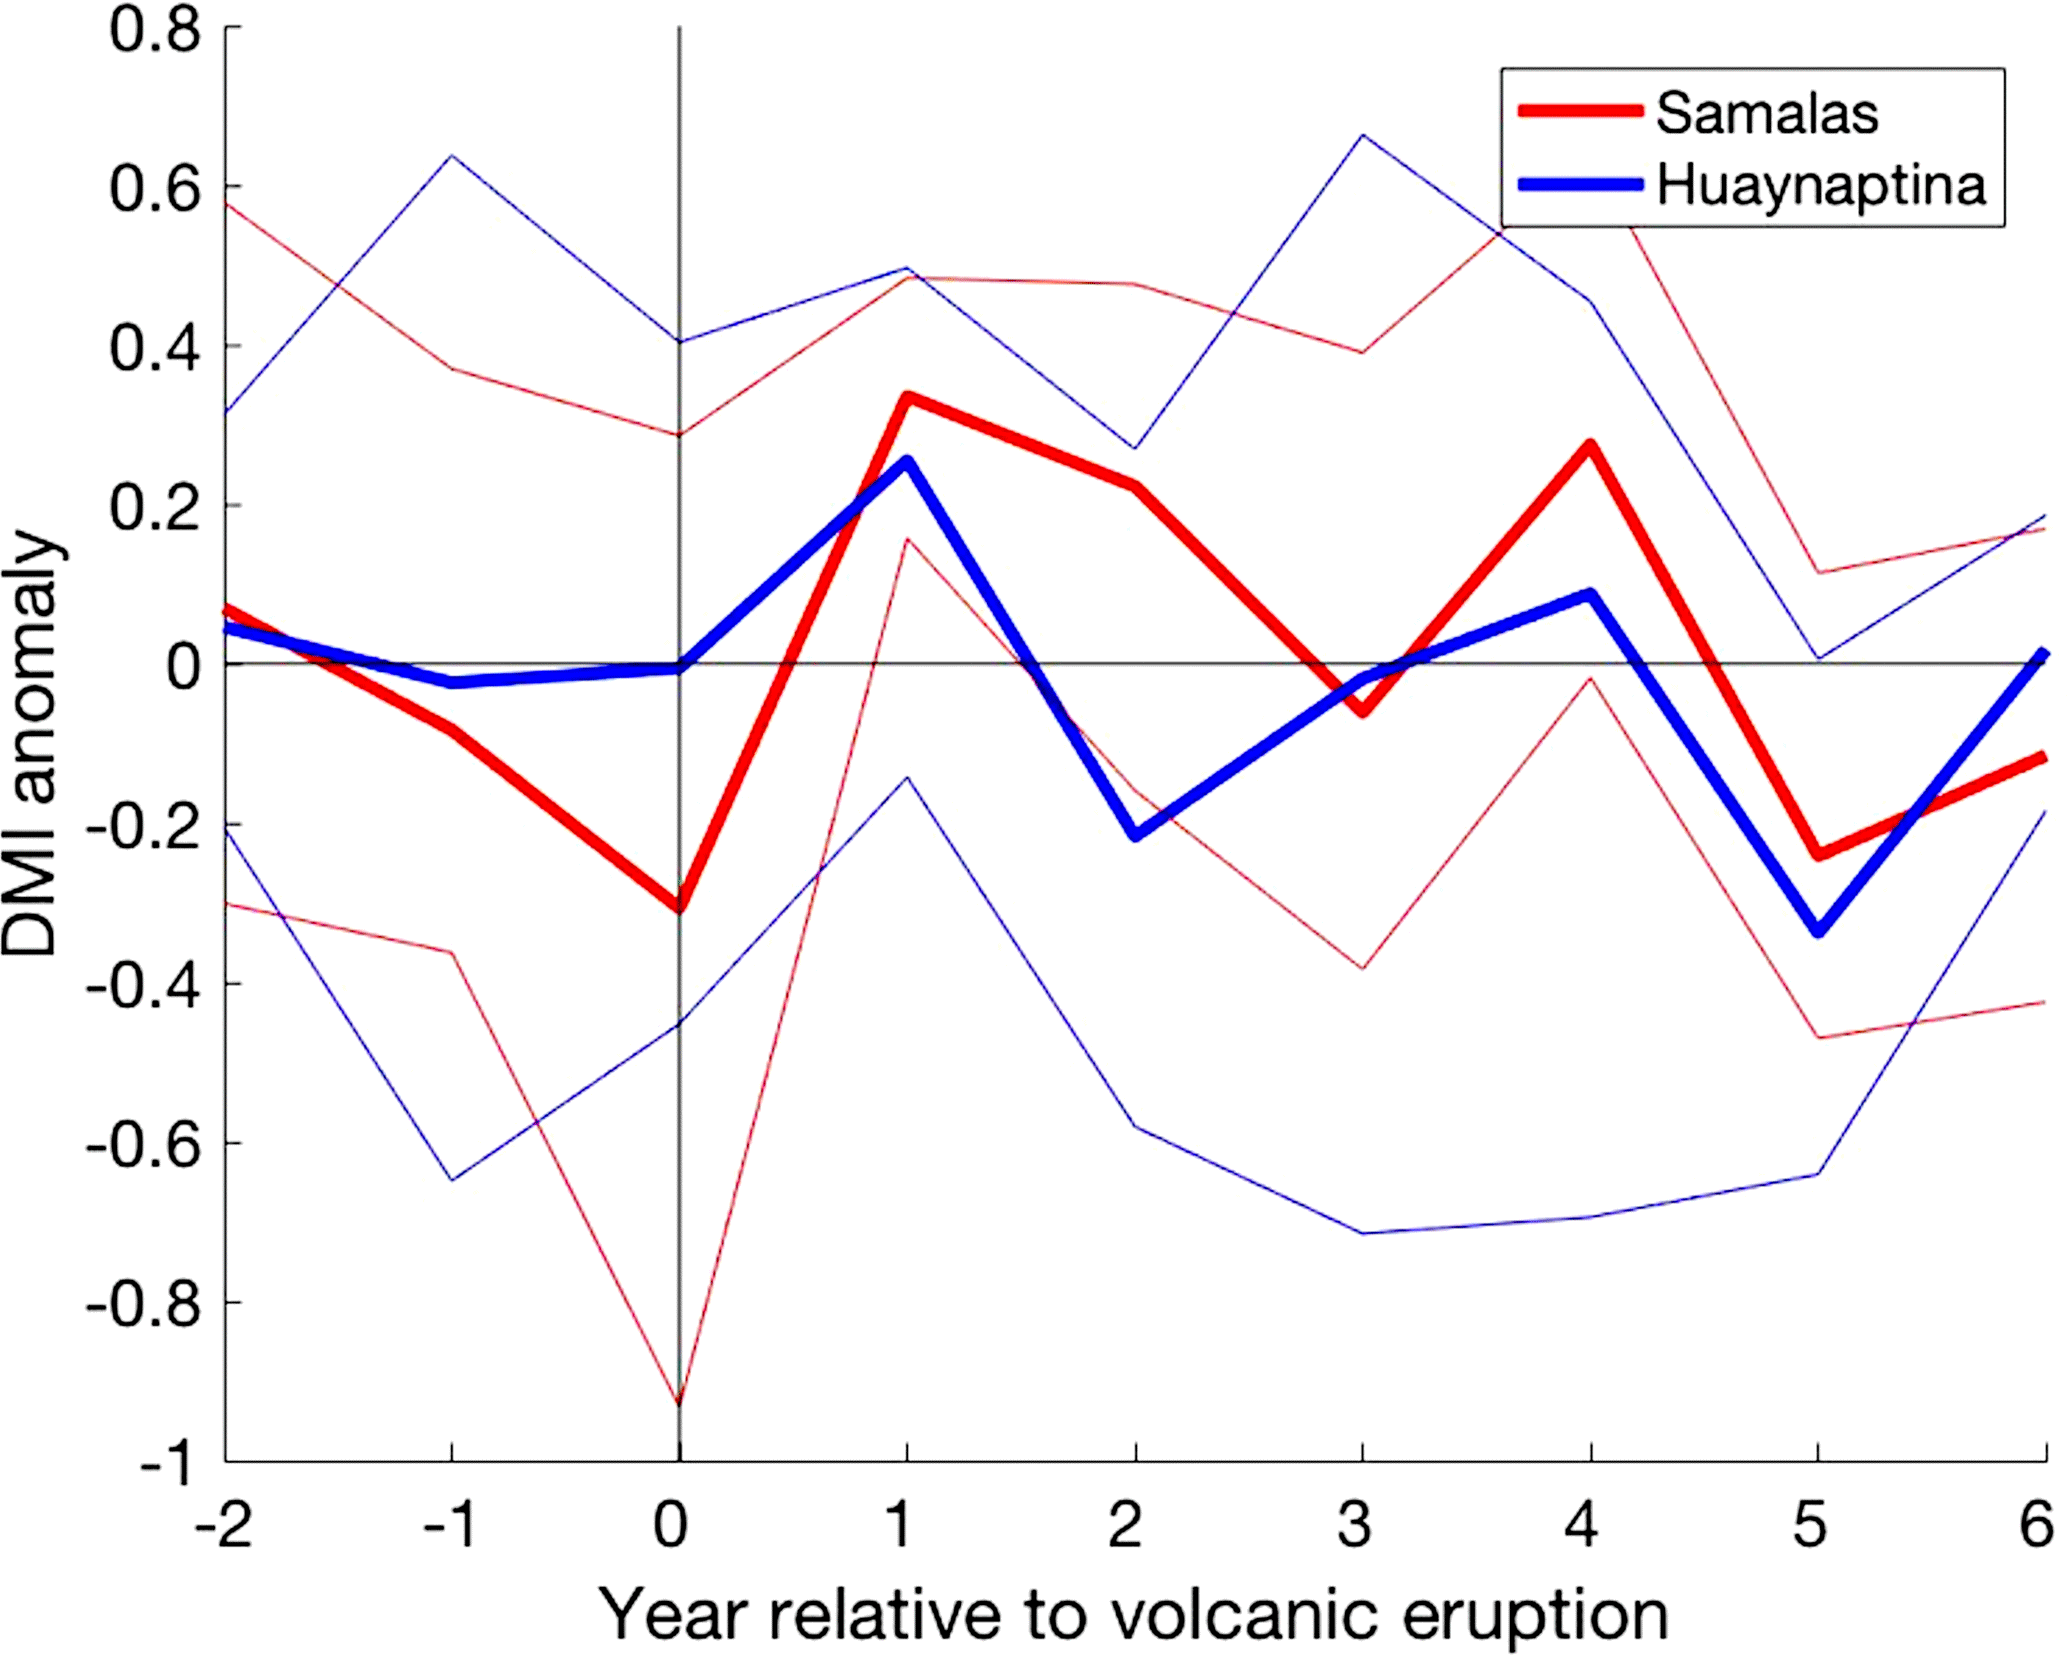
Figure 5Mean DMI response of all volcanic ensembles (four CR ensembles and one 2 × G ensemble) to the largest (1258 Samalas) and smallest (1600 Huaynaputina) eruptions analysed over JASON. The bold lines represent the mean of all volcanic ensembles to each eruption, and the fainter lines represent the 90th and 10th percentile of the ensemble members.
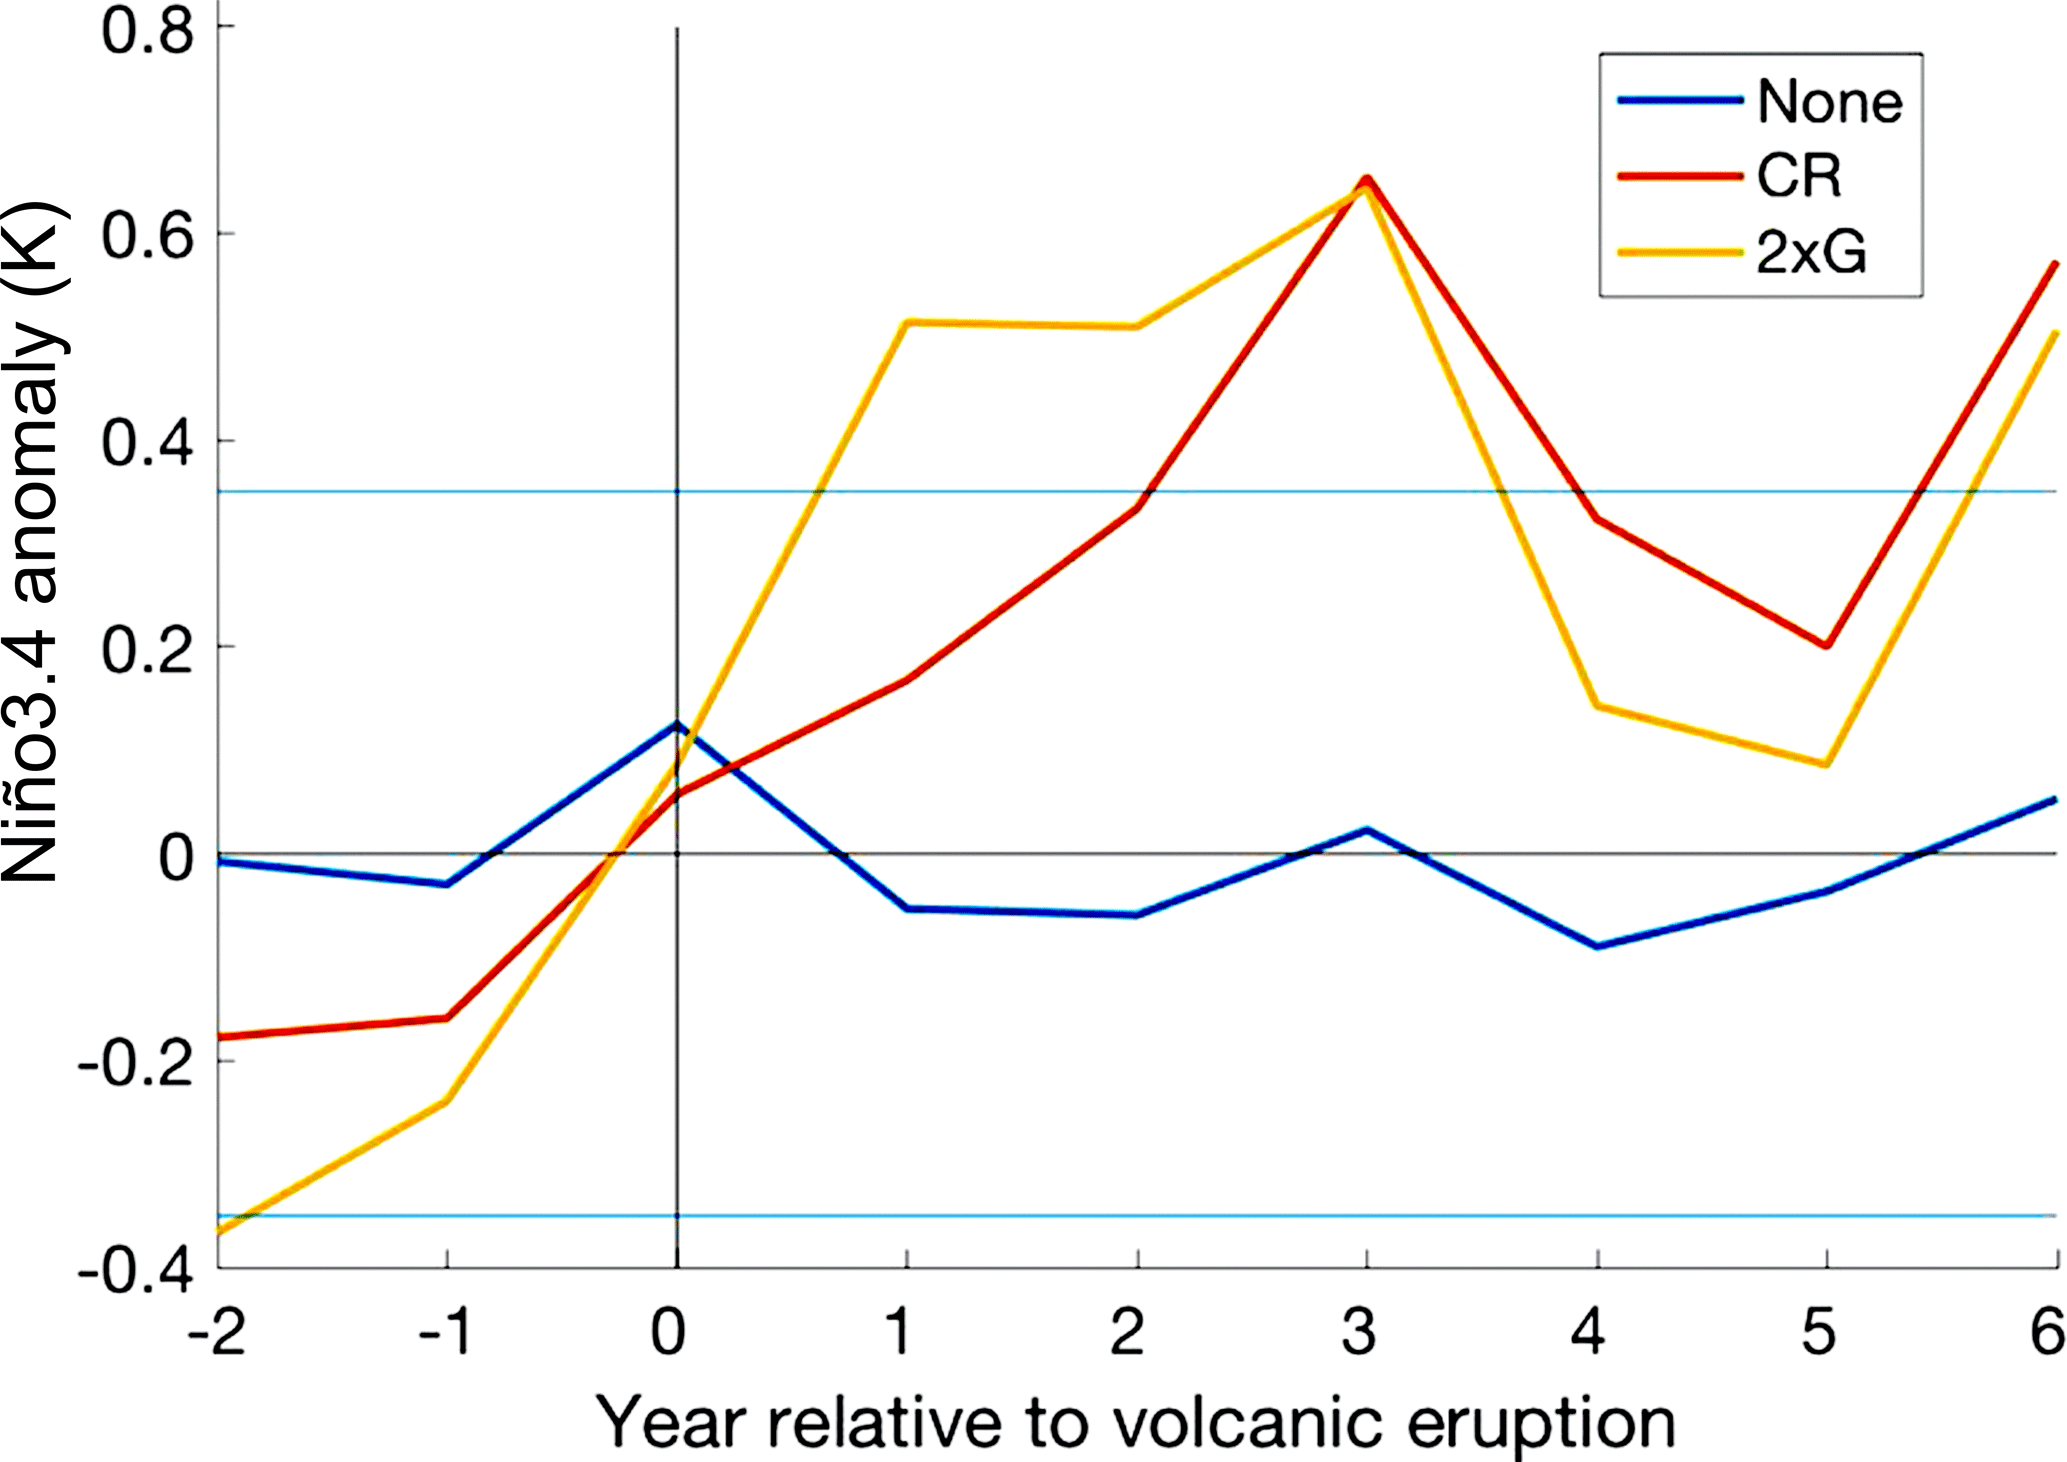
Figure 6Multi-ensemble and multi-volcano mean NINO3.4 response to CR and “None” ensemble forcing groups and multi-volcano mean DMI response to the 2 × G forcing group over DJF. Significance was tested using the 0.6 standard deviation threshold (horizontal blue lines), and by comparing the CR and 2 × G ensembles to those without volcanic forcing.

Figure 7Mean NINO3.4 response of all volcanic ensembles (four CR ensembles and one 2 × G ensemble) to the largest (1258 Samalas) and smallest (1600 Huaynaputina) eruptions analysed over DJF. The bold lines represent the mean of all volcanic ensembles to each eruption, and the fainter lines represent the 90th and 10th percentile of the ensemble members.
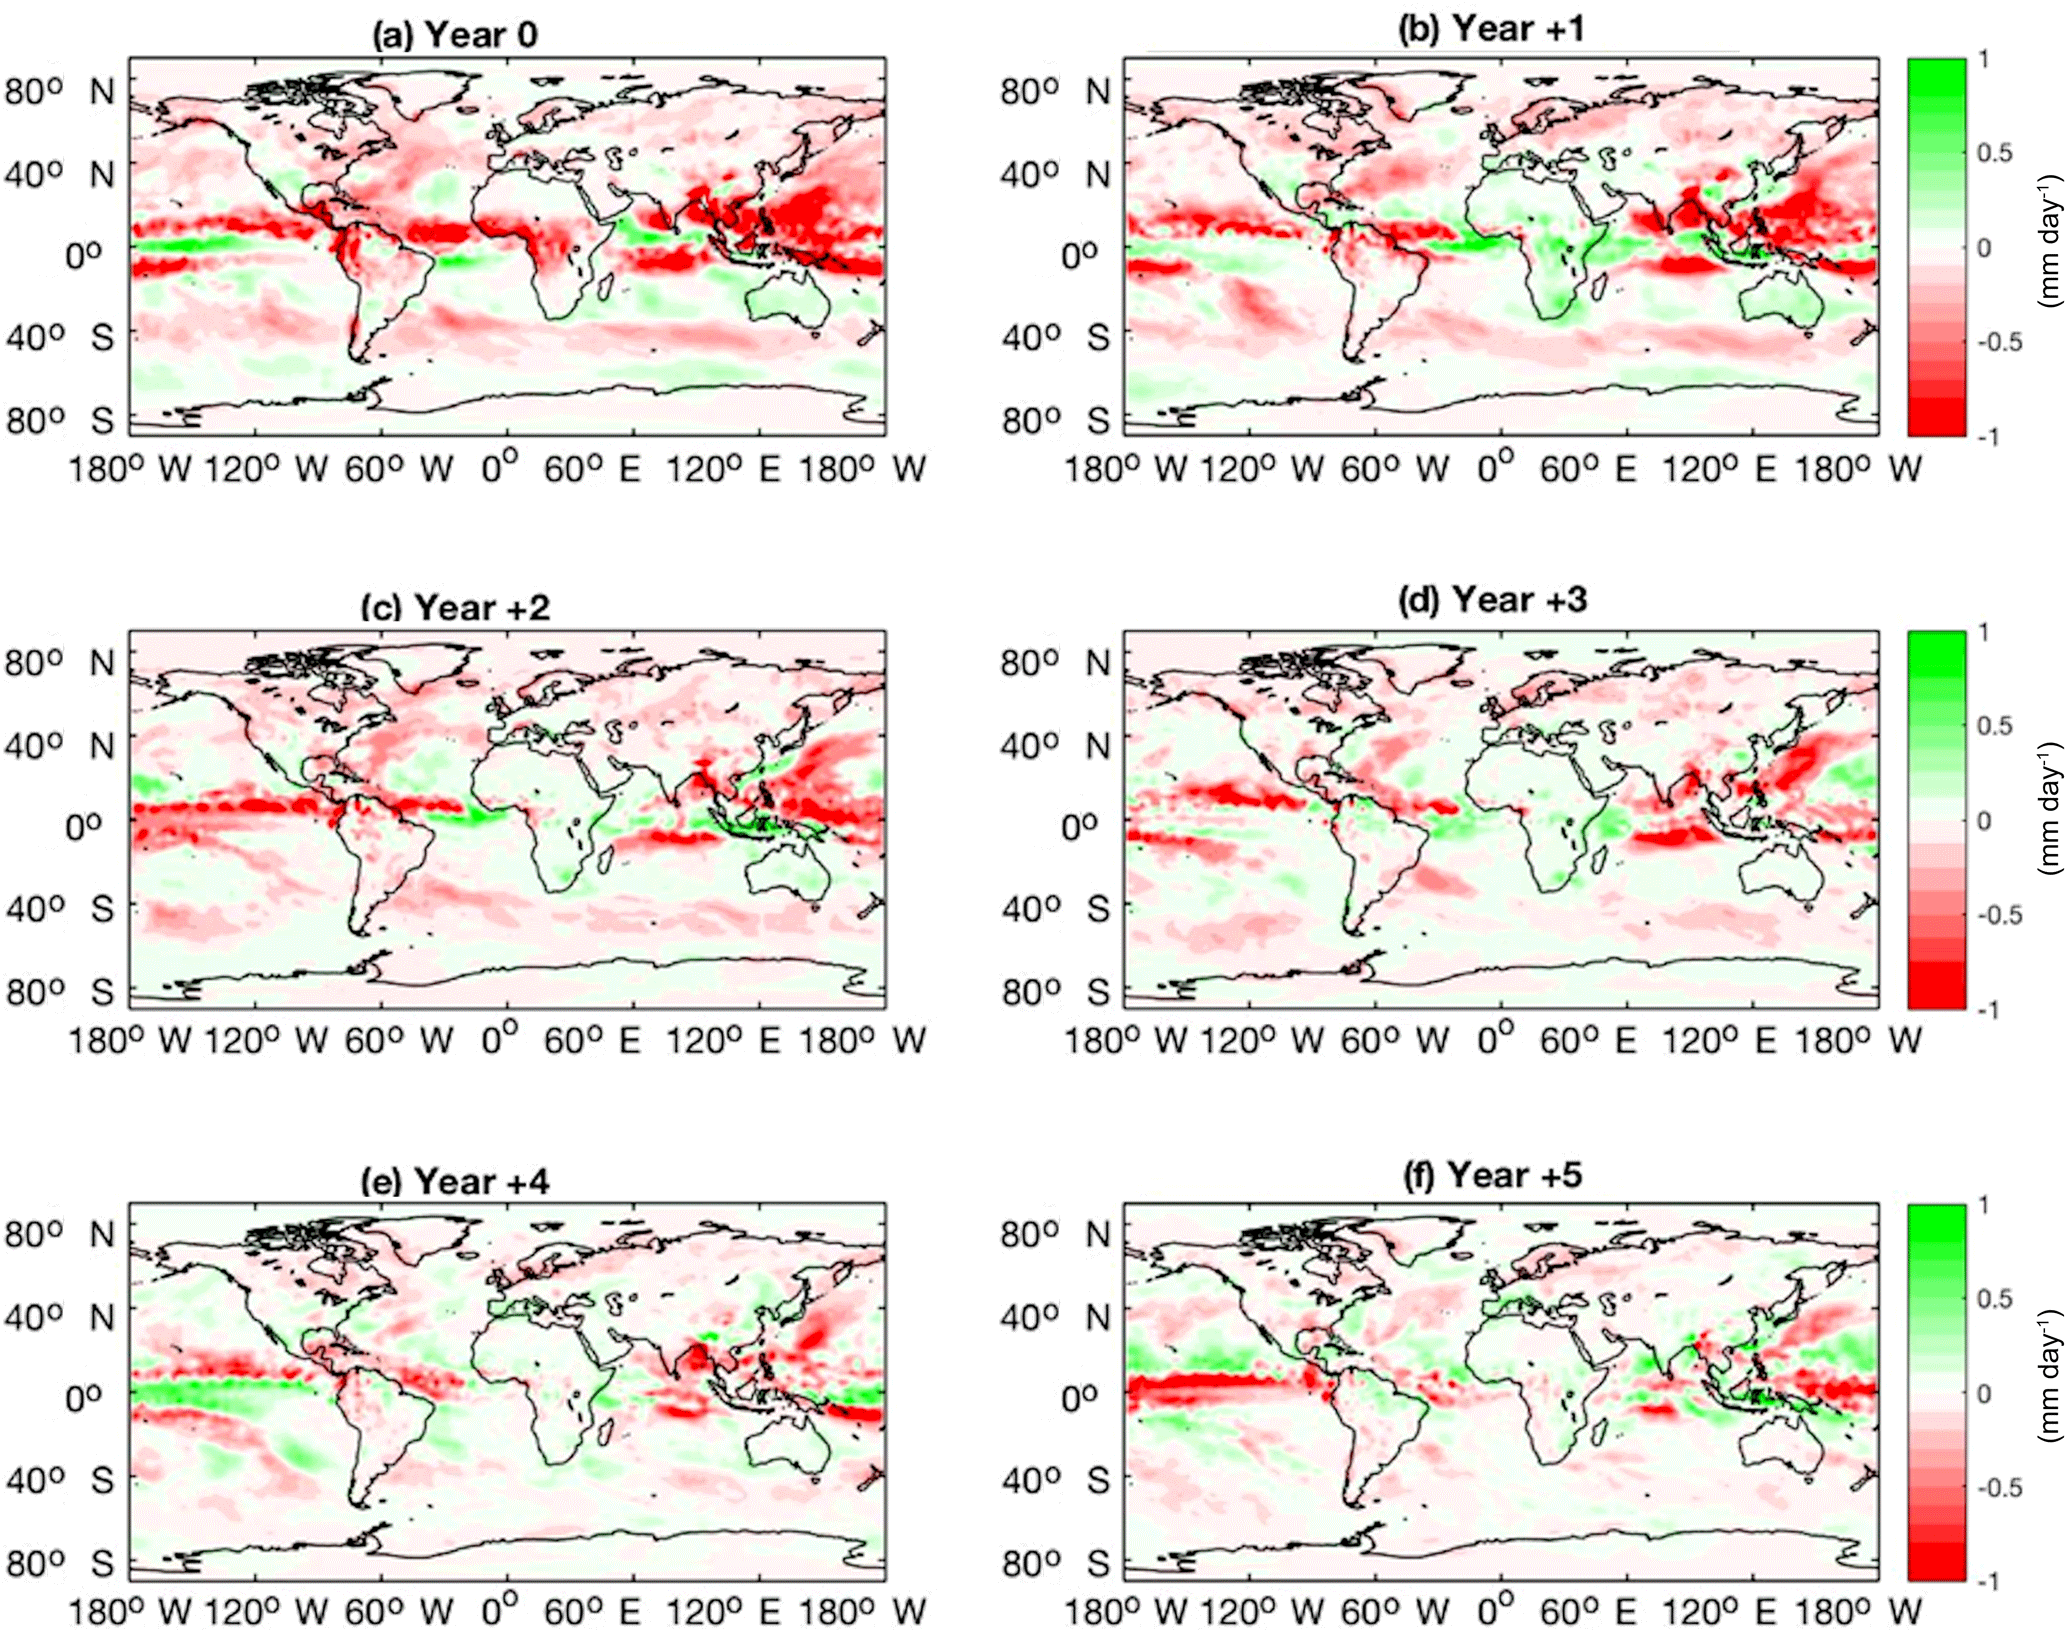
Figure 8Global precipitation anomalies (mm day−1) in response to the Crowley and Unterman (CR) forcing, showing multi-ensemble mean responses over JASON averaged across all analysed eruptions for years 0 to +5 after eruption.
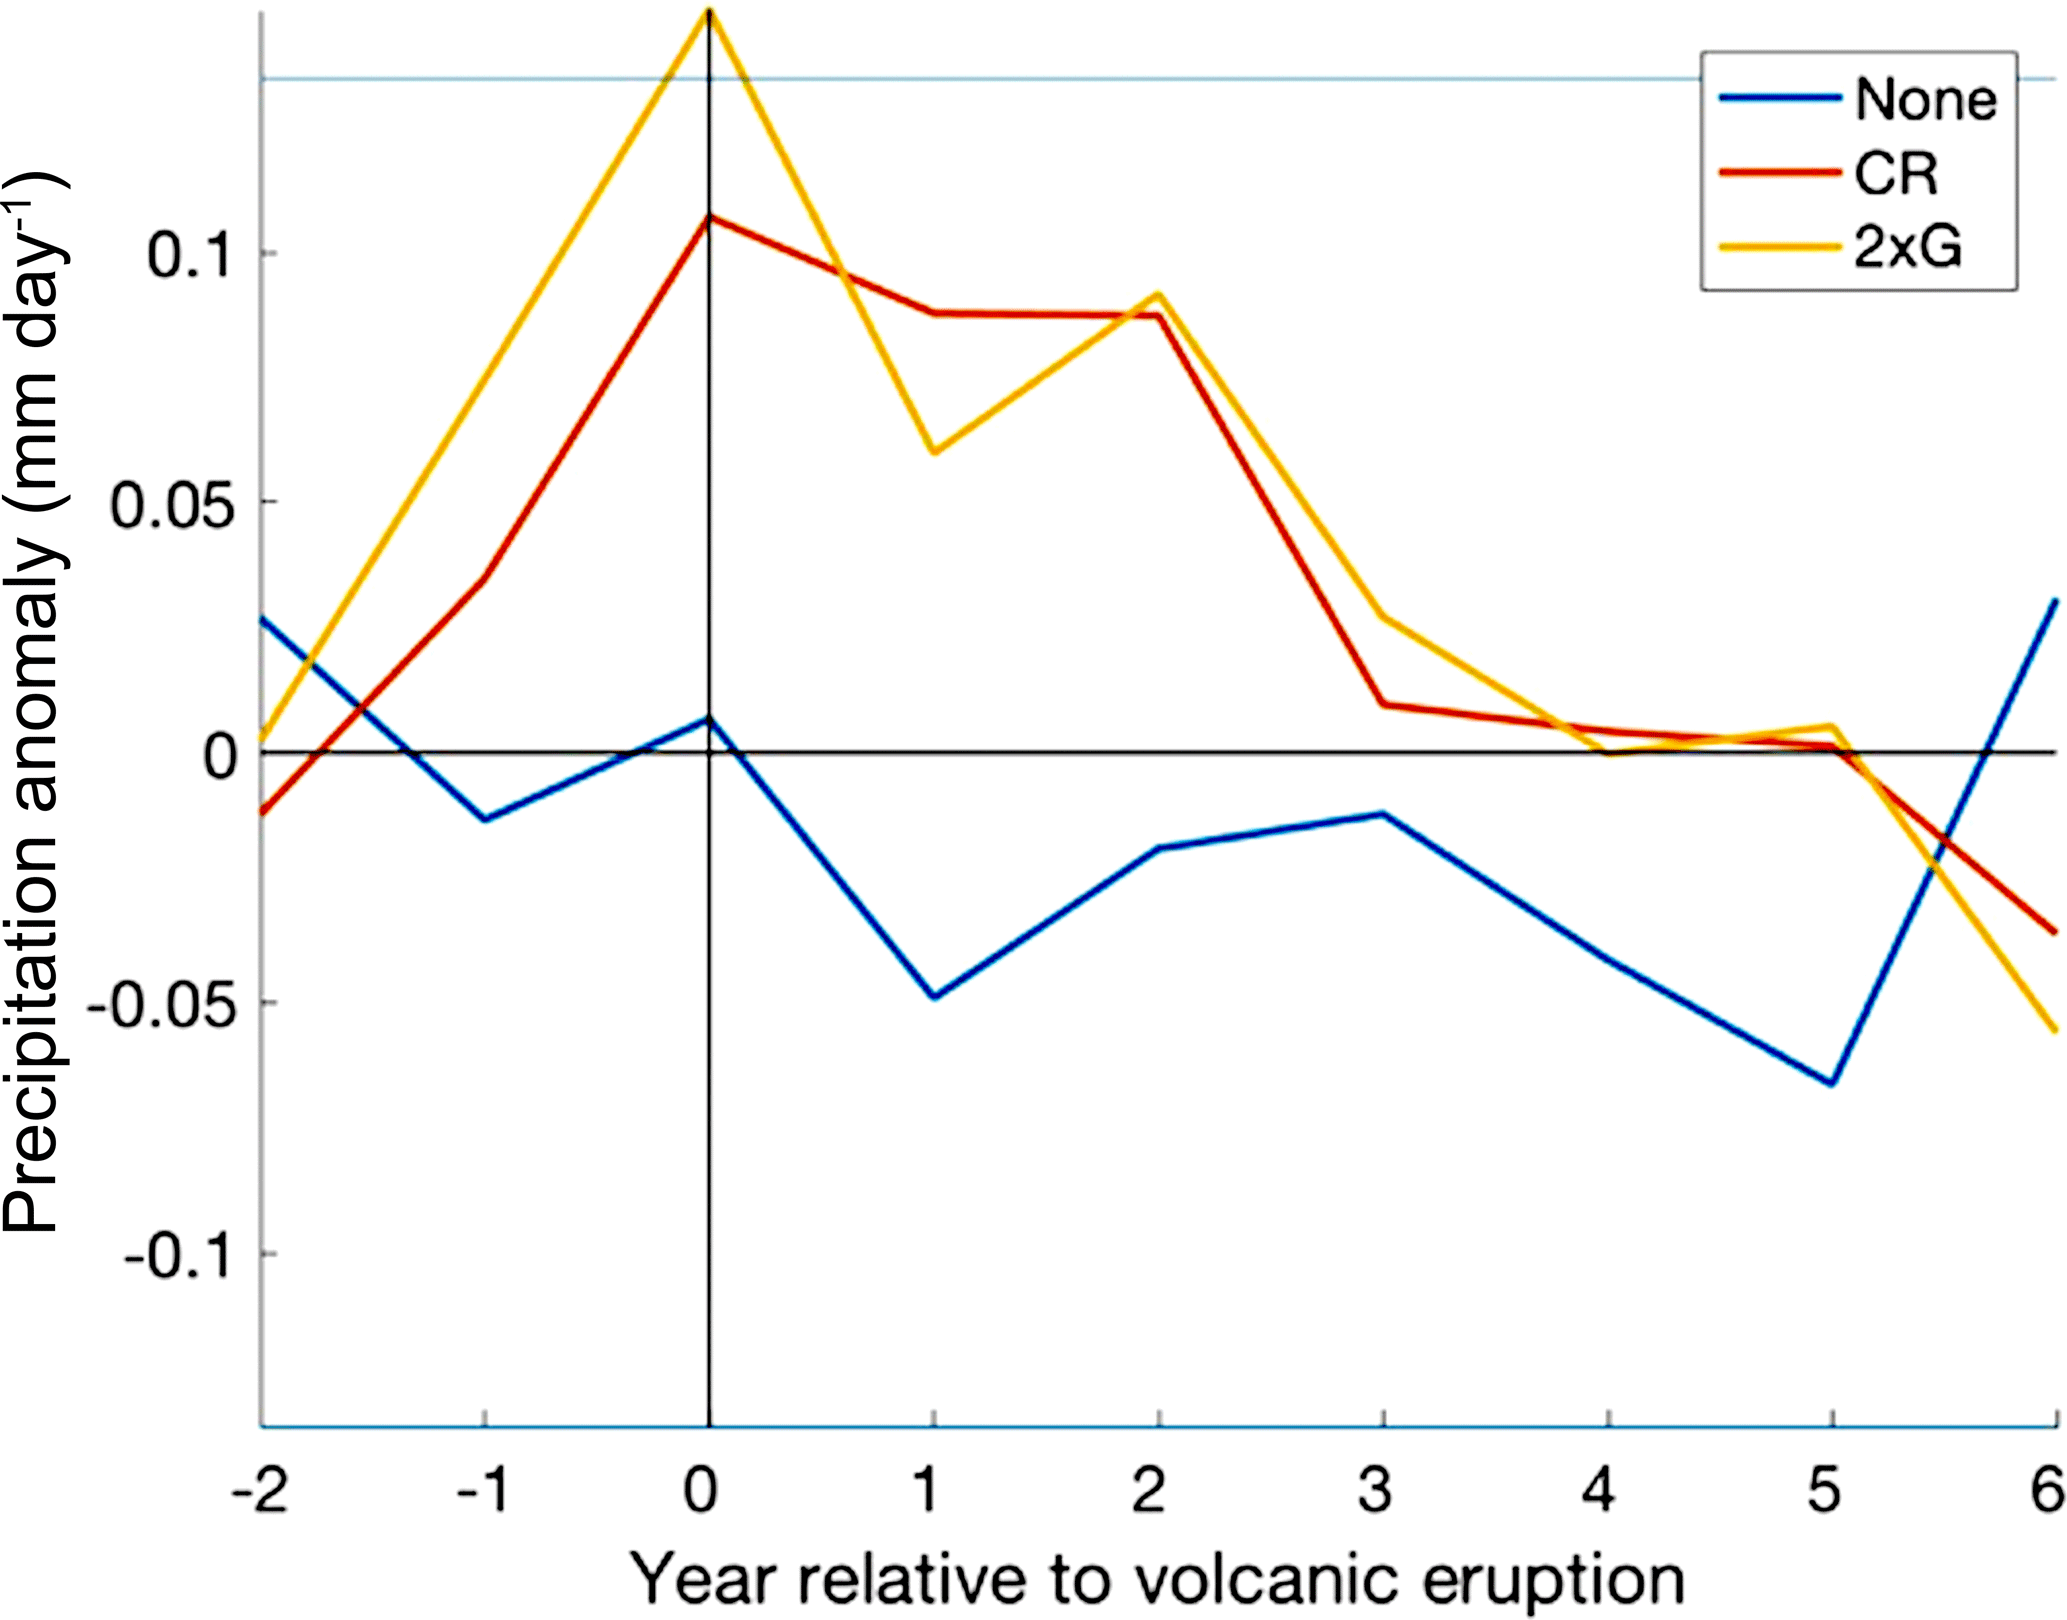
Figure 9Multi-ensemble and multi-volcano mean NW Australian precipitation (mm day−1) response to CR and “None” forcing groups and multi-volcano mean to the 2 × G forcing group in the eight years surrounding eruption over JASON. Significance was tested using the 0.6 standard deviation threshold (horizontal blue lines), and by comparing the CR and 2 × G ensembles to those without volcanic forcing.
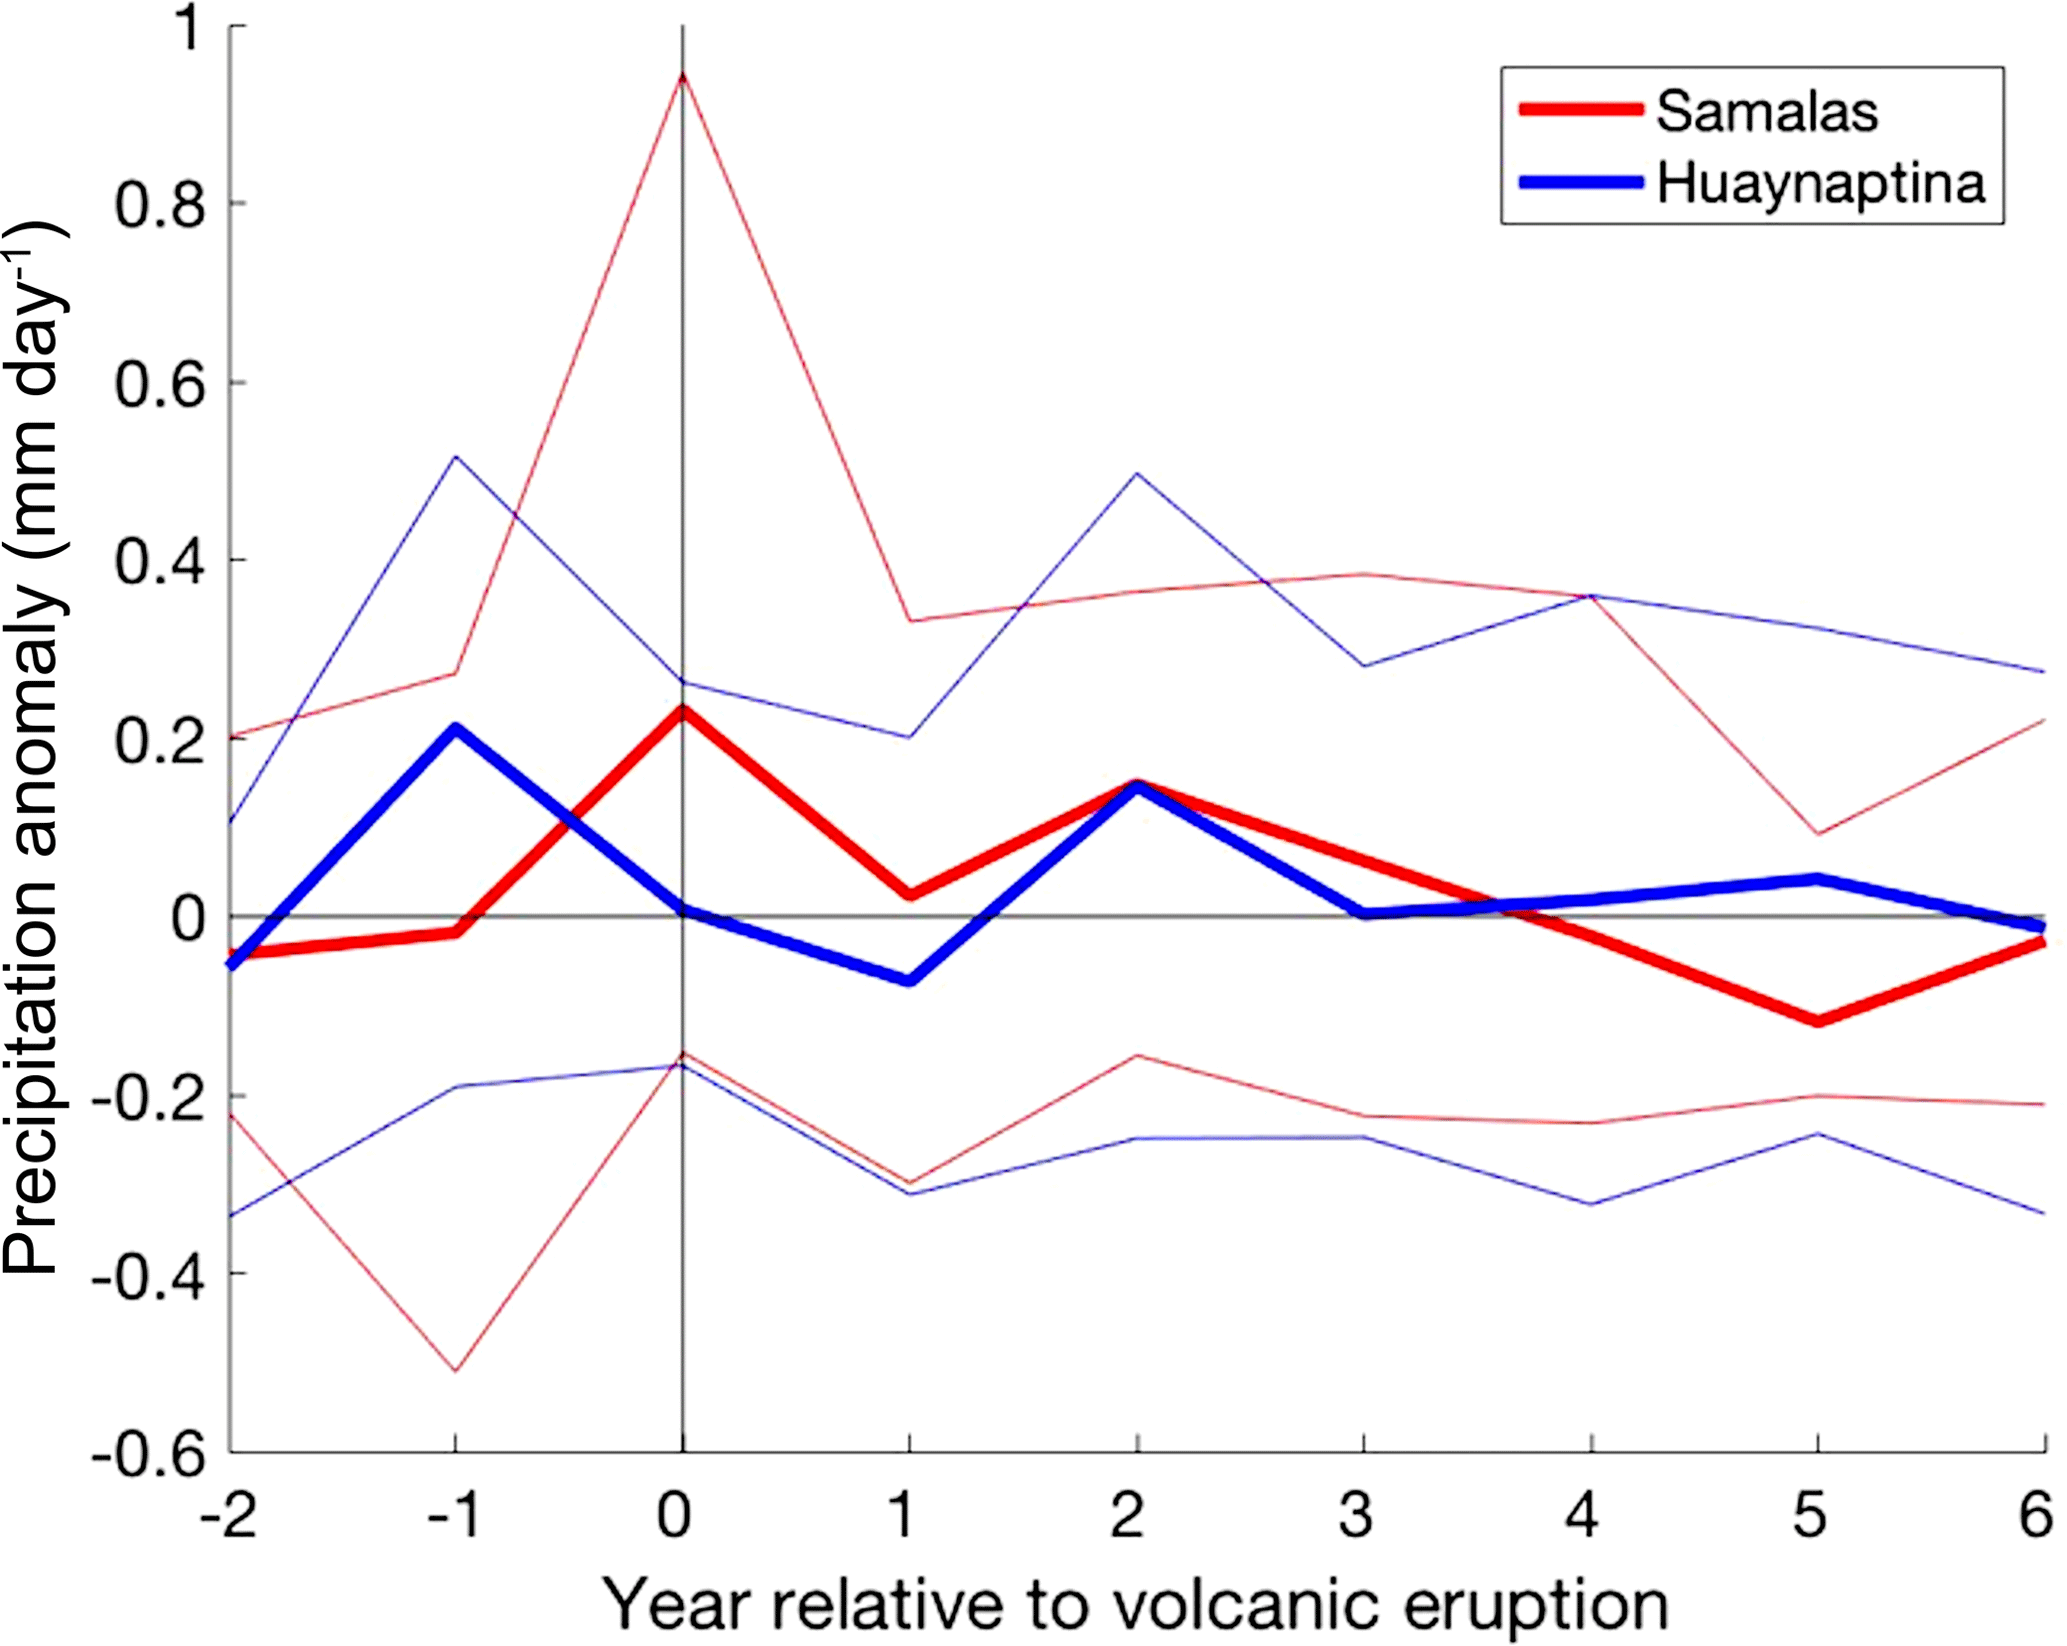
Figure 10Mean NW Australian precipitation (mm day−1) response of all volcanic ensembles (four CR ensembles and one 2 × G ensemble) to the largest (1258 Samalas) and smallest (1600 Huaynaputina) eruptions analysed over JASON. The bold lines represent the mean of all volcanic ensembles to each eruption, and the fainter lines represent the 90th and 10th percentile of the ensemble members.

Figure 11Multi-ensemble and multi-volcano mean SE Australian precipitation (mm day−1) response to CR and “None” forcing groups and multi-volcano mean to the 2 × G forcing group in the eight years surrounding eruption over JASON. Significance was tested using the 0.6 standard deviation threshold (horizontal blue lines), and by comparing the CR and 2 × G ensembles to those without volcanic forcing.
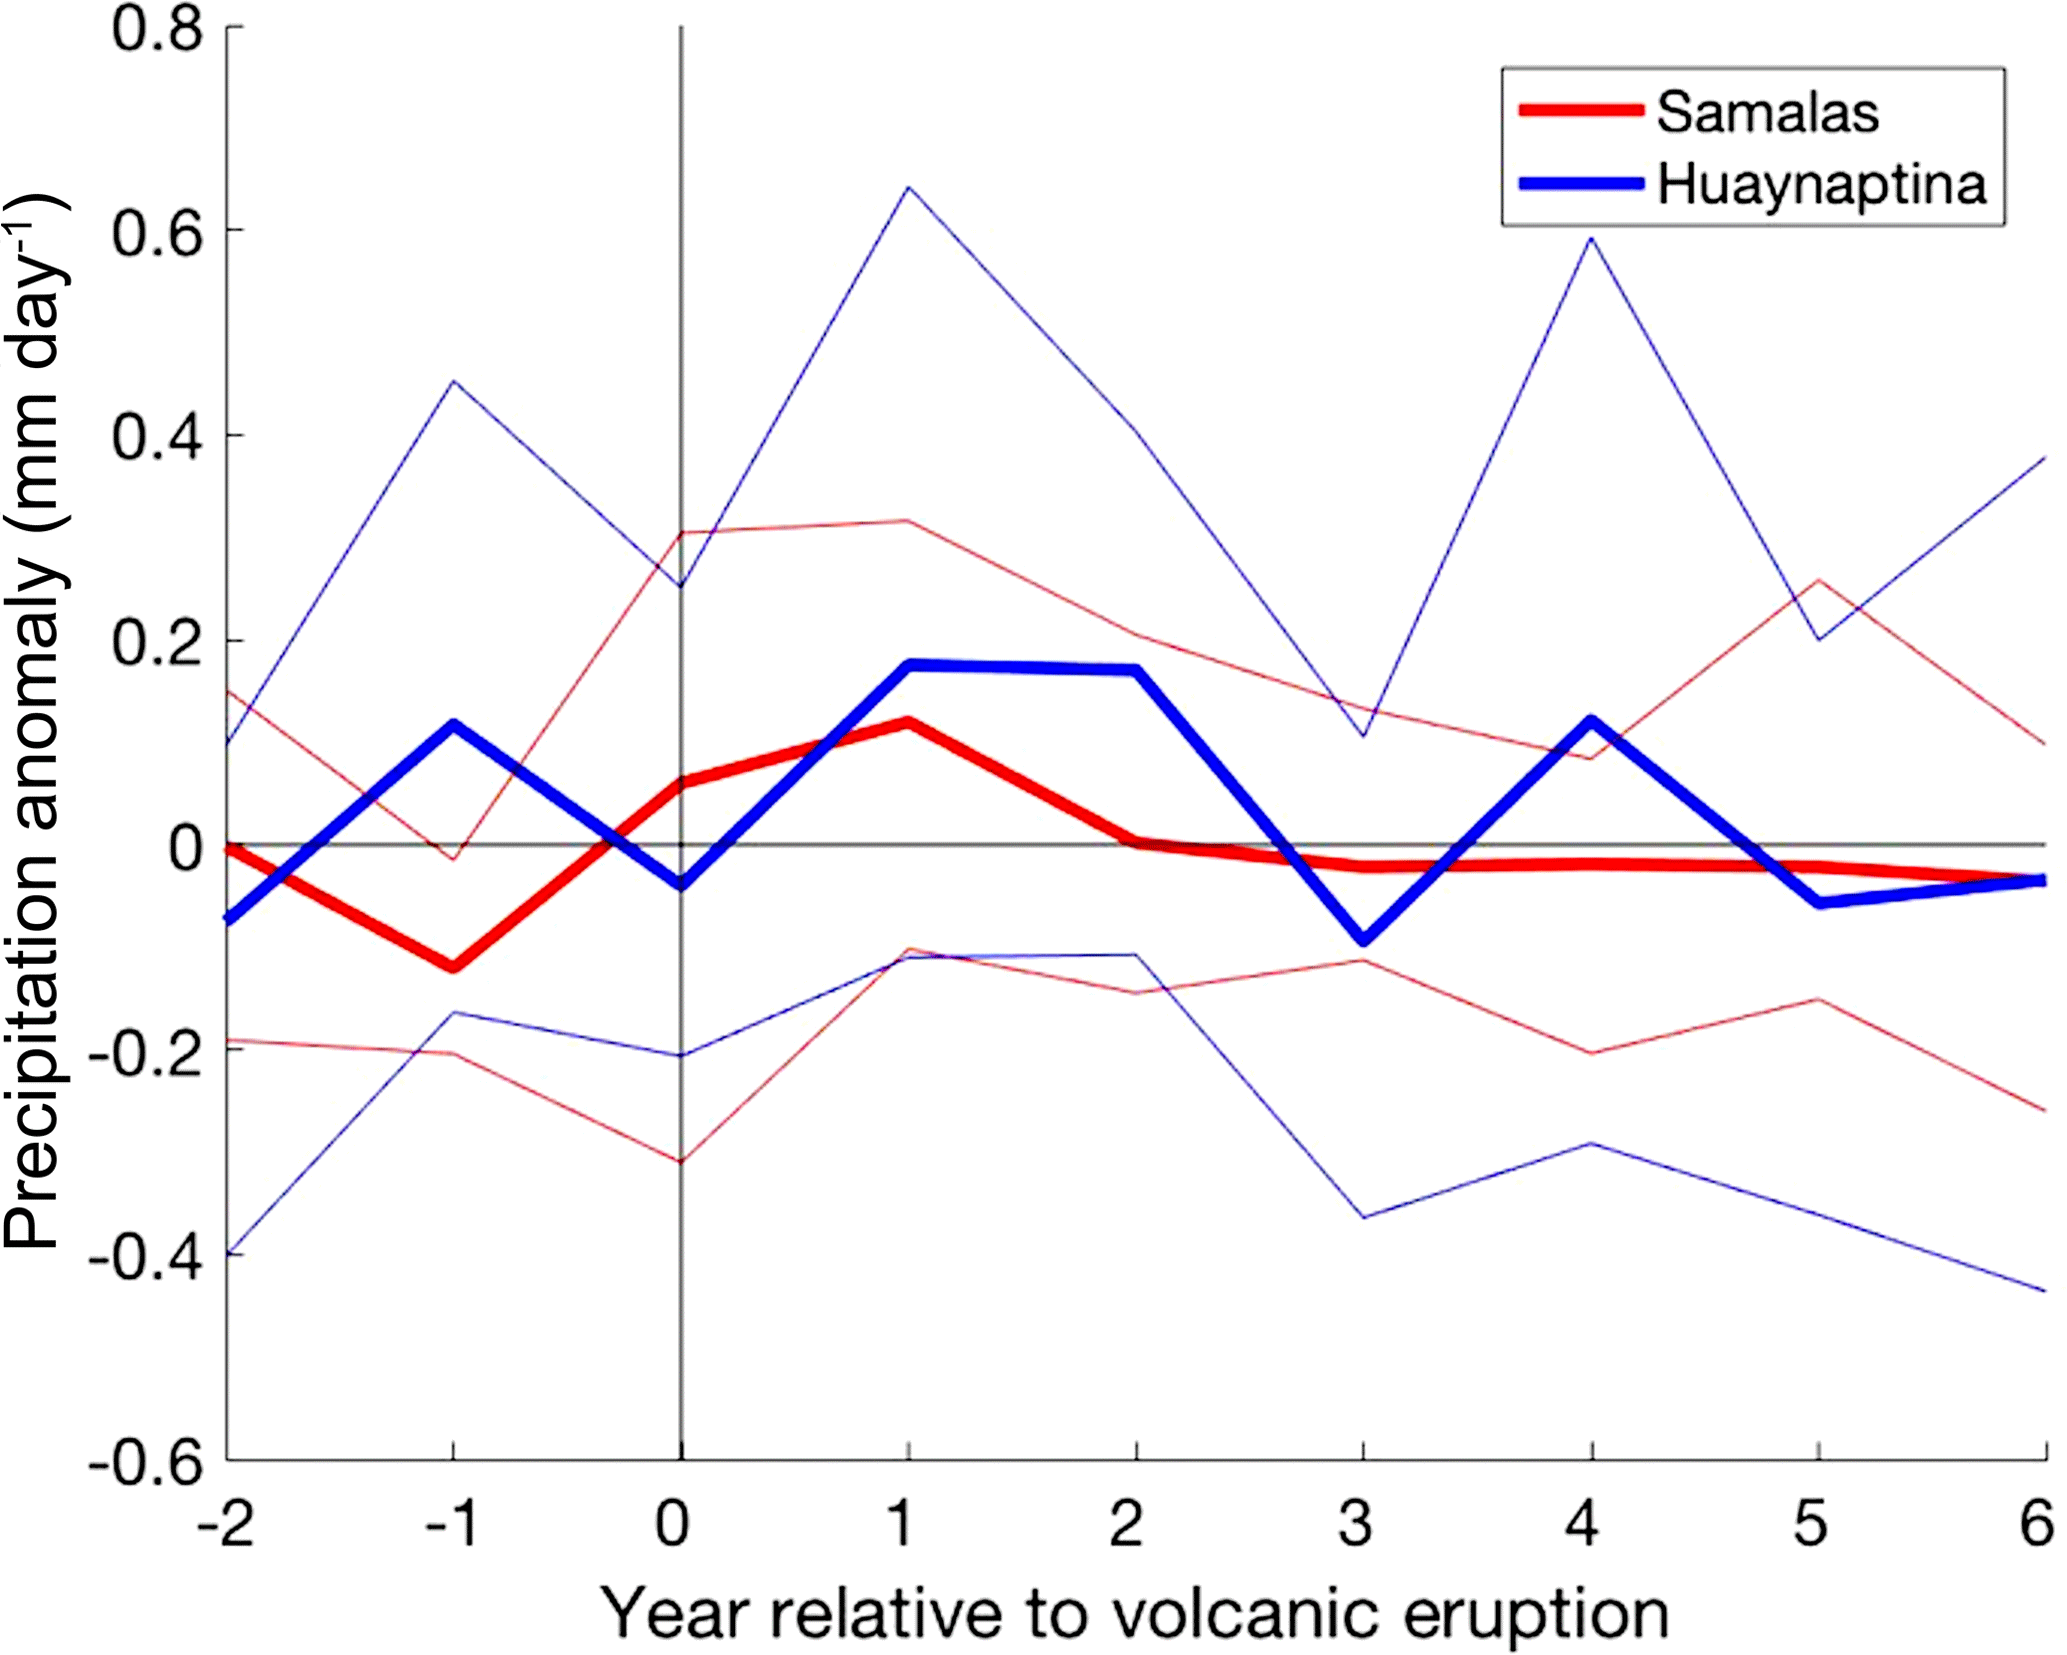
Figure 12Mean SE Australian precipitation (mm day−1) response of all volcanic ensembles (four CR ensembles and one 2 × G ensemble) to the largest (1258 Samalas) and smallest (1600 Huaynaputina) eruptions analysed over JASON. The bold lines represent the mean of all volcanic ensembles to each eruption, and the fainter lines represent the 90th and 10th percentile of the ensemble members.
Comparison of the precipitation anomalies following the Samalas and Huaynaptina eruptions in NW Australia (Fig. 10) showed that the smaller eruption had a delayed and smaller positive precipitation peak; Samalas peaked in year 0 with an anomaly of 0.23 and Huaynaptina in year 2 at 0.14. While the Huaynaptina eruption also showed a delayed peak in precipitation in SE Australia (Fig. 12), the persistence of positive precipitation anomalies exceeded those of the Samalas eruption. Huaynaptina recorded values > 0.17 in years 1–2 and a value of 0.12 in year 4, all of which were larger anomalies than the peak of the Samalas eruption at 0.11 in year 1 (Fig. 12).
Figures 13 and 14 show multi-volcano mean anomalous changes to the surface wind direction (Fig. 13) and speed (Fig. 14) over the 5 years following eruptions in the CR forcing group. The most notable changes occur in years 0 and +1 where anomalously strong Southern Hemisphere westerlies and anomalously weak south-easterly trade winds occurred, accompanied by strong north-easterlies off the south-east coast of China and an intensification of North Atlantic circulation. In year +3 anomalous south-easterly winds off the southwestern coast, and anomalous westerlies off the central western coast, of South America are seen.
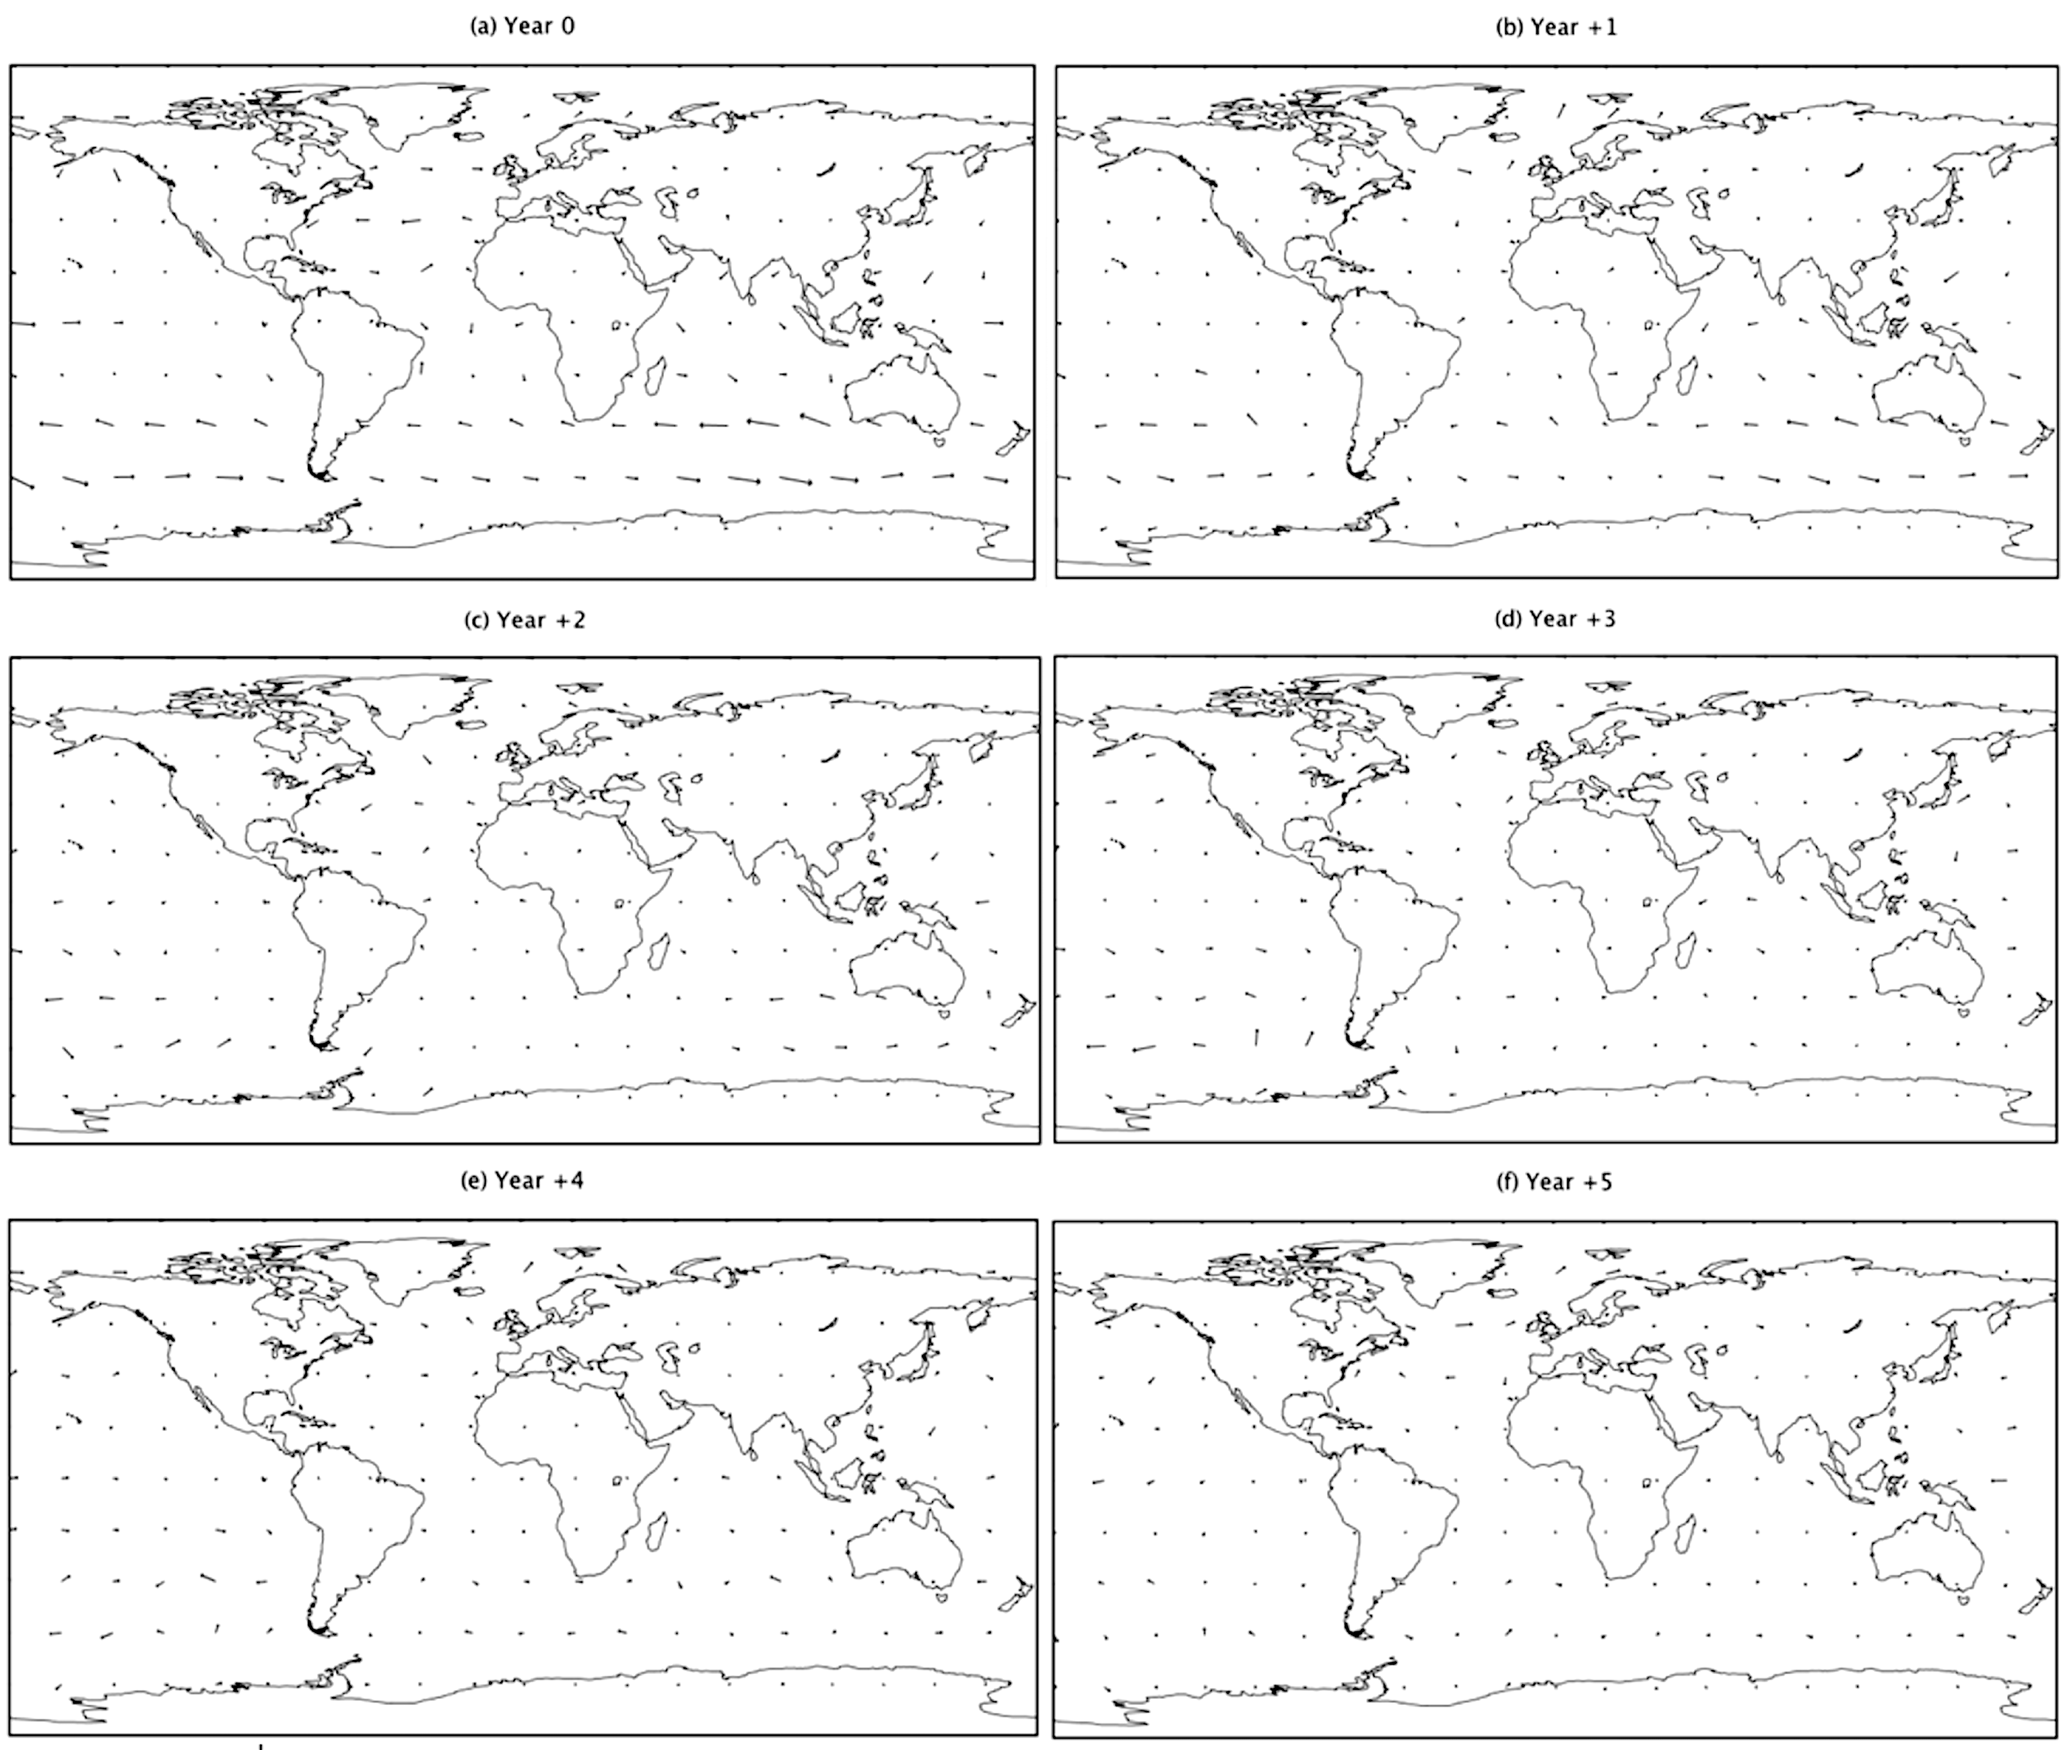
Figure 13Global surface wind direction anomalies in response to the Crowley and Unterman (CR) forcing, showing multi-ensemble mean responses over JASON averaged across all analysed eruptions for years 0 to +5 after eruption.
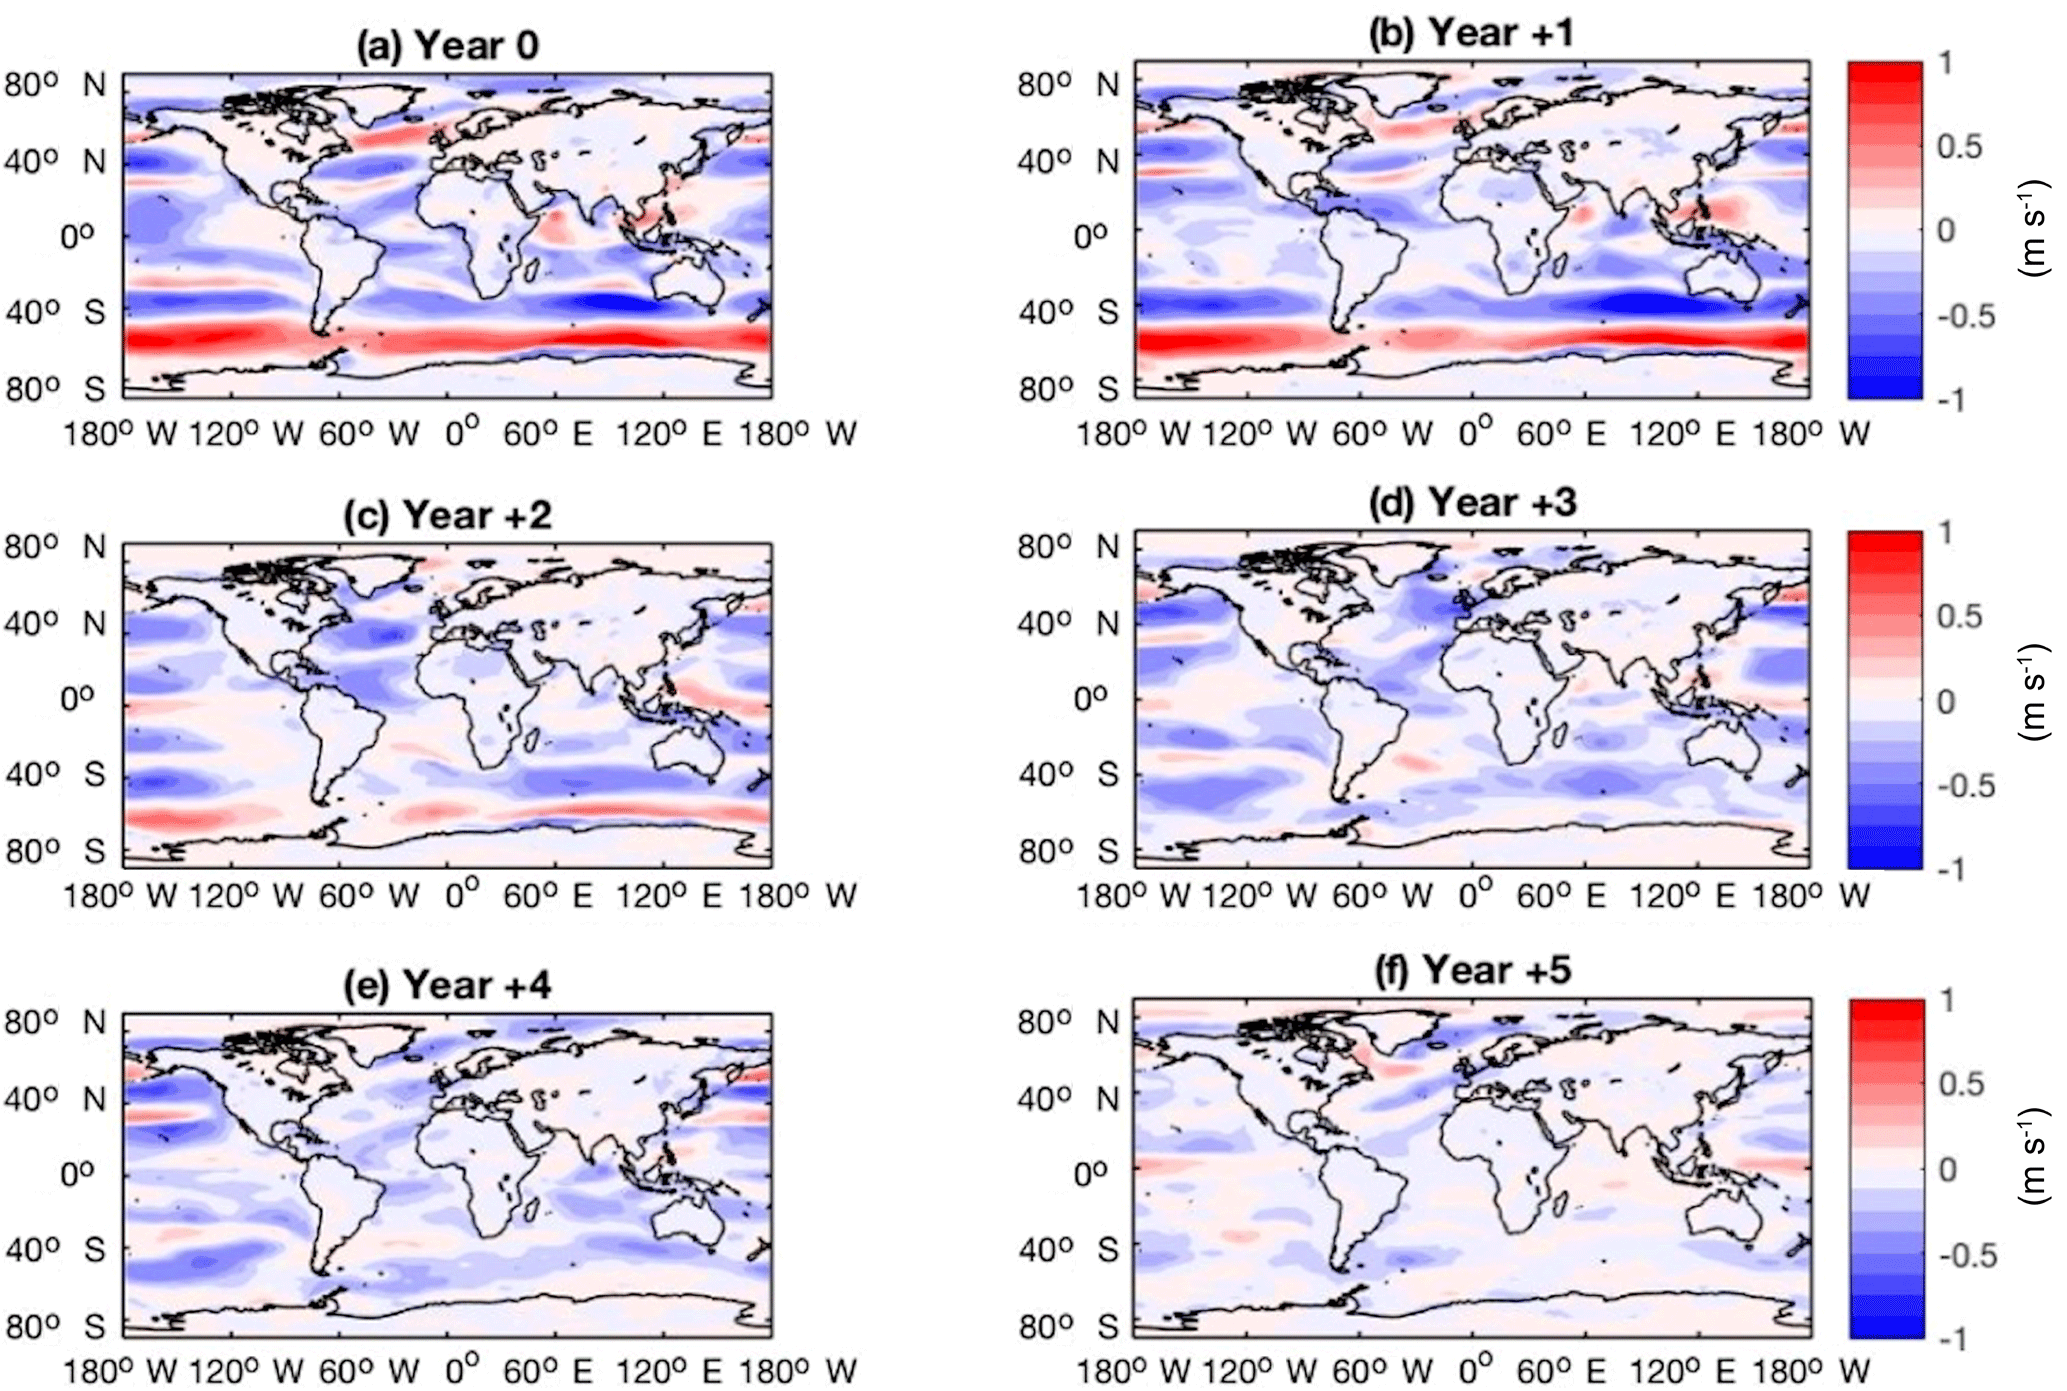
Figure 14Global surface wind speed (m s−1) anomalies in response to the Crowley and Unterman (CR) forcing, showing multi-ensemble mean responses over JASON averaged across all analysed eruptions for years 0 to +5 after eruption.
Our results suggest that the large-scale IOD and ENSO systems, and Australian rainfall regimes, were all impacted by large tropical eruptions of the last millennium.
The DMI response simulated in the GISS ensemble following large eruptions is complimentary to previous research conducted by Cheung and Abram (2016) and Maher et al. (2015). The pIOD peak in year 1 (Fig. 4) is consistent with both studies, in which statistically significant pIOD conditions occurred from 6 months to 2 years after an eruption. Cheung and Abram (2016) also found a statistically significant negative condition immediately after eruption at year 0, however this was absent from both Maher et al.'s (2015) results and the CR forcing category in this study. The 2 × G category does show a nIOD condition at year 0, but this is not believed to be a response to volcanic forcing as a similar nIOD condition can be seen at year −1. The abrupt shift to a negative condition at year 5 was not found in either Cheung and Abram (2016) or Maher et al. (2015)'s results. Both studies found a gradual decrease in DMI from year 1 to years 3 to 4.
The smooth transition to a lower DMI following eruptions found by Cheung and Abram (2016) and Maher et al. (2015) contrasts with the abrupt change from a pIOD of approximately 0.13 at year 4, to an nIOD of −0.069 in the CR ensembles and −0.083 in the 2 × G ensemble at year 5 (Fig. 4). This inconsistency between studies could be due to the selection of eruptions analysed by each paper. Cheung and Abram (2016) included all eruptions from 850 to 2005 CE recorded on the IVI2 (Gao et al., 2008) in their analysis. While this encompasses all eruptions analysed here, it also included many smaller eruptions that would likely have dampened the climatic response – a response that has been analysed in previous papers (Zambri and Robock, 2016). Maher et al. (2015) looked at the five largest eruptions from 1880 to present, of which the largest was Pinatubo (1991), which measured at 30.10 Tg globally on the IVI2 (Gao et al., 2008). In comparison, our research deals with eruptions of much larger atmospheric loading, ranging from 56.59 to 257.91 Tg.
Therefore, the persistence of a high pIOD through to year 4 seen here may result from the larger mean atmospheric sulfate loading imposed. This theory is supported by the comparison between the Samalas and Huaynaptina (Fig. 5) eruptions. Our results showed that while both eruptions caused a significant pIOD at year 1, the larger 1258 Samalas eruption alone persisted with a significant pIOD condition in following years. Further support can be gathered from the comparison between the 2 × G and CR ensemble means in Fig. 4. Years 0–3 show more extreme values in the 2 × G ensemble mean, while years 4–6 show similar values for both forcing categories. Maher et al. (2015) found a similar response, with the two largest eruptions analysed in the paper showing the largest and longest enduring pIOD anomalies. This suggests that larger mean atmospheric sulfate loading can cause not only more persistent, but also more extreme pIOD conditions.
The phase and intensity of the IOD is known to be influenced by the Asian monsoon (Brown et al., 2009; Xiang et al., 2011), which means that the physical mechanisms driving the pIOD response to volcanic forcing in GISS likely stem from this relationship. In GISS, the Asian monsoon was suppressed by the anomalous north-easterly flow off the south-east coast of China in years 0 and +1 (Figs. 13, 14) generated by volcanic aerosols, and a decrease of convection over the warm pool, cause by El Niño-like anomalies in those same years (Fig. 3). These feedbacks caused a comparatively warmer WIO, generating a pIOD. The Asian monsoon suppression following volcanic eruptions was also noted by Stevenson et al. (2016).
The NINO3.4 response found in this research supports previous studies by Adams et al. (2003), Mann et al. (2005), Emile-Geay et al. (2008), McGregor et al. (2010) and Maher et al. (2015), despite GISS modelling weaker SST anomalies than observations (Fig. 1a, b). Figure 6 shows a very prominent and persistent El Niño response in all 6 years following eruption, however it lacks the weaker La Niña-like state that was observed 3–6 years after eruption in these previous papers. Spatial maps of SST (Fig. 3), while dominated by the overall volcanic cooling, show an El Niño-like pattern in the eastern Pacific that is most visible in year 4, possibly driven by the anomalous winds off the western coast of South America in year +3 (Fig. 13); however it is also distinctive in years 0, 1, and 3. We can therefore conclude that El Niño-like anomalies were generated in the multi-ensemble mean response in years 0–6 following eruption by a uniform reduction in surface temperature, driven by a decrease in the surface heat flux; a response which was also observed by Mann et al. (2005) and Emile-Geay et al. (2008). It can furthermore be concluded that the intensification of the El Niño in year +4 was due to anomalous wind flow in year +3. Comparison of the Samalas and Huaynaptina (Fig. 7) eruptions also suggest that, similar to the DMI, the intensity and endurance of the ENSO response to volcanic forcing increases with increasing mean atmospheric sulfate loading. This once again supports the findings of Maher et al. (2015) that identified a similar pattern.
The positive response of Australian precipitation to volcanic forcing as seen here (Figs. 8, 9 and 11) is in agreement with several papers that identified a precipitation surplus over Australia following large volcanic eruptions (Schneider et al., 2009; Joseph and Zeng, 2011). Our results suggest that the direct effect of volcanic aerosols on precipitation overrode the impact of the IOD and ENSO on Australian precipitation in the years following large tropical volcanic eruptions. Northwestern Australia (Fig. 9) showed larger positive precipitation anomalies between years 0 and 2 than southeastern Australia (Fig. 11) in the CR ensemble mean, and in years 0 and 2 in the 2 × G ensemble mean. This could be due to the positive precipitation anomalies that can be generated by combined El Niño and pIOD events in the NW Australian region (Meyers et al., 2007; Pepler et al., 2014), which enhance the precipitation surplus caused by volcanic aerosols.
The varying response of NW Australia to the Samalas and Huaynaptina eruptions (Fig. 10) also supports the enhancement of the volcanically induced precipitation surplus by combined El Niño and pIOD events. The Samalas eruption was followed by strong and enduring El Niño and pIOD conditions for up to 4 years post volcanism, and showed larger positive precipitation anomalies from years 0 to 3 than the Huaynaptina eruption, that was accompanied by smaller, shorter lived El Niño and pIOD conditions. The precipitation surplus related to the Samalas eruption in NW and SE Australia also peaked earlier than Huaynaptina, which could be a response to the larger atmospheric sulfate loading. Interestingly, previous papers have not reported a relationship between atmospheric sulfate loading and the peak in precipitation response (Robock and Lui, 1994; Iles et al., 2013, 2015).
The precipitation anomalies of SE Australia (Fig. 12) further support this theory. The response to the Huaynaptina eruption, while peaking later than Samalas, endured longer, and with larger positive anomalies. The effect of strong, combined El Niño and pIOD conditions on SE Australia is significant precipitation deficits (Meyers et al., 2007; Pepler et al., 2014), which could explain the negative precipitation anomalies that occur in the Samalas response from year 2 onwards. This combined influence of a strong El Niño and pIOD dampened the positive precipitation response generated by the atmospheric sulfate loading. It should be noted that the surprisingly large positive precipitation anomaly at year −1 for SE Australia is an indicator of the uncertainty of the post-eruption values; however the significance of this event can still be seen by the comparison of the volcanic ensembles to the “None” ensemble.
We note that our study has provided an analysis of climatic response to a set of forcings in a single climate model, which may limit the precise interpretation of responses to eruptions. Overall, volcanic aerosols remain an understudied climatic forcing such that the timing, magnitude, and spatial footprint of past eruptions remains uncertain (Colose et al., 2016). In addition to uncertainties around the fundamental physical forcings, limitations still exist in the implementation of volcanic eruptions in climate models (Colose et al., 2016; Zambri et al., 2017). For example, Colose et al. (2016) suggest that improvements in model representations of volcanic particle size may improve the accuracy of model simulations. Furthermore, LeGrande et al. (2016) note that the chemistry and composition of a volcanic plume affects its climatic impact, which requires realistic representation in climatic models. Overall, these limitations in modelling eruptions and the idealised approach adopted here may mean that impacts simulated do not precisely match those of the proxy record.
In summary, this paper aimed to identify the impact of large, tropical volcanism on the ENSO, IOD, and Australian rainfall. Averaging over multiple major eruptions and multiple simulations was undertaken to reduce the noise associated with the analysis of single volcanic eruptions, as seen by the 90th and 10th percentiles in Figs. 5, 7, 10, and 12. Results showed an El Niño and pIOD response in the immediate years following eruption, accompanied by positive precipitation anomalies over SE and NW Australia. The positive precipitation anomalies suggest that volcanic aerosol cooling dominates the precipitation response, rather than the effect of ENSO or IOD, despite aerosols also proving to be an important influence on these large-scale modes. Although this study focused on Australian rainfall regimes and its main climatic drivers, this approach can be applied for exploring the impact of time evolving forcings, such as volcanism, in other regions.
All underlying research data is available on the CMIP5 archive, bar the water isotopes (https://esgf-node.llnl.gov/search/cmip5/, last access: 9 June 2018).
The authors declare that they have no conflict of interest.
We thank NASA GISS for institutional support. Sophie C. Lewis is funded
through the Australian Research Council (ARC) DECRA Fellowship (DE160100092) and
additional funding is provided through the Australian Research Council
Centre of Excellence for Climate System Science (CE110001028). We also thank
the NASA MAP programme for the continued support of Allegra N. LeGrande
and Ron L. Miller Resources
supporting this work were provided by the NASA High-End Computing (HEC)
Program through the NASA Center for Climate Simulation (NCCS) at Goddard
Space Flight Center.
Edited by: Stefan Bronnimann
Reviewed by: two anonymous referees
Adams, J. B., Mann, M. E., and Ammann C. M.: Proxy evidence for an El Niño-like response to volcanic forcing, Nature, 426, 274–278, https://doi.org/10.1038/nature02101, 2003.
Anchukaitis, K. J., Buckley, B. M., Cook, E. R., Cook, B. I., Arrigo, R. D. D., and Ammann, C. M.: Influence of volcanic eruptions on the climate of the Asian monsoon region, Geophys. Res. Lett., 37, L22703, https://doi.org/10.1029/2010GL044843, 2010.
Ashok, K., Guan, Z., and Yamagata, T.: Influence of the Indian Ocean dipole on the Australian winter rainfall, Geophys. Res. Lett., 30, 15, https://doi.org/10.1029/2003GL017926, 2003
Brown, J., Lynch, A. H., and Marshall, A. G.: Variability of the Indian Ocean Dipole in coupled model paleoclimate simulations, J. Geophys. Res., 114, D11105, https://doi.org/10.1029/2008JD010346, 2009.
Cheung, A. N. and Abram, N. J.: Indian Ocean Dipole variability during the Late 13th C, Final Report for EMSC3050 Special Topics Research Project, 2016.
Clement, A., Seager, R., Cane, M. A., and Zebiak, S. E.: An ocean dynamical thermostat, J. Climate, 9, 2190–2196, https://doi.org/10.1175/1520-0442(1996)009<2190:AODT>2.0.CO;2, 1996.
Colose, C. M., LeGrande, A. N., and Vuille, M.: Hemispherically asymmetric volcanic forcing of tropical hydroclimate during the last millennium, Earth Syst. Dyn., 7, 681–696, https://doi.org/10.5194/esd-7-681-2016, 2016.
Crowley, T. and Unterman, M.: Technical details concerning development of a 1200 yr proxy index for global volcanism, Earth Syst. Sci. Data, 5, 187–197, https://doi.org/10.5194/essd-5-187-2013, 2013.
Ding, Y., Carton, J. A., Chepurin, G. A., Stenchikov, G., Robock, A., Sentman, L. T., and Krasting, J. P.: Ocean response to volcanic eruptions in Coupled Model Intercomparison Project 5 simulations, J. Geophys. Res.-Oceans, 199, 5622–5637, https://doi.org/10.1002/2013JC009780, 2014.
Driscoll, S., Bozzo, A., Gray, L. J., Robock, A., and Stenchikov, G.: Coupled Model Intercomparison Project 5 (CMIP5) simulations of climate following volcanic eruptions, J. Geophys. Res., 117, D17105, https://doi.org/10.1029/2012JD017607, 2012.
Emile-Geay, J., Seager, R., Cane, M. A., Cook, E. R., and Haug, G. H.: Volcanoes and ENSO over the Past Millennium, J. Climate, 21, 3134–3148, https://doi.org/10.1175/2007JCLI1884.1, 2008.
Flato, G., Marotzke, J., Abiodun, B., Braconnot, P., Chou, S. C., Collins, W., Cox, P., Driouech, F., Emori, S., Eyring, V., Forest, C., Glecker, P., Guilyardi, E., Jakob, C., Kattsov, V., Reason, C., and Rummukainen, M.: Evaluation of Climate Models, in: Climate Change 2013: The Physical Science Basis, Contribution of Working Group I to the Fifth Assessment Report of the Intergovernmental Panel on Climate Change, edited by: Stocker, T. F., Qin, D., Plattner, G.-K., Tignor, M., Alen, S. K., Boschung, J., Nauels, A., Xia, Y., Bex, V., and Midgley, P. M., Cambridge University Press, Cambridge, United Kingdom and New York, NY, USA, 2013.
Gao, C., Robock, A., and Ammann, C. M.: Volcanic forcing of climate over the past 1500 years: An improved ice core-based index for climate models, J. Geophys Res., 113, D23111, https://doi.org/10.1029/2008JD010239, 2008.
Gillett, N. P., Weaver, A. J., Zwiers, F. W., and Wehner, M. F.: Detection of volcanic influence on global precipitation, Geophys. Res. Lett., 31, L12217, https://doi.org/10.1029/2004GL020044, 2004.
Gu, G. and Adler, R.: Large-scale, inter-annual relations among surface temperature, water vapour and precipitation with and without ENSO and volcano forcings, Int. J. Climatol., 32, 1782–1791, https://doi.org/10.1002/joc.2393, 2011.
Iles, C. E., Hegerl, G. C., Schurer, A. P., and Zhang, X.: The effect of volcanic eruptions on global precipitation, J. Geophys. Res.-Atmos., 118, 8770–8786, https://doi.org/10.1002/jgrd.50678, 2013.
Iles, C. E., Hegerl, G. C., and Schurer, A. P.: Volcanic eruptions and the global hydrological cycle, Pages, 23, 56–57, 2015.
Joseph, R. and Zeng, N.: Seasonally modulated tropical drought induced by volcanic aerosol, J. Climate, 24, 2045–2060, https://doi.org/10.1175/2009JCLI3170.1, 2011.
LeGrande, A. N., Tsigaridis, K., and Bauer, S. E.: Role of atmospheric chemistry in the climate impacts of stratospheric volcanic injections, Nat. Geosci., 9, 652–655, https://doi.org/10.1038/NGEO2771, 2016.
Lewis, S. C. and Karoly, D. J.: Assessment of forced responses of the Australian Community Climate and Earth System Simulator (ACCESS) 1.3 in CMIP5 historical detection and attribution experiments, Meteorol. Oceanogr. J., 64, 5–20, https://doi.org/10.22499/2.6402.001, 2014.
Lewis, S. C. and LeGrande, A. N.: Stability of ENSO and its tropical Pacific teleconnections over the Last Millennium, Clim. Past, 11, 1347–1360, https://doi.org/10.5194/cp-11-1347-2015, 2015.
Maher, N., McGregor, S., England, M. H., and Gupta, A. S.: Effect of volcanism on tropical variability, Geophys. Res. Lett., 42, 6024–6033, https://doi.org/10.1002/2015GL064751, 2015.
Mann, M., Cane, M., Zebiak, S., and Clement, A.: Volcanic and solar forcing of the tropical Pacific over the past 1000 years, J. Climate, 18, 447–456, https://doi.org/10.1175/JCLI-3276.1, 2005.
Meyers, G., McIntosh, P., Lidia, L., and Pook, M.: The Years of El Niño, La Niña and Interactions with the Tropical Indian Ocean, J. Climate, 20, 2972–2880, https://doi.org/10.1175/JCLI4152.1, 2007.
McGregor, S. and Timmermann, A.: The effect of explosive tropical volcanism on ENSO, J. Climate, 24, 2178–2191, https://doi.org/10.1175/2010JCLI3990.1, 2011.
McGregor, S., Timmermann, A., and Timm, O.: A unified proxy for ENSO and PDO variability since 1650, Clim. Past, 5, 1–17, https://doi.org/10.5194/cp-6-1-2010, 2010.
Miller, R. L., Schmidt, G. A., Nazarenko, L. S., Tausnev, N., Bauer, S. E., DelGenio, A. D., Kelley, M., Lo, K. K., Ruedy, R., Shindell, D. T., Aleinov, I., Bauer, M., Bleck, R., Canuto, V., Chen, Y., Cheng, Y., Clune, T. L., Faluvegi, G., Hansen, J. E., Healy, R. J., Kiang, N. Y., Koch, D., Lacis, A. A., LeGrande, A. N., Lerner, J., Menon, S., Oinas, V., Garcia-Pando, C. P., Perlwitz, J. P., Puma, M. J., Rind, D., Romanou, A., Russel, G. L., Sato, M., Sun, S., Tsigaridis, K., Unger, N., Voulgarakis, A., Yao, M., and Zhang, J.: CMIP5 historical simulations (1850-2012) with GISS ModelE2, J. Adv. Model. Earth Sys., 6, 441–478, https://doi.org/10.1002/2013MS000266, 2015.
Moise, A., Bhend, H., Watterson, I., and Wilson, L.: Chapter 5: Evaluation of Climate Models, in: Climate Change in Australia Information for Australia's Natural Resource Management Regions: Technical Report [CSIRO and Bureau of Meteorology], CSIRO and Bureau of Meteorology, Australia, 2015.
Oman, L., Robock, A., Stenchikov, G., Schmidt, G. A., and Ruedy, R.: Climatic response to high-latitude volcanic eruptions, J. Geophys. Res., 110, D13103, https://doi.org/10.1029/2004JD005487, 2005.
Pausata, F. S. R., Chafik, L., Caballero, R., and Battisti, D. S.: Impact of high-latitude volcanic eruptions on ENSO and AMOC, P. Natl. Acad. Sci. USA, 112, 13784–13788, https://doi.org/10.1073/pnas.1509153112, 2015.
PCMDI: CMIP5 Coupled Model Intercomparison Project, available at: https://cmip.llnl.gov/cmip5/data_portal.html, last access: 9 June 2018.
Pepler, A., Timbal, B., Rakich, C., and Coutts-Smith, A.: Indian Ocean Dipole overrides ENSO's influence on cool season rainfall across the Eastern Seaboard of Australia, J. Climate, 27, 3816–3826, https://doi.org/10.1175/JCLI-D-13-00554.1, 2014.
Predybaylo, E., Stenchikov, G. L., Wittenberg, A. T., and Zeng, F.: Impacts of a Pinatubo-size volcanic eruption on ENSO, J. Geophys. Res.-Atmos., 122, 925–947, https://doi.org/10.1002/2016JD025796, 2017.
Robock, A.: Volcanic eruptions and climate, Rev. Geophys., 38, 191–219, https://doi.org/10.1029/1998RG000054, 2000.
Robock, A. and Liu, Y.: The volcanic signal in Goddard Institute for Space Studies three-dimensional model simulations, J. Climate, 7, 44–55, https://doi.org/10.1175/1520-0442(1994)007<0044:TVSIGI>2.0.CO;2, 1994.
Roxy, M., Gualdi, S., Drbohlav, H. L., and Navarra, A.: Seasonality in the relationship between El Niño and the Indian Ocean dipole, Clim. Dynam., 37, 221–236, https://doi.org/10.1007/s00382-010-0876-1, 2011.
Ruxton, G. D.: The unequal variance t-test is an underused alternative to Stduent's t-test and the Mann-Whitney U test, Behav. Ecol., 4, 688–690, https://doi.org/10.1093/beheco/ark016, 2006.
Sato, M., Hansen, J. E., McCormick, M. P., and Pollack, J. B.: Stratospheric aerosol optical depths, 1850–1990, J. Geophys. Res., 98, 22987–22994, https://doi.org/10.1029/93JD02553, 1993.
Schmidt, G. A., Kelley, M., Nazarenko, L., Ruedy, R., Russell, G. L., Aleinov, I., Bauer, M., Bauer, S. E., Bhat, M. K., Bleck, R., Canuto, V., Chen, Y-H., Cheng, Y., Clune, T. L., Genio, A. D., Fainchtein, R., Faluvegi, G., Hansen, J. E., Healy, R. J., Kiang, N. Y., Koch, D., Lacis, A. A., LeGrande, A. N., Lerner, J., Lo, K. K., Matthews, E. E., Menon, S., Miller, R. L., Oinas, V., Oloso, A. O., Perlwitz, J. P., Puma, M. J., Putman, W. M., Rind, D., Romanou, A., Sato, M., Shindell, D. T., Sun, S., Syed, R. A., Tausnev, N., Tsigaridis, K., Unger, N., Voulgarakis, A., Yao, M.-S., and Zhang, J.: Configuration and assessment of the GISS ModelE2 contributions to the CMIP5 archive, J. Adv. Model. Earth Syst., 6, 141–184, https://doi.org/10.1002/2013MS000265, 2014.
Schneider, D. P., Ammann, C. M., Otto-Bliesner, B. L., and Kaufman, D. S.: Climate response to large, high-latitude and low-latitude volcanic eruptions in the Community Climate System Model, J. Geophys. Res., 114, D15101, https://doi.org/10.1029/2008JD011222, 2009.
Self, S., Rampino, M. R., Zhao, J., and Katz, M. G.: Volcanic aerosol perturbations and strong El Niño events: No general correlation, Geophys. Res. Lett., 24, 1247–1250, 1997.
Shindell, D., Schmidt, G., Mann, M., and Faluvegi, G.: Dynamic winter climate response to large tropical volcanic eruptions since 1600, J. Geophys. Res., 109, D05104, https://doi.org/10.1029/2003JD004151, 2004.
Sigl, M., McConnell, J. R., Layman, L., Maselli, O., McGwire, K., Pasteris, D., Dahl-Jensen, D., Steffensen, J. P., Vinther, B., Edwards, R., Mulvany, R., and Kipfstuhl, S.: A new bipolar ice core record of volcanism from WAIS Divide and NEEM and implications for climate forcing of the last 2000 years, J. Geophysic Res.-Atmos., 118, 1151–1169, https://doi.org/10.1029/2012JD018603, 2013.
Soden, B., Wetherald, R., Stenchikov, G., and Robock, A.: Global cooling after the eruption of Mount Pinatubo: A test of climate feedback by Water Vapour, Science, 296, 727–730, https://doi.org/10.1126/science.296.5568.727, 2002.
Stenchikov, G., Hamilton, K., Stouffer, R. J., Robock, A., Ramaswamy, V., Santer, B., and Graf, H. F.: Arctic Oscillation response to volcanic eruptions in the IPCC AR4 climate models, J. Geophys. Res., 111, D07107, https://doi.org/10.1029/2005JD006286, 2006.
Stenchikov, G., Delworth, T. L., Ramaswamy, V., Stouffer, R. J., Wittenberg, A., and Zeng, F.: Volcanic signals in oceans, J. Geophys. Res., 144, D16104, https://doi.org/10.1029/2008JD011673, 2009.
Stevenson, S., Otto-Bliesner, B., Fasullo, J., and Brady, E.: El Niño like hydroclimate response to last millennium volcanic eruptions, J. Climate, 29, 2907–2921, https://doi.org/10.1175/JCLI-D-15-0239.1, 2016.
Taylor, K. E., Stouffer, R. J., and Meehl, G. A.: An overview of CMIP5 and the experiment design, B. Am. Meteorol. Soc., 485–498, https://doi.org/10.1175/BAMS-D-11-00094.1, 2012.
Timmreck, C., Graf, H. F., Zanchettin, D., Hagemann, S., Kleinen, T., and Kruger, K.: Climate response to the Toba eruption: regional changes, Quat. Int., 258, 30–44, https://doi.org/10.1016/j.quaint.2011.10.008, 2012.
Trenberth, K. E.: The definition of El Niño, B. Am. Meteorol. Soc., 78, 2771–2777, 1997.
Ummenhofer, C., England, M., McIntosh, P., Meyers, G., Pook, M., Risbey, J., Gupta, A., and Taschetto, A.: What causes southeast Australia's worst droughts?, Geophys. Res. Lett., 36, L04706, https://doi.org/10.1029/2008GL036801, 2009.
Wahl, E. R., Diaz, H. F., Smerdon, J. E., and Ammann, C. M.: Late winter temperature response to large tropical volcanic eruptions in temperate western North America: Relationship to ENSO phases, 122, 238–250, https://doi.org/10.1016/j.gloplacha.2014.08.005, 2014.
Weller, E., Cai, W., Du, Y., and Min, S-K.: Differentiating flavors of the Indian Ocean Dipole using dominant modes in tropical Indian Ocean rainfall, Geophys. Res. Lett., 41, 8978–8986, https://doi.org/10.1002/2014GL062459, 2014.
Wielicki, B., Wong, T., Allen, R., Slingo, A., Kiehl, J., Soden, B., Gordon, C., Miller, A., Yang, S., Randall, D., Robertson, F., Susskind, J., and Jacobwitz, H.: Evidence for large decadal variability in the tropical mean radiative energy budget, Science, 295, 841–844, https://doi.org/10.1126/science.1065837, 2002.
Xiang, B., Yu, W., Li, T., and Wang, B.: The critical role of the boreal summer mean state in the development of the IOD, Geophys. Res. Lett., 38, L02710, https://doi.org/10.1029/2010GL045851, 2011.
Zambri, B. and Robock, A.: Winter warming and summer monsoon reduction after volcanic eruptions in Coupled Model Intercomparison Project 5 (CMIP5) simulations, Geophys. Res. Lett., 4320, 10920–10928, https://doi.org/10.1002/2016GL070460, 2016.
Zambri, B., Slawinska, J., Robock, A., and LeGrande, A. N.: Northern Hemisphere winter warming and summer monsoon reduction after volcanic eruptions over the last millennium, J. Geophys. Res. Atmos., 122, 7971–7989, https://doi.org/10.1002/2017JD026728, 2017.
Zanchettin, D., Timmreck, C., Graf, H. F., Rubino, A., Lorenz, S., Lohmann, K., Krüger, K., and Jungclaus, J. H.: Bi-decadal variability excited in the coupled ocean-atmosphere system by strong tropical volcanic eruptions, Clim. Dynam., 39, 419–444, 2012.