the Creative Commons Attribution 3.0 License.
the Creative Commons Attribution 3.0 License.
Synchronizing early Eocene deep-sea and continental records – cyclostratigraphic age models for the Bighorn Basin Coring Project drill cores
Ursula Röhl
Roy H. Wilkens
Philip D. Gingerich
William C. Clyde
Scott L. Wing
Gabriel J. Bowen
Mary J. Kraus
A consistent chronostratigraphic framework is required to understand the effect of major paleoclimate perturbations on both marine and terrestrial ecosystems. Transient global warming events in the early Eocene, at 56–54 Ma, show the impact of large-scale carbon input into the ocean–atmosphere system. Here we provide the first timescale synchronization of continental and marine deposits spanning the Paleocene–Eocene Thermal Maximum (PETM) and the interval just prior to the Eocene Thermal Maximum 2 (ETM-2). Cyclic variations in geochemical data come from continental drill cores of the Bighorn Basin Coring Project (BBCP, Wyoming, USA) and from marine deep-sea drilling deposits retrieved by the Ocean Drilling Program (ODP). Both are dominated by eccentricity-modulated precession cycles used to construct a common cyclostratigraphic framework. Integration of age models results in a revised astrochronology for the PETM in deep-sea records that is now generally consistent with independent 3He age models. The duration of the PETM is estimated at ∼ 200 kyr for the carbon isotope excursion and ∼ 120 kyr for the associated pelagic clay layer. A common terrestrial and marine age model shows a concurrent major change in marine and terrestrial biota ∼ 200 kyr before ETM-2. In the Bighorn Basin, the change is referred to as Biohorizon B and represents a period of significant mammalian turnover and immigration, separating the upper Haplomylus–Ectocion Range Zone from the Bunophorus Interval Zone and approximating the Wa-4–Wa-5 land mammal zone boundary. In sediments from ODP Site 1262 (Walvis Ridge), major changes in the biota at this time are documented by the radiation of a “second generation” of apical spine-bearing sphenolith species (e.g., S. radians and S. editus), the emergence of T. orthostylus, and the marked decline of D. multiradiatus.
- Article
(18910 KB) - Full-text XML
-
Supplement
(8756 KB) - BibTeX
- EndNote


Early Eocene greenhouse climate on Earth was punctuated by transient global warming events (Cramer et al., 2003; Kirtland Turner et al., 2014). The Paleocene–Eocene Thermal Maximum (PETM or Eocene Thermal Maximum 1, ETM-1) at 55.93 Ma (Kennett and Stott, 1991; Koch et al., 1992; Bowen et al., 2001; Zachos et al., 2005; Bowen et al., 2015) is the most pronounced hyperthermal event, with a ∼ 5–8 ∘C global warming (McInerney and Wing, 2011). The Elmo event (aka ETM-2 or H1) (Cramer et al., 2003; Lourens et al., 2005) is another prominent transient warming event at 54.05 Ma (Westerhold et al., 2017a). Both have been studied in great detail in deep-sea and terrestrial sedimentary successions (e.g., Zachos et al., 2005; Abels et al., 2016).
The hyperthermal events in outcrops and ocean drill cores can be identified by the characteristic negative carbon isotope excursions (CIEs), although these differ in magnitude (McInerney and Wing, 2011; Sluijs and Dickens, 2012; Bowen, 2013). The CIEs are interpreted to be due to massive inputs of 13C-depleted carbon to the exogenic carbon pool (see Dickens, 2011, for discussion). For both events, major changes in land and ocean biota have been documented (McInerney and Wing, 2011; Slujis et al., 2007). In the fossil record, the PETM, for example, marks the appearance of the modern orders of mammals including horses and primates on land (Gingerich, 1989, 2006) and a major extinction of benthic foraminifera in the deep sea (Thomas, 1989).
The hyperthermals provide important evidence for understanding the dramatic and long-lasting consequences of a rapid massive input of CO2 into the ocean–atmosphere system within a few thousand years (Kirtland Turner and Ridgwell, 2016; Zeebe et al., 2016). The PETM in particular, the largest CIE of the last 100 million years, is very important for understanding Earth's future climate (McInerney and Wing, 2011), but the anthropogenic input of CO2 may be as much as an order of magnitude more rapid than at the PETM (Zeebe et al., 2016).
Key records for studying the early Eocene climate and hyperthermals come from carbonate-rich deep-sea drill cores from Walvis Ridge in the South Atlantic (Zachos et al., 2005) and terrestrial fluvial deposits with paleosols in the Bighorn Basin in Wyoming, USA (Koch et al., 1992; Bowen et al., 2001, 2015; Abels et al., 2012, 2016). Deep-sea records have much lower sedimentation rates, on the order of cm kyr−1 compared to the terrestrial records having sedimentation rates on the order of m kyr−1, but have been deposited continuously. Sedimentation in terrestrial environments was very likely more dynamic due to the different types of deposition (see Bowen et al., 2015). To interpret rates of changes of geological processes before, during, and after the events a detailed age model is required. Deep-sea records around the PETM and Elmo event reveal extraordinary cyclicity related to precession and eccentricity of the Earth's orbit that was used for establishing high-resolution age models based on cyclostratigraphy and astronomical tuning (Lourens et al., 2005; Röhl et al., 2000, 2007; Westerhold et al., 2007; Abdul Aziz et al., 2008; Stap et al., 2009). Cyclostratigraphic estimates of the duration of the PETM from deep-sea records are hampered by the lack of carbonate-rich sequences, which are characterized at sites nearby the paleo-CCD (carbonate compensation depth) with a clay-rich layer at the onset of the event (Röhl et al., 2007), resulting from severe carbonate dissolution (Zachos et al., 2005). Alternative age models based on extraterrestrial 3He assign more time to the clay layer and a more rapid recovery to pre-PETM δ13C values than do cyclostratigraphic models (Murphy et al., 2010). The stacking pattern of paleosols in the terrestrial PETM section at Polecat Bench (PCB) is driven by climatic precession and therefore was used to develop an astronomical age model for the CIE (Abdul Aziz et al., 2008). Cyclicity in outcrops of fluvial deposits prior to and during the Elmo event in the Bighorn Basin was dominated by precession (Abels et al., 2012, 2013), similar to what has been found in deep-sea sediments (Lourens et al., 2005; Westerhold et al., 2007; Zachos et al., 2010; Littler et al., 2014).
Because records from both realms show precession-dominated cyclicity, it should be possible to correlate and synchronize them. In summer 2011, the Bighorn Basin Coring Project (BBCP) drilled 900 m of overlapping cores from three sites covering the interval of the PETM and Elmo events (Clyde et al., 2013). The BBCP retrieved continuous unweathered material for common multiproxy studies. The main purpose of this report is to establish high-resolution age models for the BBCP drill cores based on cyclostratigraphy and integrate existing age models from outcrops. Second, these new BBCP age models will be combined with deep-sea records to synchronize and improve the available astronomical age model for the PETM and Elmo interval. The new age models will allow other studies to compare multiple proxy records from both realms at unprecedented temporal accuracy. Our study also allows us to consider whether the mammalian turnover called Biohorizon B in the Bighorn Basin fossil faunas (Schankler, 1980; Chew, 2009, 2015; Chew and Oheim, 2013) is synchronous with changes in deep-sea calcareous nannofossil assemblages (Agnini et al., 2007) significantly prior to the Elmo event.
The BBCP drilled late Paleocene to early Eocene fluvial deposits including the PETM at PCB and Basin Substation (BSN), and the Elmo interval at Gilmore Hill (GMH) (Fig. 1; Clyde et al., 2013). Two overlapping holes were drilled at BSN down to 138.4 mbs (BSN11-1A) and 138.6 mbs (BSN11-1B). At PCB two overlapping holes were drilled to 130 mbs (PCB11-2A) and 245.1 mbs (PCB11-2B). At GMH one hole was drilled down to 202.4 mbs (GMH11-3A) and a second down to 66.7 mbs (GMH11-3B). All cores were split and processed according to IODP standards that included visual core description, color and line scanning, sampling for post-party investigations at home laboratories, and archiving at the Bremen Core Repository during a BBCP Science Party at MARUM, University Bremen, Germany, in January 2012 (Clyde et al., 2013).
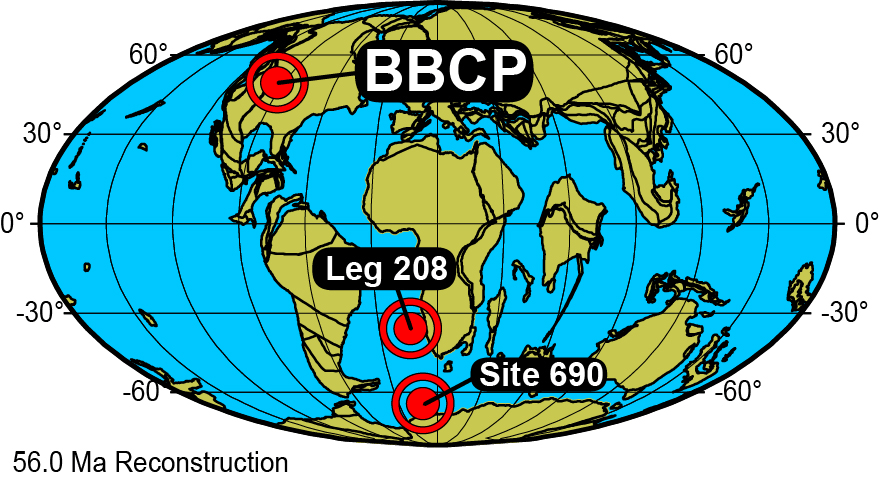
Figure 1Location map for BBCP (Bighorn Basin Coring Project, Wyoming, USA), ODP Leg 208 (Sites 1260 and 1263), and ODP Leg 113 (Site 690) on a 56 Ma paleogeographic reconstruction in Mollweide projection (from http://www.odsn.de; Hay et al., 1999).
Here we present the results of processing and interpreting line scan images and color reflectance data for the BSN, GMH, and PCB sites, with the records from PCB being presented initially in Bowen et al. (2015). All cores from PCB, BSN, and GMH were X-ray fluorescence (XRF) scanned over the course of 2012 at MARUM, University of Bremen, and we use the iron (Fe) intensity data here as well. XRF data were collected every 2 cm down-core using XRF core scanner 3 (Avaatech serial no. 12) at MARUM, University of Bremen, over a 1.2 cm2 area with a down-core split size of 10 mm using generator settings of 50, 30, and 10 kV, a respective current of 1.0, 1.0, and 0.2 mA, and a sampling time of 10 s in each run directly at the split core surface of the archive half. The split core surface was covered with a 4 µm thin SPEXCerti Prep Ultralene1 foil to avoid contamination of the XRF detector prism and desiccation of the cores. The data were acquired with a Canberra X-PIPS silicon drift detector (model SXD 15C-150-500) with 150 eV X-ray resolution, the Canberra digital spectrum analyzer DAS 1000, and an Oxford Instruments 100W Neptune X-ray tube with a rhodium (Rh) target. Raw data spectra were processed using the Analysis of X-ray spectra by Iterative Least square software (WIN AXIL) package from Canberra Eurisys. Core data and images have been correlated and integrated using the new software tool CODD (Code for Ocean Drilling Data; Wilkens et al., 2017). This tool greatly facilitates handling of large and complex data sets and allows the use of core images for scientific analysis.
Pedogenic carbonate nodules for isotope analysis were identified as discrete, small (∼ 2 mm to > 5 cm in diameter), well-cemented, rounded to sub-rounded accumulations of micritic carbonate, some of which contain observable secondary, diagenetic spar. Samples larger than ∼ 1 cm diameter were slabbed to expose a clean flat surface. For smaller samples, the exterior surface of the nodule was etched using a dental drill. Primary micrite was collected with a dental drill under a binocular microscope. Carbon isotope data acquisition is the same as presented in the supplement of Bowen et al. (2015). Repeatability of the pedogenic carbonate analyses averaged 0.20 ‰ for δ13C and 0.24 ‰ for δ18O based on replicate analyses of pedogenic carbonate samples. Isotopic data for PCB nodules were previously reported in Bowen et al. (2015).
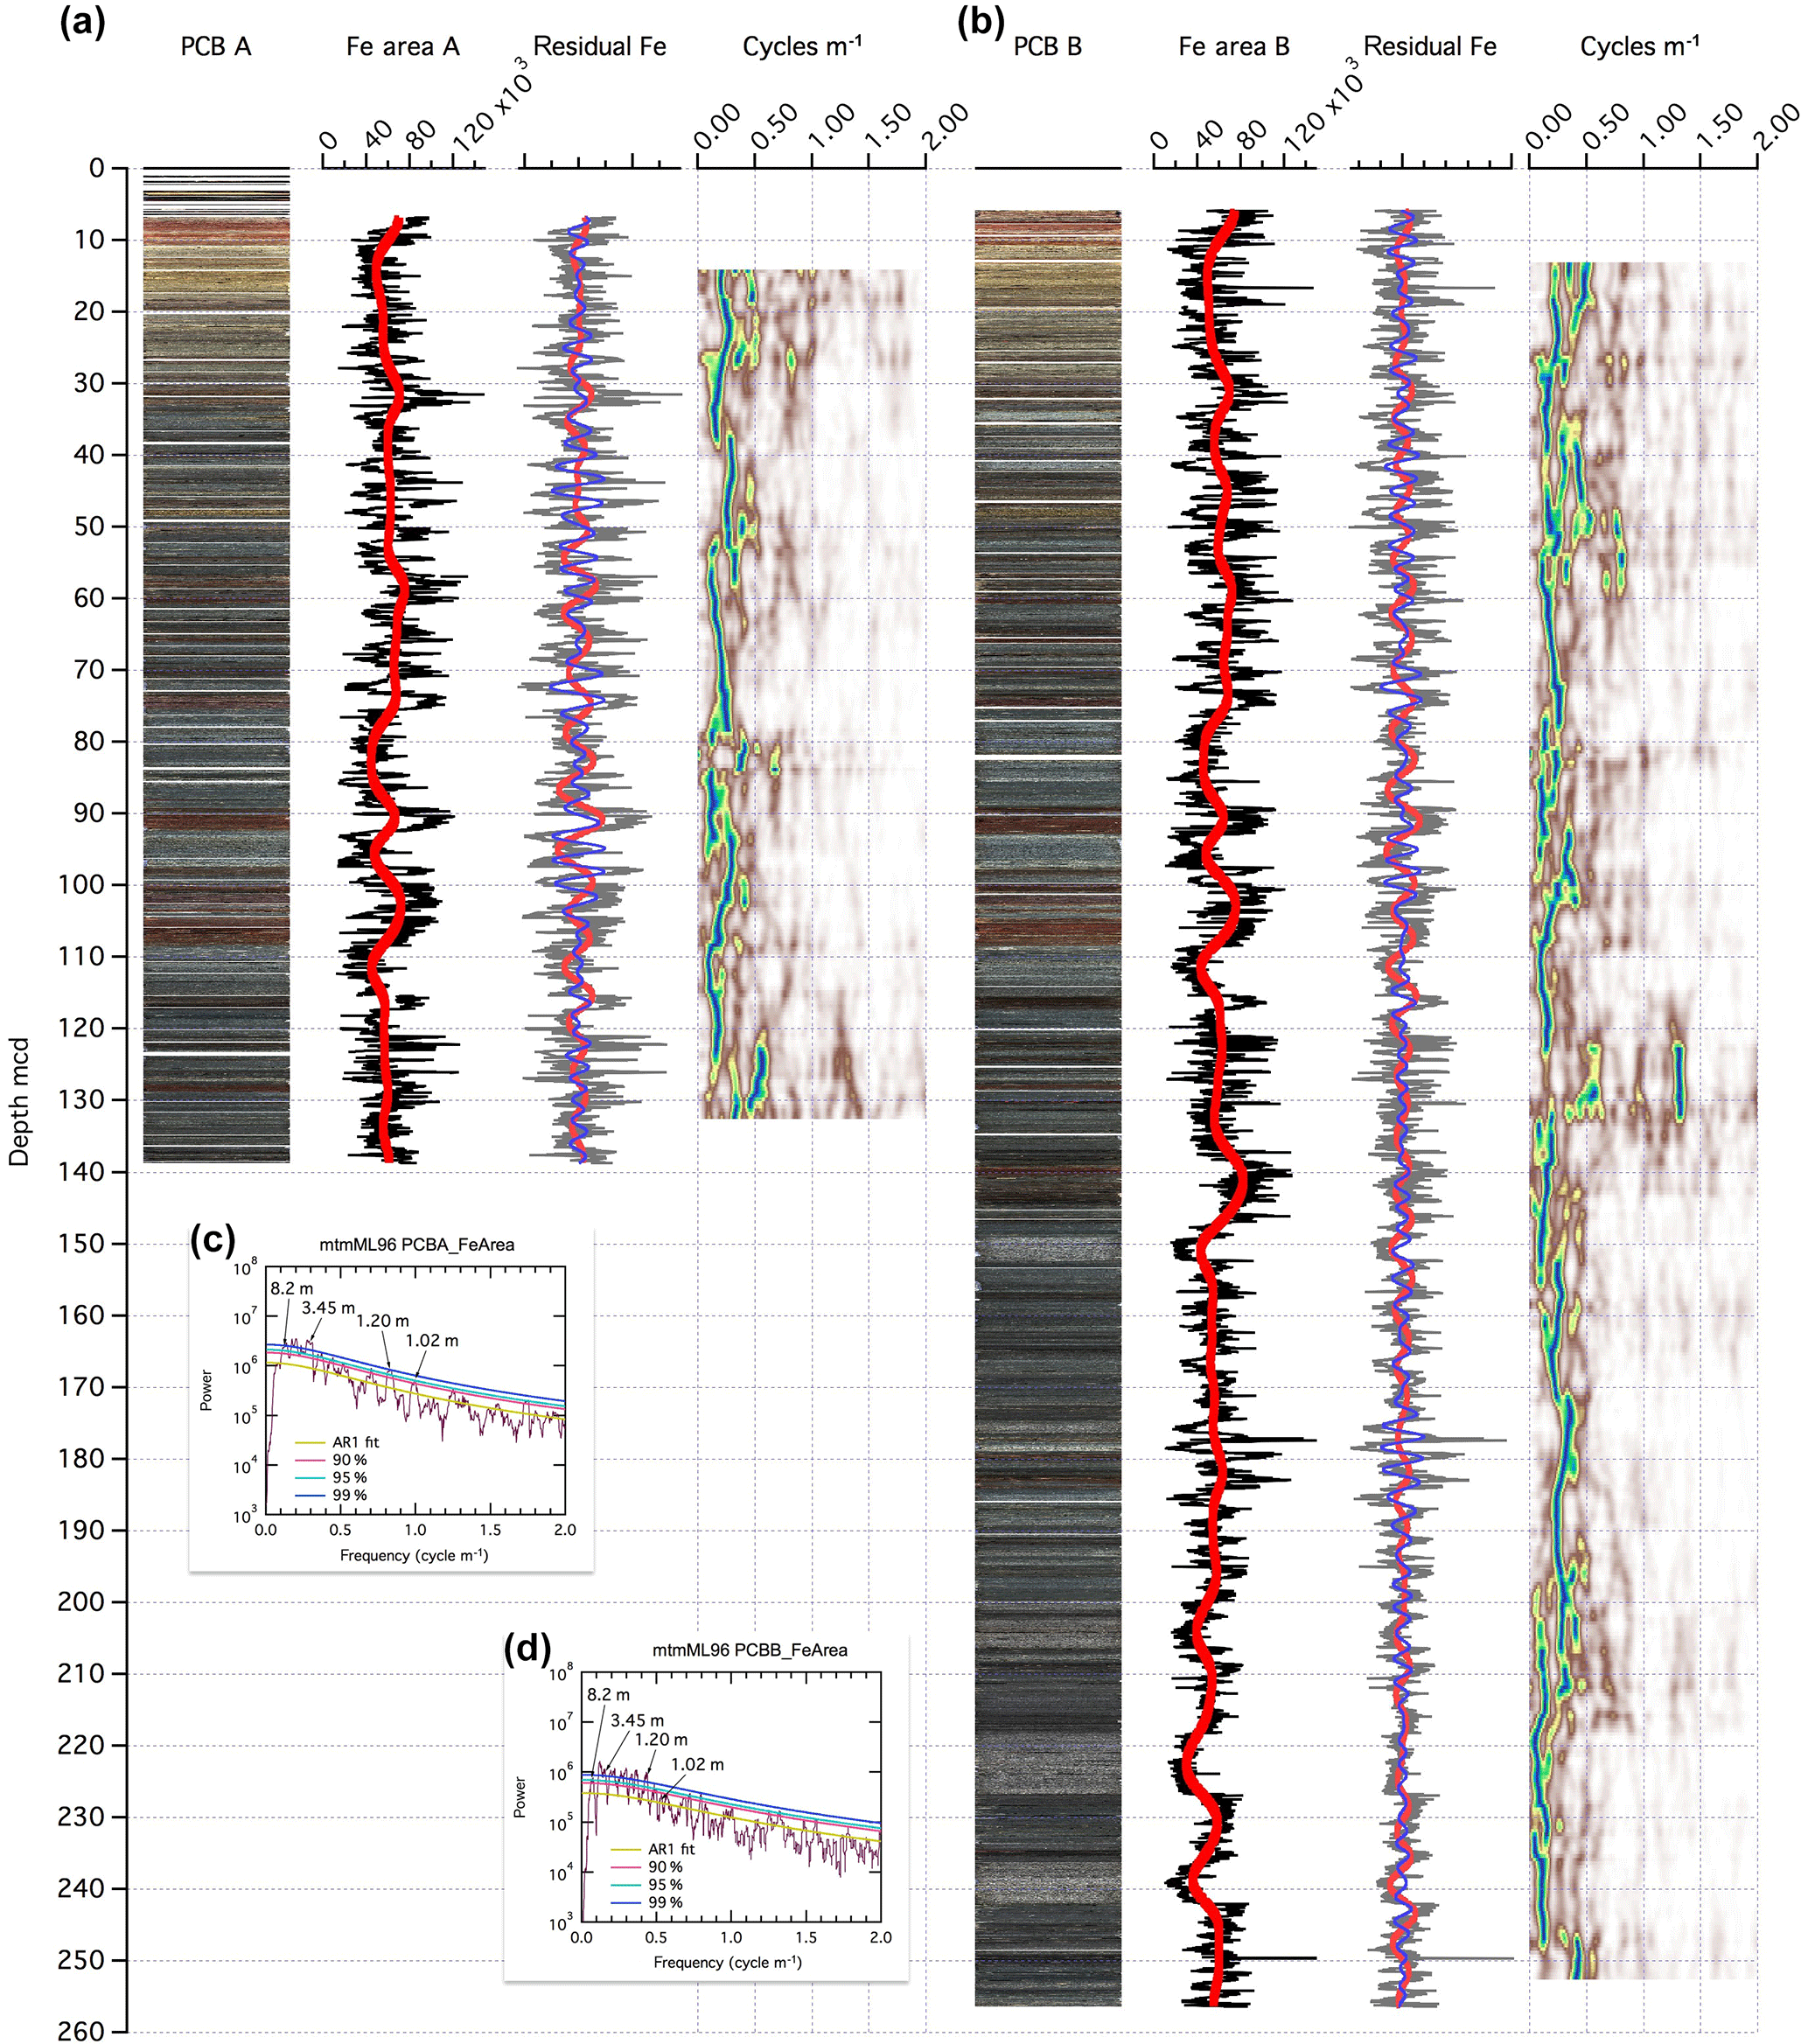
Figure 2Polecat Bench PCB-A (a) and PCB-B (b) core images, XRF Fe intensity data, and spectral analysis on composite depth scale. Core scan images have been assembled with software package CODD (Wilkens et al., 2017). XRF Fe intensity (black line) with the trend (thick red line) removed for following spectral analysis. Residual Fe after trend removal and two Gaussian filters of the dominant cycles 8 m (red) and 3.5 m (blue). Evolutive spectral plot to decode changes in the cyclicity and thus sedimentation rates. Panels (c, d) show the MTM power spectra for PCB-A and PCB-B Fe data.
All data and tables from this study are available through open access in the PANGAEA database (https://doi.org/10.1594/PANGAEA.875685).
3.1 Color reflectance data, XRF core scanning data, and composite depth
Weathering resulted in brighter, yellowish colors within the upper ∼ 30 m of the BBCP drill cores (Fig. 2 in Clyde et al., 2013). Below the weathering zone, sediments appear light to dark gray with reddish to purplish colored paleosols. Lightness varies between 20 and 60 % for all sites with a high degree of variability. a* (red/green) values for PCB and BSN cores range from 0 with values up to 10 or higher in reddish and purplish paleosols. a* values of the GMH cores show higher variability due to the more reddish, varying lithology. b* (blue/yellow) values vary more in the upper 30 m of the cores in line with the yellower colors of the weathered zone. Fe core scanning intensities vary between several 1000 up to 100 000 total counts (area) and display cyclic changes with a much better signal-to-noise ratio than the color data. BSN Fe intensities reveal lower variability than PCB and GMH, but higher Fe peaks are more common. GMH and PCB Fe data show persistent cyclicity throughout the succession.
Core images, color reflectance, and Fe data have been utilized to correlate between parallel holes for PCB, BSN, and GMH drill cores. As normal shipboard routine for multiple holes drilled by IODP, cores of the BBCP were offset from the original drilling depth (mbs) and subsequently combined. The correlation of the two PCB records and the resulting composite can be found in Bowen et al. (2015, their Fig. 1). Lithological logs, core images, color reflectance CIE from the BBCP Science Party (Clyde et al., 2013), and XRF core scanning Fe intensity for BSN, GMH, and PCB are provided in Figs. S1, S2, and S3 and data Tables S1–S6 in the Supplement.
3.2 Time-series analysis of BBCP drill cores
Evolutionary Power Spectral Density values were calculated for the XRF core scanning Fe intensities and color reflectance a* (AStar) data for all drill holes separately. Before spectral analysis, the raw data were resampled and the trend was removed. In the residual data multitaper method (MTM) spectra were calculated using the mtmML96 routine of the “astrochron” software package (Meyers, 2014). Cycles identified using MTM spectrum analysis were then extracted using a Gaussian bandpass filter of the central frequency with 30 % bandwidth using AnalySeries (Paillard et al., 1996).
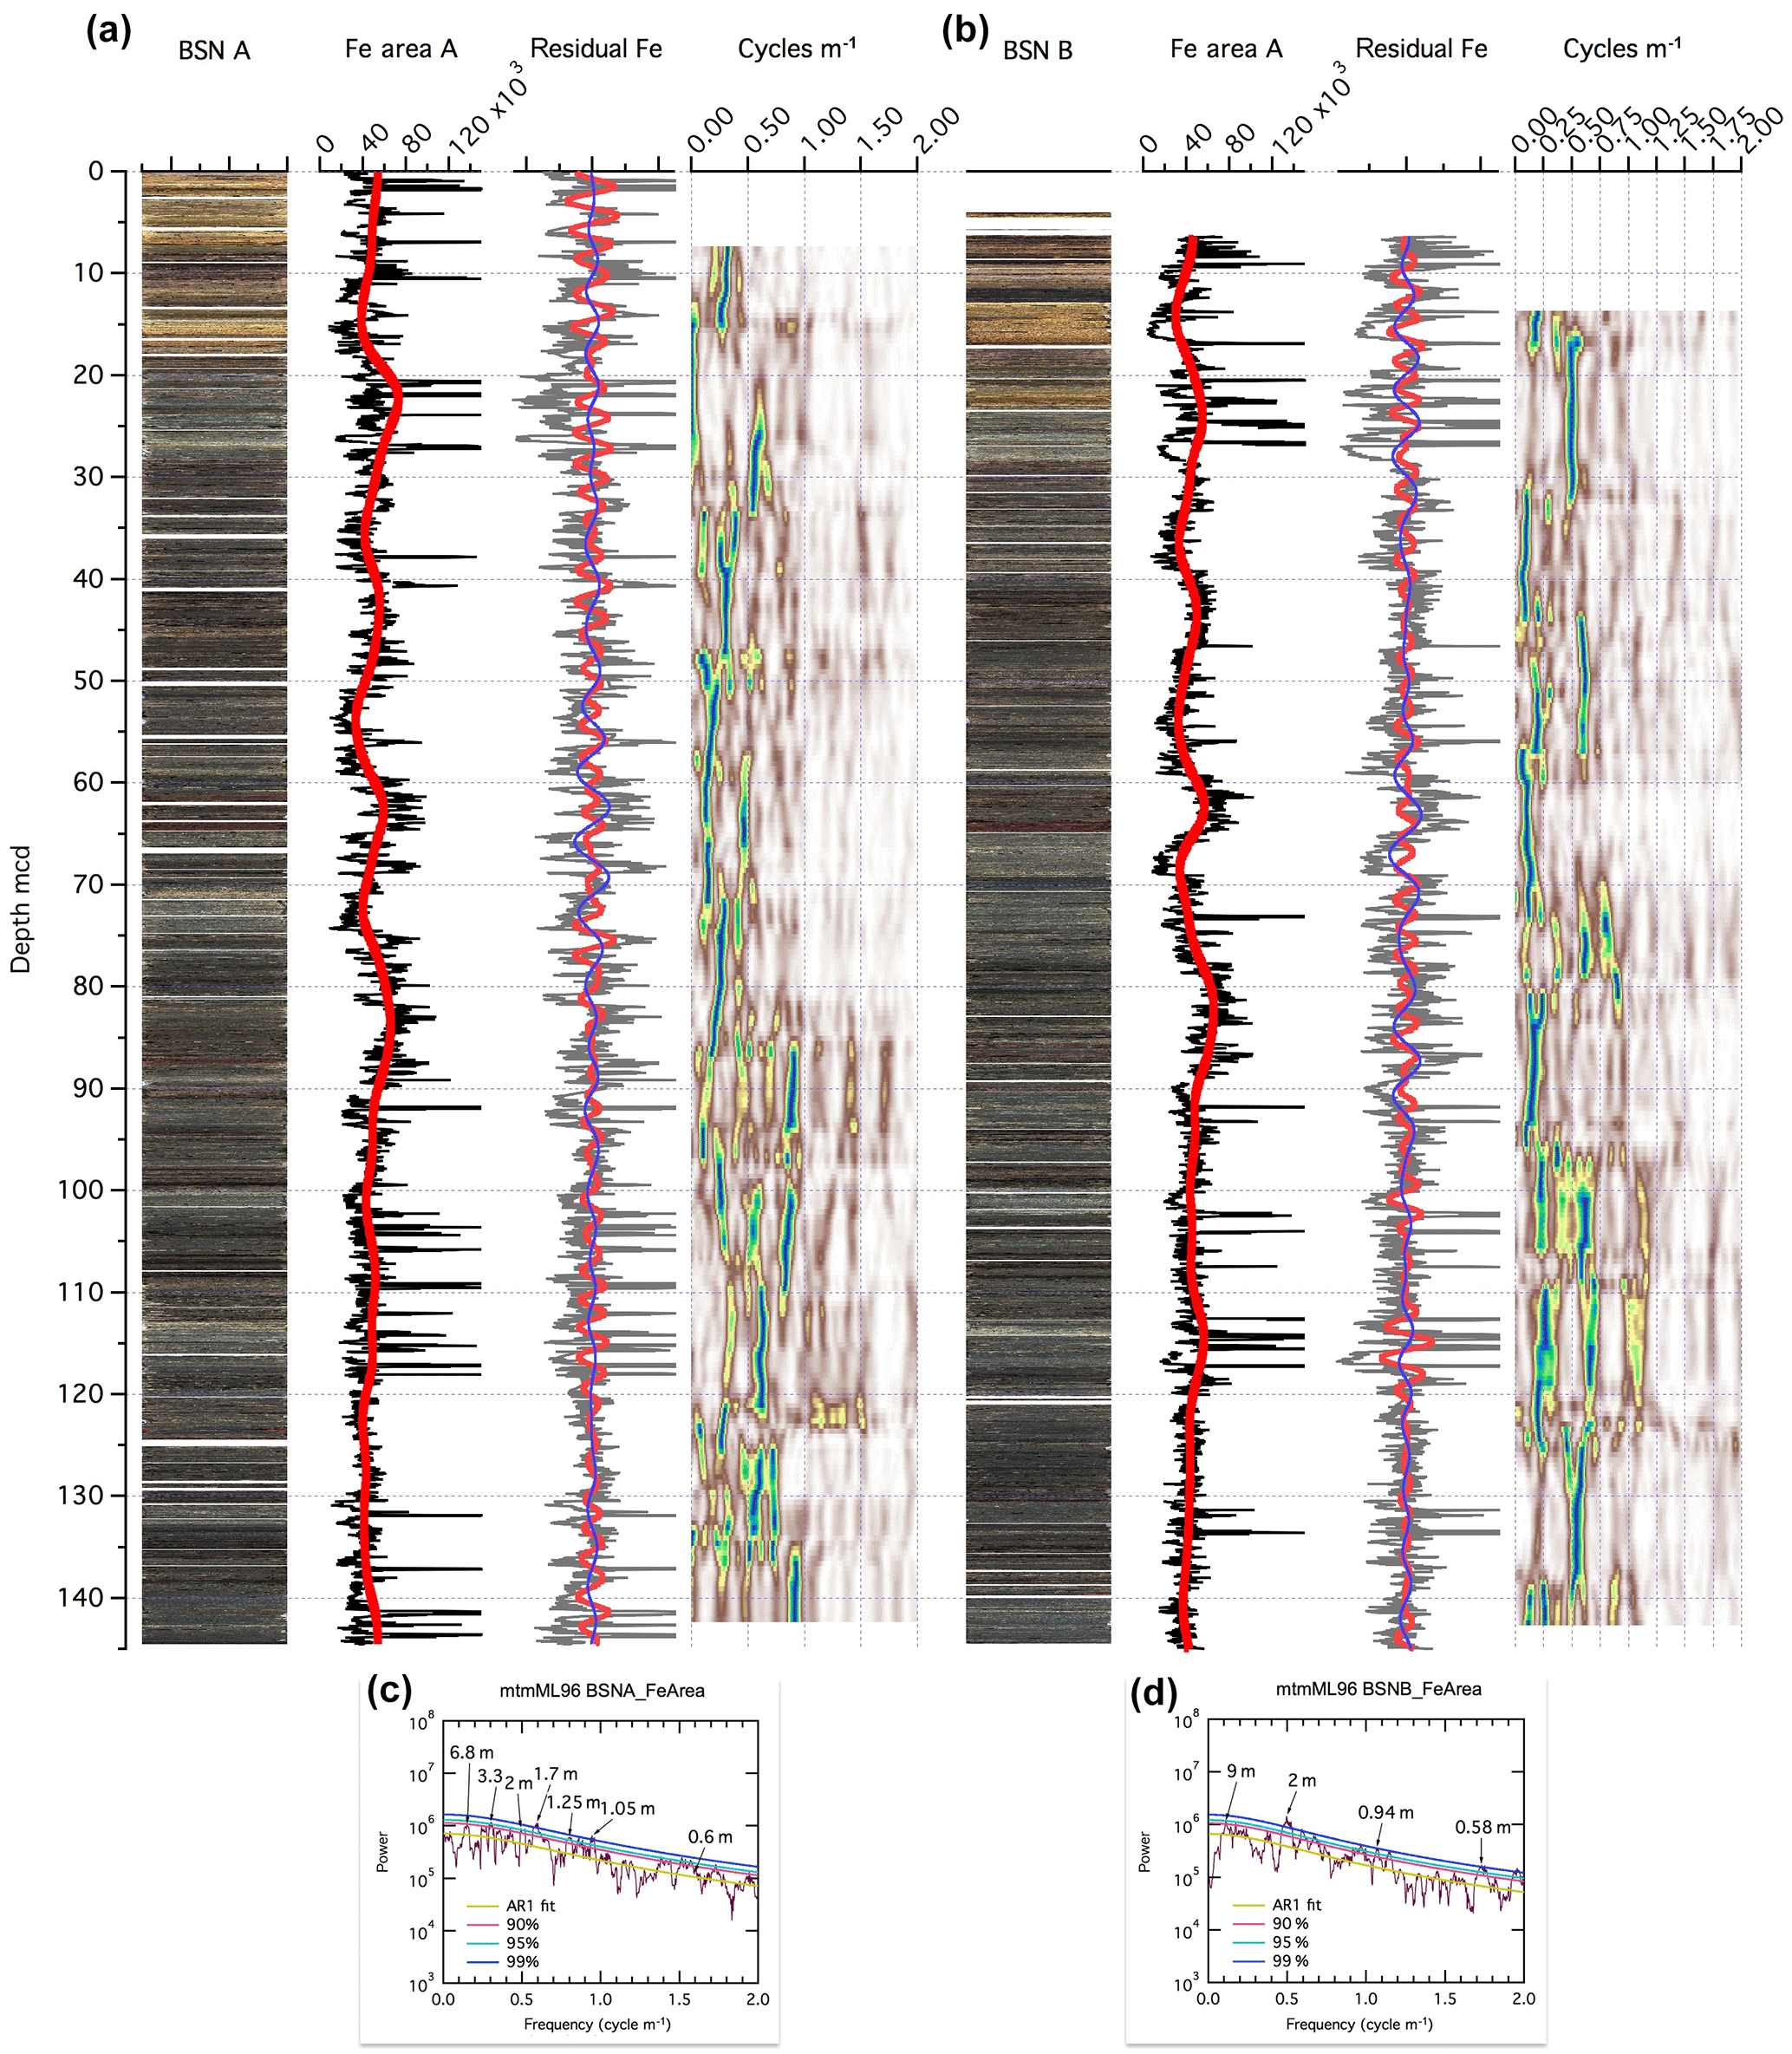
Figure 3Basin Substation BSN-A (a) and BSN-B (b) core images, XRF Fe intensity data, and spectral analysis on composite depth scale. Panels (c, d) show the MTM power spectra for BSN-A and BSN-B Fe data. For details see Fig. 2.
3.2.1 Polecat Bench
At PCB, the dominant cycles in Fe intensity data are 8.2, 3.45, 1.2, 1.02, and 0.58 m long (Fig. 2), and in the a* data 7.8–8, 3.45, and 1.1 m (Fig. S6). This result is consistent with the observation of 7.7, 3.3, and 1.1 m long cycles in a* data obtained from the outcrop (Abdul-Aziz et al., 2008). The slight difference in length could be due to thickness variations in paleosols and sandstone beds between the drill site location and the outcrop. The two longer cycles around 8 and 3.5 m have been interpreted as precession and sub-precession or millennial-scale cycles (see Abdul-Aziz et al., 2008). Assuming that the 8.2 m cycles represent the averaged 21 kyr long precession cycle, the other cycles have a period of 8.83, 3.1, 2.61, and 1.48 kyr. The evolutionary spectra show some slight changes in the length of the dominant cycles around 8 m, which can be interpreted as changes in sedimentation rate.
3.2.2 Basin Substation
At BSN, a range of dominant cycles in Fe intensity are apparent (6.8, 3.3, 2, 1.7, 1.25, 1.05, and 0.58 m; Fig. 3). In the a* data, a similar variety can be observed (Fig. S7). The evolutionary spectra show that cycles are not persistent over the entire succession, hampering the construction of a cyclostratigraphic age model at BSN. These irregularities in cyclicity could point to strong changes in sedimentation rate, condensed intervals in the record, and/or changes in the processes regulating the Fe content in the sediment. Relatively stable cycles can be observed in the interval from 50 to 85 m, with dominant 6.8 m cycles that might correspond to the precession cycles with ∼ 8 m length in the PCB core. Because the cycles are not persistent for the entire drill core, a cyclostratigraphy for BSN was not established here.
3.2.3 Gilmore Hill
At GMH the dominant cycles in Fe intensity and a* data are 7.5–6.7, 3.3, 2.5, ∼ 1, and 0.62 m long (Figs. 4, S7). The evolutionary spectra show relatively regular cycles just before the Elmo event (see discussion below), which is cut out by sandstones of a channel fill at 0–20 m. Below this, the dominant cycle undulates around 7 m and is clearly visible in the data. Long-term sediment accumulation rates in the closest outcrop section with magnetostratigraphy (Clyde et al., 1994, 2007) suggest that 7 m of sediment in this part of the basin represents between 14 500 and 25 500 years and thus is consistent with precession. The 7 and 3.3 m long cycles are also consistent with precession and half-precession cycles observed in a* values from the Bighorn Basin Deer Creek amphitheater section, which is ∼ 17 km away along the McCullough Peaks escarpment (Abels et al., 2013). Thus these cycles can be used for building a cyclostratigraphy.
Table 1PETM age model for Polecat Bench (PCB) and ODP Sites 690, 1262, 1263, 1265, 1266, and 1267. From left to right: precession cycle number of the extracted cycles as in Röhl et al. (2007) and this study, the equivalent depth in the Polecat Bench outcrop and the BBCP drill core, the respective depth of the assigned precession cycles at ODP sites, the relative age to the onset of the PETM assuming 21 kyr duration for each precession cycle counted, and finally the absolute age using 55.930 Ma as the age of the onset of the PETM as in Westerhold et al. (2007). Bold fond marks the onset of the PETM as identified in each drill core.
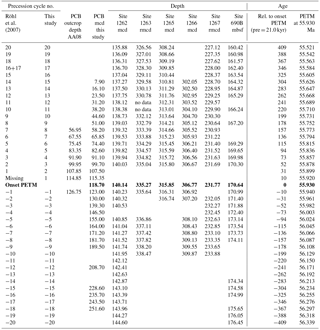

Figure 4Gilmore Hill GMH-A (a) and GMH-B (b) core images, XRF Fe intensity data, and spectral analysis on composite depth scale. Panels (c, d) show the MTM power spectra for GMH-A and GMH-B Fe data. For details see Fig. 2.
The obtained data allow the construction of a cyclostratigraphy for drill cores from GMH and PCB. We correlated GMH and PCB records with outcrop successions to allow full integration of Bighorn Basin surface-derived data with the drill cores.
4.1 Age model for PCB PETM
For the PCB drill cores, a correlation to a composite outcrop (Abdul Aziz et al., 2008) is already available (Bowen et al., 2015), identifying well-known local marker beds consisting of red to purplish paleosols. The rhythmic stacking pattern of the paleosols is driven by orbital precession cycles and was successfully used to establish a cyclostratigraphy for the PETM at PCB (Abdul Aziz et al., 2008) roughly consistent with independent age models from deep-sea cores (Farley and Eltgroth, 2003; Röhl et al., 2007). For the PCB cores a set of pedogenic age models was developed, calculating time based on thickness, sediment type, and paleosol maturity of individual stratigraphic units (Bowen et al., 2015), but no cyclostratigraphy similar to the outcrop has been developed so far.
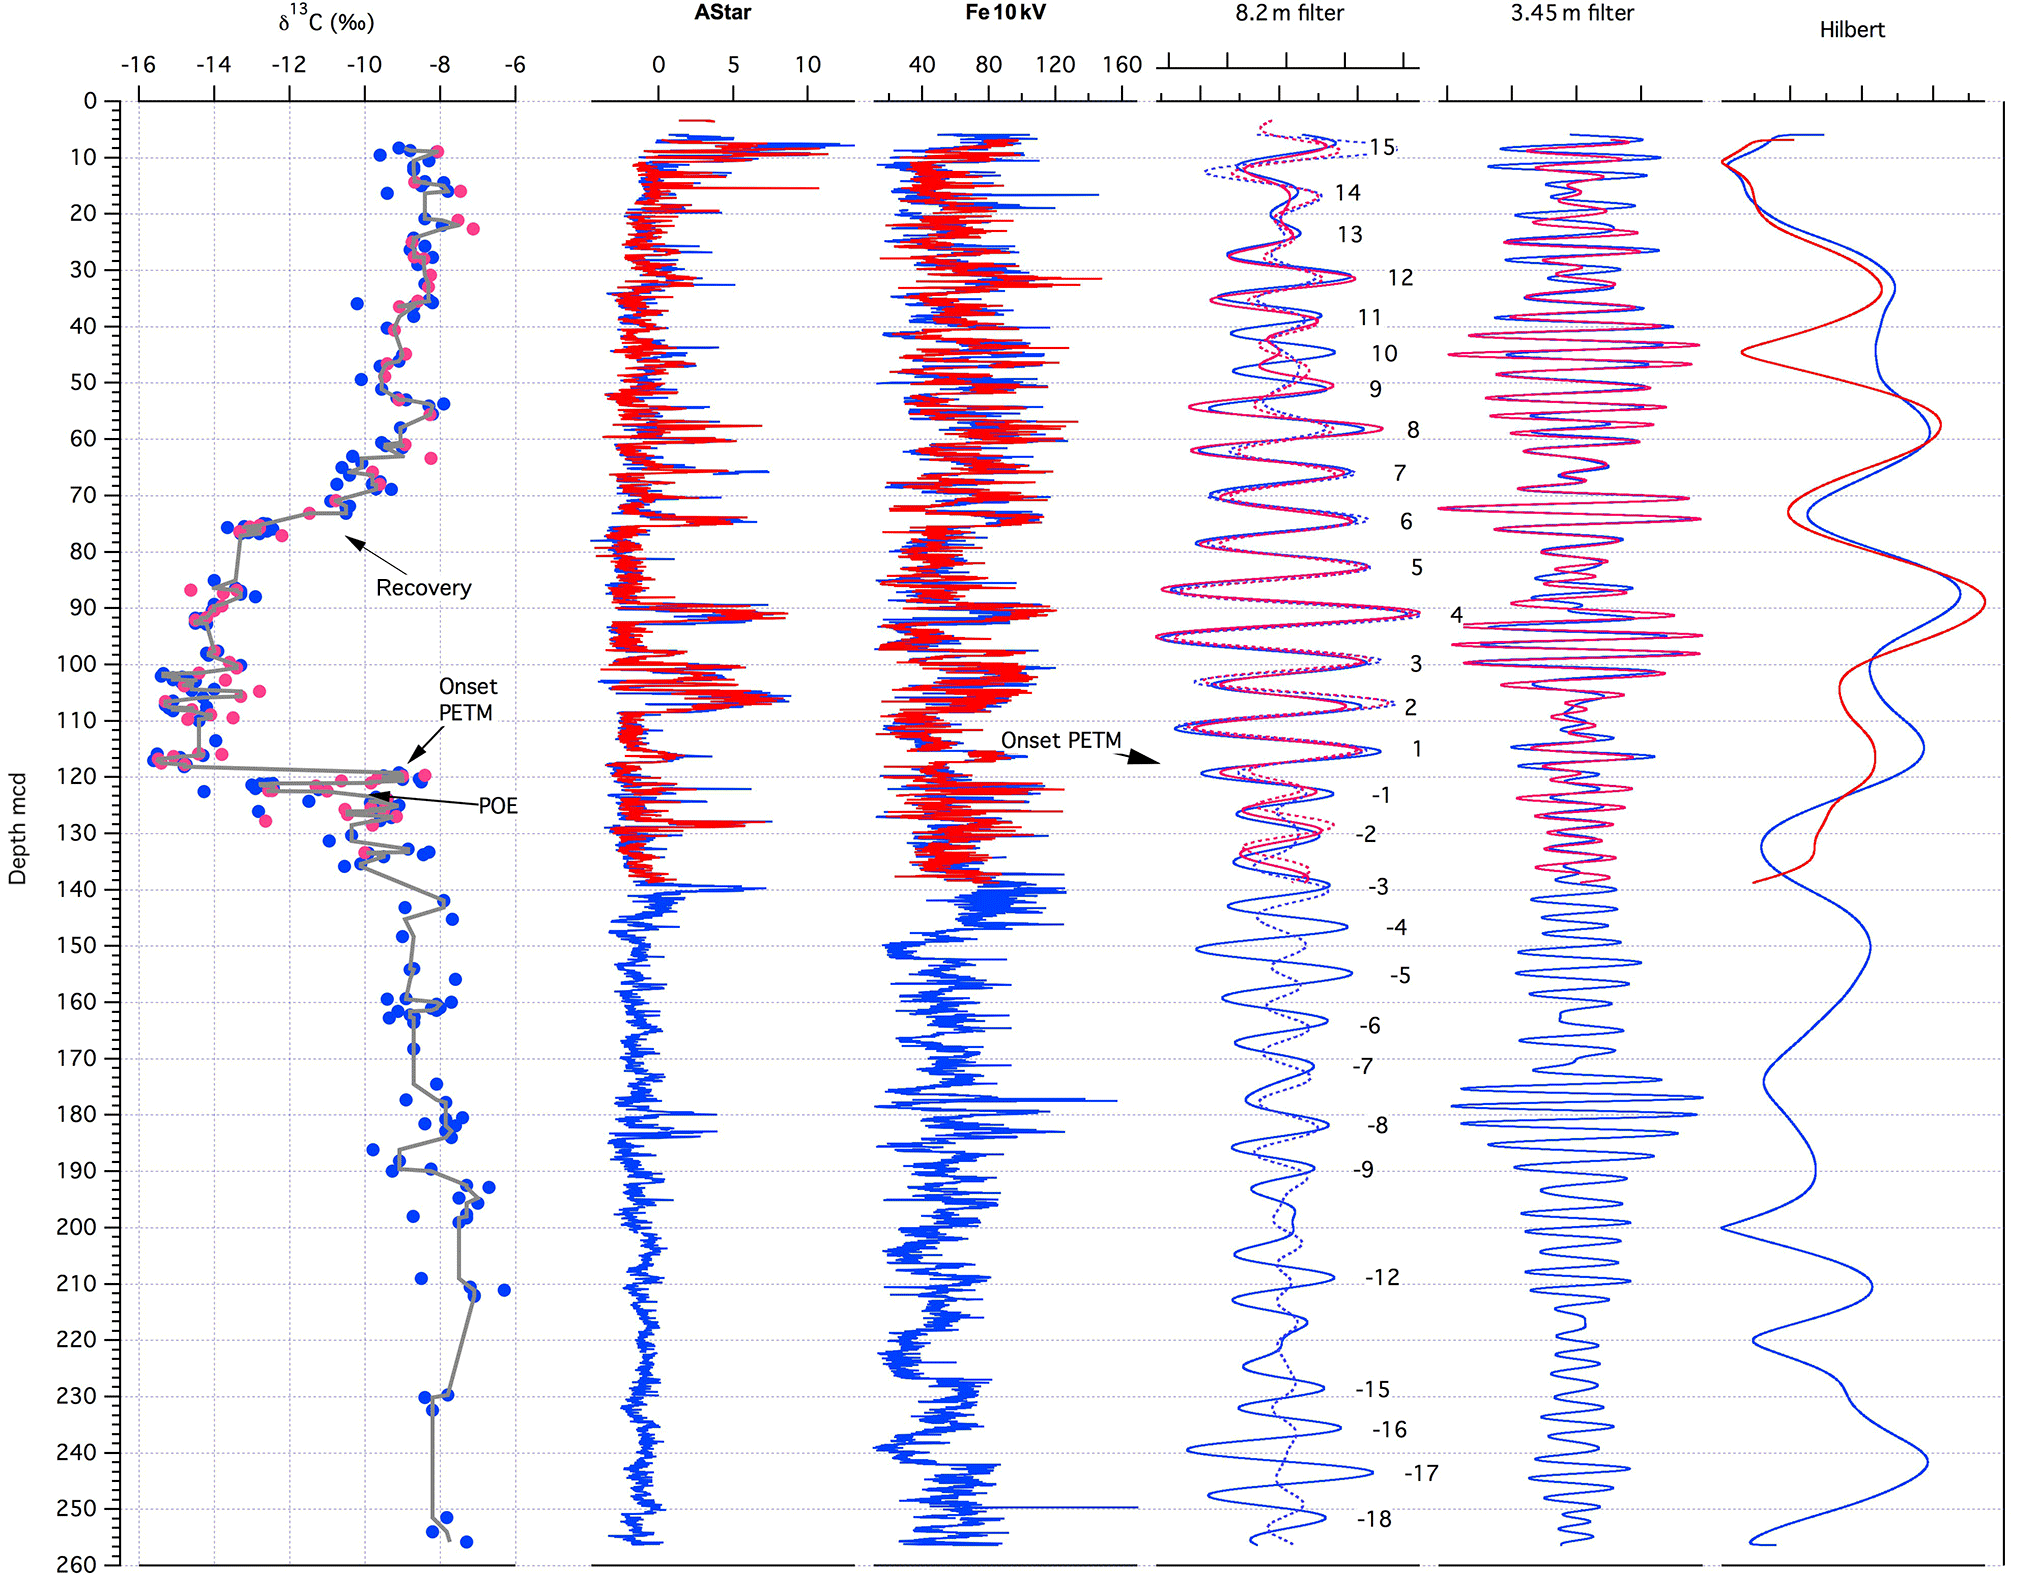
Figure 5Cyclostratigraphy for Polecat Bench. From left to right: PCB-A (red) and PCB-B (blue) soil nodule carbon isotope data (Bowen et al., 2015), a* data from color scanning, and XRF Fe intensity data (in total counts area ⋅ 1000). The Gaussian filter of the longer 8.2 m cycle (precession) of the Fe data (solid lines) and from a* data (dashed lines). Numbers mark the precession cycle counting starting at the onset of the PETM; positive numbers are time after PETM, negative numbers before. On the right is a Gaussian filter of the 3.5 m cycle (half precession) and the amplitude modulation of the Fe data extracted with Hilbert transform using the “astrochron” software package (Meyers, 2014).
The cyclostratigraphy for PCB cores presented here is based on cycle counting of both the a* and XRF Fe data cycles that are interpreted to be related to precession. Precession and sub-precession or millennial-scale cyclicity was extracted using Gaussian filtering of a* and XRF Fe data (Fig. 5) with the Fe data providing a much cleaner rhythmic signal due to the better signal-to-noise ratio compared to a*. Taking the soil nodule carbon isotope data (Bowen et al., 2015) as reference, we started counting at the onset of the PETM CIE (see Fig. 5), with positive numbers up-core and negative numbers down-core. The filter of the precession cycles of ∼ 8.2 m in both data sets show modulations that are consistent with eccentricity. We estimate that the PCB core covers 33 precession cycles, of which we use 29 for a direct age assignment. Cycles −10, −11, −13, and −14 are hard to identify because of the low-amplitude variation in the data. This observation is consistent with lower amplitudes in a* and XRF Fe data 300 kyr prior to the onset of the PETM in deep-sea sediments from Walvis Ridge (South Atlantic) and Blake Nose (North Atlantic) (Westerhold et al., 2007) caused by a minimum in the long 405 kyr eccentricity cycle.
For each of the precession cycles we assume a constant duration of 21 kyr as done in previous deep-sea cyclostratigraphic models (Röhl et al., 2007; Westerhold et al., 2007) setting the onset of the PETM as 0. Relative ages with respect to the onset of the PETM are given in Table 1. For absolute ages we use the age for onset of the PETM as 55.930 Ma (Westerhold et al., 2007, 2015) and add or subtract the relative age. According to the filter of the a* and Fe data, we also arbitrarily assume that the onset of the PETM is located in the minimum between cycle −1 and 1 (Fig. 5). Regarding the phase relationship, whether paleosols correspond to precession minima or maxima (Abels et al., 2013) is unknown and not relevant for establishing a cyclostratigraphy based on cycle counting itself. For simplicity we assume that paleosols correspond to more negative bulk carbonate carbon isotope values in more clay-rich layers in the deep-sea records (higher Fe XRF intensities; Zachos et al., 2010; Littler et al., 2014; Zeebe et al., 2017). Thus, the onset of the PETM was set into a precession minimum in the PCB cyclostratigraphy model. The new cyclostratigraphy is almost identical to the outcrop model (Abdul Aziz et al., 2008) for the PETM. Because we use the longer drill core from PCB now as a reference, minor discrepancies between outcrop and drill core paleosol and sandstone bed thicknesses had to be corrected in the tie points for the outcrop (Abdul Aziz et al., 2008). This did not affect the original estimates for the duration of the PETM CIE and rapid recovery reported in Abdul Aziz et al. (2008). The new cyclostratigraphic age model for PCB covers a longer stretch across the PETM compared to previous outcrop studies spanning from the latest Paleocene precession cycle −15 (as in Westerhold et al., 2007) to early Eocene precession cycle 15: 56.234 to 55.626 Ma with the PETM at 55.930 Ma.
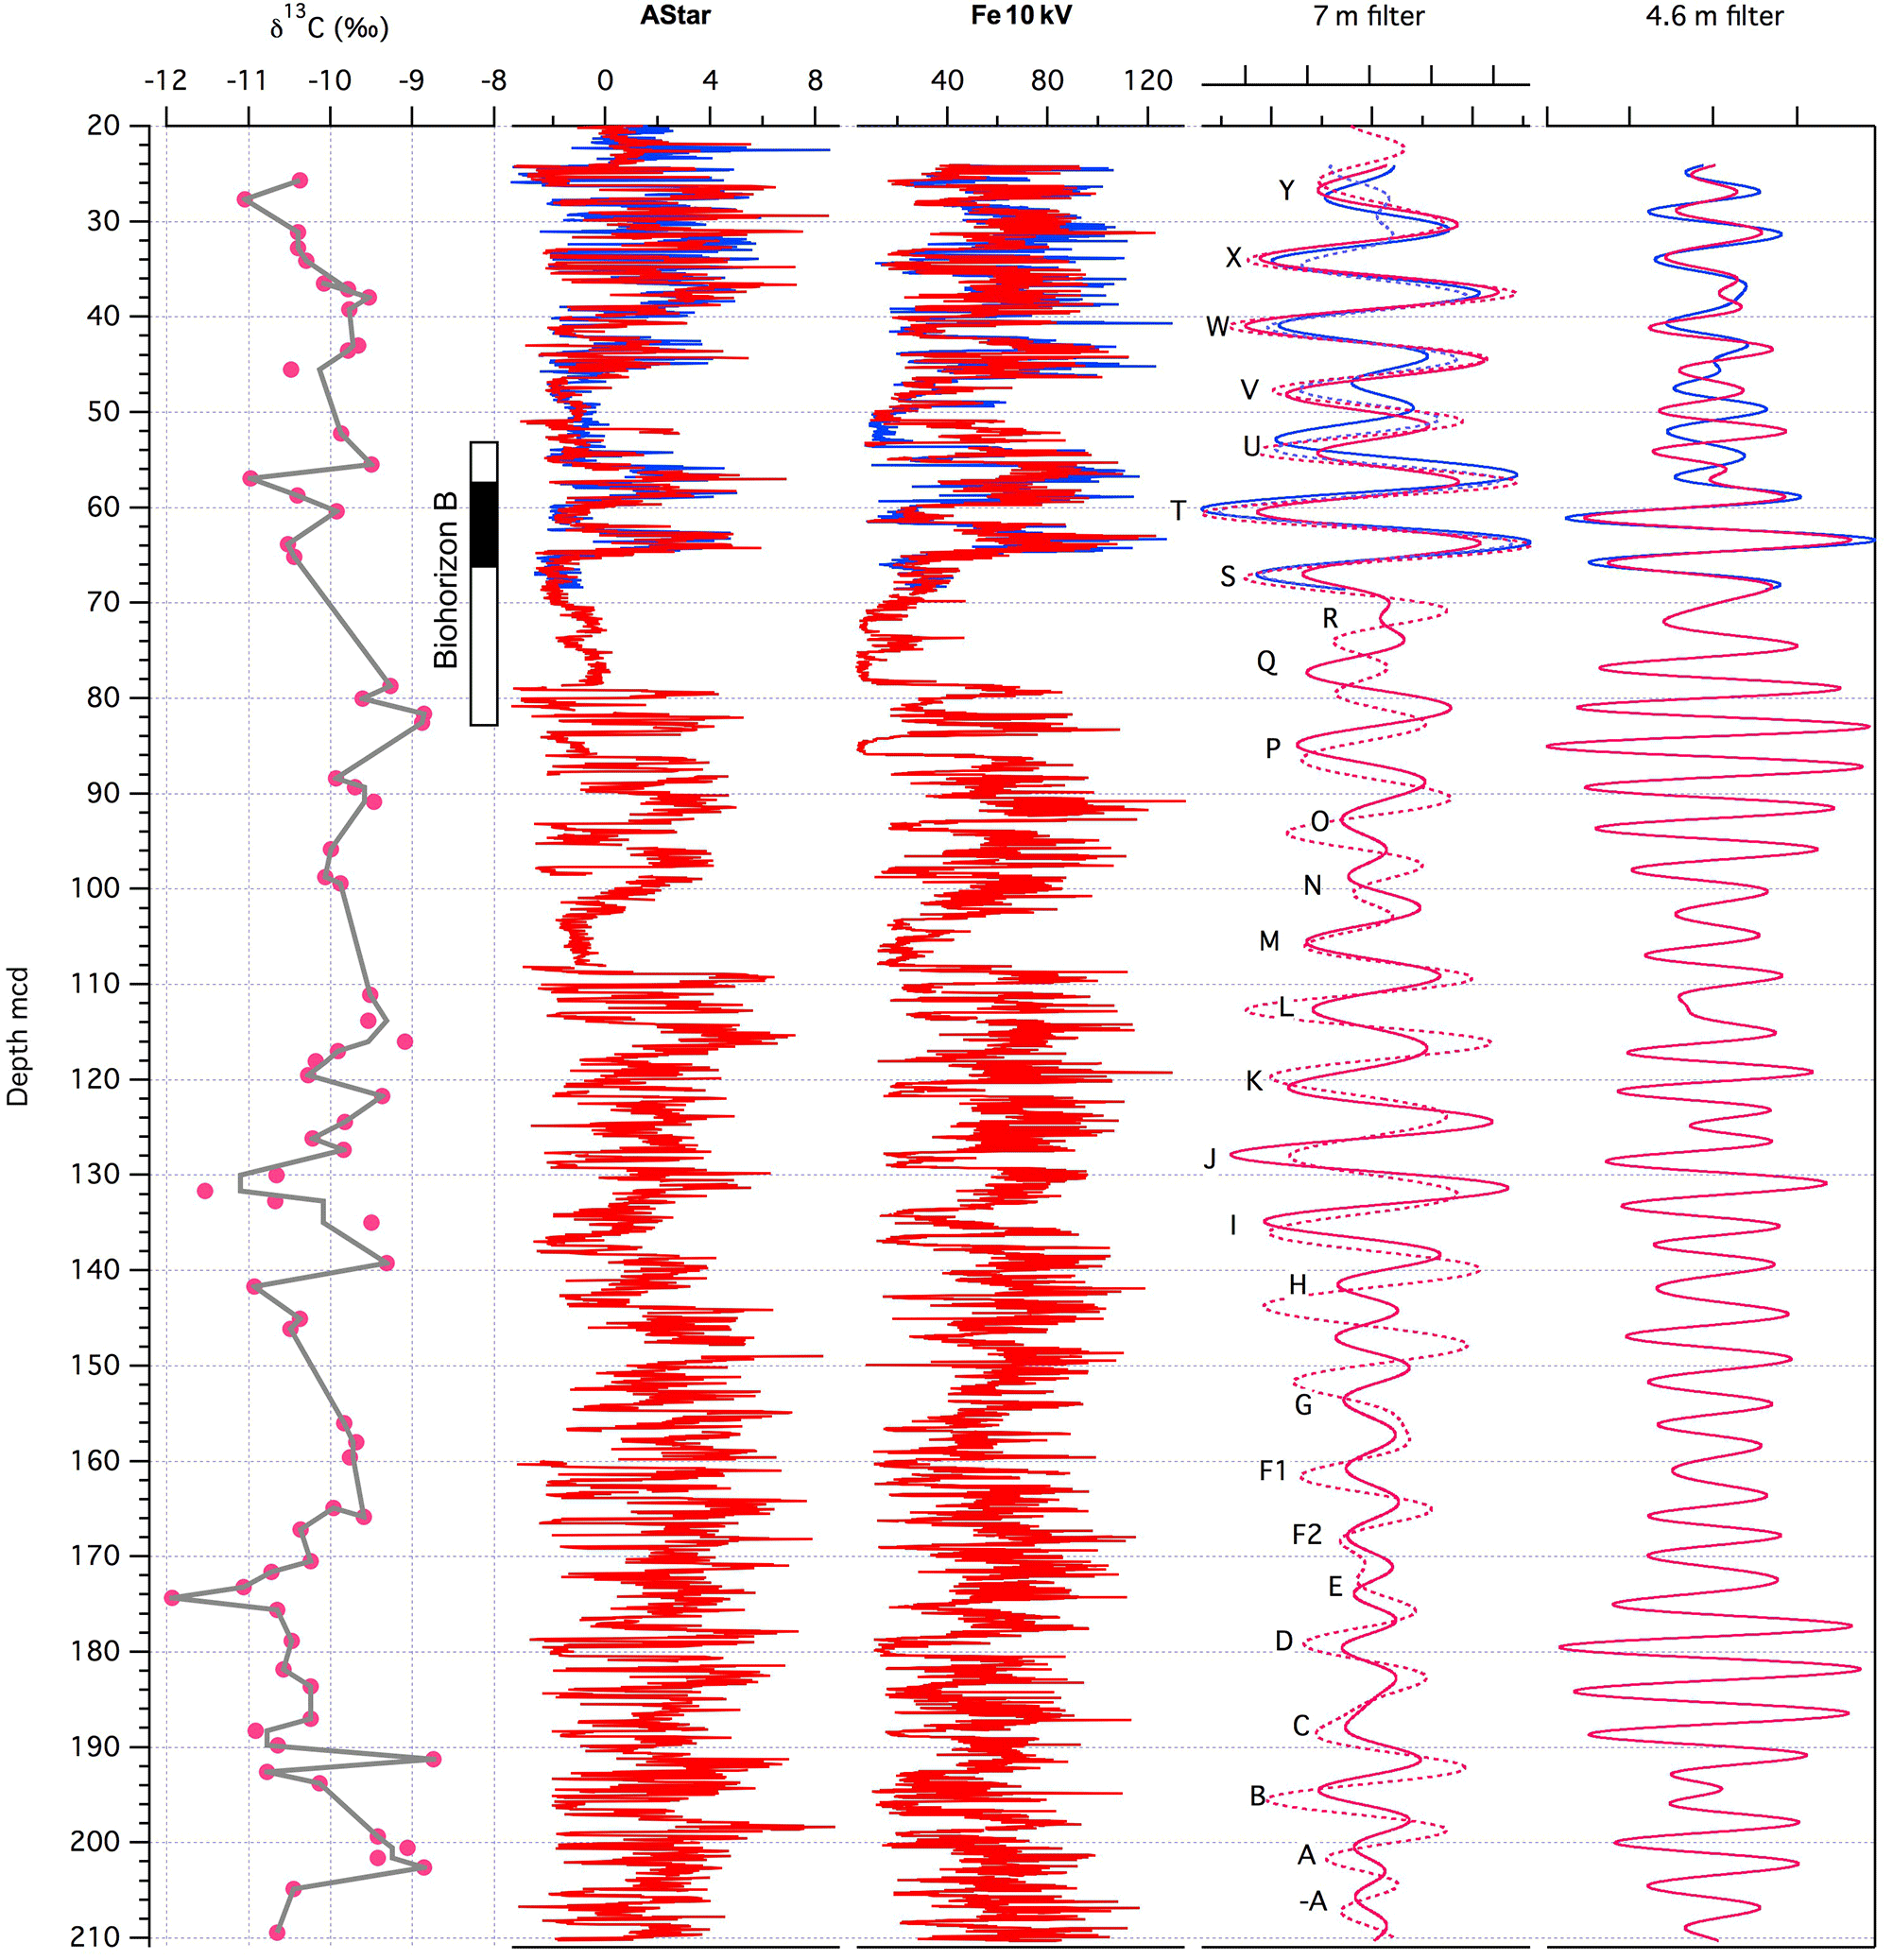
Figure 6Cyclostratigraphy for Gilmore Hill. Left to right: GMH-A (red) soil nodule carbon isotope data (Table S9) for stratigraphic reference, a* data from color scanning, and XRF Fe intensity data (in total counts area ⋅ 1000). The Gaussian filter of the longer 7 m cycle (precession) of the Fe data (lines) and from a* data (dashed lines). Letters mark the precession cycle counting following Abels et al. (2013) labeling at Deer Creek amphitheater. On the right is a Gaussian filter of the 4.6 m cycle. Please note that the cyclostratigraphy is straightforward and correlates well with Abels et al. (2013) for the range A to P; however, cycles P to Y are new and not in Abels et al. (2013).
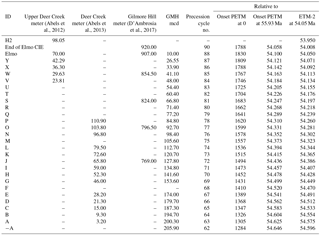
Table 2Age model for Gilmore Hill (GMH) drill core and regional outcrops. From left to right: labeling ID for identified precession cycles (see text for details), the respective depth of the assigned precession cycles in the Upper Deer Creek, the Deer Creek, and the Gilmore Hill sections as well as the Gilmore Hill BBCP drill core. Precession cycle number as defined at ODP sites counting precession cycles (Westerhold et al., 2007) followed by the relative and absolute age to the onset of the PETM assuming 21 kyr duration for each precession cycle counted, using 55.930 Ma for the onset of the PETM (Westerhold et al., 2007) and using 54.050 Ma for the absolute age of ETM-2 (Westerhold et al., 2017a).
4.2 Age model for GMH – pre Elmo interval
Extensive outcrop work and cyclostratigraphic interpretations are also available for terrestrial sediments across the ETM-2 (Elmo, Lourens et al., 2005) in the Bighorn Basin (Clyde et al., 1994, 2007; Abels et al., 2012, 2013, 2016; D'Ambrosia et al., 2017). Alluvial sedimentary cycles before and after the Elmo are shown to be precession forced (Abels et al., 2012). The GMH cores cover an interval prior to the ETM-2, which is cut out by a sandstone channel complex (Clyde et al., 2013). To establish a cyclostratigraphy for the GMH drill cores, precession and half-precession cycles were extracted from the a* and XRF Fe data (Fig. 6). Both data sets show high-amplitude variations as expected from the more reddish terrestrial deposits. The extracted a* and XRF Fe data cycles are consistent with previous cyclic variations in a* values from outcrop samples. The drill core data have been correlated to the Deer Creek (Fig. S9; Abels et al., 2012) and Gilmore Hill (Fig. S10, D'Ambrosia et al., 2017) sections using prominent purple marker beds and field observations. Subsequently, we adopted the labeling system of Abels et al. (2013, A–P) but extend it towards the ETM-2 at GMH (Q to Y). As already observed in the PCB drill cores, data from the GMH core show the same precession length and amplitude modulation as observed in outcrop samples (Fig. S9). Combining the correlation to the outcrop interpretation with the precession-filtered data from the drill cores we established a best-fit cycle counting age model for GMH drill cores. This is necessary because the filtering of a* and Fe data is not consistent in all parts of the record. Basic tie points for correlation and cyclostratigraphy are given in Table 2. For a relative age model we assigned the precession cycle numbers identified at Walvis Ridge ODP sites from Leg 208 and their relative age to the onset of the PETM (Westerhold et al., 2007) to the precession cycles found in GMH. For absolute ages we provide one option that refers to the age of 55.930 Ma for the onset of the PETM (see PCB) and another option relative to the age of 54.05 Ma for ETM-2. The age model suggests that the GMH cores cover precession cycles −A to Y, representing roughly 500 kyr of terrestrial deposition from 54.596 to 54.071 Ma.
This study not only provides a high-resolution cyclostratigraphic age model for the BBCP drill cores but also improves existing age models for the interval spanning the PETM and prior to ETM-2. BBCP drill core and Bighorn Basin outcrops are an ideal basis for revision of the PETM age model that is mainly derived from deep-sea sediments with low sedimentation rates. Dissolution of carbonate, particularly at the onset of the PETM, hampers the establishment of a complete chronology for the PETM from marine cores (Kelly et al., 2005, 2010). Uncertainty in correlation between terrestrial successions from the Bighorn Basin and marine records also makes it difficult to evaluate if the terrestrial Biohorizon B is synchronous with major changes in marine calcareous nannofossil assemblages prior to ETM-2 (Agnini et al., 2007). Bighorn Basin deposits of the Fort Union and Willwood formations with their extremely high sedimentation rates allow very detailed insight into changes in biota on land. Using our new astrochronology we can test if these biotic turnovers were coeval in marine and terrestrial ecosystems.
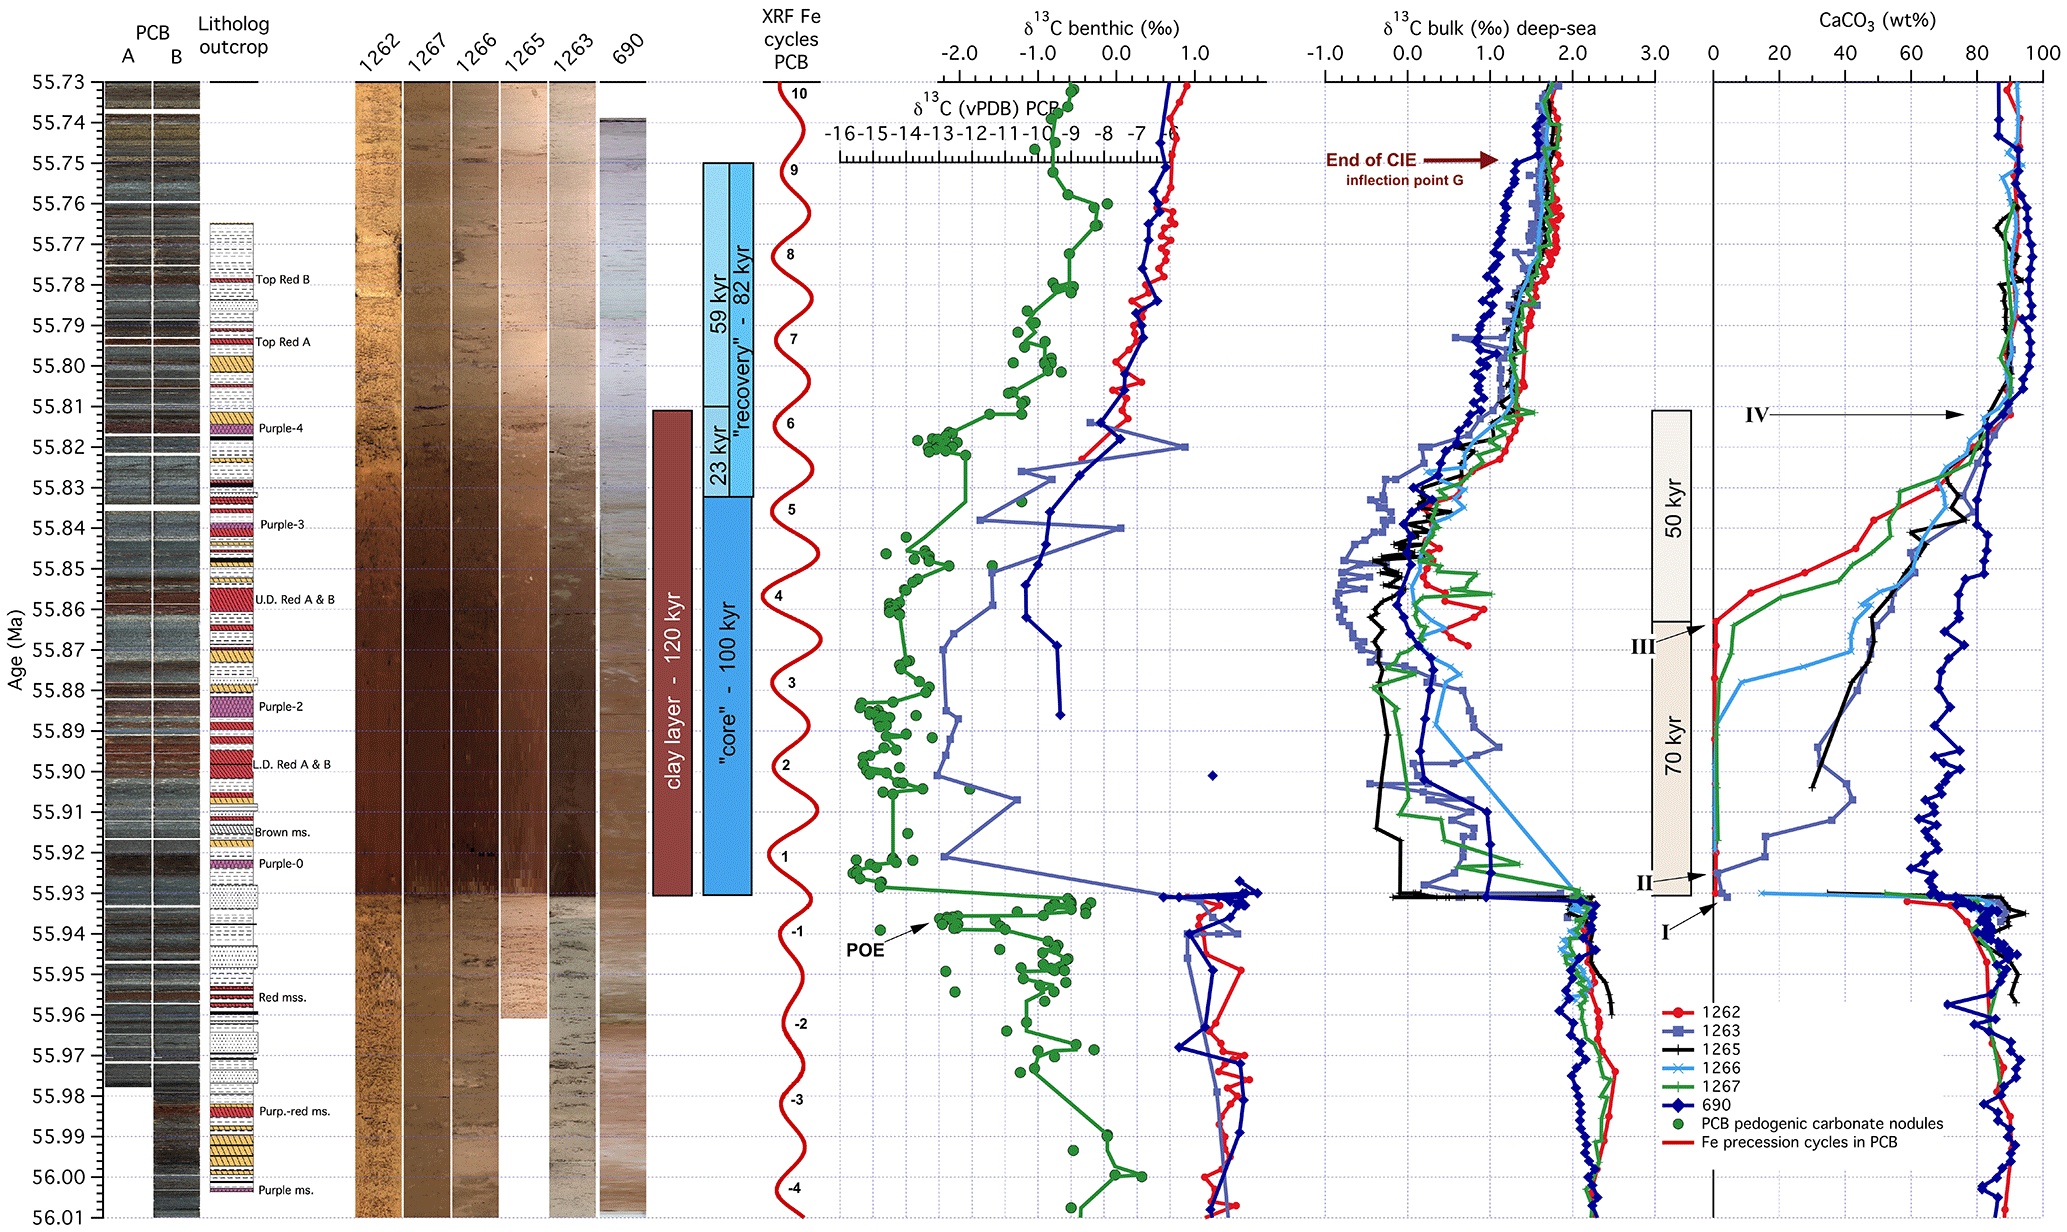
Figure 7Overview for the Paleocene–Eocene Thermal Maximum (PETM) data from deep-sea records and the terrestrial Polecat Bench (PCB) drill core against age. Core images and lithology log (Gingerich, 2006) for PCB, core images of ODP Sites 1262, 1267, 1266, 1265, 1263, and 690 (aligned from left to right according to the water depth from deep to shallow), defined phases of events in the PETM (Röhl et al., 2007) on the new age model, extracted precession cycles using a Gaussian filter of the PCB XRF Fe intensity data, stable carbon isotope data from PCB soil nodules (Bowen et al., 2015), the deep-sea benthic foraminifera and bulk sediment (690 – Bains et al., 1999; Leg 208 – Zachos et al., 2005), and carbonate content (690 – Farley and Eltgroth, 2003; Leg 208 – Zachos et al., 2005). Letters indicate horizons as identified by Zachos et al. (2005) adjusted to the new age model for the deep-sea sites.
5.1 Synchronizing deep-sea and continental records for the PETM
Precession-related variations in XRF core scanning data (Röhl et al., 2000, 2007) and the concentration of extraterrestrial 3He in ODP cores from the same regions (Farley and Eltgroth, 2003; Murphy et al., 2010) were used to develop an age model for the PETM from pelagic sequences. During the PETM, massive dissolution of carbonates in the deep-sea truncated the cyclostratigraphic record (Zachos et al., 2005), complicating the construction of age models. Cyclostratigraphy and extraterrestrial 3He age models are roughly consistent but show some discrepancies in the duration and recovery of the CIE (Murphy et al., 2010). The extraterrestrial 3He age model proposed 217 kyr for the entire CIE compared to 171 kyr by cyclostratigraphy (Röhl et al., 2007; Murphy et al., 2010). The duration of the clay layer, which is the interval between the sharp contact of dissolution at the onset and the recovery of carbonate content to pre-event levels (Fig. 7), was estimated to be 167 kyr using extraterrestrial 3He (Murphy et al., 2010) and ∼ 95 kyr using cyclostratigraphy (Röhl et al., 2007). The helium age model can be compromised if the flux of extraterrestrial 3He was not constant during the PETM. Orbital chronology depends on the correct recognition of all sedimentary cycles, which is notoriously difficult at the onset of the PETM. Severe carbonate dissolution, including the burn-down of carbonate deposited before the actual ocean acidification during the onset of the PETM (Zeebe and Zachos, 2007), could explain the difference in these estimates of the PETM duration. In addition, cyclostratigraphic work around the deep-sea PETM sections (Röhl et al., 2007; Westerhold et al., 2007) limits the maximum duration of the clay layer to seven precession cycles, or 147 kyr, which is within the error of the 3He age model (210–143 kyr, Murphy et al., 2010).
At the Walvis Ridge ODP sites, the top of the clay layer coincides with the top of the initial rapid recovery of the CIE (Recovery phase I in Murphy et al., 2010). To correlate deep-sea and terrestrial records, the onset and the top of the initial rapid recovery of the CIE are commonly used (McInerney and Wing, 2011). The PCB cyclostratigraphy indicates that the duration of this interval mentioned above covers six precession cycles or ∼ 120 kyr (assuming an average duration of 21 kyr for one precession cycle). This duration is between the estimates of 90 and 135 kyr used as a basis for the age model in Bowen et al. (2015). As a consequence, a duration of 120 kyr suggests that the deep-sea records (∼ 95 kyr) are missing ∼ 25 kyr or about one precession cycle at the onset of the event. The onset of the PETM was set into a precession minimum in the PCB cyclostratigraphy model (see above), and thus subtracting 21 kyr (one precession cycle) from the missing ∼ 25 kyr leaves us with an additional ∼ 4 kyr on top of the missing precession cycle in the duration compared to the deep sea. If we compare the PCB CIE of our new cyclostratigraphy to the deep-sea CIE using the existing orbital chronology (Röhl et al., 2007) and aligning the records at the onset of the PETM, the initial recovery from sustained minimum δ13C values will be offset by ∼ 25 kyr. A lag of 25 kyr between this major inflection in the ocean and atmosphere carbon isotope records is not possible given the rapid rate of carbon exchange between the atmosphere and surface-ocean (tens of years) and deep-ocean (hundreds of years) reservoirs (Revelle and Suess, 1957; Broecker and Peng, 1982; Bowen, 2013). We therefore modified and updated the age model of Röhl et al. (2007) from precession cycles −20 to 20 (56.320 to 55.520 Ma) by adding a precession cycle at the onset of the PETM and moving the onset of the PETM between two precession cycles (see Table 1, Figs. 7 and S12).
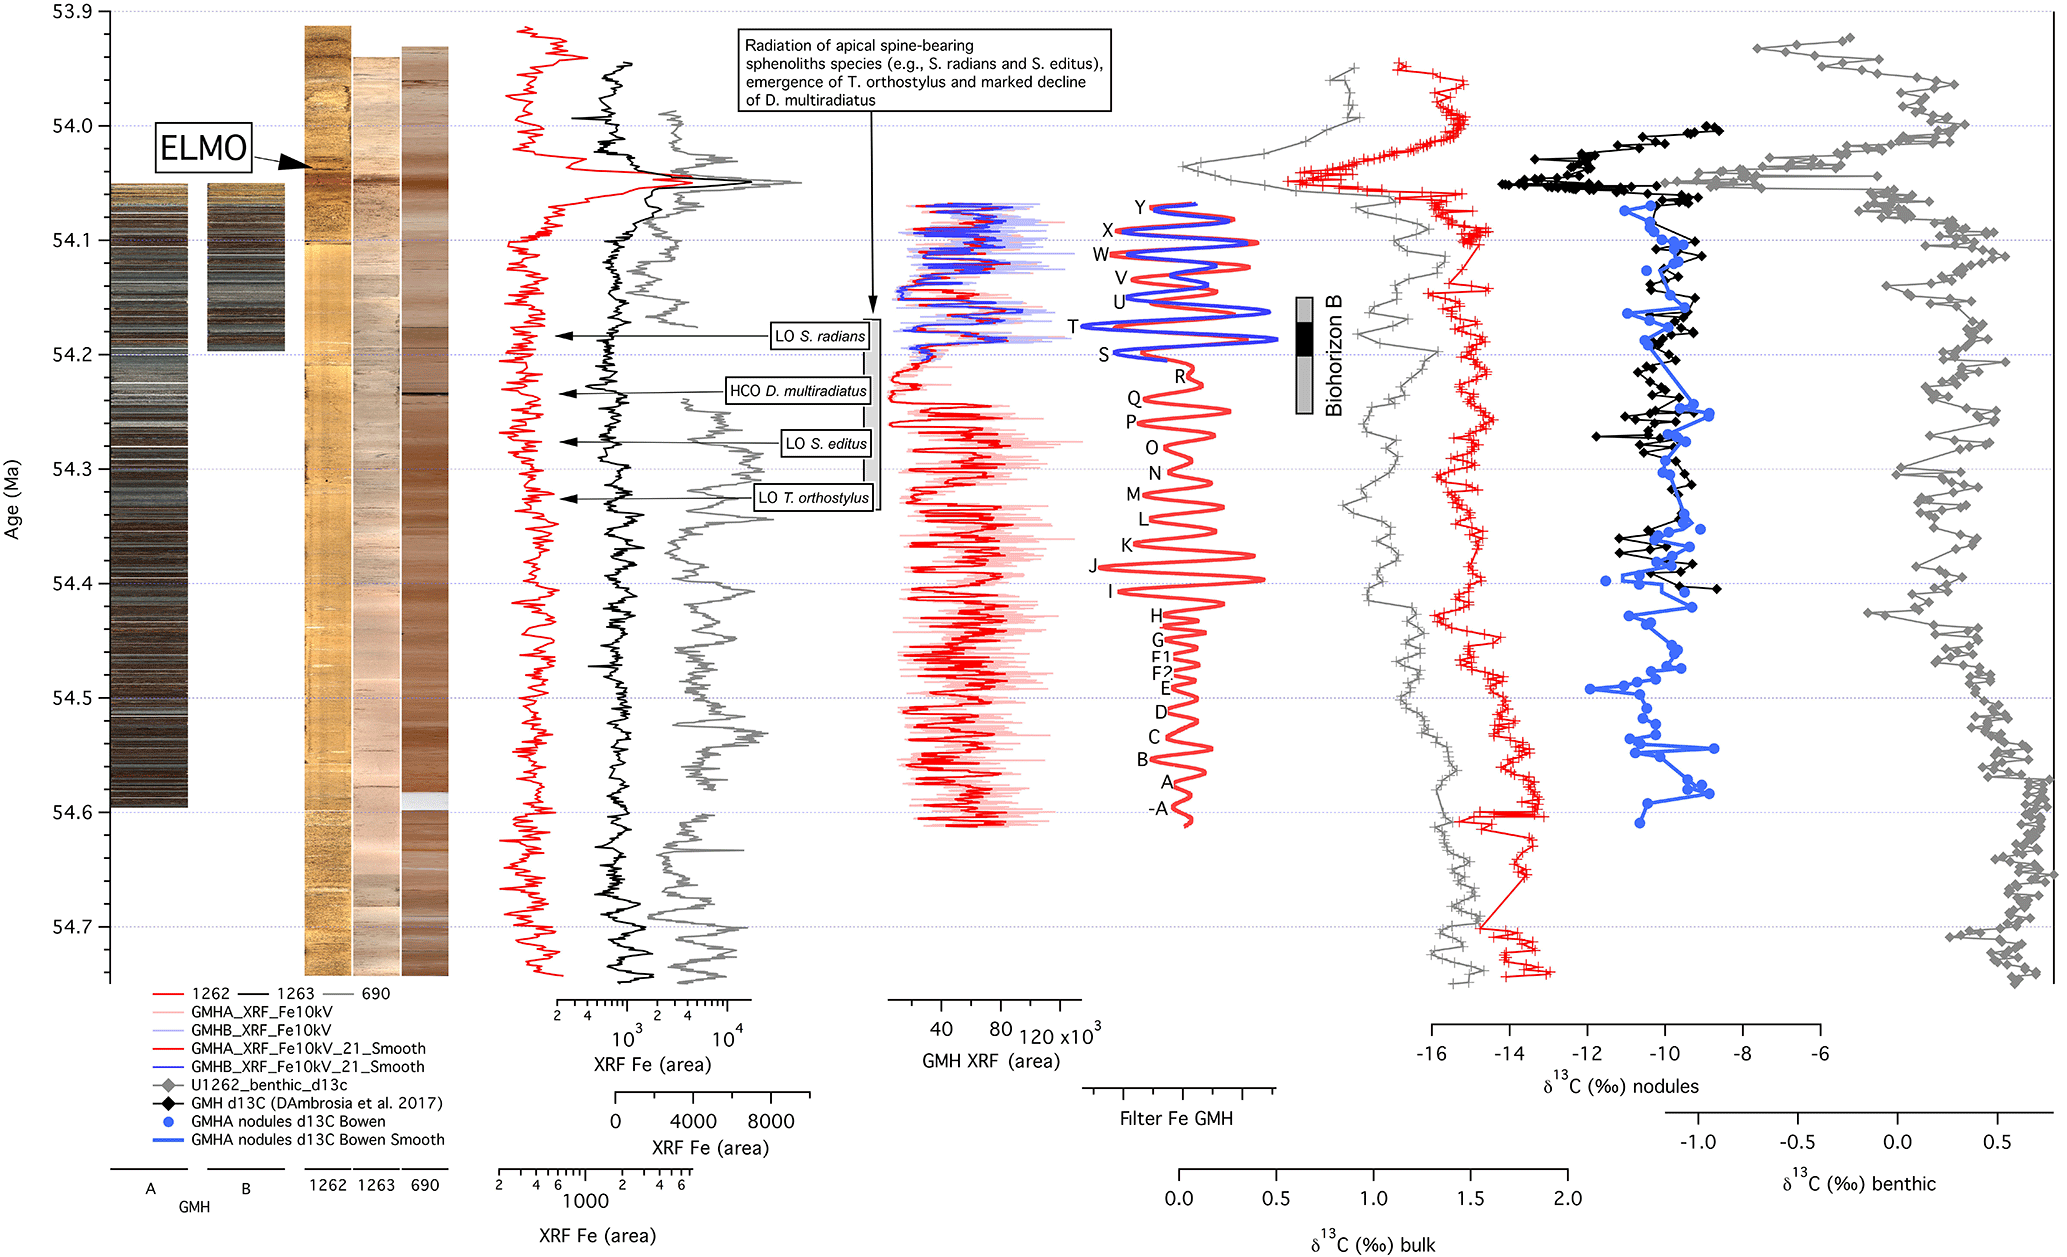
Figure 8Overview of data for the interval prior to the Eocene Thermal Maximum 2 (ETM-2) from deep-sea records and the terrestrial Gilmore Hill (GMH) drill core against age. Core images for GMH-A and B, core images of ODP Sites 1262, 1263, and 690 (aligned from left to right according to the water depth from deep to shallow), XRF Fe core scanning data from 1262 (red), 1263 (black), 690 (grey) (Westerhold et al., 2007), and GMH, extracted Gaussian filter of the GMH XRF Fe intensity data, stable carbon isotope data of soil nodules from the Gilmore Hill area (black – Gilmore Hill section; Abels et al., 2012, and D'Ambrosia et al., 2017; blue – GMH drill core), and the deep-sea benthic foraminifera (1262 – Littler et al., 2014) and bulk sediment (690 – Cramer et al., 2003; 1262 – Zachos et al., 2010). Position of Biohorizon B is after Abels et al., 2012, and D'Ambrosia et al., 2017 (black bar represents best estimate; gray bars represent conservative estimate – see text for discussion); the change in calcareous nannofossils (gray bar and text box) at ODP Site 1262 from Agnini et al. (2007).
As a result of the updated orbital chronology, the duration of the clay layer is now estimated to be ∼ 120 kyr, and the total duration of the PETM is ∼ 200 kyr, compared to the previous 95 and 171 kyr estimates (Röhl et al., 2007). Comparing the duration of the entire CIE of the PETM and understanding subtle differences between age models requires some discussion about the definition of PETM phases. The onset of the PETM CIE is relatively easy to identify in many different records. The termination of the CIE at Site 1263 and the Site 690 reference section were defined (Tables 1 and 2) by identifying an inflection point in the bulk carbon isotope curve (Röhl et al., 2007). The inflection point was labeled “G” in Zachos et al. (2005) and used for correlation to other records. It is located at 167.12 mbsf in ODP 690 (Zachos et al., 2005). Using the Röhl et al. (2007) age model this point is 153.5 kyr after the onset of the PETM (Table 2 of Röhl et al., 2007; not 171 kyr as written in Murphy et al., 2010). Using the updated age model developed in this study we obtain an age of 55.749 Ma for inflection point G, which translates into 182 kyr between onset and end CIE (Fig. 7). But the end of the recovery as outlined in Röhl et al. (2007) is between cycles 8 and 9 at ODP 690. Based on cycle counting, the duration of the CIE is roughly 170 kyr () as determined in that paper. In our revision of the age model we simply added one precession cycle; therefore the duration of the PETM sensu Röhl et al. (2007) is roughly 190 kyr ( kyr). In addition, the position of the onset of the PETM in our paper was placed between two precession cycles, adding another 7 kyr to the duration (relative age of precession cycle 2 in Röhl et al., 2007, is 24 kyr after the onset of the PETM; in our study it is 31 kyr after onset). Summing up, the PETM CIE duration is roughly 200 kyr (189 + 7 = 196 kyr) using the commonly used definition for deep-sea records (Zachos et al., 2005; Röhl et al., 2007). Identification of inflection point G defined in the deep-sea reference record of Site 690 in the PCB core and/or outcrop is not possible, preventing any comparable estimate for the entire CIE of the PETM as defined in the deep sea. Nevertheless, records from both realms have the same duration of ∼ 120 kyr from onset CIE to the end of the rapid recovery, equivalent to the clay layer in the deep sea or the interval from key event I to IV in Zachos et al. (2005).
The updated duration of the CIE in the deep sea using cyclostratigraphy is now in agreement with the 3He age model (Farley and Eltgroth, 2003; Murphy et al., 2010), but the duration of the clay layer is still more than 23 kyr shorter. Although the overall cyclostratigraphy around the PETM (Röhl et al., 2007; Westerhold et al., 2007) would allow a seventh precession cycle in the clay layer, there is no indication in the Bighorn Basin records for a missing precession cycle at the onset of the event. Six cycles in the PETM CIE have also been reported from the BH9/05 drill core of the Paleocene–Eocene boundary in Spitsbergen (Charles et al., 2011; cyclostratigraphic option B therein). U ∕ Pb dating for the onset of the PETM from the Spitsbergen record (55.866 ± 0.098 Ma) is also consistent with the 55.930 ± 0.05 Ma estimate from astronomical calibration (Westerhold et al., 2008, 2015).
Direct comparison of the 3He age model (Murphy et al., 2010) and our orbital chronology for Site 1266 (Fig. S13) shows that the initial rapid recovery located in precession cycle 6 of the PCB record is, on average, offset by 40 kyr in the 3He age model. For calibration of the constant extraterrestrial 3He flux, an average sedimentation rate between 306.92 and 308.54 mcd at Site 1266 of 1.43 cm kyr−1 based on the age model of Röhl et al. (2007) was used. It is important to note that the age model uses the average duration for precession of 21 kyr. Over hundreds of millions of years, the Moon moved away from Earth and the rotation of the Earth slowed down with time, changing the precession frequency of Earth (Laskar et al., 2004). As a consequence, the average precession cycle at 56 Ma will not be 21 kyr but rather 20.5 kyr. This subtle difference could point to the fact that, in the calibration interval of the six precession cycles used for the extraterrestrial 3He flux estimate, there is less time and therefore the sedimentation rates are a bit higher, on the order of 1.5 cm kyr−1. Assuming the decrease in the precession period over time to be valid, the extraterrestrial 3He flux would be higher, resulting in a duration of ∼ 200 kyr for the CIE (306.15 to 304.70 mcd at 1266) and ∼ 160 kyr for the clay layer. The discrepancy would be still hard to explain because to match the duration of the clay layer to the ∼ 120 kyr estimate, the sedimentation rate in the calibration interval has to be increased to 2 cm kyr−1, resulting in a cycle duration of 14–16 kyr for the six precession cycles. The duration of the CIE would also be reduced to 150–160 kyr, making this scenario rather unlikely. These uncertainties call for more 3He-based studies across the PETM to investigate if there is also time missing in the PCB sections. A relevant additional issue is whether the helium isotope ratio is affected by the enhanced coeval flood basalt volcanism in East Greenland (Wotzlaw et al., 2012). Until then we consider the updated age model presented here as a proper solution to compare deep-sea records with terrestrial records.
5.2 Synchronizing deep-sea and continental records prior to the ETM-2
Eccentricity-modulated precession cycles dominate geochemical records in the interval prior to ETM-2 and have been used to establish cyclostratigraphic age models (Westerhold et al., 2007; Zachos et al., 2010; Littler et al., 2014). To synchronize marine and terrestrial records (GMH), we simply adopted the cyclostratigraphic ages from the deep-sea sections (Fig. 8, Table 2). Remarkably, the same eccentricity-related amplitude modulation of XRF Fe data can be observed for both records. Low-amplitude precession cycles are present from 54.65 to 54.48 Ma followed by high-amplitude cyclicity around 54.44 Ma, implying a climate system feedback to modulations in precession affecting both realms (Fig. 6). Variations in the XRF Fe data of the deep sea are most likely driven by changes in carbonate deposition. In the terrestrial sediments these variations have been attributed to large-scale reorganization of the fluvial system driven by astronomically forced changes in the hydrological cycle (Abels et al., 2012). Comparing the stable carbon isotope curves from deep-sea benthic foraminifera, bulk carbonate sediment, and soil nodules (Table S9) shows similar congruent variations, even outside the extraordinary hyperthermal events (e.g., ETM-2, Abels et al., 2016). Consistent small-scale variability is clearly linked to changes in the global carbon cycle.
Knowing that the age model for the deep-sea and the Bighorn Basin records are synchronous, we can test for a temporal relation between Biohorizon B in the Bighorn Basin (Clyde et al., 2007) and biotic changes in calcareous nannofossils in deep-sea records. The best constraint on the stratigraphic position of Biohorizon B comes from the Gilmore Hill section where it falls between locality MP167 (LAD of Haplomylus) and MP166 (FAD of Bunophorus), both of which fall directly in the line of section. The middle level of locality MP167 is at 807 m (above PETM) of that section and the middle level of locality MP166 is 840 m so Biohorizon B must fall somewhere in the interval between ∼ 807 and ∼ 840 m of the Gilmore Hill section (see Abels et al., 2012; D'Ambrosia et al., 2017, for details). Another locality, MP122, that is not located directly in the line of section but has been physically correlated to the 825–835 m level in this section via bed tracing, contains both Haplomylus and Bunophorus and thus provides a more precise biostratigraphic estimate of Biohorizon B but with additional stratigraphic uncertainty due to the long-distance correlation. The 33 m of section between 807 and 840 m represents four to five precession cycles (no. 79 to no. 83 in Table 2) from 54.151 to 54.254 Ma and the 10 m of section between 825 to 835 m represents 1.5 precession cycles (between no. 81 and no. 83, centered at no. 82 in Table 2) from 54.165 to 54.195 Ma.
In sediments from ODP Site 1262 (Walvis Ridge), a series of biotic events, representing rapid evolutionary change, are documented in the calcareous nannofossil assemblage by the radiation of a “second generation” of apical spine-bearing sphenolith species (e.g., S. radians and S. editus), the emergence of T. orthostylus, and the marked decline of D. multiradiatus 200 kyr prior to the ETM-2 (Agnini et al., 2007; Fig. 8). Based on our GMH cyclostratigraphy, the terrestrial faunal turnover at Biohorizon B occurred coeval with the upper half of the deep-sea biotic events, possibly pointing to a common response of the biota in both realms to environmental change at 54.2 Ma. However, in high-resolution isotope records from the deep sea (Littler et al., 2014), there is no evidence for a major perturbation or even change in environmental conditions that could cause the synchronous response in the marine and terrestrial ecosystems, but the coincident timing could point to some common response to a forcing yet to be discovered.
Sedimentary records of Fe intensities, core images, and color reflectance data were used to build composite records for the Bighorn Basin Coring Project drill cores from Gilmore Hill, Basin Substation, and Polecat Bench. Eccentricity-modulated precession-scale cyclicity observed in the high-resolution data allowed the construction of cyclostratigraphic age models for GMH and PCB spanning a 500 kyr interval prior to the ETM-2 and a 500 kyr interval across the PETM. The established orbital chronology of the drill core data is not only consistent with previous age models from outcrops but also helps to improve the cyclostratigraphic age model for the PETM in deep-sea records. Synchronization and integration of all records define a duration of ∼ 200 kyr for the CIE and ∼ 120 kyr for the clay layer of the PETM, largely consistent with independent 3He age models. XRF and lightness data from marine and terrestrial records show coherent amplitude modulations in both investigated intervals. The combination of marine and terrestrial records on a common age model prior to the ETM-2 points towards a coeval turnover in marine and terrestrial biota likely related to a common but as yet unknown environmental change. The successful synchronizing of marine and terrestrial records using cyclostratigraphy yields potential for future research deciphering climate changes on Earth and the impact on biota at an unprecedented temporal resolution.
The data reported in this paper are tabulated in the Supplement and archived in PANGAEA under https://doi.org/10.1594/PANGAEA.875685 (Westerhold et al., 2017b).
The supplement related to this article is available online at: https://doi.org/10.5194/cp-14-303-2018-supplement.
The authors declare that they have no conflict of interest.
We thank Editor Yves Godderis and the two anonymous reviewers for their effort
and critical comments improving the paper. This research used samples
and data provided by the International Ocean Discovery Program (IODP). IODP
is sponsored by the US National Science Foundation (NSF) and participating
countries. Financial support for this research was provided by the Deutsche
Forschungsgemeinschaft (DFG) and the National Science Foundation (EAR0958821,
EAR0958583, EAR1261312).
The article
processing charges for this open-access
publication were
covered by the University of Bremen.
Edited
by: Yves Godderis
Reviewed by: two anonymous referees
Abdul Aziz, H., Hilgen, F. J., van Luijk, G. M., Sluijs, A., Kraus, M. J., Pares, J. M., and Gingerich, P. D.: Astronomical climate control on paleosol stacking patterns in the upper Paleocene–lower Eocene Willwood Formation, Bighorn Basin, Wyoming, Geology, 36, 531–534, https://doi.org/10.1130/g24734a.1, 2008.
Abels, H. A., Clyde, W. C., Gingerich, P. D., Hilgen, F. J., Fricke, H. C., Bowen, G. J., and Lourens, L. J.: Terrestrial carbon isotope excursions and biotic change during Palaeogene hyperthermals, Nat. Geosci., 5, 326–329, https://doi.org/10.1038/ngeo1427, 2012.
Abels, H. A., Kraus, M. J., and Gingerich, P. D.: Precession-scale cyclicity in the fluvial lower Eocene Willwood Formation of the Bighorn Basin, Wyoming (USA), Sedimentology, 60, 1467–1483, https://doi.org/10.1111/sed.12039, 2013.
Abels, H. A., Lauretano, V., van Yperen, A. E., Hopman, T., Zachos, J. C., Lourens, L. J., Gingerich, P. D., and Bowen, G. J.: Environmental impact and magnitude of paleosol carbonate carbon isotope excursions marking five early Eocene hyperthermals in the Bighorn Basin, Wyoming, Clim. Past, 12, 1151–1163, https://doi.org/10.5194/cp-12-1151-2016, 2016.
Agnini, C., Fornaciari, E., Raffi, I., Rio, D., Röhl, U., and Westerhold, T.: High-resolution nannofossil biochronology of middle Paleocene to early Eocene at ODP Site 1262: Implications for calcareous nannoplankton evolution, Mar. Micropaleontol., 64, 215–248, https://doi.org/10.1016/j.marmicro.2007.05.003, 2007.
Bains, S., Corfield, R. M., and Norris, R. D.: Mechanisms of Climate Warming at the End of the Paleocene, Science, 285, 724–727, https://doi.org/10.1126/science.285.5428.724, 1999.
Bowen, G. J.: Up in smoke: A role for organic carbon feedbacks in Paleogene hyperthermals, Global Planet. Change, 109, 18–29, https://doi.org/10.1016/j.gloplacha.2013.07.001, 2013.
Bowen, G. J., Koch, P. L., Gingerich, P. D., Norris, R. D., Bains, S., and Corfield, R. M.: Refined Isotope Stratigraphy across the Continental Paleocene-Eocene Boundary on Polecat Bench in the Northern Bighorn Basin, in: Paleocene-Eocene Stratigraphy and Biotic Change in the Bighorn and Clarks Fork Basins, Wyoming, edited by: Gingerich, P. D., University of Michigan Papers on Paleontology, 73–88, 2001.
Bowen, G. J., Maibauer, B. J., Kraus, M. J., Röhl, U., Westerhold, T., Steimke, A., Gingerich, P. D., Wing, S. L., and Clyde, W. C.: Two massive, rapid releases of carbon during the onset of the Palaeocene-Eocene thermal maximum, Nat. Geosci., 8, 44–47, https://doi.org/10.1038/ngeo2316, 2015.
Broecker, W. S. and Peng, T.-H.: Tracers in the sea, Lamont-Doherty Geological Observatory, 690 pp., 1982.
Charles, A. J., Condon, D. J., Harding, I. C., Pälike, H., Marshall, J. E. A., Cui, Y., Kump, L., and Croudace, I. W.: Constraints on the numerical age of the Paleocene-Eocene boundary, Geochem. Geophy. Geosy., 12, Q0AA17, https://doi.org/10.1029/2010gc003426, 2011.
Chew, A. E.: Paleoecology of the early Eocene Willwood mammal fauna from the central Bighorn Basin, Wyoming, Paleobiology, 35, 13–31, 2009.
Chew, A. E.: Mammal faunal change in the zone of the Paleogene hyperthermals ETM2 and H2, Clim. Past, 11, 1223–1237, https://doi.org/10.5194/cp-11-1223-2015, 2015.
Chew, A. E. and Oheim, K. B.: Diversity and climate change in the middle-late Wasatchian (early Eocene) Willwood Formation, central Bighorn Basin, Wyoming, Palaeogeography, Palaeoclimatology, Palaeoecology, 369, 67–78, https://doi.org/10.1016/j.palaeo.2012.10.004, 2013.
Clyde, W. C., Stamatakos, J., and Gingerich, P. D.: Chronology of the Wasatchian land-mammal age: magnetostratigraphic results from the McCullough Peaks section, northern Bighorn Basin, Wyoming, J. Geology, 102, 367–377, 1994.
Clyde, W. C., Hamzi, W., Finarelli, J. A., Wing, S. L., Schankler, D., and Chew, A.: Basin-wide magnetostratigraphic framework for the Bighorn Basin, Wyoming, GSA Bulletin, 119, 848–859, 2007.
Clyde, W. C., Gingerich, P. D., Wing, S. L., Röhl, U., Westerhold, T., Bowen, G., Johnson, K., Baczynski, A. A., Diefendorf, A., McInerney, F., Schnurrenberger, D., Noren, A., Brady, K., and the BBCP Science Team: Bighorn Basin Coring Project (BBCP): a continental perspective on early Paleogene hyperthermals, Sci. Dril., 16, 21–31, https://doi.org/10.5194/sd-16-21-2013, 2013.
Cramer, B. S., Wright, J. D., Kent, D. V., and Aubry, M.-P.: Orbital climate forcing of d13C excursions in the late Paleocene–Eocene (chrons C24n–C25n), Paleoceanography, 18, 1097, https://doi.org/10.1029/2003PA000909, 2003.
D'Ambrosia, A. R., Clyde, W. C., Fricke, H. C., Gingerich, P. D., and Abels, H. A.: Repetitive mammalian dwarfing during ancient greenhouse warming events, Science Advances, 3, e1601430, https://doi.org/10.1126/sciadv.1601430, 2017.
Dickens, G. R.: Down the Rabbit Hole: toward appropriate discussion of methane release from gas hydrate systems during the Paleocene-Eocene thermal maximum and other past hyperthermal events, Clim. Past, 7, 831–846, https://doi.org/10.5194/cp-7-831-2011, 2011.
Farley, K. A. and Eltgroth, S. F.: An alternative age model for the Paleocene-Eocene thermal maximum using extraterrestrial 3He, Earth Planet. Sc. Lett., 208, 135–148, 2003.
Gingerich, P. D.: New earliest Wasatchian mammalian fauna from the Eocene of northwestern Wyoming: composition and diversity in a rarely sampled high-floodplain assemblage, University of Michigan Papers on Paleontology, 28, 1–97, available at: http://hdl.handle.net/2027.42/48628 (last access: 28 February 2018), 1989.
Gingerich, P. D.: Environment and evolution through the Paleocene-Eocene thermal maximum, Trends Ecol. Evol., 21, 246–253, 2006.
Hay, W. W., DeConto, R., Wold, C. N., Wilson, K. M., Voigt, S., Schulz, M., Wold-Rossby, A., Dullo, W.-C., Ronov, A. B., Balukhovsky, A. N., and Soeding, E.: Alternative Global Cretaceous Paleogeography, in: The Evolution of Cretaceous Ocean/Climate Systems, edited by: Barrera, E. and Johnson, C., Geological Society of America Special Paper, 1–47, 1999.
Kelly, D. C., Zachos, J. C., Bralower, T. J., and Schellenberg, S. A.: Enhanced terrestrial weathering/runoff and surface ocean carbonate production during the recovery stages of the Paleocene-Eocene thermal maximum, Paleoceanography, 20, PA4023, https://doi.org/10.1029/2005PA001163, 2005.
Kelly, D. C., Nielsen, T. M. J., McCarren, H. K., Zachos, J. C., and Röhl, U.: Spatiotemporal patterns of carbonate sedimentation in the South Atlantic: Implications for carbon cycling during the Paleocene-Eocene thermal maximum, Palaeogeogr. Palaeocl., 293, 30–40, https://doi.org/10.1016/j.palaeo.2010.04.027, 2010.
Kennett, J. P. and Stott, L. D.: Abrupt deep sea warming, paleoceanographic changes and benthic extinctions at the end of the Paleocene, Nature, 353, 225–229, 1991.
Kirtland Turner, S. and Ridgwell, A.: Development of a novel empirical framework for interpreting geological carbon isotope excursions, with implications for the rate of carbon injection across the PETM, Earth Planet. Sc. Lett., 435, 1–13, https://doi.org/10.1016/j.epsl.2015.11.027, 2016.
Kirtland Turner, S., Sexton, P. F., Charles, C. D., and Norris, R. D.: Persistence of carbon release events through the peak of early Eocene global warmth, Nat. Geosci., 7, 748–751, https://doi.org/10.1038/ngeo2240, 2014.
Koch, P. L., Zachos, J. C., and Gingerich, P.: Correlation between isotope records in marine and continental carbon reservoirs near the Paleocene/Eocene boundary, Nature, 358, 319–322, 1992.
Laskar, J., Robutel, P., Joutel, F., Gastineau, M., Correia, A., and Levrard, B.: A long-term numerical solution for the insolation quantities of the Earth, Astron. Astrophys., 428, 261–285, https://doi.org/10.1051/0004-6361:20041335, 2004.
Littler, K., Röhl, U., Westerhold, T., and Zachos, J. C.: A high-resolution benthic stable-isotope record for the South Atlantic: Implications for orbital-scale changes in Late Paleocene–Early Eocene climate and carbon cycling, Earth Planet. Sc. Lett., 401, 18–30, https://doi.org/10.1016/j.epsl.2014.05.054, 2014.
Lourens, L. J., Sluijs, A., Kroon, D., Zachos, J. C., Thomas, E., Röhl, U., Bowles, J., and Raffi, I.: Astronomical pacing of late Palaeocene to early Eocene global warming events, Nature, 435, 1083–1087, https://doi.org/10.1038/nature03814, 2005.
McInerney, F. A. and Wing, S. L.: The Paleocene-Eocene Thermal Maximum: A Perturbation of Carbon Cycle, Climate, and Biosphere with Implications for the Future, Annu. Rev. Earth Planet. Sc., 39, 489–516, https://doi.org/10.1146/annurev-earth-040610-133431, 2011.
Meyers, S. R.: Astrochron: An R Package for Astrochronology, available at: https://CRAN.R-project.org/package=astrochron (last access: 5 September 2017), 2014.
Murphy, B. H., Farley, K. A., and Zachos, J. C.: An extraterrestrial 3He-based timescale for the Paleocene-Eocene thermal maximum (PETM) from Walvis Ridge, IODP Site 1266, Geochim. Cosmochim. Ac., 74, 5098–5108, https://doi.org/10.1016/j.gca.2010.03.039, 2010.
Paillard, D., Labeyrie, L., and Yiou, P.: Macintosh program performs time-series analysis, Eos T. Am. Geophys. Un., 77, 79–379, https://doi.org/10.1029/96EO00259, 1996.
Revelle, R. and Suess, H. E.: Carbon dioxide exchange between atmosphere and ocean and the question of an increase of atmospheric CO2 during the past decades, Tellus, 9, 18–27, 1957.
Röhl, U., Bralower, T. J., Norris, R. D., and Wefer, G.: New chronology for the late Paleocene thermal maximum and its environmental implications, Geology, 28, 927–930, https://doi.org/10.1130/0091-7613(2000)28<927:ncftlp>2.0.co;2, 2000.
Röhl, U., Westerhold, T., Bralower, T. J., and Zachos, J. C.: On the duration of the Paleocene-Eocene thermal maximum (PETM), Geochem. Geophy. Geosy., 8, Q12002, https://doi.org/10.1029/2007GC001784, 2007.
Schankler, D.: Faunal zonation of the Willwood Formation in the central Bighorn Basin, Wyoming, in: Early Cenozoic paleontology and stratigraphy of the Bighorn Basin, Wyoming, edited by: Gingerich, P. D., University of Michigan Papers on Paleontology, Ann Arbor, MI, 99–114, 1980.
Sluijs, A. and Dickens, G. R.: Assessing offsets between the δ13C of sedimentary components and the global exogenic carbon pool across early Paleogene carbon cycle perturbations, Global Biogeochem. Cy., 26, GB4005, https://doi.org/10.1029/2011gb004224, 2012.
Sluijs, A., Bowen, G. J., Brinkhuis, H., Lourens, L. J., and Thomas, E.: The Palaeocene–Eocene Thermal Maximum super greenhouse: biotic and geochemical signatures, age models and mechanisms of global change, in: Deep-Time Perspectives on Climate Change: Marrying the Signal from Computer Models and Biological Proxies, edited by: Williams, M., Haywood, A. M., Gregory, F. J., and Schmidt, D. N., The Micropalaeontological Society Special Publications, The Geological Society, London, 323–349, 2007.
Stap, L., Sluijs, A., Thomas, E., and Lourens, L.: Patterns and magnitude of deep sea carbonate dissolution during Eocene Thermal Maximum 2 and H2, Walvis Ridge, southeastern Atlantic Ocean, Paleoceanography, 24, PA1211, https://doi.org/10.1029/2008PA001655, 2009.
Thomas, E.: Development of Cenozoic deep-sea benthic foraminiferal faunas in Antarctic waters, in: Origins and Evolution of the Antarctic Biota, edited by: Crame, J. A., Geological Society Special Publication, 283–296, 1989.
Westerhold, T., Röhl, U., Laskar, J., Bowles, J., Raffi, I., Lourens, L. J., and Zachos, J. C.: On the duration of magnetochrons C24r and C25n and the timing of early Eocene global warming events: Implications from the Ocean Drilling Program Leg 208 Walvis Ridge depth transect, Paleoceanography, 22, https://doi.org/10.1029/2006PA001322, 2007.
Westerhold, T., Röhl, U., Raffi, I., Fornaciari, E., Monechi, S., Reale, V., Bowles, J., and Evans, H. F.: Astronomical calibration of the Paleocene time, Palaeogeography, Palaeoclimatology, Palaeoecology, 257, 377–403, https://doi.org/10.1016/j.palaeo.2007.09.016, 2008.
Westerhold, T., Röhl, U., Frederichs, T., Bohaty, S. M., and Zachos, J. C.: Astronomical calibration of the geological timescale: closing the middle Eocene gap, Clim. Past, 11, 1181–1195, https://doi.org/10.5194/cp-11-1181-2015, 2015.
Westerhold, T., Röhl, U., Frederichs, T., Agnini, C., Raffi, I., Zachos, J. C., and Wilkens, R. H.: Astronomical calibration of the Ypresian timescale: implications for seafloor spreading rates and the chaotic behavior of the solar system?, Clim. Past, 13, 1129–1152, https://doi.org/10.5194/cp-13-1129-2017, 2017a.
Westerhold, T., Röhl, U., Wilkens, R. H., Gingerich, P. D., Clyde, W. C., Wing, S. L., Bowen, G., and Kraus, M. J.: Synchronizing early Eocene deep-sea and continental records from the Bighorn Basin Coring Project, PANGAEA, https://doi.org/10.1594/PANGAEA.875685, 2017b.
Wilkens, R. H., Westerhold, T., Drury, A. J., Lyle, M., Gorgas, T., and Tian, J.: Revisiting the Ceara Rise, equatorial Atlantic Ocean: isotope stratigraphy of ODP Leg 154 from 0 to 5 Ma, Clim. Past, 13, 779–793, https://doi.org/10.5194/cp-13-779-2017, 2017.
Wotzlaw, J.-F., Bindeman, I. N., Schaltegger, U., Brooks, C. K., and Naslund, H. R.: High-resolution insights into episodes of crystallization, hydrothermal alteration and remelting in the Skaergaard intrusive complex, Earth Planet. Sc. Lett., 355–356, 199–212, https://doi.org/10.1016/j.epsl.2012.08.043, 2012.
Zachos, J. C., Röhl, U., Schellenberg, S. A., Sluijs, A., Hodell, D. A., Kelly, D. C., Thomas, E., Nicolo, M., Raffi, I., Lourens, L. J., McCarren, H., and Kroon, D.: Rapid Acidification of the Ocean During the Paleocene-Eocene Thermal Maximum, Science, 308, 1611–1615, https://doi.org/10.1126/science.1109004, 2005.
Zachos, J. C., McCarren, H., Murphy, B., Röhl, U., and Westerhold, T.: Tempo and scale of late Paleocene and early Eocene carbon isotope cycles: Implications for the origin of hyperthermals, Earth Planet. Sc. Lett., 299, 242–249, https://doi.org/10.1016/j.epsl.2010.09.004, 2010.
Zeebe, R. E. and Zachos, J. C.: Reversed deep-sea carbonate ion basin gradient during Paleocene-Eocene thermal maximum, Paleoceanography, 22, PA3201, https://doi.org/10.1029/2006PA001395, 2007.
Zeebe, R. E., Ridgwell, A., and Zachos, J. C.: Anthropogenic carbon release rate unprecedented during the past 66 million years, Nat. Geosci., 9, 325–329, https://doi.org/10.1038/ngeo2681, 2016.
Zeebe, R. E., Westerhold, T., Littler, K., and Zachos, J. C.: Orbital forcing of the Paleocene and Eocene carbon cycle, Paleoceanography, 32, 440–465, https://doi.org/10.1002/2016PA003054, 2017.