the Creative Commons Attribution 4.0 License.
the Creative Commons Attribution 4.0 License.
 | 18 Dec 2018
Long-term deglacial permafrost carbon dynamics in MPI-ESM
Thomas Schneider von Deimling
Thomas Kleinen
Gustaf Hugelius
Christian Knoblauch
Christian Beer
Victor Brovkin
We have developed a new module to calculate soil organic carbon (SOC) accumulation in perennially frozen ground in the land surface model JSBACH. Running this offline version of MPI-ESM we have modelled long-term permafrost carbon accumulation and release from the Last Glacial Maximum (LGM) to the pre-industrial (PI) age. Our simulated near-surface PI permafrost extent of 16.9 × 10⁶ km2 is close to observational estimates. Glacial boundary conditions, especially ice sheet coverage, result in profoundly different spatial patterns of glacial permafrost extent. Deglacial warming leads to large-scale changes in soil temperatures, manifested in permafrost disappearance in southerly regions, and permafrost aggregation in formerly glaciated grid cells. In contrast to the large spatial shift in simulated permafrost occurrence, we infer an only moderate increase in total LGM permafrost area (18.3 × 10⁶ km2) – together with pronounced changes in the depth of seasonal thaw. Earlier empirical reconstructions suggest a larger spread of permafrost towards more southerly regions under glacial conditions, but with a highly uncertain extent of non-continuous permafrost.
Compared to a control simulation without describing the transport of SOC into perennially frozen ground, the implementation of our newly developed module for simulating permafrost SOC accumulation leads to a doubling of simulated LGM permafrost SOC storage (amounting to a total of ∼ 150 PgC). Despite LGM temperatures favouring a larger permafrost extent, simulated cold glacial temperatures – together with low precipitation and low CO2 levels – limit vegetation productivity and therefore prevent a larger glacial SOC build-up in our model. Changes in physical and biogeochemical boundary conditions during deglacial warming lead to an increase in mineral SOC storage towards the Holocene (168 PgC at PI), which is below observational estimates (575 PgC in continuous and discontinuous permafrost). Additional model experiments clarified the sensitivity of simulated SOC storage to model parameters, affecting long-term soil carbon respiration rates and simulated ALDs. Rather than a steady increase in carbon release from the LGM to PI as a consequence of deglacial permafrost degradation, our results suggest alternating phases of soil carbon accumulation and loss as an effect of dynamic changes in permafrost extent, ALDs, soil litter input, and heterotrophic respiration.
- Article
(14065 KB) - Full-text XML
- BibTeX
- EndNote


The amount of carbon stored in the atmosphere, in the ocean, and on land has varied strongly between glacial and modern times (Ciais et al., 2012). Ice-core records suggest a large increase of about 100 ppm in atmospheric CO2 concentrations from the Last Glacial Maximum (LGM) to the pre-industrial (PI) climate, posing the question of the source of this atmospheric carbon input. Given the overwhelmingly large storage capacity of the global oceans, the release of oceanic CO2 played a dominant role in the atmospheric CO2 increase during deglaciation (Archer et al., 2000; Brovkin et al., 2012). There are especially large uncertainties in estimates of past terrestrial carbon storage dynamics. During deglacial warming from the LGM to the PI climate, global land vegetation was a strong sink of carbon through increased productivity stimulated by warmer temperatures and higher CO2 levels. A key question concerns the role of terrestrial soils during the transition from the glacial period to the Holocene with regard to these soils acting as a carbon source or a carbon sink. In this study we use the Earth system model (ESM) MPI-ESM to investigate soil organic carbon (SOC) accumulated in permafrost under glacial conditions, and the dynamics of carbon uptake and release under deglacial warming into the PI climate.
Large amounts of SOC have accumulated in soils of the northern permafrost regions as a consequence of the low heterotrophic respiration in the surface soil layer that thaws during the short summer period (active layer) and permanent sub-zero temperatures in permafrost. Vertical soil mixing through consecutive freeze-thaw cycles (cryoturbation) is specific to permafrost soils and further favours high SOC accumulation, but is generally not accounted for in current ESMs (Koven et al., 2009, 2015; Beer, 2016). The large carbon storage capacity of high-latitude soils is underlined by observational evidence which points to a total SOC stored in the permafrost region of ∼ 1300 PgC under present-day climate conditions (Hugelius et al., 2014). This large carbon pool represents a major part of global SOC storage (Jackson et al., 2017) and is therefore considered an important component in the global carbon cycle. Model projections of future permafrost degradation and consequent carbon release have underlined the vulnerability of the permafrost carbon store to warming and have discussed implications for affecting future greenhouse gas levels (McGuire et al., 2009; Lawrence et al., 2011; Koven et al., 2011; Schneider von Deimling et al., 2012; Burke et al., 2012; Schaphoff et al., 2013; Schaefer et al., 2014).
Given the sensitivity of permafrost soils to climate change, manifested in permafrost aggregation or degradation, which decreases or increases CO2 and CH4 release from permafrost soils, permafrost carbon is also discussed in the paleoclimatic context. It has been suggested that the amount of permafrost SOC has been distinctively different under glacial and modern climate conditions (Ciais et al., 2012). Zimov et al. (2006) speculate that the thawing of frozen loess in Europe and southern Siberia has led to large carbon releases during the Pleistocene to Holocene transition. Isotopic analyses of ice-core CO2 have pointed to large excursions of 13C-depleted carbon, interpreted as a possible strong land source from permafrost carbon release (Lourantou et al., 2010). Recently Crichton et al. (2016) speculated that permafrost carbon release likely played a dominant role for explaining a pronounced CO2 rise between 17.5 and 15 ka, while Köhler et al. (2014) have analysed Δ14C excursions from coral records to explain abrupt release of about 125 PgC from permafrost degradation at the onset of the Bølling-Allerød (∼ 14.6 ka). A recent empirically based reconstruction suggests that the total estimated SOC stock for the LGM northern permafrost region is smaller than the present-day SOC storage for the same region (Lindgren et al., 2018). This reconstruction shows that very significant changes in SOC have occurred over this time interval, including decreased Yedoma SOC stocks and increased peat SOC stocks, but does not shed light on when these shifts occurred (Lindgren et al., 2018).
A focus of many paleo modelling studies is the LGM climate, as it was distinctively different to the PI climate and therefore is considered an ideal test case for model evaluation, e.g. within the framework of the Paleoclimate Modelling Intercomparison Project (PMIP; Braconnot et al., 2012; Kageyama et al., 2017). With respect to permafrost dynamics, PMIP models have been used to analyse permafrost extent under LGM and PI climate conditions (Saito et al., 2013), but not with respect to changes in permafrost soil carbon storage. Willeit et al. (2015) have run the ESM CLIMBER-2 over the last glacial cycle to explore the interaction of permafrost and ice-sheet evolution. Using the ORCHIDEE land surface model, Zhu et al. (2016) simulated glacial SOC storage in Yedoma deposits showing a rather large potential of these thick ice- and organic-rich sediments to affect the global carbon cycle. Having analysed a permafrost loess–paleosol sequence, Zech et al. (2011) inferred that more SOC was sequestered during glacials than during interglacials.
Permafrost carbon dynamics are only recently being implemented into ESMs. Due to this, and the computational costs of high-resolution glacial–interglacial model runs, we know of no previous full-complexity ESM experiments (in contrast to Earth system Model of Intermediate Complexity, EMIC, studies) that quantify the dynamic role of circum-Arctic permafrost carbon during deglacial warming.
In this study, we investigate permafrost soil carbon dynamics from the LGM to PI using a process-based land surface model. In particular, we want to analyse the amount of SOC which was stored under LGM climate conditions, and the dynamics of this SOC store under deglacial warming into the Holocene – in response to receding ice-sheets, broad-scale shifts in permafrost regime, and increases in vegetation productivity and soil respiration.
2.1 Simulating deglacial climate dynamics
For simulating soil carbon dynamics from the LGM to PI climate, we have used a standalone (offline) configuration of the MPI-ESM land surface model JSBACH (Reick et al., 2013; Brovkin et al., 2013; Schneck et al., 2013) in coarse T31GR30 resolution (∼ 3.75∘ or roughly 400 km × 300 km at 45∘ N). The model was run with dynamic vegetation and driven by transient climate forcings covering the full LGM to PI period. In contrast to the CMIP5 version previously published, we use an extended version of JSBACH with a multilayer hydrology scheme (Hagemann and Stacke, 2015), a representation of physical permafrost processes (Ekici et al., 2014), and an improved soil carbon model based on the YASSO model (Goll et al., 2015). Climate forcing fields were prescribed for surface air temperature, precipitation, humidity, radiation, and wind speed and were inferred from a LGM time-slice experiment with MPI-ESM1.2 without permafrost physics, combined with a full transient glacial cycle experiment performed with the ESM of intermediate complexity CLIMBER2 (Ganopolski et al., 2010). In Appendix A1 we describe in detail the generation of the climate driving fields applied to JSBACH and further show the performance of MPI-ESM1.2 at simulating pre-industrial and glacial temperature and precipitation fields in high northern latitudes.
2.2 Model set-up
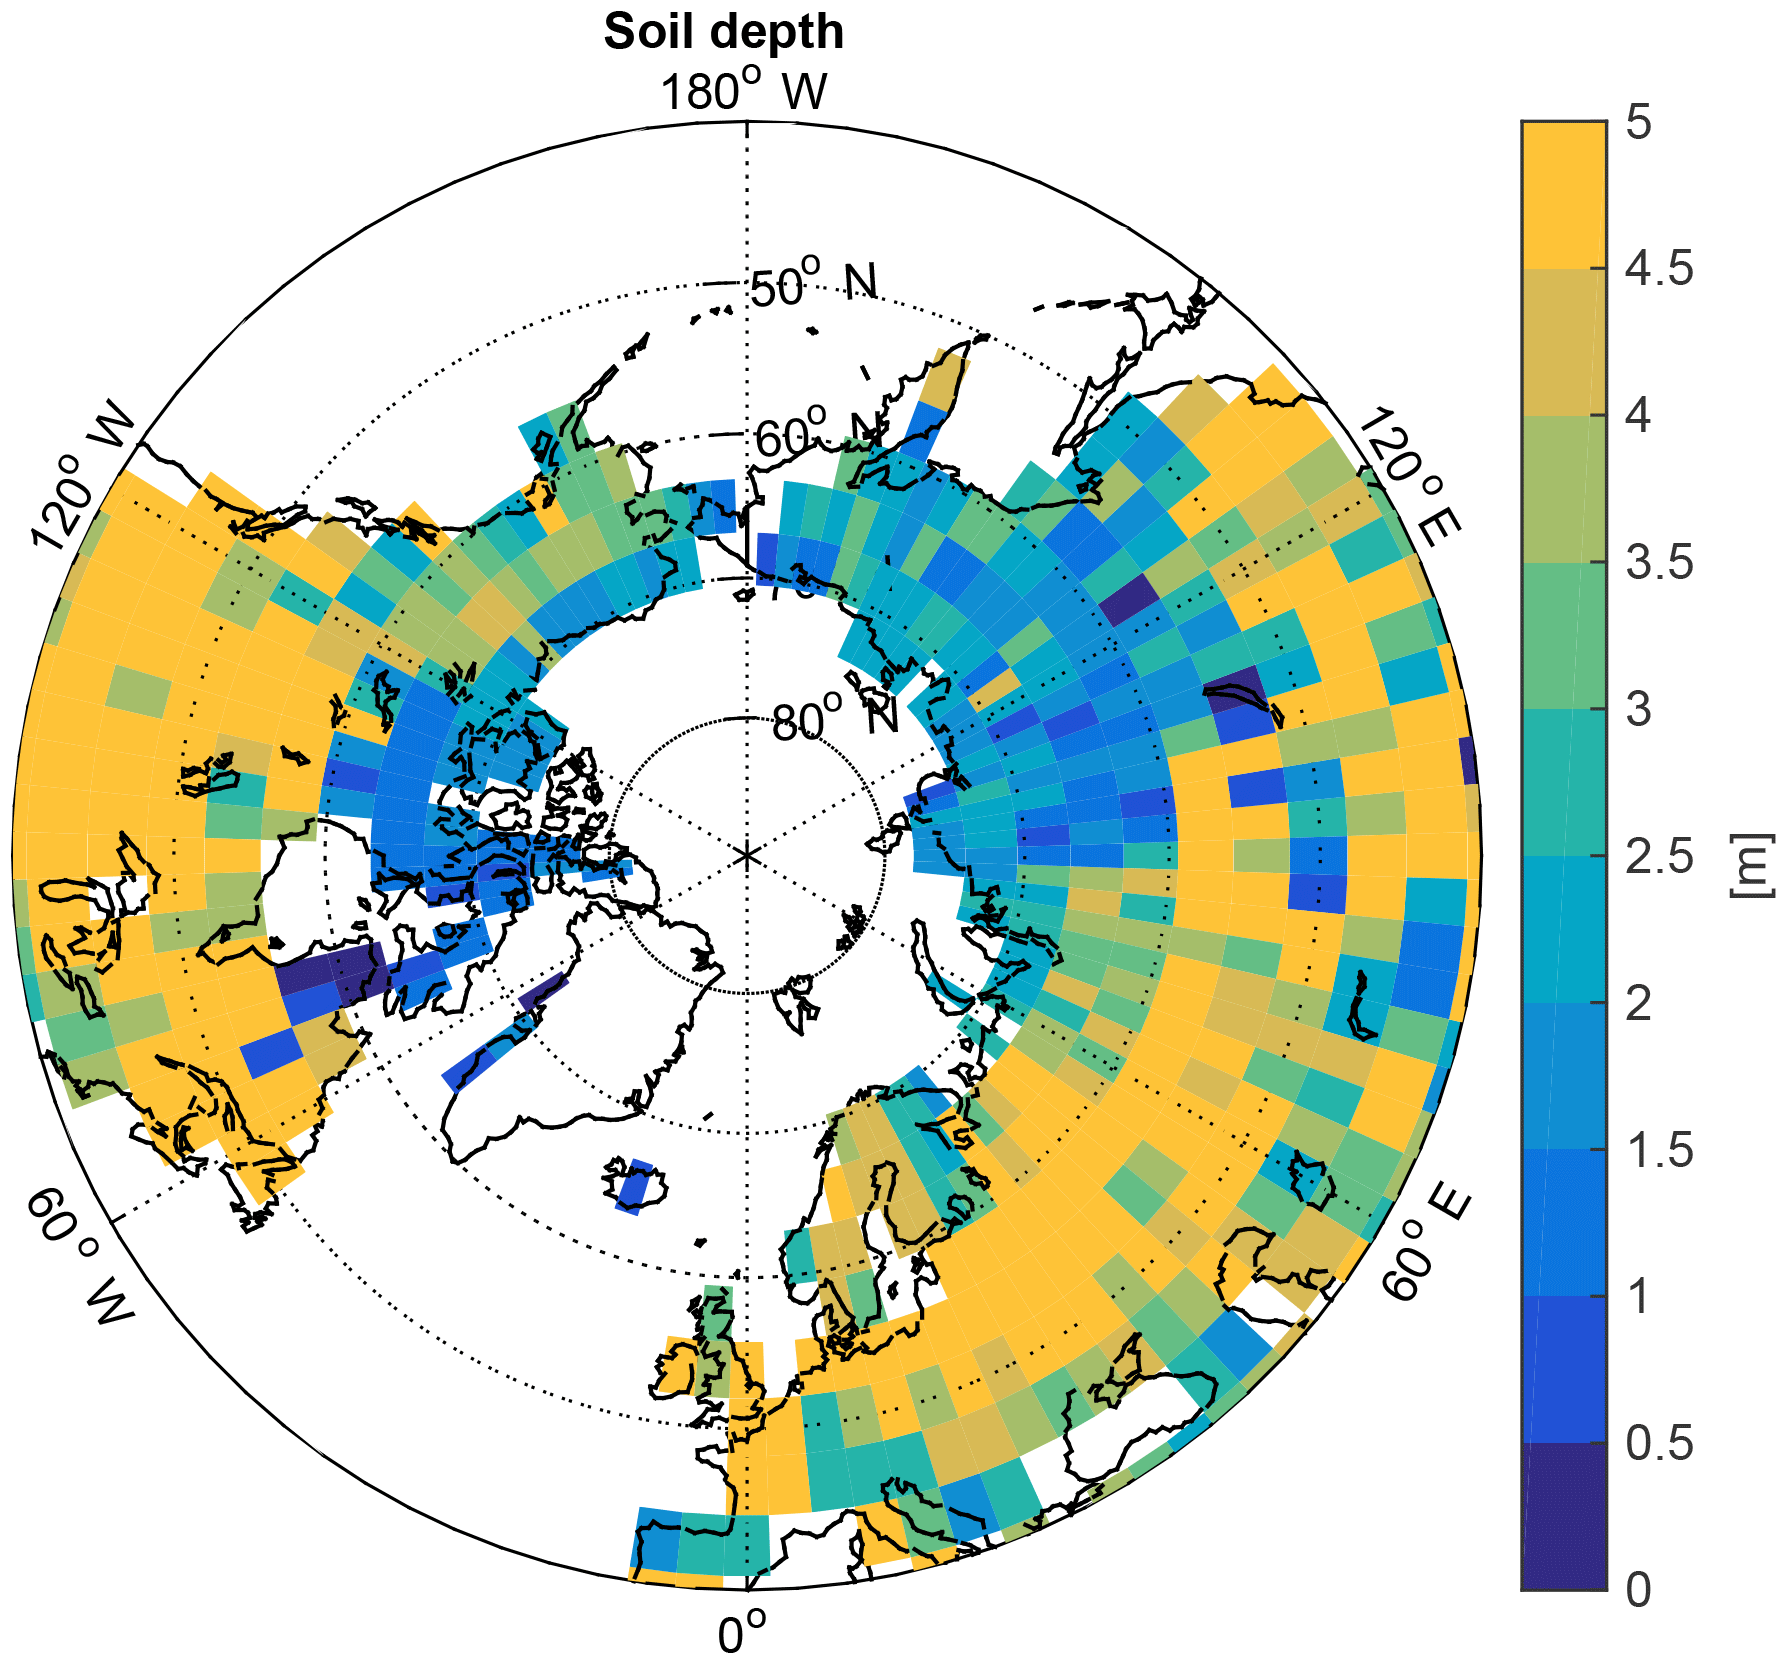
In this study we focus on long-term (millennial scale) dynamics of near-surface SOC stocks, and therefore only consider carbon accumulation in permafrost soils to a depth of 3 m. Consequences of accounting for deeper SOC deposits are briefly discussed in Sect. 2.5. For many JSBACH permafrost grid cells, bedrock depths are shallower than 3 m and therefore limit the maximum depth of SOC accumulation in our model. Here, we use a global dataset of soil depths compiled by Carvalhais (2014) (see Fig. A8). Vegetation cover is assumed to respond to changing glacial–Holocene climatic conditions and is dynamically calculated throughout the simulation. Pre-industrial land use changes in high latitudes are negligible (Hurtt et al., 2011), and therefore we do not account for human-induced modifications of vegetation cover. We prescribe glacial ice sheet coverage and CO2 concentration (see Sect. 7.4) along with its changes during deglacial warming based on the CLIMBER2 model (Ganopolski et al., 2010). We do not consider glacial lowering of sea level and do not account for permafrost having established in shelf regions which were exposed to cold surface air conditions under a lower glacial sea level.
2.3 Physical permafrost model
Here we describe key aspects of the physical soil representation in JSBACH, while a detailed model description can be found in Ekici et al. (2014). In our study we use a set-up with 11 vertical soil layers of increasing vertical thicknesses reaching a lower boundary at 40 m. Surface air temperature is used as an upper boundary forcing for calculating soil temperatures during the snow-free season. When snow is present, a 5-layer snow scheme is applied for forcing soil temperatures. An organic layer of constant thickness is assumed to cover the soil top. The bottom boundary condition is given by a zero heat flux assumption. Heat transfer into the soil is calculated for each soil layer by using a one-dimensional heat-conduction equation accounting for phase change of soil water.
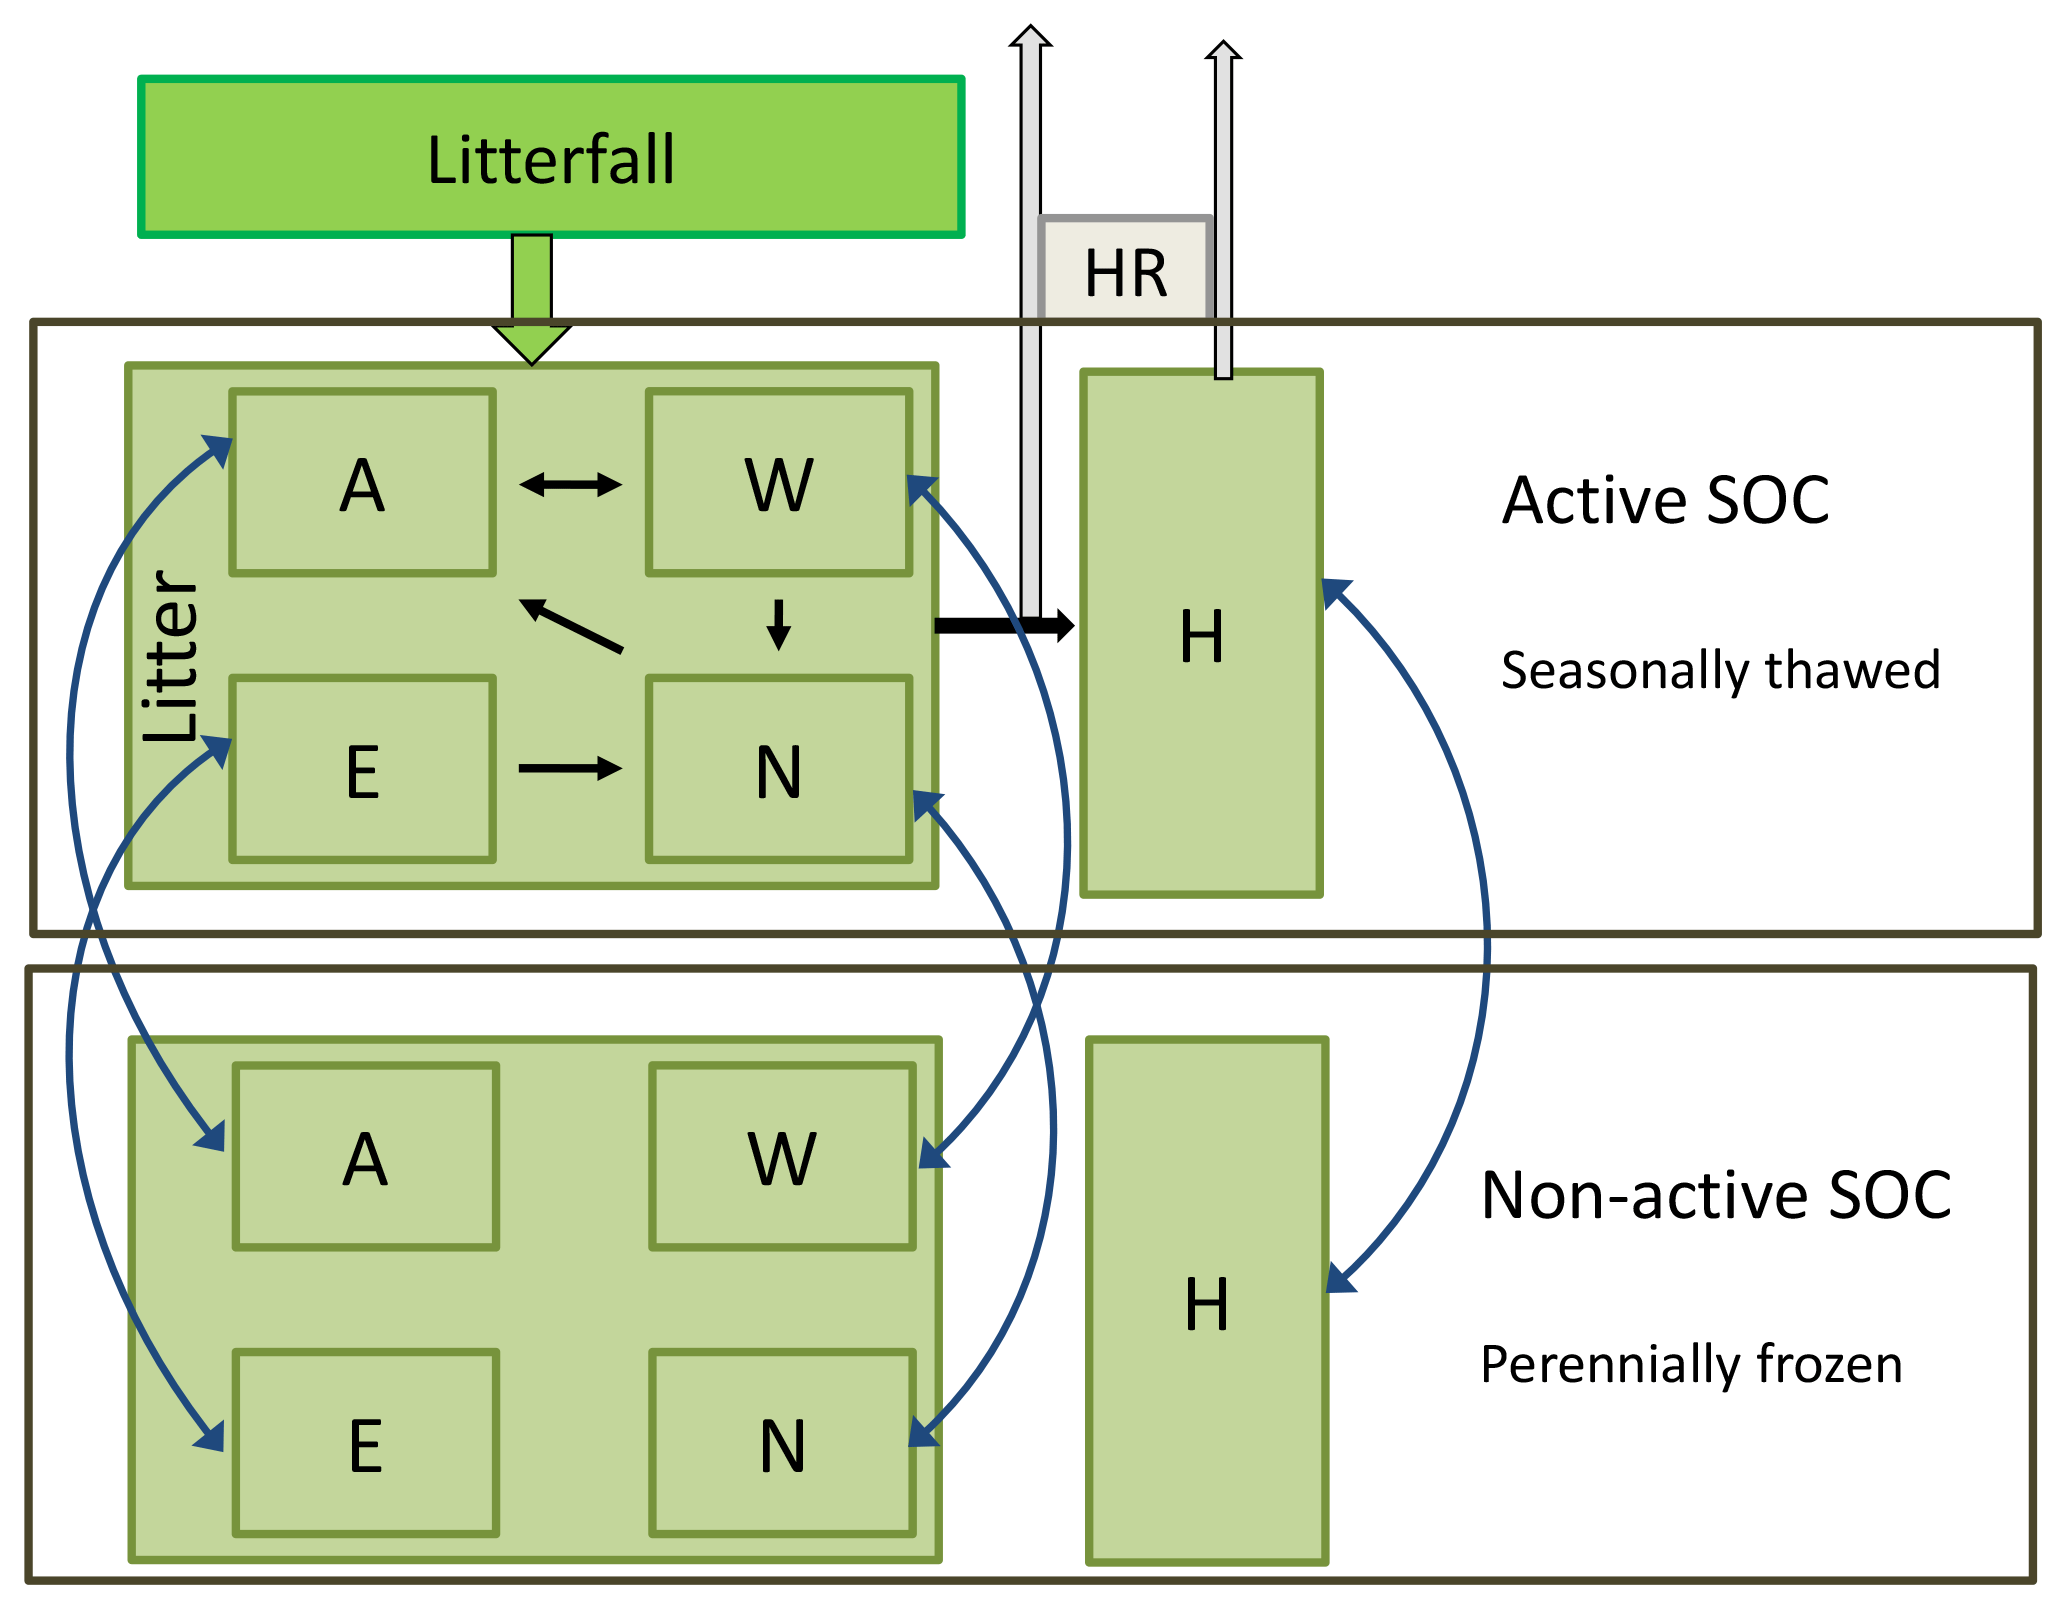
Figure 1Extended soil carbon pool structure in JSBACH accounting for active layer and permafrost carbon (modified from Goll et al., 2014). In YASSO, soil organic matter (SOM) is separated into groups of different chemical compounds (A, W, E: labile pools), an intermediate pool (N), and a slow pool (H). Carbon gain results from litter input, carbon loss from heterotrophic respiration (HR) in active layer pools. Changes in maximum seasonal thaw depth induce a transfer of carbon (blue arrows) from non-active to active pools (warming), and vice versa (cooling).
2.4 Soil carbon model
Soil carbon dynamics within JSBACH are simulated by YASSO (Liski et al., 2005). We describe key characteristics of this soil carbon model, while a detailed description of its implementation into JSBACH can be found elsewhere (Thum et al., 2011; Goll et al., 2015). YASSO calculates the decomposition of soil organic matter (SOM) considering four different lability classes based on a chemical compound separation of litter into acid-soluble (A), water-soluble (W), ethanol-soluble (E), and non-soluble (N) fractions with the pools replicated for above and below ground. In addition to these four pools, there is a slow pool that receives a fraction of the decomposition products of the more labile pools (Fig. 1). These pools are replicated for green and woody litter on each vegetation tile. Decomposition rates of each carbon pool were inferred from litter bag experiments and soil carbon measurements and range from turnover times of up to a few years (labile pools) to multi-centennial for the slow pool. Furthermore, litter input into the soil is separately considered for leaf and woody components (not shown in Fig. 1), assuming decreasing decomposition rates for increasing size of woody litter. The dependence of decomposition on temperature is described by an optimum curve, combined with a scaling factor to describe precipitation dependency (Tuomi et al., 2009). YASSO decomposition parameters were tuned to surface air temperatures and precipitation, using measurements that include sites representing tundra conditions. With increasing active layer depths (ALDs), temperatures above the permafrost are much colder than surface temperatures during summer – and therefore suggest lower decomposition rates compared to the soil surface. Although the temperature difference between soil and surface air temperature is growing with depth, the typical vertical profile of declining SOC (Sect. 7.7) introduces less weight to deeper layers. Given that the more labile SOC pools are concentrated in upper soil layers (Walz et al., 2017), the soil–surface air temperature difference is mainly affecting carbon pools of slow decomposition (N and H pool, Sect. 7.7). In Sect. 4.3 we investigate implications of assuming a reduced decomposition timescale for the slow H pool on SOC build-up. A consideration of decomposition parameters depending on soil temperature profiles is subject to current development work for JSBACH.
A main limitation for modelling the transfer of carbon between the active layer and the underlying permafrost body is the zero-dimensional structure of YASSO within JSBACH which does not allow for calculating vertical SOC profiles. Yet permafrost-affected grounds can store SOC in depths of several metres in the soil and reveal rather pronounced vertical gradients of typically decreasing carbon concentrations with depth within the active layer (Harden et al., 2012). Therefore we have developed a soil carbon build-up model which describes carbon gain through litter input, carbon loss through heterotrophic respiration, and vertical carbon transport through cryoturbation and sedimentation. Based on this model, we infer the needed information of vertical SOC distributions (see Appendix). We then use this new model to determine SOC concentrations at the level of the ALD, which determine the amount of carbon transferred between perennially frozen (permafrost) and seasonally thawed (active layer) pools. For this purpose we added an additional non-active pool into JSBACH for each YASSO soil carbon pool which describes carbon of the same chemical compound class, but which is not subject to seasonal thaw and remains perennially frozen (Fig. 1).
For each grid cell and each SOM class i the carbon transfer dSOCi(t) at time step t (in kgC m−2) between thawed (active) and perennially frozen (non-active) pools is simulated in JSBACH depending on the extent of annual change in ALD (in m), and on the individual SOC concentration (in kgC m−3) at the boundary between active layer and permafrost SOC :
with dALD(t) describing the change in maximum thaw depth. As our focus is on long-term carbon transfer we smooth dALD(t) by applying a 100-year exponential weighting. (t) is the SOC concentration for each lability class i at the boundary between seasonally thawed and perennially frozen ground.
The transfer of carbon into permafrost strongly depends on the thickness of the active layer: with increasing thickness, the share of labile soil organic material, which gets incorporated into permafrost, decreases as the distance of carbon transport to the permafrost boundary gets longer and therefore allows for more time for microbial decomposition. Our approach enables us to capture this key characteristic of soil carbon accumulation in permafrost soils, i.e. it describes the fractionation of SOM of differing lability with depth. As a consequence, shares of more labile SOC are increasing when organic material accumulates in colder climate conditions under shallower ALDs (Fig. A11).
2.5 Model limitations
The full dynamics of deglacial permafrost SOC accumulation and release are determined by a multitude of factors, ranging from past climatic boundary conditions and associated permafrost evolution to process-based descriptions of SOC formation.
Here we discuss structural model aspects and model limitations with regard to these factors which can explain part of the model data discrepancies which we discuss in Sect. 4.
2.5.1 Unaccounted aspects of permafrost extent and dynamics
The T31 resolution of JSBACH used in this study has allowed us to run a set of model experiments from the LGM to the PI. Yet the coarse resolution does not allow for simulating permafrost which covers only a fraction of the landscape (such as isolated and sporadic permafrost). We therefore underestimate the total area of ground subject to perennially frozen conditions.
We also do not account for effects of excess ice, which affects the temporal thaw dynamics and soil moisture conditions upon thaw in ice-rich grounds (Lee et al., 2014).
2.5.2 Unaccounted permafrost carbon stocks
Peatlands
We do not account for water-logged soils – an environment which allows for the formation of peatlands and which requires specific model descriptions of SOC build-up (Kleinen et al., 2012). As a peat module was not included in our version of MPI-ESM, we do not describe carbon storage following deglacial peat dynamics (Yu et al., 2010). In this study, we focus on typical carbon profiles in mineral soils which decline with depth (in line with large-scale observational evidence (Harden et al., 2012). We acknowledge that we therefore underestimate total carbon storage by not capturing high carbon accumulation in saturated organic-rich soils (see discussion in Sect. 4.1.4).
Deep SOC deposits
We do not account for the evolution of syngenetic permafrost deposits through sustained accumulation of new material on the top of the active layer. High sedimentation rates result in deep soil deposits, rich in organic matter, as found in Yedoma soils or river deltas, which can store hundreds petagrams of SOC down to some tens of metres (Hugelius et al., 2014; Strauss et al., 2017). Using a multi-box model of permafrost carbon inventories, Schneider von Deimling et al. (2015) have shown that large amounts of perennially frozen carbon in depths below 3 m can get mobilized on a century timescale if abrupt thaw through thermokarst lake formation is accounted for. A consideration of the accumulation and release dynamics of these deep deposits under deglacial warming in JSBACH would require a process-based description of Yedoma formation and of abrupt thaw processes which is beyond the scope of this study.
2.5.3 Simulation of SOC respiration loss
Our model of describing soil carbon dynamics (YASSO) is based on the assumption that soil carbon decomposition can be inferred based on a chemical compound separation of litter. Model parameters are fitted based on annual litter-bag experiments. Therefore, uncertainties in long-term soil carbon dynamics (centennial to millennial timescale) can be large. Other factors, including soil texture and mineralogy, can strongly affect decomposition timescales. The stabilization of SOM due to its interaction with mineral compounds strongly reduces SOM decomposability (Schädel et al., 2014; Xu et al., 2016), but this particular process is not considered in YASSO.
Probably of more importance in the process-based SOM transport model is the fact that we did not explicitly account for soil moisture effects on SOC build-up, which, for example, can result in profiles of increasing SOC with depth (Zimov et al., 2006) due to slowing down respiration with soil moisture approaching saturation (see also discussion in Appendix A7.1).
We further focus on SOM decomposition under aerobic conditions and do not model CH4 formation and release in anaerobic soil environments.
2.5.4 Stationary assumptions
Soil depths
We do not model soil genesis but prescribe stationary soil depths according to Carvalhais et al. (2014) by assuming a balance between deglacial soil erosion and formation rates. In Appendix A4.3 we discuss implications of this assumption on modelled SOC build-up. We account for the fact that many soils have only formed after the LGM by assuming that SOC build-up was prevented for grid cells when covered by LGM ice sheets.
Organic surface layer
Protection of warm permafrost through insulation effects by organic surface layers have likely varied between the glacial and Holocene climate but are not captured in our modelling study. A more elaborate scheme of organic layer treatment is subject to current JSBACH model development, coupling organic layer thickness to litter carbon amounts.
Vertical SOC gradients
Our approach of accounting for vertical SOC gradients (Sect. 7.7) is based on using a process-based model of SOM transport assuming equilibrium conditions. Transient deviations from the equilibrium profiles cannot be captured and would be most pronounced for the faster cycling SOC pools, which reveal pronounced vertical gradients (Fig. A11). In this study we focus on long-term carbon dynamics along the deglacial warming, and therefore do not capture full SOC dynamics resulting from short-term climate changes on decadal to centennial timescales.
3.1 Simulation set-up
For spinning-up soil carbon pools we start our simulations at 28 ka (kiloyears before present) from zero soil carbon concentrations and run JSBACH for 7000 years under a stationary climate forcing representative for LGM conditions. The chosen spin-up time allows for the slow soil carbon pools to come close to equilibrium (see Fig. A13). As cold glacial climate conditions have prevailed for tens of thousands of years before LGM, we assume that soils had enough time to accumulate soil carbon into permafrost under pre-LGM conditions, leading to approximately depth-constant SOC profiles between the permafrost table and our considered lower soil boundary (see Fig. A11 and discussion in Appendix A7.1). With a focus on near-surface permafrost in this study, this lower boundary z∗ for SOC accumulation is assumed at 3 m, while the lower boundary for modelling soil temperatures is at 40 m. Shallower SOC accumulation is assumed if soil depth is constrained by shallow-laying rock sediments which we prescribe after Carvalhais et al. (2014, see Fig. A8). In Appendix A4.3 we discuss implications of prescribed soil depths on SOC build-up.
Further, we assume that SOM accumulation is prevented for sites covered for millennia under LGM ice sheets.
During the LGM spin-up phase we calculate accumulation in perennially frozen ground (in kgC m−2) for ice-free sites for each SOM lability class i (following YASSO) as
with soil carbon concentrations at the permafrost table (in kgC m−3) inferred as described in Appendix A7, and z∗ describing the lower boundary of SOC accumulation (in m).
After 7000 years of model spin-up (when we diagnose permafrost SOC), we activate our scheme of transient SOC transfer between seasonally thawed and perennially frozen SOC pools and calculate prognostically with the transfer rate depending on changes in simulated ALD in each grid cell (see Appendix A7). We run the model for another 1000 years under stationary LGM climate forcing until 20 ka to allow for equilibration of the transient SOC transfer scheme and then perform the fully transient deglacial simulation from 20 ka to PI (see Fig. A13).
Table 1Performed transient and time-slice model experiments with MPI-ESM.
3.2 Model experiments
Unless otherwise stated, we discuss simulated model output by referring to our transient model experiment from LGM to PI with standard model parameters (experiment L2P). The model requires 16.43 s per model year on 108 nodes of our high-performance machine, giving a total computation time requirement of 0.5 node-h yr−1. To evaluate uncertainty in parameter settings (see Table 1), we have performed a set of additional experiments with JSBACH which are described in the following subsections.
3.2.1 Active layer depth (experiment L2P_ALD)
Organic layers at the top of permafrost soils cover only a small fraction of the soil profile, but exert a large effect on subsoil temperatures by their insulating effect (Porada et al., 2016; O'Donnell et al., 2009). Given a tendency to overestimate active layer depths (ALDs) in JSBACH compared to observations (see Sect. 4.1.2), we have set up a sensitivity experiment in which we have lowered the standard value of thermal conductivity of the surface organic layer (0.25 W m−1 K−1; Ekici et al., 2014) by a factor of 2 to test the significance of this parameter.
3.2.2 Vertical mixing rates (experiment L2P_VMR)
Vertical mixing of SOC in permafrost soils through cryoturbation is a well-studied process, but as the timescale involved is rather large, the magnitude of cryoturbation mixing rates is hard to constrain by observations and is subject to large uncertainty (Koven et al., 2009). We investigate consequences of doubling our assumed standard cryoturbation rate of 10 cm2 yr−1. Unless high sedimentation regions of fast loess formation are considered (e.g. Zimov et al., 2006), sedimentation has a much less pronounced effect on vertical concentration profiles of SOC in our model setting than cryoturbation and is therefore not considered separately.
3.2.3 Slow pool decomposition timescale (experiment L2P_HDT)
Decomposition timescale parameters in YASSO are inferred from a large set of litter-bag experiments. However, the slow pool decomposition timescale is less constrained. We therefore perform an additional experiment in which we increase the standard reference slow pool turnover time of 625 years (assumed for 0 ∘C and unlimited water availability) to 1000 years.
3.2.4 Litter input (experiment L2P_LIT)
SOC accumulation critically depends on simulated litter input. In our standard simulation we simulate a rather low net primary productivity (NPP) in permafrost regions under the harsh climatic conditions at 20 ka (see discussion in Sect. 4.1.3). We therefore have performed an additional experiment in which we have doubled litter input to YASSO soil pools to investigate SOC accumulation under a more productive LGM vegetation compared to our standard parameter setting.
3.2.5 Pre-industrial time slice (MPI-ESM1.2 T31_PI)
A time-slice experiment was run, in which MPI-ESM was run without permafrost physics in T31GR30 resolution in a fully coupled atmosphere–ocean setting (see Sect. 7.2). Stationary PI boundary conditions were defined following the CMIP5 protocol.
3.2.6 LGM time slice (MPI-ESM1.2 T31_LGM)
A time-slice experiment for stationary LGM boundary conditions following the PMIP3 protocol was run (Braconnot et al., 2011), with LGM land-sea and ice sheet masks, as well as greenhouse gases and orbit modified to LGM conditions (see Sect. 7.3). The model was run without permafrost physics in a fully coupled atmosphere–ocean setting in T31GR30 resolution.
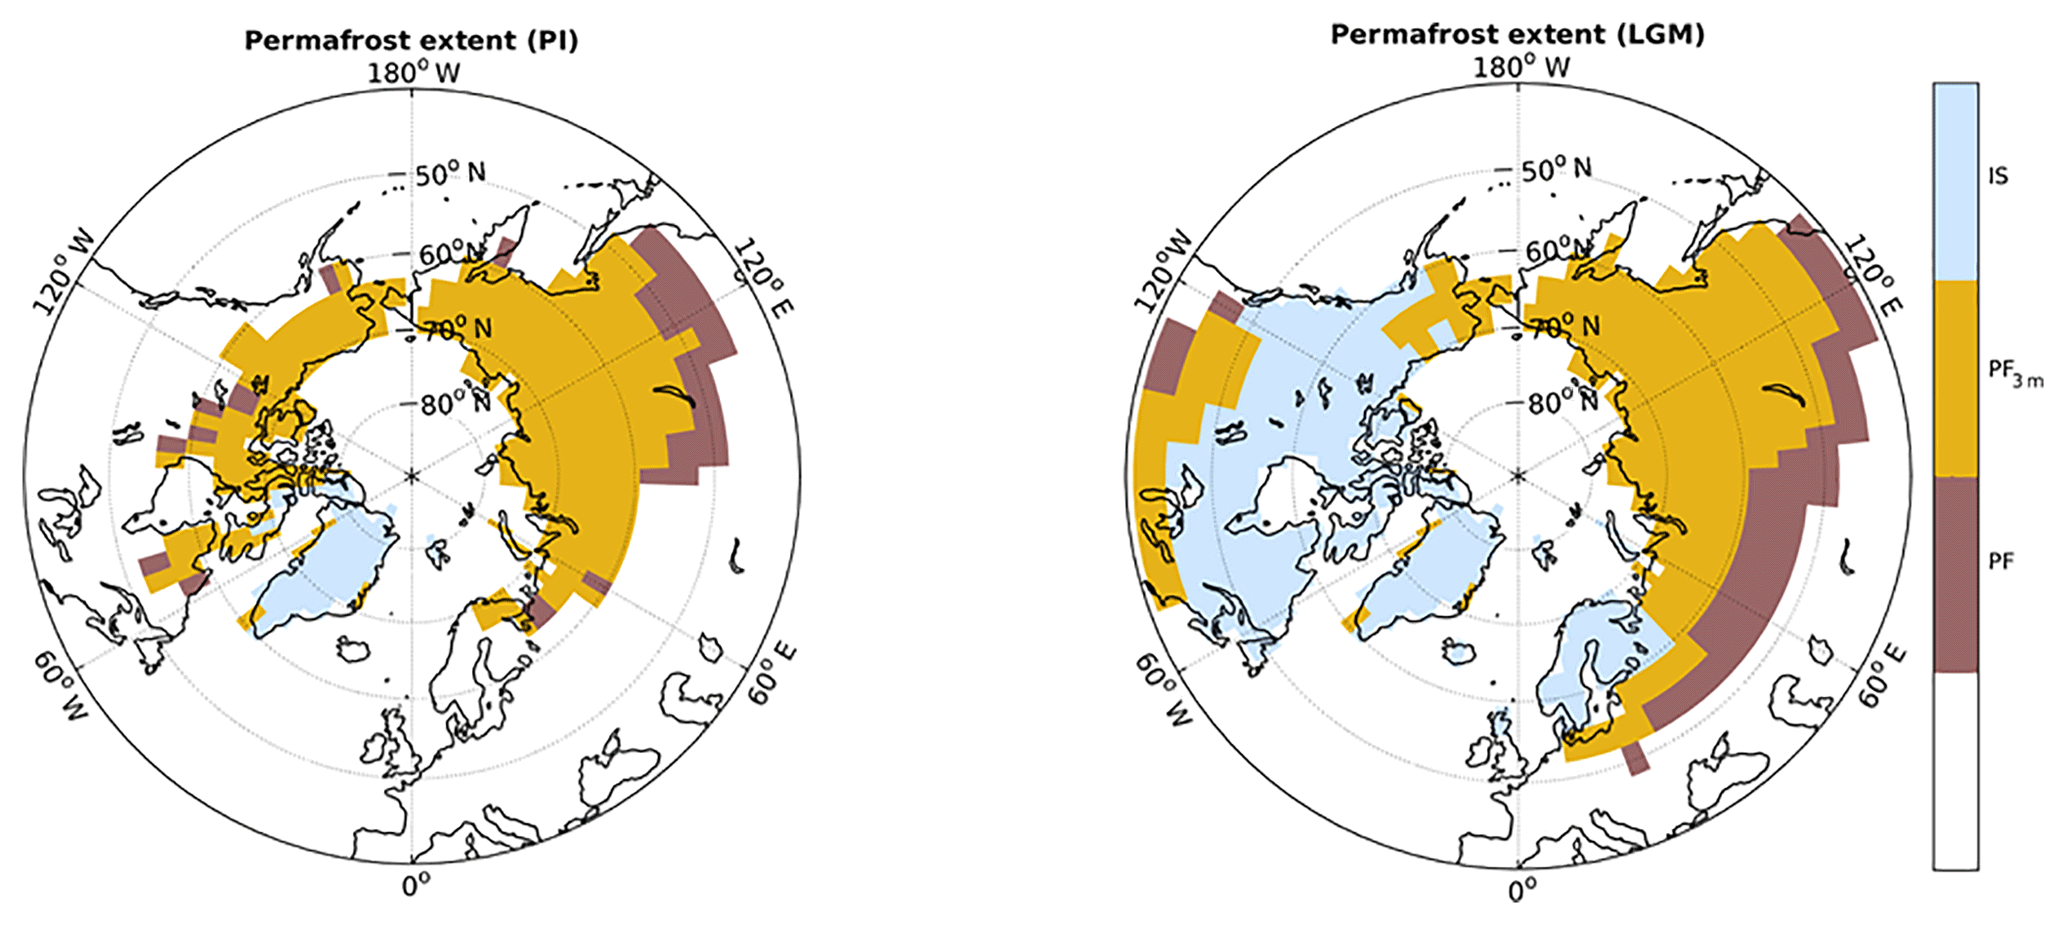
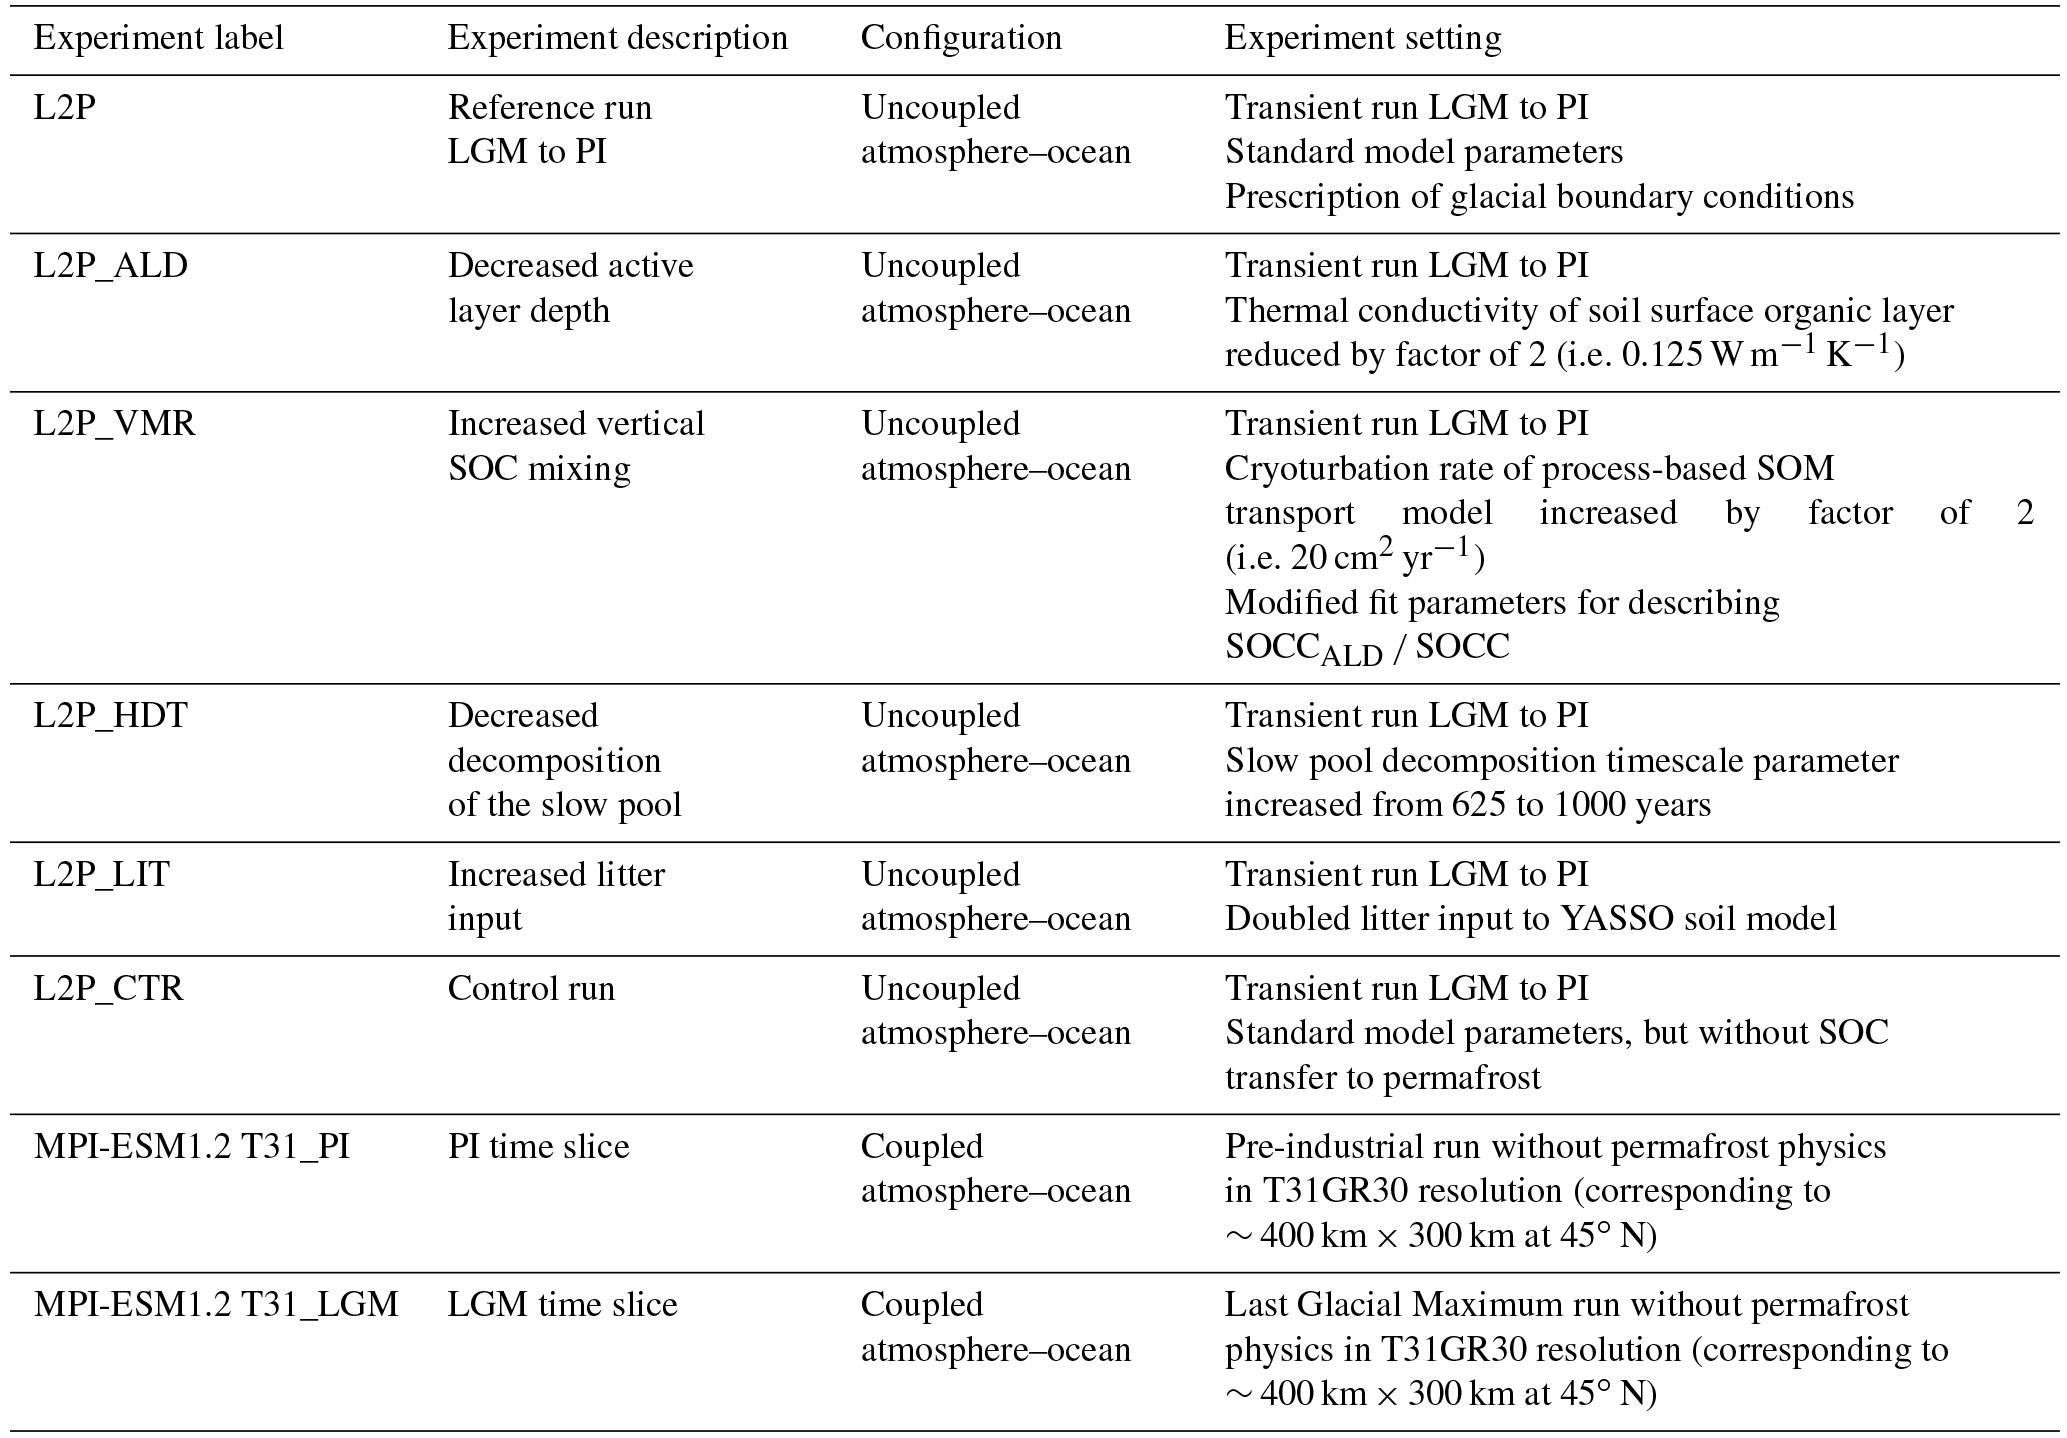
Figure 2Ice sheet coverage and permafrost extent at PI and LGM simulated with JSBACH. Mustard-coloured areas illustrate grid cells of simulated near-surface permafrost with active layers above 3 m (PF3 m), brown-mauve-coloured areas describe permafrost with active layers deeper than 3 m (PF). Light-bluish-coloured areas show prescribed ice sheet coverage (IS). Data shown represent 100-year time averages.
We first show simulated spatial patterns of physical and biogeochemical drivers for SOC build-up, along with simulated SOC distributions in permafrost regions under LGM and PI climatic conditions. We then discuss transient SOC dynamics from the LGM at 20 ka to the Holocene at 0 ka. Finally, we discuss the robustness of our findings with regard to uncertainty in specific model parameter choices.
4.1 PI and LGM time slices
4.1.1 Permafrost extent at PI and LGM
Under PI climate conditions we model a Northern Hemisphere (NH) permafrost extent of 20.3 million km2 (Fig. 2). Hereby we classify a grid cell subject to permafrost if maximum seasonal thaw is consistently less than the model's lowest soil boundary at 40 m. Most of the areal coverage is in Asia where the southern boundary extents to 46∘ N, excluding more southerly permafrost in the Himalaya region (not shown). Focusing on near-surface permafrost within the upper 3 m of the soils, JSBACH simulates a northern permafrost extent of 16.9 million km2. Data-based estimates indicate that about 24 % of the exposed NH land area or 22.8 million km2 are affected by permafrost (Zhang et al., 1999). These estimates comprise permafrost regions of smaller-scale occurrence, such as sporadic permafrost (10 %–50 % landscape coverage) or isolated permafrost (less than 10 % coverage). These smaller landscape-scale features are not captured by JSBACH grid cell sizes. When excluding these contributions, data-based estimates of continuous and discontinuous permafrost suggest an areal coverage of 15.1 million km2 (Zhang et al., 2008), about 90 % of JSBACH simulated near-surface pre-industrial permafrost extent.
Under the cold climatic conditions prevailing at LGM, JSBACH simulates an additional 3.7 million km2 above pre-industrial extent, amounting to a total NH permafrost area of 24 million km2, which is close to the mean of PMIP3 model results of 26 million km2 (Saito et al., 2013). Our simulated LGM near-surface permafrost in the upper 3 m amounts to 18.3 million km2. Reconstructions suggest a total coverage of about 30 million km2 on current land areas (Lindgren et al., 2016). Without contributions from discontinuous permafrost, the reconstructed extent (25.4 km2) is close to our simulated total LGM permafrost extent. Compared to the reconstructions, JSBACH simulates less LGM permafrost in Europe, western and central Asia, and slightly more permafrost in North America at the southern Laurentide Ice Sheet boundary. The discrepancy between the model and data is likely a consequence of too warm soil temperatures simulated under LGM conditions at southerly permafrost grid cells. Part of the discrepancy might also be explained if LGM data-based estimates of discontinuous permafrost comprise large contributions from sporadic and isolated permafrost not resolved in JSBACH.
Another part of the discrepancy might result from precipitation biases leading to snow depth biases under glacial conditions. Overestimates in simulated snow depth can easily translate into too excessive snow insulation and therefore result in unrealistic high soil temperature (Stieglitz et al., 2003; Zhang, 2005; Lawrence and Slater, 2010; Slater and Lawrence, 2013; Langer et al., 2013).
Simulating too little LGM permafrost coverage underlines the challenge of modelling warm permafrost occurrence in non-continuous permafrost regions in which smaller-scale variations in snow thickness, vegetation cover, and topography play an increasingly dominant role on the soil thermal state.
Despite a limited simulated decrease in permafrost extent (20 %), pronounced spatial changes in permafrost coverage from the LGM to the PI climate are evident (Fig. 2). As a consequence of the cold climatic conditions prevailing at the LGM, permafrost extent has spread further south in most regions. At the same time, large areas of the NH, especially in North America, have been covered by thick ice sheets, thus limiting the maximum area for permafrost to establish in NH grounds.
Figure 3Active layer depths (ALDs) in near-surface permafrost soils at PI and LGM simulated by JSBACH. Light bluish-coloured areas show prescribed ice sheet coverage. Data shown represent 100-year time averages.
4.1.2 ALD for PI and LGM
Figure 3 shows simulated ALDs for PI and glacial conditions. Compared to the PI experiment performed with the CMIP-5 MPI-ESM model version, a slight warm bias in simulated mean surface air temperatures is evident in most grid cells of North America for MPI-ESM1.2T31 (Fig. A2 in the Appendix). As a consequence of this warm bias, ALDs in Alaska are biased high for most grid cells (Fig. A9) in our model version when compared to CALM observations (Brown et al., 2000). Given rather poor data coverage of monitored ALDs, especially in Asia, a model–data comparison should be seen with caution as it is questionable to what extent the site-level data are representative for scales simulated by JSBACH. Nevertheless, we here compare large-scale simulated ALDs to local-scale observational estimates based on the CALM database. Model data mismatches are less pronounced in Asia, and generally the model experiment of an increased organic layer insulating effect (experiment L2P_ALD, see Sect. 4.3) suggests improved agreement with the data. The simulated ALDs further suggest a tendency towards too warm soil temperatures in southerly permafrost regions (see Fig. A9). This is in line with underestimating LGM southward spread of permafrost in JSBACH compared to reconstructions.

Figure 4Vegetation productivity (NPP, summed over all vegetation types) in near-surface permafrost regions for PI and LGM simulated by JSBACH. Light bluish-coloured areas show prescribed ice sheet coverage. Data shown represent 100-year time averages.
4.1.3 Vegetation productivity at PI and LGM
The amount of SOC stored in the ground crucially depends on vegetation litter input. Figure 4 shows high-latitude vegetation productivity under LGM and PI climate conditions. We infer highest vegetation productivity (with NPP larger than 250 gC m−2 yr−1) for the PI at the southern near-surface boundary in North America. The harsh glacial conditions of low temperatures and low precipitation in combination with low CO2 levels result in strongly reduced glacial vegetation productivity compared to the PI. Therefore large regions show a NPP well below 50 gC m−2 yr−1 during the LGM (Fig. 4). The sensitivity of vegetation productivity to changing CO2 levels is especially debatable. This structural model uncertainty is underlined by an ensemble of process-based land-surface models which reveal a very large spread in simulated vegetation productivity to changing CO2 levels under present-day climate (McGuire et al., 2016). Beer et al. (2010) have inferred observation-based estimates of gross primary production (GPP) and have underlined the large uncertainty in modelled high-latitude vegetation. Compared to this study, our simulated NPP falls in the lower range of their estimates. For a more detailed model–data comparison of vegetation productivity we have analysed up-scaled flux tower measurements of GPP (Jung et al., 2011) by assuming that present-day GPP is roughly 15 % above pre-industrial values (Ciais et al., 2013). In Fig. A4 we analyse simulated pre-industrial GPP and infer a larger vegetation productivity in North America (about 25 %–50 % above the data), while a reversed signal of low-biased GPP in Eurasia (typically about 50 % below the data) is modelled. This pattern of GPP deviation from observations expresses the climatology bias of this model configuration of MPI-ESM1.2 due to an altered land–atmosphere coupling (see discussion in Sect. 7.2).
The low bias in vegetation productivity proved especially critical for simulating glacial permafrost SOC storage (see next section), as low levels of glacial temperatures, precipitation, and CO2 concentration were strong limiting factors for glacial NPP and eventual SOC storage. The harsh simulated LGM climate pushes many permafrost grid cells close to bio-climatic vegetation limits. Therefore a small temperature bias can result in a strong underestimation of SOC storage in permafrost grounds, pointing to the importance of calibrating simulated LGM climate for modelling permafrost SOC build-up.

Figure 5Seasonally thawed SOC in the active layer (a, b: SOCAL) and perennially frozen SOC in near-surface permafrost (c, d: SOCPF) at PI and LGM simulated by JSBACH. Light bluish areas show prescribed ice sheet coverage. Data shown represent 100-year time averages.
4.1.4 SOC storages at LGM and PI
Simulated SOC storage in the active layer (SOCAL) shows pronounced regional to continental-scale differences for PI and LGM (Fig. 5, upper panels). Pre-industrial SOC storage in North America is much higher than in Eurasia as a consequence of differences in simulated vegetation productivity in JSBACH. Given low glacial vegetation productivity, many grid cells reveal low LGM soil carbon storages below 5 kgC m−2. The implementation of our newly developed scheme to account for SOC accumulation in perennially frozen ground has led to pronounced increases in total SOC storage in many regions compared to a reference run without accounting for permafrost carbon. The largest increases are inferred for northern grid cells with rather shallow active layer that have >15 kgC m−2 in permafrost (SOCPF, Fig. 5, lower panels). Under PI climate conditions, the largest permafrost SOC carbon accumulation is inferred for northernmost grid cells in Siberia, where active layers are shallow, but where surface air temperatures are still high enough to support litter input to the soils. In contrast, under LGM climate conditions we infer a southward shift of maximum permafrost SOC as vegetation productivity in the northernmost grid cells decreases strongly.
Field data of mineral horizons in loamy permafrost-affected soils of Kolyma lowlands have organic carbon contents of 1 %–3 %, with possible peaks up to 7 %, likely due to cryoturbation (Mergelov and Targulian, 2011). These soils contain 7–25 kgC m−2, which is within the range of our simulation results.
In contrast to observational datasets, such as the NCSCD (Northern Circumpolar Soil Carbon Database), we represent SOM quantity and its degree of decomposition by our simulation approach (see Sect. 7.7.1). Weighted over the permafrost domain, we model a SOC composition in the seasonally thawed soil surface of roughly equal shares of the slow (H) pool (∼ 45 %–50 %) and intermediate (N) non-soluble pool (∼ 40 %), with the remaining SOM stored in the fast pools. Simulated SOM stored in deeper perennially frozen ground reveals the imprint of depth-fractionation with a higher share of the slow pool (∼ 60 %). Southerly grid cells with deep active layers show the largest slow pool fractions, which can reach 100 % if seasonal thaw is pronounced. We therefore do not only capture accumulation of carbon in permafrost soils but also model the depth dependent distributions of potential SOM lability, which in turn determines the timescale of C release upon thaw.
Table 2Simulated SOC storage under LGM and PI conditions in near-surface permafrost soils for the standard parameter setting (L2P), reduced thermal conductivity of the organic layer (L2P_ALD), increased vertical soil mixing (L2P_VMR), increased slow pool lifetime (L2P_HDT), doubled litter input (L2P_LIT), and a control run without transfer of SOC to permafrost (L2P_CTR). Storages are expressed as totals, as the ratio between active layer and permafrost carbon, and normalized by the near-surface permafrost area (PFA).

JSBACH simulates a total SOC storage in near-surface permafrost soils of 168 PgC under PI climate conditions, of which about a third is stored in permafrost (see also Fig. 7 and Table 2). When considering the full area of simulated permafrost ground (i.e. also considering grid cells with active layers below 3 m depth), a total of 194 PgC is stored in permafrost soils. This is significantly lower than a recent empirically based reconstruction of LGM SOC stocks which includes ca. 800 PgC in mineral soils, but for a larger permafrost area and assuming that lower glacial CO2 levels did not strongly reduce vegetation productivity (Lindgren et al., 2018). Given a multitude of factors which impact simulated SOC storage, current process-based permafrost-carbon models underline that uncertainty in simulated present-day permafrost carbon stocks is very large (McGuire et al., 2016) and suggest that our estimate falls in the lower range of model results.
Data-based estimates of pan-Arctic SOC storage in permafrost regions suggest a total of 1042 PgC (NCSCDv2.2; Hugelius et al., 2013). This amount also comprises SOC contributions from soils within the permafrost domain that are not underlain by permafrost. When focusing on continuous and discontinuous permafrost and constraining the NCSCD data to grid cells with permafrost coverages larger than 50 %, an estimated 575 PgC is stored in northern Gelisols. As we do not model organic soils (>40 cm surface peat; Histels), we have recalculated the Gelisol SOC estimate for model–data comparison purposes by assuming that Histels have the same SOC concentrations as mineral cryoturbated soils (i.e. Turbels) and infer a total of 547 Pg SOC storage.
As discussed above, part of the low bias in simulated SOC storage can be explained by low litter input into the soils due to an underestimate in vegetation productivity. Simulated vegetation productivity is especially low under the glacial climate as a consequence of low levels of glacial temperatures, precipitation, and CO2 concentration which prove a strong limiting factor for glacial NPP and eventual SOC storage. It is worth noting that the reconstruction by Lindgren et al. (2018) did not consider a potentially lower SOC stock due to CO2 limitation at LGM times. In our model the harsh simulated LGM climate and low CO2 levels pushes many permafrost grid cells close to bio-climatic vegetation limits. Therefore a small temperature bias can result in a strong underestimate of SOC storage in permafrost grounds, pointing to the importance of calibrating simulated LGM climate for modelling permafrost SOC build-up.
Another contribution to differences in modelled and observed SOC storage is likely to come from SOM decomposition timescale assumptions. In Sect. 4.3 we discuss an increase in simulated SOC accumulation due to increasing the residence time of the slow pool. These results underline that accounting for processes of long-term SOM stabilization (e.g. through the interaction with mineral compounds) would further increase simulated long-term SOC storages and should be considered an important aspect for further model development. A further aspect with regard to an improved representation of soil decomposition in permafrost will come from accounting for the full vertical soil temperature profile instead of tuning decomposition parameters to surface climatology only (see Sect. 2.4).
Despite a slightly larger simulated permafrost extent under LGM conditions, total LGM SOC storage of 147 PgC is lower than PI storage due to a reduced vegetation productivity under harsh glacial climate conditions (see Fig. 4). In contrast, using the land surface model ORDCHIDEE-MICT (Zhu et al., 2016) infers much larger LGM SOC storage in permafrost regions of about 1220 PgC (without accounting for fast sedimentation in Yedoma regions). This large discrepancy results from of a factor of 2 lower LGM permafrost extent and much lower glacial vegetation productivity simulated by JSBACH compared to ORCHIDEE-MICT.
4.2 Deglacial climate and carbon dynamics
The dynamics of total SOC storage in permafrost are determined by the interplay of changes in permafrost extent and active layer thickness, as well as by changes in soil carbon net fluxes determined by litter input and losses mainly due to heterotrophic respiration. These factors are analysed in detail in the following sections.
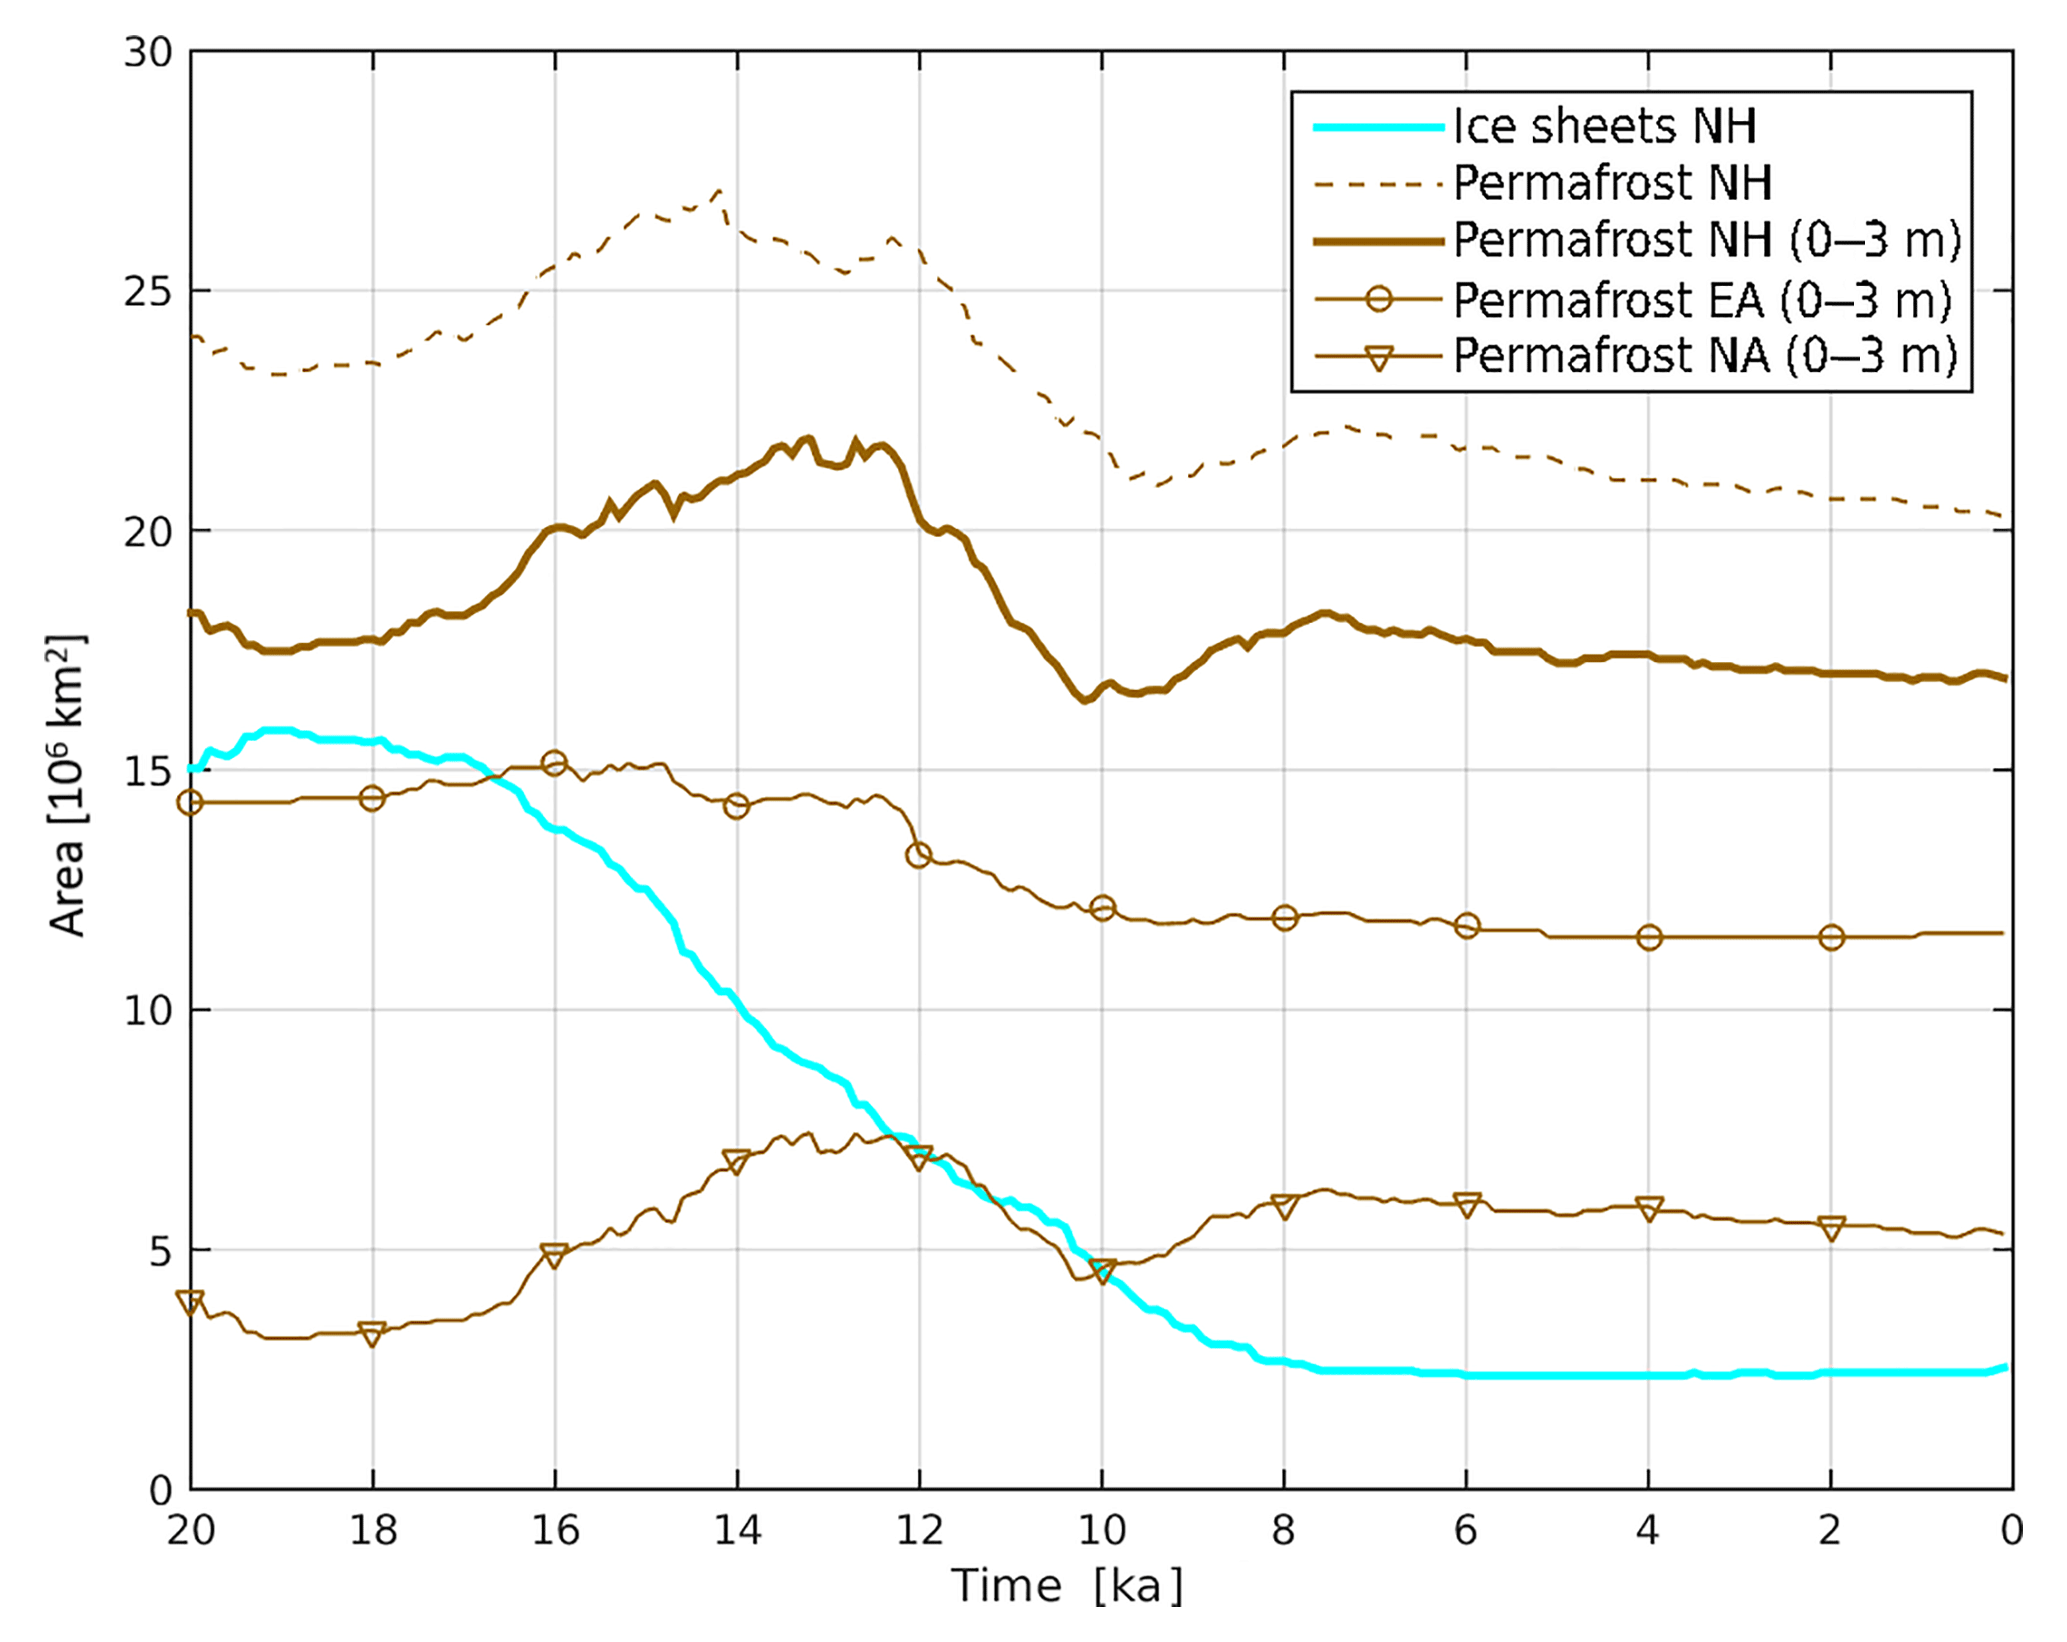
Figure 6Deglacial evolution of simulated permafrost extent and prescribed ice sheet area from LGM to PI. Permafrost extent (brown lines) is shown separately for total (dashed line) and near-surface (solid line) Northern Hemisphere (NH) permafrost, subdivided into North America (NA, line with triangles), and Eurasia (EA, line with circles). Data shown represent 100-year time averages.
4.2.1 Deglacial evolution of permafrost extent and SOC storage
Deglacial changes in permafrost extent are strongly shaped by the retreat of northern hemisphere ice sheets. Especially the decline in the Laurentide Ice Sheet has exposed large areas of soil in North America to cold air temperatures, which led to a build-up of permafrost in these regions. As a consequence, JSBACH simulates the maximum in permafrost extent not during the LGM with maximum ice-sheet coverage, but around 13 ka due to an increase in permafrost extent in North America (Fig. 6). Consequently, deglacial warming results in a strong decline in total permafrost extent towards the beginning of the Holocene at 10 ka, while changes in permafrost extent over the Holocene period are less pronounced.
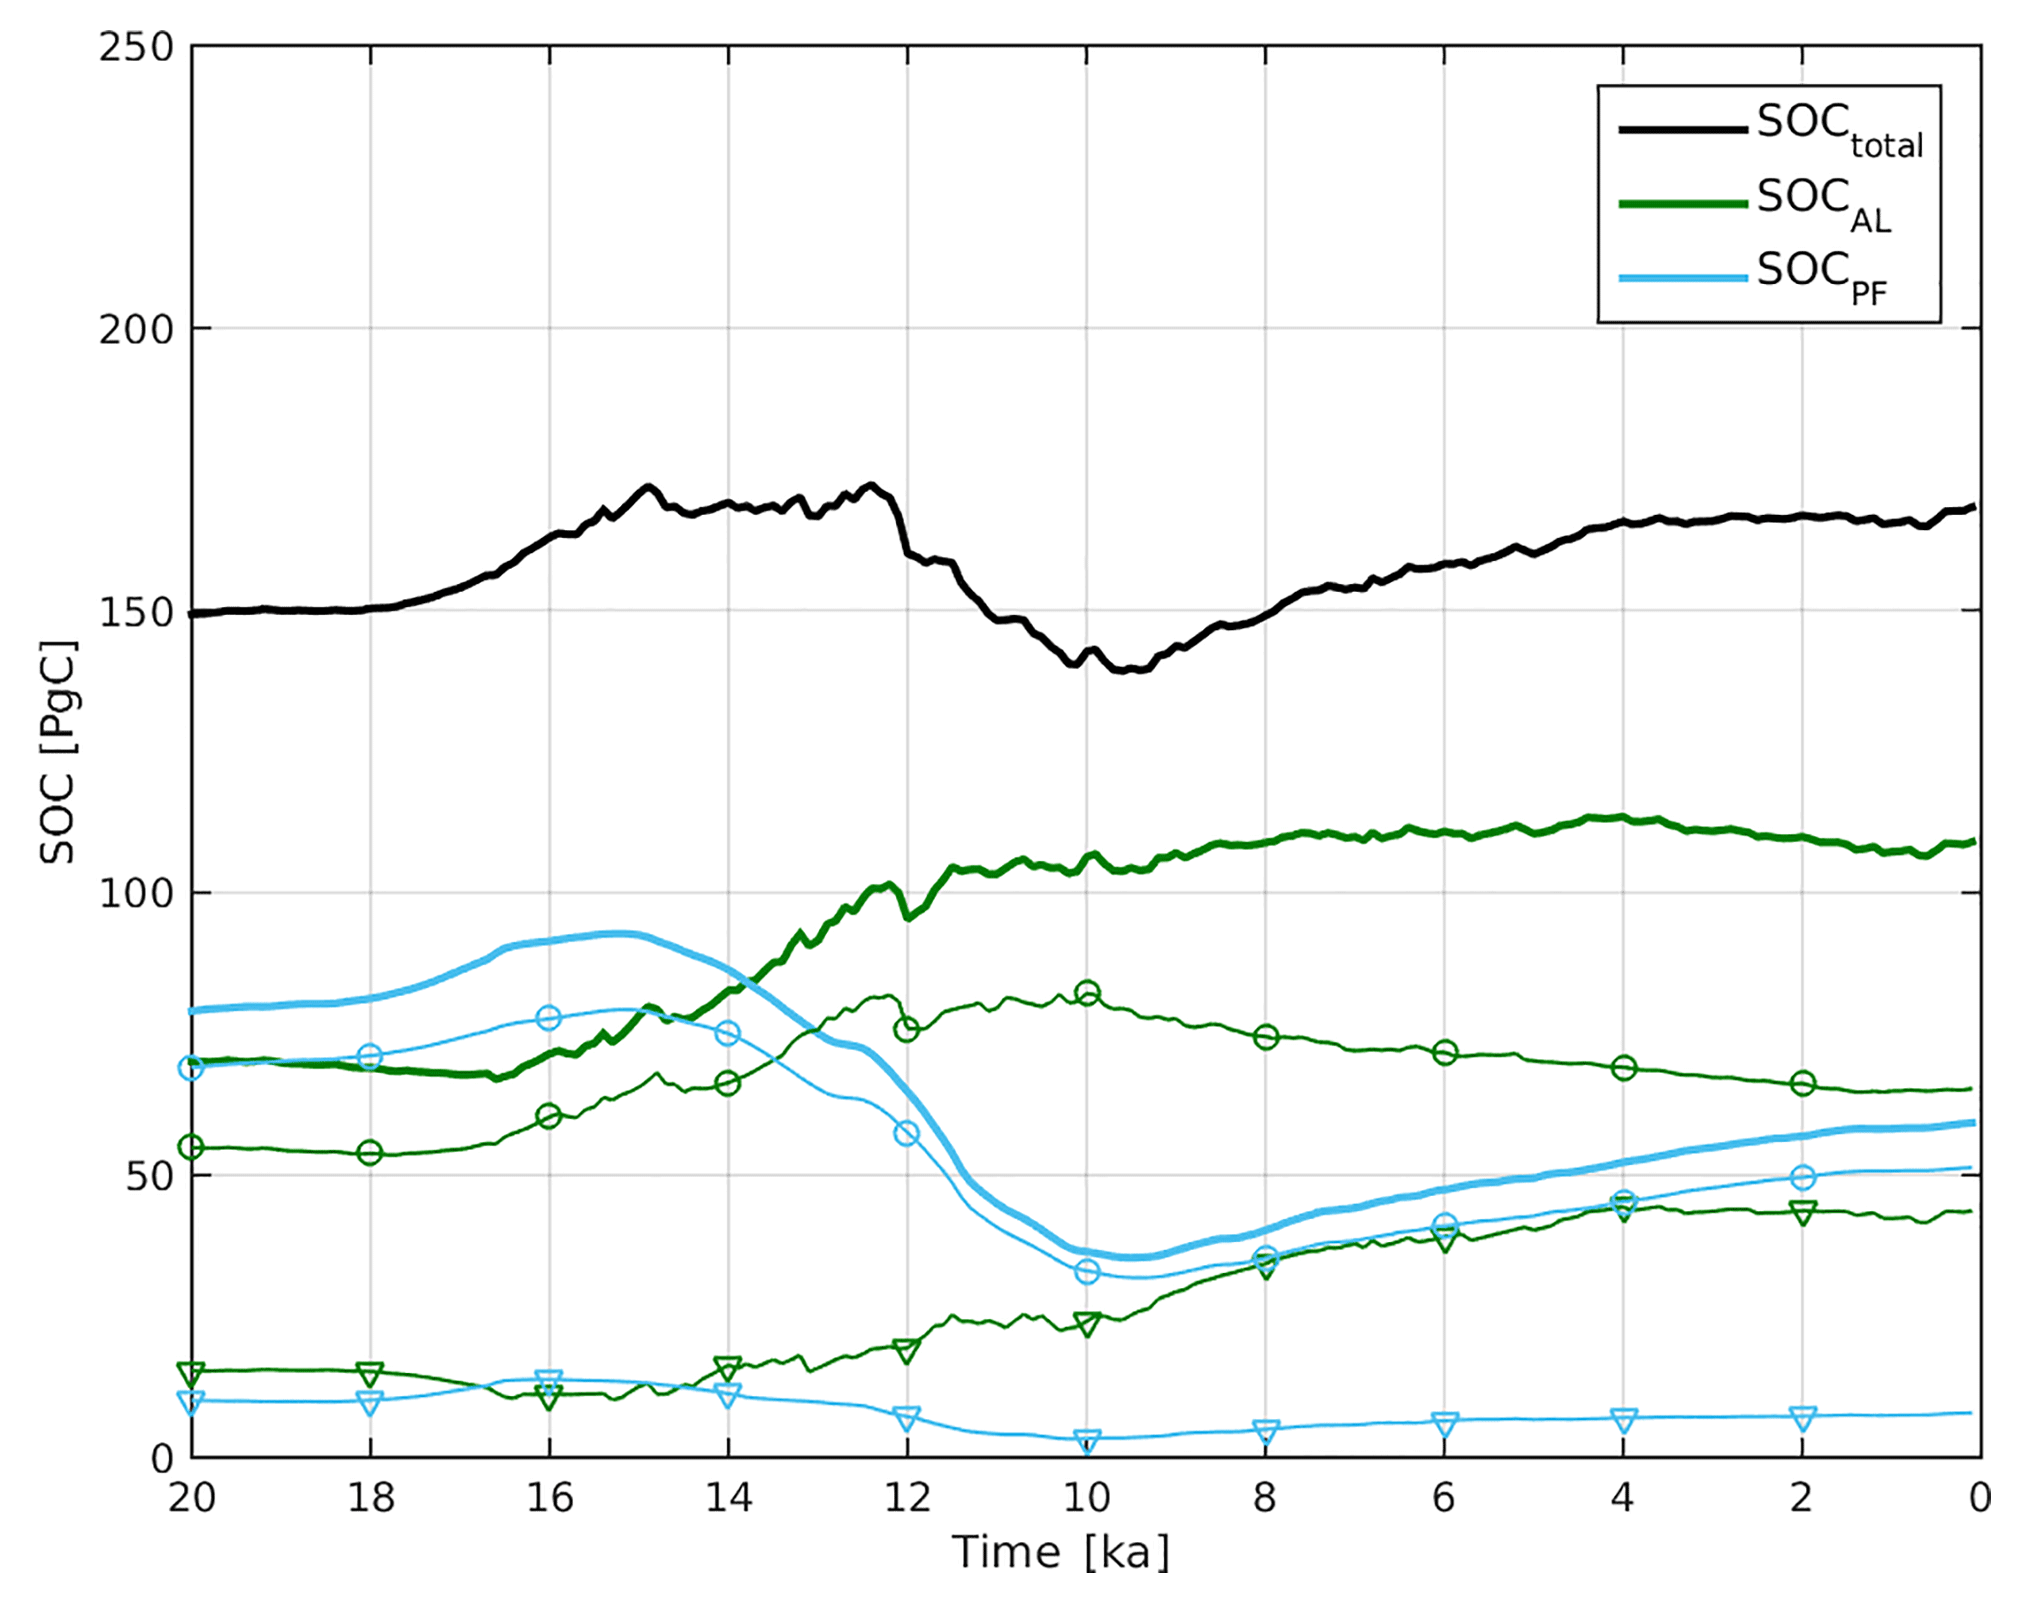
Figure 7Deglacial evolution of seasonally thawed and perennially frozen SOC in near-surface permafrost from LGM to PI. Total SOC (black line) is composed of seasonally thawed SOC (green lines) and perennially frozen SOC (blue lines). Contributions from North America (lines with triangles) and Eurasia (lines with circles) are shown separately. Data shown represent 100-year time averages and were summed over near-surface permafrost grid cells (accounting for temporally evolving permafrost extents).
Deglacial climate dynamics have also affected permafrost carbon storage by increases in vegetation productivity through higher CO2 levels, and a prolonged and warmer growing season (thus increasing litter input to the soils). In parallel, soil respiration rates have increased by soil warming and carbon was transferred from perennially frozen to seasonally thawed soils through active layer deepening. Figure 7 shows the deglacial evolution of total SOC stored in near-surface permafrost along with individual contributions from active layer (SOCAL) and permafrost (SOCPF) organic carbon.
Pronounced changes in permafrost SOC become evident after 17 ka, showing alternating phases of total permafrost carbon release and storage. Over the full deglacial period from the LGM to PI, we model a net accumulation of 29 PgC from SOC in near-surface permafrost – in line with a recent empirically based reconstruction of higher SOC accumulation in mineral soils of the permafrost domain under present-day conditions as compared to the LGM (Lindgren et al., 2018). Changes in the pools of seasonally thawed and perennially frozen carbon are more pronounced. Total organic carbon storage in the active layer (SOCAL) is gradually increasing from the glacial period towards the Holocene, while perennially frozen organic carbon (SOCPF) strongly decreases under deglacial warming towards the Holocene, and then increases slightly towards reaching PI conditions.
With regard to continental-scale deglacial SOC evolution, the temporal dynamics of permafrost coverage and SOC storage turn out to be only weakly linked (see Fig. A10). Under climate warming, the direct loss of permafrost extent lowers the total amount of SOC stored in active layer and permafrost grounds. At the same time, this SOC loss is compensated by an increased litter input to permafrost soils due to higher vegetation productivity. For instance, the strong warming at 13 to 10 ka results in a pronounced reduction in North American and Eurasian permafrost extents (Fig. A10) and increased soil respiration, but related SOC losses are more than outweighed by concurrent increases in NPP, which finally result in increased total SOCAL accumulation (Fig. A10). A further consequence of climate warming is the deepening of active layers, which decreases the stock of perennially frozen SOC (SOCPF) in favour of active layer SOC as carbon is transferred from frozen to thawed pools. In the case of permafrost area gains as a consequence of ice sheet retreat, e.g. between 17 and 13 ka in North America (Fig. A10), the total area of permafrost SOC accumulation is increasing. Yet the climate has to warm sufficiently to favour intense vegetation productivity in newly established permafrost grid cells which explains the time lag in SOCAL increases. Figure A10 underlines that the evolution of active layer SOC is rather tracked by changes in NPP in permafrost regions than by changes in permafrost extent. In Eurasia, a long-term shallowing trend in simulated ALDs after 10 ka results in a NPP decline towards reaching the PI climate in our model. The sensitivity of simulated NPP to ALD could explain how climatology biases affect permafrost region vegetation productivity via soil moisture coupling and therefore negatively affect permafrost SOC accumulation (especially in cold-biased regions of Siberia).
In contrast to Crichton et al. (2016), we infer a slight increase in permafrost SOC storage between 17.5 and 15 ka instead of a large release of thawed permafrost carbon. Part of the discrepancy in simulated permafrost carbon dynamics can be explained by modelling rather different trajectories of deglacial permafrost extents. We also do not capture abrupt permafrost carbon release as suggested by Köhler et al. (2014) during the onset of the Bølling-Allerød. The authors hypothesize that the source of old 14C depleted carbon was eventually affected by large contributions from flooding of the Siberian continental shelf – a potential carbon source region which we do not capture by our modelling approach. With a focus on global CH4 levels (which we do not consider in this study), CH4 release from newly forming thermokarst lakes was postulated to have strongly affected global CH4 levels at the Pleistocene–Holocene transition (Walter et al., 2007).
Using an ESM of intermediate complexity, Ganopolski and Brovkin (2017) have recently analysed the contribution of terrestrial and ocean processes to the glacial–interglacial CO2 cycle. The important role of permafrost carbon in these simulations is that it lowers the increase in total deglacial terrestrial carbon, which is caused by CO2 fertilization and re-establishment of boreal forests. This study also found a minimum in permafrost carbon storage at the beginning of the Holocene, in line with our results.
4.3 Sensitivity runs
We have tested the robustness of our simulations with regard to model parameter choices which affect ALDs, vertical SOC profiles, and decomposition timescale. Further, we have run an additional experiment in which we have doubled litter input to the YASSO soil carbon module to compensate for low biases in simulated vegetation productivity. Table 2 shows how the individual sensitivity experiments affect simulated SOC storages under LGM and PI conditions.
When decreasing the organic surface layer conductivity by a factor of 2 (experiment L2P_ALD), we model a slight increase in permafrost extent (by 13.6 % for PI, by 6.0 % for LGM). Yet the dominant effect on simulated permafrost soils is manifested in shallower ALDs (see Fig. A9), thus shifting the weight between active layer and permafrost carbon towards a larger carbon store in permafrost layers (Table 2). This increase in the fraction of permafrost carbon favours SOC accumulation by reducing heterotrophic respiration losses. Under LGM conditions, this SOC gain is compensated by simulating very shallow ALDs in many grid cells, which results in lower vegetation productivity in L2P_ALD compared to L2P as a consequence of modified soil moisture and soil water availability. Therefore, simulated total LGM storage is comparable in both experiments (Table 2). In contrast, SOCtot under PI conditions is about 60 % larger (amounting to 271 PgC) in L2P_ALD compared to our standard parameter setting (L2P).
We have further investigated how a doubling of the cryoturbation rate in the process-based model of SOC accumulation is affecting vertical SOC distributions, and therefore simulated SOC transport between active layer and permafrost carbon pools. We infer a slight increase in the fraction of permafrost SOC as a consequence of the faster SOM transport through the active layer, but the overall effect on simulated SOC storages is rather small (Table 2). Of larger impact is uncertainty in the assumed decomposition time of the slow pool. After increasing the slow pool turnover time in YASSO from 625 years (L2P) to 1000 years (L2P_HDT), we infer an increase in total SOC storage of 31.8 % (LGM) and 22.0 % (PI). An increase in simulated SOC storage would also result if YASSO soil decomposition parameters were scaled by soil instead of surface air temperatures (see discussion in Sect. 2.4). The extent to which SOC storage will increase is uncertain and an improved description of temperature sensitivity of decomposition is subject to current JSBACH model development. Finally, we have run an additional experiment with doubling of the soil litter input to YASSO to compensate for our inferred low bias in vegetation productivity. Simulated SOC stores in L2P_LIT almost double and amount to 288 PgC (LGM) and 320 PgC (PI), reducing the mismatch to observational data (see discussion in Sect. 4.1.4).
Using a new land surface model offline version of JSBACH, we have simulated long-term permafrost carbon dynamics from the Last Glacial Maximum (LGM) to pre-industrial (PI) climate, driven by climate forcing fields generated from MPI-ESM (version 1.2 in T31GR30 resolution). Focusing on continuous and discontinuous permafrost extent, we simulate a near-surface permafrost extent (i.e. permafrost in the upper 3 m of the soil) of 16.9 × 10⁶ km2, which is close to observational estimates. Simulated near-surface permafrost extent under glacial conditions during the LGM shows a pronounced different spatial pattern, with slightly increased total area coverage of 18.3 × 10⁶ km2. Empirical reconstructions of LGM permafrost suggest a larger areal extent, mainly due to an underestimate of JSBACH in simulated LGM permafrost in Europe and western and central Asia compared to the reconstructions. Despite comparatively small simulated changes in total permafrost extent between LGM and PI, our simulations show broad-scale shifts in permafrost coverage, with permafrost disappearance in southerly regions, and permafrost aggregation in formerly ice-covered grid cells in North America during deglacial warming.
The implementation of our newly developed model to calculate SOC accumulation in JSBACH in perennially frozen ground has strongly increased total simulated SOC storage at high latitudes: we model a LGM SOC storage of 72 PgC in seasonally thawed soil layers comprising all grid cells with permafrost in the upper 3 m. When additionally accounting for SOC accumulation in perennially frozen soil layers, which prevents permafrost organic matter from decomposition, we infer a total SOC storage of 147 PgC – doubling the amount of simulated LGM SOC in a control experiment with identical permafrost physics but without modelling carbon transport to permafrost layers.
Simulated deglacial warming triggers pronounced changes in regional permafrost extent and ALDs. In parallel, litter input into the soils increases through higher vegetation productivity, while soil respiration increases due to warming temperatures. As a consequence of combined deglacial changes in physical and biogeochemical driving factors we infer an increase in total permafrost SOC storage towards the Holocene (168 PgC at PI), with largest changes seen in the individual contributions of permafrost and active layer carbon. Our modelled PI SOC storage is low compared to observations of total carbon stored in soils of the permafrost region (∼ 1300 PgC) as we do not model high soil carbon accumulation in organic soils, in soils with little to no permafrost, or in deep deposits within the permafrost region. When focusing on near-surface permafrost sites of continuous and discontinuous occurrences (describing a Gelisol coverage larger than 50 %), observations suggest a total of 575 Pg of permafrost soil carbon. We inferred an improved agreement of simulated permafrost SOC storage with observational data when compensating low vegetation productivity in our coarse-resolution model version (MPI-ESM1.2T31) by doubling soil litter input in JSBACH, which leads to a storage of 320 Pg of SOC under PI climate conditions. Additional model experiments with JSBACH revealed the sensitivity of simulated SOC storage in permafrost regions to slow pool decomposition timescale and to ALDs. A larger storage of pre-industrial SOC was inferred when increasing the slow pool turnover time (205 PgC), and when increasing the insulation of the organic surface layer (271 PgC). Not capturing processes of long-term SOM stabilization in our model (e.g. through the formation of organo-mineral associations) can further explain a part of model–data differences.
Rather than a steady increase in carbon release from the LGM to PI as a consequence of deglacial permafrost degradation, our results show alternating phases of permafrost carbon release and accumulation, which illustrates the highly dynamic nature of this part of the global soil carbon pool. The temporal evolution of active layer SOC proved to be strongly linked to changes in NPP in permafrost regions, rather than to changes in permafrost extent, which can be explained by pronounced time lags between establishment of new permafrost after ice sheet retreat and onset of intense vegetation productivity. Our simulations show a long-term shallowing trend of ALDs towards reaching the PI climate, which results in a sustained but slow transfer of active layer SOC to perennially frozen pools after 10 ka.
Over the full deglacial period from the LGM to the PI climate, we model a net accumulation of 21 PgC in near-surface permafrost soils (i.e. an increase by 14 % above LGM SOC). The full extent to which carbon accumulation and release as a consequence of deglacial permafrost degradation has likely affected past variations in atmospheric glacial–interglacial greenhouse gas levels critically depends on the realism of simulated glacial vegetation productivity and permafrost thermal state, which are both the subject for future model improvements.
Primary data and scripts used in the analysis and other supplementary information that may be useful in reproducing this work are archived by the Max Planck Institute for Meteorology and can be obtained by contacting publications@mpimet.mpg.de.
A1 Applied climate forcing fields for a transient deglacial simulation with JSBACH
We have performed experiments with a standalone configuration of the MPI-ESM land surface model JSBACH, driven with climate forcings derived from coupled climate time-slice model experiments in coarse T31 resolution performed under pre-industrial and glacial conditions with MPI-ESM1.2 (as described in Mauritsen et al., 2018; with differences to the base version described in Mikolajewicz et al., 2018). As the availability of MPI-ESM1.2 experiments is limited to these two time slices, we follow an anomaly approach for modelling deglacial climate dynamics and used climatic fields from a transient glacial cycle experiment with the intermediate-complexity ESM CLIMBER2 (Ganopolski et al., 2010).
For the study presented here, we use the MPI-ESM1.2 pre-industrial climate experiment (described in Sect. 7.2) as the basis of the climate forcings. Climate forcings for earlier times were derived by applying monthly anomalies to the pre-industrial climate, with absolute anomalies used for surface air temperature fields and relative anomalies for precipitation, humidity, radiation, and wind speed. The anomaly applied to the MPI-ESM PI climate is derived as a linear interpolation between MPI-ESM LGM and CLIMBER2 anomalies, depending on the distance of CLIMBER2 global mean temperature to the LGM state. The weight of the MPI-ESM anomaly in this interpolation is shown in Fig. A1.
This procedure of determining the climatic anomalies ensures that near-LGM conditions are derived from the high-resolution MPI-ESM climatic fields, while climate during the deglaciation and the Holocene is derived from the lower resolution but spatiotemporally consistent CLIMBER2 fields.
A2 PI climate
To derive the climate forcings for the standalone JSBACH model we performed an experiment with MPI-ESM in version 1.2 in resolution T31GR30 (MPI-ESM1.2T31, corresponding to ∼ 400 km × 300 km at 45∘ N) using a half-hourly time step. We add a brief description of the northern high-latitude climate and differences to the CMIP5 version of the model. In CMIP5 the standard (LR) resolution was T63GR15, and climatic fields for comparison were interpolated to T31GR30 here. The CMIP5 pre-industrial climate was described in Giorgetta et al. (2013).
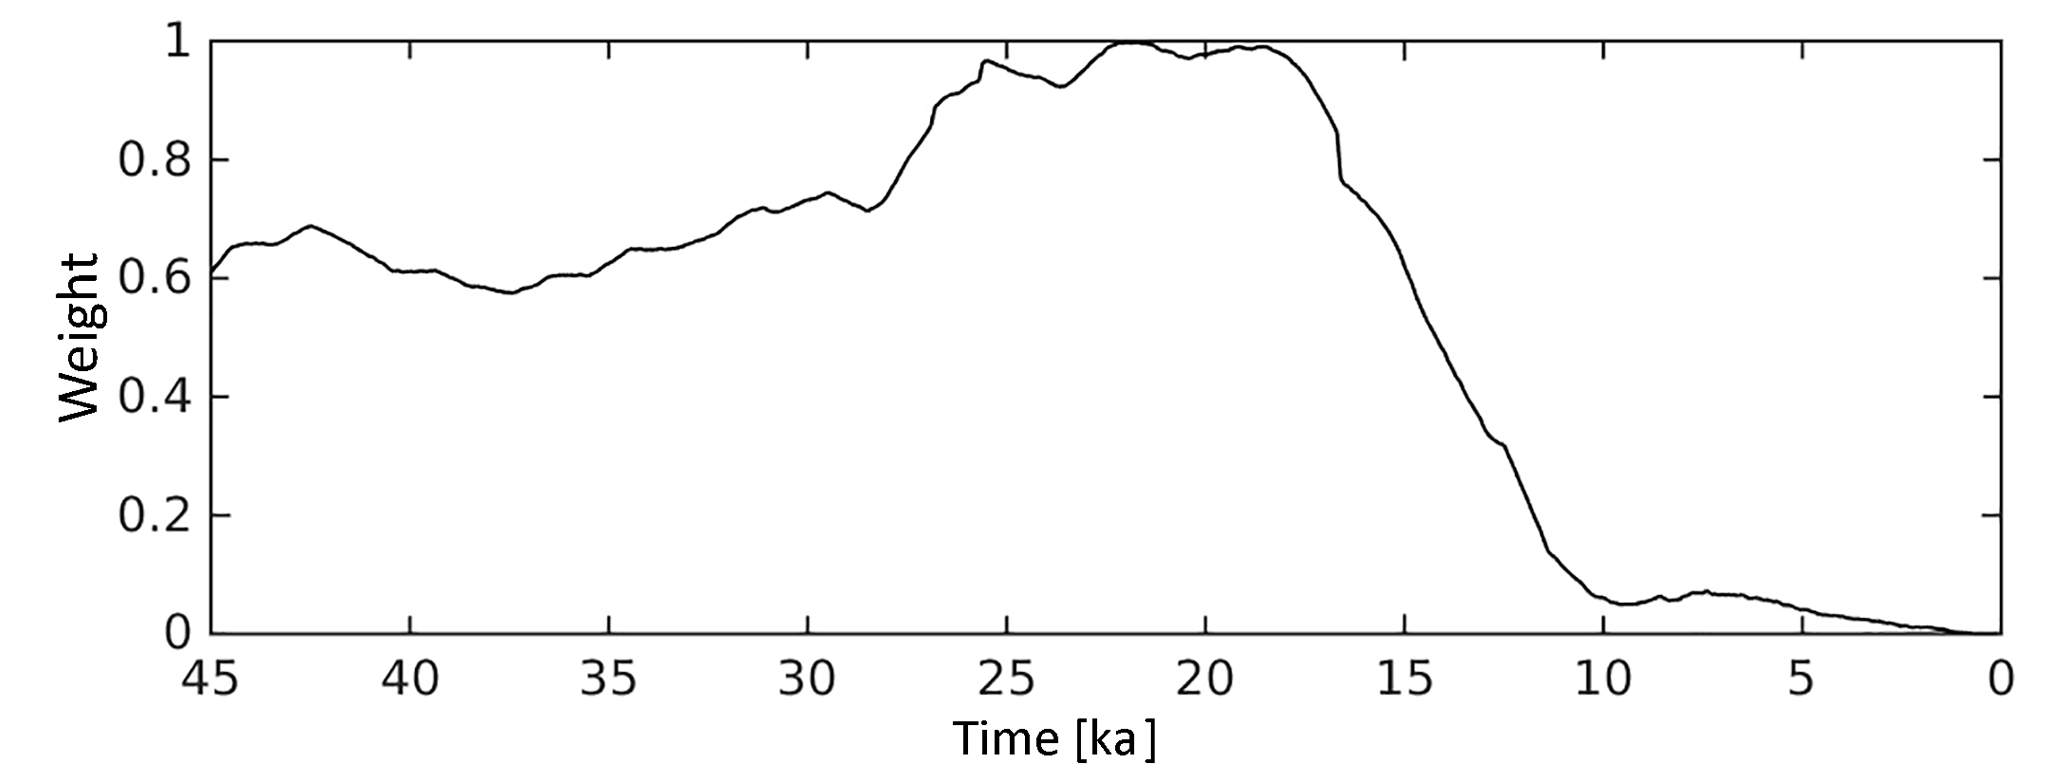
Figure A1Transient weighting of MPI-ESM anomaly (LGM-PI). At LGM, the anomaly is fully described by MPI-ESM. CLIMBER2 anomaly weight is 1 – MPI-ESM anomaly.
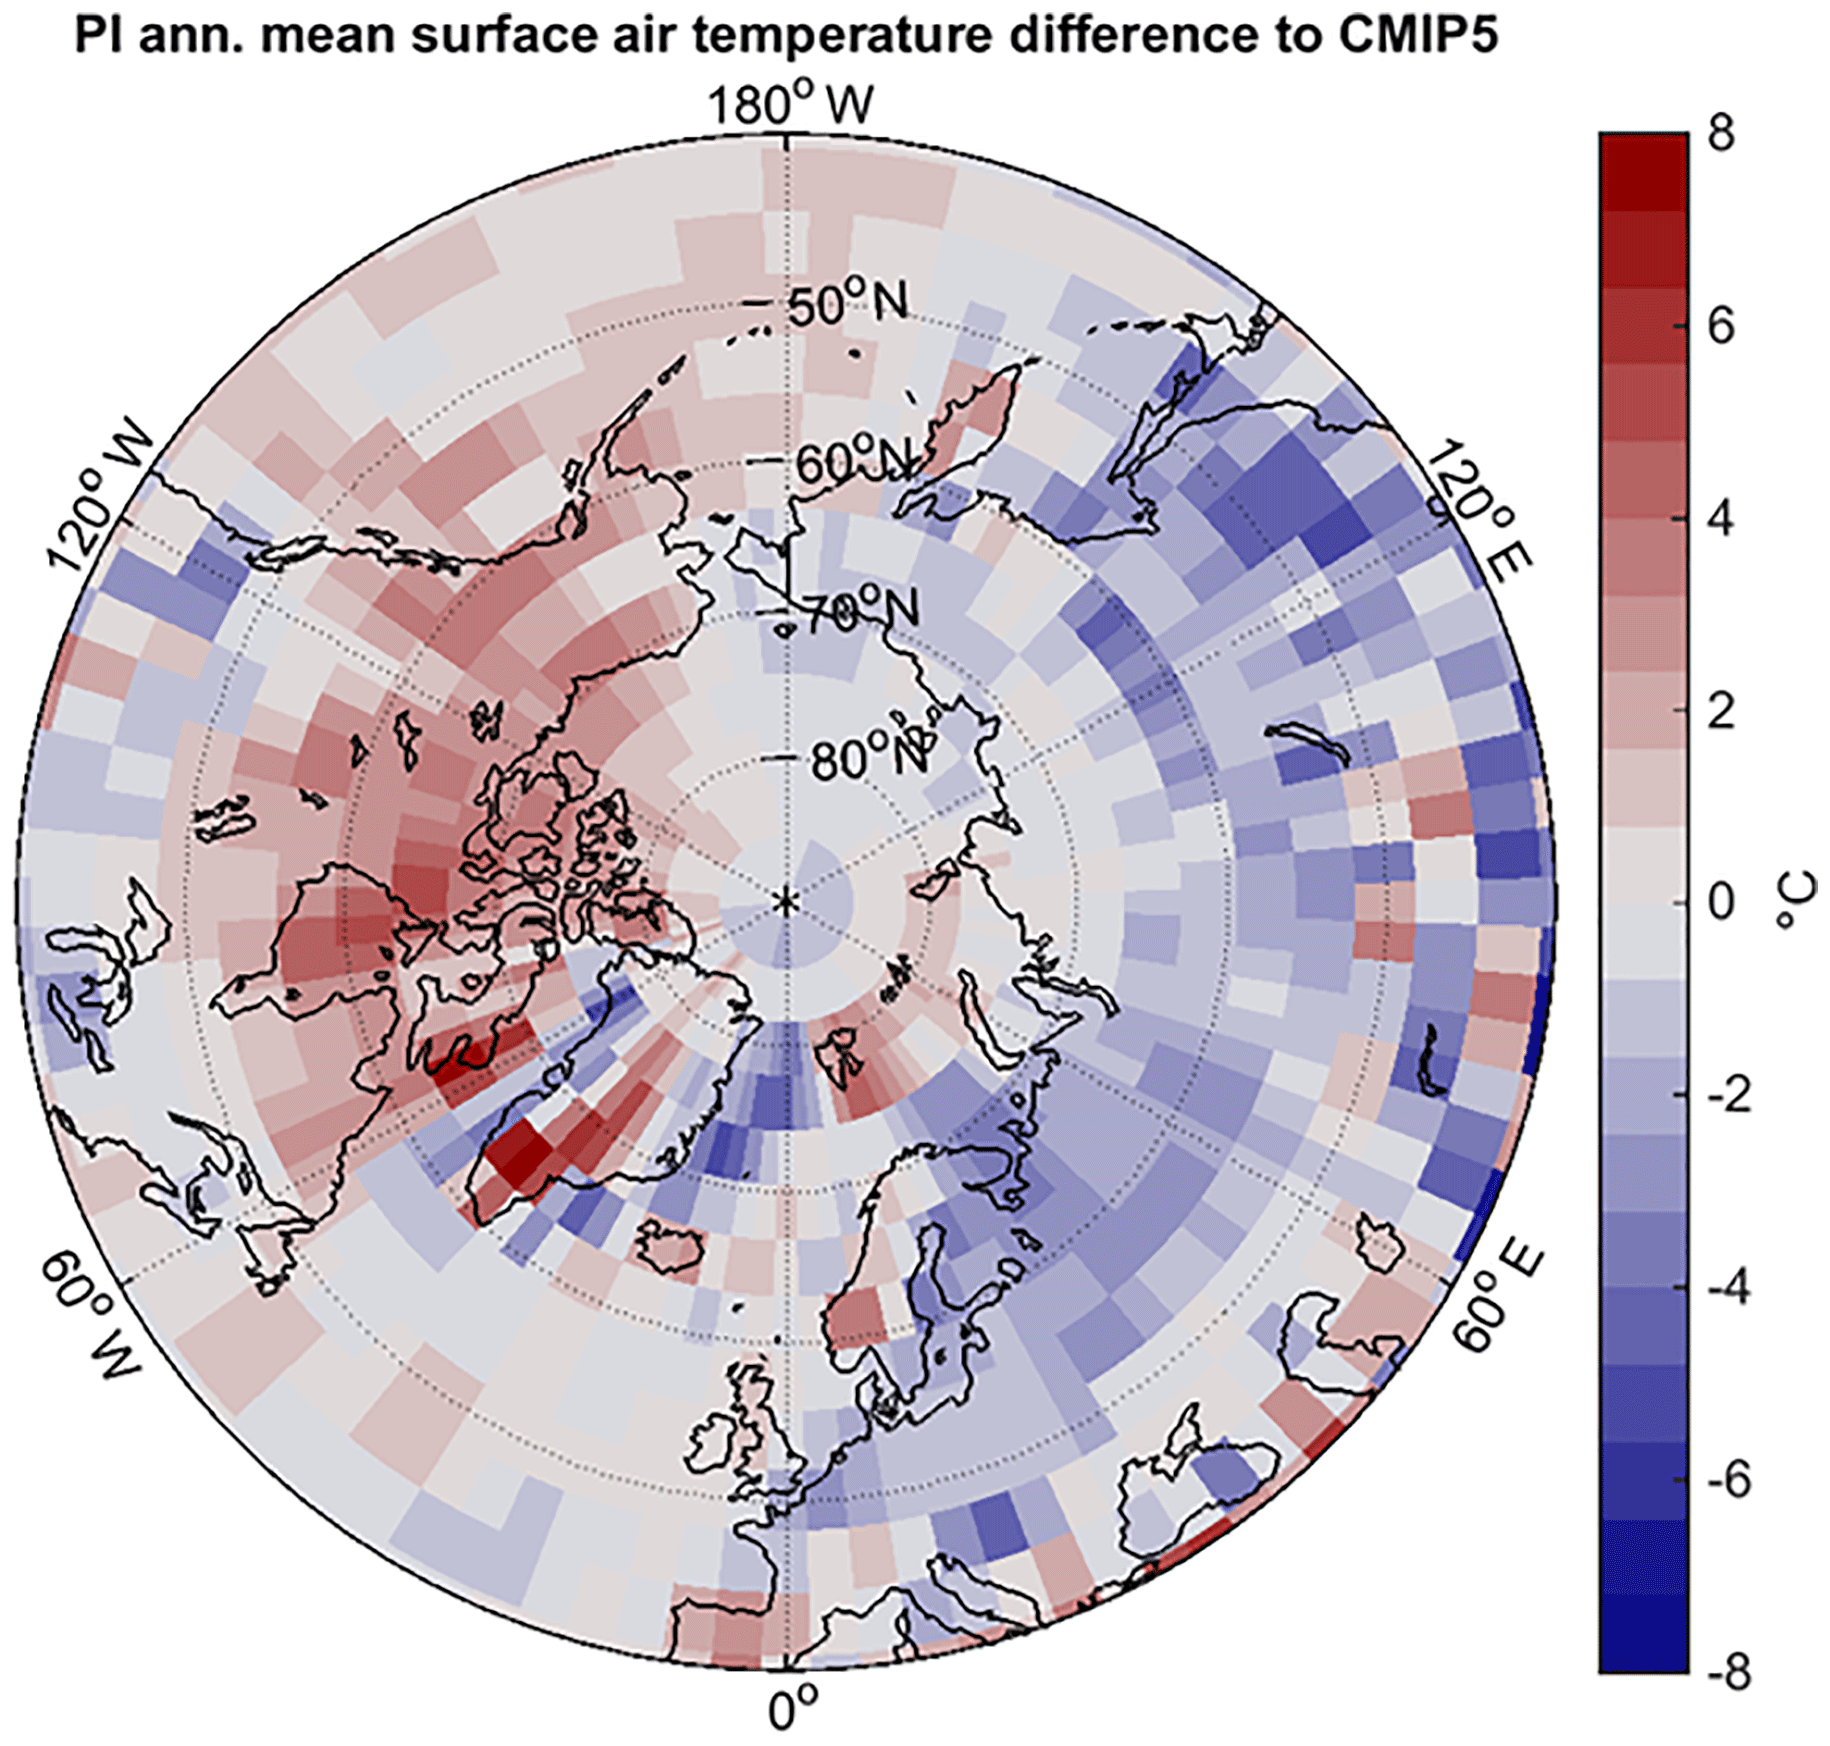
Figure A2Difference in simulated annual mean surface air temperature by MPI-ESM1.2T31_PI compared to CMIP5 PI experiment.

Figure A3PI winter surface air temperatures (DJF), summer surface air temperature (JJA), and annual precipitation simulated by MPI-ESM1.2T31_PI.
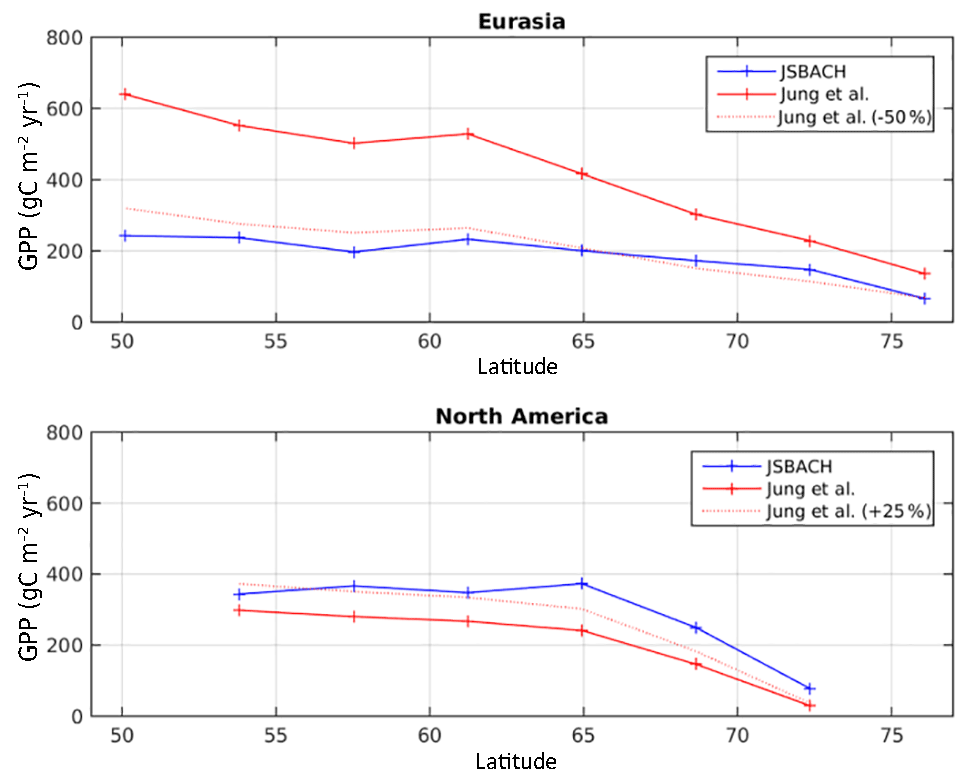
Figure A4Simulated and observed high-latitude GPP for Eurasia and North America. Model results are for pre-industrial conditions. Observations are from Jung et al. (2011) and scaled to 85 % to account for lower pre-industrial GPP (Ciais et al., 2013). Regional zonal averaging was only performed for grid cells containing near-surface permafrost.
In the version we are using here, the global mean temperature is 286.78 K, nearly identical to the global mean temperature of 286.66 K of the CMIP5 model in T63 resolution. However, the spatial distribution of temperature is modified, as shown in Fig. A2. Annual mean temperatures over northern North America are warmer than the CMIP5 reference, while temperatures over Eurasia are cooler. This spatial pattern is also affecting simulated pre-industrial vegetation productivity (Fig. A4) which shows higher GPP in North America and lower GPP in Eurasia compared to observational evidence based on up-scaled flux tower measurements (Jung et al., 2011).
As shown in Fig. A3, PI winter (DJF) temperatures reach −35 ∘C over Greenland and northern Siberia. Southern Siberia and North America are warmer, though temperatures warmer than −10 ∘C are limited to latitudes south of 50∘ N. Summer (JJA) conditions are substantially warmer, with temperatures below freezing only over Greenland, and most NH high-latitude areas having summer temperatures of the order of 10 ∘C. Annual precipitation, shown in Fig. A3 is less than 750 mm yr−1 over most of the high-latitude regions, and less than 500 mm yr−1 north of 65∘ N.
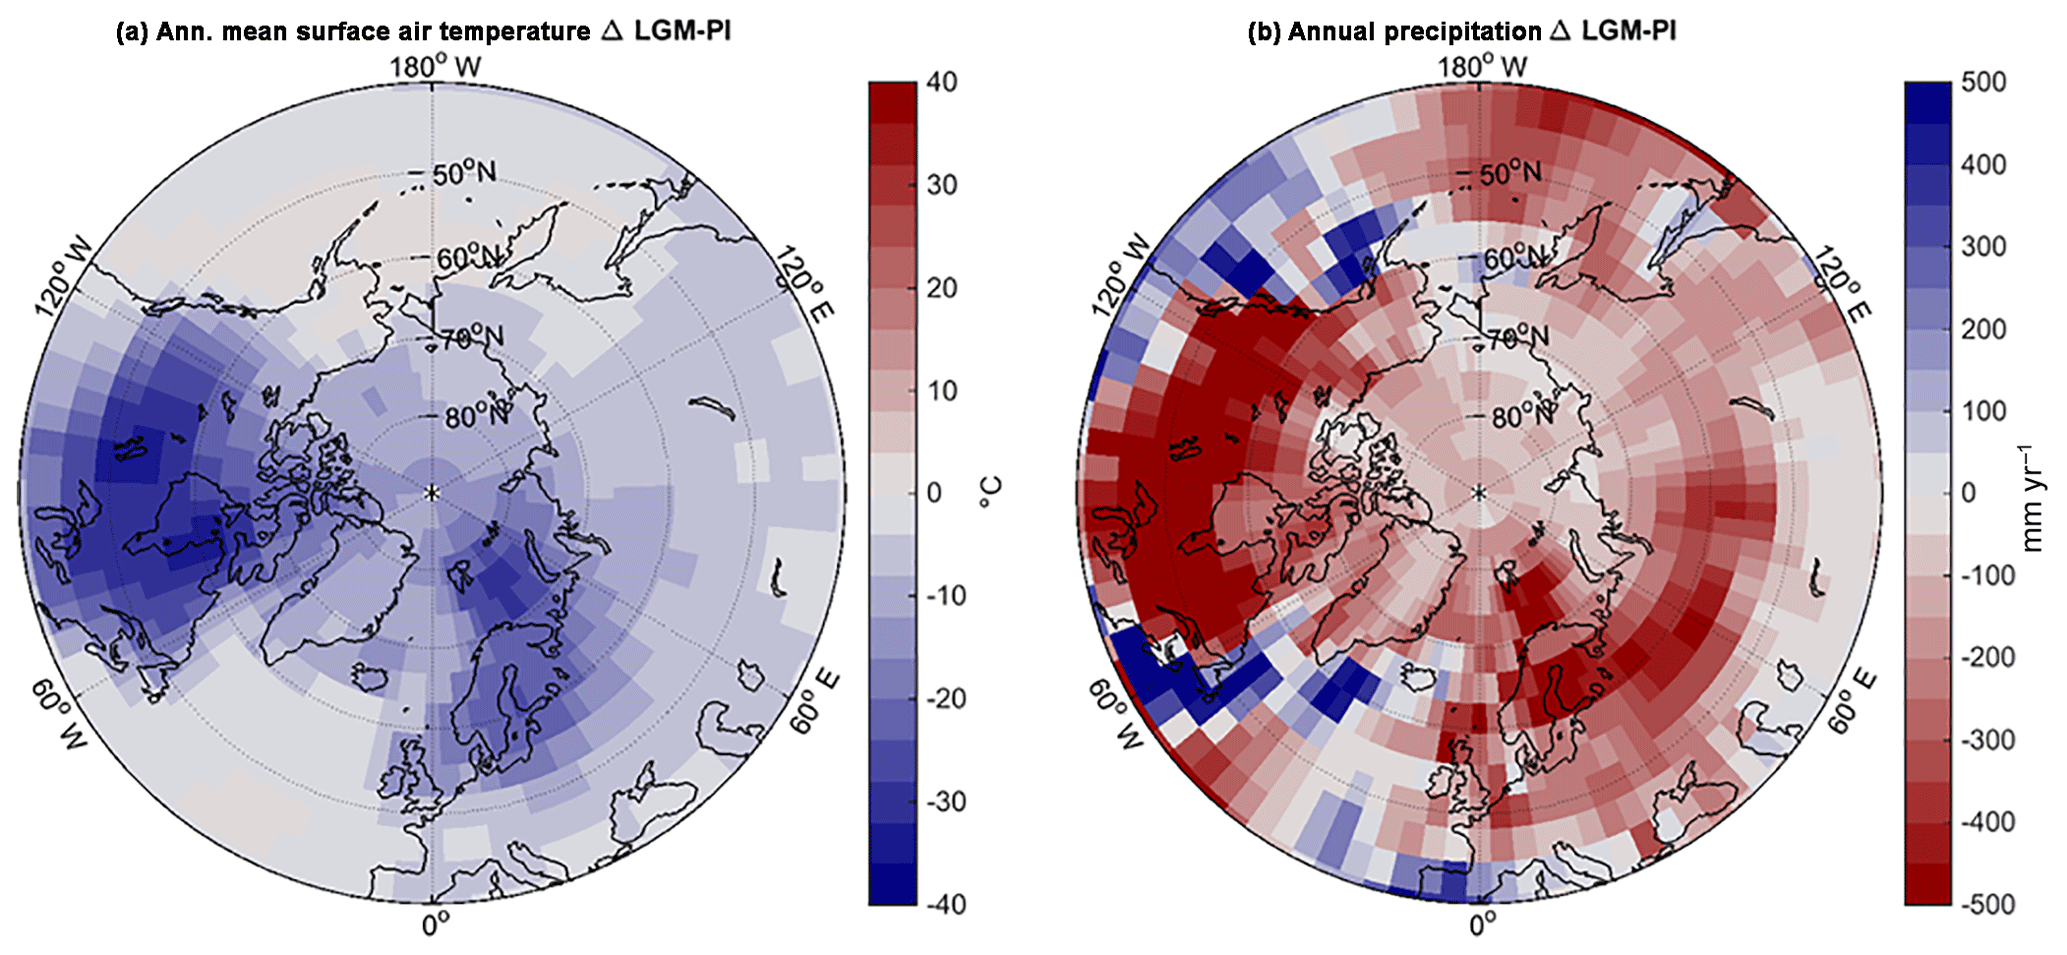
Figure A5Difference in (a) annual mean surface air temperatures and (b) annual mean precipitation between LGM and PI as simulated by MPI-ESM1.2T31.
A3 LGM climate
The LGM climate experiment is set up following the PMIP3 protocol (Braconnot et al., 2011), with LGM land-sea and ice sheet masks, as well as greenhouse gases and orbit modified to LGM conditions. The global mean surface air temperature is 282.94, 3.84 K colder than for PI (which is at the lower end of PMIP3 model results; Schmidt et al., 2014). The differences in annual mean temperatures, shown in Fig. A5, are largest over the Laurentide Ice Sheet, where cooling is up to 30 ∘C. In Siberia the cooling is about 8 ∘C in the annual mean.
Precipitation changes, shown in Fig. A5, show a general drying trend, with pronounced differences east of the Fennoscandian ice sheet where precipitation reduces by 200–400 mm yr−1.
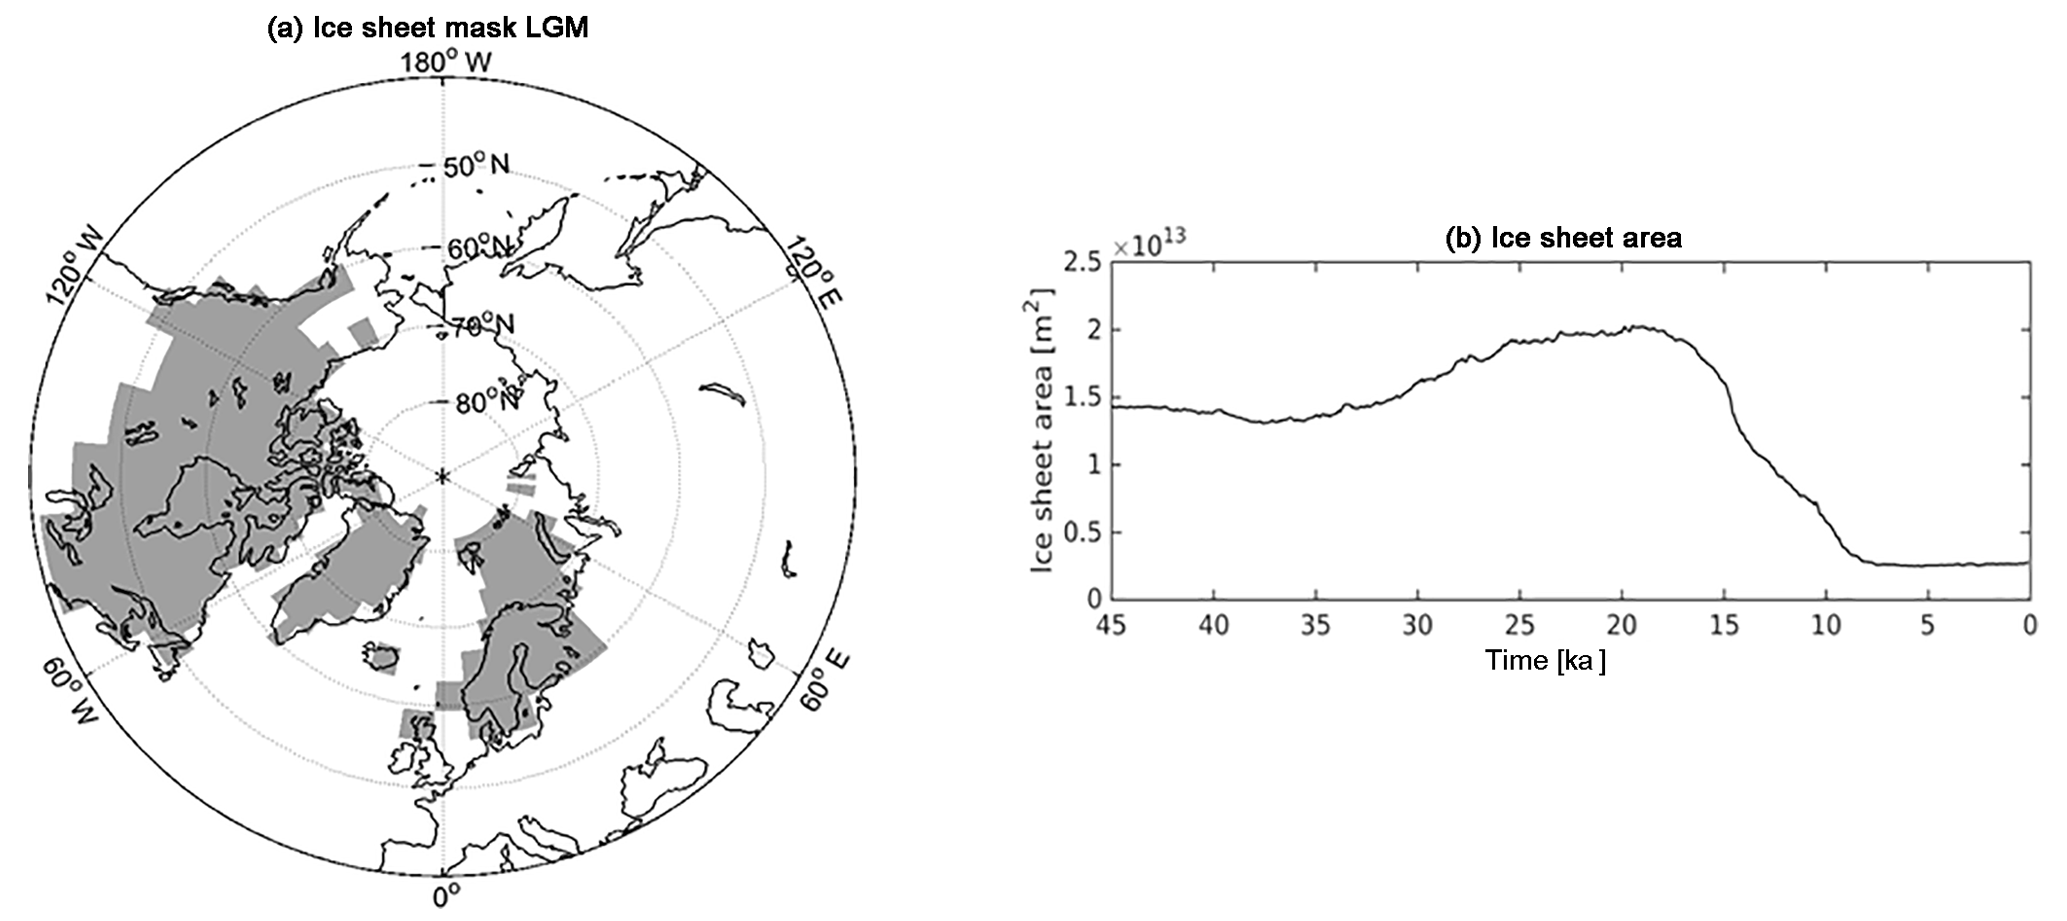
Figure A6(a) Ice sheet extent at LGM prescribed in MPI-ESM1.2T31_LGM, and (b) evolution of total NH ice sheet area from 45 ka to PI simulated by CLIMBER-2.
A4 Boundary conditions
A4.1 Ice sheet extent
Ice sheet extent is prescribed from a transient glacial cycle experiment performed with CLIMBER2 and the ice sheet model SICOPOLIS (Ganopolski et al., 2010). As SICOPOLIS ice sheet extent for LGM is slightly larger than the ice sheet extent used in the MPI-ESM LGM experiment, we limit ice sheet extent to the MPI-ESM LGM ice sheet mask, shown in Fig. A6.
The transient total ice sheet area, shown in Fig. A6, is maximal at 20 ka (20.3 × 10⁶ km2), while the PI size is 2.76 × 10⁶ km2. As the JSBACH ice sheet and land-sea masks cannot be varied during run time, we keep these fixed at PI extent. However, the effect of ice sheets on vegetation and soil carbon is represented by removing precipitation in ice sheet locations, thereby preventing the development of vegetation and soil carbon accumulation.
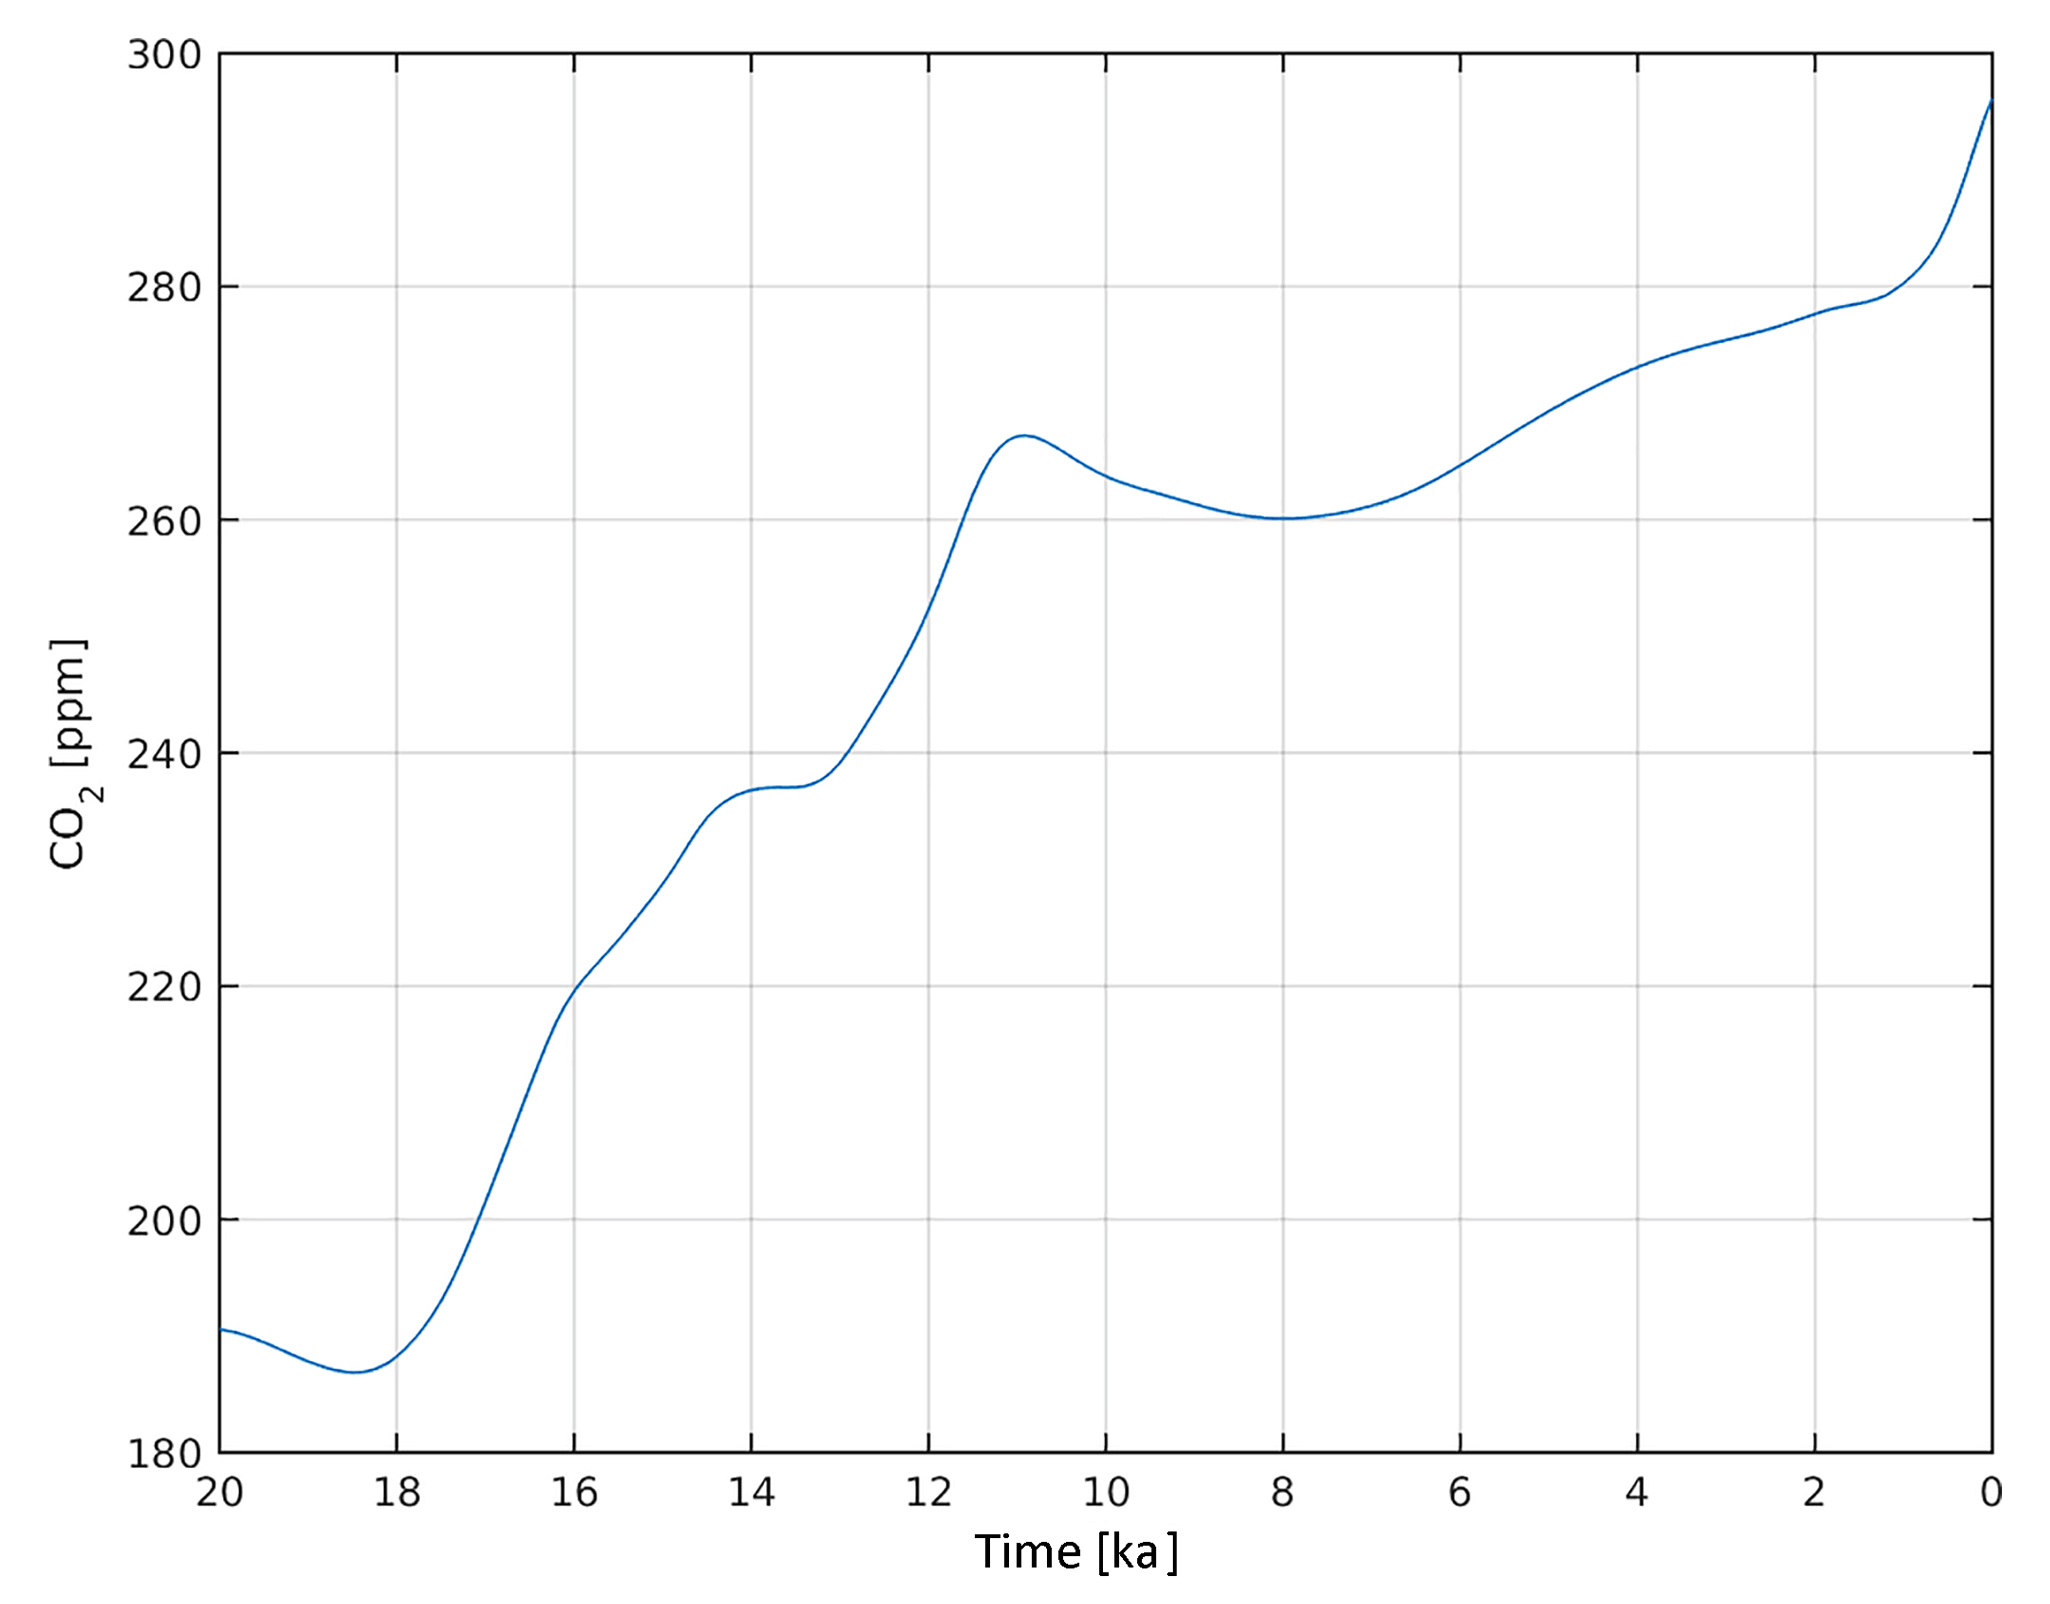
Figure A7Atmospheric CO2 equivalent concentration from 20 ka to PI prescribed in JSBACH. Data were obtained from a CLIMBER-2 glacial-cycle simulation (Ganopolski et al., 2010).
CO2 concentrations
Atmospheric CO2 contents are prescribed following CLIMBER-2 glacial cycle experiments (Ganopolski et al., 2010) and are shown in Fig. A7.
A4.3 Soil depths
We prescribed stationary soil depths in JSBACH based on a global soil map compiled by Carvalhais et al. (2014).
Bluish grid cells (Fig. A8) indicate regions in which LGM permafrost SOC accumulation in the upper 3 m is constrained by soil depth. Using Eq. (2), we estimated the consequence of neglecting the limitation in SOC build-up through soil depth. Assuming a lower boundary of 3 m for all near-surface permafrost grid cells, our simulated LGM permafrost carbon pool would be 33 % (or 26 PgC) larger. By using constant soil depths, we implicitly assume that soil accumulation and erosion rates in non-ice-covered grid cells were in equilibrium over the model simulation time horizon. For ice-covered grid cells we assume a full removal of soil through the ice movement.
Depth to bedrock is also a poorly constrained variable for concurrent soil C stock estimates. Jackson et al. (2017) showed that applying different products of soil depth led to differences in global soil C stocks of up to 800 PgC in the upper 3 m, with most of the differences occurring in high-latitude soils. Future model developments should analyse whether alternative soil depth data products (e.g. Pelletier et al., 2016 or Hengl et al., 2017) might better capture soil depths in permafrost regions, possibly supporting less shallow soils and therefore larger LGM SOC storage. During the transient deglacial warming phase, permafrost SOC build-up is prevented in our model when the simulated ALD falls below soil depth, which is the case for 17 % of permafrost grid cells under PI climate conditions. These grid cells accumulate 41 PgC in the active layer, but they do not allow for additional SOC accumulation in permafrost.
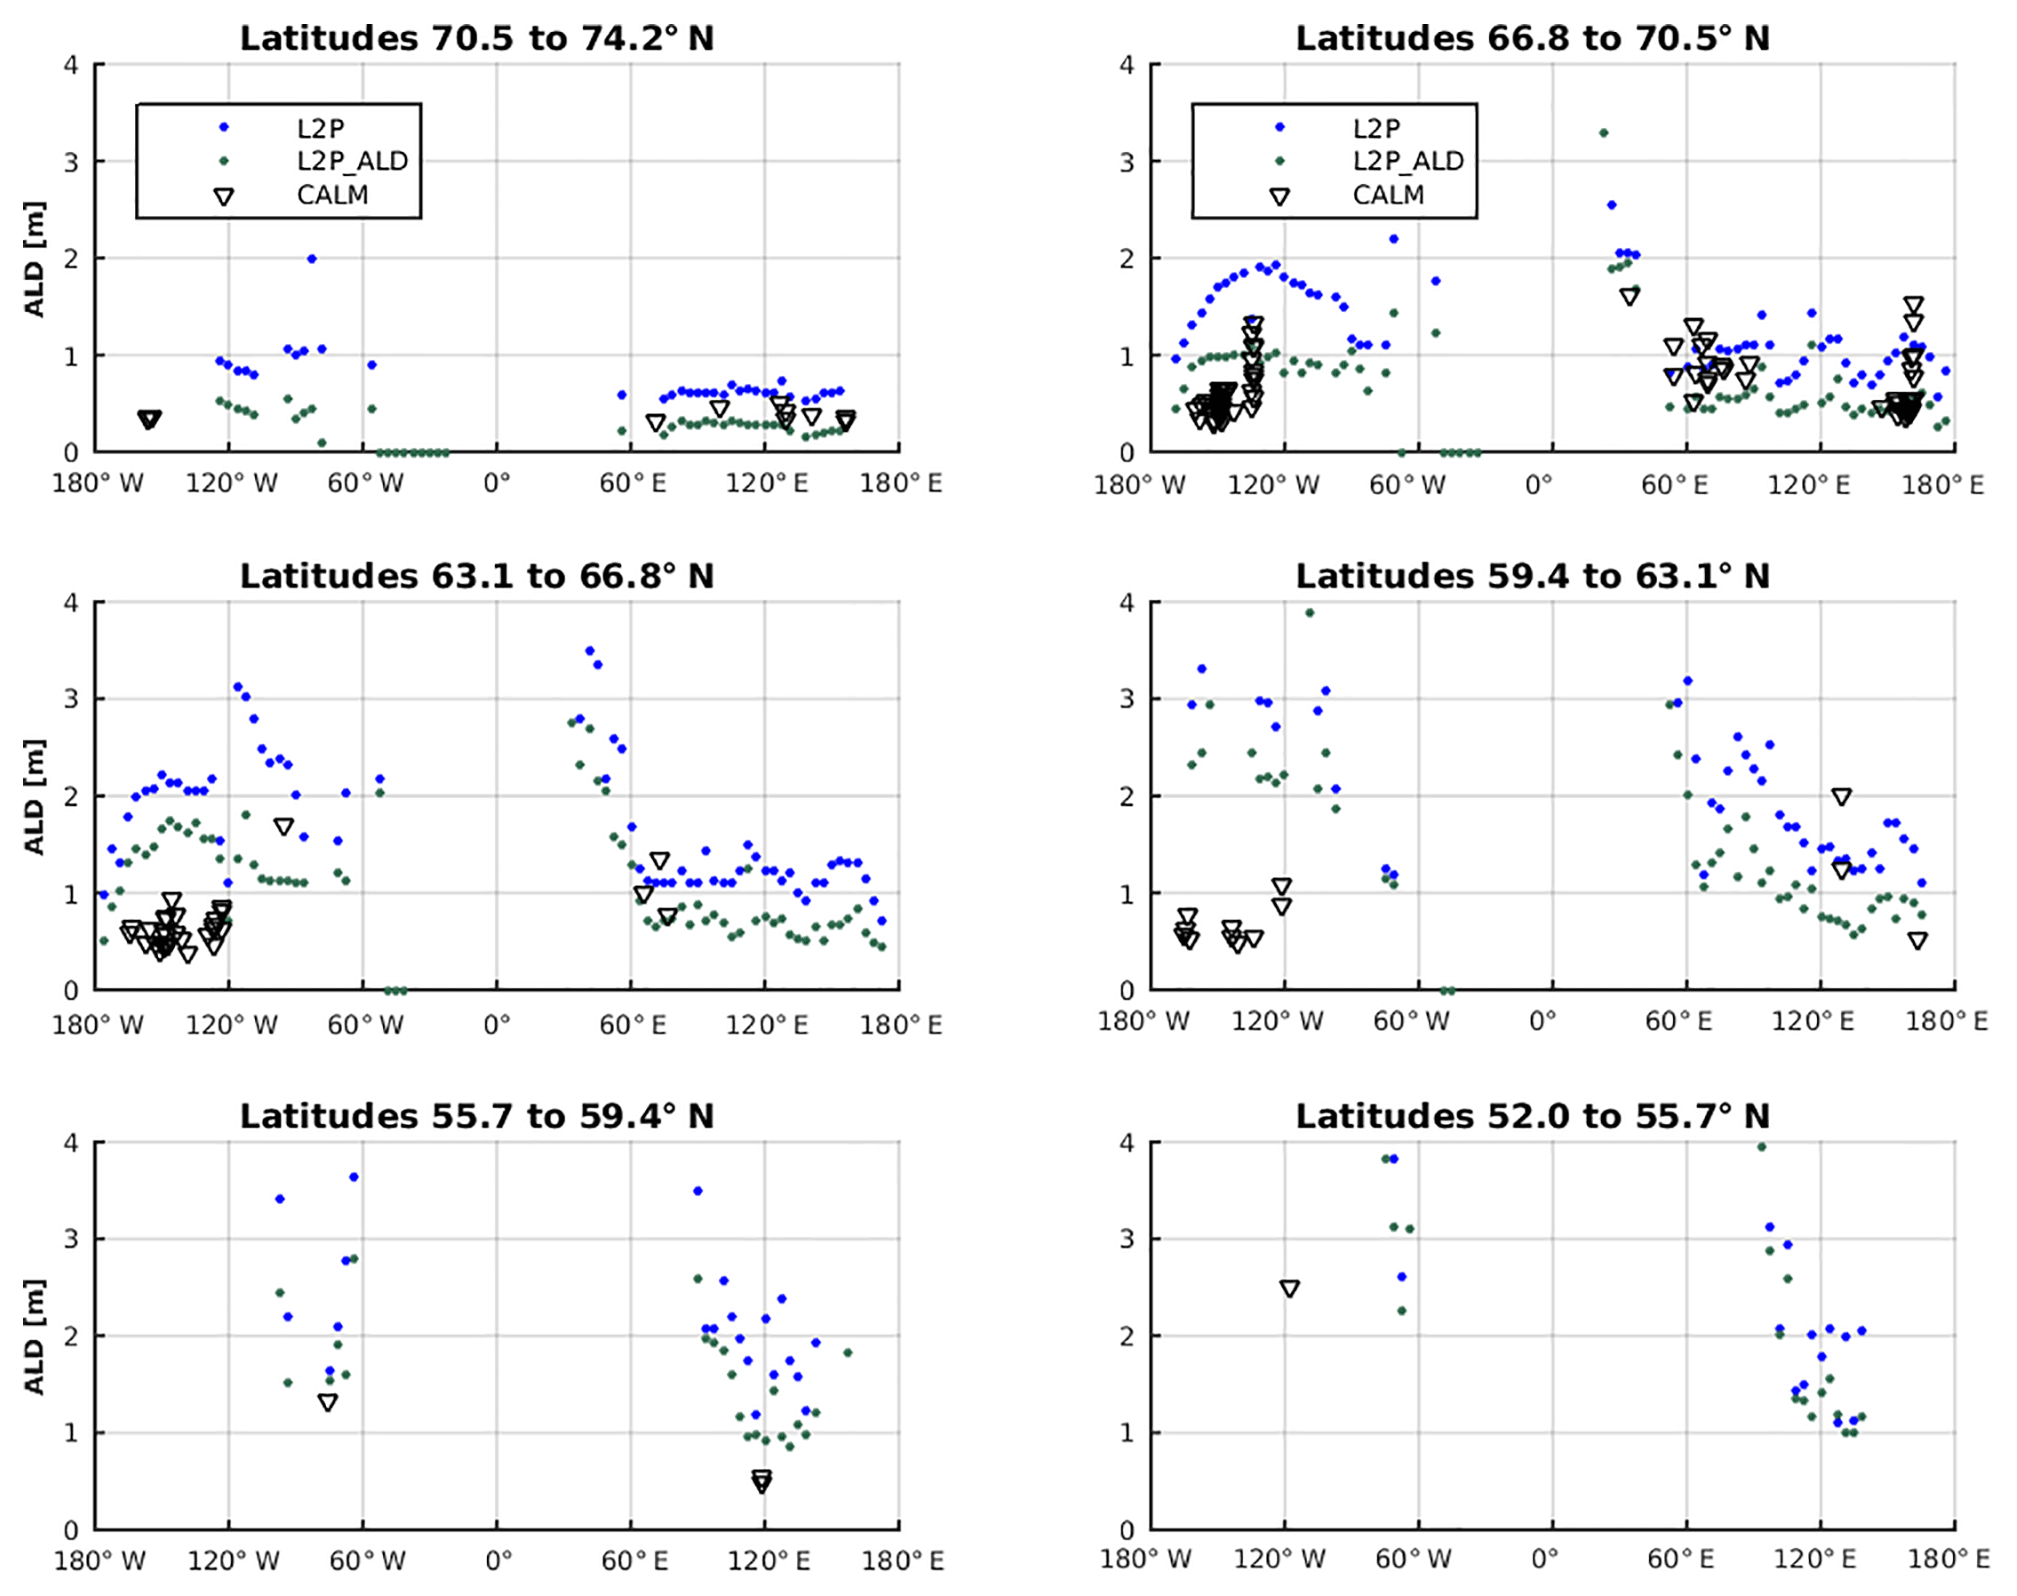
Figure A9Latitudinal dependency of active layer depths (ALDs) inferred from JSBACH simulations (dots) and CALM observations (triangles). Blue dots represent the standard model experiment (L2P) and green dots the sensitivity run with increased thermal insulation of the organic surface layer (L2P_ALD).

Figure A10Deglacial evolution of seasonally thawed (a) and perennially frozen SOC (d) in near-surface permafrost from LGM to PI. Panels (b) and (e) show deglacial evolution of NPP summed over near-surface permafrost grid cells, and permafrost extent. Panels (c) and (f) illustrate mean annual surface air temperature and ALD, which both were weighted over permafrost grid cells. Contributions from North America (light blue) and Eurasia (dark blue) are shown separately.
A5 Comparison of simulated ALDs with CALM observations
To compare simulated active layer depths with data, we focused on CALM observations (Brown et al., 2000). Figure A9 shows this comparison for different latitudinal bands from north to south.
A6 Driving factors of deglacial SOC dynamics
A6.1 Accounting for vertical SOC profiles in JSBACH
Permafrost soils reveal typical profiles of depth-declining soil organic carbon concentrations (SOCC) in the active layer (Harden et al., 2012). To capture this key characteristic, which strongly affects the amount of carbon transferred between seasonally thawed and perennially frozen carbon pools, we have developed a process-based model which allows for the calculation of vertical SOCC profiles dependent on factors such as ALDs, lability of the organic matter, and vertical soil mixing rates. In this section we describe the physics of this model and its implementation into JSBACH.
A6.2 Modelling soil carbon profiles with a process-based model of SOM transport
Soil carbon build-up is modelled by assuming that the carbon flux balance in each soil layer is determined by litter input, by a transport of carbon through diffusion and advection within the soil column, and by loss of carbon through heterotrophic respiration within the active layer (Braakhekke et al., 2014):
SOCCi(z,t) describes the soil carbon concentration (in kgC m−3) for each soil carbon pool i (, based on YASSO soil carbon separation). Litter input (in kgC m−2) is assumed representative for grassland (being the dominant vegetation cover in permafrost regions) and is subdivided by equal shares into aboveground and belowground fluxes. While aboveground flux enters the uppermost soil layer only, belowground litter flux is restricted to the active layer and is described by a depth profile according to Jackson et al. (1996):
with γ=0.943 chosen to represent the depth distribution of temperate grassland (z in cm). A rescaling assures carbon closure, especially for active layers less deep than theoretical root depths. D describes a diffusivity parameter and mimics the strength of cryoturbation. As we focus in our study on mineral, cryoturbated soils, we do not separately describe soil carbon profiles inferred without vertical mixing, but we investigate the sensitivity of modifying the diffusivity parameter on our results (see Sect. 4.3). We choose a default setting for D of 10 cm2 yr−1 (Koven et al., 2009). As radiocarbon data provide only a weak constraint on cryoturbation strength, we acknowledge that this parameter is subject to large uncertainty and investigate the robustness of our results for a doubled cryoturbation rate setting (see Sect. 4.3). At depth levels below the active layer, the diffusivity parameter is set to zero. Under a stationary climate, only advection through sedimentation can transport SOM into the permafrost body. Based on SOC-age profiles from a loess–paleosol sequence in north-east Siberia (Zech et al., 2011), we choose a standard sedimentation rate α of 10 cm kyr−1. Decomposition of SOM is calculated according to YASSO (i.e. separating SOM into four classes of differing litter lability and a slowly decomposing and more stable component). Pool specific decomposition rates βi (z,t) (in yr−1) are described dependent on temperature T(z,t) at each soil level (in degrees Celsius):
with reference decomposition rates at 0 ∘C for each lability class according to YASSO standard parameters (p1=0.095 ∘C−1 and ∘C−2). For sub-zero temperatures decomposition is set to zero. Within the range of typical magnitudes in variations in soil temperatures and of soil moisture inferred from permafrost grid cells (without describing saturated soil conditions), we consider the impact of soil moisture on SOCC build-up being of secondary importance and describe SOC build-up depending on soil-temperature only. This assumption is in line with Bauer et al. (2008) and Exbrayat et al. (2013) who inferred a dominant control of simulated heterotrophic respiration exerted by soil temperature, while soil moisture effects revealed less important.
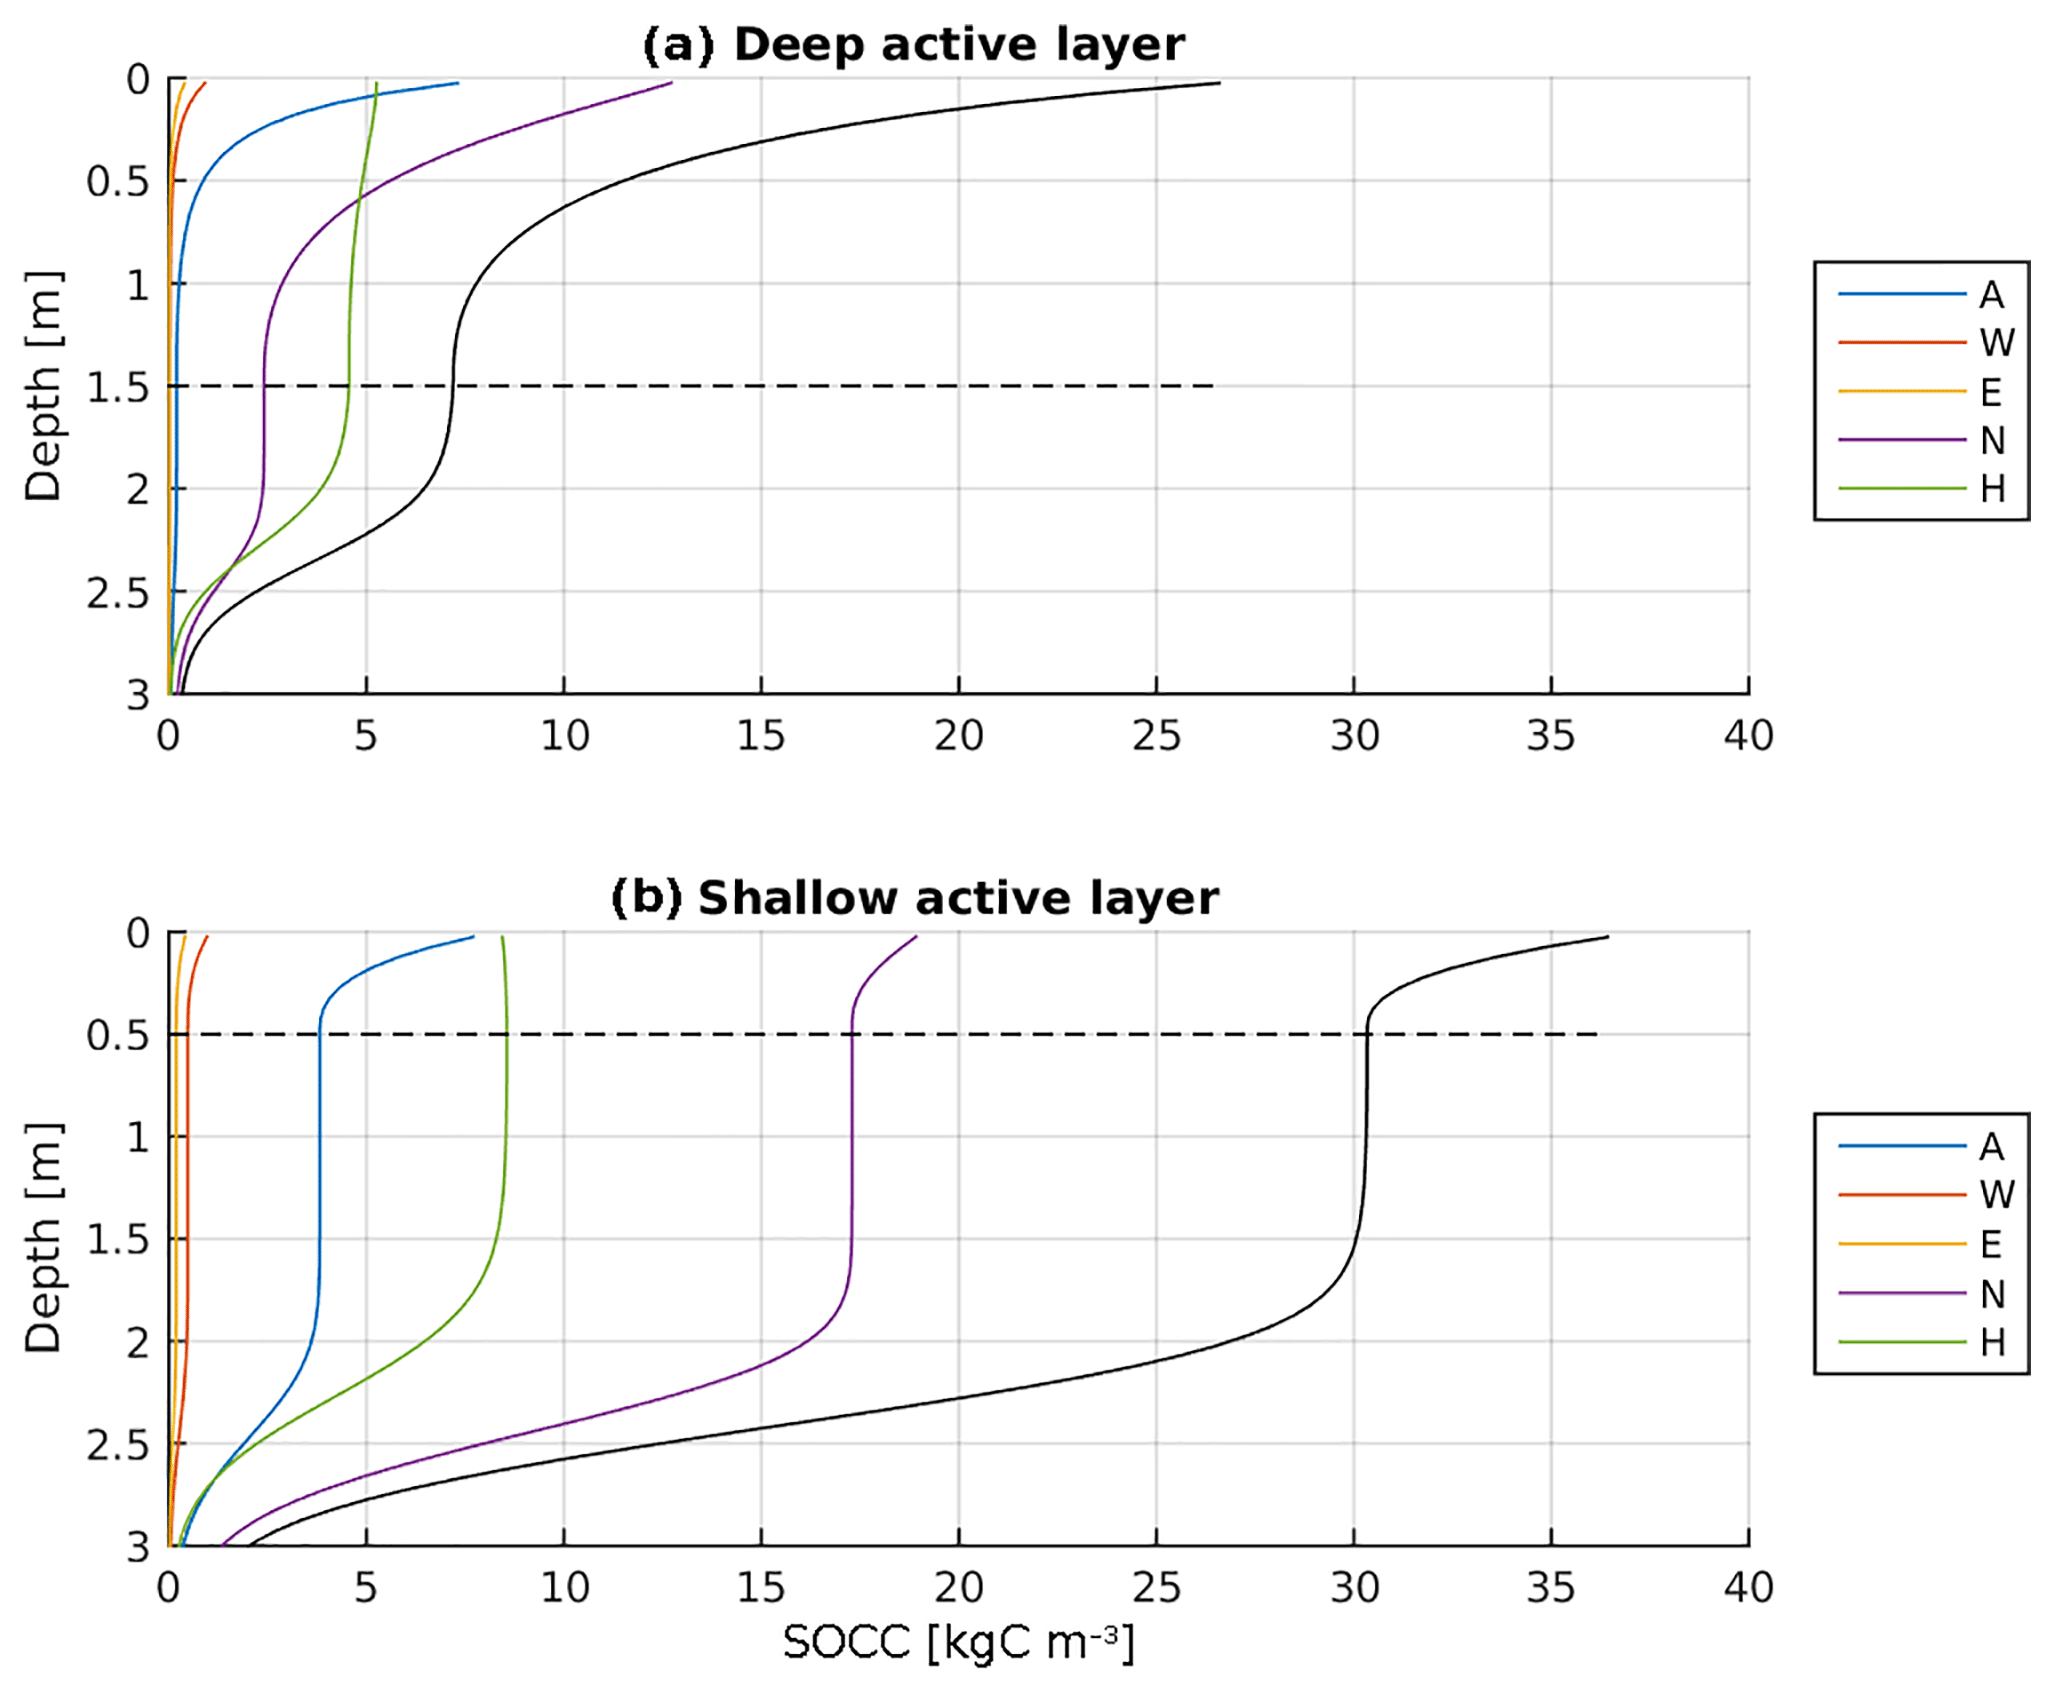
Figure A11Simulated SOCC profiles inferred from the process-based model of vertical SOM dynamics. The coloured curves represent different SOM lability classes according to YASSO, separated into fast (A, W, E), intermediate (N), and slowly decomposing (H) compounds. The black line shows aggregated total SOC. The horizontal dashed lines indicate ALD, and determine . Simulations were run for 20 kyr using a cryoturbation rate of 10 cm2 yr−1, a sedimentation rate of 10 cm kyr−1, decomposition timescale parameters set to YASSO standard values, and using a litter input of 100 gC yr−1 m−2 (a) and 200 gC yr−1 m−2, respectively (b).
To determine SOCCALD values for a broad range of ALDs, the model is driven by a range of annual temperature cycles of differing mean annual ground temperatures (MAGT) to generate ALDs from 10 cm to 3 m. Soil carbon decomposition rates are calculated in each soil layer dependent on simulated soil temperatures, and litter input is linearly scaled by MAGT (by covering typical litter inputs from JSBACH in permafrost grid cells). The scaling assumes 100 gC yr−1 m−2 at a MAGT of −16 ∘C, and 200 gC yr−1 m−2 at a MAGT of −10 ∘C, covering the active layer range between 50 and 150 cm shown in Fig. A11. SOCC is finally calculated by solving Eq. (A1) at each vertical grid level for each time step.
Once transported into permafrost layers, SOC is protected from microbial decomposition and establishes a depth-constant SOCC profile. The decline of SOCC in soil layers below about 2 m is an expression of our chosen simulation time of 20 kyr in combination with the slow sedimentation rate of 10 cm kyr−1.
With increasing SOM lability, the SOC profiles get more pronounced with highest concentrations in the upper layers and lowest concentrations in the lower part of the soil (Fig. A11). With increasing thickness of the active layer, less SOC gets incorporated into permafrost. This decrease is a consequence of a longer transport distance to the permafrost table, and therefore more time for conditions favourable to decomposition.
The implemented transport scheme does not fully capture vertical SOC distributions as inferred from observations (e.g. an increase with depth in SOC in the uppermost Turbel soil profile; Harden et al., 2012). But the scheme allows for capturing the general tendency of decreasing SOC contents with depth, especially the lower SOCC at the permafrost table as compared to mean SOCC in the active layer (which determines the SOC transfer between permafrost and active layer carbon in our model, see next section).
The lability-dependent decline in SOCC leads to a stronger fractionation of SOM into slow- and fast-cycling SOC, resulting in a higher share of more labile SOC under cold climate conditions as compared to more moderate climate conditions; For example, the share of labile SOC getting incorporated into perennially frozen ground is negligible with the slow pool representing the largest contribution to permafrost SOC build-up (Fig. A11, upper panel), in contrast to much higher shares of labile components (Fig. A11, lower panel).
A6.3 Implementation of the process-based model of SOM transport into JSBACH
For calculating the transfer of SOC between perennially frozen and seasonally thawed pools in JSBACH, the SOC concentration (see Eq. 1) is required for each lability class per year and grid cell. If soil temperatures increase, the active layer is deepening (with the extent of this active layer deepening being simulated by JSBACH) and SOC is transferred from non-active to active carbon pools (Fig. 1). Here we assume that SOCC in the perennially frozen pools can be approximated as constant with depth (see Fig. A11). If soil temperatures are decreasing, the active layer shrinks and SOC is transferred from the active to the non-active pools.
Based on the process-based model, we determine, for each lability class, the ratio of SOCC at the permafrost table to mean SOCCi within the active layer for each grid cell and year (for a given ALD). The functional dependence of on ALD is inferred from equilibrium simulations with the process-based model and is shown in Fig. A12. By using linear approximations, we can determine for any modelled ALD in JSBACH.

Figure A12Dependency of vertical soil carbon concentration at the permafrost table on active layer depth (ALD) as simulated by the process-based SOM transport model. The ratio of equilibrium SOCC at the ALD to mean seasonally thawed SOCCi is shown for individual soil carbon lability pools. Values smaller than 1 are indicative of SOCC declining with depth. Dotted lines illustrate linear approximations used for implementation into JSBACH. Curves are inferred for default parameters of the process-based SOM transport model (cryoturbation rate: 10 cm2 yr−1, sedimentation rate: 10 cm kyr−1, litter input described by grassland).
Figure A12 illustrates the lability-dependent vertical decline in SOCC and shows that for active layer thicknesses larger than 2 m the SOC transfer into permafrost in the process-based model is strongly dominated by the slow pool (green lines).
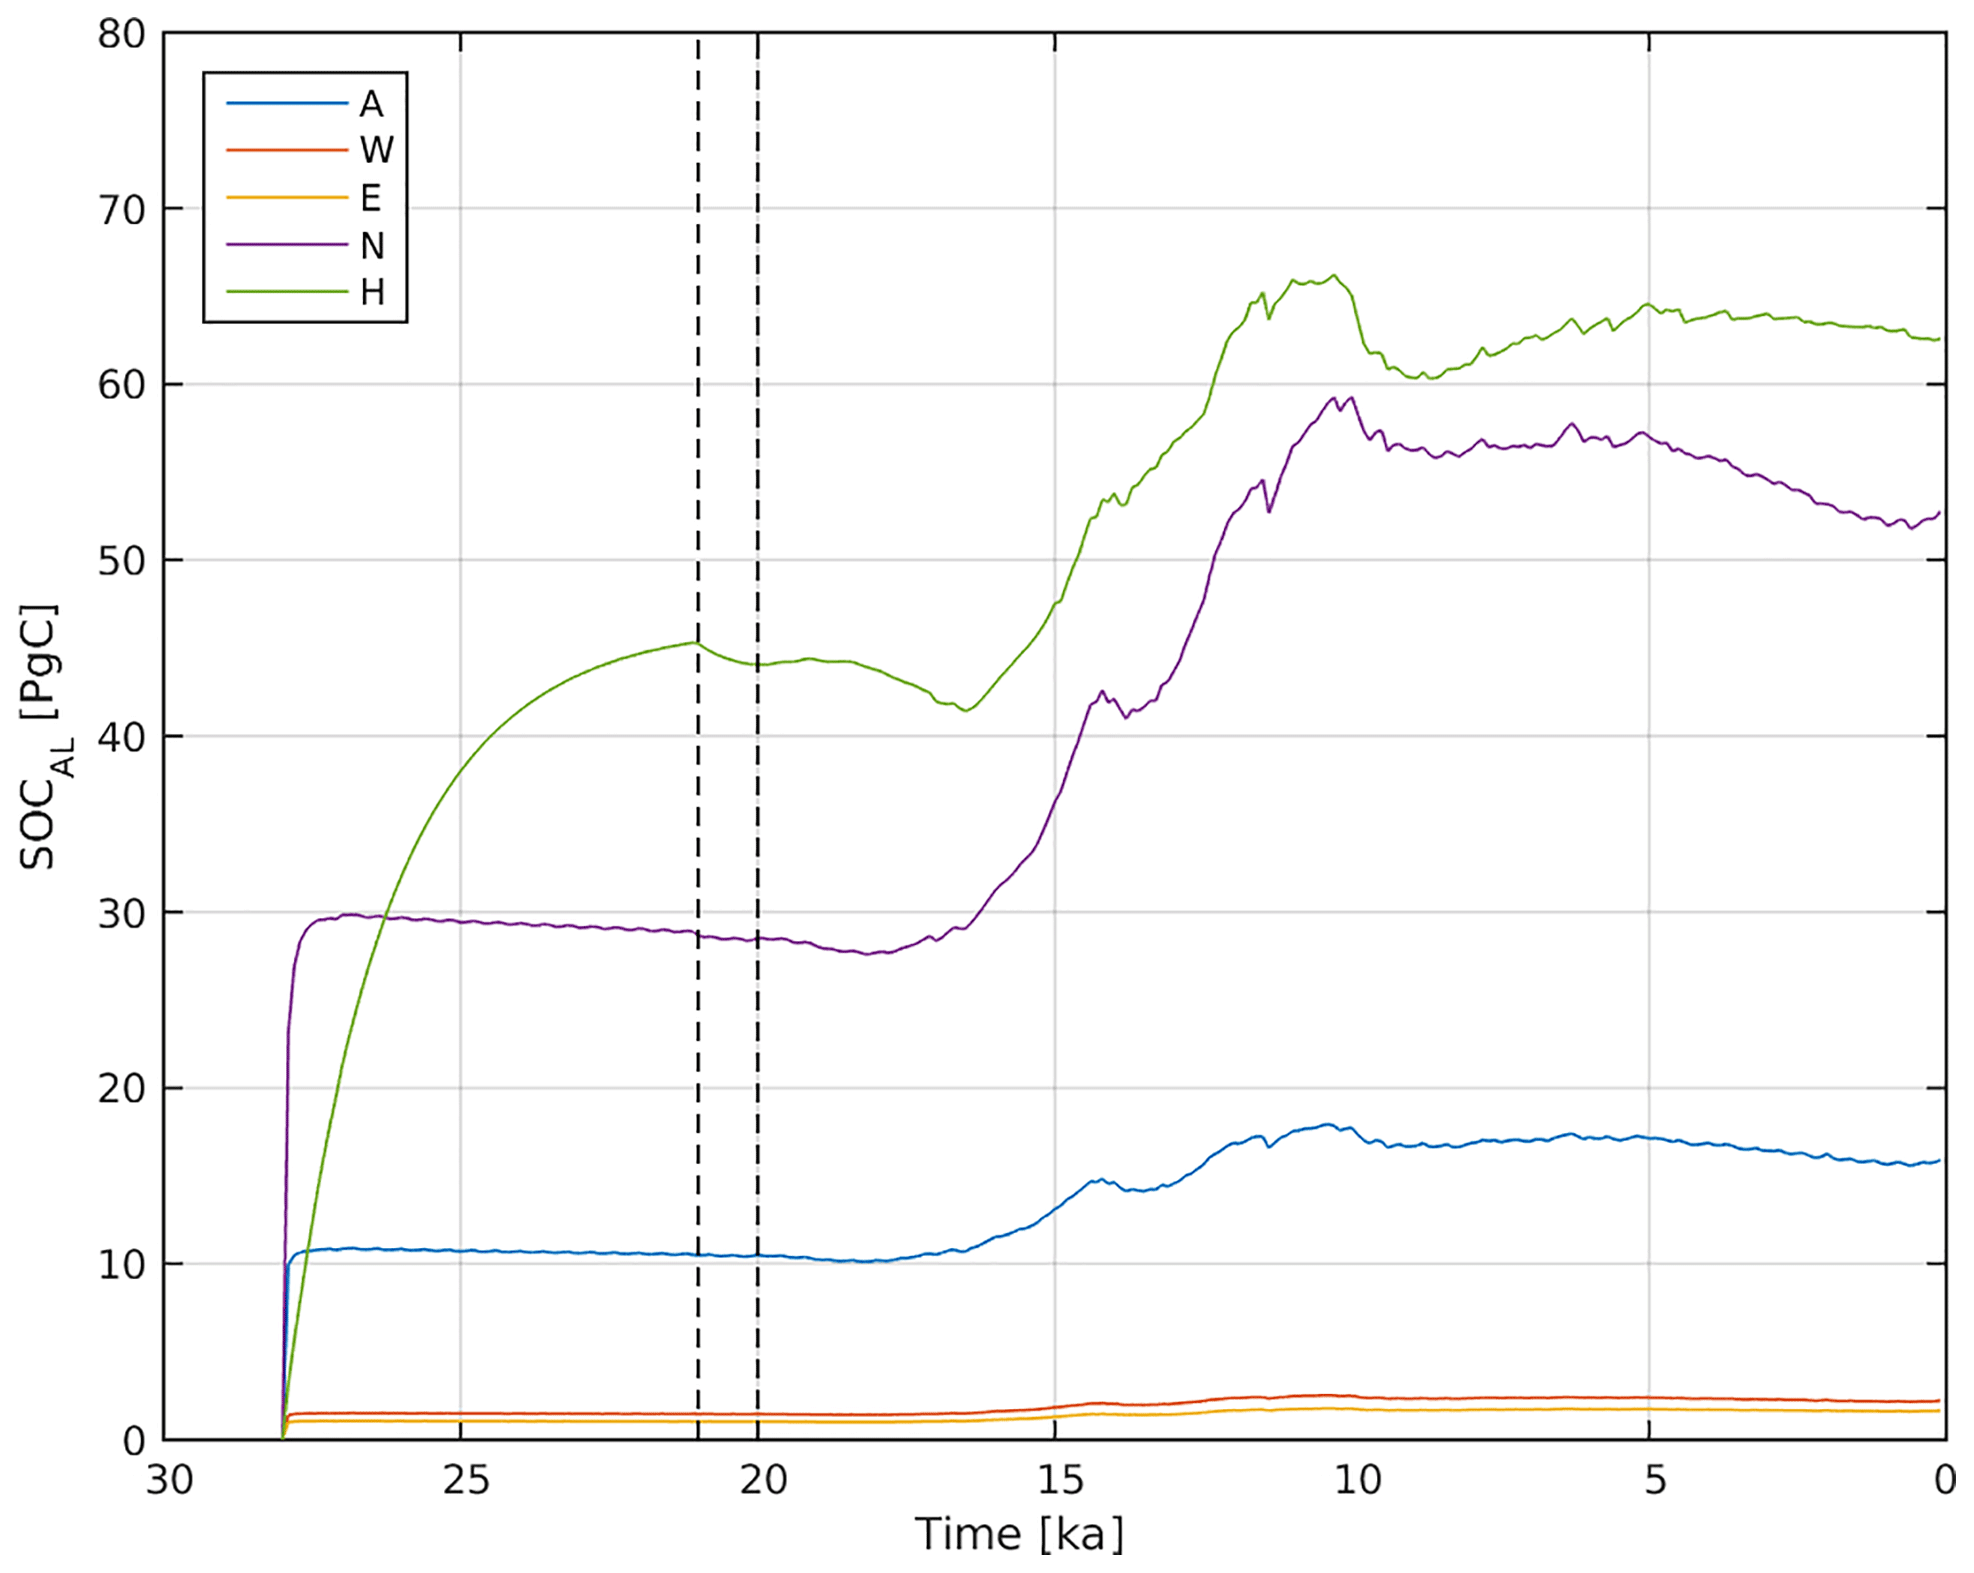
Figure A13Simulation set-up for deglacial model runs. Shown is the spin-up and fully transient phase of active layer SOC pools for all SOM lability classes (A, W, E, N, H) from the experiment initialization at 28 to 0 ka. The vertical dashed line at 21 ka illustrates the end of the SOC spin-up phase, the vertical dashed line at 20 ka illustrates the end of the stationary LGM climate forcing. Individual SOC contributions were summed over all permafrost grid cells.
TSvD developed the process-based SOM transport model; implemented the model into JSBACH; and designed, performed, and analysed the model simulations. TK generated deglacial climate forcing data, supported the model setup and development, and extensively discussed model simulation results. GH provided soil carbon data and helped in model designing. CK supported the discussion of carbon lability aspects, and CB contributed to the development of the physical permafrost scheme. VB supported the development of the study design, the model development, and the interpretation of model results. TSvD wrote the manuscript, with contributions from all authors. All authors contributed to the interpretation of simulation results presented in this study.
The authors declare that they have no conflict of interest.
Thomas Schneider von Deimling acknowledges support from BMBF projects
CARBOPERM (grant 03G0836C), KOPF (grant 03F0764C), and PERMARISK (grant
01LN1709A). Gustaf Hugelius acknowledges the EU-JPI COUP consortium and a
Marie Curie Skłodowska and Swedish Research Council International Career
Grant (INCA; no. 330-2014-6417). We thank Nuno Carvalhais for providing a
compilation of soil depth data and Andrey Ganopolski for the provision of
glacial–interglaical simulation data which we used to generate forcing
anomalies. Philipp de Vrese has reviewed the manuscript and contributed
helpful feedback for improving the paper. Many thanks also to Veronika
Gayler, Rainer Schnuur, and Thomas Raddatz for discussing JSBACH model
aspects.
The article processing charges for
this open-access
publication were covered by the Max Planck
Society.
Edited by: Ran Feng
Reviewed by: two anonymous referees
Archer, D., Winguth, A., Lea, D., and Mahowald, N.: What caused the glacial/interglacial atmospheric pCO2 cycles?, Rev. Geophys., 38, 159–189, https://doi.org/10.1029/1999RG000066, 2000.
Bauer, J., Herbst, M., Huisman, J. A., Weihermüller, L., and Vereecken, H.: Sensitivity of simulated soil heterotrophic respiration to temperature and moisture reduction functions, Geoderma, 145, 17–27, https://doi.org/10.1016/j.geoderma.2008.01.026, 2008.
Beer, C., Reichstein, M., Tomelleri, E., Ciais, P., Jung, M., Carvalhais, N., Rödenbeck, C., Arain, M. A., Baldocchi, D., Bonan, G. B., Bondeau, A., Cescatti, A., Lasslop, G., Lindroth, A., Lomas, M., Luyssaert, S., Margolis, H., Oleson, K. W., Roupsard, O., Veenendaal, E., Viovy, N., Williams, C., Woodward, F. I., and Papale, D.: Terrestrial Gross Carbon Dioxide Uptake: Global Distribution and Covariation with Climate, Science, 329, 834–838, https://doi.org/10.1126/science.1184984, 2010.
Beer, C.: Permafrost Sub-grid Heterogeneity of Soil Properties Key for 3-D Soil Processes and Future Climate Projections, Front. Earth Sci., 4, 81, https://doi.org/10.3389/feart.2016.00081, 2016.
Braakhekke, M., Beer, C., Schrumpf, M., Ekici, A., Ahrens, B., Hoosbeek Marcel, R., Kruijt, B., Kabat, P., and Reichstein, M.: The use of radiocarbon to constrain current and future soil organic matter turnover and transport in a temperate forest, J. Geophys. Res.-Biogeo., 119, 372–391, https://doi.org/10.1002/2013JG002420, 2014.
Braconnot, P., Harrison, S. P., Otto-Bliesner, B., Abe-Ouchi, A., Jungclaus, J., and Peterschmitt, J. Y.: The Paleoclimate Modeling Intercomparison Project contribution to CMIP5, CLIVAR Exchanges, 56, 15–19, 2011.
Braconnot, P., Harrison, S. P., Kageyama, M., Bartlein, P. J., Masson-Delmotte, V., Abe-Ouchi, A., Otto-Bliesner, B., and Zhao, Y.: Evaluation of climate models using palaeoclimatic data, Nat. Clim. Change, 2, 417–424, 2012.
Brovkin, V., Ganopolski, A., Archer, D., and Munhoven, G.: Glacial CO2 cycle as a succession of key physical and biogeochemical processes, Clim. Past, 8, 251–264, https://doi.org/10.5194/cp-8-251-2012, 2012.
Brovkin, V., Boysen, L., Raddatz, T., Gayler, V., Loew, A., and Claussen, M.: Evaluation of vegetation cover and land-surface albedo in MPI-ESM CMIP5 simulations, J. Adv. Model. Earth Sy., 5, 48–57, https://doi.org/10.1029/2012MS000169, 2013.
Brown, J., Hinkel, K. M., and Nelson, F. E.: The circumpolar active layer monitoring (calm) program: Research designs and initial results, Polar Geography, 24, 166–258, https://doi.org/10.1080/10889370009377698, 2000.
Burke, E. J., Jones, C. D., and Koven, C. D.: Estimating the Permafrost-Carbon Climate Response in the CMIP5 Climate Models Using a Simplified Approach, J. Climate, 26, 4897–4909, https://doi.org/10.1175/JCLI-D-12-00550.1, 2012.
Carvalhais, N., Forkel, M., Khomik, M., Bellarby, J., Jung, M., Migliavacca, M., Mu, M., Saatchi, S., Santoro, M., Thurner, M., Weber, U., Ahrens, B., Beer, C., Cescatti, A., Randerson, J. T., and Reichstein, M.: Global covariation of carbon turnover times with climate in terrestrial ecosystems, Nature, 514, 213–217, https://doi.org/10.1038/nature13731, 2014.
Ciais, P., Tagliabue, A., Cuntz, M., Bopp, L., Scholze, M., Hoffmann, G., Lourantou, A., Harrison, S. P., Prentice, I. C., Kelley, D. I., Koven, C., and Piao, S. L.: Large inert carbon pool in the terrestrial biosphere during the Last Glacial Maximum, Nat. Geosci, 5, 74–79, 2012.
Ciais, P., Sabine, C., Bala, G., Bopp, L., Brovkin, V., Canadell, J., Chhabra, A., DeFries, R., Galloway, J., Heimann, M., Jones, C., Le Quéré, C., Myneni, R. B., Piao, S., and Thornton, P.: Carbon and Other Biogeochemical Cycles, in: Climate Change 2013: The Physical Science Basis. Contribution of Working Group I to the Fifth Assessment Report of the Intergovernmental Panel on Climate Change, edited by: Stocker, T. F., Qin, D., Plattner, G.-K., Tignor, M., Allen, S. K., Boschung, J., Nauels, A., Xia, Y., Bex, V., and Midgley, P. M., Cambridge University Press, Cambridge, 2013.
Crichton, K. A., Bouttes, N., Roche, D. M., Chappellaz, J., and Krinner, G.: Permafrost carbon as a missing link to explain CO2 changes during the last deglaciation, Nat. Geosci., 9, 683–686, https://doi.org/10.1038/ngeo2793, 2016.
Ekici, A., Beer, C., Hagemann, S., Boike, J., Langer, M., and Hauck, C.: Simulating high-latitude permafrost regions by the JSBACH terrestrial ecosystem model, Geosci. Model Dev., 7, 631–647, https://doi.org/10.5194/gmd-7-631-2014, 2014.
Exbrayat, J.-F., Pitman, A. J., Zhang, Q., Abramowitz, G., and Wang, Y.-P.: Examining soil carbon uncertainty in a global model: response of microbial decomposition to temperature, moisture and nutrient limitation, Biogeosciences, 10, 7095–7108, https://doi.org/10.5194/bg-10-7095-2013, 2013.
Ganopolski, A., Calov, R., and Claussen, M.: Simulation of the last glacial cycle with a coupled climate ice-sheet model of intermediate complexity, Clim. Past, 6, 229–244, https://doi.org/10.5194/cp-6-229-2010, 2010.
Giorgetta, M. A., Jungclaus, J., Reick Christian, H., Legutke, S., Bader, J., Böttinger, M., Brovkin, V., Crueger, T., Esch, M., Fieg, K., Glushak, K., Gayler, V., Haak, H., Hollweg, H. D., Ilyina, T., Kinne, S., Kornblueh, L., Matei, D., Mauritsen, T., Mikolajewicz, U., Mueller, W., Notz, D., Pithan, F., Raddatz, T., Rast, S., Redler, R., Roeckner, E., Schmidt, H., Schnur, R., Segschneider, J., Six Katharina, D., Stockhause, M., Timmreck, C., Wegner, J., Widmann, H., Wieners Karl, H., Claussen, M., Marotzke, J., and Stevens, B.: Climate and carbon cycle changes from 1850 to 2100 in MPI-ESM simulations for the Coupled Model Intercomparison Project phase 5, J. Adv. Model. Earth Sy., 5, 572–597, https://doi.org/10.1002/jame.20038, 2013.
Goll, D. S., Brovkin, V., Liski, J., Raddatz, T., Thum, T., and Todd-Brown, K. E. O.: Strong dependence of CO2 emissions from anthropogenic land cover change on initial land cover and soil carbon parametrization, Global Biogeochem. Cy., 29, 1511–1523, https://doi.org/10.1002/2014GB004988, 2015.
Hagemann, S. and Stacke, T.: Impact of the soil hydrology scheme on simulated soil moisture memory, Clim. Dynam., 44, 1731–1750, https://doi.org/10.1007/s00382-014-2221-6, 2015.
Harden, J. W., Koven, C. D., Ping, C.-L., Hugelius, G., David McGuire, A., Camill, P., Jorgenson, T., Kuhry, P., Michaelson, G. J., O'Donnell, J. A., Schuur, E. A. G., Tarnocai, C., Johnson, K., and Grosse, G.: Field information links permafrost carbon to physical vulnerabilities of thawing, Geophys. Res. Lett., 39, L15704, https://doi.org/10.1029/2012GL051958, 2012.
Hengl, T., Mendes de Jesus, J., Heuvelink, G. B. M., Ruiperez Gonzalez, M., Kilibarda, M., Blagotić, A., Shangguan, W., Wright, M. N., Geng, X., Bauer-Marschallinger, B., Guevara, M. A., Vargas, R., MacMillan, R. A., Batjes, N. H., Leenaars, J. G. B., Ribeiro, E., Wheeler, I., Mantel, S., and Kempen, B.: SoilGrids 250 m: Global gridded soil information based on machine learning, PLOS ONE, 12, e0169748, https://doi.org/10.1371/journal.pone.0169748, 2017.
Hugelius, G., Tarnocai, C., Broll, G., Canadell, J. G., Kuhry, P., and Swanson, D. K.: The Northern Circumpolar Soil Carbon Database: spatially distributed datasets of soil coverage and soil carbon storage in the northern permafrost regions, Earth Syst. Sci. Data, 5, 3–13, https://doi.org/10.5194/essd-5-3-2013, 2013.
Hugelius, G., Strauss, J., Zubrzycki, S., Harden, J. W., Schuur, E. A. G., Ping, C.-L., Schirrmeister, L., Grosse, G., Michaelson, G. J., Koven, C. D., O'Donnell, J. A., Elberling, B., Mishra, U., Camill, P., Yu, Z., Palmtag, J., and Kuhry, P.: Estimated stocks of circumpolar permafrost carbon with quantified uncertainty ranges and identified data gaps, Biogeosciences, 11, 6573–6593, https://doi.org/10.5194/bg-11-6573-2014, 2014.
Hurtt, G. C., Chini, L. P., Frolking, S., Betts, R. A., Feddema, J., Fischer, G., Fisk, J. P., Hibbard, K., Houghton, R. A., Janetos, A., Jones, C. D., Kindermann, G., Kinoshita, T., Klein Goldewijk, K., Riahi, K., Shevliakova, E., Smith, S., Stehfest, E., Thomson, A., Thornton, P., van Vuuren, D. P., and Wang, Y. P.: Harmonization of land-use scenarios for the period 1500–2100: 600 years of global gridded annual land-use transitions, wood harvest, and resulting secondary lands, Clim. Change, 109, https://doi.org/10.1007/s10584-011-0153-2, 2011.
Jackson, R. B., Lajtha, K., Crow, S. E., Hugelius, G., Kramer, M. G., and Piñeiro, G.: The Ecology of Soil Carbon: Pools, Vulnerabilities, and Biotic and Abiotic Controls, Annu. Rev. Ecol. Evol. S., 48, 419–445, https://doi.org/10.1146/annurev-ecolsys-112414-054234, 2017.
Jung, M., Reichstein, M., Margolis, H. A., Cescatti, A., Richardson, A. D., Arain, M. A., Arneth, A., Bernhofer, C., Bonal, D., Chen, J., Gianelle, D., Gobron, N., Kiely, G., Kutsch, W., Lasslop, G., Law, B. E., Lindroth, A., Merbold, L., Montagnani, L., Moors, E. J., Papale, D., Sottocornola, M., Vaccari, F., and Williams, C.: Global patterns of land-atmosphere fluxes of carbon dioxide, latent heat, and sensible heat derived from eddy covariance, satellite, and meteorological observations, J. Geophys. Res.-Biogeosci., 116, G00J07, https://doi.org/10.1029/2010JG001566, 2011.
Kageyama, M., Albani, S., Braconnot, P., Harrison, S. P., Hopcroft, P. O., Ivanovic, R. F., Lambert, F., Marti, O., Peltier, W. R., Peterschmitt, J.-Y., Roche, D. M., Tarasov, L., Zhang, X., Brady, E. C., Haywood, A. M., LeGrande, A. N., Lunt, D. J., Mahowald, N. M., Mikolajewicz, U., Nisancioglu, K. H., Otto-Bliesner, B. L., Renssen, H., Tomas, R. A., Zhang, Q., Abe-Ouchi, A., Bartlein, P. J., Cao, J., Li, Q., Lohmann, G., Ohgaito, R., Shi, X., Volodin, E., Yoshida, K., Zhang, X., and Zheng, W.: The PMIP4 contribution to CMIP6 – Part 4: Scientific objectives and experimental design of the PMIP4-CMIP6 Last Glacial Maximum experiments and PMIP4 sensitivity experiments, Geosci. Model Dev., 10, 4035–4055, https://doi.org/10.5194/gmd-10-4035-2017, 2017.
Kleinen, T., Brovkin, V., and Schuldt, R. J.: A dynamic model of wetland extent and peat accumulation: results for the Holocene, Biogeosciences, 9, 235–248, https://doi.org/10.5194/bg-9-235-2012, 2012.
Köhler, P., Knorr, G., and Bard, E.: Permafrost thawing as a possible source of abrupt carbon release at the onset of the Bølling/Allerød, Nat. Commun., 5, 5520, https://doi.org/10.1038/ncomms6520, 2014.
Koven, C., Friedlingstein, P., Ciais, P., Khvorostyanov, D., Krinner, G., and Tarnocai, C.: On the formation of high-latitude soil carbon stocks: Effects of cryoturbation and insulation by organic matter in a land surface model, Geophys. Res. Lett., 36, L21501, https://doi.org/10.1029/2009GL040150, 2009.
Koven, C. D., Ringeval, B., Friedlingstein, P., Ciais, P., Cadule, P., Khvorostyanov, D., Krinner, G., and Tarnocai, C.: Permafrost carbon-climate feedbacks accelerate global warming, P. Natl. Acad. Sci. USA, 108, 14769–14774, 2011.
Koven, C. D., Lawrence, D. M., and Riley, W. J.: Permafrost carbon-climate feedback is sensitive to deep soil carbon decomposability but not deep soil nitrogen dynamics, P. Natl. Acad. Sci. USA, 112, 3752–3757, https://doi.org/10.1073/pnas.1415123112, 2015.
Langer, M., Westermann, S., Heikenfeld, M., Dorn, W., and Boike, J.: Satellite-based modeling of permafrost temperatures in a tundra lowland landscape, Remote Sens. Environ., 135, 12–24, https://doi.org/10.1016/j.rse.2013.03.011, 2013.
Lawrence, D. M. and Slater, A. G.: The contribution of snow condition trends to future ground climate, Clim. Dynam., 34, 969–981, 2010.
Lawrence, D. M., Slater, A. G., and Swenson, S. C.: Simulation of Present-day and Future Permafrost and Seasonally Frozen Ground Conditions in CCSM4, J. Climate, 25, 2207–2225, https://doi.org/10.1175/JCLI-D-11-00334.1, 2011.
Lee, H., Sean, C. S., Andrew, G. S., and David, M. L.: Effects of excess ground ice on projections of permafrost in a warming climate, Environ. Res. Lett., 9, 124006, https://doi.org/10.1088/1748-9326/9/12/124006, 2014.
Lindgren, A., Hugelius, G., Kuhry, P., Christensen, T. R., and Vandenberghe, J.: GIS-based Maps and Area Estimates of Northern Hemisphere Permafrost Extent during the Last Glacial Maximum, Permafrost Periglac., 27, 6–16, https://doi.org/10.1002/ppp.1851, 2016.
Liski, J., Palosuo, T., Peltoniemi, M., and Sievänen, R.: Carbon and decomposition model Yasso for forest soils, Ecol. Model., 189, 168–182, https://doi.org/10.1016/j.ecolmodel.2005.03.005, 2005.
Lourantou, A., Lavrič Jošt, V., Köhler, P., Barnola, J. M., Paillard, D., Michel, E., Raynaud, D., and Chappellaz, J.: Constraint of the CO2 rise by new atmospheric carbon isotopic measurements during the last deglaciation, Global Biogeochem. Cy., 24, GB2015, https://doi.org/10.1029/2009GB003545, 2010.
Mauritsen, T., Bader, J., Becker, T., Behrens, J., Bittner, M., Brokopf, R., Brovkin, V., Claussen, M., Crueger, T., Esch, M., Fast, I., Fiedler, S., Fläschner, D., Gayler, V., Giorgetta, M., Goll, D., Haak, H., Hagemann, S., Hedemann, C., Hohenegger, C., Ilyina, T., Jahns, T., Jimenez de la Cuesta, D., Jungclaus, J., Kleinen, T., Kloster, S., Kracher, D., Kinne, S., Kleberg, D., Lasslop, G., Kornblueh, L., Marotzke, J., Matei, D., Meraner, K., Mikolajewicz, U., Modali, K., Müller, W., Nabel, J., Nam, C., Notz, D., Nyawira, S., Paulsen, H., Peters, K., Pincus, R., Pohlmann, H., Pongratz, J., Popp, M., Raddatz, T., Rast, S., Redler, R., Reick, C., Rohrschneider, T., Schemann, V., Schmidt, H., Schnur, R., Schulzweida, U., Six, K., Stein, L., Stemmler, I., Stevens, B., von Storch, S., Tian, F., Voigt, A., de Vrese, P., Wieners, K., Wilkenskjeld, S., Winkler, A., and Roeckner, E.: Developments in the MPI-M Earth System Model version 1.2 (MPI-ESM1.2) and its response to increasing CO2, J. Adv. Model. Earth Sy., in review, 2018.
McGuire, A. D., Anderson, L. G., Christensen, T. R., Dallimore, S., Guo, L. D., Hayes, D. J., Heimann, M., Lorenson, T. D., Macdonald, R. W., and Roulet, N.: Sensitivity of the carbon cycle in the Arctic to climate change, Ecol. Monogr., 79, 523–555, 2009.
McGuire, A. D., Koven, C., Lawrence David, M., Clein Joy, S., Xia, J., Beer, C., Burke, E., Chen, G., Chen, X., Delire, C., Jafarov, E., MacDougall Andrew, H., Marchenko, S., Nicolsky, D., Peng, S., Rinke, A., Saito, K., Zhang, W., Alkama, R., Bohn Theodore, J., Ciais, P., Decharme, B., Ekici, A., Gouttevin, I., Hajima, T., Hayes Daniel, J., Ji, D., Krinner, G., Lettenmaier Dennis, P., Luo, Y., Miller Paul, A., Moore John, C., Romanovsky, V., Schädel, C., Schaefer, K., Schuur Edward, A. G., Smith, B., Sueyoshi, T., and Zhuang, Q.: Variability in the sensitivity among model simulations of permafrost and carbon dynamics in the permafrost region between 1960 and 2009, Global Biogeochem. Cy., 30, 1015–1037, https://doi.org/10.1002/2016GB005405, 2016.
Mergelov, N. S. and Targulian, V. O.: Accumulation of organic matter in the mineral layers of permafrost-affected soils of coastal lowlands in East Siberia, Eurasian Soil Sci., 44, 249–260, https://doi.org/10.1134/S1064229311030069, 2011.
Mikolajewicz, U., Ziemen, F., Cioni, G., Claussen, M., Fraedrich, K., Heidkamp, M., Hohenegger, C., Jimenez de la Cuesta, D., Kapsch, M.-L., Lemburg, A., Mauritsen, T., Meraner, K., Röber, N., Schmidt, H., Six, K. D., Stemmler, I., Tamarin-Brodsky, T., Winkler, A., Zhu, X., and Stevens, B.: The climate of a retrograde rotating Earth, Earth Syst. Dynam., 9, 1191–1215, https://doi.org/10.5194/esd-9-1191-2018, 2018.
O'Donnell, J. A., Romanovsky, V. E., Harden, J. W., and McGuire, A. D.: The Effect of Moisture Content on the Thermal Conductivity of Moss and Organic Soil Horizons From Black Spruce Ecosystems in Interior Alaska, Soil Sci., 174, 646–651, 2009.
Pelletier, J., Broxton, P., Hazenberg, P., Zeng, X., Troch, P., Niu, G. Y., Williams, Z., Brunke, M., and Gochis, D.: A gridded global data set of soil, intact regolith, and sedimentary deposit thicknesses for regional and global land surface modeling, J. Adv. Model. Earth Sy., 8, 41–65, https://doi.org/10.1002/2015MS000526, 2016.
Porada, P., Ekici, A., and Beer, C.: Effects of bryophyte and lichen cover on permafrost soil temperature at large scale, The Cryosphere, 10, 2291–2315, https://doi.org/10.5194/tc-10-2291-2016, 2016.
Reick, C. H., Raddatz, T., Brovkin, V., and Gayler, V.: Representation of natural and anthropogenic land cover change in MPI-ESM, J. Adv. Model. Earth Sy., 5, 459–482, https://doi.org/10.1002/jame.20022, 2013.
Saito, K., Sueyoshi, T., Marchenko, S., Romanovsky, V., Otto-Bliesner, B., Walsh, J., Bigelow, N., Hendricks, A., and Yoshikawa, K.: LGM permafrost distribution: how well can the latest PMIP multi-model ensembles perform reconstruction?, Clim. Past, 9, 1697–1714, https://doi.org/10.5194/cp-9-1697-2013, 2013.
Schädel, C., Schuur, E. A. G., Bracho, R., Elberling, B., Knoblauch, C., Lee, H., Luo, Y., Shaver, G. R., and Turetsky, M. R.: Circumpolar assessment of permafrost C quality and its vulnerability over time using long-term incubation data, Glob. Change Biol., 20, 641–652, 10.1111/gcb.12417, 2014.
Schaefer, K., Lantuit, H., Romanovsky, V. E., Schuur, E. A. G., and Witt, R.: The impact of the permafrost carbon feedback on global climate, Environ. Res. Lett., 9, 085003, https://doi.org/10.1088/1748-9326/9/8/085003, 2014.
Schaphoff, S., Heyder, U., Ostberg, S., Gerten, D., Heinke, J., and Lucht, W.: Contribution of permafrost soils to the global carbon budget, Environ. Res. Lett., 8, 014026, https://doi.org/10.1088/1748-9326/8/1/014026, 2013.
Schmidt, G. A., Annan, J. D., Bartlein, P. J., Cook, B. I., Guilyardi, E., Hargreaves, J. C., Harrison, S. P., Kageyama, M., LeGrande, A. N., Konecky, B., Lovejoy, S., Mann, M. E., Masson-Delmotte, V., Risi, C., Thompson, D., Timmermann, A., Tremblay, L.-B., and Yiou, P.: Using palaeo-climate comparisons to constrain future projections in CMIP5, Clim. Past, 10, 221–250, https://doi.org/10.5194/cp-10-221-2014, 2014.
Schneck, R., Reick, C. H., and Raddatz, T.: Land contribution to natural CO2 variability on time scales of centuries, J. Adv. Model. Earth Sy., 5, 354–365, https://doi.org/10.1002/jame.20029, 2013.
Schneider von Deimling, T., Meinshausen, M., Levermann, A., Huber, V., Frieler, K., Lawrence, D. M., and Brovkin, V.: Estimating the near-surface permafrost-carbon feedback on global warming, Biogeosciences, 9, 649–665, https://doi.org/10.5194/bg-9-649-2012, 2012.
Schneider von Deimling, T., Grosse, G., Strauss, J., Schirrmeister, L., Morgenstern, A., Schaphoff, S., Meinshausen, M., and Boike, J.: Observation-based modelling of permafrost carbon fluxes with accounting for deep carbon deposits and thermokarst activity, Biogeosciences, 12, 3469–3488, https://doi.org/10.5194/bg-12-3469-2015, 2015.
Slater, A. G. and Lawrence, D. M.: Diagnosing Present and Future Permafrost from Climate Models, J. Climate, 26, 5608–5623, https://doi.org/10.1175/JCLI-D-12-00341.1, 2013.
Stieglitz, M., Déry, S. J., Romanovsky, V. E., and Osterkamp, T. E.: The role of snow cover in the warming of arctic permafrost, Geophys. Res. Lett., 30, 1721, https://doi.org/10.1029/2003GL017337, 2003.
Strauss, J., Schirrmeister, L., Grosse, G., Fortier, D., Hugelius, G., Knoblauch, C., Romanovsky, V., Schädel, C., Schneider von Deimling, T., Schuur, E. A. G., Shmelev, D., Ulrich, M., and Veremeeva, A.: Deep Yedoma permafrost: A synthesis of depositional characteristics and carbon vulnerability, Earth-Sci. Rev., 172, 75–86, https://doi.org/10.1016/j.earscirev.2017.07.007, 2017.
Thum, T., Räisänen, P., Sevanto, S., Tuomi, M., Reick, C., Vesala, T., Raddatz, T., Aalto, T., Järvinen, H., Altimir, N., Pilegaard, K., Nagy, Z., Rambal, S., and Liski, J.: Soil carbon model alternatives for ECHAM5/JSBACH climate model: Evaluation and impacts on global carbon cycle estimates, J. Geophys. Res.-Biogeosci., 116, G02028, https://doi.org/10.1029/2010JG001612, 2011.
Tuomi, M., Thum, T., Järvinen, H., Fronzek, S., Berg, B., Harmon, M., Trofymow, J. A., Sevanto, S., and Liski, J.: Leaf litter decomposition – Estimates of global variability based on Yasso07 model, Ecol. Model., 220, 3362–3371, https://doi.org/10.1016/j.ecolmodel.2009.05.016, 2009.
Walter, K. M., Edwards, M. E., Grosse, G., Zimov, S. A., and Chapin, F. S.: Thermokarst lakes as a source of atmospheric CH4 during the last deglaciation, Science, 318, 633–636, 2007.
Walz, J., Knoblauch, C., Böhme, L., and Pfeiffer, E.-M.: Regulation of soil organic matter decomposition in permafrost-affected Siberian tundra soils – Impact of oxygen availability, freezing and thawing, temperature, and labile organic matter, Soil Biol. Biochem., 110, 34–43, https://doi.org/10.1016/j.soilbio.2017.03.001, 2017.
Willeit, M. and Ganopolski, A.: Coupled Northern Hemisphere permafrost-ice-sheet evolution over the last glacial cycle, Clim. Past, 11, 1165–1180, https://doi.org/10.5194/cp-11-1165-2015, 2015.
Xu, X., Shi, Z., Li, D., Rey, A., Ruan, H., Craine, J. M., Liang, J., Zhou, J., and Luo, Y.: Soil properties control decomposition of soil organic carbon: Results from data-assimilation analysis, Geoderma, 262, 235–242, https://doi.org/10.1016/j.geoderma.2015.08.038, 2016.
Yu, Z., Loisel, J., Brosseau Daniel, P., Beilman David, W., and Hunt Stephanie, J.: Global peatland dynamics since the Last Glacial Maximum, Geophys. Res. Lett., 37, L13402, https://doi.org/10.1029/2010GL043584, 2010.
Zech, R., Huang, Y., Zech, M., Tarozo, R., and Zech, W.: High carbon sequestration in Siberian permafrost loess-paleosols during glacials, Clim. Past, 7, 501–509, https://doi.org/10.5194/cp-7-501-2011, 2011.
Zhang, T., Barry, R. G., Knowles, K., Heginbottom, J. A., and Brown, J.: Statistics and characteristics of permafrost and ground-ice distribution in the Northern Hemisphere, Polar Geogr., 23, 132–154, https://doi.org/10.1080/10889379909377670, 1999.
Zhang, T.: Influence of the seasonal snow cover on the ground thermal regime: An overview, Rev. Geophys., 43, RG4002, https://doi.org/10.1029/2004RG000157, 2005.
Zhang, T., Barry, R. G., Knowles, K., Heginbottom, J. A., and Brown, J.: Statistics and characteristics of permafrost and ground-ice distribution in the Northern Hemisphere, Polar Geogr., 31, 47–68, https://doi.org/10.1080/10889370802175895, 2008.
Zhu, D., Peng, S., Ciais, P., Zech, R., Krinner, G., Zimov, S., and Grosse, G.: Simulating soil organic carbon in yedoma deposits during the Last Glacial Maximum in a land surface model, Geophys. Res. Lett., 43, 5133–5142, https://doi.org/10.1002/2016GL068874, 2016.
Zimov, S. A., Davydov, S. P., Zimova, G. M., Davydova, A. I., Schuur, E. A. G., Dutta, K., and Chapin, F. S.: Permafrost carbon: Stock and decomposability of a globally significant carbon pool, Geophys. Res. Lett., 33, L20502, https://doi.org/10.1029/2006GL027484, 2006.