the Creative Commons Attribution 4.0 License.
the Creative Commons Attribution 4.0 License.
 | 11 Dec 2018
A stalagmite test of North Atlantic SST and Iberian hydroclimate linkages over the last two glacial cycles
Rhawn F. Denniston
Amanda N. Houts
Yemane Asmerom
Alan D. Wanamaker Jr.
Jonathan A. Haws
Victor J. Polyak
Diana L. Thatcher
Setsen Altan-Ochir
Alyssa C. Borowske
Sebastian F. M. Breitenbach
Caroline C. Ummenhofer
Frederico T. Regala
Michael M. Benedetti
Nuno F. Bicho
Close coupling of Iberian hydroclimate and North Atlantic sea surface temperature (SST) during recent glacial periods has been identified through the analysis of marine sediment and pollen grains co-deposited on the Portuguese continental margin. While offering precisely correlatable records, these time series have lacked a directly dated, site-specific record of continental Iberian climate spanning multiple glacial cycles as a point of comparison. Here we present a high-resolution, multi-proxy (growth dynamics and δ13C, δ18O, and δ234U values) composite stalagmite record of hydroclimate from two caves in western Portugal across the majority of the last two glacial cycles (∼220 ka). At orbital and millennial scales, stalagmite-based proxies for hydroclimate proxies covaried with SST, with elevated δ13C, δ18O, and δ234U values and/or growth hiatuses indicating reduced effective moisture coincident with periods of lowered SST during major ice-rafted debris events, in agreement with changes in palynological reconstructions of continental climate. While in many cases the Portuguese stalagmite record can be scaled to SST, in some intervals the magnitudes of stalagmite isotopic shifts, and possibly hydroclimate, appear to have been somewhat decoupled from SST.
- Article
(7896 KB) - Full-text XML
-
Supplement
(6482 KB) - BibTeX
- EndNote


The Portuguese continental margin is an important location for understanding variations in paleoceanographic conditions over orbital and millennial scales (Hodell et al., 2013; Voelker and de Abreu, 2011). Here, marine sediments record basin-wide oceanographic signals, while co-deposited pollen grains track coeval vegetation changes occurring across Iberia. Integrated analysis of these proxies has revealed a close coupling of North Atlantic SST, regional climate, and Iberian ecosystems during the last three glacial cycles, including changes in vegetation dynamics (Sánchez Goñi et al., 2002, 2008; Tzedakis et al., 2004; Roucoux et al., 2006; Martrat et al., 2007; Naugthon et al., 2007), atmospheric circulation (Sánchez Goñi et al., 2013), and fire frequency (Daniau et al., 2007). One commonly applied palynological metric is the abundance of temperate tree pollen, which rises during warm and wet conditions associated with both interglacials and Greenland interstadials, concomitant with shifts in Iberian margin SST (Sánchez Goñi et al., 2002; Tzedakis et al., 2004; Combourieu-Nebout et al., 2009; Fletcher et al., 2010; Chabaud et al., 2014). However, the nature of such land–sea connections is partially obscured by the size of catchments from which the pollen is derived, with some reaching into central Iberia and spanning a range of environmental settings subject to varying climatic influences (Martin-Vide and Lopez-Bustins, 2006; Naughton et al., 2007) (Fig. 1).
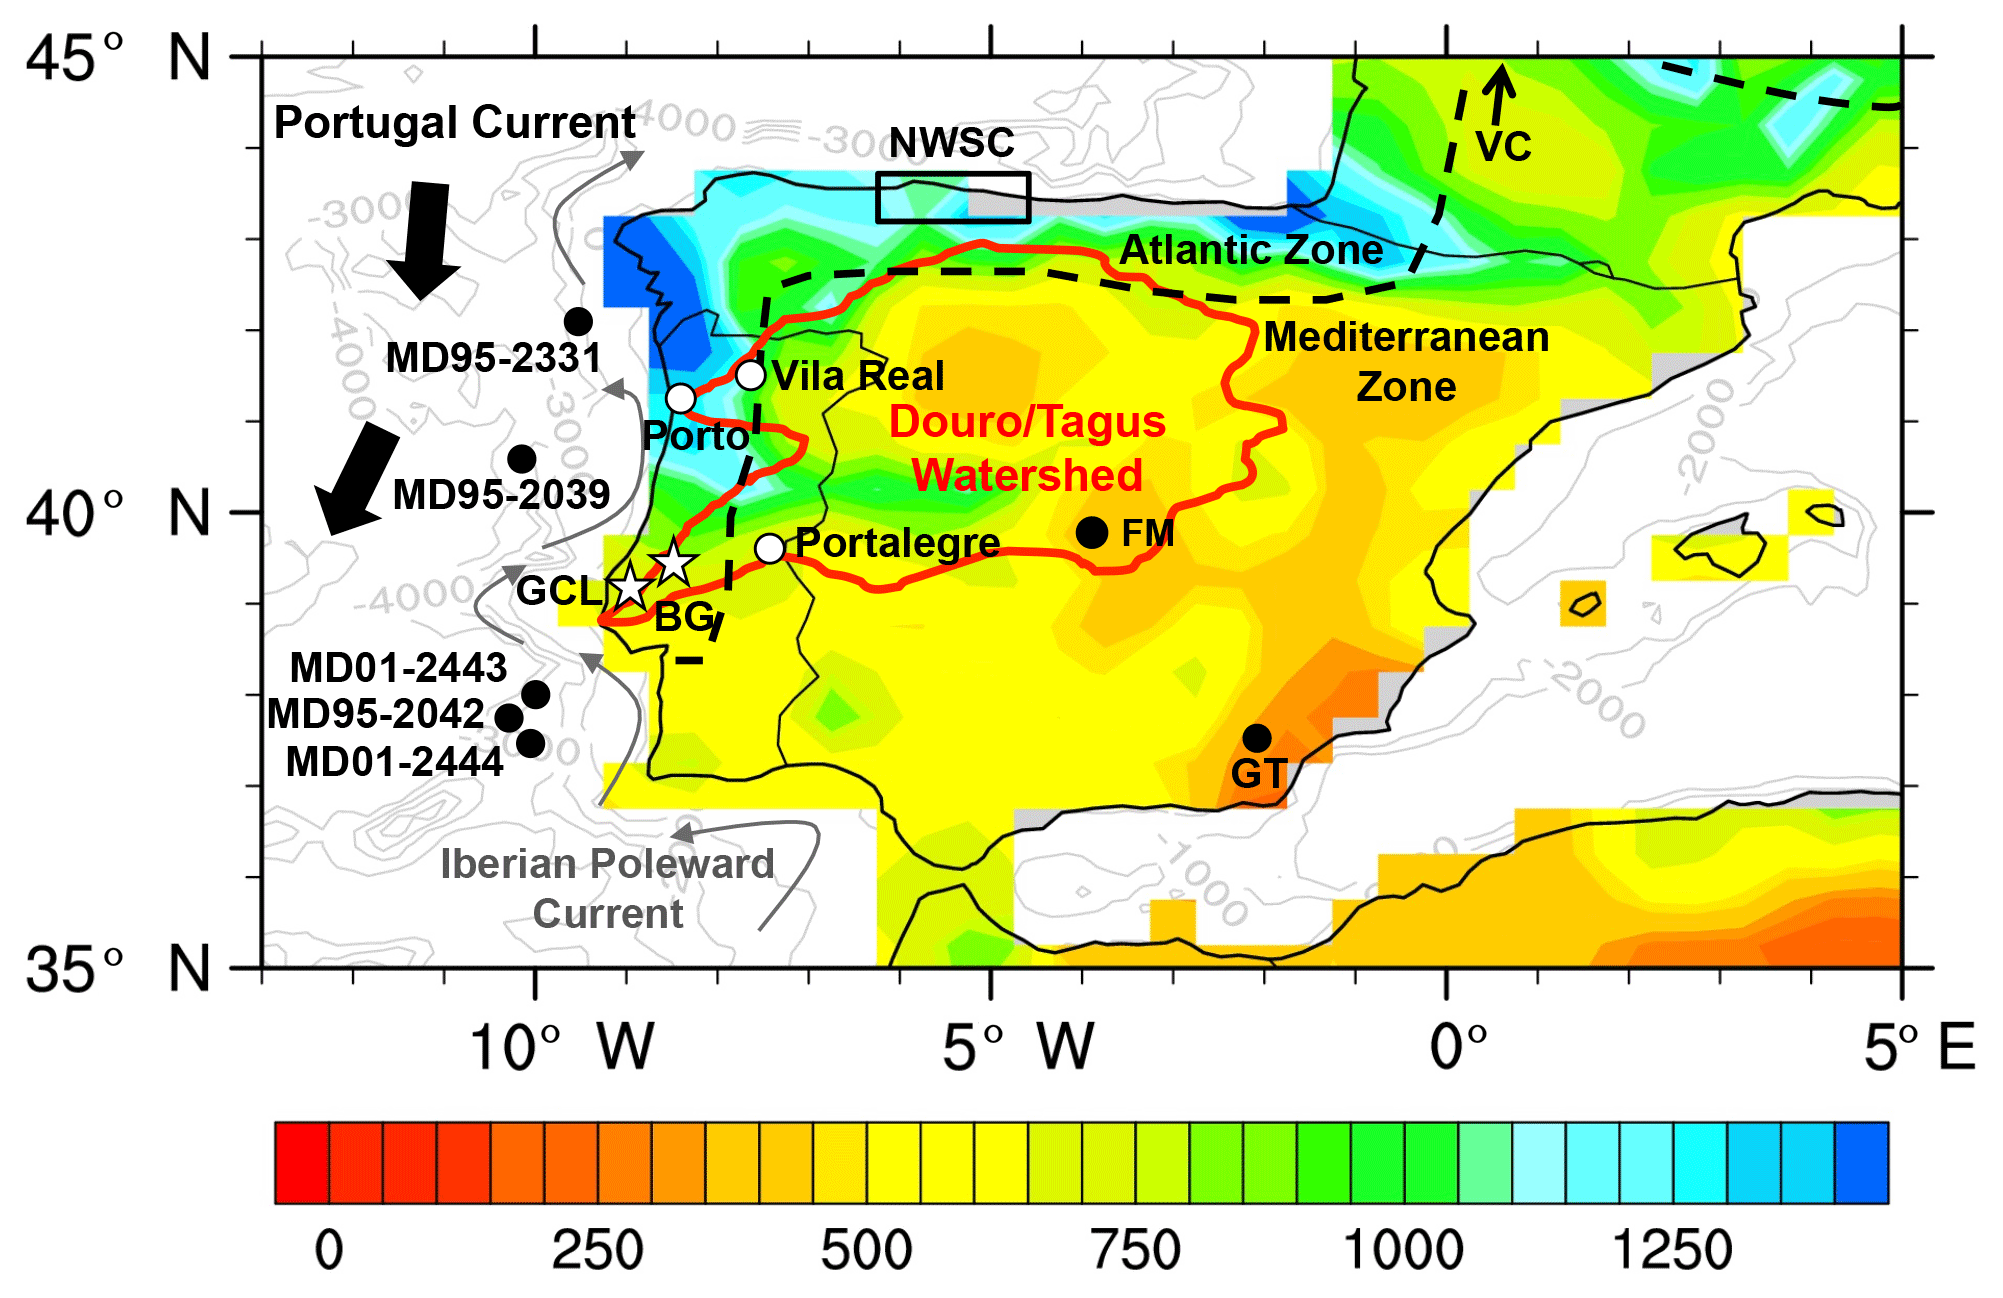
Figure 1Average annual precipitation (mm) of the Iberian Peninsula for years 1901–2009 CE (GPCC v. 6; Schneider et al., 2014) relative to cave study sites (white stars: GLC – Gruta do Casal da Lebre; BG – Buraca Gloriosa). Rectangle denotes location of northwest Spain cave sites (NWSCs) (Moreno et al., 2010; Stoll et al., 2013); FM – Fuentillejo maar (Vegas et al., 2010) and GT – Gitana Cave (Hodge et al., 2008); VC – Villars Cave (Genty et al., 2003) located just north of map. Also shown are locations of marine cores discussed in the text and GNIP stations at Porto, Vila Real, and Portalegre. Bathymetric contours shown in grey (m). Location of currents after Voelker et al. (2010).
Testing the links between terrestrial and marine systems benefits from continental climate archives that provide precisely dated and high-resolution rainfall-sensitive time series spanning tens of millennia, but such records remain rare in Iberia, particularly near the west Iberian margin (Fletcher et al., 2010; Moreno et al., 2012; Stoll et al., 2013). Here we present a composite stalagmite record of four proxies for hydroclimate – growth dynamics and δ13C, δ18O, and δ234U values – spanning the majority of the last and penultimate glacial cycles (∼220 ka) at two cave sites in western Portugal. These time series offer a rare site-specific continental record capable of examining the coherence of SST controls on Iberian climate and ecosystem dynamics across glacial and interglacial periods. The new record provides a continental perspective of hydroclimate dynamics linked to regional oceanographic conditions.
2.1 Environmental setting
We report the analysis of five stalagmites (BG41, BG66, BG67, BG611, BG6LR) from Buraca Gloriosa (BG; 39∘32′ N, 08∘47′ W; 420 m a.s.l.) and one stalagmite (GCL6) from Gruta do Casal da Lebre (GCL; 39∘18′ N, 9∘16′ W; 130 m a.s.l.), two caves in western Portugal (Fig. 1). Environmental conditions in BG and GCL are well suited for speleothem paleoclimate reconstruction (see below). BG and GCL are located within the Meso-Mediterranean bioclimatic zone that dominates much of Iberia (Fig. 1). This region is characterized by strong seasonality with warm, dry summers and cool, wet winters (Fig. 2) associated with the winter westerlies (Blanco Castro et al., 1997). In contrast, the Atlantic zone, north of the Douro River, is cooler, wetter, and less strongly seasonal. In the Pleistocene, the transition between these zones likely shifted southward with Mediterranean-type vegetation restricted to refugia (Rey Benayas and Scheiner, 2002).
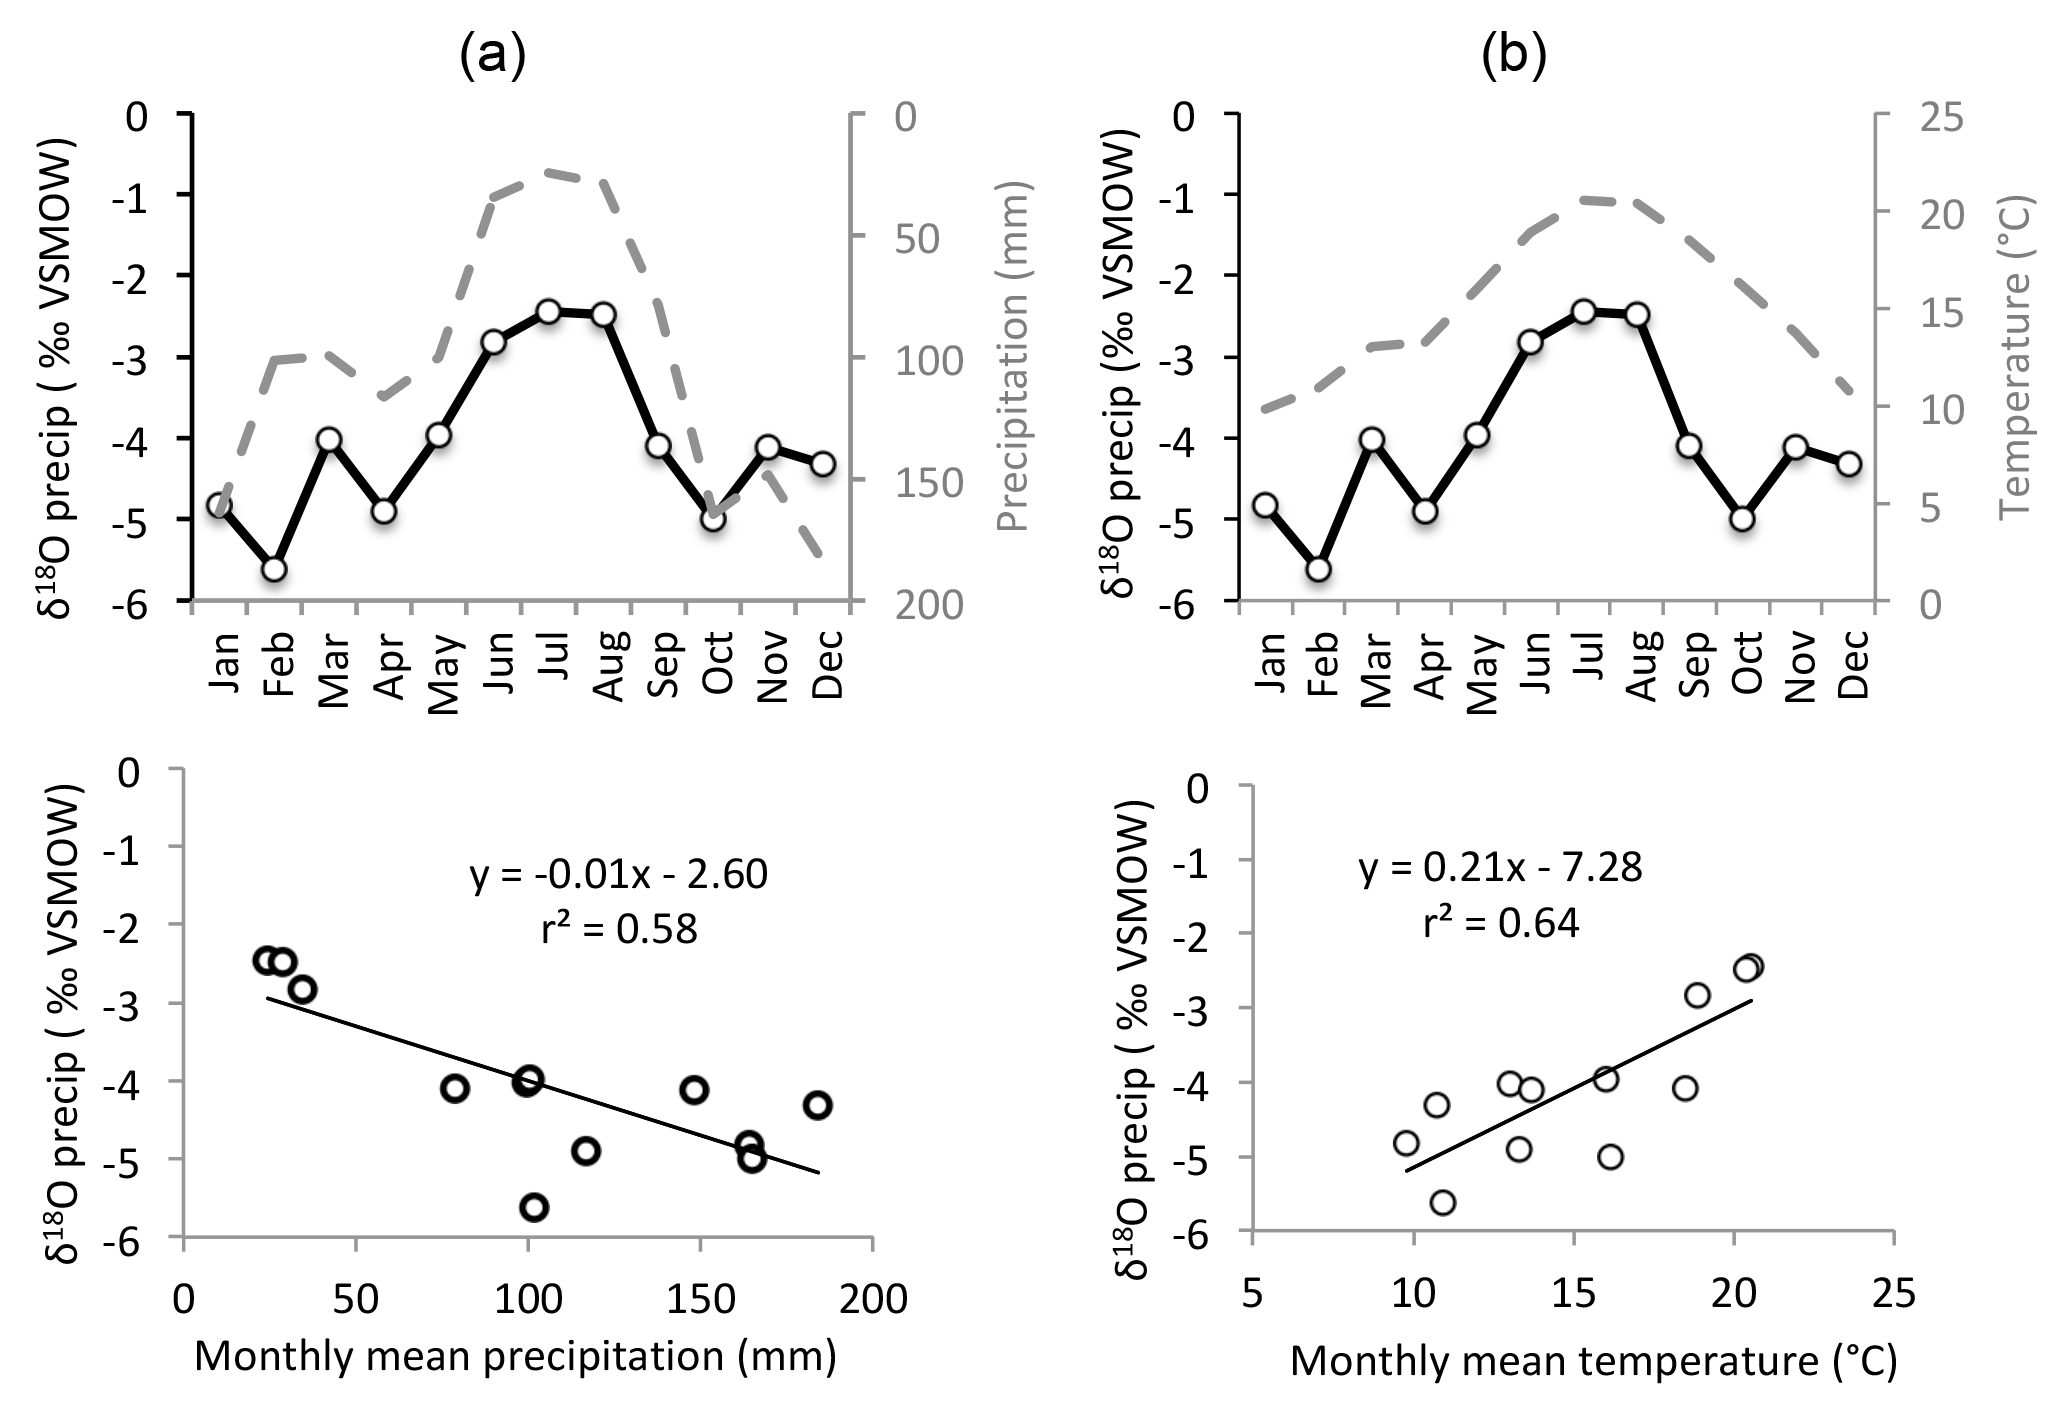
Figure 2Oxygen isotopic composition of precipitation versus rainfall amount (a) and air temperature (b). Data collected at IAEA/GNIP site in Porto, Portugal (see Fig. 1 for location) for 1988–2004. Oxygen isotope data represent multiyear averages of monthly means. The two other closest GNIP stations in Portugal – Vila Real and Portalegre (see Fig. 1) – share similar relationships between precipitation oxygen isotopic composition and air temperature (+0.27 ‰ ∘C−1, r2=0.76 and +0.26 ‰ ∘C−1, r2=0.69, respectively) to that of Porto (+0.21 ‰ ∘C−1). The relationship between precipitation oxygen isotopic composition and monthly precipitation amount is −3.5 ‰ 100 mm−1 month−1 (r2=0.64), −3.7 ‰ 100 mm−1 month−1 (r2=0.49), and −1.6 ‰ 100 mm−1 month−1 (r2=0.62) for the three sites, respectively. Note that the right-hand y axis in panel (a) is inverted in order to illustrate the inverse nature of rainfall and precipitation oxygen isotopic composition.
Over interannual scales, the hydroclimate of Iberia is tightly coupled with the winter North Atlantic Oscillation (NAO) (Fig. 3), an atmospheric dipole that strongly influences precipitation across much of western Europe and that more broadly reflects the strength and positioning of the Azores high-pressure system, which steers storm tracks contained within the westerlies into or north of Iberia (e.g., Trigo et al, 2002; Paredes et al., 2006; Trouet et al., 2009; Cortesi et al., 2014). The NAO is typically measured as the NAO index, which is calculated using atmospheric pressure differences between Iceland and Lisbon (or the Azores) (Barnston and Livezey, 1987). The nature of the influence of the NAO varies across Iberia, but it is strongly correlated with rainfall in western Portugal (Fig. 3), with a positive NAO index associated with a steeper pressure gradient and elevated Iberian aridity. Iberian precipitation has also been linked to SST in regions ranging from the western North Atlantic to the Iberian margin (Lorenzo et al., 2010) where ocean circulation is dominated by the south-flowing Portugal Current and the near-coastal, north-flowing Iberian Poleward Current, two systems that transport pollen from river mouths along the continental shelf (Fig. 1).
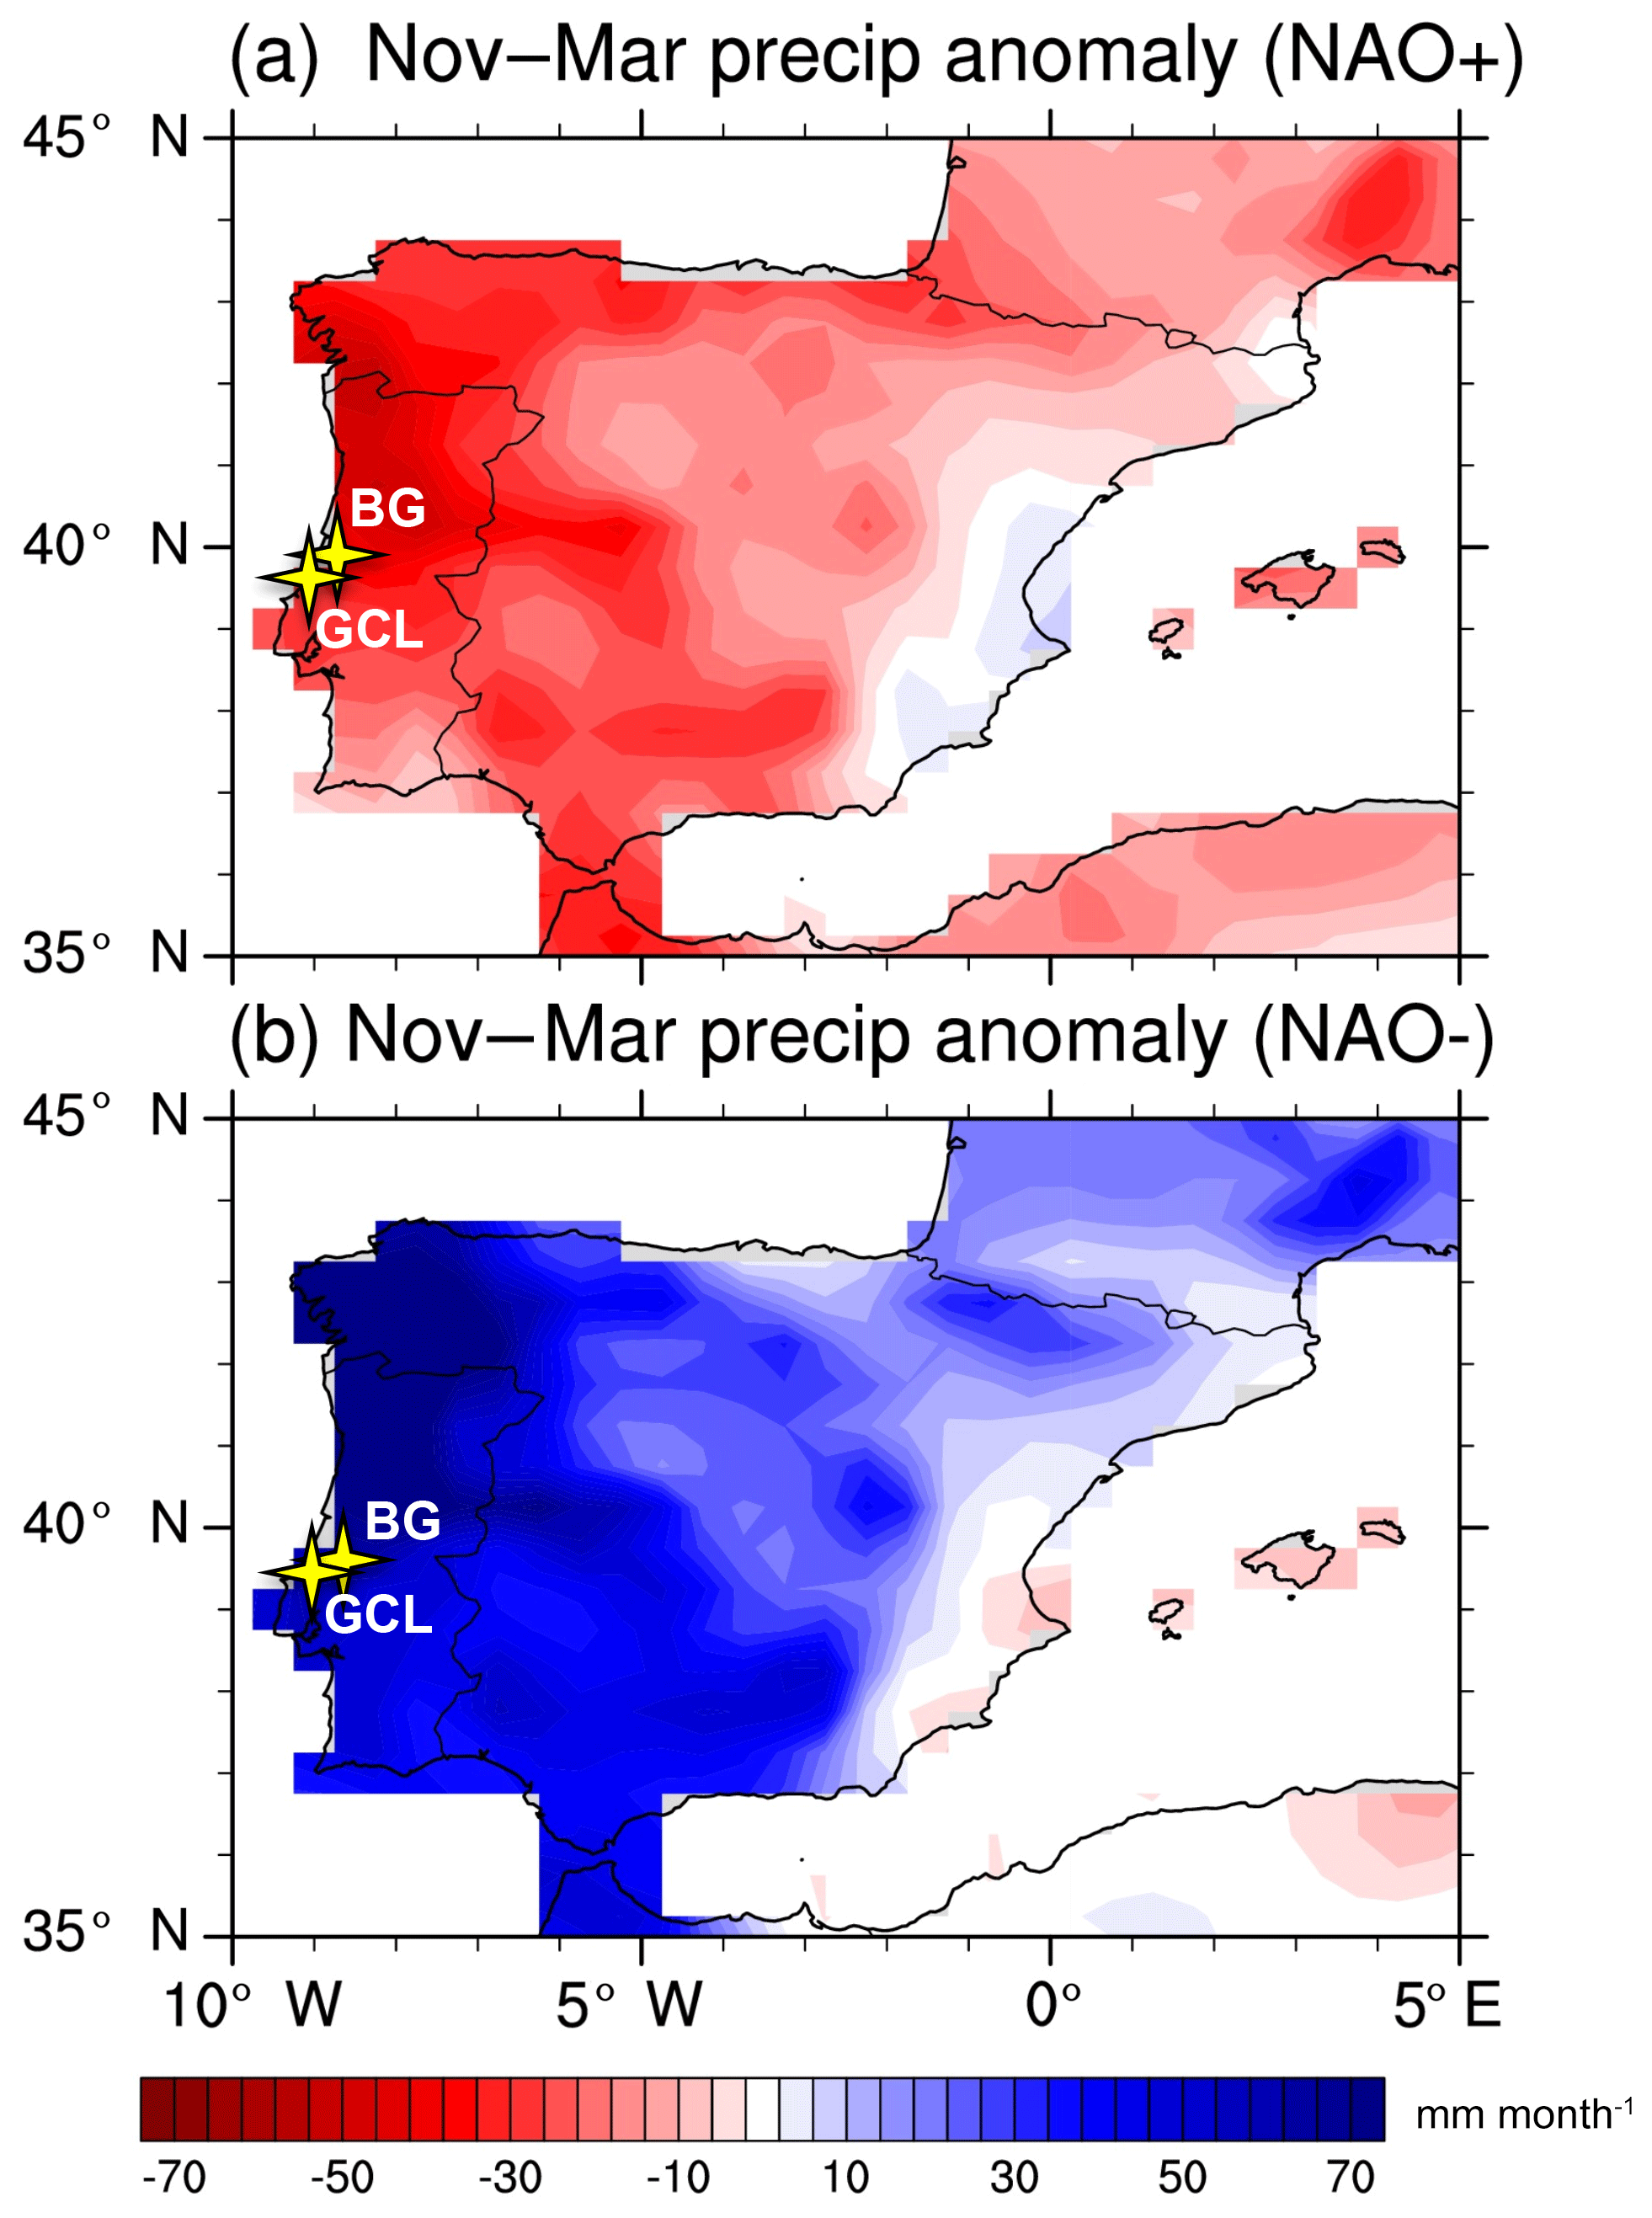
Figure 3Iberian rainfall anomalies associated with the North Atlantic Oscillation. Composites of November–March precipitation anomalies (mm month−1) during (a) positive and (b) negative NAO winters for the period 1901–2012. Positive–negative NAO winters were determined using the December–March Hurrell principal-component-based NAO index (CDG, 2018) as winters with NAO values in the highest–lowest decile of all winters. The PC-based NAO index represents the time series of the leading empirical orthogonal function of SLP anomalies over the Atlantic sector at 20–80∘ N, 90∘ W–40∘ E. Precipitation anomalies are based on the GPCC precipitation version 7 at 0.5∘ spatial resolution (Schneider et al., 2014). Yellow stars denote cave sites in this study. BG: Buraca Gloriosa; GCL: Gruta do Casal da Lebre.
2.2 Cave settings
Buraca Gloriosa cave is located near the town of Alvados, 30 km from the Atlantic Ocean, within Middle Jurassic limestones of the Estremadura Limestone Massif (Rodrigues and Fonseca, 2010), a topographically distinct region in central Portugal (Fig. 1). The ∼35 m long cave is accessed through a single small (∼0.5 m2) entrance at the top of a collapse at the base of a 30 m high escarpment (Fig. 4). The cave is well decorated although little active growth is occurring today. Vegetation above the cave is primarily shrubs, small trees, and mosses hosted by a thin (0–10 cm) and highly organic soil layer.
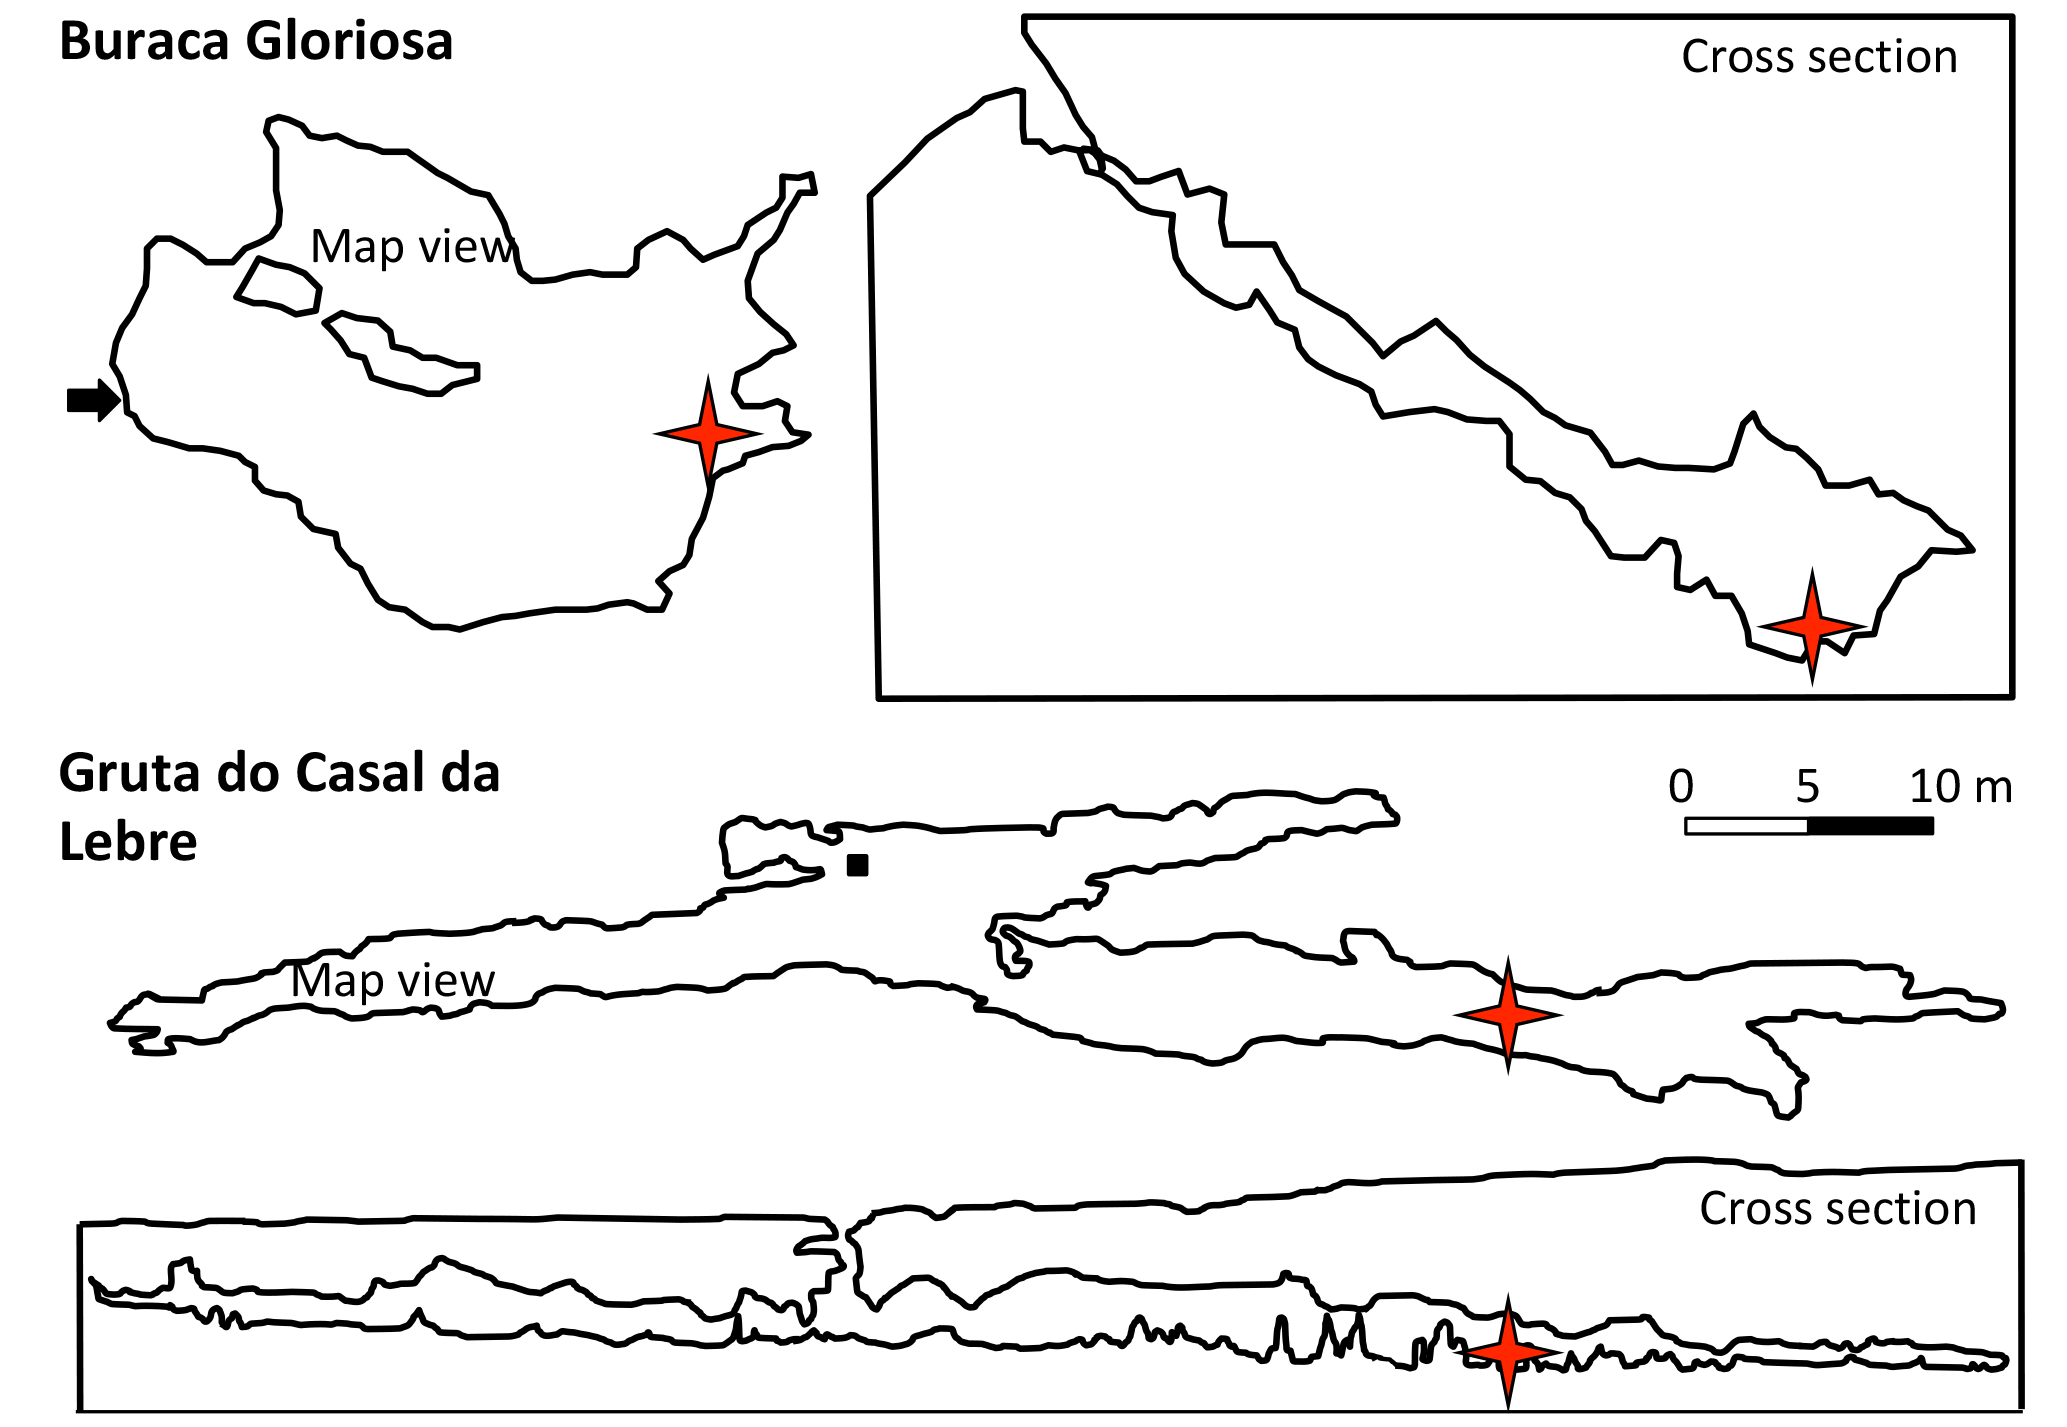
Figure 4Profile and map views of Buraca Gloriosa (top) and Gruta do Casal da Lebre (bottom). Entrance denoted by arrow (top panel) and filled square (bottom panel). Red stars denote locations of stalagmites used in this study.
Gruta do Casal da Lebre overlooks the coastal town of Peniche and is hosted by Upper Jurassic limestones. The cave is 130 m long and contains a single 1 m2 entrance that opens onto a 7 m vertical shaft (Fig. 4). This entrance has been closed with a solid metal door in recent decades in order limit access to the cave, and this modification has likely reduced air exchange in GCL relative to its original state. Like BG, GCL hosts little active calcite deposition, but contains numerous fossil stalagmites and stalactites. The vegetation over the cave has been replaced in recent decades by stands of eucalyptus that grow in thin (< 1–5 cm) clay-rich soils.
2.3 Pollen sources
Pollen deposited on the west Iberian margin is sourced primarily from vegetation inhabiting the watersheds of the major west-flowing stream systems draining Portugal and Spain, which are (from north to south) the Douro, Tagus, and Sado rivers. The areas encompassed by these streams are large (79 000, 81 000, and 7650 km2, respectively) and span a variety of elevations. The Tagus and Sado are primarily responsible for pollen deposited southwest of Portugal, while the Douro plays an important role in delivering pollen to the more northwesterly sites (Fig. 1). Prevailing wind patterns likely prevent substantial transport of pollen from Iberia to the western Portuguese margin (Naughton et al., 2007). The pollen data presented here were collected in three closely spaced cores from the southwest Iberian margin: MD01-2443, 250–194 ka (Roucoux et al, 2006; Tzedakis et al., 2004); MD01-2444, 193–136 ka (Margari et al., 2010, 2014); MD95-2042, 141–1 ka (Sánchez Goñi et al., 2008, 2013) (Fig. 1). They are integrated here into a single time series.
3.1 Environmental monitoring
Environmental conditions were measured at both cave sites over a multiyear period, with data recorded in 2 h intervals near the areas where the stalagmites were deposited. Temperature and relative humidity were obtained using HOBO U23 automated sensors, while barometric pressure was recorded with HOBO U20L loggers. Drip rates were monitored at BG with Stalagmate acoustic drip counters (Collister and Mattey, 2008).
3.2 Uranium-series dating
Stalagmite chronologies were constructed with a total of 69 230Th dates obtained at the University of New Mexico (Table 1) using the methods of Asmerom et al. (2010). For dating of stalagmite carbonate, powders ranging from 100–200 mg were weighed, dissolved in 15N nitric acid, spiked with a mixed 229Th–229Th–236U tracer, and processed using column chemistry methods. U and Th fractions were dissolved in 5 mL of 3 % nitric acid and transferred to analysis tubes for measurement on a Thermo Neptune MC-ICP-MS. U and Th solutions were aspirated into the Neptune using a Cetac Aridus II low-flow desolvating nebulizer and run as static routines. All isotopes of interest were measured in Faraday cups, except for 234U and 230Th, which were measured in the secondary electron multiplier (SEM). Gains between the SEM and the Faraday cups were determined using standard solutions of NBL-112 for U and an in-house 230Th–229Th standard for Th that was measured after every fifth sample; chemistry blanks reveal U and Th blanks below 20 pg. Ages are reported using 2 standard deviation errors.
For BG stalagmites, corrections were made for unsupported 230Th using a 230Th∕232Th ratio of 13.5 ppm (±50 %), a value determined from isotopic analysis of cave drip water. To obtain this value, 108 mL of drip water was transferred into six 30 mL Teflon beakers. These beakers were fluxed in 6N HCl for an hour, rinsed, and heated gently on a hot plate until approximately 1–2 mL of fluid remained in each. All solutions were then combined into a single 30 mL Teflon beaker, spiked with the same tracer described above (which contains HF), fluxed, and then taken to complete dryness. The resulting precipitate was dissolved with 15N HNO3, dried down, dissolved again in 7N HNO3, and processed with the same column chemistry methods used for the stalagmite samples. We lack independent constraints on the initial Th ratio for the GCL stalagmite and thus apply the default value of 4.4 ppm (±50 %). This difference in the initial Th ratio impacts the corrected ages of GCL6 by 0.5–3.0 kyr relative to the value used for BG and thus does not meaningfully influence our interpretations.
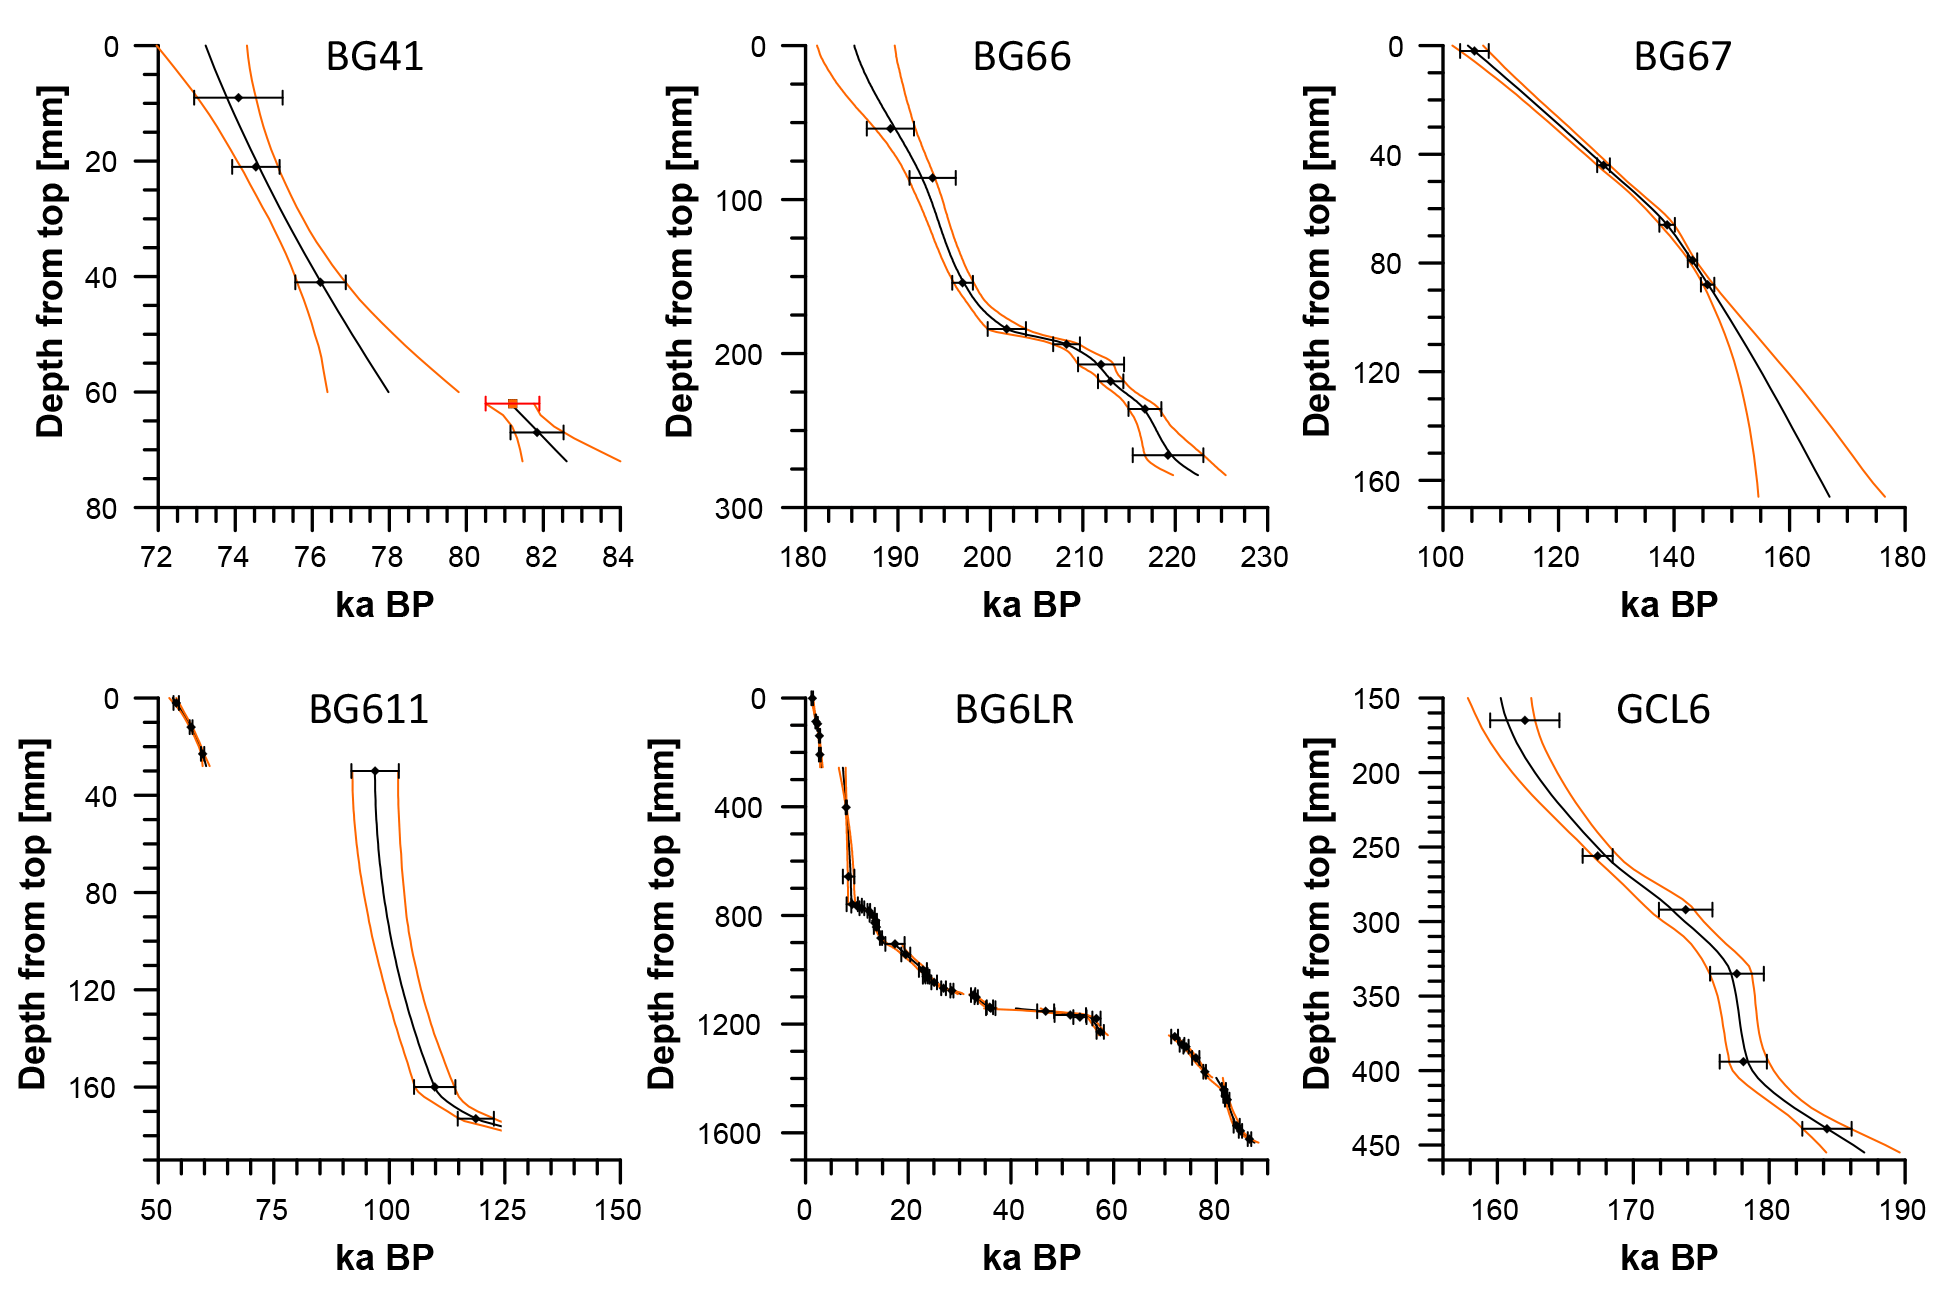
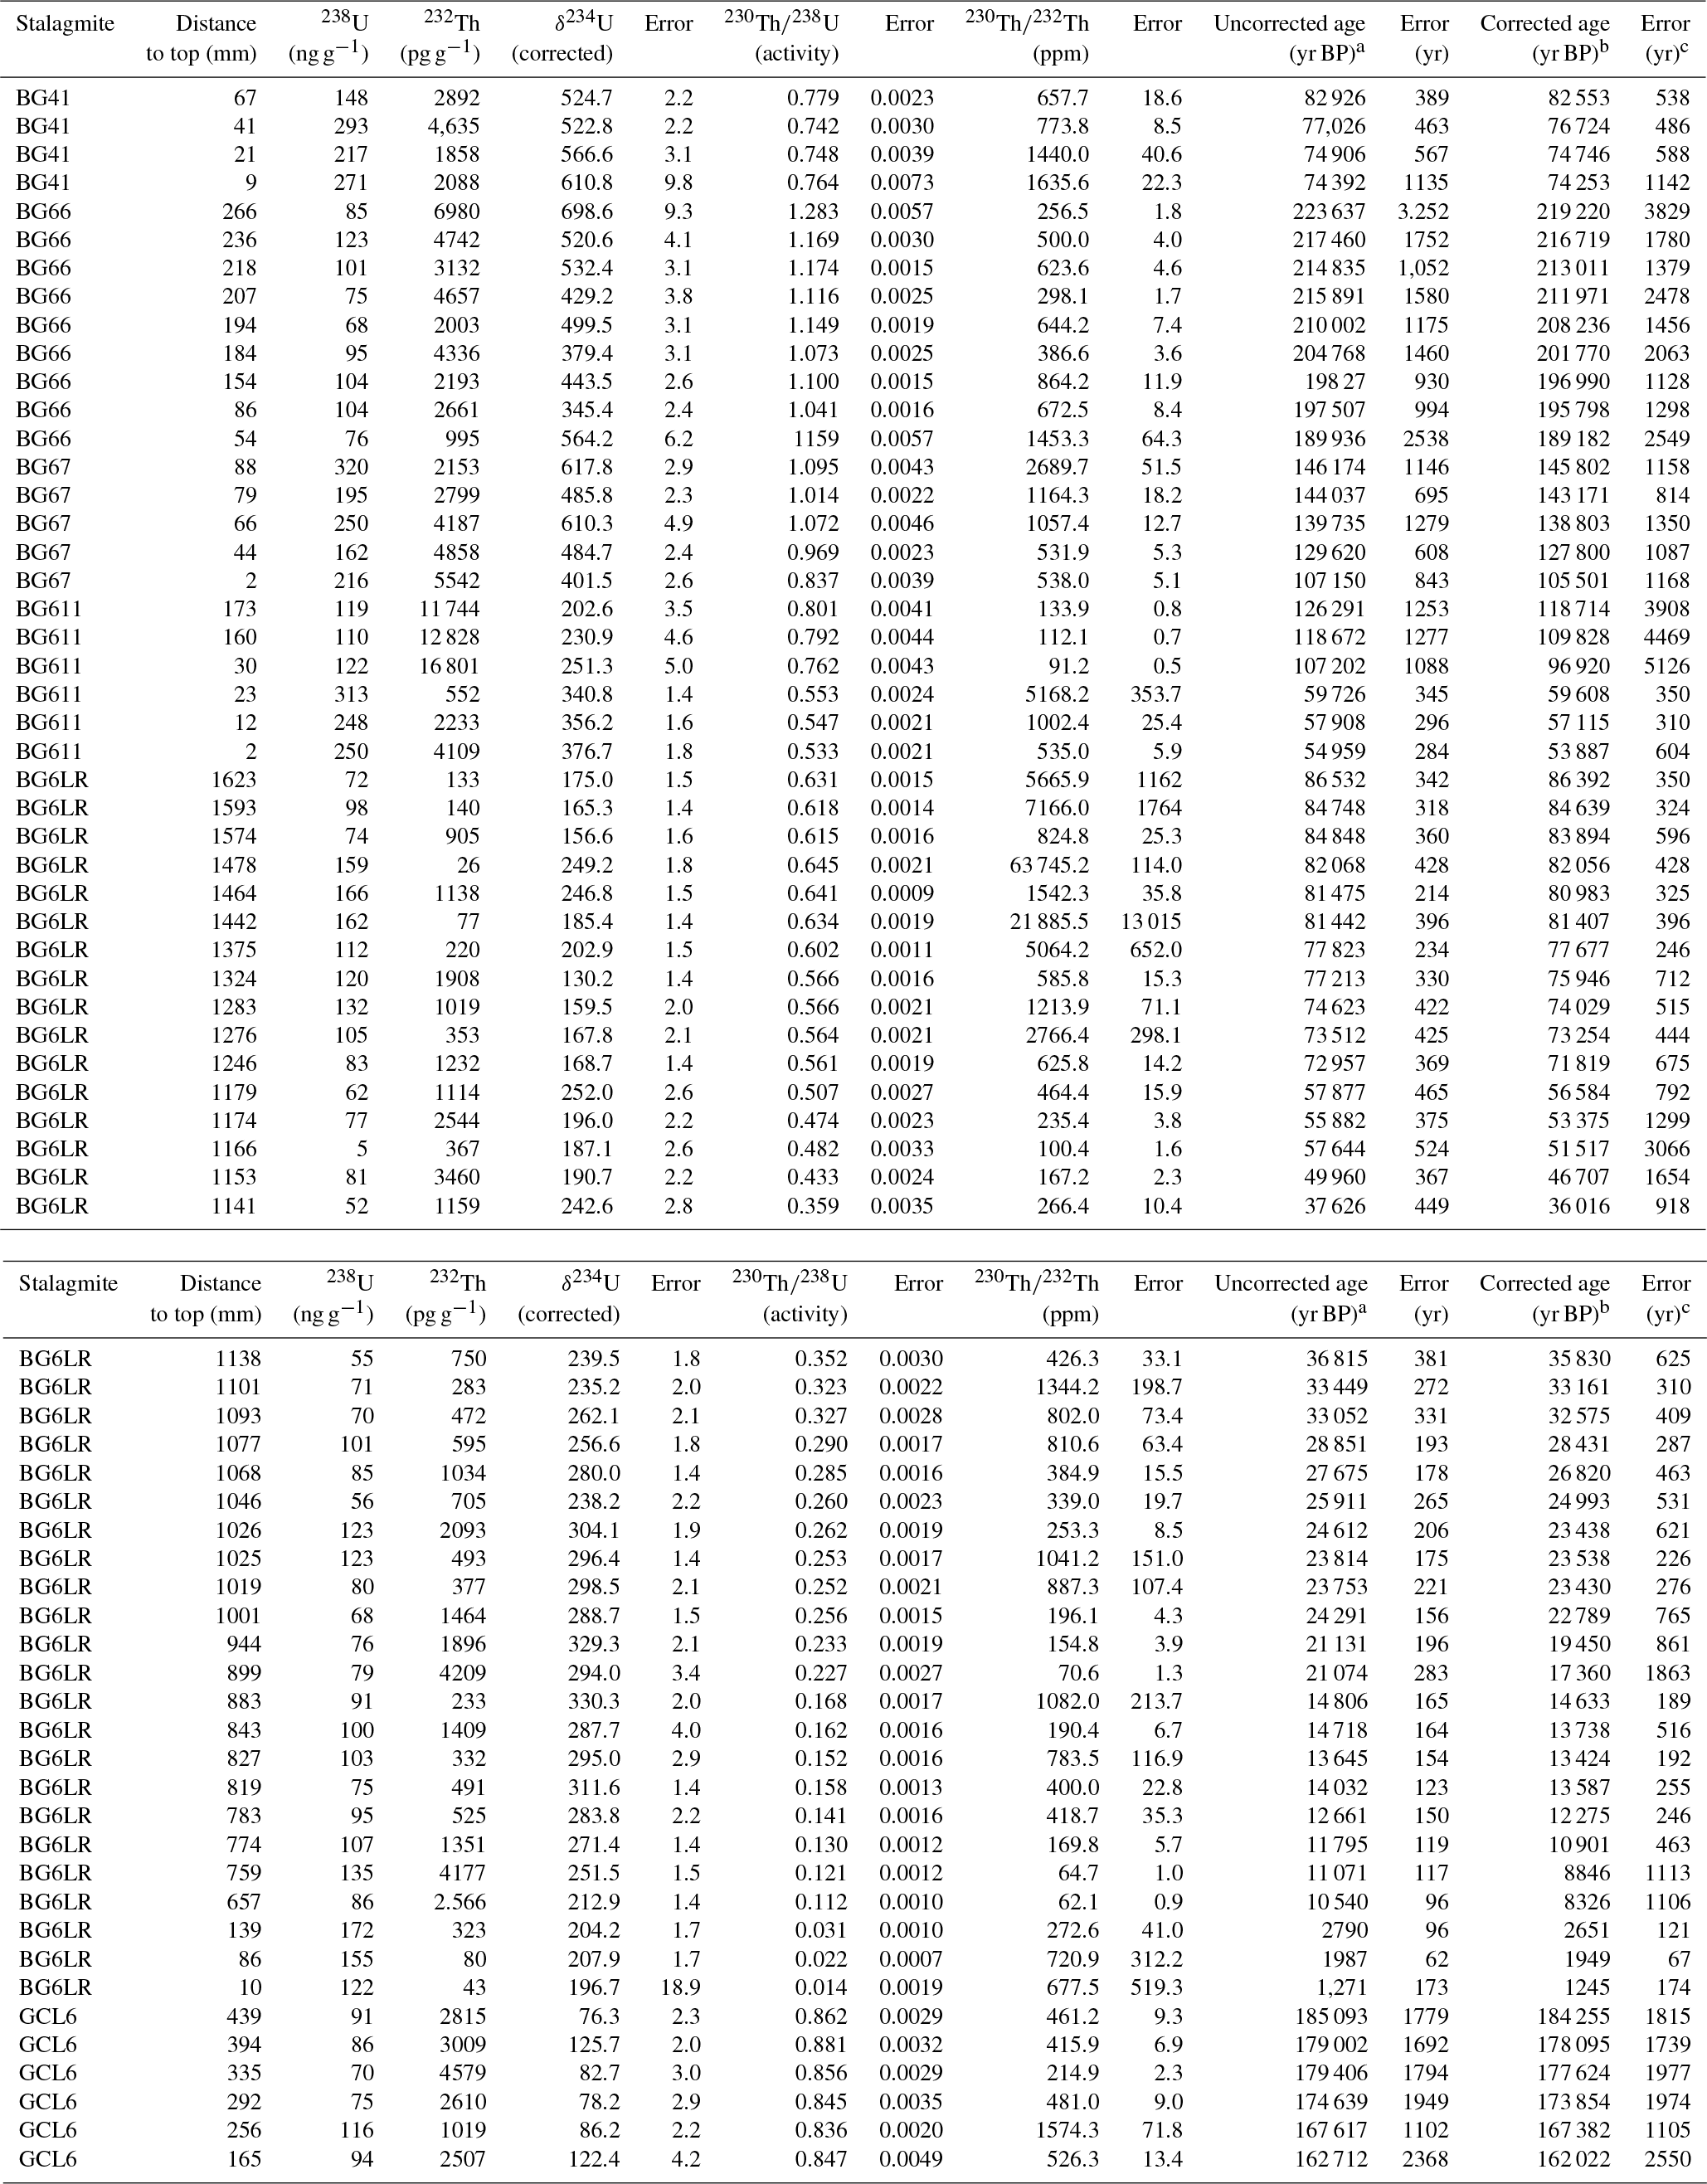
Figure 5COPRA-derived age models for BG and GCL stalagmites. Black lines represent mean of calculated age models, while red lines denote 95 % confidence intervals. See Table 1 for specific ages and isotopic ratios. Orange square represents a “dummy age” that was included in order to extrapolate below the hiatus, which is only possible with at least two dated points. The bottom of BG611 was based on linear extrapolation through dated intervals. Distances for BG66 were measured relative to the topmost section of the interval for which stable isotopes were obtained, and not relative to the cap of the stalagmite (see Fig. 6).
Age models were developed via multiple polynomial interpolations between dated intervals using the COPRA age-modeling software (Breitenbach et al., 2012) (Fig. 5). Aside from providing age models, COPRA also yields mean modeled stable isotope values and confidence intervals (Supplement Fig. S1). Here we rely primarily on the original δ18O and δ13C values because COPRA-derived median values reflect statistically robust variations, but reduce to some degree the range of isotopic variability. For COPRA, a dummy age was included in the age model for BG41 in order to extrapolate below the hiatus, which is only possible with at least two dated points. The value of this dummy age was based on the assumption that it maintains a stratigraphically correct slope (i.e., higher sections of the stalagmite represent younger material). The dummy age was applied a conservative error, meaning that it was as large as possible without causing stratigraphic inversion with respect to the bounding ages.
3.3 Stable isotope ratios
A total of 1510 stable isotope analyses were performed on calcite samples milled from the central axis of each stalagmite. After milling, powders were weighed (∼200 µg) and transferred to reaction vessels that were flushed with ultrapure helium. Samples were then digested using > 100 % H3PO4 and equilibrated overnight (∼16 h) at 34 ∘C before being analyzed. Isotopic ratios were measured using a GasBench II with a CombiPal autosampler coupled to a Thermo Finnigan Delta Plus XL mass spectrometer at Iowa State University. A combination of internal and external standards was run after every fifth sample, as well as before and after each batch, in order to ensure reproducibility. Oxygen and carbon isotope ratios are presented in parts per mil (‰) relative to the Vienna Pee Dee Belemnite carbonate standard (VPDB). Average precision for both δ13C and δ18O analyses is better than ±0.1 ‰ (1σ).
For isotopic analyses of soil organic matter and vegetation collected from above the caves, samples were dried, crushed, and transferred to tin boats. Carbon isotopic ratios were measured using a Thermo Finnegan Delta Plus XL mass spectrometer in continuous-flow mode coupled with a Costech elemental analyzer. Caffeine (IAEA-600), cellulose (IAEA-CH-3), and acetanilide (laboratory standard) isotopic standards yielded an average analytical uncertainty for carbon of ±0.09 ‰ 1σ (VPDB). Drip water samples were measured using a Picarro L2130-i isotopic liquid water analyzer, with autosampler and ChemCorrect software. Each sample was measured six times, with only the last three injections used to determine isotopic values in order to minimize memory effects. Three reference standards (VSMOW, IAEA-OH-2, IAEA-OH-3) were used for regression-based isotopic corrections and to assign the data to the appropriate isotopic scale. Reference standards were measured at least once every five samples. The average analytical uncertainty for δ18O measurements was ±0.1 ‰ 1σ (VSMOW).
Figure 6BG and GCL stalagmites and U∕Th ages. Red lines denote stable isotope sampling transects. Blue and white scale bars (cm) define differential enlargement of each stalagmite. Black arrows represent intervals excluded from this study due to evidence of open system behavior. Sections without arrows or transect lines are older than the interval examined in this study. The impact of recrystallization in stalagmite cores was assessed by parallel sampling transects (parallel red lines on BG66 and GCL6) and demonstrated consistent stable isotopic values and trends (Fig. S7).
3.4 Stalagmite mineralogy and fabrics
The calcite comprising the BG samples ranges across a variety of fabrics including a faster-growing, white, fibrous form and a slower-growing, dense, clear structure (Fig. 6; Fig. S2). In some samples, sharp changes between the two forms within the same growth horizons mark intervals of recrystallization during which U∕Th ages are highly inconsistent, and these intervals were excluded from our data set. BG6LR, which grew discontinuously over much of the last glacial cycle, suffered from alteration of early and middle Holocene material, which was therefore excluded from this analysis. BG67 is characterized primarily by fibrous calcite that has been recrystallized to clear, dense calcite in a narrow band descending through its core. U∕Th dates from the fibrous calcite on the margins of the growth surface reveal open system behavior and thus this portion of BG67 was excluded. Recrystallization is evident in portions of GCL6 (particularly just above its base) and BG66 but the consistency of U∕Th dates and the trends in stable isotopes suggest that this alteration may have occurred soon after original deposition. We tested whether these altered sections retain reliable paleoclimatic information by analyzing stable isotopes along partial transects located just outside the zones of recrystallization (Fig. 6). Because stable isotopic values and trends between these transects were consistent (within the analytical errors), we retained these sections in the time series. Growth position changed at numerous times in several of these stalagmites, and our sampling strategy accounted for these changes so as to consistently collect samples for stable isotopic analysis from the top surface (cap) of each stalagmite rather than the margins.
4.1 Environmental monitoring
Temperature and relative humidity collected inside both caves document environmental conditions over a multiyear period. Relative humidity remained largely stable at ∼100 % in both caves. Temperatures, while different at the two sites, exhibited similar seasonal variability that approximates the mean average temperature of the region (14.2±0.4 ∘C at BG and 16.2±0.3 ∘C at GCL for August 2012–January 2018) (Fig. 7).

Figure 7Temperature and relative humidity variations from (a) Buraca Gloriosa and (b) GCL. Drip rate from Buraca Gloriosa and precipitation variability (c) from Monte Real, Portugal (35 km from BG). Temperature sensor in GCL was changed in November 2014 and the sensitivity of the new instrument varies slightly from the original.
Drip water was collected at BG both over the course of minutes during site visits on four separate occasions (November 2014, October 2015, March 2016, January 2018) and as months-long integrated samples. A total of 25 drip water samples were analyzed for stable isotopic values. Drip water δ18O values range from −2.4 ‰ to −4.6 ‰ , with a mean of ‰ (Supplement Table S1), although as the timing of site visits varied, this value clearly is impacted by seasonal controls on precipitation (and thus infiltration) oxygen isotope values. Drip rates were measured for much of the period spanning June 2014 to January 2018 (for a total of ∼36 months) and exhibit seasonal variations tied to the winter wet and summer dry seasons, as well as individual rain events (Fig. 7).
4.2 U–Th dates and age models
234U–230Th dating of BG and GCL stalagmites reveals growth across approximately three-quarters of the last 220 ka, with periods of deposition interrupted by numerous hiatuses of varying length, with the longest gaps from 160–147, 97–87, 72–60, 41–36, 32–30, and 17–15 ka (Figs. 5 and 6; Fig. S3). These features, coupled with repeated changes in growth direction and high 232Th abundances in select sections, complicate construction of a chronology in some intervals. Macroscopic petrographic discontinuities suggest the presence of several short-lived hiatuses, but these were included as gaps in the age models only where U∕Th dates reveal an identifiable temporal offset. For example, the marine isotope stage (MIS) 6–5e boundary recorded by stalagmite BG67 is marked by both a change in drip position and a sharp transition from dense, clear calcite to a white, fibrous form. Taken together, it is clear that a hiatus of some duration occurred at this time. However, these isotope data are presented as being uninterrupted given the continuity of δ18O values and no U∕Th evidence for a long-lived hiatus (Fig. 6).
4.3 Assessing equilibrium in speleothem 18O and 13C values
We used two approaches to assess the fidelity of BG–GCL carbon and oxygen isotopes as records of past environmental variability. First, Hendy tests, in which stalagmite isotopic ratios must satisfy two criteria in order to be considered as having crystallized near isotopic equilibrium with cave drip water (Hendy, 1971), were performed for each stalagmite. The first half of the Hendy test involves analysis of multiple isotopic analyses performed on samples drilled at increasing distance from the central growth axis along the same series of growth layers. The conceptual justification for this approach is that drip water, and thus speleothem calcite, 18O values should remain constant down the stalagmite flanks because 16O preferentially lost to CO2 outgassing is replenished by CO2 hydration and hydroxylation reactions. Progressive 18O enrichment associated with kinetic effects tied to Rayleigh distillation suggests isotopic disequilibrium. No such consistent trends toward elevated oxygen isotopic ratios are found (Fig. 8), and thus the BG and GCL stalagmites appear to satisfy the first criterion of the Hendy test.
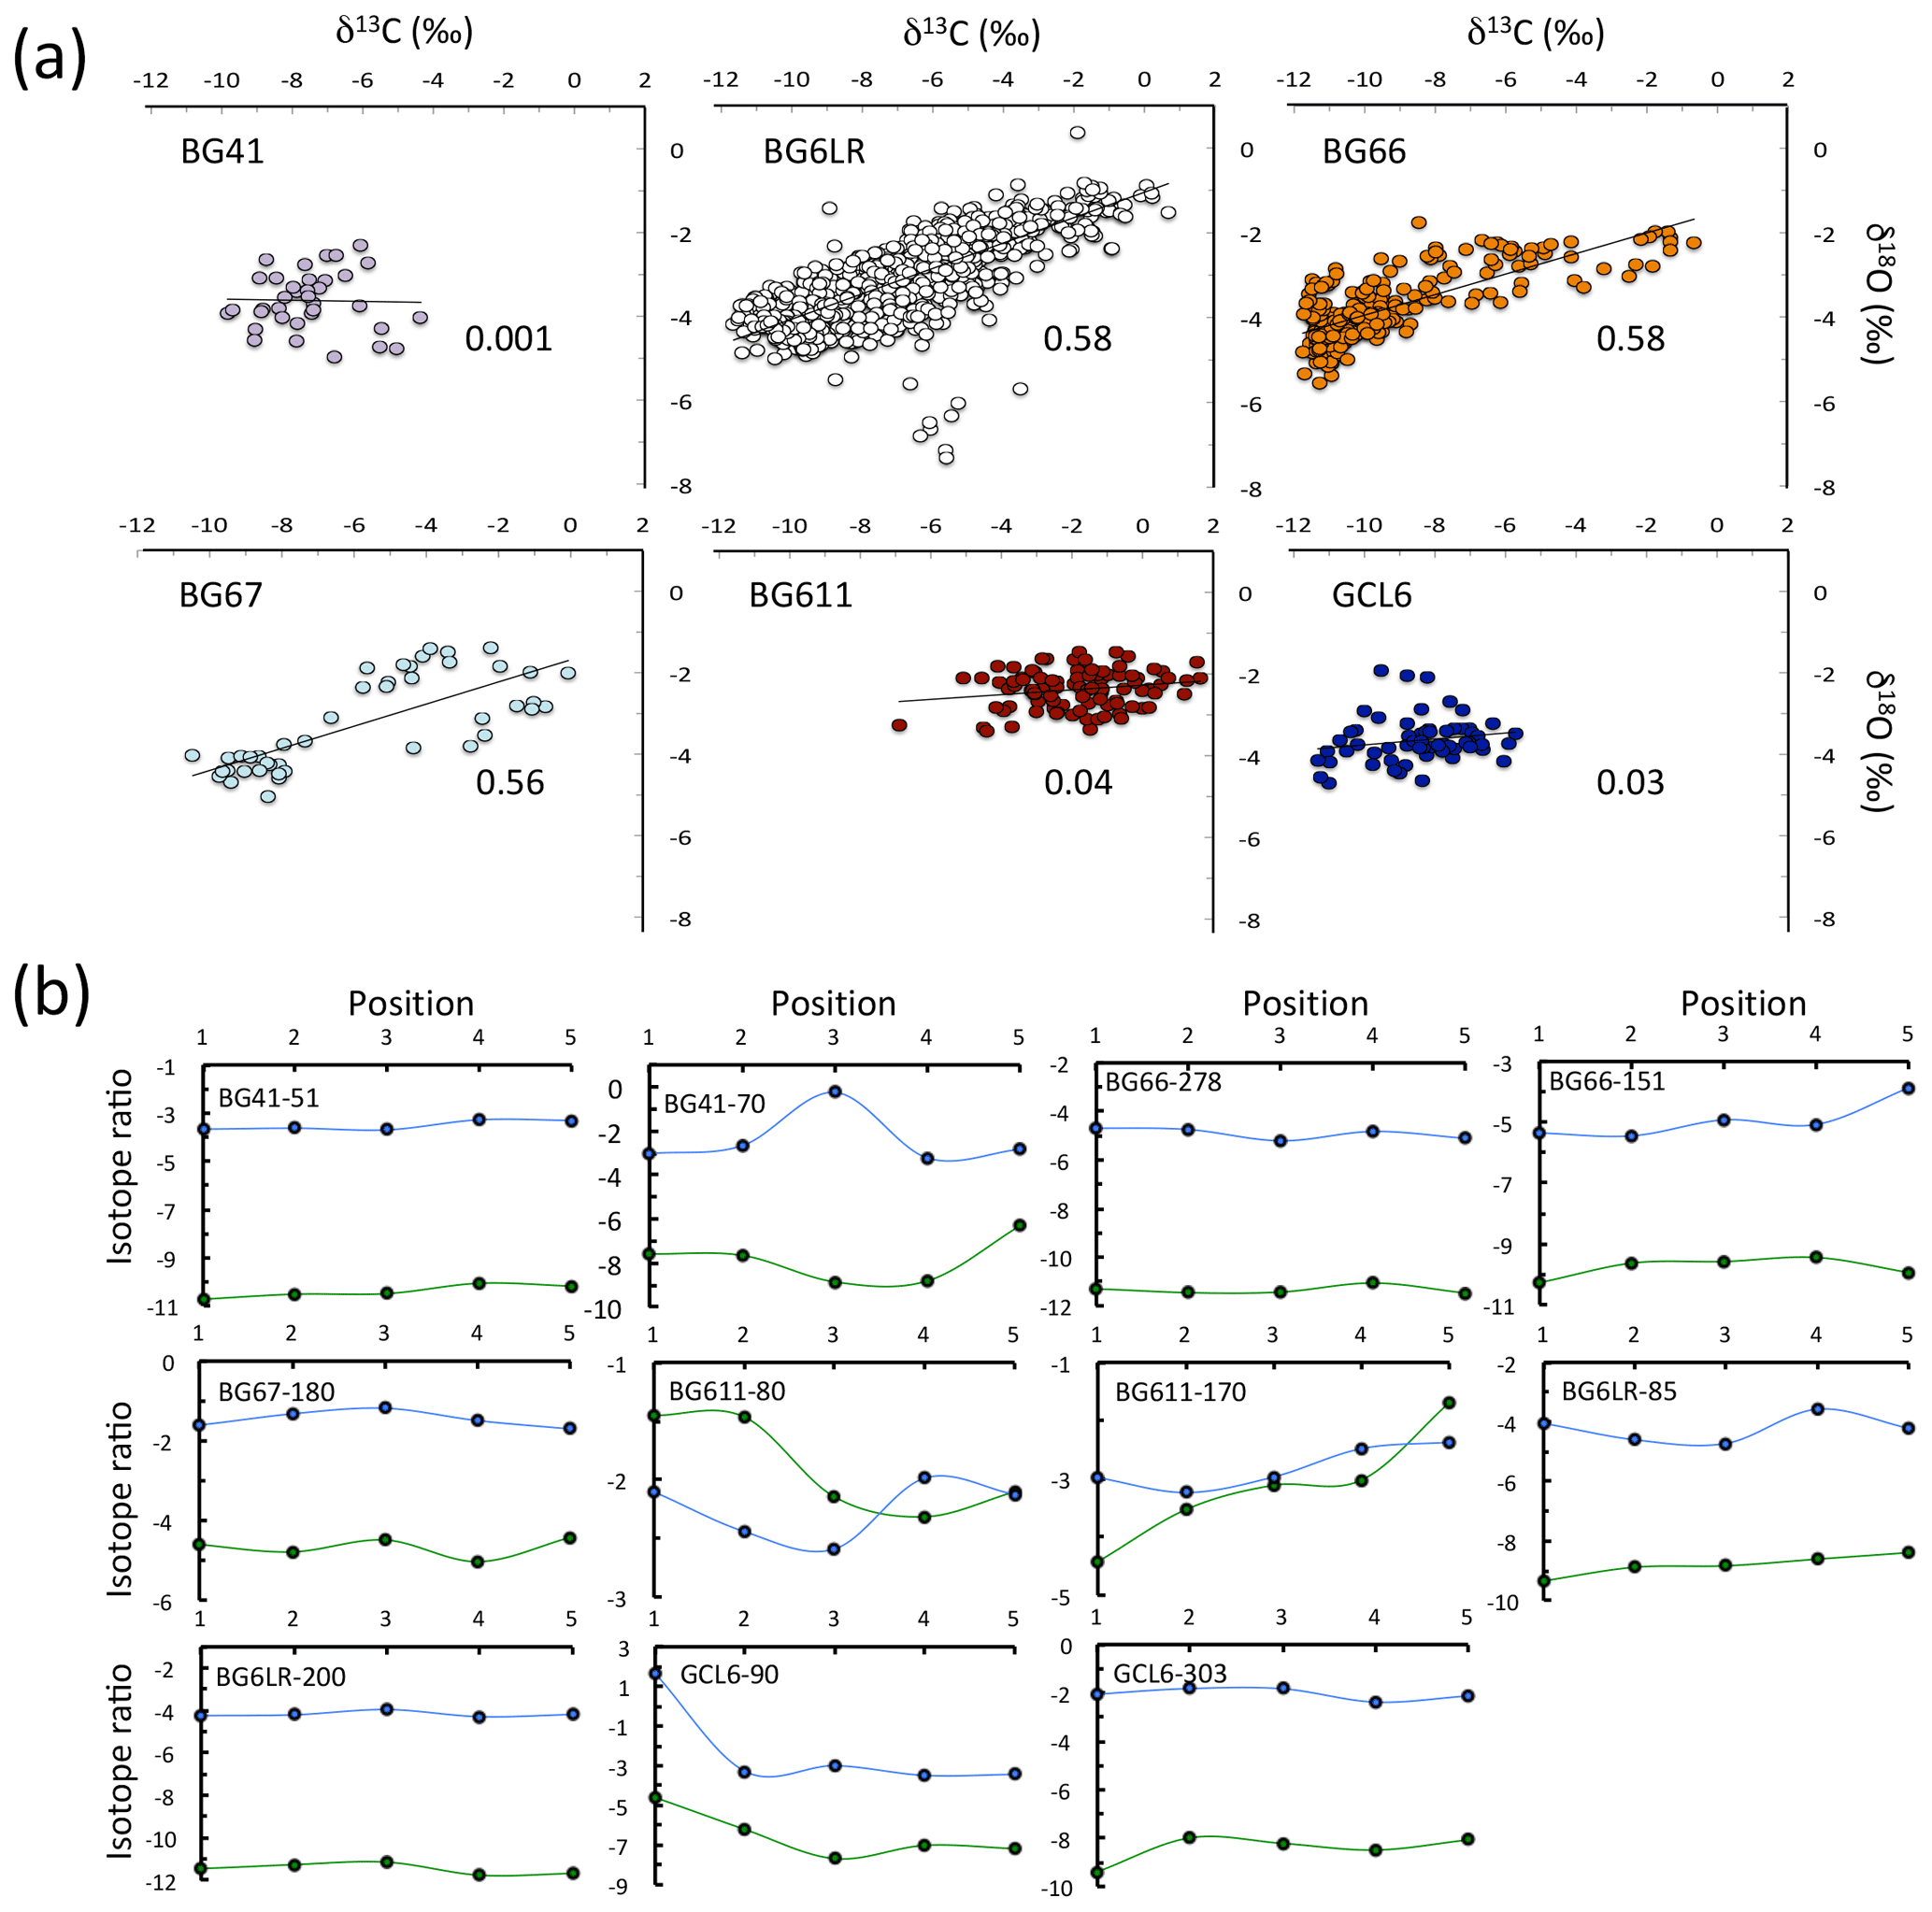
Figure 8Hendy tests of BG and GCL stalagmites. (a) Covariance plots of carbon and oxygen isotopic ratios. Correlation coefficients (r2 values) are listed for each plot. High positive correlations have been identified as an indicator of nonequilibrium crystallization. (b) Oxygen (blue) and carbon (green) isotopic variations along the same growth layers with distance (listed in the upper left corner of each panel) from the stalagmite central growth axis. Progressive increases in δ18O values have been interpreted to reflect disequilibrium crystallization. Limitations of the Hendy tests are discussed in the text.
The second portion of the Hendy test is based on the degree of covariation of carbon and oxygen isotopic ratios. Oxygen isotopic ratios of speleothem calcite reflect those of infiltrating fluids, which are generally close to the 18O values of meteoric precipitation, and in many locations are linked to climate (air temperature, moisture source, seasonality of precipitation, or rainfall amount; Lachniet, 2009). Interpreting changes in oxygen isotope composition at BG and GCL during intervals of profound climatic change such as the last glacial period is complicated by the multiple factors that influenced δ18O values of precipitation at these sites, including shifts in moisture source. The potential exists for rainfall in Iberia to be derived from atmospheric moisture sources that change on synoptic and seasonal scales (Moreno et al., 2014; Gimeno et al., 2010, 2012) as well as in response to changing glacial boundary conditions (Florineth and Schlüchter, 2000; Kuhlemann et al., 2008; Luetscher et al., 2016). In addition, strong but opposite correlations exist in modern precipitation between rainwater δ18O values and (i) the regional air temperature () and (ii) rainfall amount (), both of which are related to the strong seasonality of precipitation associated with Meso-Mediterranean climates (IPMA, 2016).
Correlations between carbon and oxygen isotope ratios are presented in Fig. 8. Three stalagmites – BG6LR, BG66, and BG67 – show strong correlations between 13C and 18O (r2=0.6), while the other three samples lack a strong correlation. If one considers the second criterion of the Hendy test, the nature of equilibrium crystallization in stalagmites BG6LR, BG66, and BG67 would be considered suspect. It must be noted, however, that the reliability of the Hendy test has been questioned because (1) equilibrium may be maintained in some portions of a stalagmite but not others, (2) growth layers thin progressively down the sides of the stalagmite, making it difficult to restrict samples to the same material, and (3) equilibrium covariation of carbon and oxygen isotope ratios may be the direct or indirect result of climatic variability (Dorale and Liu, 2009; Lechleitner et al., 2017). We therefore interpret both isotope ratios and their covariation as environmental signals.
4.4 Hydroclimate proxies
4.4.1 Carbon isotopes
Interpreting speleothem δ13C variability in a climatic context requires understanding, or at least constraining, the origins of these isotopic shifts. Stalagmite δ13C values reflect two primary inputs: CO2 derived from the atmosphere and/or soil zone and bicarbonate derived from the dissolution of bedrock carbonate. Speleothem 13C values reflect the type (C3 vs. C4) and density of vegetation over the cave, both of which are impacted by changes in air temperature and/or precipitation. The average δ13C value of biogenic CO2 in the soil zone is tied to the ratio of plants utilizing the C3 (average δ13C −26 ‰) versus C4 (average δ13C −14 ‰) photosynthetic pathways (Deines, 1980; von Fischer et al., 2008). Similarly, vegetation density and soil respiration rates over the cave impact the relative contribution of atmospheric CO2 (preindustrial δ13C −6 ‰ to −7 ‰; Francey et al., 1999) compared to soil-derived CO2 (Hellstrom and McCulloch, 2000; Genty et al., 2003). Phanerozoic bedrock δ13C values range from −4 ‰ to +8 ‰ (Saltzman and Thomas, 2012), but these values are static and do not contribute to temporal variability in stalagmite carbon isotopic ratios.
Superimposed on these inputs are secondary effects capable of influencing the δ13C values of drip water in the epikarst or cave. When voids in the bedrock are not fully saturated, CO2 degassing from infiltrated water may occur in the epikarst. This preferential loss of 12CO2 (that may result in crystallization of calcium carbonate – so-called prior calcite precipitation) enriches the residual solution in 13C, a signal that can be transferred into underlying stalagmites (Baker et al., 1997). Once the solution enters the cave, equilibrium fractionation between dissolved carbon species may be disrupted owing to issues surrounding CO2 degassing under low-drip-rate conditions (Breitenbach et al., 2015) or by disequilibrium processes occurring during carbonate crystallization (Mickler et al., 2004; Fairchild et al., 2006). Importantly, δ13C values reflect local infiltration rather than (pan-)regional atmospheric conditions as in the case of δ18O. This difference between the two proxies offers the opportunity to investigate environmental changes at different spatial scales.
Terrestrial deposits preserving pollen spectra spanning substantial portions of the last glacial cycle from western Iberia are rare (Gómez-Orellana et al., 2008; Fletcher et al., 2010; Moreno et al., 2012), and thus pollen in marine sediments represents a particularly important continental climate record. Pollen samples obtained from the Iberian margin contain small percentages of Poaceae, the family including the majority of C4 plants, demonstrating a persistent and overwhelming majority of C3 (largely shrub and arboreal) vegetation throughout the last glacial cycle, including between Greenland stadials (GS) and interstadials (GI) and across Heinrich stadials (HS) (d'Errico and Sánchez Goñi, 2003; Tzedakis et al., 2004; Desprat et al., 2006; Sánchez Goñi et al., 2008, 2013; Margari et al., 2014). In the absence of changes in vegetation type, shifts in the source of carbon found in cave drip water therefore likely originated with the density of vegetation and/or soil respiration rates (Genty et al., 2003). Decreases in these values are generally associated with decreases in temperature and/or increases in aridity, such as have been inferred from Iberian pollen spectra to characterize Iberia during GS, HS, and glacial maxima (Sánchez Goñi et al., 2008; Margari et al., 2014). Complementing these effects are increases in the contribution of bedrock carbon, as well as prior calcite precipitation, reflecting a combination of longer residence times of infiltrating solutions and desaturation of voids in the epikarst above the cave, both of which are consistent with more arid climates (Baker et al., 1997; Genty et al., 2003). Thus, we interpret the carbon isotopic values of the BG–GCL record as primarily a local (hydro)climate proxy, with higher δ13C values indicative of a cooler, drier climate. Integrating the GCL6 δ13C record into the BG time series is complicated by the slightly different bedrock δ13C values of the host rocks (Table S1) and what may have been distinct vegetation types and cave hydrologies at each cave when GCL6 was being deposited (187–160 ka). However, similar δ13C values during their period of overlap (187–185 ka) suggests that the two records can be consolidated (see below).
A test of equilibrium crystallization in the modern system can be constructed by comparing modeled stalagmite isotopic values to recently deposited calcite. The carbon isotopic composition of speleothem calcite is the result of a complex series of reactions that have been addressed in a number of studies (Hendy, 1971; Mühlinghaus et al., 2007; Dreybodt, 2008). For 13C in BG stalagmites, we use the equations of Li et al. (2014), which factor in the two primary sources of carbon (soil CO2 and bedrock carbonate), the proportion of carbon derived from each source, and temperature-induced fractionation of carbon isotopes between dissolved carbon species:
where f1 is the fraction of bicarbonate from limestone (ls), and T is temperature (∘K).
We assume the most straightforward and simple situation: the system remains closed to soil CO2 after entering the epikarst, and bedrock carbonate contributes 50 % of carbon to drip water bicarbonate (f1=0.5). We apply the average cave temperature of 14.4 ∘C and the measured 13C values of BG bedrock and the overlying vegetation–soil of ‰ and ‰, respectively. This approach, while certainly overly simplified for the BG cave system, yields modeled stalagmite δ13C values averaging ‰, similar to calcite crystallized on two glass slides installed at the site of two actively growing stalagmites in the loft area of BG, which yielded δ13C values of ‰ .
4.4.2 Oxygen isotopes
The origins of BG and GCL isotopic variability appear more complex for oxygen than for carbon. Like δ13C values, local δ18O minima mark interstadials and interglacials. Analysis of modern precipitation data reveals equally strong, albeit inverse, correlations between precipitation δ18O and both amount () and air temperature () effects, likely owing to the dominance of cool season precipitation in annual water budgets (IAEA/WMO, 2016) (Fig. 2). Based on these relationships, it remains possible that changes in air temperature, overall precipitation, and/or precipitation seasonality could impact the δ18O values of effective moisture. That air temperature is likely not a prominent driver of stalagmite oxygen isotopic variability is supported by two observations, however. First, the slopes of the air temperature–δ18O relationships (‰ ∘C−1) at the three GNIP stations located closest to BG and GCL (Porto, Vila Real, and Portalegre) are nearly identical (average for the three sites 0.25±0.03 ‰ ∘C−1) but opposite in sign to the calcite–water temperature dependence of oxygen isotopic fractionation (−0.2 ‰ ∘C−1) (Kim and O'Neil, 1997) (slopes of precipitation amount ∕ δ18O are −1.6, −3.5, and −3.7 ‰ 100 mm−1 month−1, respectively). In the simplest sense, therefore, a 1 ∘C increase in mean annual air temperature (and thus also cave temperature) would increase precipitation δ18O values by approximately the same amount that the water temperature effect would lower stalagmite calcite δ18O values. In this simplified scenario, the net effect is a stalagmite record that is negligibly influenced by multi-decadal- to centennial-scale temperature changes alone. Secondly, the observed shift toward lower stalagmite δ18O values during interstadials and interglacials, periods of elevated mean annual temperature, demonstrates that the observed positive correlation between precipitation δ18O and air temperature is not a dominant feature over millennial timescales. For example, the 3.5 ‰ decrease in δ18O values between MIS 6 and MIS 5e (136–128 ka) (Fig. 9) can only be partially accounted for by the ∼1 ‰ ice-volume-related decrease in North Atlantic surface water δ18O values (Schrag et al., 1996). Other factors, such as kinetics associated with humidity and wind speed at the point of evaporation (Grootes et al., 1993), temperature and source of atmospheric moisture (Herbert et al., 2001), and cloud evolutionary pathways (Rozanski and Araguás, 1995), also need to be considered but cannot account for the entirety of this shift. Because of the narrow continental shelf in central Portugal, the LGM shoreline was located close to the modern shoreline, thereby minimizing continental effects, and the magnitude of the impacts of wind speed and ocean temperature do not appear sufficient to account for the observed stalagmite δ18O variability. Thus, the decrease in stalagmite δ18O between the penultimate glacial and last interglacial suggests that stalagmite oxygen isotope ratios are primarily recording (pan-)regional hydroclimate rather than temperature. The origin of the anomalously low δ18O values during GI 1 (dated here from 14.5–13.9 ka) is unclear (unfortunately no other BG or GCL stalagmite also spans this interval) but reinforces this inverse relationship between mean annual temperature and stalagmite oxygen isotope ratios.
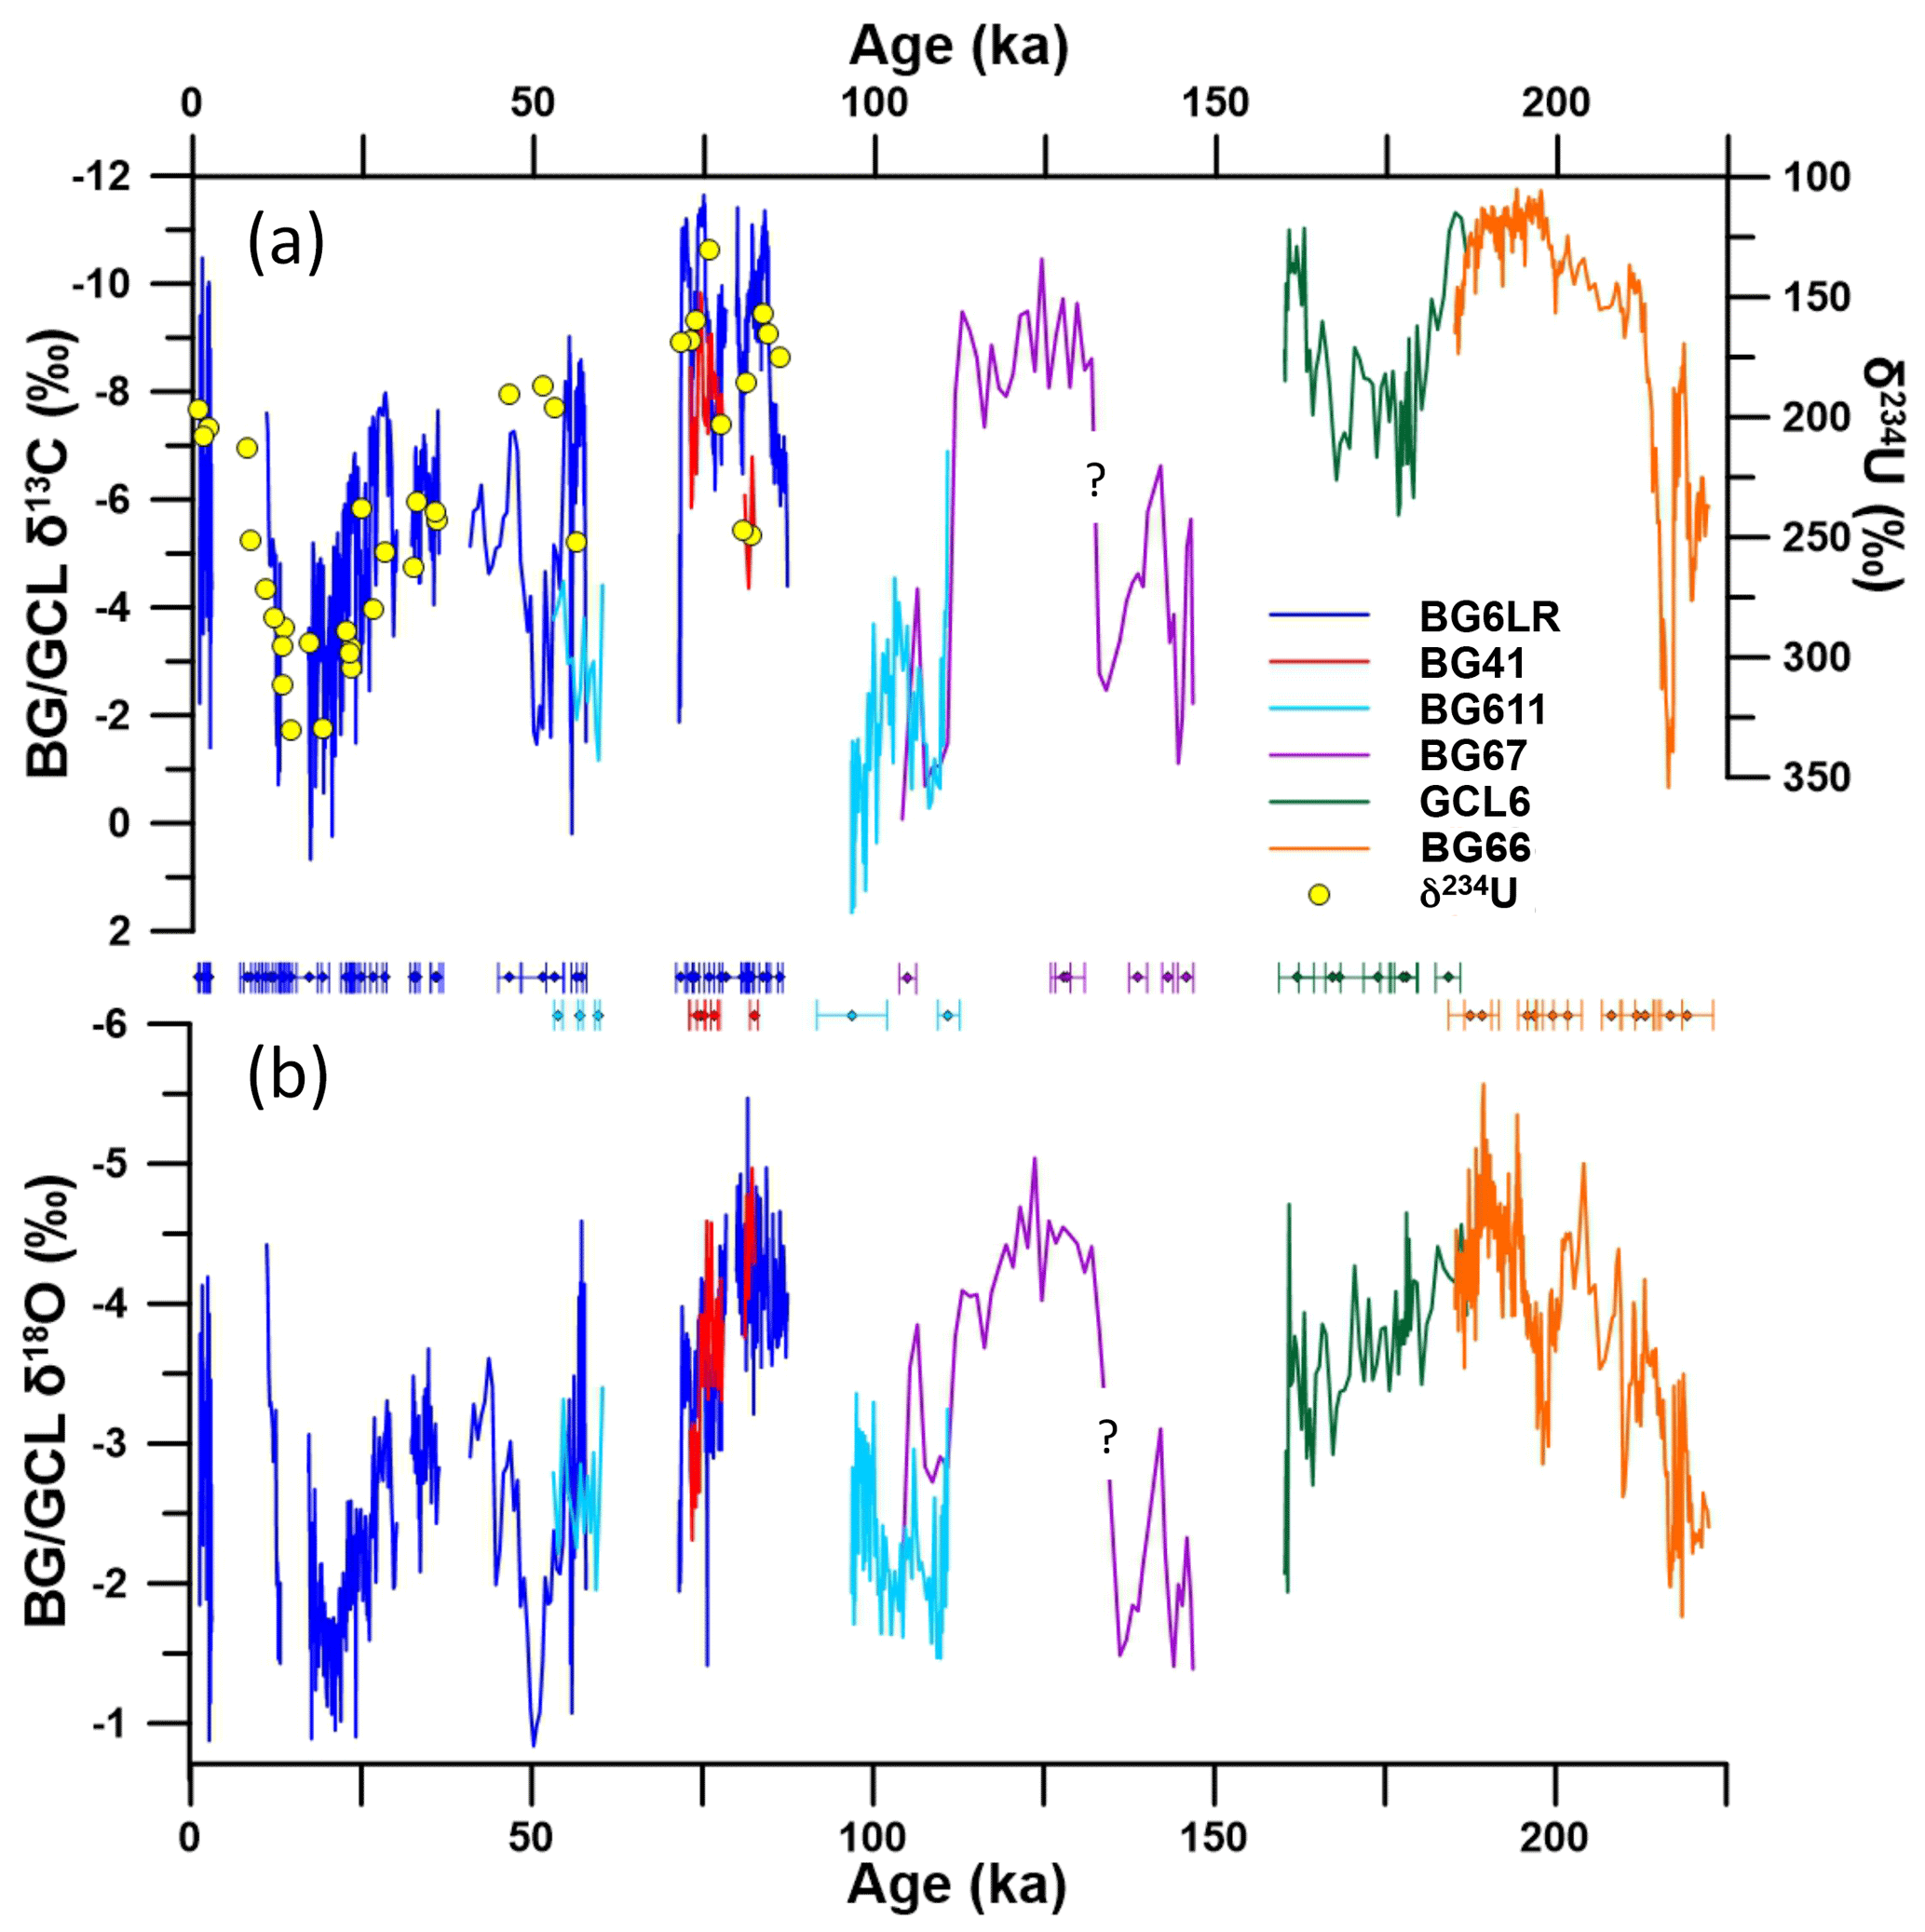
Figure 9BG–GCL stalagmite isotopic time series. Carbon (a) and oxygen (b) isotopes, with each stalagmite presented in a different color. δ234U values (yellow circles) for BG6LR are plotted against carbon isotope ratios (plots showing the δ234U and δ13C values of the other stalagmites are presented in the Supplement). U∕Th ages (with 2 SD errors) are also shown. The “?” at the MIS 6–5e transition denotes uncertainties associated with the continuity of this interval.
Speleothem oxygen isotopic ratios were modeled using the paleotemperature equation of Kim and O'Neil (1997), which requires measurements of water (cave) temperature and drip water δ18O values. The resulting δ18O model value of ‰ is nearly identical to the glass-plate-grown calcite value of ‰. It should be noted, however, that assessing equilibrium crystallization in modern calcite–drip-water pairs at BG is complicated by the low temporal resolution associated with integrated, months-long drip water samples, variable timing of drip water collecting trips, and any seasonal biases in calcite crystallization that at present remain poorly constrained.
Replication between stalagmites of similar age is arguably the single most reliable method for evaluating the impacts of climate versus secondary influences, including evaporation and kinetic effects (Denniston et al., 1999; Mickler et al., 2004), on stalagmite isotopic ratios (Dorale and Liu, 2009; Denniston et al., 2013). When presented as an integrated data set, the BG–GCL stalagmite carbon and oxygen isotopic time series spans the majority of the last 220 ka (Fig. 9), although stalagmites spanning the same periods of time are restricted to 187–185, 111–104, 83–81, 78–73, and 58–53 ka. Because these intervals are short and because the temporal resolution varies substantially between stalagmites, replication tests based on these intervals are of limited utility. However, within the age uncertainties, 18O and 13C values and trends are similar, suggesting that oxygen and carbon isotopic ratios track environmental, rather than drip-specific, variables. The three exceptions in which coeval samples do not replicate well are 13C values offset by 3 ‰ from 83–81 ka and by 4 ‰ from 58–53 ka and 18O values offset by 1 ‰ from 111–104 ka (Figs. 9, S4).
4.4.3 δ234U values
δ234U values (calculated as the difference between the age-corrected 234U∕238U ratio of a sample and the secular equilibrium 234U∕238U ratio) of speleothem carbonate have also been used as a proxy for paleoprecipitation (Hellstrom and McCulloch, 2000; Oster et al., 2012; Plagnes et al., 2002; Polyak et al., 2012; Zhou et al., 2005). 234U exists in the stalagmite crystalline lattice due to incorporation from cave drip water and through in situ production from the decay of 238U. Alpha recoil displaces 234U from its lattice position, increasing its susceptibility to leaching by infiltrating waters, meaning that 234U is selectively mobilized relative to 238U in cave drip water (Chabaux et al., 2003; Oster et al., 2012). The flux of infiltrating fluids is therefore tied to δ234U values of drip water, and thus stalagmite carbonate, such that decreases in effective precipitation and/or bedrock dissolution rate, both of which are tied to increased aridity, are associated with elevated speleothem δ234U values (Hellstrom and McCulloch, 2000; Plagnes et al., 2002; Polyak et al., 2012).
As differences in δ234U values between stalagmites may arise from distinct infiltration pathways (Zhou et al., 2005), complicating the integration of δ234U values from multiple stalagmites into a single cohesive data set, we restrict our analysis to stalagmite BG6LR, which represents the longest individual stalagmite record of the BG–GCL time series. While the number of δ234U measurements is small compared to stable isotopic values, the temporal density of the former is sufficient to demonstrate the utility of δ13C and δ18O values as paleohydroclimate proxies (Fig. 9). Decreased precipitation or effective moisture is associated with elevated stalagmite δ13C, δ18O, and δ234U values. The relationships between δ13C and δ234U values in all BG and GCL stalagmites are presented in Fig. S5.
The previously discussed tests for isotopic equilibrium, including the reproducibility of carbon and oxygen isotope ratios between coeval BG and GCL stalagmites, support the notion that their δ13C and δ18O values may be integrated into cohesive time series reflecting paleohydroclimatic conditions and used to assess links between continental climate and SST (Fig. 10). Over the last several glacial cycles, oceanographic conditions along the western Iberian margin varied at millennial and orbital timescales in close correlation with Greenland air temperature and North Atlantic conditions and circulation (Roucoux et al., 2005; Daniau et al., 2007; Sánchez Goñi et al., 2008; Darfeuil et al., 2016). Abrupt changes in SST reflect a balance between southward expansion of subpolar waters and northward migration of subtropical water masses (de Abreu et al., 2003). During the particularly cold conditions characterizing HS and GS, Iberian margin SST decreased by up to 9 ∘C (to as much as 13 ∘C below present values; de Abreu et al., 2003), with these changes helping to position the Arctic or subarctic front at ∼39∘ N, the same latitude as BG and GCL. These cold surface waters reduced the production and transport of atmospheric moisture to Iberia (Eynaud et al., 2009; Voelker and de Abreu, 2011) and would have thereby influenced the timing of speleothem growth and carbon and oxygen isotopic values in BG and GCL stalagmites. Indeed, the composite BG–GCL record documents coherence, at both orbital and millennial scales, between Portuguese hydroclimate, vegetation, and Iberian margin SST during the last two glacial cycles (Figs. 10 and 11). In an attempt to quantify this covariance, we binned the SST and stalagmite stable isotope data into century-long intervals. The relatively short record of BG41 was not included, and age models for stalagmites BG66 and GLC6 were increased by 4.0 kyr and 1.3 kyr, respectively, to improve correlation with the SST chronology. The resulting inverse correlation between SST and carbon and oxygen is strong ( and −0.52, respectively; p<0.0001) (Fig. S6).
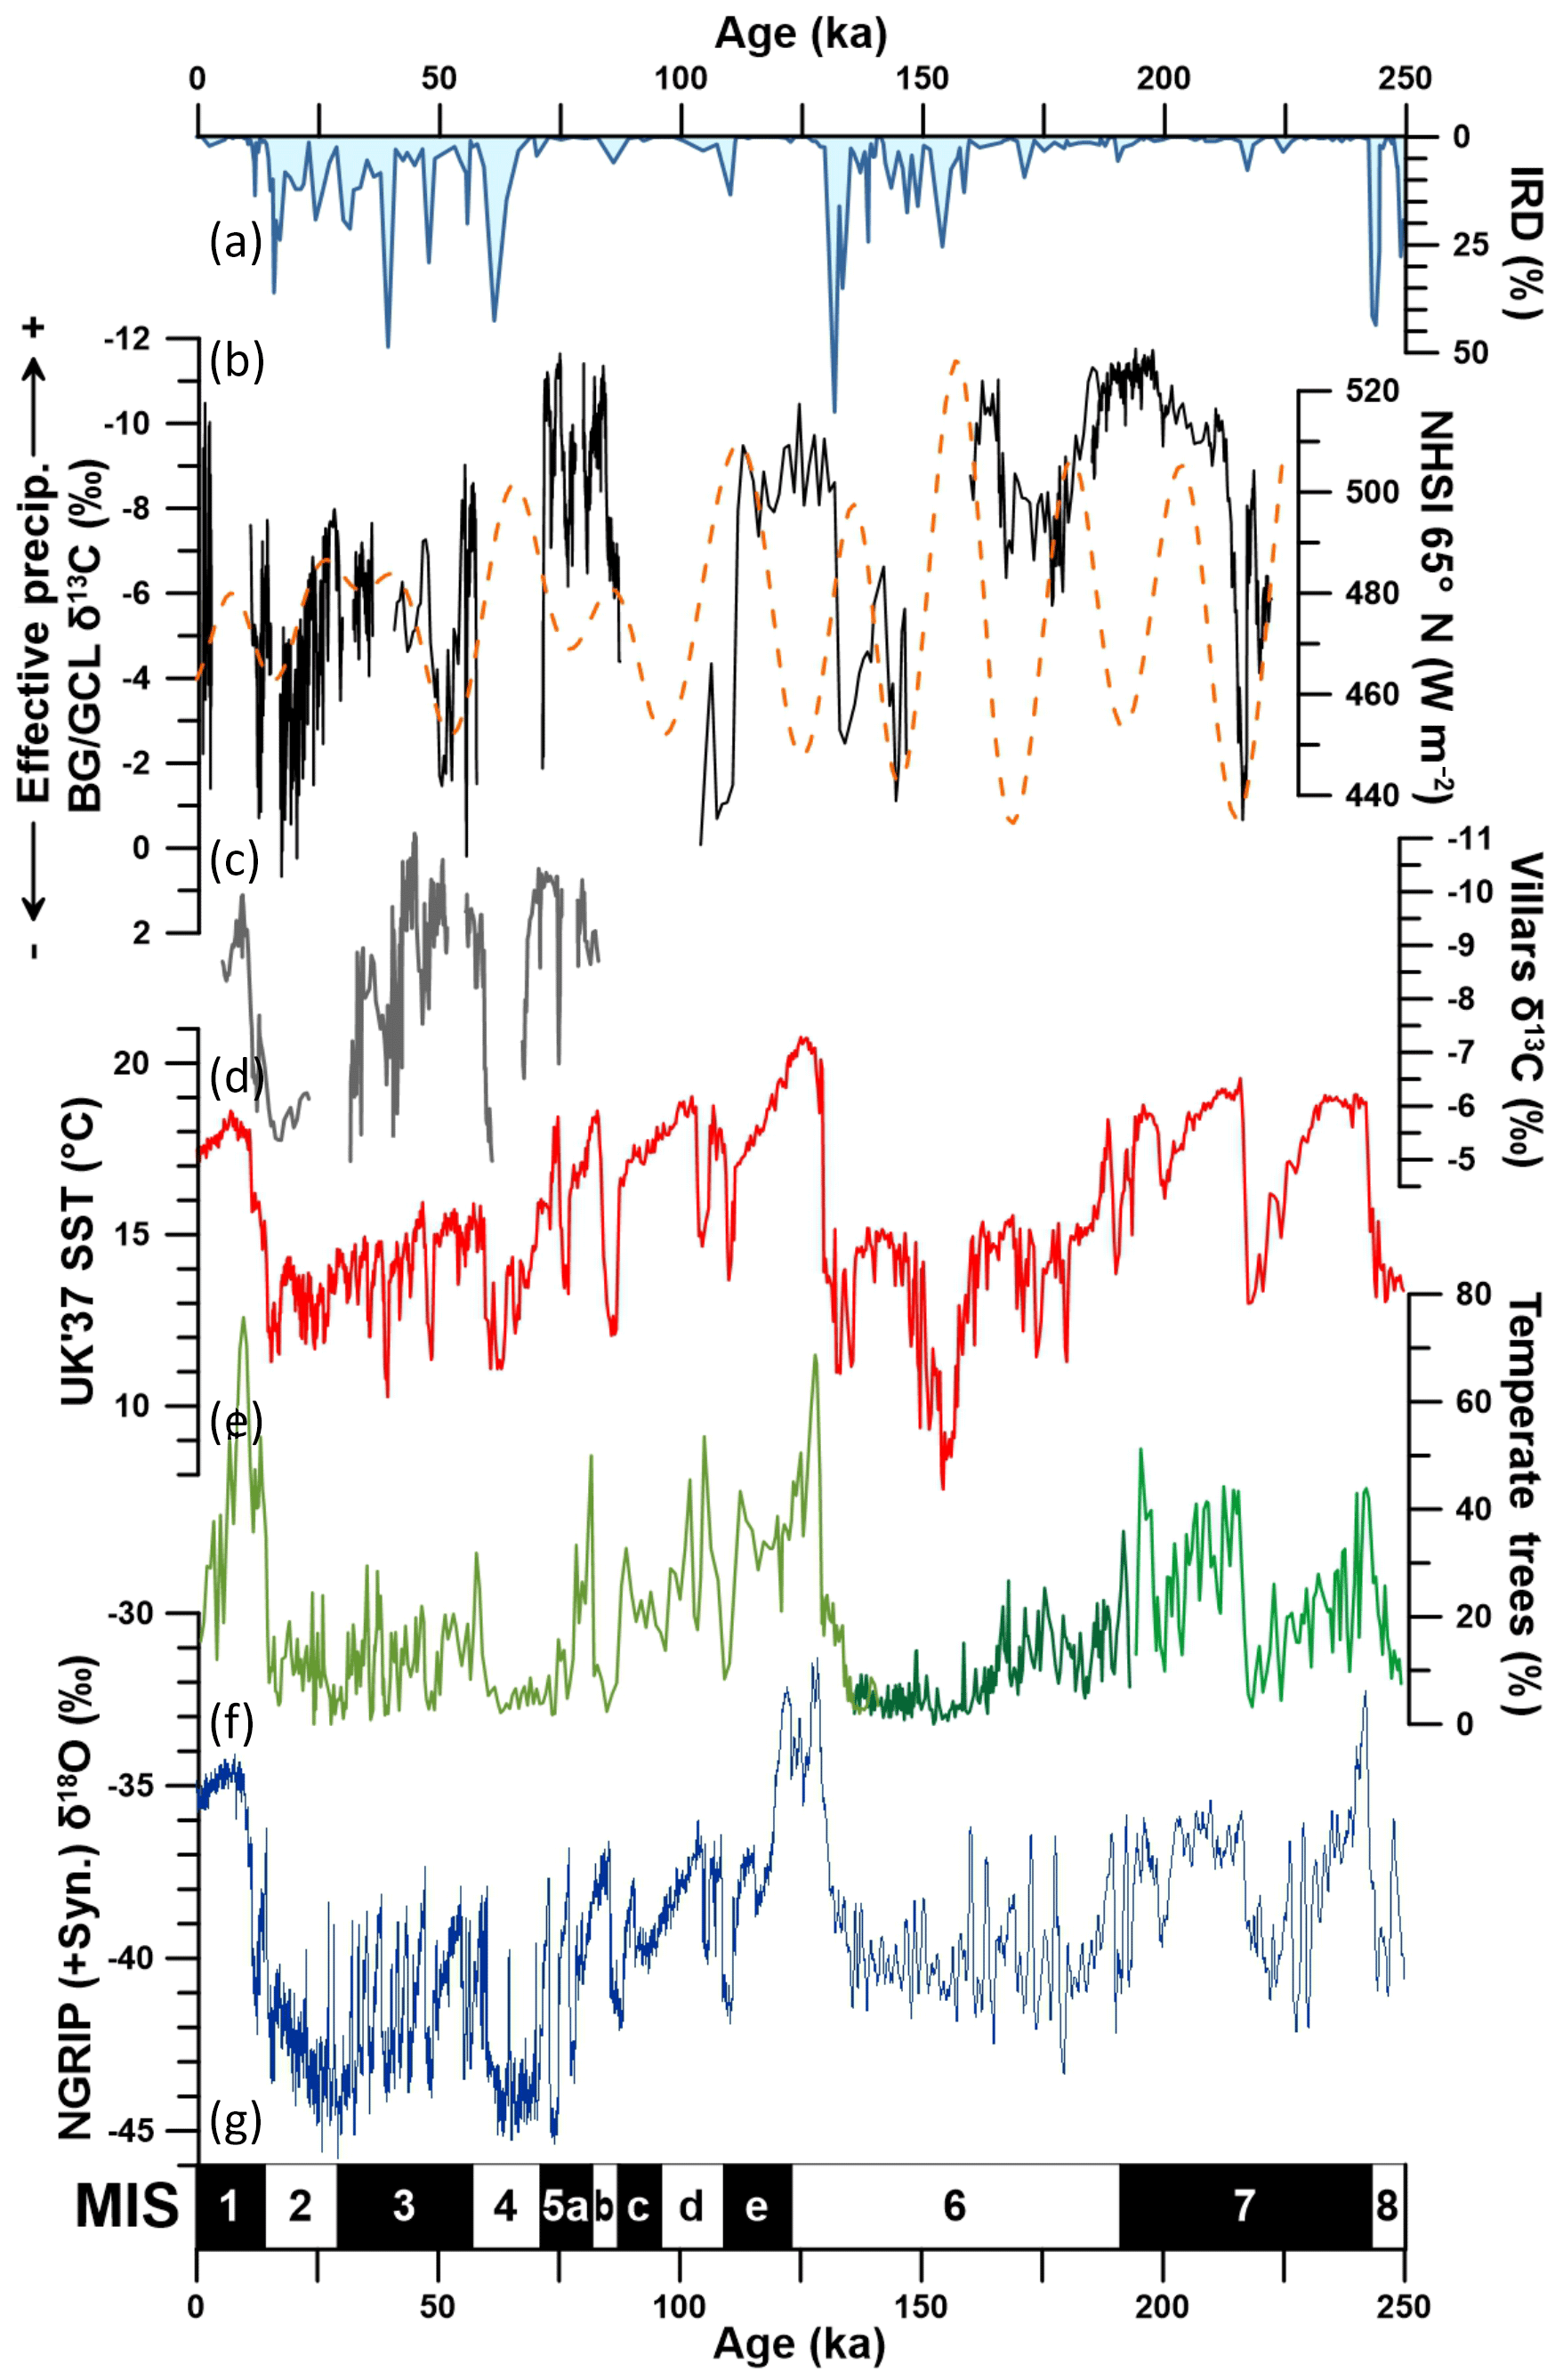
Figure 10Comparison of Portuguese stalagmite hydroclimate proxies with regional and global climate records from the last two glacial cycles. (a) Ice-rafted debris abundance from North Atlantic ODP Site 980 (McManus et al., 1999 using Hulu Cave timescale as presented in Barker et al., 2011); (b) composite BG–GCL stalagmite carbon isotopic time series with NH summer insolation (Berger an Loutre, 1991); (c) carbon isotopic time series from Villars Cave, southern France (Genty et al., 2003, 2006); (d) alkenone-based Iberian margin SST reconstruction (core MD01-2443; Martrat et al., 2007); (e) temperate forest pollen abundance from three closely spaced cores (MD01-2443, 250–194 ka, Roucoux et al, 2006, and Tzedakis et al., 2004; MD01-2444, 194–136 ka, Margari et al., 2010, 2014; MD95-2042, 136–1 ka, Sánchez Goñi et al., 2008, 2013); (f) NGRIP (0–122 ka) (North Greenland Ice Core Project members, 2004) and synthetic Greenland oxygen isotopic record (Barker et al., 2011); (g) marine isotope stages.
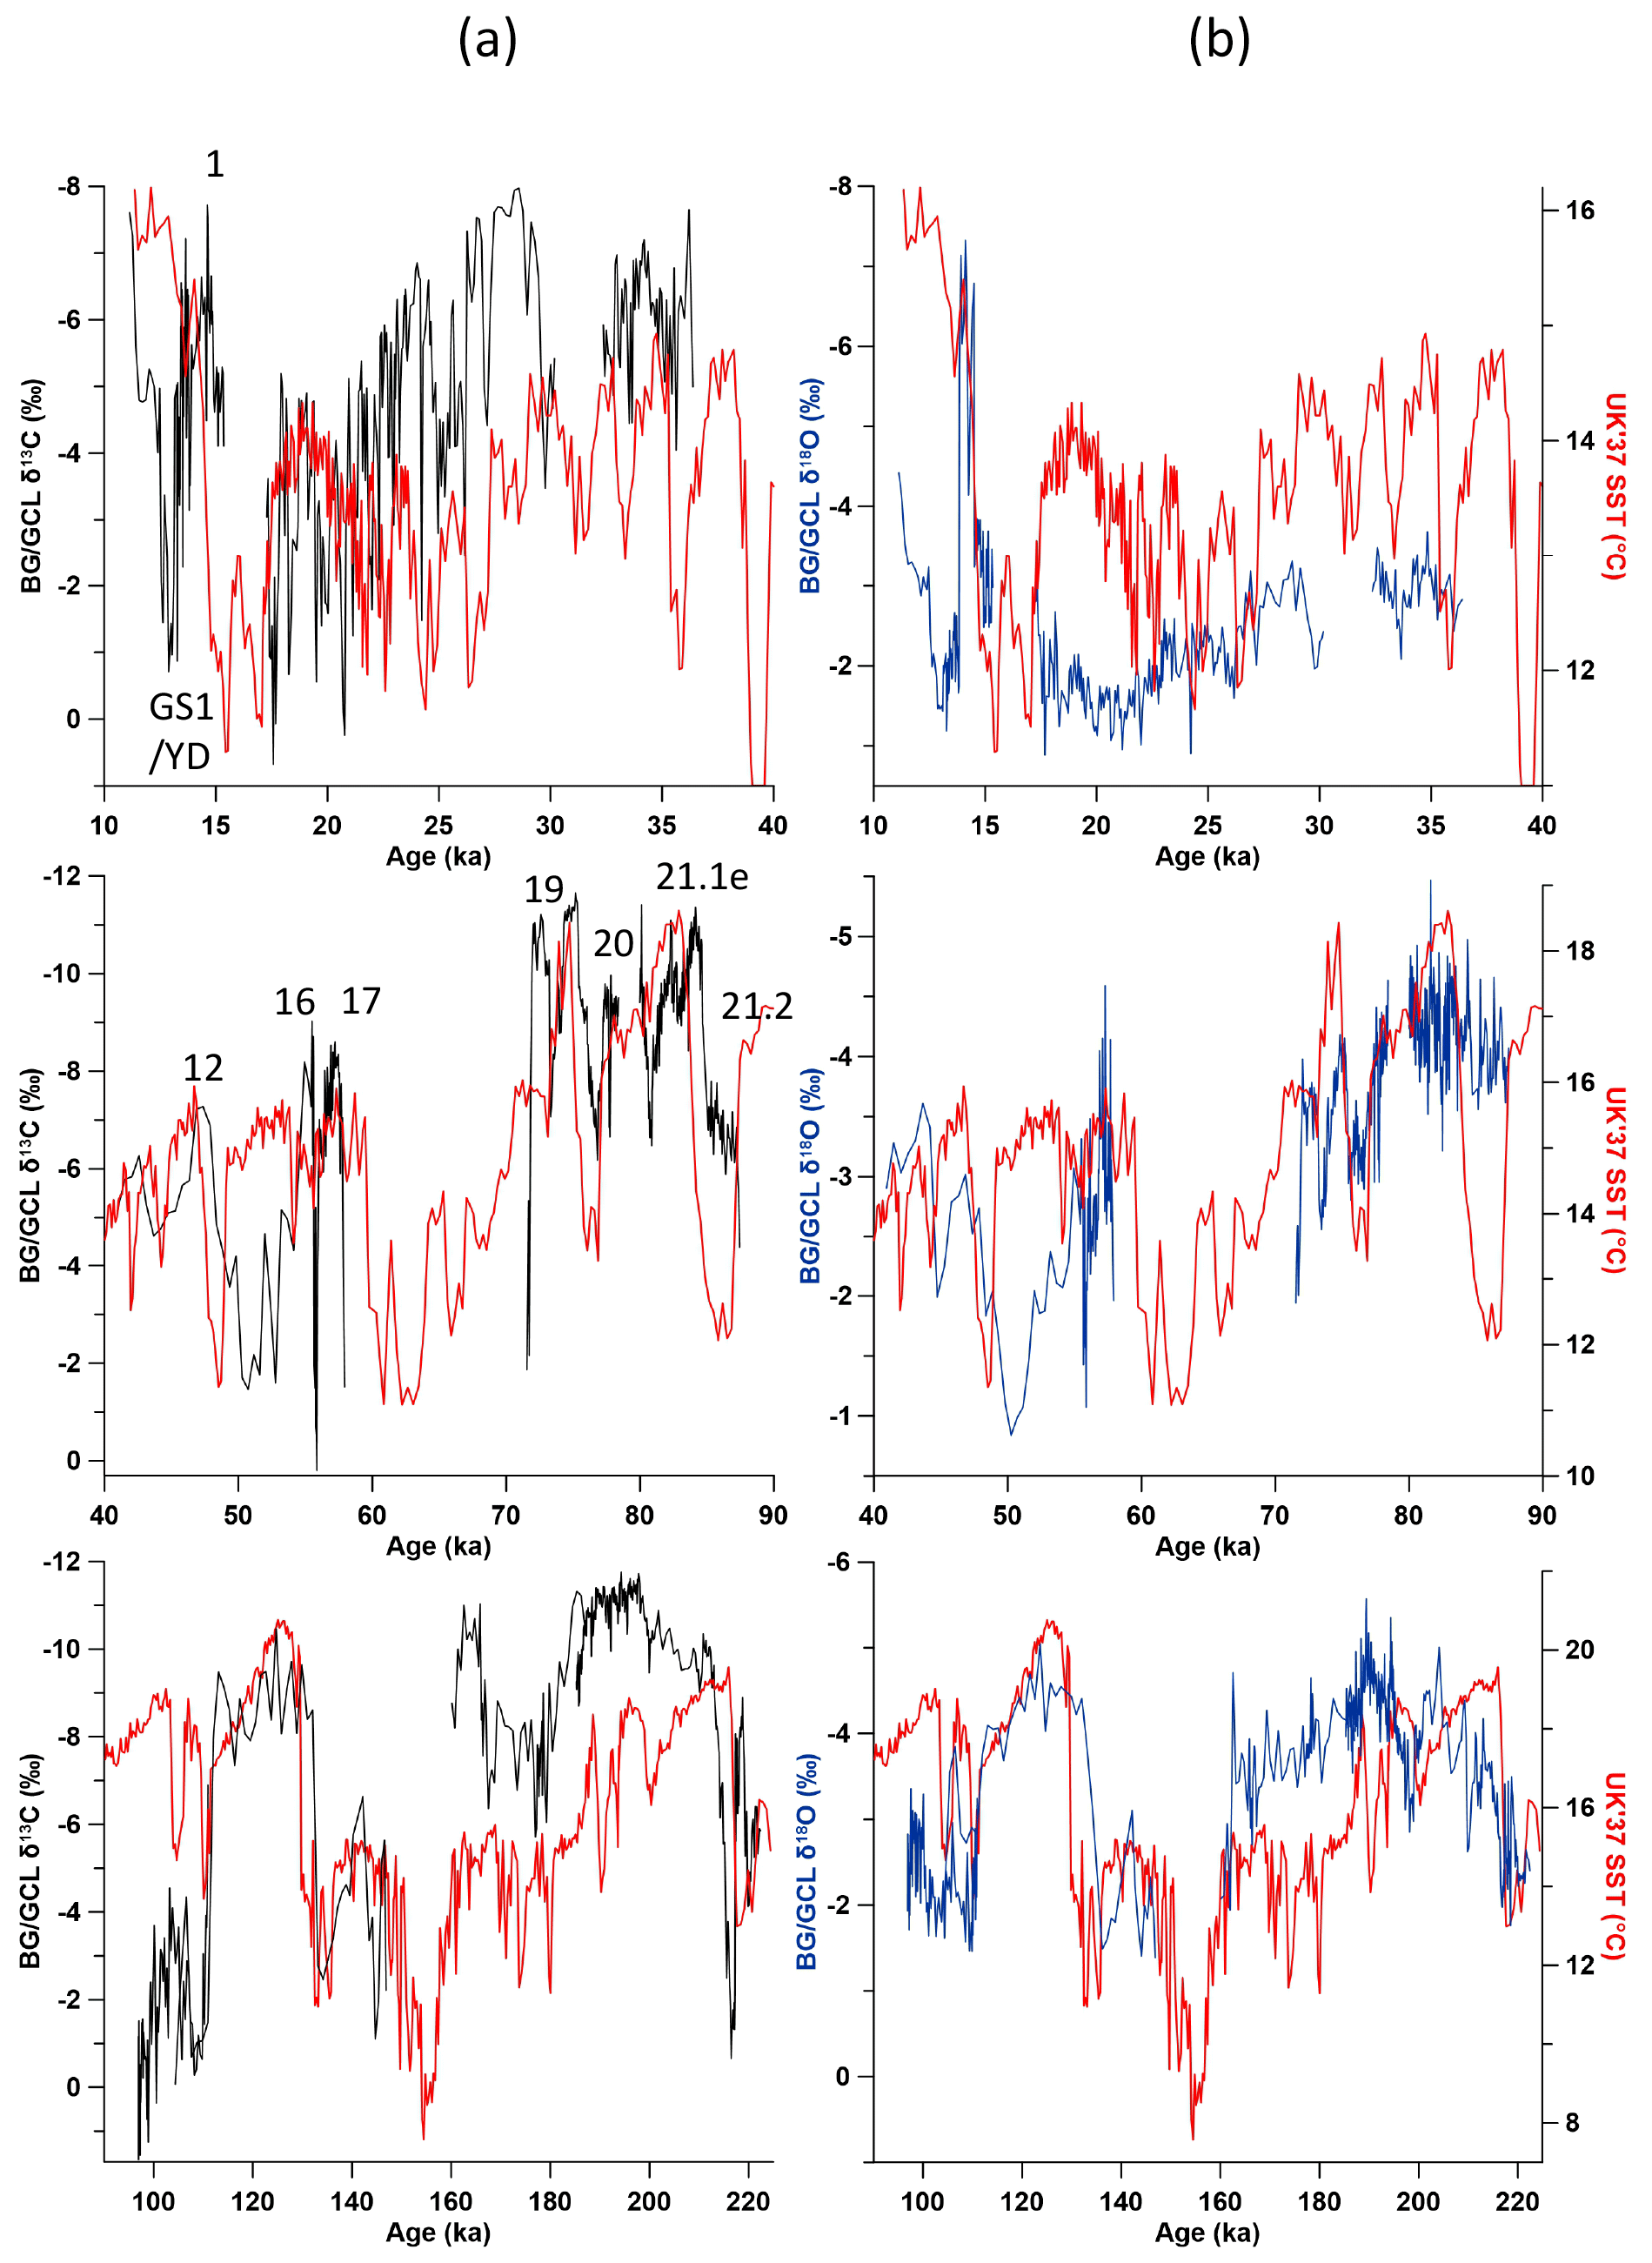
Figure 11Iberian margin SST (red) versus stalagmite carbon (black; a) and oxygen (blue; b) isotopes. Numbers denote select GI events using the stratigraphic nomenclature of Rasmussen et al. (2014).
5.1 Growth intervals
The single most fundamental prerequisite to speleothem deposition is infiltration of surface waters, and thus the timing of stalagmite growth can reflect changes in mean hydroclimatic state. Deposition of multiple BG stalagmites was punctuated by hiatuses spanning similar time intervals (although the precise ages of the onset and/or termination of the hiatuses are distinct), a relationship that suggests links to changes in hydroclimate rather than random drip-site-specific variability.
Hiatuses in some BG samples coincide with HS1, HS3, HS4, and HS6, and pollen spectra independently suggest increased aridity during HS and glacial maxima. Decreases in arboreal pollen abundance and concomitant increases in drought-tolerant vegetation coincide with periods of reduced SST. Vegetation patterns during maximal IRD deposition on the Iberian margin reveal not only dramatically reduced forest cover but also a pronounced expansion of semidesert plants (e.g., Sánchez Goñi et al., 2000; Roucoux et al., 2005; Naughton et al., 2009). These changes mark the long hiatus between HS7 and HS6 (71–59 ka), which overlaps some of the coldest SSTs of the last 70 ka as reconstructed using at core MD95-2042 (Darfeuil et al., 2016) (Figs. 10, 12). An absence of BG stalagmite deposition from ∼160–149 ka occurs at the same time as massive seasonal discharges from the Fleuve Manche (Channel River) and the coldest continental climates and SSTs (157–154 ka) of the last 220 ka, as determined from pollen and foraminifera from core MD01-2444 (Margari et al., 2014; Fig. 1).

Figure 12BG–GCL stalagmite carbon isotopic time series and Iberian margin SST. Light blue vertical rectangles denote North Atlantic cold events (some of which are labeled). Several interruptions in stalagmite growth coincide, within the errors of the stalagmite chronologies, with periods of depressed SST. Question mark at MIS 6–5e transition denotes visible hiatus not resolvable by U∕Th dates.
Whether hiatuses in BG speleothem deposition are a result of pronounced reductions in precipitation, an extension of below-freezing temperatures that limited infiltration (Vaks et al., 2013; Fankhauser et al., 2016), or variations in infiltration pathway–drip position is ambiguous. Pollen transfer functions from MD95-2042 suggest winter temperatures dropped below 0 ∘C during HS and annual precipitation was reduced by up to 50 % (from 800 to 500–400 mm during HS3, HS4, and HS5) (Sánchez Goñi et al., 2002). Applying this temperature reconstruction to western Portugal is complicated, however, by the broad area across which these pollen grains were sourced. Permafrost reconstructions (Vandenberghe et al., 2014) of Iberia argue against the hypothesis that continuous subzero temperatures inhibited infiltration and stalagmite growth. We thus suggest that the hiatuses observed at BG and GCL were driven largely by reductions in precipitation.
Other western European cave records also share similar growth histories. For example, stalagmites from Villars Cave, southwestern France (Genty et al., 2003, 2010; Wainer et al., 2011), and from multiple caves in northern Spain (Stoll et al., 2013) (Fig. 1) are also punctuated by hiatuses during HS. For example, at or near HS7, stalagmite hiatuses were formed at Villars Cave (78–76 ka), in northern Spain (∼75 ka), and BG (80–78 ka). No stalagmite deposition has been identified at BG from 71–60 ka or Villars cave from 67–62 ka, a period that includes HS6. Finally, HS1 is marked by a hiatus in northern Spain (18–15.5 ka) and at BG (17–15 ka). While the timing of these hiatuses is not identical and not all hiatuses at Villars Cave and the Spanish caves are coincident with those at BG, the substantial degree of overlap suggests a common origin. Stoll et al. (2013) noted that stalagmite deposition and/or elevated growth rates in northern Spain stalagmites occurred during periods of high Northern Hemisphere summer insolation or during GI, while hiatuses occurred during periods of low insolation and low SST (< 13.7 ∘C). The BG record supports the hypothesis that growth interruptions are related to SST controls on regional atmospheric moisture availability, although the impact of insolation is not clear.
5.2 BG–GCL stable isotopic and δ234U variability
Stalagmite δ13C and δ18O values covary with changes in SST at orbital timescales. The offset between interglacial and glacial isotopic values averages ∼3 ‰ for δ18O and ∼7 ‰ for δ13C values (Fig. 10). Stalagmite δ234U values also preserve these changes in aridity. Millennial-scale changes are also recorded in stalagmite carbon isotope ratios, with shifts of 3 ‰–7 ‰ associated with GI–GS transitions and oxygen isotopic changes of ∼1 ‰–2 ‰. The large swing in δ18O values during the transition from GI-1 to the Younger Dryas (YD) (∼5 ‰ from 14.0–13.5 ka) is anomalous. Given that the change in δ13C values at this time (6 ‰) is consistent with other GI transitions, the hydroclimatic implications of this interval require additional study. Similarly, oxygen and carbon isotopic variability is pronounced during the late Holocene portion of the BG record. The origin of this high variability is unclear. Replication of the Holocene portion of this record is currently underway and will help address this question (Thatcher et al., 2018).
Where growth is continuous during HS, the link between stalagmite isotopic variations and SST changes is clearly visible (Fig. 11). Prominent positive carbon isotopic excursions define the YD, HS2, HS5, HS6, and HS8, consistent with diminished concentrations of arboreal pollen in cores from the Iberian margin, and serve to document particularly cold and dry conditions at these times (Sánchez Goñi et al., 2000, 2008; Roucoux et al., 2006). Reduced stalagmite δ13C values mark periods of enhanced effective moisture from 170–160 and 145–135 ka, tracking peaks in temperate tree pollen and alkenone-based SST. The BG record reveals a pronounced increase in stalagmite δ13C values during the YD, at odds with the plateau in SST observed in some Portuguese coastal margin sediments at this time. However, a higher-resolution SST record reveals a pronounced drop in SST (Rodrigues et al., 2010), well matched with the BG isotopic profile and the stalagmite record from Villars Cave.
Hydroclimatic shifts associated with GS and GI are most clearly expressed during MIS 5a and 5b in the BG carbon isotope record (Fig. 11). Other European stalagmite records have identified GI–GS events from the last glacial period (Genty et al., 2003; Spötl et al., 2006; Boch et al., 2011; Moseley et al., 2014) (Fig. 10), but the level of resolution recorded in the BG–GCL time series has not been clearly identified previously in western Iberia. A carbon isotope time series (albeit with low temporal resolution) of a flowstone from southeastern Spain does not present clear evidence of either GI or most HS during the last glacial cycle, although it does contain a clear expression of HS11 (Hodge et al., 2008) (Fig. 1). And while some Iberian lakes and peat bogs document environmental changes concurrent with HS, no single record, including one of the longest – the 50 ka time series from the Fuentillejo maar, south-central Spain – contains a consistent signal for all HS (Vegas et al., 2010; Moreno et al., 2012) (Fig. 1). GS–GI oscillations during MIS 3 are not clearly defined in BG stalagmites, likely owing to insufficient temporal resolution, although the BG records do share a resemblance to reconstructed SST variability (Fig. 11).
Whether the apparent inconsistent linkages between Iberian margin SST and Iberian hydroclimate are due to the limitations of these proxies, region-specific responses to SST variations, or a changing influence of SST on precipitation is unclear. However, other points of divergence between SST and the BG and GCL records exist. For example, some marine cores reveal a prominent spike in forest taxa occurring at the start of interglacials, decreasing thereafter for the next 5–10 kyr (Tzedakis et al, 2004; Desprat et al., 2007) (Fig. 10). This early interglacial peak is a common feature in several time series, including the Antarctic δD (Petit et al., 1999) and CH4 records (Loulergue et al., 2008), and in stalagmite isotopic ratios from the eastern Mediterranean (Bar-Matthews et al., 2003) and southern France (Couchoud et al., 2009) (Fig. 10). The BG–GCL δ13C and δ18O records lack this feature, although the previously discussed issues surrounding the continuity of the MIS 6–5e transition may complicate identifying it.
Stalagmite δ13C and δ18O values are lower during GI 20–22 (MIS 5a–4; 84–72 ka) than in either the Holocene or MIS 5e (Figs. 10 and 12), and BG6LR δ234U values support this observation. This interval is of particular interest given that Atlantic forest pollen, which has been used as a proxy for air temperature, was decoupled from SST across northwestern Iberia during cold events (C18–C20) (Rousseau et al., 2006; Rasmussen et al., 2014). This decoupling is interpreted as reflective of a weakened control of SST on Iberian atmospheric temperature that, in turn, enhanced transport of atmospheric vapor to the high latitudes, amplifying the production of ice sheets in the early stages of the last glacial cycle (Sánchez Goñi et al., 2013). This process has also been demonstrated for an earlier interglacial (MIS 19; Sánchez Goñi et al., 2016). Other offsets include (1) the gradual change in BG δ13C and δ18O values across the MIS 8–7 boundary, in contrast to the sharp rise in SST at this time, (2) the anomalously large δ13C response to ice-rafting event C24 (111–108 ka), and (3) the persistence of low δ13C values as SST decreased from 205–187 ka (Figs. 11 and 12).
The mechanism linking SST and Iberian hydroclimate over millennial timescales remains unclear. The NAO exerts a strong control over Iberian precipitation, and previous studies have suggested that GS, GI (Moreno et al., 2002; Sánchez Goñi et al., 2002; Daniau et al., 2007), and HS (Naughton et al., 2009) were characterized by distinct NAO modes. The dynamics of the NAO and Azores high-pressure system prior to the historical era are only beginning to be understood (Trouet et al., 2009; Olsen et al., 2012; Wassenburg et al., 2013), and the BG–GCL record cannot address this question independently. However, rainfall variability in eastern Iberia is less closely tied to the NAO than is western Iberia and instead reflects other climatic phenomena including the El Niño–Southern Oscillation (Rodó et al., 1997), helping to produce an east–west precipitation gradient. Additional high-resolution speleothem records from central and eastern Iberia could therefore provide a more robust test of the underlying drivers of millennial-scale hydroclimatic changes during recent glacial periods.
The BG–GCL composite speleothem record demonstrates that the hydroclimate and vegetation dynamics in west-central Portugal tracked Iberian margin SST over orbital and millennial scales during the past two glacial cycles. Enhanced aridity characterized HS, as evidenced by elevated carbon and oxygen isotopic ratios and/or hiatuses in stalagmite growth, consistent with other regional stalagmite time series. GI–GS variability expressed in the Iberian margin SST record and in co-deposited pollen spectra is also present in the BG–GCL time series and is particularly well defined in MIS 5a and 5b. Understanding differences between the structures of the stalagmite and SST records during some time intervals will require the development of speleothem records from central and southern Iberia.
Use of the following data sets is gratefully acknowledged: Global Precipitation Climatology Center data by the German Weather Service (DWD) accessed through http://gpcc.dwd.de (last access: 28 March 2016); NAO index data provided by the Climate Analysis Section, NCAR, Boulder, USA (Climate Data Guide, 2018) – updated regularly and accessed through https://climatedataguide.ucar.edu/climate-data/hurrell-north-atlantic-oscillation-nao-index-pc-based (last access: 21 May 2018).
The supplement related to this article is available online at: https://doi.org/10.5194/cp-14-1893-2018-supplement.
RFD and JAD designed the experiment. Laboratory analyses were performed by RFD, ANH, YA, ADW, VJP, SAO, and ACB. Fieldwork was conducted by RFD, ANH, ADW, JAH, DLT, ACB, FTR, MRB, and NB. Data were analyzed by RFD, ANH, YA, ADW, JAH, DLT, SAO, ACB, SFMB, CCU, and MMB. Manuscript was written by RFD with contributions from all authors.
The authors declare that they have no conflict of interest.
This work was supported by the Center for Global and Regional Environmental
Research, Cornell College (to Rhawn F. Denniston), and the US National
Science Foundation (grant BCS-1118155 to Jonathan A. Haws, BCS-1118183 to
Michael M. Benedetti, and AGS-1804132 to Caroline C. Ummenhofer). Field
sampling was performed under the auspices of IGESPAR (to Jonathan A. Haws) and
Associação de Estudos Subterrâneos e Defesa do Ambiente. Brandon
Zinsious and Stephen Rasin contributed to fieldwork at BG, and Zachary
LaPointe assisted with radioisotopic analyses; Suzanne Ankerstjerne performed
stable isotope measurements. This paper
benefitted tremendously from discussions with Maria F. Sánchez Goñi,
David Hodell, and Chronis Tzedakis. We thank five anonymous reviewers who
substantially improved this paper's scope and clarity through detailed
and thoughtful assessments. Stable and U-series isotope data are available at
the NOAA National Centers for Environmental Information website.
Edited by: Nathalie Combourieu
Nebout
Reviewed by: five anonymous referees
Asmerom, Y., Polyak, V., and Burns, S.: Variable winter moisture in the southwestern United States linked to rapid glacial climate shifts, Nat. Geosci., 3, 114–117, 2010.
Baker, A., Ito, E., Smart, P., and McEwan, R.: Elevated and variable values of 13C in speleothems in a British cave system, Chem. Geol., 136, 263–270, 1997.
Barker, S., Knorr, G., Edwards, R. L., Parrenin, F., Putnam, A. E., Skinner, L. C., Wolff, E., and Ziegler, M.: 800,000 years of abrupt climate variability, Science, 334, 347–351, 2011.
Bar-Matthews, M., Ayalon, A., Gilmour, M., Matthews, A., and Hawkesworth, C. J.: Sea-land oxygen isotopic relationships from planktonic foraminifera and speleothems in the Eastern Mediterranean region and their implication for paleo-rainfall during interglacials intervals, Geochim. Cosmochim. Ac., 67, 3181–3199, 2003.
Barnston, A. G. and Livezey, R. E.: Classification, seasonality, and persistence of low-frequency atmospheric circulation patterns, Mon. Weather Rev., 115, 1083–1126, 1987.
Berger, A. and Loutre, M. F.: Insolation values for the climate of the last 10 million years, Quaternary Sci. Rev., 10, 297–318, 1991.
Blanco Castro, E., Casado González, M. A., Costa Tenorio, M., Escribano Bombín, R., García Antón, M., Génova Fuster, M., Gómez Manzaneque, F., Gómez Manzaneque, A., Moreno Sáiz, J. C., Morla Juaristi, C., Regato Pajares, P., and Sáiz Ollero, H.: Los bosques ibéricos, Planeta, Barcelona, 1997.
Boch, R., Cheng, H., Spötl, C., Edwards, R. L., Wang, X., and Häuselmann, Ph.: NALPS: a precisely dated European climate record 120–60 ka, Clim. Past, 7, 1247–1259, https://doi.org/10.5194/cp-7-1247-2011, 2011.
Breitenbach, S. F. M., Rehfeld, K., Goswami, B., Baldini, J. U. L., Ridley, H. E., Kennett, D. J., Prufer, K. M., Aquino, V. V., Asmerom, Y., Polyak, V. J., Cheng, H., Kurths, J., and Marwan, N.: COnstructing Proxy Records from Age models (COPRA), Clim. Past, 8, 1765–1779, https://doi.org/10.5194/cp-8-1765-2012, 2012.
Breitenbach, S. F. M., Lechleitner, F. A., Meyer, H., Diengdo, G., Mattey, D., and Marwan, N.: Cave ventilation and rainfall signals in dripwater in a monsoonal setting – a monitoring study from NE India, Chem. Geol., 402, 111–124, 2015.
Climate Data Guide: Hurrell North Atlantic Oscillation (NAO) Index (PC-based), available at: https://climatedataguide.ucar.edu/climate-data/hurrell-north-atlantic-oscillation-nao-index-pc-based, last access: 21 May 2018.
Chabaud, L., Sánchez Goñi, M. F., Desprat, S., and Rossignol, L.: Land-sea climatic variability in the eastern North Atlantic subtropical region over the last 14,200 years: Atmospheric and oceanic processes at different timescales, Holocene, 24, 787–797, 2014.
Chabaux, F., Riotte, J., and Dequincey, O.: U–Th–Ra fractionations during weathering and river transport, Rev. Mineral. Geochem., 52, 533–576, 2003.
Collister, C. and Mattey, D.: Controls on water drop volume at speleothem drip sites: An experimental study, J. Hydrol., 358, 259–267, 2008.
Combourieu Nebout, N., Peyron, O., Dormoy, I., Desprat, S., Beaudouin, C., Kotthoff, U., and Marret, F.: Rapid climatic variability in the west Mediterranean during the last 25 000 years from high resolution pollen data, Clim. Past, 5, 503–521, https://doi.org/10.5194/cp-5-503-2009, 2009.
Cortesi, N., Gonzalez-Hidalgo, J. C., Trigo, R. M., and Ramos, A. M.: Weather types and spatial variability of precipitation in the Iberian Peninsula, Int. J. Climatol., 34, 2661–2677, 2014.
Couchoud, I, Genty, D., Hoffman, D., Drysdale, R., and Blamart, D.: Millennial-scale climate variability during the Last Interglacial recorded in a speleothem from south-western France, Quaternary Sci. Rev., 28, 3263–3274, 2009.
Daniau, A.-L., Sánchez Goñi, M.F., Beaufort, L., Laggoun-Defarge, F., Loutre, M.-F., and Duprat, J.: Dansgaard-Oeschger climatic variability revealed by fire emissions in southwestern Iberia, Quaternary Sci. Rev., 26, 1369–1383, 2007.
Darfeuil, S., Ménot, G., Giraud, X., Rostek, F., Tachikawa, K., Garcia, M., and Bard, É.: Sea surface temperature reconstructions over the last 70 kyr off Portugal: Biomarker data and regional modeling, Paleocean, 31, 40–65, 2016.
de Abreu, L., Shackleton, N. J., Schönfeld, J., Hall, M., and Chapman, M.: Millennial-scale oceanic climate variability off the Western Iberian margin during the last two glacial periods, Mar. Geol., 196, 1–20, 2003.
Deines, P.: The isotopic composition of reduced organic carbon, in: Handbook of Environmental Isotope Geochemistry, The Terrestrial Environment, Part A, edited by: Fritz, P. and Fontes, J., Elseveier, New York, 331–406, 1980.
Denniston, R. F., González, L. A., Asmerom, Y., Baker, R. G., Reagan, M. K., and Bettis, E. A. III.: Evidence for increased cool season moisture during the middle, Holocene, Geology, 27, 815–818, 1999.
Denniston, R. F., Wyrwoll, K.-H., Polyak, Brown, J. Asmerom, Y., Wanamaker, A. Jr., LaPointe, Z., Ellerbroek, R., Barthelmes, M., Cleary, D., Cugley, J., Woods, D., and Humphreys, W.: A Stalagmite Record of Holocene Indonesian-Australian Summer Monsoon Variability from the Australian Tropics, Quaternary Sci. Rev., 78, 155–168, 2013.
Desprat, S., Fernanda Sánchez Goñi, M., T. J.-L., Duprat, J., Malaizé, B., and Peypouquet, J.-P.: Climatic variability of Marine Isotope Stage 7: direct land-sea-ice correlation from a multiproxy analysis of a north-western Iberian margin deep-sea core, Quaternary Sci. Rev., 25, 1010–1026, 2006.
Desprat, S., Sánchez Goñi, M.F., Naughton, F., Turon, J.-L., Duprat, J., Malaizé, B., Cortijo, E., and Peypouquet, J.-P.: Climate variability of the last five isotopic interglacials: Direct land-sea-ice correlation from the multiproxy analysis of North-Western Iberian margin deep-sea cores, edited by: Sirocko, F., Claussen, M., Sánchez Goñi, M. F., and Litt, T., in: Developments in Quaternary Sciences, Elsevier, 375–386, 2007.
Dorale, J. A., and Liu, Z.: Limitations of Hendy Test criteria in judging the paleoclimatic suitability of speleothems and the need for replication, J. Cave Karst. Stud., 71, 73–80, 2009.
Dreybodt, W.: Evolution of the isotopic composition of carbon and oxygen in a calcite precipitating solution and the related isotopic composition of calcite in stalagmites, Geochim. Cosmochim. Ac., 72, 4712–4724, 2008.
Deutscher Wetter Dienst (DWD): Global Precipitation Climatology Center data, available at: http://gpcc.dwd.de, last access: 28 March 2016.
Eynaud, F., de Abreu, L, Voelker, A., Schönfeld, J., Salgueiro, E., Turon, J.-L., Penaud, A., Toucanne, S., Naughton, F., Sánchez Goñi, M.F., Malaizé, and Cacho, I.: Position of the Polar Front along the western Iberian margin during key cold episodes of the last 45 ka, Geochem. Geophy. Geosy., 10, Q07U05, https://doi.org/10.1029/2009GC002398, 2009.
Fairchild, I. J., Smith, C. L., Baker, A., Fuller, L., Spötl, C., Mattey, D., McDermott, F., and Edinburgh Ion Microprobe Facility (EIMF): Modification and preservation of environmental signals in speleothems, Earth Sci. Rev., 75, 105–153, 2006.
Fankhauser, A., McDermott, F., and Fleitmann, D.: Episodic speleothem deposition tracks the terrestrial impact of millennial-scale last glacial climate variability in SW Ireland, Quaternary Sci. Rev., 152, 104–117, 2016.
Fletcher, W. J., Sánchez Goñi, M. F., Allen, J. R. M., Cheddadi, R., Combourieu-Nebout, N., Huntley, B., Lawson, I., Londiex, L., Magri, D., Margari, v., Müller, U. C., Naughton, F., Novenko, E., Roucoux, K., and Tzedakis, P. C.: Millennial scale variability during the last glacial in vegetation records from Europe, Quaternary Sci. Rev., 29, 2839–2864, 2010.
Florineth, D. and Schlüchter, S.: Alpine Evidence for Atmospheric Circulation Patterns in Europe during the Last Glacial Maximum, Quaternary Res., 54, 295–308, 2000.
Francey, R. J., Allison, C. E., Etheridge, D. M., Trudinger, C. M., Enting, I. G., Leuenberger, M., Langenfelds, R. L., Michel, E., and Steele, L. P. A.: 1000-year high precision record of 13C in atmospheric CO2, Tellus B, 51, 170–193, 1999.
Genty, D., Blamart, D., Ouahdi, R., Gilmour, M., Baker, A., Jouzel, J., Van-Exter, S.: Precise dating of Dansgaard-Oeschger climate oscillations in western Europe from stalagmite data, Nature, 421, 833–837, 2003.
Genty, D., Comboruieu-Nebout, N., Peyron, O., Blamart, D., Wainer, K., Mansuri, F., Ghaleb, B., Isabello, L., Dormoy, I., von Grafenstein, U., Bonelli, S., Landais, A., and Brauer, A.: Isotopic characterization of rapid climatic events during OIS3 and OIS4 in Villars Cave stalagmites (SW-France) and correlation with Atlantic and Mediterranean pollen records, Quaternary Sci. Rev., 29, 2799–2820, 2010.
Genty, D., Blamart, D., Ghaleb, B., Plagnes, V., Causse, Ch., Bakalowicz, M., Zouari, K., Chkir, N., Hellstrom, J., Wainer, K., and Bourges, F.: Timing and dynamics of the last deglaciation from European and North African δ13C stalagmite profiles – comparison with Chinese and South Hemisphere stalagmites, Quaternary Sci. Rev., 25, 2118–2142, 2006.
Gimeno, L., Nieto, R., Trigo, R. M., Vicente-Serrano, S. M., and López-Moreno, J. I.: Where does the Iberian Peninsula moisture come from? An answer based on a Lagrangian approach, J. Hydrometeorol., 11, 421–436, 2010.
Gimeno, L., Stohl, A., Trigo, R. M., Dominguez, F., Yoshimura, K., Yu., L., Drumond, A., Durán-Quesada, A. M., and Nieto, R.: Oceanic and terrestrial sources of continental precipitation, Rev. Geophys., 50, 1–41, 2012.
Gómez-Orellana, L., Ramil-Rego, P., and Sobrino, C. M.: The Würm in NW Iberia, a pollen record from Area Longa (Galicia), Quaternary Res., 67, 438–452, 2008.
Grootes, P. M.: Climate Change in Continental Isotopic Records, edited by: Swart, P. K., Lohmann, K. C., McKenzie, J., and Savin, S., American Geophysical Union, Washington, DC, 37–46, 1993.
Hellstrom, J. and McCulloch, M.: Multi-proxy constraints on the climatic significance of trace element records from a New Zealand speleothem, Earth Planet Sc. Lett., 179, 287–297, 2000.
Hendy, C.: The isotopic geochemistry of speleothems – I. The calculation of the effects of different modes of formation on the isotopic composition of speleothems and their applicability as palaeoclimatic indicators, Geochim. Cosmochim. Ac., 35, 801–824, 1971.
Herbert, T. D., Schuffert, J. D., Heusser, L., Lyle, M., Mix, A., Ravelo, A. C., Stott, L. D., and Herguera, J. C.: Collapse of the California current during glacial maxima linked to climate change on land, Science, 293, 71–76, 2001.
Hodell, D., Crowhurst, S., Skinner, L., Tzedakis, P. C., Margari, V., Channell, J. E. T., Kamenov, G., Maclachlan, S., and Rothwell, G.: Response of Iberian margin sediments to orbital and suborbital forcing over the past 420 ka, Paleoceanography, 28, 185–199, 2013.
Hodge, E. J., Richards, D. A., Smart, P. L., Andreo, B., Hoffman, D. L., Mattey, D. P., and Gonzales-Ramon, A.: Effective precipitation in southern Spain (∼266 to 46 ka) based on a speleothem stable carbon isotope record, Quaternary Res., 69, 447–457, 2008.
IAEA/WMO: Global Network of Isotopes in Precipitation, The GNIP Database, available at: http://www.iaea.org/water, last access: 2015.
IPMA: Instituto Português do Mar e da Atmosfer, available at: http://www.meteo.pt/en/oclima/clima.normais/015/, last access: 2018.
Justino, F. and Peltier, W. R.: The glacial North Atlantic Oscillation, Geophys. Res. Lett., 32, L21803, https://doi.org/10.1029/2005GL023822, 2008.
Kim, S.-T. and O'Neil, J. R.: Equilibrium and nonequilibrium oxygen isotope effects in synthetic carbonates, Geochim. Cosmochim. Ac., 61, 3461–3475, 1997.
Kuhlemann, J., Rohling, E. J., Krumrei, I., Kubik, P., Ivy-Ochs, S., and Kucera, M.: Regional synthesis of Mediterranean atmospheric circulation during the Last Glacial Maximum, Science, 321, 1338–1340, 2008.
Lachniet, M. S.: Climatic and environmental controls on speleothem oxygen isotope values, Quaternary Sci. Rev., 28, 412–432, 2009.
Lechleitner, F. A., Breitenbach, S. F. M., Cheng, H., and Plessen, B.: Climatic and in-cave influences on δ18O and δ13C in a stalagmite from northeastern India through the last deglaciation, Quaternary Res., 88, 458–471, 2017.
Li, Z.-H., Driese, S. G., and Cheng, H.: A multiple cave deposit assessment of suitability of speleothem isotopes for reconstructing palaeo-vegetation and palaeo-temperature, Sedimentology, 61, 749–766, 2014.
Lorenzo, M. N., Iglesias, I., Taboada, J. J., and Gomez-Gesteira, M.: Relationship between monthly rainfall in northwest Iberian Peninsula and North Atlantic sea surface temperature, Int. J. Climatol., 30, 980–990, 2010.
Loulergue, L., Schilt, A., Spahni, R., Masson-Delmotte, V., Blunier, T., Lemieux, B., Barnola, J.-M., Raynaud, D., Stocker, T. F., and Chappellaz, J.: Orbital and millennial-scale features of atmospheric CH4 over the past 800,000 years, Nature, 453, 383–386, 2008.
Luetscher, M., Boch, R., Sodemann, H., Spötl, C., Cheng, H., Edwards, R.L., Frisia, S., Hof, F., and Müller, W.: North Atlantic storm track changes during the Last Glacial Maximum recorded by Alpine speleothems, Nat. Commun., 6, https://doi.org/10.1038/ncomms7344, 2016.
Margari, V., Skinner, L. C., Tzedakis, P. C., Ganopolski, A., Vautravers, M., and Shackleton, N. J.: The nature of millennial-scale climate variability during the past two glacial periods, Nat. Geosci., 3, 127–131, https://doi.org/10.1038/ngeo740, 2010.
Margari, V., Skinner, L. C., Hodell, D. A., Martrat, B., Toucanne, S., Grimalt, J. O., Gibbard, P. L., Lunkka, J. P., and Tzedakis, P. C.: Land-ocean changes on orbital and millennial time scales and the penultimate glaciation, Geology, 42, 183–186, 2014.
Martin-Vide, J. and Lopez-Bustins, J.-A.: The Western Mediterranean Oscillation and rainfall in the Iberian Peninsula, Int. J. Climatol., 26, 1455–1475, 2006.
Martrat, B., Grimalt, J. O., Shackleton, N. J., de Abreu, L., Hutterli, M .A., and Stocker, T. F.: Four climate cycles of recurring deep and surface water destabilizations on the Iberian margin, Science, 317, 502–507, 2007.
McManus, J. F., Oppo, D. W., and Cullen, J. L.: A 0.5-Million-Year Record of Millennial-Scale Climate Variability in the North Atlantic, Science, 283, 971–975, 1999.
Mickler, P. J., Banner, J. L., Stern, L., Asmerom, Y., Edwards, R. L., and Ito, E.: Stable isotope variations in modern tropical speleothems: Evaluation equilibrium vs. kinetic isotope effects, Geochim. Cosmochim. Ac., 68, 4381–4393, 2004.
Moreno, A., Cacho, I., Canals, M., Prins, M. A., Sánchez Goñi, M. F., Grimalt, J. O., and Weltje, G. J: Saharan dust transport and high-latitude glacial climate variability: the Alboran Sea record, Quaternary Res., 58, 318–328, 2002.
Moreno, A., Gonzalez-Samperiz, P., Morellon, M., Valero-Garces, B. L., and Fletcher, W. J.: Northern Iberian abrupt climate change dynamics during the last glacial cycle: a view from lacustrine sediments, Quaternary Sci. Rev., 36, 139–153, 2012.
Moreno, A., Sancho, C., Bartolumé, M., Oliva-Rucia, B., Delgado-Huertas, A., José, Estrela, M., Corell, D., López-Moreno, J. I., and Cacho, I.: Climate controls on rainfall isotopes and their effects on cave drip water and speleothem growth: the case of Molinos cave (Teruel, NE Spain), Clim. Dynam., 43, 221–241, 2014.
Moseley, G. E., Spötl, C., Scensson, A., Cheng, H., Brandstatter, S., and Edwards, R. L.: Multi-speleothem record reveals tightly coupled climate between central Europe and Greenland during Marine Isotope Stage 3, Geology, 42, 1043–1946, 2014.
Mühlinghaus, C., Scholz, D., and Mangini, A.: Modelling stalagmite growth and δ13C as a function of drip interval and temperature, Geochim. Cosmochim. Ac., 71, 2780–2790, 2007.
Naughton, F., Sánchez Goñi, M. F., Desprat, S., Turon, J.-L., Duprat, J., Malaizé, B., Joli, C., Cortijo, E., Drago, T., and Freitas, M. C.: Present-day and past (last 25,000 years) marine pollen signal off western Iberia, Mar. Micropaleontol., 62, 91–114, 2007.
Naughton, F., Sánchez Goñi, M. F., Kageyama, M., Bard, E., Duprat, J., Cortijo, E., Desprat, S., Malaizé, B., Joly, C., Rostek, F., and Turon, J.-L.: Wet to dry climatic trend in north-western Iberia within Heinrich events, Earth Planet Sc. Lett., 284, 329–342, 2009.
North Greenland Ice Core Project members: High-resolution record of Northern Hemisphere climate extending into the last interglacial period, Nature, 431, 147–151, 2004.
Olsen, J., Anderson, N. J., and Knudsen, M. F.: Variability of the North Atlantic Oscillation over the past 5,200 years, Nat. Geosci., 5, 808–812, 2012.
Oster, J. L., Ibarra, D. L., Harris, C. H., and Maher, K.: Influence of eolian deposition and rainfall amounts on the U-isotopic composition of soil water and soil minerals, Geochim. Cosmochim. Ac., 88, 146–166, 2012.
Paredes, D., Trigo, R. M., Garcia-Herrera, R., and Franco Trigo, I.: Understanding precipitation changes in Iberia in early spring: weather typing and storm-tracking approaches, J. Hydrometeorol., 7, 101–113, 2006.
Petit, J. R., Jouzel, J., Raynaud, D., Barkov, N. I., Barnola, J.-M., Basile, I., Bender, M., Chappellaz, J., Davis, M., Delaygue, G., Delmotte, M., Kotlyakov, V. M., Legrand, M., Lipenkov, V. Y., Lorius, C., Pepin, L., Ritz, C., Saltzman, E., and Stievenard, M.: Climate and atmospheric history of the 420,000 years from the Vostok ice core, Antarctica, Nature, 399, 429–436, 1999.
Plagnes, V., Causse, C., Genty, D., Paterne, M., and Blamart, D.: A discontinuous climatic record from 187 to 74 ka from a speleothem of the Clamouse Cave (south of France), Earth Planet Sc. Lett., 201, 87–103, 2002.
Polyak, V. J., Asmerom, Y., Burns, S. J., and Lachniet, M. S.: Climatic backdrop to the terminal Pleistocene extinction of North American mammals, Geology, 40, 1023–1026, 2012.
Rasmussen, S. O., Bigler, M., Blockley, S. P., Blunier, T., Buchardt, S. L., Clausen, H. B., Cvijanovic, I., Dahl-Jensen, D., Johnsen, S. L., Fischer, H. Gkinis, V., Guillevic, M., Hoek, W. Z., Lowe, J. J., Pedro, J. B., Popp, T., Seierstad, I. K., Steffensen, J. P., Svensson, A. M., Vallelonga, P., Vinther, B. M., Walker, M. J. C., Wheatley, J. J., and Winstrup, M.: A stratigraphic framework for abrupt climatic changes during the Last Glacial period based on three synchronized Greenland ice-core records: redefining and extending the INTIMATE event stratigraphy, Quaternary Sci. Rev., 106, 14–28, 2014.
Rey Benayas, J. M. and Scheiner, S. M.: Plant diversity, biogeography and environment in Iberia: Patterns and possible causal factors, J. Veg. Sci., 13, 245–258, 2002.
Rodó, X., Baert, E., and Comin, F. A.: Variations in seasonal rainfall in Southern Europe during the present century: relationships with the North Atlantic Oscillation and the El Niño-Southern Oscillation, Clim. Dynam., 13, 275–284, 1997.
Rodrigues, T., Grimalt, J. O., Abrantes, F., Naughton, F., and Flores, J.-A.: The last glacial-interglacial transition (LGIT) in the western mid-latitudes of the North Atlantic: Abrupt sea surface temperature change and sea level implications, Quaternary Sci. Rev., 29, 1853–1862, 2010.
Roucoux, K. H., de Abreu, L., Shackleton, N. J., and Tzedakis, P. C.: The response of NW Iberian vegetation to North Atlantic climate oscillations during the last 65 kyr, Quaternary Sci. Rev., 24, 1637–1653, 2005.
Roucoux, K. H., Tzedakis, P. C., de Abreu, L., and Shackleton, N. J.: Climate and vegetation changes 180,000 to 345,000 years ago recorded in a deep-sea core off Portugal, Earth Planet Sc. Lett., 249, 307–325, 2006.
Rousseau, D. D., Kukla, G., and McManus, J.: What is what in the ice and the ocean?, Quaternary Sci. Rev., 25, 2025–2030, 2006.
Rozanski, K. L., Araguas-Araguas, L., and Gonfiantini, R.: Climate Change in Continental Isotopic Records, edited by: Swart, P. K., Lohmann, K. C., McKenzie, J., and Savin, S., American Geophysical Union, Washington, DC, 1–36, 1993.
Saltzman, M. and Thomas, E.: Carbon Isotope Stratigraphy, The Geologic Time Scale, 1, 207–232, 2012.
Sánchez Goñi, M. F., Turon, J. L., Eynaud, F., and Gendreau, S.: European climatic response to millennial-scale changes in the atmosphere-ocean system during the Last Glacial Period, Quaternary Res., 54, 394–403, 2000.
Sánchez Goñi, M. F., Cacho, I., Turon, J.-L., Guiot, J., Sierro, F. J., Peypouquet, J.-P., Grimalt, J. O., and Shackleton, N. J.: Synchroneity between marine and terrestrial responses to millennial scale climatic variability during the last glacial period in the Mediterranean region, Clim. Dynam., 19, 95–105, 2002.
Sánchez Goñi, M. F., Landais, A., Fletcher, W. J., Naughton, F., Desprat, S., and Duprat, J.: Contrasting impacts of Dansgaard-Oeschger events over a western European latitudinal transect modulated by orbital precession, Quaternary Sci. Rev., 27, 1136–1151, 2008.
Sánchez Goñi, M. F., Bard, E., Landais, A., Rossignol, L., and d'Errico, F.: Air-sea temperature decoupling in western Europe during the last interglacial-glacial transition, Nat. Geosci., 6, 837–841, 2013.
Sánchez Goñi, M. F., Rodrigues, T., Hodell, D. A., Polanco-Martinez, J. M., Alonso-Garcia, M., Hernandez-Almeida, I., Desprat, S., and Ferretti, P.: Tropically-driven climate shifts in southwestern Europe during MIS 19, a low eccentricity interglacial, Geophys. Res. Abst., 18, EGU2016-3940, 2016.
Schneider, U., Becker, A., Finger, P., Meyer-Christoffer, A., Ziese, M., and Rudolf, B.: GPCC's new land surface precipitation climatology based on quality-controlled in situ data and its role in quantifying the global water cycle, Theor. Appl. Climatol., 115, 15–40, 2013.
Schneider, U., Becker, A., Finger, P., Meyer-Christoffer, A., Ziese, M., and Rudolf, B.: GPCC's new land surface precipitation climatology based on quality-controlled in situ data and its role in quantifying the global water cycle, Theor. Appl. Climatol., 115, 1–15, 2014.
Schrag, D. P, Hampt, G., and Murray, D. W.: Pore fluid constraints on the temperature and oxygen isotopic composition of the glacial ocean, Science, 272, 1930–1932, 1996.
Spötl, C., Mangini, A., and Richards, D. A.: Chronology and paleoenvironment of Marine Isotope Stage 3 from two high-elevation speleothems, Austrian Alps, Quaternary Sci. Rev., 25, 1127–1136, 2006.
Stoll, H. M., Moreno, A., Mendez-Vincente, A., Gonzalez-Lemos, S., Jimenez-Sánchez, M., Dominguez-Cuesta, M. J., Edwards, R. L., Cheng, H., and Wang, X.: Paleoclimate and growth rates of speleothems in the northwestern Iberian Peninsula over the last two glacial cycles, Quaternary Res., 80, 284–290, 2013.
Thatcher, D. L., Wanamaker, A. D., Jr., Denniston, R. F., Asmerom, Y., Ummenhofer, C. C., Polyak, V. J., Hasiuk, F., Haws, J. A., and Gillikin, D. P.: Changes in hydroclimate in Iberia in the last 1200 years: insights from speleothem records from western Portugal, Geological Society of America North-Central Meeting Abstracts with Programs, Ames, Iowa, 2018.
Trigo, R. M., Osborn, T. J., and Corte-Real, J. M.: The North Atlantic Oscillation influence on Europe: climate impacts and associated physical mechanisms, Clim. Res., 20, 9–17, 2002.
Trouet, V., Esper, J., Graham, N. E., Baker, A., Scourse, J. D., and Grank, D. C.: Persistent positive North Atlantic Oscillation mode dominated the Medieval Climate Anomaly, Science, 324, 78–80, 2009.
Tzedakis, P. C., Roucoux, K. H., de Abreu, L., and Shackleton, N. J.: The duration of forest stages in southern Europe and interglacial climate variability, Science, 306, 2231–2235, 2004.
Vaks, A., Gutareva, O. S., Breitenbach, S. F. M., Avirmed, E., Mason, A. J., Thomas, A. L., Osinev, A. V., Kononov, A. M., and Henderson, G. M.: Speleothems reveal 500,000-year history of Siberian permafrost, Science, 340, 183–186, 2013.
Vandenberghe, J., French, H. M., Gorbunov, A., Marchenko, S., Velichko, A. A., Jin, H., Cui, Z., Zhang, T., and Wan, X.: The Last Permafrost Maximum (LPM) map of the Northern Hemisphere: permafrost extent and mean annual air temperatures, 25–17 ka BP, Boreas, 43, 652–666, 2014.
Vegas, J., Ruiz-Zapata, B., Ortiz, J. E., Galan, L., Torres, T., Garcia-Cortes, A., Gil-Garcia, M. J., Perez-Gonzalez, A., and Gallardo-Millan, J. L.: Identification of arid phases during the last 50 cal. ka BP from the Fuentillejo maar-lacustrine record (Campo de Calatrava Volcanic Field, Spain), J. Quaternary Sci., 25, 1051–1062, 2010.
Voelker, A. H. L., Rodrigues, T., Billups, K., Oppo, D., McManus, J., Stein, R., Hefter, J., and Grimalt, J. O.: Variations in mid-latitude North Atlantic surface water properties during the mid-Brunhes (MIS 9–14) and their implications for the thermohaline circulation, Clim. Past, 6, 531–552, https://doi.org/10.5194/cp-6-531-2010, 2010.
Voelker, A. H. L. and de Abreu, L.: A review of abrupt climate change events in the northeastern Atlantic Ocean (Iberian Margin): Latitudinal, Longitudinal, and Vertical Gradients. Abrupt Climate Change: Mechanisms, Patterns, and Impacts, edited by: Rashid, H., Polyak, L., and Mosley-Thompson, E., Geoph. Monog. Series, 193, 15–37, 2011.
von Fischer, J. C., Tieszen, L. L., and Schimel, D. S.: Climate controls on C3 vs. C4 productivity in North American grasslands from carbon isotope composition of soil organic matter, Glob. Change Biol., 14, 1–15, 2008.
Wainer, K., Genty, D., Blamart, D., Daëron, M., Bar-Matthews, M., Vonhof, H., Dublyansky, Y., Pons-Branchu, E., Thomas, L., van Calsteren, P., Quinif, Y., and Caillon, N.: Speleothem record of the last 180 ka in Villars cave (SW France): Investigation of a large δ18O shift between MIS6 and MIS5, Quaternary Sci. Rev., 30, 130–146, 2011.
Wassenburg, J. A., Immenhauser, A., Richter, D. K., Niedermayr, A., Riechelmann, S., Fietzke, J., Scholz, D., Jochum, K. P., Fohlmeister, J., Schröder-Ritzrau, Sabaoui, A., Riechelmann, D. F. C., Schneider, L., and Esper, J.: Moroccan speleothem and tree ring records suggest a variable positive state of the North Atlantic Oscillation during the Medieval Warm Period, Earth Planet. Sc. Lett., 375, 291–302, 2013.
Zhou, J., Lundstrom, C. C., Fouke, B., Panno, S., Hackley, K., and Curry, B.: Geochemistry of speleothem records from southern Illinois: Development of (234U)/(238U) as a proxy for paleoprecipitation, Chem. Geol., 221, 1–20, 2005.