the Creative Commons Attribution 4.0 License.
the Creative Commons Attribution 4.0 License.
 | 22 Oct 2018
Extratropical cyclone statistics during the last millennium and the 21st century
Christoph C. Raible
Martina Messmer
Flavio Lehner
Thomas F. Stocker
Richard Blender
Extratropical cyclones in winter and their characteristics are investigated in depth for the Atlantic European region, as they are responsible for a significant part of the rainfall and extreme wind and/or precipitation-induced hazards. The analysis is based on a seamless transient simulation with a state-of-the-art fully coupled Earth system model from 850 to 2100 CE. The Representative Concentration Pathway 8.5 (RCP8.5) scenario is used in the 21st century. During the Common Era, cyclone characteristics show pronounced variations on interannual and decadal timescales, but no external forcing imprint is found prior to 1850. Thus, variations of extratropical cyclone characteristics are mainly caused by internal variability of the coupled climate system. When anthropogenic forcing becomes dominant in the 20th century, a decrease of the cyclone occurrences mainly over the Mediterranean and a strong increase of extreme cyclone-related precipitation become detectable. The latter is due to thermodynamics as it follows the Clausius–Clapeyron relation. An important finding, though, is that the relation between temperature and extreme cyclone-related precipitation is not always controlled by the Clausius–Clapeyron relation, which suggests that dynamical processes can play an important role in generating extreme cyclone-related precipitation – for example, in the absence of anomalously warm background conditions. Thus, the importance of dynamical processes, even on decadal timescales, might explain the conundrum that proxy records suggest enhanced occurrence of precipitation extremes during rather cold periods in the past.
- Article
(6865 KB) - Full-text XML
- BibTeX
- EndNote


Extratropical cyclones are fundamental phenomena of the day-to-day weather variability. Extreme extratropical cyclones have a strong impact on society and economy and are one of the major natural hazards of the midlatitudes (e.g., Schiesser et al., 1997; Beniston, 2007; Etienne et al., 2013). Thus, a better understanding of variations of cyclone characteristics is essential and has led to a variety of studies, which assess recent and future changes in cyclone characteristics (e.g., Ulbrich et al., 2008; Bengtsson et al., 2009; Pinto et al., 2009; Raible et al., 2010; Schneidereit et al., 2010; Zappa et al., 2013; IPCC, 2013). Still, considerable uncertainty remains of how extratropical cyclones react to changes of external forcing, especially in the 21st century (Harvey et al., 2012; IPCC, 2013), as confounding and partly canceling processes are difficult to disentangle (O'Gorman, 2010; Woollings et al., 2012b). Additionally, low-frequency internal variability might be important, e.g., a potential influence of the Atlantic meridional overturning circulation (AMOC) on cyclones has been discussed (Woollings et al., 2012a, 2015). Some of the uncertainties also arise from the fact that the observed time period is rather short, making it difficult to validate model-simulated decadal variability in cyclone statistics. Further, there are only a few modeling studies which put changes of extratropical cyclone characteristics in a long-term perspective (Fischer-Bruns et al., 2005; Raible et al., 2007; Gagen et al., 2016). A possibility to overcome this is the last millennium, which enables us to study the externally forced and internally varying extratropical cyclone activities (PAGES 2k-PMIP3 group, 2015; PAGES Hydro2k Consortium, 2017).
The purpose of this study is to establish a long-term, pre-instrumental perspective for cyclone characteristics. In particular, we evaluate the future of these characteristics under the Representative Concentration Pathway 8.5 (RCP8.5) scenario and compare it to natural variability during the last millennium. We take advantage of a transient simulation for the last millennium in high resolution (approximately ), which provides 12 h output – a necessity to investigate extratropical cyclones and their characteristics, such as cyclone-associated wind and precipitation extremes. The focus of the analysis is on the North Atlantic region and winter (December to February).
Various studies have analyzed the climate change response of extratropical cyclones and some of their characteristics (e.g., Ulbrich et al., 2008, 2009; Zappa et al., 2013; Feser et al., 2015; IPCC, 2013). A robust finding is that the warmer atmosphere in the future leads to a moistening of extratropical cyclones and thus to more precipitation (Bengtsson et al., 2009; Zappa et al., 2013). In the North Atlantic, an extension of the storm track into Europe is suggested under future climate change (e.g., Bengtsson et al., 2006; Ulbrich et al., 2009; Catto et al., 2011; McDonald, 2011; Zappa et al., 2013; Feser et al., 2015). For the Mediterranean, a decrease in winter cyclone activity is projected (e.g., Ulbrich et al., 2009; Raible et al., 2010; Zappa et al., 2013). Further modeling studies suggest that the wind intensity of extratropical cyclones in the North Atlantic is projected to be enhanced north of 55∘ N in the future compared to today (e.g., Feser et al., 2015), leading to a higher potential of future losses (Pinto et al., 2012). A process relevant for this intensification is a local minimum in the warming of the North Atlantic Ocean due to a reduction of the AMOC (Rahmstorf et al., 2015). This temperature anomaly leads to stronger low-level temperature gradients within the North Atlantic basin than today and thus to enhanced low-level baroclinicity (Laine et al., 2009; Catto et al., 2011; Woollings et al., 2012b).
Substantial uncertainty remains in future projections of extratropical cyclone characteristics because of the processes involved (Harvey et al., 2012). The decrease of the projected low-level meridional temperature gradient on average (due to strong high-latitude near-surface warming associated with polar amplification) implies a decrease of storm activity in the future, but at the same time the vertical temperature gradient decreases over the Atlantic and Arctic, which induces a reduced static stability and thus a favoring of storm growth (Harvey et al., 2012). Additionally, the moisture changes also influence the cyclone formation as latent heating arising from moist condensation often strengthens cyclones due to diabatic potential vorticity anomalies (e.g., Gutowski et al., 1992; Li et al., 2014), such that one would expect an intensification of cyclones in a warmer, moister climate (Willison et al., 2013). However, increased moisture, and therefore latent heat content in the global circulation, leads to a more efficient poleward transport of energy and therefore to a weakening of cyclonic activity in the midlatitudes (e.g., O'Gorman and Schneider, 2008; Schneider et al., 2010; Li et al., 2014). Additionally, other processes like changes in the wave–wave interaction (James and James, 1989; Riviere, 2011) and in the eddy length scale (Kidston et al., 2011) might play a role for the response of extratropical cyclones to future anthropogenic forcing changes and for the uncertainty of the response in different climate model simulations.
The past can serve as a test bed to place future projection of extratropical cyclone characteristics into context and to assess multi-decadal variability. Climate states completely different from the present, like the Last Glacial Maximum, show pronounced differences in extratropical cyclone behavior. Hofer et al. (2012a, b) showed that cyclones tend to move more zonally over the North Atlantic, leading to enhanced precipitation in southern Europe in winter. The reason is a southward shift of the eddy-driven jet due to the Laurentide ice sheet (Merz et al., 2015). However, in the last interglacial, the Eemian (130 ka ago), the jet positions and thus the cyclones are similar to present (Merz et al., 2015). More relevant is potentially the recent past, i.e., the last millennium including the Medieval Warm Period (approximately 11th to the 13th century) and the Little Ice Age (LIA; approximately 14th to the 19th century; e.g., Bradley and Jones, 1993; Broecker, 2000; McGregor et al., 2015), as these periods are precursors of the Anthropocene (Zalasiewicz et al., 2010) and thus provide a rich and highly resolved proxy network (e.g., PAGES 2k Consortium, 2013). In multi-century pre-industrial climate model simulations, Fischer-Bruns et al. (2005) suggested that natural variability of extratropical cyclones is unrelated to external forcing like total solar irradiance (TSI) or volcanoes. This is in contrast to the modeling study of Raible et al. (2007), who found a significant intensification of cyclones in the North Atlantic during the Maunder Minimum (a period of reduced TSI from AD 1640 to 1715) compared to today, although part of the signal is already of anthropogenic origin. They further showed that low-level baroclinicity is enhanced due to the increased low-level meridional temperature gradient, which seems to be the dominant process for cyclone intensification in their coarsely resolved simulations. Comparing this model result with proxy records shows that during the LIA more severe storms are observed (Björck and Clemmensen, 2004; de Jong et al., 2007; Sabatier et al., 2012; Trouet et al., 2012; Van Vliet-Lanoe et al., 2014; Degeai et al., 2015; Costas et al., 2016).
Since the early attempts to assess past extratropical cyclone behavior in model simulations (e.g., Fischer-Bruns et al., 2005; Raible et al., 2007) the ability to perform millennium-size simulations in high resolution has improved so that today several simulations for the last millennium based on different models are available (Schmidt et al., 2011; Braconnot et al., 2012; Taylor et al., 2012; Otto-Bliesner et al., 2016). Still, most of these simulations have only saved monthly data, which prevent us from analyzing extratropical cyclones in these simulations. Recently, a last millennium simulation spanning the period AD 850 to 2099 became available providing 12 h data (Lehner et al., 2015). This enables us to address the following research questions:
-
How are cyclone characteristics projected to change in the 21st century?
-
How do these changes compare with variability, in particular low-frequency variation, during the last millennium?
The study is structured as follows: Sect. 2 briefly presents the model and experimental design chosen to generate the last millennium simulation. Further, the cyclone detection and tracking method is introduced and the cyclone characteristics are defined. In Sect. 3, the last millennium simulation is compared with ERA-Interim for the period AD 1980 to 2009 to demonstrate the model's ability in simulating cyclone characteristics. Then, the climate change signals of the different characteristics are put into context with the low-frequency variability (Sect. 4). Finally, the results are summarized and discussed, and concluding remarks are presented in Sect. 5.
2.1 Model and experimental design
To investigate the characteristics of extratropical cyclones, we use the Community Earth System Model (CESM, 1.0.1 release; Hurrell et al., 2013). It is a state-of-the-art fully coupled Earth system model developed by the National Center for Atmospheric Research. CESM relies on the Community Climate System Model (CCSM; Gent et al., 2011) in terms of the model physics, but it contains a carbon cycle module, which is included in its atmosphere, land and ocean components.
We use the 1∘ version of the model used in Coupled Model Intercomparison Project (CMIP)-class experiments; i.e., the finite volume core of the atmosphere has a uniform horizontal resolution of at 26 vertical levels. Compared to the former version of the atmosphere component, important improvements are implemented in the deep convection parameterization by including a dilute plume calculation of convective available potential energy and by introducing the convective momentum transport (Neale et al., 2013). Additionally, the cloud fraction method has been modified to reduce the positive bias of wintertime polar clouds. Further details on the changes in the atmospheric component are presented in Neale et al. (2013).
CESM is used to simulate the entire last millennium from AD 850 to 2099. The initial conditions for this transient simulation are obtained from a 500-year control simulation for perpetual AD 850 conditions, which was run into a quasi-equilibrium state (no drift of the global mean temperature in the upper part of the ocean). The transient external forcing follows the Paleoclimate Modelling Intercomparison Project 3 (PMIP3) protocols (Schmidt et al., 2011) and CMIP5 (Taylor et al., 2012). It consists of TSI, volcanic and anthropogenic aerosols, land use change and greenhouse gases (GHGs; Fig. 1). Note that the TSI deviates from the PMIP3 protocol in that the amplitude between the Maunder Minimum (1640–1715) and today is doubled. Further, the model has enabled the carbon cycle module. To extend the simulation beyond AD 2005, RCP8.5 is applied, which corresponds to a radiative forcing of approximately 8.5 W m−2 by 2100. Further details on the simulation are summarized in Lehner et al. (2015).
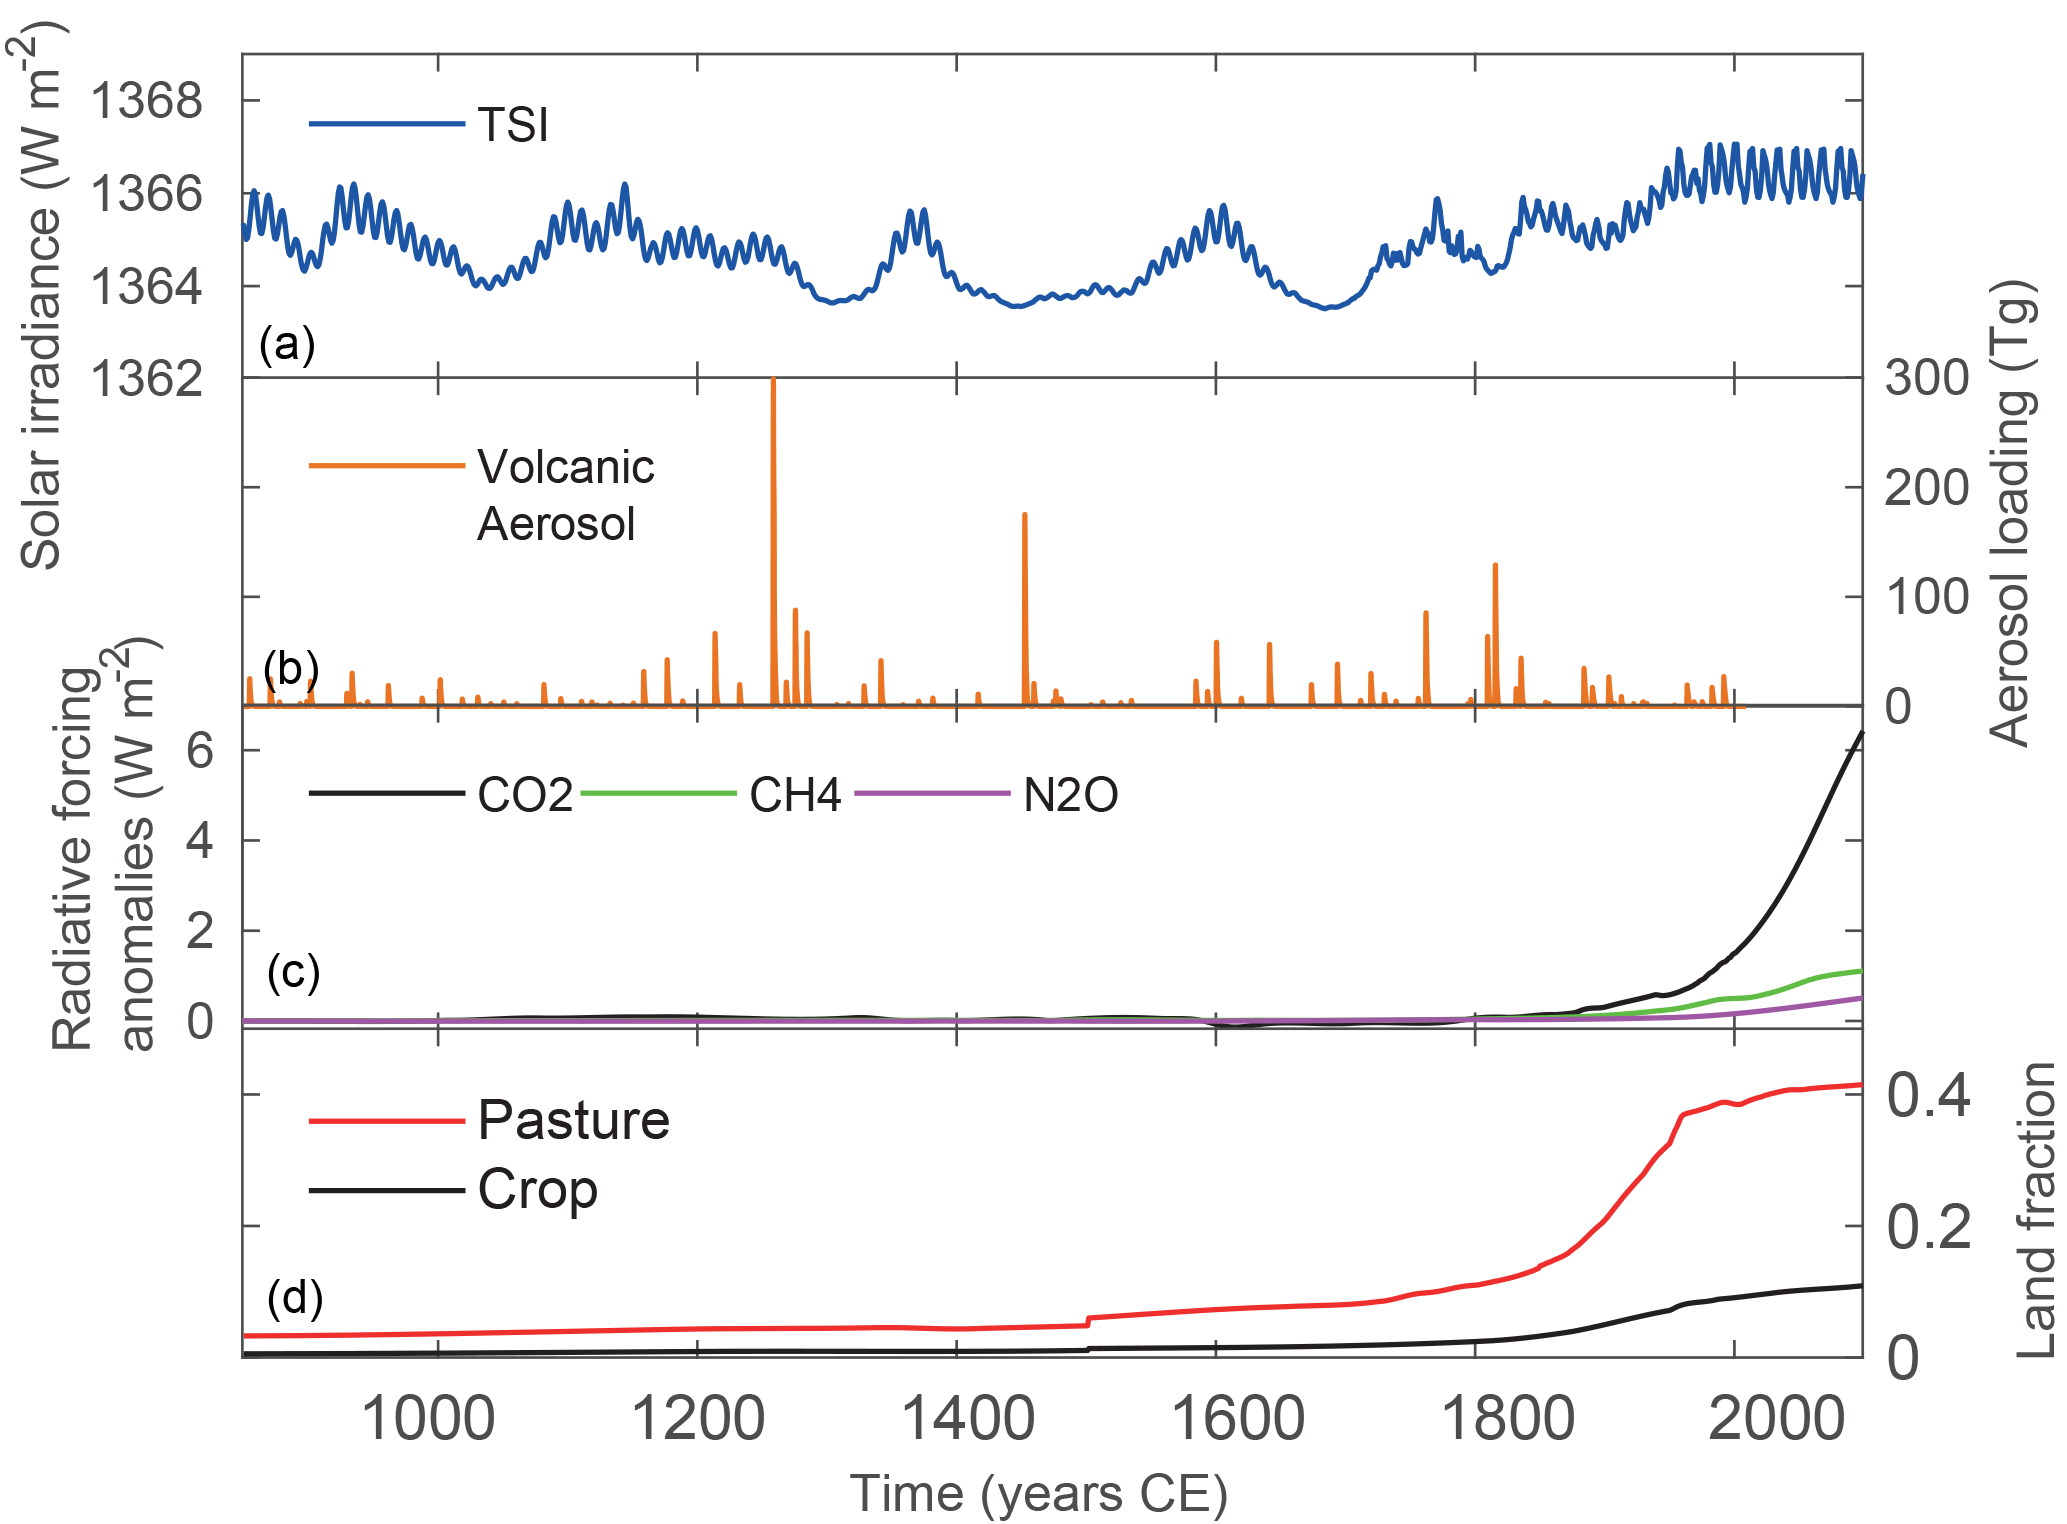
Figure 1Forcings used in the last millennium simulation with CESM. From panels (a) to (d): total solar irradiance (TSI), total volcanic aerosol mass; radiative forcing (calculated according to IPCC, 2001) from the greenhouse gases CO2, CH4 and N2O; and major changes in land cover as fraction of global land area. The figure is adapted from Lehner et al. (2015).
To save storage, the analysis is based on 12 h instantaneous output. This resolution is sufficient to derive characteristics of extratropical cyclones. For example, Blender and Schubert (2000) showed that the number of cyclones based on 12 h output is only reduced by 14 % compared to the number obtained from 6 h output. Furthermore, all pressure level simulated data used in the analysis are interpolated using the three-dimensional field in sigma-pressure coordinates, in particular geopotential height at 1000 and 500 hPa. The analysis focuses on the North Atlantic region in winter (December to February, DJF).
2.2 Cyclone detection, tracking and characteristics
The cyclone analysis is based on a modified Lagrangian cyclone detection and tracking scheme first developed by Blender et al. (1997). The method is applied to the 1000 hPa geopotential height field and consists of two steps: (i) cyclone detection and (ii) tracking.
- i.
A low pressure system is identified as a minimum in the geopotential height at 1000 hPa in a neighborhood of eight grid points and its intensity (in gpm/1000 km) defined as the mean gradient between the local geopotential height minimum and its neighboring grid points within an area of 1000 km distance to the minimum. To neglect weak or unrealistic minima, a minimum threshold value of this intensity measure is set to 20 gpm/1000 km and the radius of a cyclone must exceed 100 km. Further, cyclone centers identified in high topography (above 1000 m a.s.l.) are excluded.
- ii.
To connect identified pressure minima, a next-neighborhood search is applied within a search radius of 1000 km. To further prevent erroneous detection of cyclones, two additional thresholds are used: the cyclone has a minimum lifetime of 24 h, and the intensity (defined above) needs to exceed 30 gpm/1000 km once in its lifetime. More details on the cyclone detection algorithm are provided in Blender et al. (1997), Raible and Blender (2004) and Raible (2007). Furthermore, an intercomparison of different cyclone detection and tracking methods showed that the method used in this study is within the range of other methods (Raible et al., 2008; Neu et al., 2013). In particular, the agreement between the methods increases when focusing on extreme cyclones (Neu et al., 2013; Lionello et al., 2016; Grieger et al., 2018).
The Lagrangian cyclone detection and tracking method provides a variety of extratropical cyclone characteristics. Besides the number of time steps when a cyclone is present (or cumulative cyclone presence), intensity measures for wind are deduced, i.e., the central sea level pressure (SLP) and the cyclone depth. The latter is the difference between the central geopotential height and the surrounding mean geopotential height in distance of the radius of the cyclone (defined below). The 90th percentile of central pressure and cyclone depth of all cyclones within a season is used to define extremeness of wind. Note that cyclone depth and wind are connected via the geostrophic approximation in the free atmosphere of the midlatitudes.
The radius is estimated by a Gaussian radius–depth method based on Schneidereit et al. (2010) to estimate the geometric structure of the cyclones. Thereby, the geopotential height surface in the neighborhood of a cyclone minimum is approximated by a Gaussian, which is fitted by a least squares method. The standard deviation of the Gaussian is then an estimation of the cyclone radius, another characteristic of extratropical cyclones.
Further, the area of the cyclone defined by this radius is used to quantify the amount of precipitation related to this cyclone. The precipitation is integrated over this area for each time step of the cyclone and defines the cyclone-specific precipitation. To focus on extreme cyclone-specific precipitation, the 90th percentile of cyclone-related precipitation estimated within the season is used as an index of extremeness. A similar approach is selected to deduce cyclone-related temperature, though for this index we are interested in the mean of the season and not in the 90th percentile.
The radius is also used to deduce the Eulerian measure of cyclone occurrences, i.e., the cyclone frequency. For one time step, each grid point within the radius of a cyclone is assigned to be occupied by the cyclone. Summing over all time steps for each grid point and dividing by the total number of time steps results in cyclone frequency at each grid point. This measure enables us to identify regions of high and low cyclone occurrence.
All extratropical cyclone characteristics mentioned above are deduced for the North Atlantic region defined as 30–70∘ N and 65∘ W–40∘ E (Fig. 2a).
Before extratropical cyclone characteristics for the last millennium and the future are presented, the model's ability to simulate cyclones is demonstrated for the period CE 1980–2009 for winter (DJF). To compare the simulated cyclones and their characteristics, the ERA-Interim reanalysis data are used (Dee et al., 2011). The ERA-Interim data are first bilinearly interpolated to the same resolution as CESM (). Similar to CESM, 12 h instantaneous output is used in the analysis.
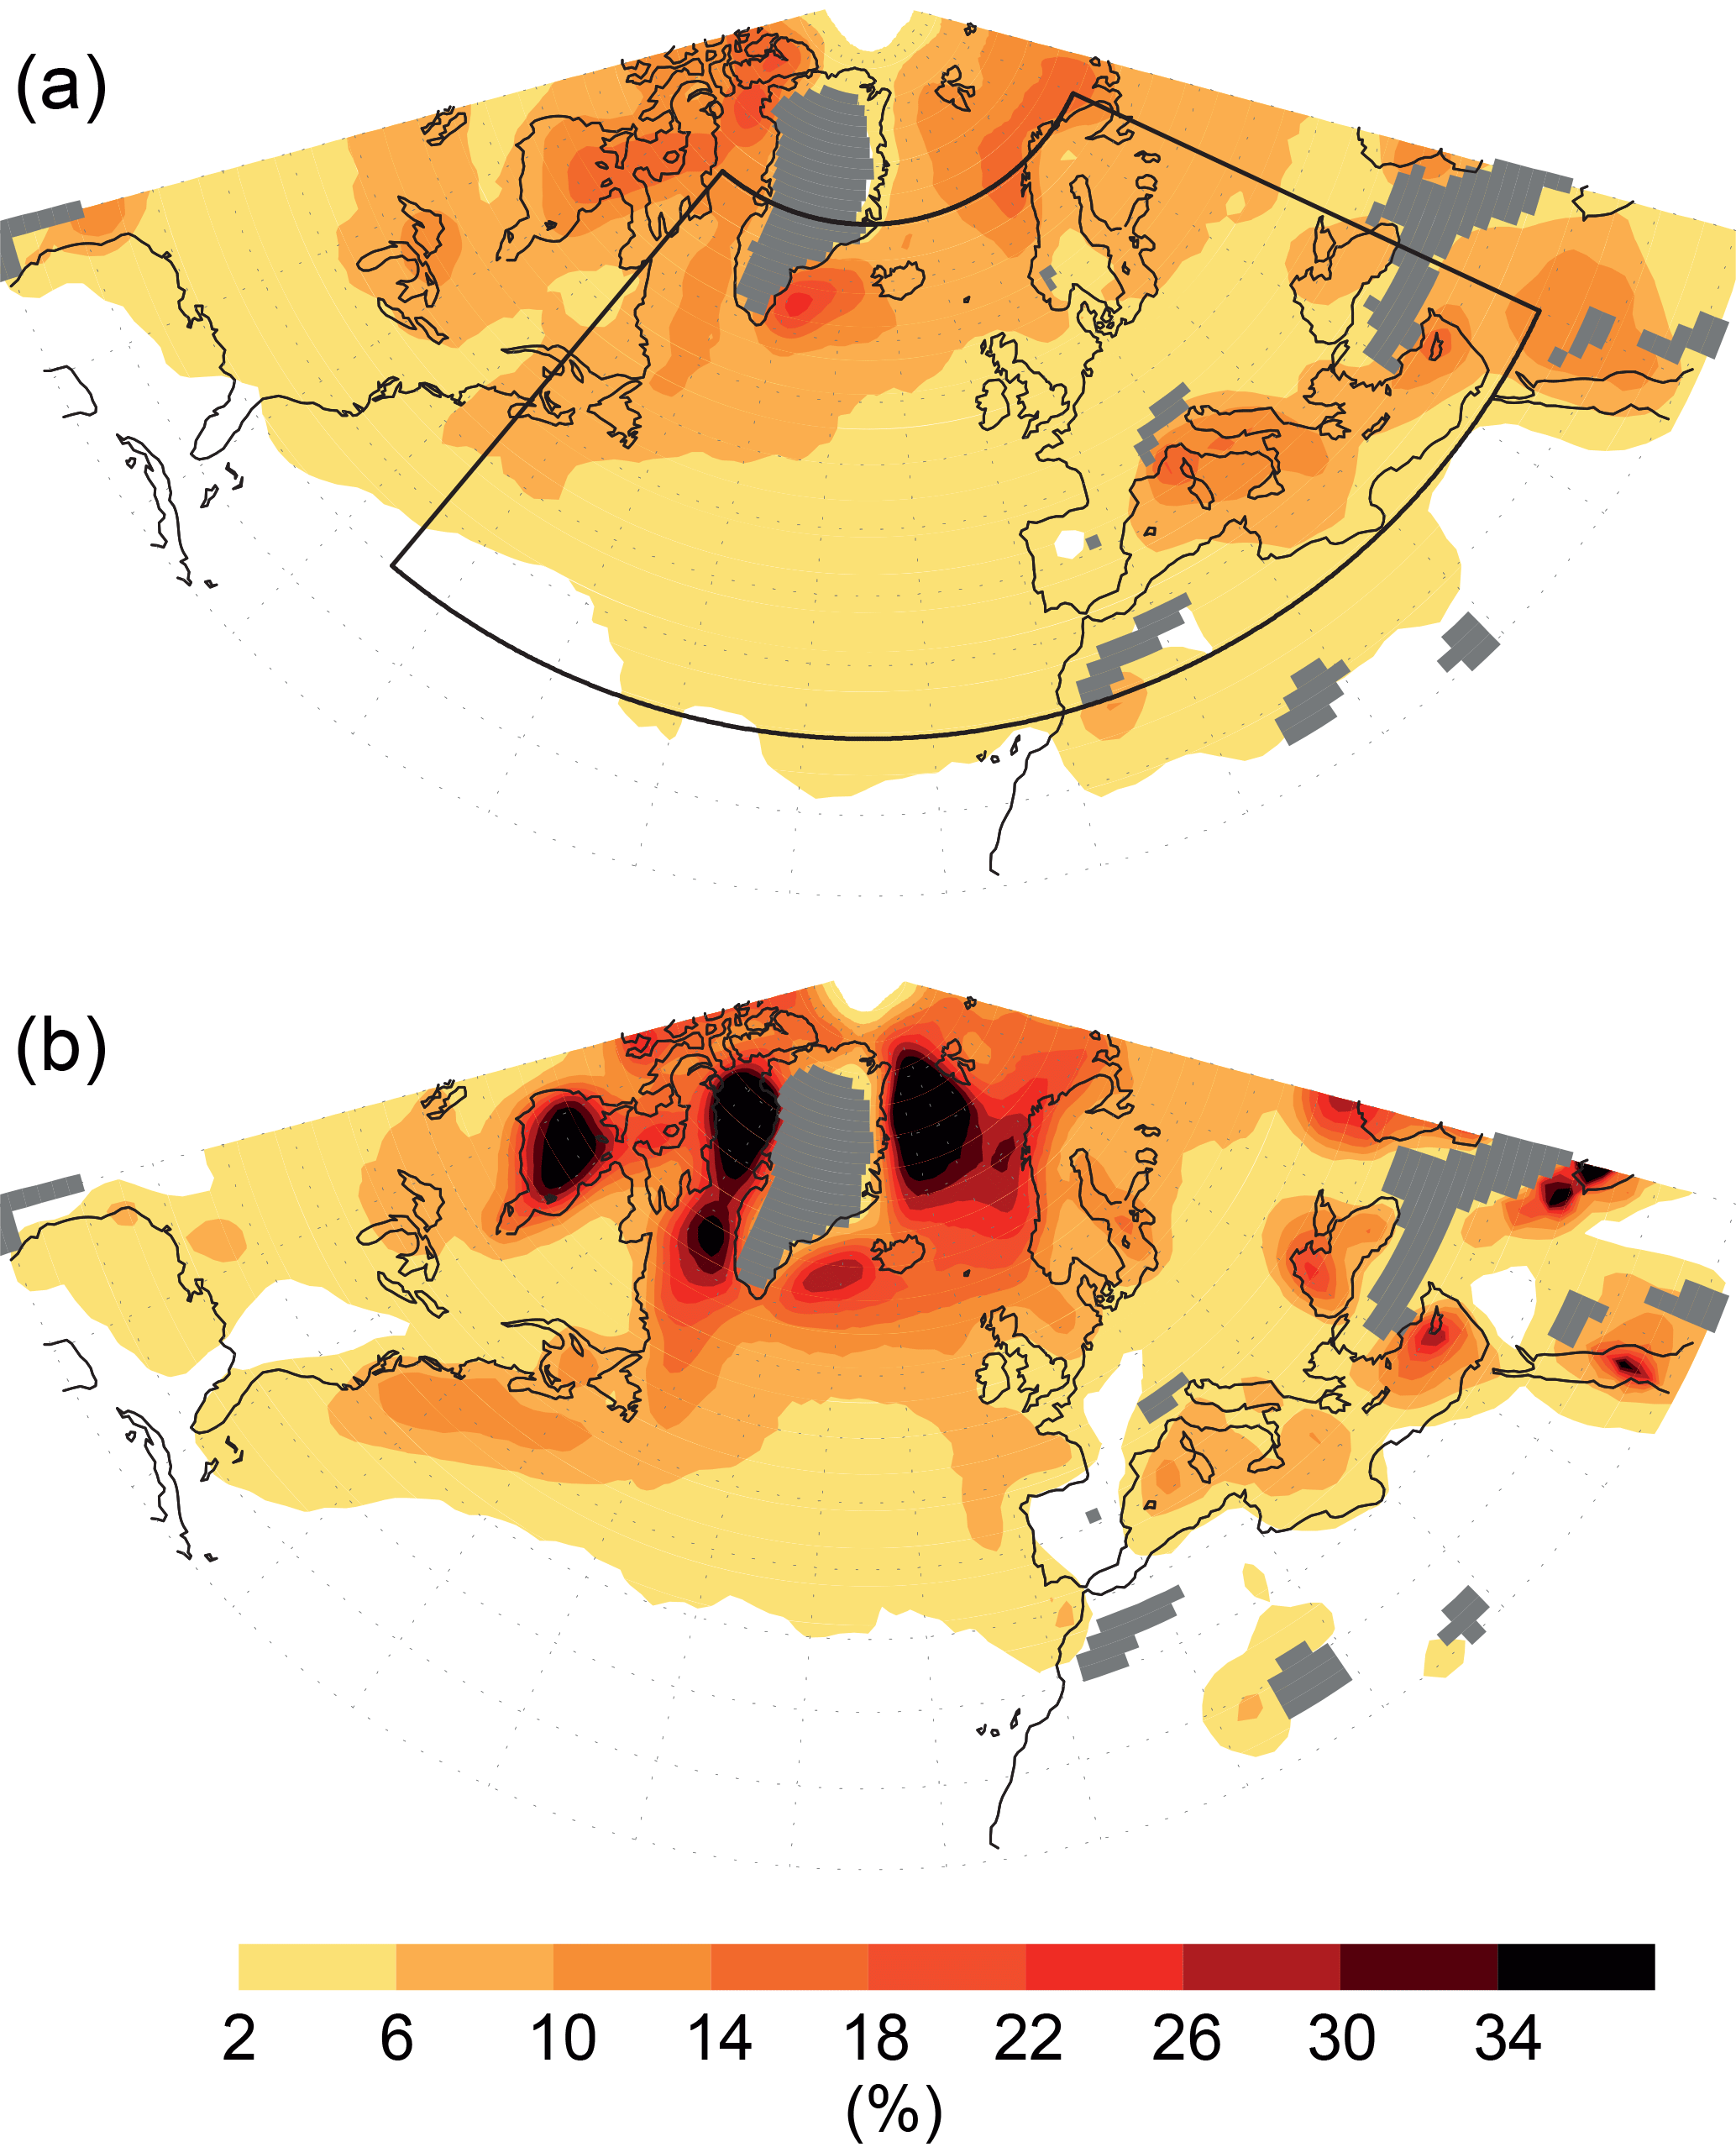
Figure 2Cyclone center frequency (percent presence per season) for (a) the ERA-Interim and (b) the CESM simulation for the period AD 1980–2009 in winter (DJF). The bounded domain illustrates the North Atlantic region used to estimate different cyclone characteristics. Grey areas are higher than 1 km above sea level and are excluded from the cyclone detection and tracking method. A 10 % presence per season means that in 10 % of the winter season a cyclone is present at a grid point.
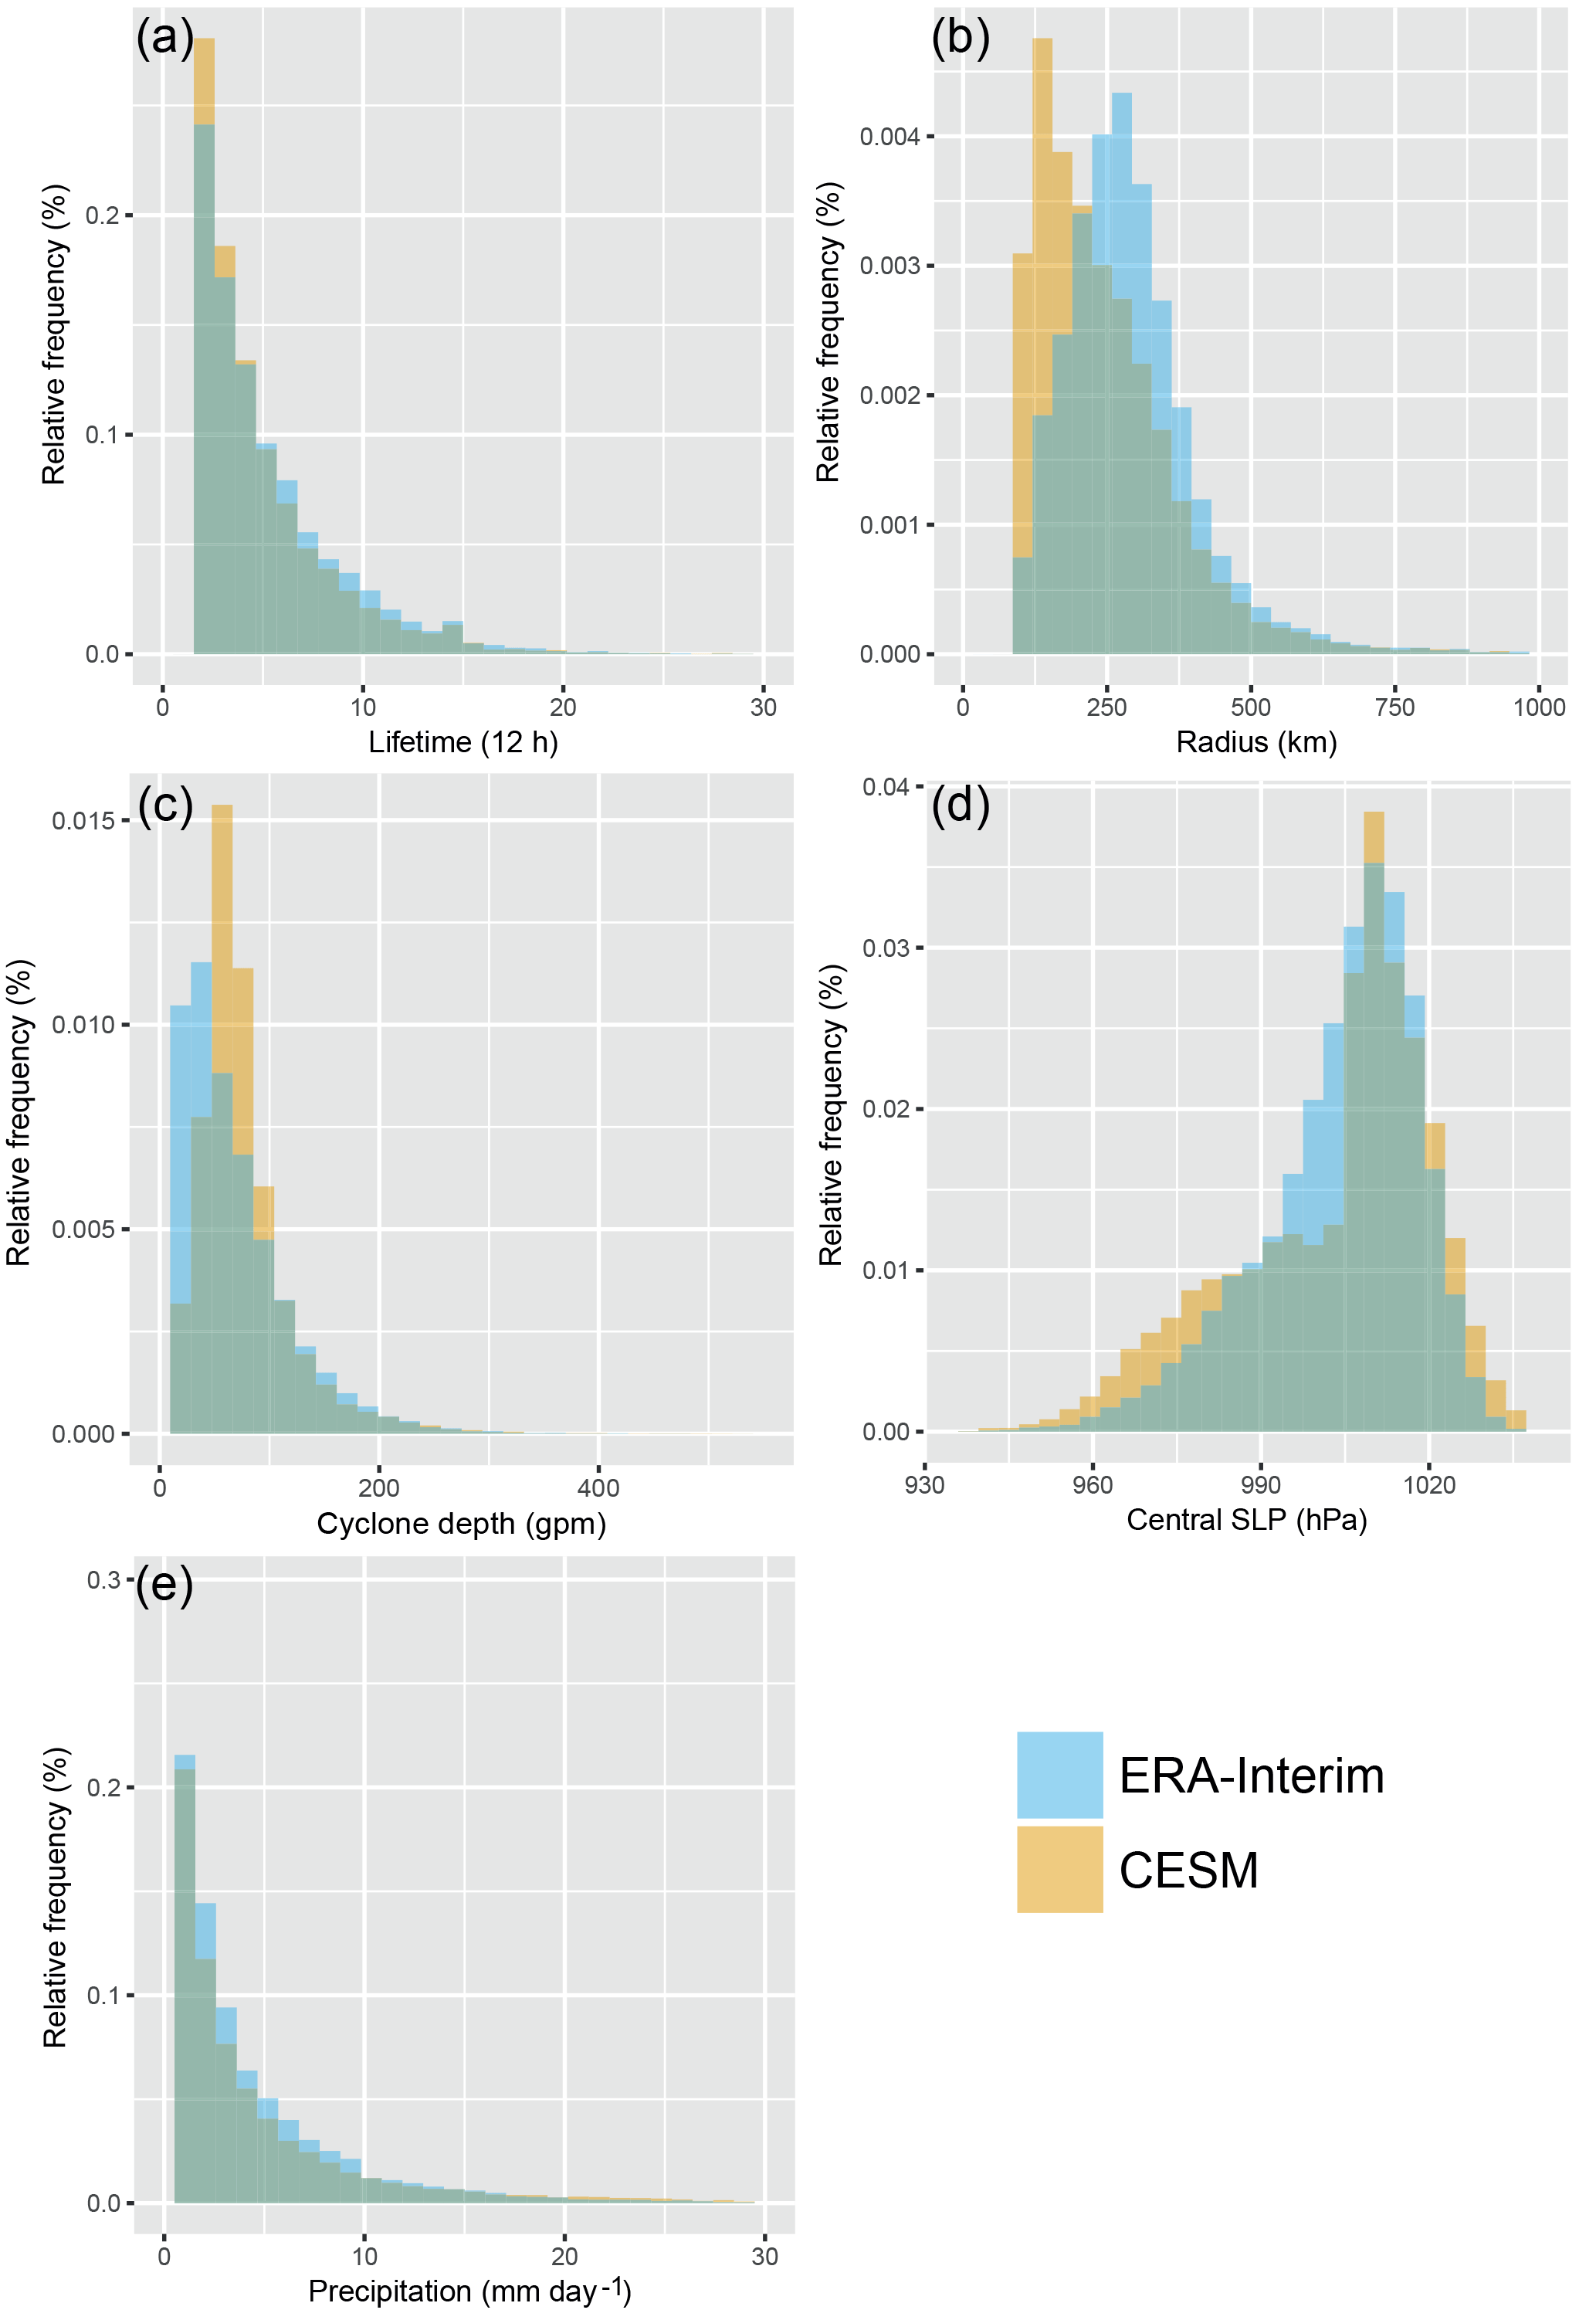
Figure 3Histograms of different cyclone characteristics: (a) lifetime of cyclones, (b) radius of cyclones and (c) cyclone depth, (d) central SLP and (e) cyclone-related precipitation. The histograms are based on the cyclones detected from 1981 to 2010, i.e., 7624 cyclones in ERA-Interim and 12 369 in CESM.
Figure 2 shows the cyclone frequency of the CESM simulation and ERA-Interim. The main centers of enhanced cyclone occurrence are realistically simulated, i.e., cyclone genesis region over North America, the North Atlantic storm track, as well as the Iceland low pressure region. Still, the CESM tends to simulate more cyclones over the North Atlantic compared to ERA-Interim. This bias remains even when using the ERA-Interim data in 0.75∘ resolution. Some differences are found around Greenland and the Hudson Bay where CESM overestimates the cyclone frequency. The reason for this is partly the fact that geopotential height over orography is extrapolated to 1000 hPa, leading to artificial high pressure and thus to low pressure in the surrounding. The biases are slightly reduced for strong cyclones using cyclone depth as a measure. Another caveat is visible over the Mediterranean where CESM slightly underestimates cyclones over the western and central Mediterranean and overestimates cyclone occurrence in the eastern part. Thus, the interpretation of the results over these regions requires particular caution.
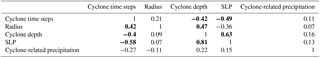
Table 1Correlation between different cyclone characteristics. The upper right side of the table represents CESM correlation, and the lower left side represents ERA-Interim. Bold numbers indicate significant correlation at the 5 % level using a two-sided Student's t test. For this analysis, the central SLP time series is multiplied by −1 so that low central pressure corresponds to a high cyclone depth resulting in a positive correlation.
To further assess the model's ability in extratropical cyclone simulation, distributions of different cyclone characteristics are presented in Fig. 3. We focus on the North Atlantic (marked in Fig. 2a). Note that the region excludes the main biases around Greenland. The cumulative cyclone presence is 22 993 in CESM and 15 590 in ERA-Interim. One reason for this overestimation is that CESM generates more short-lived cyclones (<48 h) as illustrated by the lifetime of the cyclones (Fig. 3a). Assessing the short-lived cyclones, we find that these cyclones are on average smaller (radius) and weaker (central pressure or cyclone depth measure, not shown). Thus, more weak cyclones are identified in CESM compared to ERA-Interim, which partly explains the higher cyclone frequencies (Fig. 2) also in the area of high biases around Greenland. Another difference between CESM and ERA-Interim is that the radius of the simulated cyclones is reduced, although the general shape of the distribution agrees with ERA-Interim. Reasons for this reduction could be manifold, e.g., related to the model's formulation of numerical diffusion or the interpolation of ERA-Interim. The latter was tested in the original 0.75∘ resolution of ERA-Interim. As expected, we identify a higher cyclone presence but the median radius is slightly increased (by roughly 5 %) in the original resolution of ERA-Interim. The wind-sensitive measures show an interesting behavior. Although the shape agrees between CESM and ERA-Interim, CESM shows more wind-intensive cyclones when considering the measure cyclone depth. The central SLP measure shows a similar behavior; i.e., intense cyclones show a lower central SLP for CESM than for ERA-Interim. However, weak cyclones have a higher central pressure in CESM than in ERA-Interim. Again, the latter is affected by the fact that CESM simulates more short-lived cyclones, which are weaker on average. The cyclone-related precipitation shows that CESM slightly underestimates precipitation except for extreme precipitation events (>17 mm day−1).
Besides the distributions, the model should also be able to simulate interannual connections between the indices (if they exist). To uncover such connections, the cumulative cyclone presence, median of the cyclone radius and the 90th percentile of cyclone depth, SLP and cyclone-related precipitation in each winter season are estimated and the resulting time series are considered. Table 1 summarizes pairwise correlations for these quantities derived from CESM and ERA-Interim, respectively. Significant correlations (5 % significance level) are found between the two wind-related intensity measures, extreme cyclone depth and SLP, as well as between the cumulative cyclone presence and these two measures. Most of the significant observed correlations are reproduced by CESM, though with slightly lower coefficients. The observed correlation between cumulative cyclone presence and the median radius is not simulated by CESM, while cyclone depth and radius are correlated in CESM but not in the observations.
In summary, CESM is able to realistically simulate cyclones, their extreme characteristics and the connections among different cyclone characteristics. Some of the discrepancies from ERA-Interim can be traced back to the tendency that CESM overestimates the number of weak cyclones.
4.1 Cyclone intensities during the last millennium
To investigate periods of different cyclonic activity, we define moving averaged indices for all cyclone characteristics, i.e., the cumulative cyclone presence, median of the cyclone radius and the 90th percentile of cyclone depth, SLP and cyclone-related precipitation (for definition, see Sect. 2). First, the indices are estimated for each winter season separately and then averaged over 30-year periods. The resulting time series are shown in Fig. 4.
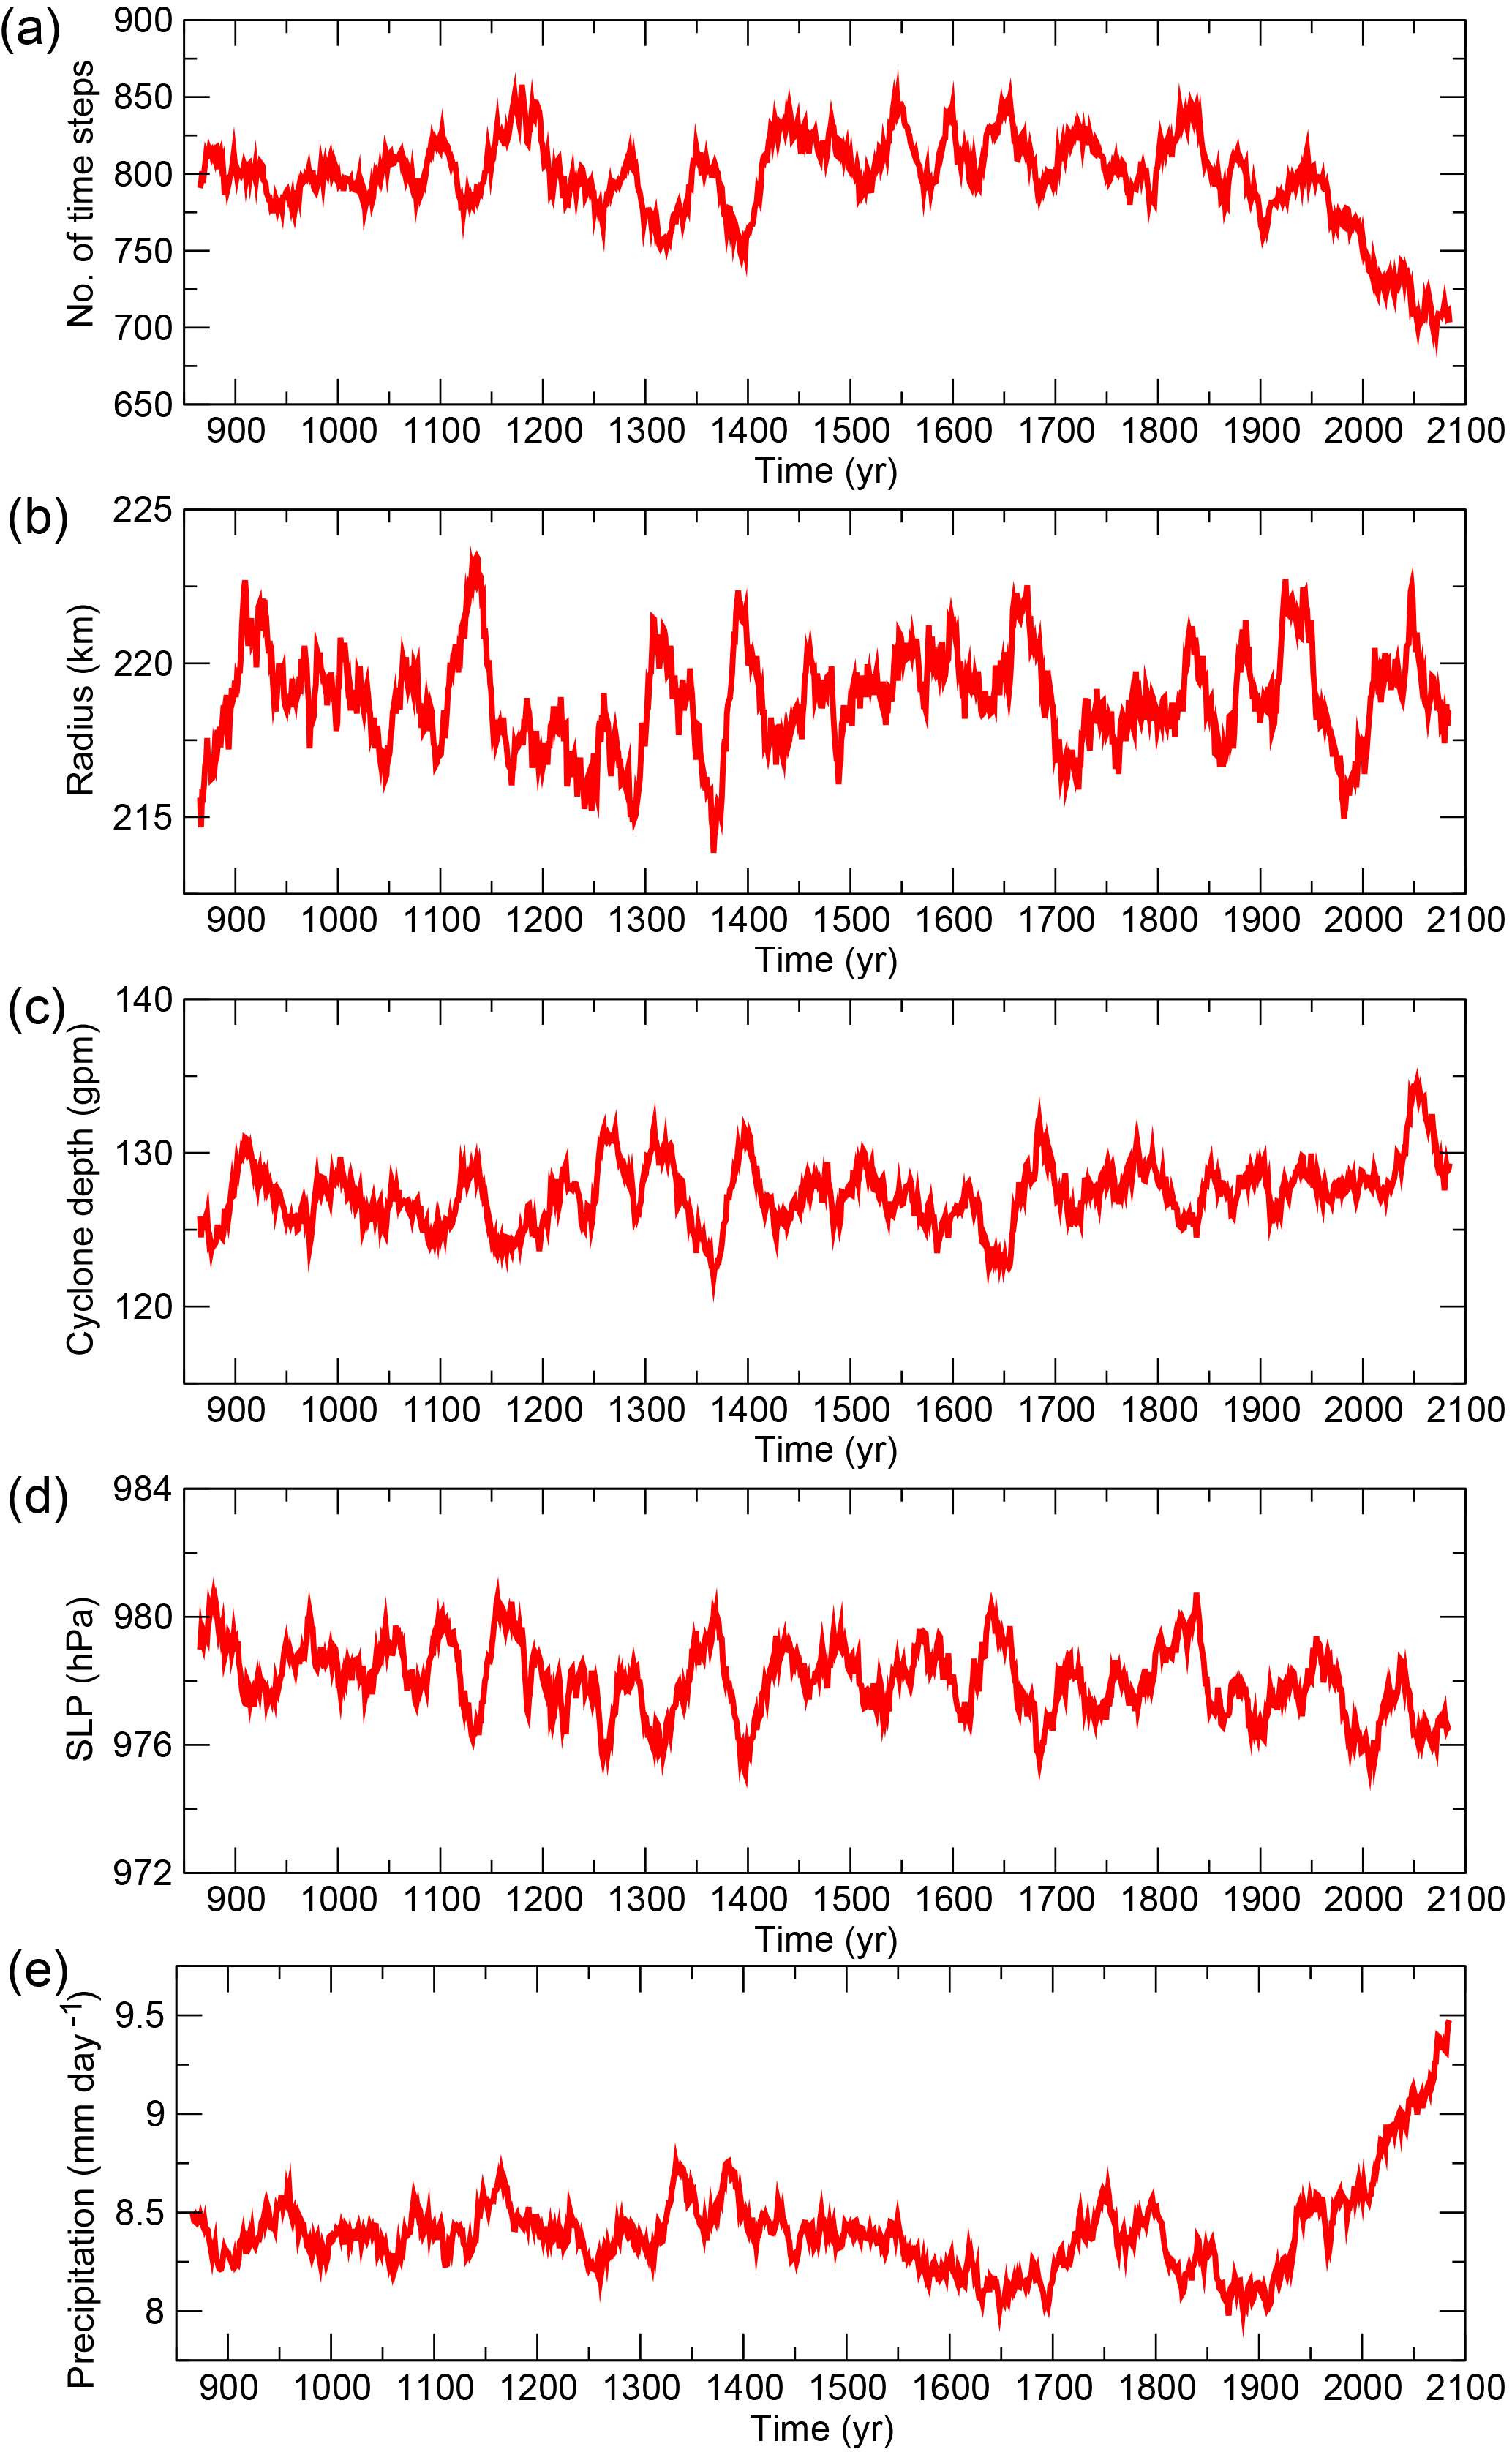
Figure 4Long-term time behavior of different cyclone characteristics illustrated by time series averaged with a 30-year running window: (a) cumulative cyclone presence, (b) median radius of the cyclones and 90th percentile of (c) cyclone depth, (d) central SLP and (e) cyclone-related precipitation.
In the years prior to AD 1850, all indices exhibit strong decadal to multi-decadal variability (Fig. 4). The cumulative cyclone presence shows a clear negative trend after AD 1850 and leaves the pre-industrial range around the year 2000. Thus, the CESM projects a lower number of cyclones for the 21st century in the North Atlantic. The geometry illustrated by the median radius of the cyclones remains unaffected by external forcing at a first glance and varies between about 215 to 222 km.
Extreme cyclone depth and central SLP both show a weak trend (positive for cyclone depth and negative for central SLP but not significant) over the entire time series towards higher wind extremes by the end of the 21st century. They also agree in some of the periods with high intensities, e.g., decades around the 1300s, 1400s, 1680s, 2060s, but around the year 2000 extreme SLP indicates its lowest values, whereas extreme cyclone depth seems to indicate average years. This difference is a clear indication that it is useful to investigate different intensity measures to conclude on cyclone-related wind extremes. Note that cyclone depth is more related to wind due to the geostrophic approximation compared to SLP, which might be influenced by the background pressure (if more cyclones are detected in the low pressure belt, they will have deeper central pressure but not necessarily stronger winds).
Extremes in cyclone-related precipitation clearly react to external forcing. Already before 1850, colder periods (17th century and 19th century), which are partly caused by reduced solar and enhanced volcanic forcing, show lower-than-average 90th percentile cyclone-related precipitation, whereas warmer periods are associated with higher-than-average values. Clearly, the warmest period in the simulation is the 21st century and there a strong and significant positive trend is simulated.
Some of the new results presented here confirm earlier studies with coarser resolved coupled climate models, e.g., the decrease of cyclone time steps from the pre-industrial to the future climate state (e.g., Raible et al., 2007). Still, there are also differences. Raible et al. (2007) suggested a decrease in wind-related intensity from the Maunder Minimum to the present-day climate state and attributed this decrease to generally reduced baroclinicity. This is in contrast to the new simulation where no clear sign of an intensification or weakening is found. One reason for this mismatch is that the resolution of the model in Raible et al. (2007) was around 4∘, which led to a general underestimation of cyclone occurrences. Furthermore, the CESM simulation shows high internal variability, as illustrated by the decadal to multi-decadal variations of the two wind-related indices, so that different processes responsible for extreme cyclones (like baroclinicity in the lower and upper troposphere, low-level meridional temperature gradient and/or diabatic processes) may interplay differently. Note that the atmospheric component is improved (Neale et al., 2013) and diabatic processes are better resolved in the CESM in this study compared to CCSM3 used in Raible et al. (2007).
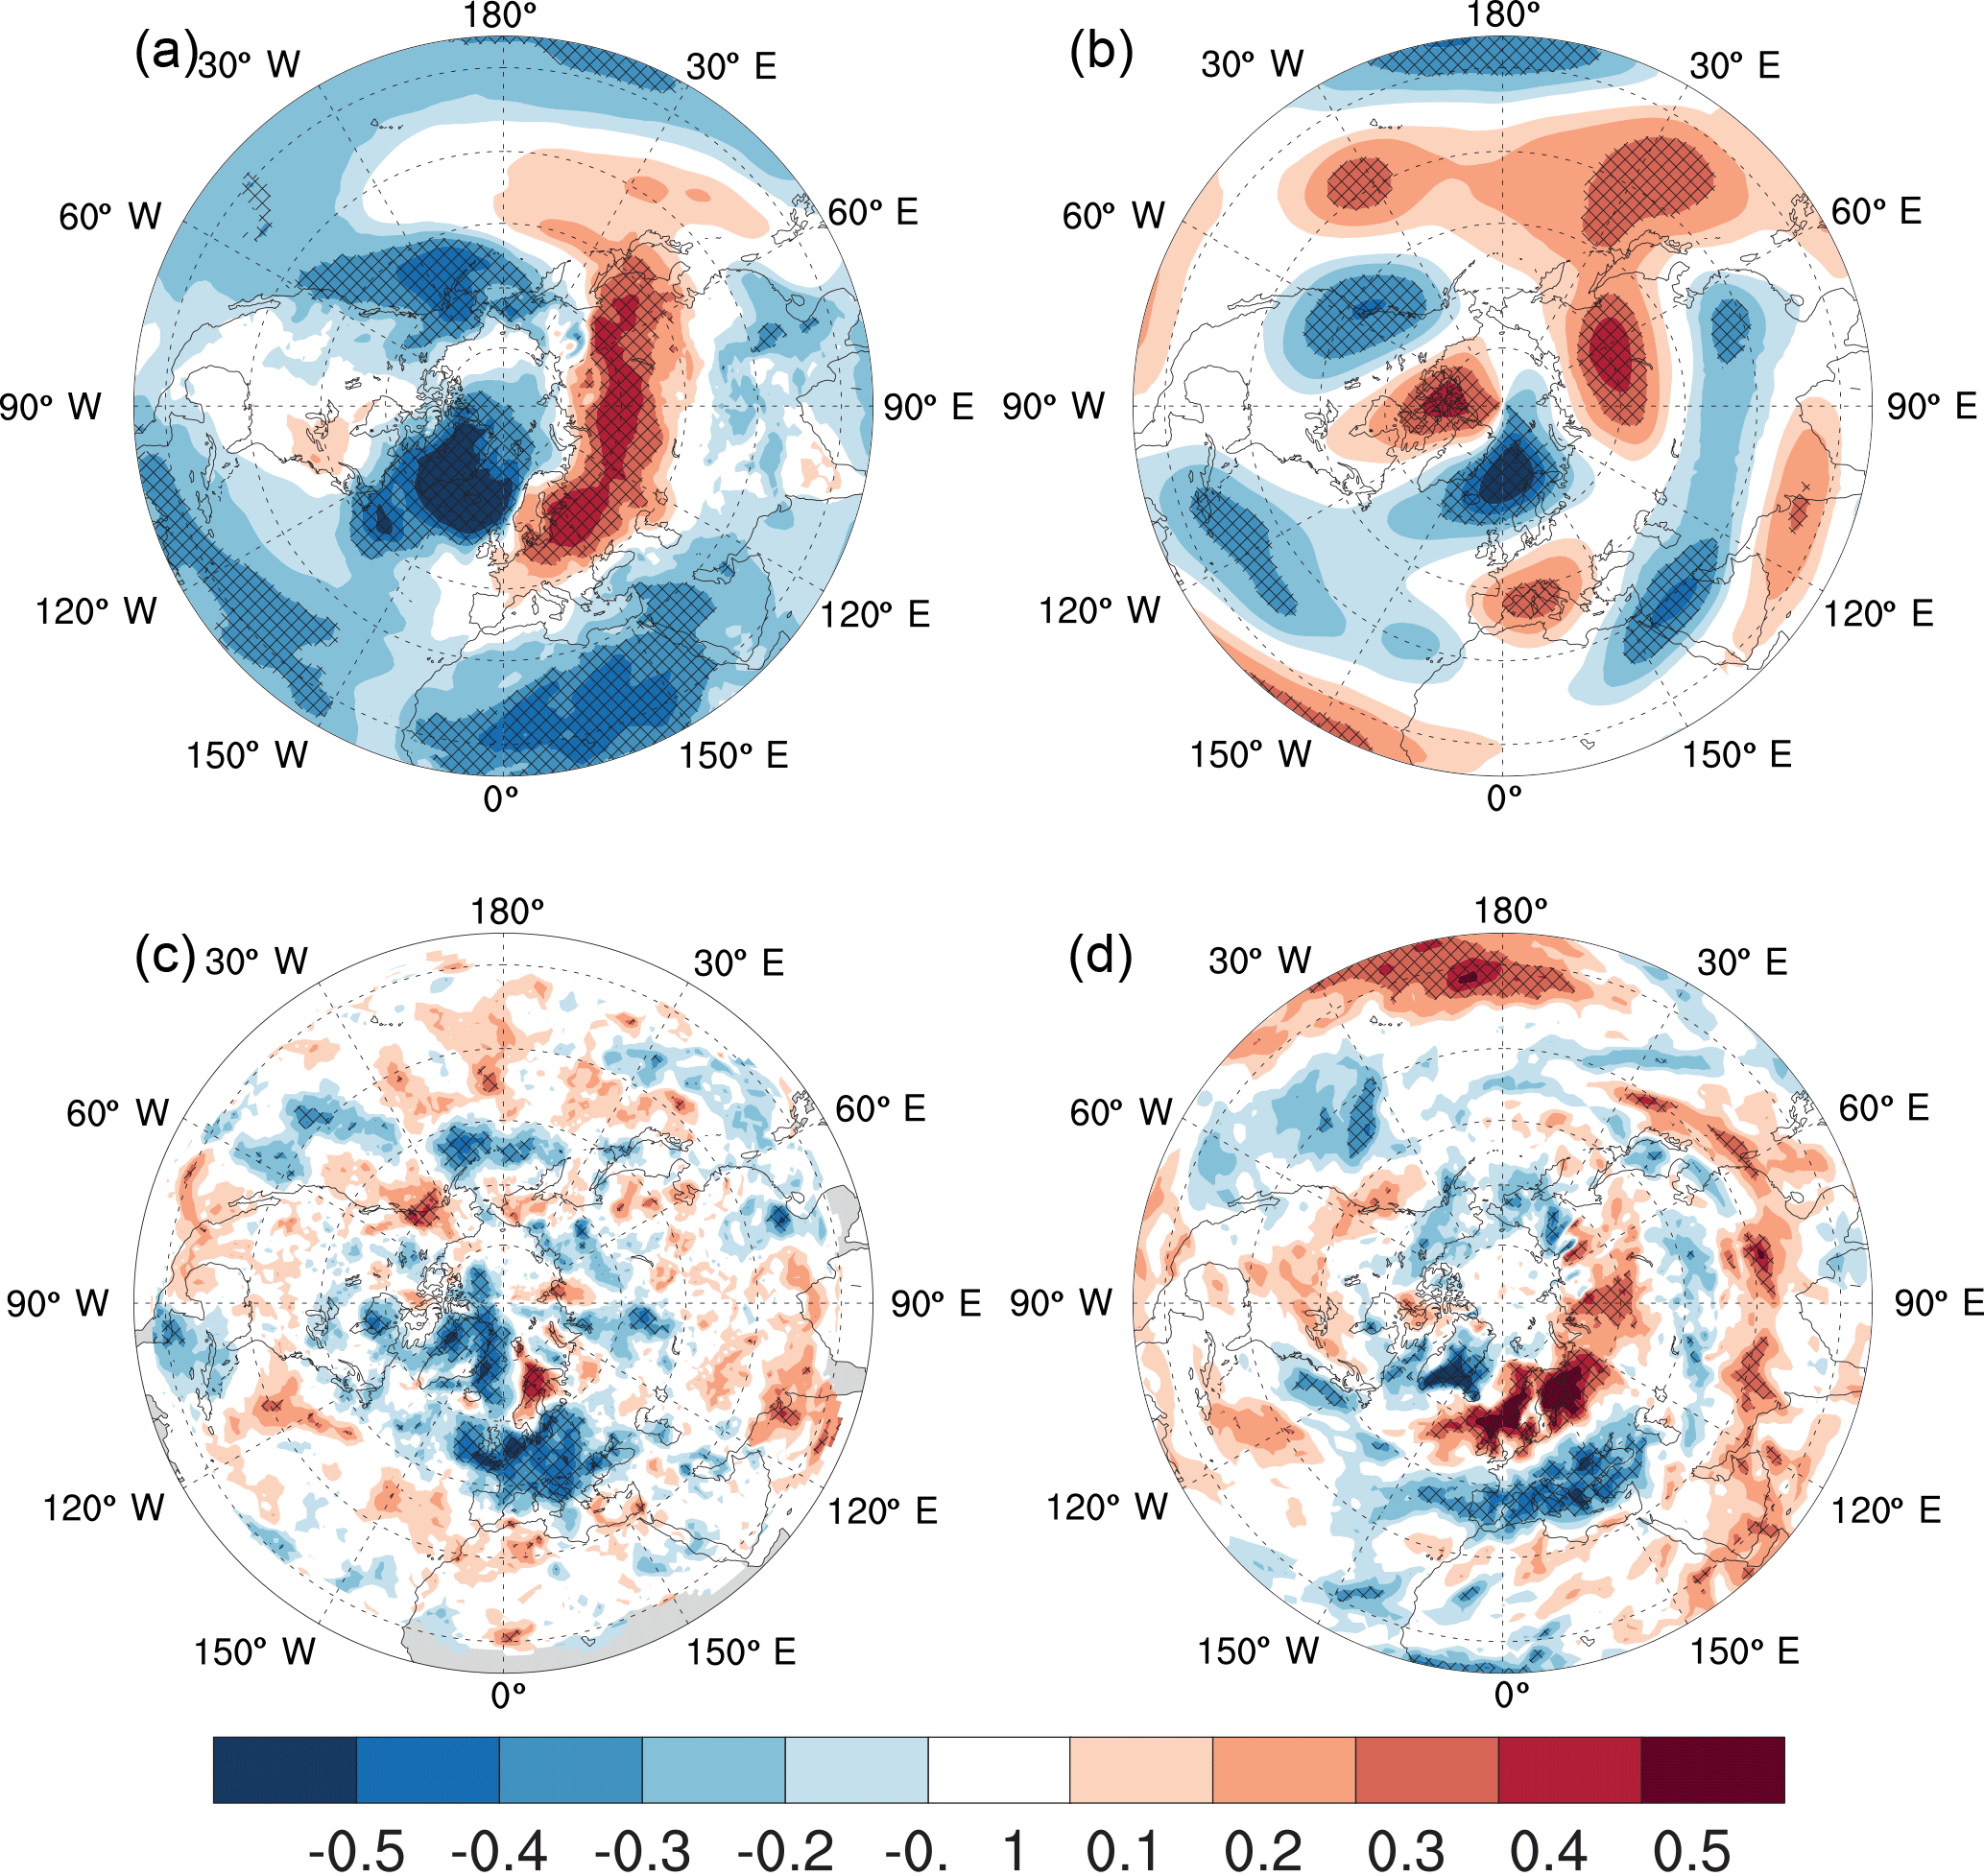
Figure 5Correlation between the 30-year running mean time series of extreme cyclone depth and (a) 2 m temperature, (b) 500 hPa geopotential height, (c) cyclone frequency and (d) precipitation for the period 850–1850 CE. The 5 % significance level using Student's t test is illustrated with cross-hatching.
4.2 Natural forcing impact on cyclone characteristics
So far, there is no clear sign that natural external forcing (volcanoes and solar variations) has a strong influence on cyclone characteristics, whereas at least cyclone-related precipitation shows a strong trend during the period of strong anthropogenic forcing. To disentangle natural and anthropogenic forcing impacts, we first focus on the potential volcanic and solar influence during the period 850–1850 CE.
To illustrate the volcanic forcing impact, the superposed epoch analysis is applied to the extratropical cyclone characteristics. The 10 strongest volcanic eruptions, according to optical depth anomaly, over the period 850–1850 CE are composed and time series of the different cyclone characteristics are presented as deseasonalized monthly anomalies from the 5 years preceding an eruption (similar to Lehner et al., 2015). Note that the 10 strongest eruptions all have a tropical origin. None of the cyclone characteristics show a volcanic forcing influence (therefore not shown). In particular, wind-related and precipitation-related extremes show no reaction after strong volcanic eruptions, although the North Atlantic Oscillation tends to be in its positive phase (Ortega et al., 2015), which has been suggested to be related to wind-intensive extratropical cyclones (Pinto et al., 2009). The missing volcanic forcing impact on precipitation-related extremes seems to be unexpected as global mean precipitation shows a clear reduction after strong volcanic eruptions (e.g., Frölicher et al., 2011; Muthers et al., 2014; Lehner et al., 2015). Thus, the results suggest that extremes in both wind and precipitation seem to be decoupled from the mean behavior.
A potential connection between cyclone characteristics and solar variations is investigated by correlating the 30-year running mean time series (Fig. 4) with the solar forcing (Fig. 1) over the period 850–1850 CE. The analysis with all cyclone characteristics shows that none of the characteristics have a significant correlation with the solar forcing (the highest correlation coefficient is 0.19 between solar forcing and extreme central pressure). We also tested lag correlations of up to ±30 years, but again the correlations were not significant at the 5 % level. To assess a potential connection to the 11-year cycle of the solar forcing, we performed a cross-wavelet analysis (Grinsted et al., 2004; Casty et al., 2011) using the time series of the cyclone characteristics in yearly resolution. Again, no robust connection is identified in the 11-year band (therefore not shown). Thus, a linear connection of mean and extreme cyclone characteristics to solar forcing is not found in the pre-industrial period of this simulation.
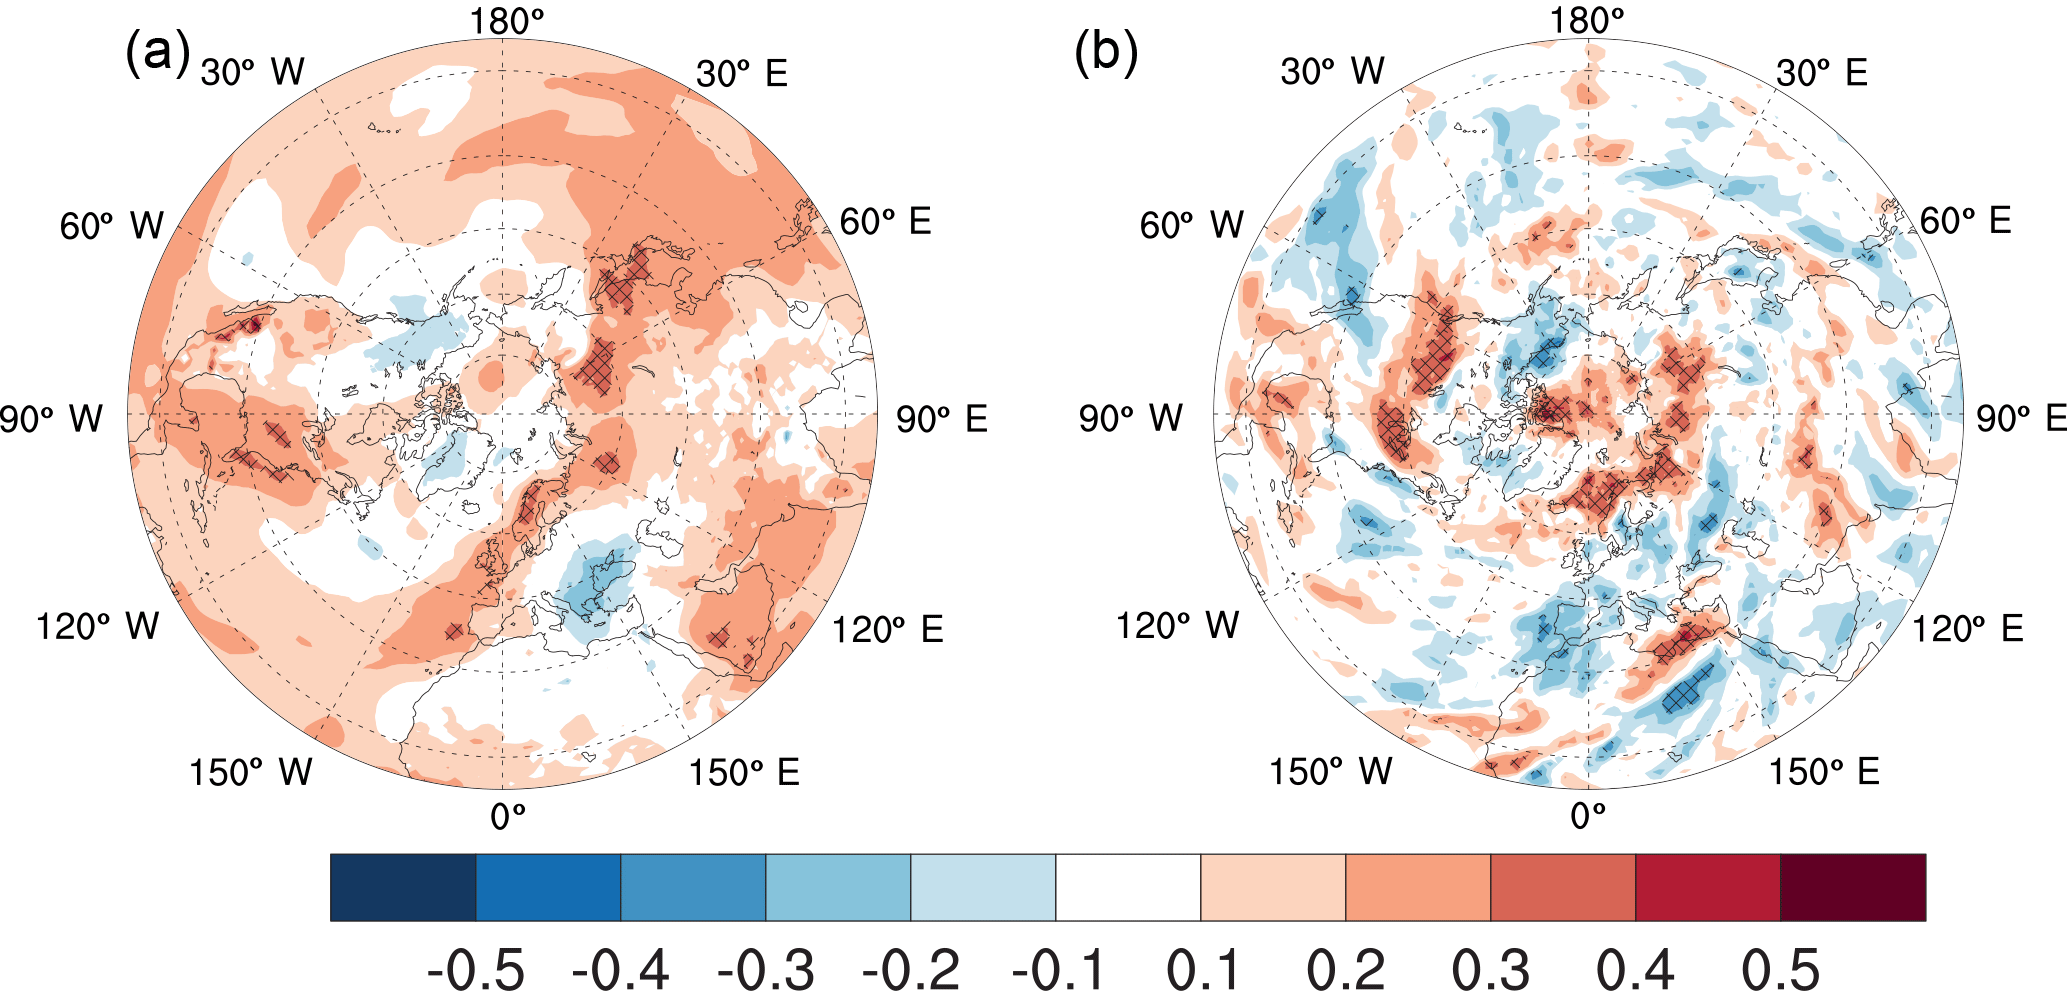
Figure 6Correlation between the 30-year running mean time series of extreme cyclone-related precipitation and (a) 2 m temperature and (b) precipitation for the period 850–1850 CE. The 5 % significance level using Student's t test is illustrated with cross-hatching.
4.3 Low-frequency variations of extreme cyclone characteristics during the last millennium
In the following, we will focus on the analysis of the two extreme cyclone characteristics for the period 850–1850 CE: 90th percentile of cyclone depth and of cyclone-related precipitation over the North Atlantic region. To obtain information on the low frequency of extreme cyclone characteristics, 30-year running averaged periods are investigated in more detail.
Correlation patterns between extreme cyclone depth with different variables like 2 m temperatures, 500 hPa geopotential height, cyclone frequency and mean precipitation show distinct significant (5 % level) patterns in the North Atlantic and over Europe (Fig. 5). Low-frequency variations of extreme cyclone depth correlate negatively with 2 m temperatures around Greenland and positively over northern and eastern Europe (Fig. 5a). This correlation is consistent with the correlation found between extreme cyclone depth and 500 hPa geopotential height (Fig. 5b). The pattern agrees with some aspects of the canonical pattern of the North Atlantic Oscillation (NAO) but is shifted to the northeast, in particular the center located over the Mediterranean Sea. The center north of Iceland of this pattern is baroclinic, as the corresponding centers of the correlation patterns with the 1000 hPa geopotential height are shifted to the east, resulting in a westward tilt with height (not shown). The negative correlations of the 2 m temperature around Greenland go hand in hand with negative correlations between extreme cyclone depth and the sea surface temperature (SST, not shown). These negative correlations are present over the entire North Atlantic basin, even if the southern part of the Atlantic does not show a statistically significant correlation. Furthermore, these negative correlations co-occur with positive correlations between extreme cyclone depth and sea ice around Iceland (not shown). Additionally, an increase in extreme cyclone depth is related to reduced cyclone frequency over Europe and to a reduction of cyclone-related precipitation around Greenland and an increase in cyclone-related precipitation around the British Isles to Scandinavia (Fig. 5c, d). Thus, the negative geopotential height anomaly (enhanced low pressure system in the middle of the atmosphere) steers the track of cyclones towards Scandinavia where the cyclone frequency correlates positively with extreme cyclone depth. Furthermore, the correlation pattern of extreme cyclone depth with 2 m temperature shows that Scandinavia is located in a region with an enhanced low-level horizontal temperature gradient and thus a strong baroclinicity when extreme cyclone depth is enhanced.
Another important region where low-frequency variations of extreme cyclone depth show significant correlations with other variables is southern Europe. Under high cyclone depth index conditions, it is a region of reduced low-level meridional temperature gradient. Such changes in the temperature field strongly reduce the low-level baroclinicity. Thus, cyclone frequency over central Europe and cyclone-related precipitation over southern Europe are reduced when cyclone depth index is enhanced (Fig. 5c, d, respectively).
Compared to the extreme cyclone depth, which shows distinct and statistically significant correlations, extreme cyclone-related precipitation reveals less clear results. The correlation pattern between extreme cyclone-related precipitation and the 500 and 1000 hPa geopotential height fields shows no statistically significant pattern (therefore not shown). The 2 m temperature reveals a slightly significant positive correlation along the European Atlantic coast (Fig. 6a). Thus, enhanced extreme cyclone-related precipitation is related to a warmer coastal line, which leads to increased moisture availability in winter and thus finally influences the precipitation especially over Iceland, Scandinavia and the Barents Sea (Fig. 6b).
In summary, this analysis shows that different circulation and temperature patterns are related to extreme cyclone depth and cyclone-related precipitation. Thus, we conclude that, on average, cyclones with extreme winds (measured by extreme cyclone depth) are disconnected from cyclones generating extreme precipitation over the period 850–1850 CE. Nevertheless, this might not be true for single isolated events. Note, however, that the analysis focuses on the mean of the North Atlantic to give a broad picture overview. Clearly, spatial variations of the cyclones' characteristics within the North Atlantic region cannot be assessed with the analysis presented.
4.4 Anthropogenic forcing impact on cyclone characteristics
Two of the cyclone characteristics (Fig. 4a, e) show strong trends in the 20th and 21st centuries and thus are influenced by GHG forcing: the cumulative cyclone presence and the cyclone-related precipitation. In contrast, the wind intensity measured by either central pressure or cyclone depth shows no significant trend in the 21st century (Fig. 4c). In the following, we discuss the behavior in the 21st century of the cyclone depth measure and cumulative cyclone presence with respect to trends of temperature, mean precipitation and cyclone frequency in order to assess potential processes for GHG-induced changes in cyclone characteristics. For the trend in cyclone-related precipitation, the relevance of thermodynamic processes is investigated by assessing the Clausius–Clapeyron relation.
The temperature trends shown in Fig. 7a are in line with the patterns assessed in the Intergovernmental Panel on Climate Change 2013 report (IPCC, 2013), suggesting a strong warming of the polar areas due to polar amplification. Additionally, a stronger positive temperature trend is found over land than over ocean due to the difference in heat capacity. In the central North Atlantic, no significant warming is found, again in line with IPCC (2013). The latter is related to changes in the ocean circulation, i.e., a weakening of the AMOC as projected by most of the comprehensive climate models. These different trends lead to a change in horizontal surface temperature gradients, which is a prerequisite for baroclinicity and thus cyclone development and enhancement. In particular, the contrast between the North Atlantic and Scandinavia is enhanced, a feature also found in the correlation pattern of extreme cyclone depth with temperature in the period 850 to 1850 (Fig. 5a). If similar processes worked for decadal variations in the Common Era and the future, we would expect to see a positive trend in extreme cyclone depth, which is not the case in Fig. 4c. Thus, we hypothesize that other processes such as increased static stability (Raible et al., 2010) and the overall decreased low-level meridional temperature gradient – both reducing cyclones and wind-related intensity – compensate for the locally increased baroclinicity near Scandinavia.

Figure 7Trends from 2005 to 2100 for (a) 2 m temperature, (b) precipitation and (c) cyclone frequency. Only significant trends at the 5 % significance level using Student's t test are shaded. Grey areas in panel (c) are excluded from the cyclone detection and tracking method (1000 m a.s.l.).
Mean precipitation trends also resemble the results presented in the latest IPCC assessment (IPCC, 2013), showing a negative trend over the Mediterranean and a wetting in high latitudes (Fig. 7b; Santos et al., 2016). This is a first hint that cyclones are redistributed in the future, as most of the precipitation in winter in the midlatitudes originates from cyclones. Figure 7c shows the cyclone frequency trend pattern for the 21st century with significant negative trends mainly over the Mediterranean and partly over the central North Atlantic. This pattern resembles the precipitation trends and illustrates the connection between cyclone occurrence and precipitation. As we find a reduction of 12.5 % in the cumulative cyclone presence over the entire region (Fig. 4a), the reduction over the Mediterranean and the central North Atlantic cannot be compensated by the positive trends found over Scandinavia and the Hudson Bay (note that only a small part of the Hudson Bay is included in the area (Fig. 2) of the indices). Again, the signals over the Mediterranean resemble earlier findings obtained with different models (e.g., Lionello and Giorgi, 2007; Raible et al., 2010). In these studies, enhanced static stability together with enhanced stationary wave activity are the main reasons for reduced cyclone activity over the Mediterranean.
The most striking trend of the cyclone characteristics in Fig. 4 is the positive trend of extreme cyclone-related precipitation in the 20th and 21st centuries, similar to findings of Zappa et al. (2013). The trend pattern of temperature (Fig. 7b) suggests an overall warming, and thus the capability of the air to hold moisture is strongly increased in the 21st century.
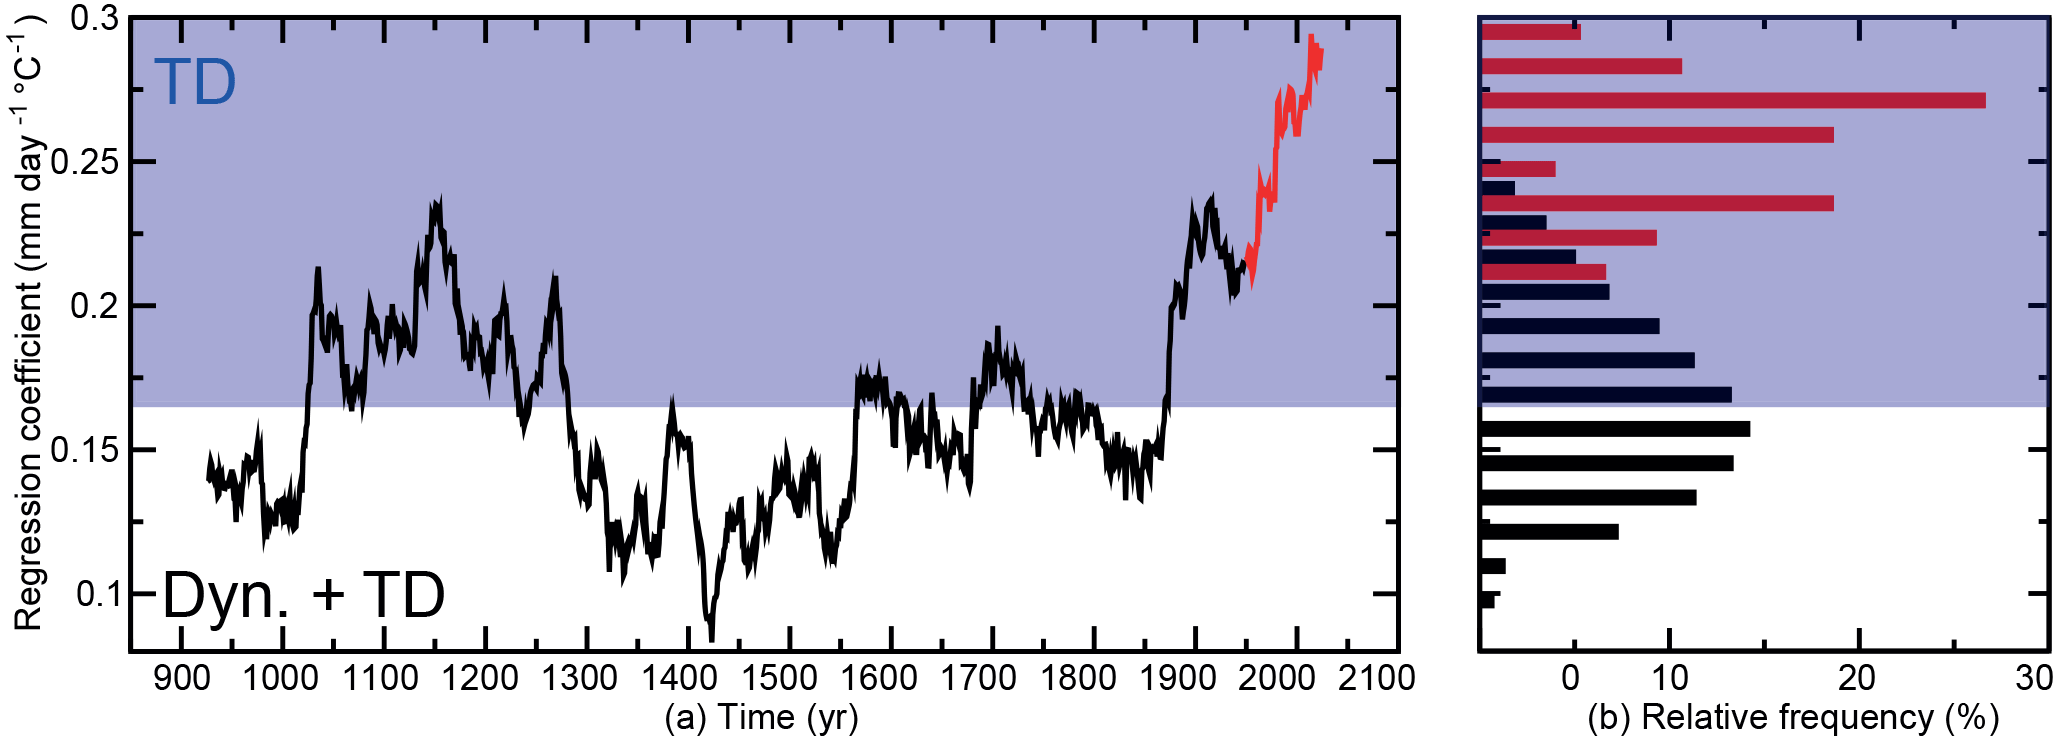
Figure 8Time series of regression coefficient estimated between mean cyclone-related temperature and 90th percentile of cyclone-related precipitation for a 150-year window running through the entire period from 850 to 2100: Common Era (black) and era influenced by RPC8.5 (red). Panel (b) shows the histogram of the regression coefficients for the two periods (bin width 0.01). All periods within the blue shading follow the Clausius–Clapeyron relation, named thermodynamic (TD) (O'Gorman and Schneider, 2009). In the white area, dynamics (Dyn.) and thermodynamics are relevant.
To test whether the trend of extreme cyclone-related precipitation is mainly due to thermodynamics, we estimate the regression coefficients β between 90th cyclone-related precipitation and mean cyclone-related temperature for the entire simulation in a 150-year running window (similar results are obtained with a 100-year running window). These regression coefficients are compared with the range given by the Clausius–Clapeyron relation, i.e., a 2 %–3 % increase in precipitation per 1 ∘C temperature increase (O'Gorman and Schneider, 2009). Note that by attributing the two variables' 90th percentile of precipitation and temperature to the cyclone we obtain to some extent a regionalized view.
The regression coefficients for the period 1851–2100 show a strong shift to the upper bound of the Clausius–Clapeyron relation (3 % increase in precipitation per 1 ∘C), a level never reached during the Common Era (Fig. 8). This is in line with recent results of Neelin et al. (2017), who found that the interplay of moisture convergence variance and precipitation loss increases under global warming. Thus, the result of the 20th and 21st centuries agrees with other findings that show that extreme precipitation is mainly thermodynamically driven, as it follows the Clausius–Clapeyron relation under global warming (e.g., Pall et al., 2007; O'Gorman and Schneider, 2009; Pendergrass and Gerber, 2016; Neelin et al., 2017). Interestingly, we find that roughly 50 % of the periods in the Common Era show a different behavior where extreme cyclone-related precipitation reacts less to temperature changes than the Clausius–Clapeyron relation would predict, as illustrated by regression coefficients below 0.16 mm day−1 ∘C−1. Thus, we show that the hypothesized general governance of the Clausius–Clapeyron relation on extreme precipitation (e.g., Pall et al., 2007; O'Gorman and Schneider, 2009) seems to be time dependent. Hints that this is not just a model result are found in proxy records over Europe, e.g., flood occurrences also cluster during rather cold periods in the Common Era (e.g., Czymzik et al., 2010; Wirth et al., 2013; Glur et al., 2013; Amann et al., 2015).
Extratropical cyclone characteristics are investigated for the period 850 to 2100 CE in a seamless transient simulation using CESM (version 1) with the focus on the North Atlantic European region and the winter season (DJF).
The evaluation under present-day conditions shows that CESM is able to realistically simulate cyclones and their characteristics, though some biases to the reanalysis product ERA-Interim remain.
Before 1850, the variability of cyclone characteristics is dominated by internal variability showing pronounced low-frequency variations of different cyclone characteristics. The extreme wind-related characteristics show a significant connection to the large-scale dynamics on decadal timescales. This northeastward displaced NAO-like connection resembles earlier findings for decadal to multi-decadal timescales (Raible et al., 2007; Pinto and Raible, 2012). The index representing cyclone-related precipitation is only weakly related to the background temperatures and large-scale dynamics on these timescales. The different cyclone characteristics are not correlated with each other over time, being a first indication that external forcing plays no dominant role in generating these variations. A more detailed analysis of the volcanic and solar forcing imprint confirms this and thus earlier findings with other coarsely resolved climate models (Fischer-Bruns et al., 2005; Raible et al., 2007).
Future changes are found in two cyclone characteristics: the cumulative cyclone presence and the extreme cyclone-related precipitation. The extreme cyclone depth measure remains unchanged in the 21st century. Zappa et al. (2013) found a similar increase in precipitation but showed a significant decrease of extreme wind intensity under future climate change using CMIP5 multi-model simulations. A possible explanation for the differing results with respect to extreme cyclone depth is the fact that in this study only one simulation is used. Still, the agreement in extreme cyclone-related precipitation between this study and Zappa et al. (2013) shows that these changes are pronounced and that we should be able to detect these changes at the beginning to the middle of the 21st century, irrespective of the realization of natural variability. The cumulative cyclone presence shows a reduction in the 21st century. This change is already found in studies using coarsely resolved ensemble simulations with an earlier version of CESM, which compare present-day climate with the pre-industrial climate (e.g., Raible et al., 2007). The main decrease of cyclone occurrence is found over the Mediterranean. Using future simulations with another global climate model shows a similar decrease in the Mediterranean (e.g., Ulbrich et al., 2009; Raible et al., 2010; Zappa et al., 2013). The process driving the reduction of cyclones over the Mediterranean is the increase in stability and changes in the stationary wave production over the region in winter (Raible et al., 2010). The other characteristic, which shows a dramatic increase in the future, is the extreme cyclone-related precipitation. This increase is driven by the temperature increase and the Clausius–Clapeyron relation, i.e., purely thermodynamically driven. This is in line with a recent study of Neelin et al. (2017). Thus, changes in the dynamics seem to be less important for changing precipitation extremes related to winter cyclone activity in the future.
Extending the analysis of the Clausius–Clapeyron relation back in time reveals prolonged periods in the Common Era where extremes do not follow the Clausius–Clapeyron relation. Thus, we hypothesize that in the Common Era both dynamical and thermodynamical processes can be dominant, whereas in the last 100 years and the future under RCP8.5 thermodynamical processes govern extreme events in cyclone-related precipitation. This result is important as many proxy-based studies show that during cold periods of the Common Era hydrological extreme events occur more frequently (Czymzik et al., 2010; Wetter, 2012; Wirth et al., 2013; Glur et al., 2013; Amann et al., 2015). For example, Amann et al. (2015) recently showed in lake sediments that flood occurrences are enhanced during the LIA, a period known to be cold in Europe – a behavior, which cannot be explained by the Clausius–Clapeyron relation. As the model simulation in this study also shows periods where the Clausius–Clapeyron relation is unable to explain above-normal extreme cyclone precipitation (14th to 15th centuries), we hypothesize that these periods were dominated by variability of dynamical processes. Moreover, our simulations show that these variations are mainly driven by internal variability and that no systematic response to external forcing like during the LIA is evident. So, based on our results, the proxies (e.g., Czymzik et al., 2010; Wetter, 2012; Wirth et al., 2013; Glur et al., 2013; Amann et al., 2015) might just show natural internal variability, and hence there is no clear justification to interpret them in context of the LIA (i.e., volcanoes and solar forcing).
Thus, future work shall concentrate on processes of low-frequency changes in cyclone characteristics and the Clausius–Clapeyron relation, e.g., to assess the role of atmosphere–ocean–sea-ice interaction (e.g., Lehner et al., 2013) and links to modes of variability (e.g., Pinto and Raible, 2012). For this, a regional analysis of the different cyclone characteristics is necessary, which also takes the spatial variability of the different measures into account.
The data of the model simulation are available on request. The ERA-Interim data are provided by ECMWF: https://www.ecmwf.int/en/forecasts/datasets/archive-datasets/reanalysis-datasets/era-interim (last access: 18 October 2018, Dee et al., 2011).
CCR and MM wrote the paper. CCR performed the analysis of Sects. 3, 4.1, partly 4.2, and 4.4. MM was responsible for the analysis of Sect. 4.3 and FL for Sect. 4.2. RB provided expert knowledge in the cyclone detection and tracking method. TFS and RB helped with discussions and in the interpretation of the results. All authors were responsible for the text editing.
The authors declare that they have no conflict of interest.
This work is supported by the Swiss National Science Foundation (grant
18-001). The CESM simulation is performed on the supercomputing architecture
of the Swiss National Supercomputing Centre (CSCS). We are grateful to the
four anonymous reviewers for their helpful comments. We also thank
Sandro Blumer for helpful discussions in an earlier stage of the
manuscript.
Edited by: Ran Feng
Reviewed by: four
anonymous referees
Amann, B., Szidat, S., and Grosjean, M.: A millennial-long record of warm season precipitation and flood frequency for the North-western Alps inferred from varved lake sediments: Implications for the future, Quaternary Sci. Rev., 115, 89–100, https://doi.org/10.1016/j.quascirev.2015.03.002, 2015. a, b, c, d
Bengtsson, L., Hodges, K. I., and Roeckner, E.: Storm tracks and climate change, J. Climate, 19, 3518–3543, https://doi.org/10.1175/JCLI3815.1, 2006. a
Bengtsson, L., Hodges, K. I., and Keenlyside, N.: Will extratropical storms intensify in a warmer climate?, J. Climate, 22, 2276–2301, https://doi.org/10.1175/2008JCLI2678.1, 2009. a, b
Beniston, M.: Linking extreme climate events and economic impacts: Examples from the Swiss Alps, Energ. Policy, 35, 5384–5392, https://doi.org/10.1016/j.enpol.2006.01.032, 2007. a
Björck, S. and Clemmensen, L. B.: Aeolian sediment in raised bog deposits, Halland, SW Sweden: A new proxy record of Holocene winter storminess variation in southern Scandinavia?, Holocene, 14, 677–688, https://doi.org/10.1191/0959683604hl746rp, 2004. a
Blender, R. and Schubert, M.: Cyclone tracking in different spatial and temporal resolutions, Mon. Weather Rev., 128, 377–384, https://doi.org/10.1175/1520-0493(2000)128<0377:CTIDSA>2.0.CO;2, 2000. a
Blender, R., Fraedrich, K., and Lunkeit, F.: Identification of cyclone-track regimes in the North Atlantic, Q. J. Roy. Meteor. Soc., 123, 727–741, https://doi.org/10.1256/smsqj.53909, 1997. a, b
Braconnot, P., Harrison, S. P., Kageyama, M., Bartlein, P. J., Masson-Delmotte, V., Abe-Ouchi, A., Otto-Bliesner, B., and Zhao, Y.: Evaluation of climate models using palaeoclimatic data, Nat. Clim. Change, 2, 417–424, https://doi.org/10.1038/nclimate1456, 2012. a
Bradley, R. S. and Jones, P. D.: “Little Ice Age” summer temperature variations: Their nature and relevance to recent global warming, Holocene, 3, 367–376, 1993. a
Broecker, W. S.: Was a change in thermohaline circulation responsible for the Little Ice Age?, P. Natl. Acad. Sci. USA, 97, 1339–1342, https://doi.org/10.1073/pnas.97.4.1339, 2000. a
Casty, C., Raible, C. C., Stocker, T. F. , Wanner, H., and Luterbacher, J.: A European pattern climatology 1766–2000, Clim. Dynam., 29, 791–805, https://doi.org/10.1007/s00382-007-0257-6, 2007. a
Catto, J. L., Shaffrey, L. C., and Hodges, K. I.: Northern Hemisphere extratropical cyclones in a warming climate in the HiGEM High-Resolution Climate Model, J. Climate, 24, 5336–5352, https://doi.org/10.1175/2011JCLI4181.1, 2011. a, b
Costas, S., Naughton, F., Goble, R., and Renssen, H.: Windiness spells in SW Europe since the Last Glacial Maximum, Earth Planet. Sc. Lett., 436, 82–92, https://doi.org/10.1016/j.epsl.2015.12.023, 2016. a
Czymzik, M., Dulski, P., Plessen, B., von Grafenstein, U., Naumann, R., and Brauer, A.: A 450 year record of spring-summer flood layers in annually laminated sediments from Lake Ammersee (southern Germany), Water Resour. Res., 46, W11528, https://doi.org/10.1029/2009WR008360, 2010. a, b, c
Dee, D. P., Uppala, S. M., Simmons, A. J., Berrisford, P., Poli, P., Kobayashi, S., Andrae, U., Balmaseda, M. A., Balsamo, G., Bauer, P., Bechtold, P., Beljaars, A. C. M., van de Berg, L., Bidlot, J., Bormann, N., Delsol, C., Dragani, R., Fuentes, M., Geer, A. J., Haimberger, L., Healy, S. B., Hersbach, H., Hólm, E. V., Isaksen, L., Kållberg, P., Köhler, M., Matricardi, M., McNally, A. P., Monge-Sanz, B. M., Morcrette, J.-J., Park, B.-K., Peubey, C., de Rosnay, P., Tavolato, C., Thépaut, J.-N., and Vitart, F.: The ERA-Interim reanalysis: Configuration and performance of the data assimilation system, Q. J. Roy. Meteor. Soc., 137, 553–597, https://doi.org/10.1002/qj.828, 2011 (data available at: https://www.ecmwf.int/en/forecasts/datasets/archive-datasets/reanalysis-datasets/era-interim, last access: 18 October 2018). a, b
Degeai, J.-P., Devillers, B., Dezileau, L., Oueslati, H., and Bony, G.: Major storm periods and climate forcing in the Western Mediterranean during the Late Holocene, Quaternary Sci. Rev., 129, 37–56, https://doi.org/10.1016/j.quascirev.2015.10.009, 2015. a
de Jong, R., Schoning, K., and Björck, S.: Increased aeolian activity during humidity shifts as recorded in a raised bog in south-west Sweden during the past 1700 years, Clim. Past, 3, 411–422, https://doi.org/10.5194/cp-3-411-2007, 2007. a
Etienne, C., Goyette, S., and Kuszli, C.-A.: Numerical investigations of extreme winds over Switzerland during 1990–2010 winter storms with the Canadian Regional Climate Model, Theor. Appl. Climatol., 113, 529–547, https://doi.org/10.1007/s00704-012-0800-1, 2013. a
Feser, F., Barcikowska, M., Krueger, O., Schenk, F., Weisse, R., and Xia, L.: Storminess over the North Atlantic and northwestern Europe – A review, Q. J. Roy. Meteor. Soc., 141, 350–382, https://doi.org/10.1002/qj.2364, 2015. a, b, c
Fischer-Bruns, I., Storch, H. v., Gonzalez-Rouco, J. F., and Zorita, E.: Modelling the variability of midlatitude storm activity on decadal to century time scales, Clim. Dynam., 25, 461–476, https://doi.org/10.1007/s00382-005-0036-1, 2005. a, b, c, d
Frölicher, T. L., Joos, F., Raible, C. C., and Sarmiento, J. L.: Atmospheric CO2 response to volcanic eruptions: The role of ENSO, season, and variability, Global Biogeochem. Cy., 27, 239–251, https://doi.org/10.1002/gbc.20028, 2011. a
Gagen, M. H., Zorita, E., McCarroll, D., Zahn, M., Young, G. H. F., and Robertson, I.: North Atlantic summer storm tracks over Europe dominated by internal variability over the past millennium, Nat. Geosci., 9, 630, https://doi.org/10.1038/NGEO2752, 2016. a
Gent, P. R., Danabasoglu, G., Donner, L. J., Holland, M. M., Hunke, E. C., Jayne, S. R., Lawrence, D. M., Neale, R. B., Rasch, P. J., Vertenstein, M., Worley, P. H., Yang, Z.-L., and Zhang, M.: The Community Climate System Model Version 4, J. Climate, 24, 4973–4991, https://doi.org/10.1175/2011JCLI4083.1, 2011. a
Glur, L., Wirth, S. B., Buentgen, U., Gilli, A., Haug, G. H., Schaer, C., Beer, J., and Anselmetti, F. S.: Frequent floods in the European Alps coincide with cooler periods of the past 2500 years, Sci. Rep.-UK, 3, 2770, https://doi.org/10.1038/srep02770, 2013. a, b, c
Grieger, J., Leckebusch, G. C., Raible, C. C., Rudeva, I., and Simmonds, I.: Subantarctic cyclones identified by 14 tracking methods, and their role for moisture transports into the continent, Tellus, 70, 1454808, https://doi.org/10.1080/16000870.2018.1454808, 2018. a
Grinsted, A., Moore, J. C., and Jevrejeva, S.: Application of the cross wavelet transform and wavelet coherence to geophysical time series, Nonlin. Processes Geophys., 11, 561–566, https://doi.org/10.5194/npg-11-561-2004, 2004. a
Gutowski, W. J., Branscome, L. E., and Stewart, D. A.: Life Cycles of Moist Baroclinic Eddies, J. Atmos. Sci., 49, 306–319, https://doi.org/10.1175/1520-0469(1992)049<0306:LCOMBE>2.0.CO;2, 1992. a
Harvey, B. J., Shaffrey, L. C., Woollings, T. J., Zappa, G., and Hodges, K. I.: How large are projected 21st century storm track changes?, Geophys. Res. Lett., 39, L18707, https://doi.org/10.1029/2012GL052873, 2012. a, b, c
Hofer, D., Raible, C. C., Dehnert, A., and Kuhlemann, J.: The impact of different glacial boundary conditions on atmospheric dynamics and precipitation in the North Atlantic region, Clim. Past, 8, 935–949, https://doi.org/10.5194/cp-8-935-2012, 2012a. a
Hofer, D., Raible, C. C., Merz, N., Dehnert, A., and Kuhlemann, J.: Simulated winter circulation types in the North Atlantic and European region for preindustrial and glacial conditions, Geophys. Res. Lett., 39, L15805, https://doi.org/10.1029/2012GL052296, 2012b. a
Hurrell, J. W., Holland, M. M., Gent, P. R., Ghan, S., Kay, J. E., Kushner, P. J., Lamarque, J.-F., Large, W. G., Lawrence, D., Lindsay, K., Lipscomb, W. H., Long, M. C., Mahowald, N., Marsh, D. R., Neale, R. B., Rasch, P., Vavrus, S., Vertenstein, M., Bader, D., Collins, W. D., Hack, J. J., Kiehl, J., and Marshall, S.: The Community Earth System Model: A Framework for Collaborative Research, B. Am. Meteorol. Soc., 94, 1339–1360, https://doi.org/10.1175/BAMS-D-12-00121.1, 2013. a
IPCC: Climate Change 2001: The Scientific Basis. Contribution of Working Group I to the Third Assessment Report of the Intergovernmental Panel on Climate Change, Cambridge University Press, Cambridge, UK and New York, NY, USA, 2001. a
IPCC: Climate Change 2013: The Physical Science Basis. Contribution of Working Group I to the Fourth Assessment Report of the Intergovernmental Panel on Climate Change, Cambridge University Press, Cambridge, UK and New York, NY, USA, 2013. a, b, c, d, e, f
James, I. N. and James, P. M.: Ultra-low-frequency variability in a simple atmospheric circulation model, Nature, 342, 53–55, https://doi.org/10.1038/342053a0, 1989. a
Kidston, J., Vallis, G. K., Dean, S. M., and Renwick, J. A.: Can the increase in the eddy length scale under global warming cause the poleward shift of the jet streams?, J. Climate, 24, 3764–3780, https://doi.org/10.1175/2010JCLI3738.1, 2011. a
Laine, A., Kageyama, M., Salas-Melia, D., Voldoire, A., Riviere, G., Ramstein, G., Planton, S., Tyteca, S., and Peterschmitt, J. Y.: Northern hemisphere storm tracks during the last glacial maximum in the PMIP2 ocean-atmosphere coupled models: Energetic study, seasonal cycle, precipitation, Clim. Dynam., 32, 593–614, https://doi.org/10.1007/s00382-008-0391-9, 2009. a
Lehner, F., Born, A., Raible, C. C., and Stocker, T. F.: Amplified inception of European Little Ice Age by sea ice-ocean-atmosphere feedbacks, J. Climate, 26, 7586–7602, https://doi.org/10.1175/JCLI-D-12-00690.1, 2013. a
Lehner, F., Joos, F., Raible, C. C., Mignot, J., Born, A., Keller, K. M., and Stocker, T. F.: Climate and carbon cycle dynamics in a CESM simulation from 850 to 2100 CE, Earth Syst. Dynam., 6, 411–434, https://doi.org/10.5194/esd-6-411-2015, 2015. a, b, c, d, e
Li, M., Woollings, T., Hodges, K., and Masato, G.: Extratropical cyclones in a warmer, moister climate: A recent Atlantic analogue, Geophys. Res. Lett., 41, 8594–8601, https://doi.org/10.1002/2014GL062186, 2014. a, b
Lionello, P. and Giorgi, F.: Winter precipitation and cyclones in the Mediterranean region: future climate scenarios in a regional simulation, Adv. Geosci., 12, 153–158, https://doi.org/10.5194/adgeo-12-153-2007, 2007. a
Lionello, P., Trigo, I. F., Gil, V., Liberato, M. L. R., Nissen, K., Pinto, J. G., Raible, C. C., Reale, M., Tanzarella, A., Trigo, R. M., Ulbrich, S., and Ulbrich, U.: Objective climatology of cyclones in the Mediterranean region: A consensus view among methods with different system identification and tracking criteria, Tellus, 68, 29391, https://doi.org/10.3402/tellusa.v68.29391, 2016. a
McDonald, R. E.: Understanding the impact of climate change on Northern Hemisphere extra-tropical cyclones, Clim. Dynam., 37, 1399–1425, https://doi.org/10.1007/s00382-010-0916-x, 2011. a
McGregor, H. V., Evans, M. N., Goosse, H., Leduc, G., Martrat, B., Addison, J. A., Mortyn, P. G., Oppo, D. W., Seidenkrantz, M. S., Sicre, M. A., Phipps, S. J., Selvaraj, K., Thirumalai, K., Filipsson, H. L., and Ersek, V.: Robust global ocean cooling trend for the pre-industrial Common Era, Nat. Geosci., 8, 671–677, https://doi.org/10.1038/NGEO2510, 2015. a
Merz, N., Raible, C. C., and Woollings, T.: North Atlantic eddy-driven jet in interglacial and glacial winter climates, J. Climate, 28, 3977–3997, https://doi.org/10.1175/JCLI-D-14-00525.1, 2015. a, b
Muthers, S., Anet, J. G., Raible, C. C., Brönnimann, S., Rozanov, E., Arfeuille, F., Peter, T., Shapiro, A. I., Beer, J., Steinhilber, F., Brugnara, Y., and Schmutz, W.: Northern hemispheric winter warming pattern after tropical volcanic eruptions: Sensitivity to the ozone climatology, J. Geophys. Res., 110, 1340–1355, https://doi.org/10.1002/2013JD020138, 2014. a
Neale, R. B., Richter, J., Park, S., Lauritzen, P. H., Vavrus, S. J., Rasch, P. J., and Zhang, M. H.: The mean climate of the Community Atmosphere Model (CAM4) in forced SST and fully coupled experiments, J. Climate, 26, 5150–5168, https://doi.org/10.1175/JCLI-D-12-00236.1, 2013. a, b, c
Neelin, J. D., Sahany, S., Stechmann, S. N., and Bernsteina, D. N.: Global warming precipitation accumulation increases above the current-climate cutoff scale, P. Natl. Acad. Sci. USA, 114, 1258–1263, https://doi.org/10.1073/pnas.1615333114, 2017. a, b, c
Neu, U., Akperov, M. G., Bellenbaum, N., Benestad, R., Blender, R., Caballero, R., Cocozza, A., Dacre, H. F., Feng, Y., Fraedrich, K., Grieger, J., Gulev, S., Hanley, J., Hewson, T., Inatsu, M., Keay, K., Kew, S. F., Kindem, I., Leckebusch, G. C., Liberato, M. L. R., Lionello, P., Mokhov, I. I., Pinto, J. G., Raible, C. C., Reale, M., Rudeva, I., Schuster, M., Simmonds, I., Sinclair, M., Sprenger, M., Tilinina, N. D., Trigo, I. F., Ulbrich, S., Ulbrich, U., Wang, X. L., and Wernli, H.: IMILAST: A community effort to intercompare extratropical cyclone detection and tracking algorithms, B. Am. Meteorol. Soc., 94, 529–547, https://doi.org/10.1175/BAMS-D-11-00154.1, 2013. a, b
O'Gorman, P. A.: Understanding the varied response of the extratropical storm tracks to climate change, P. Natl. Acad. Sci. USA, 107, 19176–19180, https://doi.org/10.1073/pnas.1011547107, 2010. a
O'Gorman, P. A. and Schneider, T.: Energy of midlatitude transient eddies in idealized simulations of changed climates, J. Climate, 21, 5797–5806, https://doi.org/10.1175/2008JCLI2099.1, 2008. a
O'Gorman, P. A. and Schneider, T.: The physical basis for increases in precipitation extremes in simulations of 21st-century climate change, P. Natl. Acad. Sci. USA, 106, 14773–14777, https://doi.org/10.1073/pnas.0907610106, 2009. a, b, c, d
Ortega, P., Lehner, F., Swingedouw, D., Masson-Delmotte, V., Raible, C. C., Casado, M., and Yiou, P.: A model-tested North Atlantic Oscillation reconstruction for the last millennium, Nature, 523, 71–75, https://doi.org/10.1038/nature14518, 2015. a
Otto-Bliesner, B. L., Brady, E. C., J., F., Jahn, A., Landrum, L., Stevenson, S., Rosenbloom, N., Mai, A., and Strand, G.: Climate variability and change since 850 CE: An ensemble approach with the Community Earth System Model, B. Am. Meteorol. Soc., 99, 735–754, 2016. a
PAGES 2k Consortium (Ahmed, M., Anchukaitis, K. J., Asrat, A., Borgaonkar, H. P., Braida, M., Buckley, B. M., Büntgen, U., Chase, B. M., Christie, D. A., Cook, E. R., Curran, M. A. J., Diaz, H. F., Esper, J., Fan, Z.-X., Gaire, N. P., Ge, Q., Gergis, J., Gonzalez-Rouco, J. F., Goosse, H., Grab, S. W., Graham, N., Graham, R., Grosjean, M., Hanhijärvi, S. T., Kaufman, D. S., Kiefer, T., Kimura, K., Korhola, A. A., Krusic, P. J., Lara, A., Lezine, A.-M., Ljungqvist, F. C., Lorrey, A. M., Luterbacher, J., Masson-Delmotte, V., McCarroll, D., McConnell, J. R., McKay, N. P., Morales, M. S., Moy, A. D., Mulvaney, R., Mundo, I. A., Nakatsuka, T., Nash, D. J., Neukom, R., Nicholson, S. E., Oerter, H., Palmer, J. G., Phipps, S. J., Prieto, M. R., Rivera, A., Sano, M., Severi, M., Shanahan, T. M., Shao, X., Shi, F., Sigl, M., Smerdon, J. E., Solomina, O. N., Steig, E. J., Stenni, B., Thamban, M., Trouet, V., Turney, C. S., Umer, M., van Ommen, T., Verschuren, D., Viau, A. E., Villalba, R., Vinther, B. M., von Gunten, L., Wagner, S., Wahl, E. R., Wanner, H., Werner, J. P., White, J. W., Yasue, K., and Zorita, E.): Continental-scale temperature variability during the past two millennia, Nat. Geosci., 6, 339–346, https://doi.org/10.1038/ngeo1797, 2013. a
PAGES 2k-PMIP3 group: Continental-scale temperature variability in PMIP3 simulations and PAGES 2k regional temperature reconstructions over the past millennium, Clim. Past, 11, 1673–1699, https://doi.org/10.5194/cp-11-1673-2015, 2015. a
PAGES Hydro2k Consortium: Comparing proxy and model estimates of hydroclimate variability and change over the Common Era, Clim. Past, 13, 1851–1900, https://doi.org/10.5194/cp-13-1851-2017, 2017. a
Pall, P., Allen, M., and Stone, D.: Testing the Clausius-Clapeyron constraint on changes in extreme precipitation under CO2 warming, Clim. Dynam., 28, 351–363, https://doi.org/10.1007/s00382-006-0180-2, 2007. a, b
Pendergrass, A. G. and Gerber, E. P.: The rain is askew: Two idealized models relating vertical velocity and precipitation distributions in a warming world, J. Climate, 29, 6445–6462, https://doi.org/10.1175/JCLI-D-16-0097.1, 2016. a
Pinto, J. and Raible, C. C.: Past and recent changes in the NAO, Interdisciplinary Reviews Climate Change, 3, 79–90, https://doi.org/10.1002/wcc.150, 2012. a, b
Pinto, J., Karremann, M., Born, K., Della-Marta, P., and Klawa, M.: Loss potentials associated with European windstorms under future climate conditions, Clim. Res., 54, 1–20, https://doi.org/10.3354/cr01111, 2012. a
Pinto, J. G., Zacharias, S., Fink, A. H., Leckebusch, G. C., and Ulbrich, U.: Factors contributing to the development of extreme North Atlantic cyclones and their relationship with the NAO, Clim. Dynam., 32, 711–737, https://doi.org/10.1007/s00382-008-0396-4, 2009. a, b
Rahmstorf, S., Box, J. E., Feulner, G., Mann, M. E., Robinson, A., Rutherford, S., and Schaffernicht, E. J.: Exceptional twentieth-century slowdown in Atlantic Ocean overturning circulation, Nat. Clim. Change, 5, 475–480, https://doi.org/10.1038/NCLIMATE2554, 2015. a
Raible, C. C.: On the relation between extremes of midlatitude cyclones and the atmospheric circulation using ERA40, Geophys. Res. Lett., 34, L07703, https://doi.org/10.1029/2006GL029084, 2007. a
Raible, C. C. and Blender, R.: Midlatitude cyclonic variability in GCM-simulations with different ocean representations, Clim. Dynam., 22, 239–248, https://doi.org/10.1007/s00382-003-0380-y, 2004. a
Raible, C. C., Yoshimori, M., Stocker, T. F., and Casty, C.: Extreme midlatitude cyclones and their implications to precipitation and wind speed extremes in simulations of the Maunder Minimum versus present day conditions, Clim. Dynam., 28, 409–423, https://doi.org/10.1007/s00382-006-0188-7, 2007. a, b, c, d, e, f, g, h, i, j
Raible, C. C., Della-Marta, P., Schwierz, C., Wernli, H., and Blender, R.: Northern Hemisphere extratropical Cyclones: A Comparison of Detection and Tracking Methods and different Re-analyses, Mon. Weather Rev., 136, 880–897, https://doi.org/10.1175/2007MWR2143.1, 2008. a
Raible, C. C., Ziv, B., Saaroni, H., and Wild, M.: Winter synoptic-scale variability over the Mediterranean Basin under future climate conditions as simulated by the ECHAM5, Clim. Dynam., 35, 473–488, https://doi.org/10.1007/s00382-009-0678-5, 2010. a, b, c, d, e, f
Riviere, G.: A dynamical interpretation of the poleward shift of the jet streams in global warming scenarios, J. Atmos. Sci., 68, 1253–1272, https://doi.org/10.1175/2011JAS3641.1, 2011. a
Sabatier, P., Dezileau, L., Colin, C., Briqueu, L., Bouchette, F., Martinez, P., Siani, G., Raynal, O., and Von Grafenstein, U.: 7000-years of paleostorm activity in the NW Mediterranean Sea in response to Holocene climate events, Quaternary Res., 77, 1–11, https://doi.org/10.1016/j.yqres.2011.09.002, 2012. a
Santos, J. A., Belo-Pereira, M., Fraga, H., and Pinto J. G.: Understanding climate change projections for precipitation over western Europe with a weather typing approach, J. Geophys. Res., 121, 1170–1189, https://doi.org/10.1002/2015JD024399, 2016. a
Schiesser, H. H., Pfister, C., and Bader, J.: Winter storms in Switzerland North of the Alps 1864/1865–1993/1994, Theor. Appl. Climatol., 58, 1–19, https://doi.org/10.1007/BF00867428, 1997. a
Schmidt, G. A., Jungclaus, J. H., Ammann, C. M., Bard, E., Braconnot, P., Crowley, T. J., Delaygue, G., Joos, F., Krivova, N. A., Muscheler, R., Otto-Bliesner, B. L., Pongratz, J., Shindell, D. T., Solanki, S. K., Steinhilber, F., and Vieira, L. E. A.: Climate forcing reconstructions for use in PMIP simulations of the last millennium (v1.0), Geosci. Model Dev., 4, 33–45, https://doi.org/10.5194/gmd-4-33-2011, 2011. a, b
Schneider, T., O'Gorman, P. A., and Levine, X. J.: Water vapor and the dynamics of climaye changes, Rev. Geophys., 48, RG3001, https://doi.org/10.1029/2009RG000302, 2010. a
Schneidereit, A., Blender, R., and Fraedrich, K.: A radius – depth model for midlatitude cyclones in reanalysis data and simulations, Q. J. Roy. Meteor. Soc., 136, 50–60, https://doi.org/10.1002/qj.523, 2010. a, b
Taylor, K. E., Stouffer, R. J., and Meehl, G. A.: An overview of CMIP5 and the experiment design, B. Am. Meteorol. Soc., 93, 485–498, https://doi.org/10.1175/BAMS-D-11-00094.1, 2012. a, b
Trouet, V., Scourse, J., and Raible, C.: North Atlantic storminess and Atlantic Meridional Overturning Circulation during the last Millennium: Reconciling contradictory proxy records of NAO variability, Global Planet. Change, 84–85, 48–55, https://doi.org/10.1016/j.gloplacha.2011.10.003, 2012. a
Ulbrich, U., Pinto, J. G., Kupfer, H., Leckebusch, G. C., Spangehl, T., and Reyers, M.: Changing northern hemisphere storm tracks in an ensemble of IPCC climate change simulations, J. Climate, 21, 1669–1679, https://doi.org/10.1175/2007JCLI1992.1, 2008. a, b
Ulbrich, U., Leckebusch, G. C., and Pinto, J. G.: Extra-tropical cyclones in the present and future climate: A review, Theor. Appl. Climatol., 96, 117–131, https://doi.org/10.1007/s00704-008-0083-8, 2009. a, b, c, d
Van Vliet-Lanoe, B., Penaud, A., Henaff, A., Delacourt, C., Fernane, A., Goslin, J., Hallegouet, B., and Le Cornec, E.: Middle- to late-Holocene storminess in Brittany (NW France): Part II – The chronology of events and climate forcing, Holocene, 24, 434–453, https://doi.org/10.1177/0959683613519688, 2014. a
Wetter, O.: Hochwasser “Katastrophen” in Basel vom 13. bis 21. Jahrhundert: Rekonstruktion, Deutung und Lerneffekte, in: Krisen – Crises. Ursachen, Deutungen, Folgen, Vol. 27, Schweizerisches Jahrbuch für Wirtschafts- und Sozialgeschichte, 48–63, 2012. a, b
Willison, J., Robinson, W. A., and Lackmann, G. M.: The importance of resolving mesoscale latent heating in the North Atlantic storm track, J. Atmos. Sci., 70, 2234–2250, https://doi.org/10.1175/JAS-D-12-0226.1, 2013. a
Wirth, S. B., Gilli, A., Simonneau, A., Ariztegui, D., Vanniere, B., Glur, L., Chapron, E., Magny, M., and Anselmetti, F. S.: A 2000 year long seasonal record of floods in the southern European Alps, Geophys. Res. Lett., 40, 4025–4029, https://doi.org/10.1002/grl.50741, 2013. a, b, c
Woollings, T., Gregory, J. M., Pinto, J. G., Reyers, M., and Brayshaw, D. J.: Response of the North Atlantic storm track to climate change shaped by ocean–atmosphere coupling, Nat. Geosci., 5, 313–317, https://doi.org/10.1038/ngeo1438, 2012a. a
Woollings, T., Harvey, B., Zahn, M., and Shaffrey, L.: On the role of the ocean in projected atmospheric stability changes in the Atlantic polar low region, Geophys. Res. Lett., 39, L24802, https://doi.org/10.1029/2012GL054016, 2012b. a, b
Woollings, T., Franzke, C., Hodson, D. L. R., Dong, B., Barnes, E. A., Raible, C. C., and Pinto, J. G.: Contrasting interannual and multidecadal NAO variability, Clim. Dynam., 45, 539–556, https://doi.org/10.1007/s00382-014-2237-y, 2015. a
Zalasiewicz, J., Williams, M., Steffen, W., and Crutzen, P.: The New World of the Anthropocene, Environ. Sci. Technol., 44, 2228–2231, https://doi.org/10.1021/es903118j, 2010. a
Zappa, G., Shaffrey, L. C., Hodges, K. I., Sansom, P. G., and Stephenson, D. B.: A multimodel assessment of future projections of North Atlantic and European extratropical cyclones in the CMIP5 climate models, J. Climate, 26, 5846–5862, https://doi.org/10.1175/JCLI-D-12-00573.1, 2013. a, b, c, d, e, f, g, h, i