the Creative Commons Attribution 4.0 License.
the Creative Commons Attribution 4.0 License.
 | 09 Aug 2018
Variation of extreme drought and flood in North China revealed by document-based seasonal precipitation reconstruction for the past 300 years
Jingyun Zheng
Yingzhuo Yu
Xuezhen Zhang
Zhixin Hao
Using a 17-site seasonal precipitation reconstruction from a unique historical archive, Yu-Xue-Fen-Cun, the decadal variations of extreme droughts and floods (i.e., the event with occurrence probability of less than 10 % from 1951 to 2000) in North China were investigated, by considering both the probabilities of droughts/floods occurrence in each site and spatial coverage (i.e., percentage of sites). Then, the possible linkages of extreme droughts and floods with ENSO (i.e., El Niño and La Niña) episodes and large volcanic eruptions were discussed. The results show that there were 29 extreme droughts and 28 extreme floods in North China from 1736 to 2000. For most of these extreme drought (flood) events, precipitation decreased (increased) evidently at most of the sites for the four seasons, especially for summer and autumn. But in drought years of 1902 and 1981, precipitation only decreased in summer slightly, while it decreased evidently in the other three seasons. Similarly, the precipitation anomalies for different seasons at different sites also existed in several extreme flood years, such as 1794, 1823, 1867, 1872 and 1961. Extreme droughts occurred more frequently (2 or more events) during the 1770s–1780s, 1870s, 1900s–1930s and 1980s–1990s, among which the most frequent (3 events) occurred in the 1900s and the 1920s. More frequent extreme floods occurred in the 1770s, 1790s, 1820s, 1880s, 1910s and 1950s–1960s, among which the most frequent (4 events) occurred in the 1790s and 1880s. For the total of extreme droughts and floods, they were more frequent in the 1770s, 1790s, 1870s–1880s, 1900s–1930s and 1960s, and the highest frequency (5 events) occurred in the 1790s. A higher probability of extreme drought was found when El Niño occurred in the current year or the previous year. However, no significant connections were found between the occurrences of extreme floods and ENSO episodes, or the occurrences of extreme droughts/floods and large volcanic eruptions.
- Article
(1964 KB) - Full-text XML
-
Supplement
(125 KB) - BibTeX
- EndNote


Extreme climate events, such as droughts and floods, can lead to large impacts on the natural environment and social system, such as water resources, agriculture, economic activity and human health and well-being. Based on the evidence from observed data since 1950, the IPCC (2012) special report concluded that several regions in the world, particularly southern Europe and West Africa, have experienced more intense and longer droughts; however, in central North America and northwestern Australia, droughts have become either less frequent, less intense or shorter (with medium confidence). Meanwhile, there have been statistically significant increases in the number of heavy precipitation events (e.g., 95th percentile) in more regions than there have been statistically significant decreases over the world. Furthermore, the strong regional and subregional variations exist in both extreme drought and heavy precipitation events. For example, in China it has been shown that droughts appeared more frequently in Northeast China, North China and the eastern part of Northwest China during 1961–2013, with persistent, severe and widespread droughts from the late 1990s to early 2000s. Moreover, severe droughts also became more and more frequent in Southwest China in the period 2006–2013. However, in the lower reaches of the Yangtze River and northern Xinjiang, the drought frequency tended to decrease from 1961 to 2013. Meanwhile, in North China, the southwest part of Northeast China and the western Sichuan Basin, a downward trend occurred in yearly rainstorm (i.e., ≥50 mm d−1) days. In most of Central China and East China, rainstorm days showed an increasing trend (Qin et al., 2015).
However, the instrumental measurements generally covered more than a half century, which cannot represent the full natural climate variability in many regions of the world as those derived from paleoclimate reconstructions, especially drought and flood (e.g., Cook et al., 2010; Ge et al., 2016; IPCC, 2012, 2013). Therefore, investigating variations in extreme climate events from long-term datasets is critical to identify whether the recent extreme events observed by instruments exceed the natural variability, which could provide more experience for adaptation to extremes and disasters in the future (Qin et al., 2015), especially in regions with large precipitation variability and dense population, such as the North China Plain (NCP). This region is located at the margin of the East Asian summer monsoon (EASM) and has a subhumid warm temperate climate with the summer and autumn precipitation accounting for approximately 80 % annual precipitation. As revealed by other studies (e.g., Wang, 2002; Wang and He, 2015; Ding and Wang, 2016), the climate in this region is sensitive to global change and rainfall decreased dramatically from the late 1970s, which had caused the evident impacts on water resources and agriculture when the EASM became weakened.
Recently, there are several studies focusing on the historical severe drought/flood events in the NCP. For example, based on “A Compendium of Chinese Meteorological Records of the Last 3000 Years” (Zhang, 2004) and Zhang (2005) identified 15 severe persistent (≥3 years) drought events that occurred in the NCP and surrounding area over the past 1000 years, and found that most of the historical persistent drought events (i.e., those before 1950) were more severe than these that occurred in the period 1951–2000. Shen et al. (2008) investigated the characteristics of anomalous precipitation events during the past five centuries over eastern China (including North China and the mid-lower Yangtze River valley), using the dataset of yearly dryness/wetness grade over eastern China (CAMS, 1981), and found that in the NCP, the high frequency of severe and extreme (5 % and 2.5 % occurrence probabilities during 1470–2000 respectively, same as for droughts) floods occurred in the 1650s, 1660s, 1750s, 1760s, 1820s and 1890s, whereas the period of 1580–1650 and the 1990s witnessed more severe and extreme droughts. Our previous studies (Hao et al., 2010a; Zheng et al., 2006) identified the extreme drought/flood events (10 % occurrence probabilities in 1951–2000) and extreme persistent drought/flood events (≥3 years, 5 % occurrence probabilities over all 2000 years) for the past 2000 years by merging the yearly dryness/wetness grade from individual sites. We found that there were more frequent extreme drought/flood (single year or persistent) events during the periods of 100–150, 550–650, 1050–1100, and 1850–1900 in the NCP, while the frequency and intensity of extreme drought/flood events in the second half of the 20th century more closely resembled the mean status over the past 2000 years. Moreover, several other studies have focused on individual event reconstructions with large impacts on agriculture and society, such as the persistent extreme droughts in 1784–1786 (Zhang, 2000), 1876–1878 (Hao et al., 2010b; Man, 2000; Zhang and Liang, 2010) and 1927–1930 (Zeng et al., 2009), as well as the extreme floods in 1730 (Zhang and Liang, 2016), 1755 (Zhang, 2012) and 1917 (Ma et al., 2015). Some earlier studies (e.g., Jiang et al., 1997, 2005; Qian et al., 2003a, b) have also investigated the dry–wet variations for decadal to centennial timescales over East China for the last millennium using document-based reconstructions.
Meanwhile, several studies had argued that the anomalous precipitation in NCP, especially the occurrence of drought, was related to El Niño and large volcanic eruptions. For instance, from the observation data since 1951, it was found that rainfall decreased over northern China (including the NCP and the adjacent areas to the north and west) not only in the summer and autumn of an El Niño-developing year (Wu et al., 2003; Lu, 2005; Zhai et al., 2016) but also in the summer when El Niño decayed (Feng et al., 2014; Zhang et al., 2017). From the document-based reconstruction of yearly dryness/wetness grade for the past 500 years, Chen and Yang (2013) argued that the occurrence of drought in northern China was synchronous with El Niño events in the context of decadal variations. Shen et al. (2007) found that the three most exceptional drought events over eastern China occurred in 1586–1589, 1638–1641 and 1965–1966, with 50 % or more summer rainfall reduction in the droughty centers, which might be triggered by large volcanic eruptions and amplified by the El Niño events.
However, most of these studies were performed from the yearly dryness/wetness grade data and relevant historical descriptions or the limited instrumental period. Therefore, we present a case study, using seasonal precipitation reconstructions, to investigate the variations of extreme drought and flood in the NCP for the past 300 years, which is helpful to understand the impacts of seasonal-scale extreme climate on agriculture and social activities.
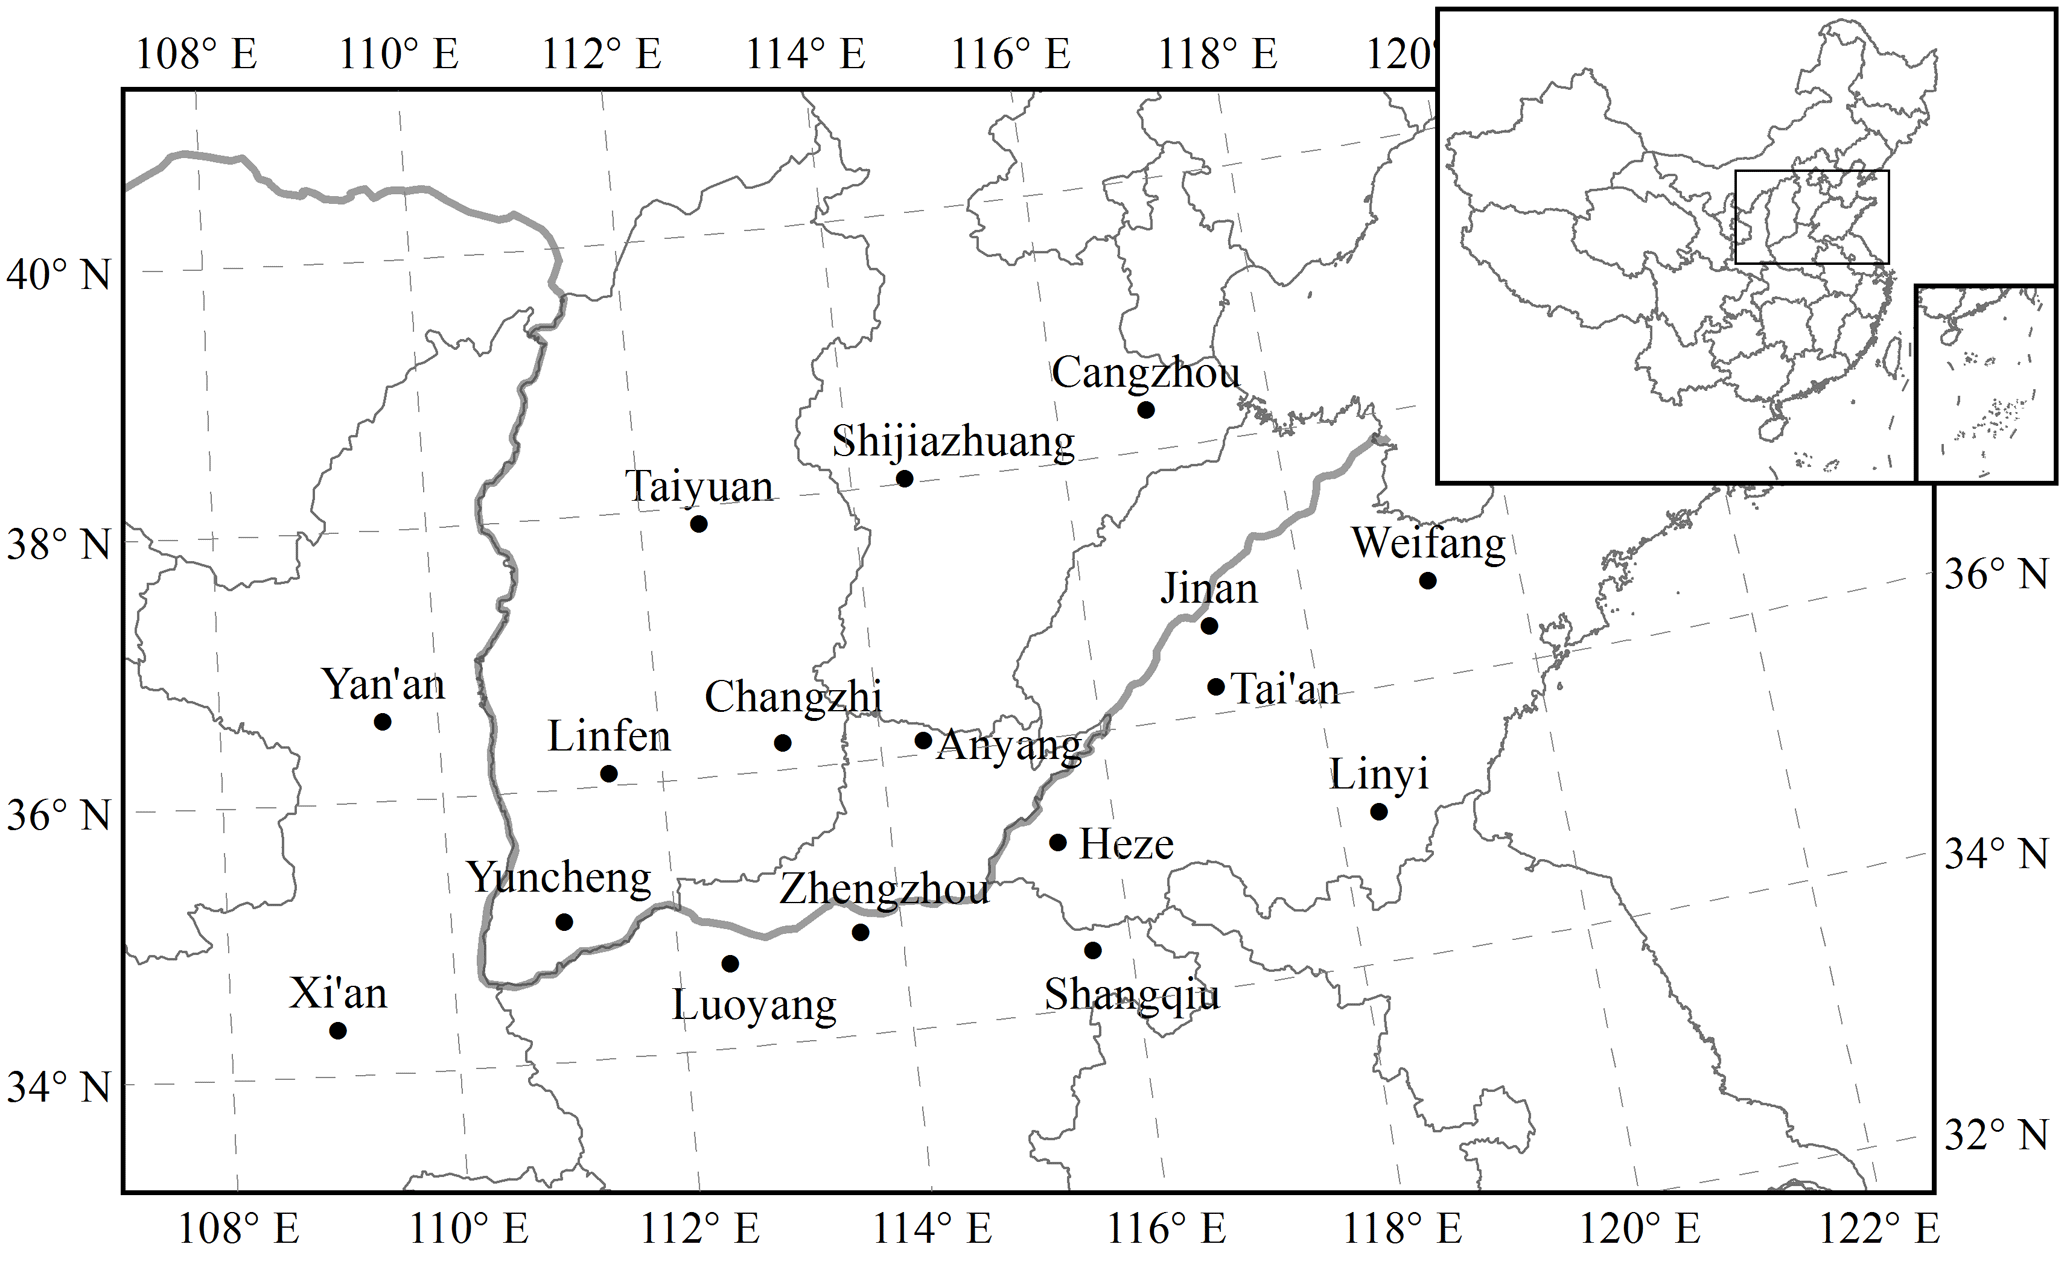
Figure 1Map of the study area and the location of 17 sites with seasonal precipitation reconstruction for 1736–2000.
2.1 Data
Three datasets were used in this study, including seasonal precipitation reconstruction, chronology of El Niño and La Niña events and chronology of large volcanic eruptions.
-
Seasonal precipitation reconstruction: it included spring, summer, autumn and winter precipitation at 17 sites (Fig. 1) located in the NCP (approximately 34–39∘ N, 108–120∘ E) during 1736–2000 with annual resolution (Zheng et al., 2005). While 8 (i.e., Xi'an, Taiyuan, Shijiazhuang, Cangzhou, Jinan, Anyang, Weifang and Linyi) of the 17 sites had complete records for the entire period (1736–2000), the other 9 sites involve some missing records during 1911–1950. This dataset was reconstructed from a unique historical archive called Yu-Xue-Fen-Cun, i.e., the quantitative records (in Chinese length units of “Fen” and “Cun”; 1 Fen = 0.32 cm approximately; 1 Cun = 10 Fens) of rainfall (i.e., “Yu”) and snowfall (i.e., “Xue”) reported in memos to the emperor from local officials in the Qing Dynasty (1644–1911), together with available instrumental data. Noting that the rainfall reported in Yu-Xue-Fen-Cun was measured as the infiltration depth (in units of Cun and Fen) from the dry–wet soil boundary layer to the ground surface by digging the soil with a shovel in the flat farmland after each rainfall event. The snowfall was measured as the depth on the surface after each snowfall event, which is similar to the observation of snowfall depth at modern weather stations. Besides the quantitative measurements of rainfall and snowfall, the Yu-Xue-Fen-Cun also reported other information, such as the dates and intensity for each precipitation event, the amount of rain or snow days, the summation of infiltration depth or snowfall depth, and the qualitative descriptions within a limited duration (e.g., one month or season) (Ge et al., 2005). For the rainfall reconstruction from historical records, the method was the Green–Ampt infiltration model under the surface water balance equation:
where P is the precipitation; θs, θi, ρ, Zf and β are the soil saturated moisture content, the initial moisture content before rainfall, the apparent specific gravity of the soil, the depth of infiltration (i.e., Yu-Fen-Cun in historical times) and the infiltration rate, respectively, which can be obtained from modern local agrometeorological stations based on the types of soil texture and the seasonality of climate at each site. This is because the physical properties of farmland soil and the seasonality of climate are supposed to generally remain constant over the past 300 years. Moreover, the field infiltration experiment was used for the validation of the reconstruction model, which showed that the predicted R2 (i.e., explained variance) for the rainfall reconstruction reached to 87 %. The snowfall reconstruction was calibrated by the regression equations based on the data of instrumental precipitation and snowfall depth from each weather station, which resulted in the predicted R2 of 62–82 % for different sites (Zheng et al., 2005). Such a high predicted R2 value enabled these reconstructions to adequately capture a majority of the precipitation variability and extreme events.
-
Chronology of El Niño and La Niña events. This chronology was reconstructed from tree-ring, ice-core, coral records and historical documents by Gergis and Fowler (2009). There were 119 El Niño and 127 La Niña events identified during 1736–2000. The magnitude of these El Niño/La Niña events was categorized into five grades as extreme (E), very strong (VS), strong (S), moderate (M) and weak (W). There are some other ENSO index reconstructions in the past millennium (e.g., Stahle et al., 1998; Braganza et al., 2009; McGregor et al., 2010; Wilson et al., 2010; J. Li et al., 2011, 2013). The reason for our study using the reconstruction by Gergis and Fowler (2009) is that their result was compiled as a chronology for each El Niño and La Niña episode rather than the ENSO index; thus, it is more appropriate for comparison with the extreme drought/flood event by event.
-
Chronology of large volcanic eruptions. The chronology of large volcanic eruptions used in this study was extracted from the database of “Volcanoes of the World” released by the Smithsonian Institution (Global Volcanism Program, 2013). This dataset includes information on volcano location (longitude, latitude and elevation), starting and ending dates of eruptive activity, tephra volume, and volcanic explosivity index (VEI) for each eruption, in which the VEI is determined by the eruption type and duration, the tephra volume, and the height of the eruption cloud column. Compared to the other reconstruction on the volcanic eruptions index (e.g., Sigl et al., 2015), this chronology contains each volcanic eruption event, which is convenient to compare with the extreme drought/flood events. It is noted that only the eruptions with VEI ≥4 were extracted as large eruptions for this study, and there were 137 large eruptions that occurred during 1736–2000.
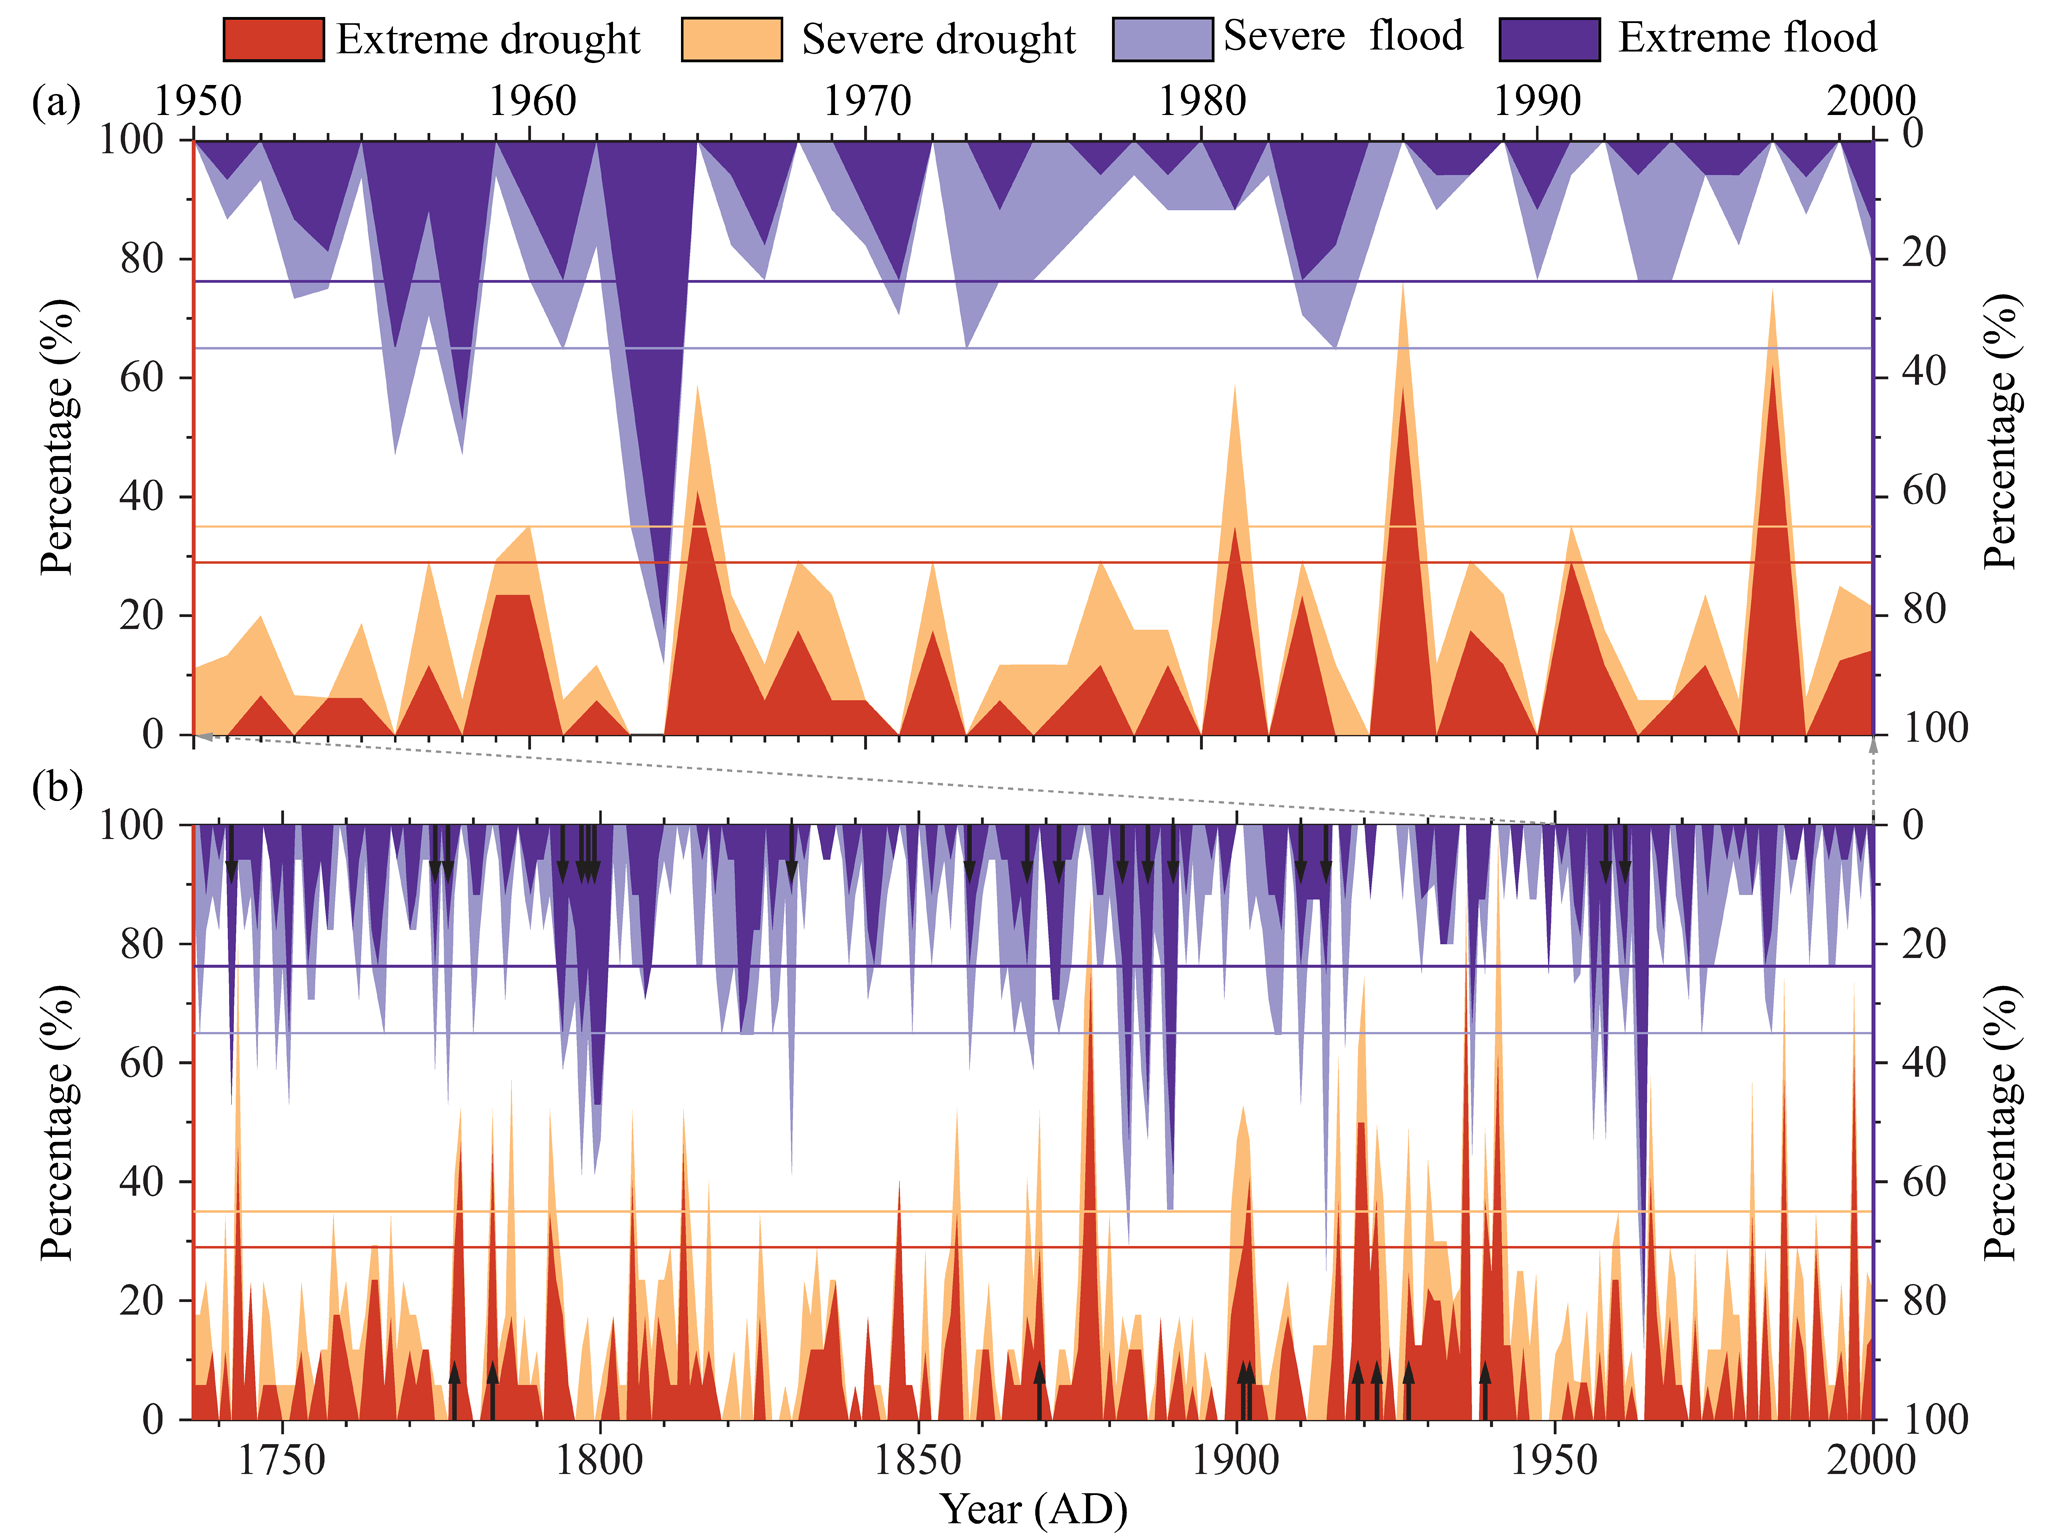
Figure 2Percentage of sites with extreme and severe drought/flood that occurred over North China during 1736–2000. Dashed line: the criteria to identify the regional extreme drought/flood events. Symbol ↑: the year of extreme drought/flood events which were not reported in previous studies (Chen and Yang, 2013; Hao et al., 2010a, b; Shen et al., 2007, 2008; Zhang, 2005; Zheng et al., 2006).
2.2 Method
Firstly, we calculate the threshold for probability of 10 %, 20 %, 80 % and 90 % occurrence based on the 17-site precipitation reconstruction series according to a gamma distribution, to identify the year when the severe or extreme drought/flood occurred in the period of 1736–2000. For each site, the severe drought (or flood) means that the annual precipitation was lower (or higher) than the threshold for probability of 20 % (or 80 %), and the extreme drought (or flood) was defined as below (or above) the threshold for probability of 10 % (or 90 %). Then, we calculate the percentage of sites with extreme and severe drought (or flood) that occurred in the study area (Fig. 2). It is shown that the top five (i.e., 10 % occurrence) drought events between 1951 and 2000 (i.e., instrumental period) occurred in 1997, 1986, 1965, 1981 and 1991; and the top five flood years were 1964, 1958, 1963, 1956 and 1961 (Fig. 2a). Therefore, we use the minimum percentage of severe and extreme drought (flood) sites among these extreme years in the period 1951–2000, i.e., 35 % (35 %) and 29 % (24 %) of all sites experiencing severe and extreme drought (flood) respectively, as the criteria to identify the regional extreme drought/flood events during 1736–2000 (Fig. 2b).
Furthermore, we compare the extreme drought/flood events with the El Niño/La Niña chronology and the large volcanic eruptions chronology using the contingency table, to illustrate the characteristics of connections between extreme drought/flood events, and El Niño/La Niña episodes, and large volcanic eruptions, respectively. For example, to detect whether the frequency of extreme drought becomes higher in the years after El Niño events, we create a contingency table by calculating the numbers of occurrences with extreme drought and El Niño in the previous year, extreme drought and no El Niño in the previous year, no extreme drought but El Niño in the previous year, no extreme drought, and El Niño in the previous year. Then, the chi-square test (χ2) is adopted to test the significance. Similarly, the contingency table and test are also performed for other cases with the occurrences of extreme drought or flood events in the NCP associated with the events of ENSO or large volcanic eruptions, respectively.
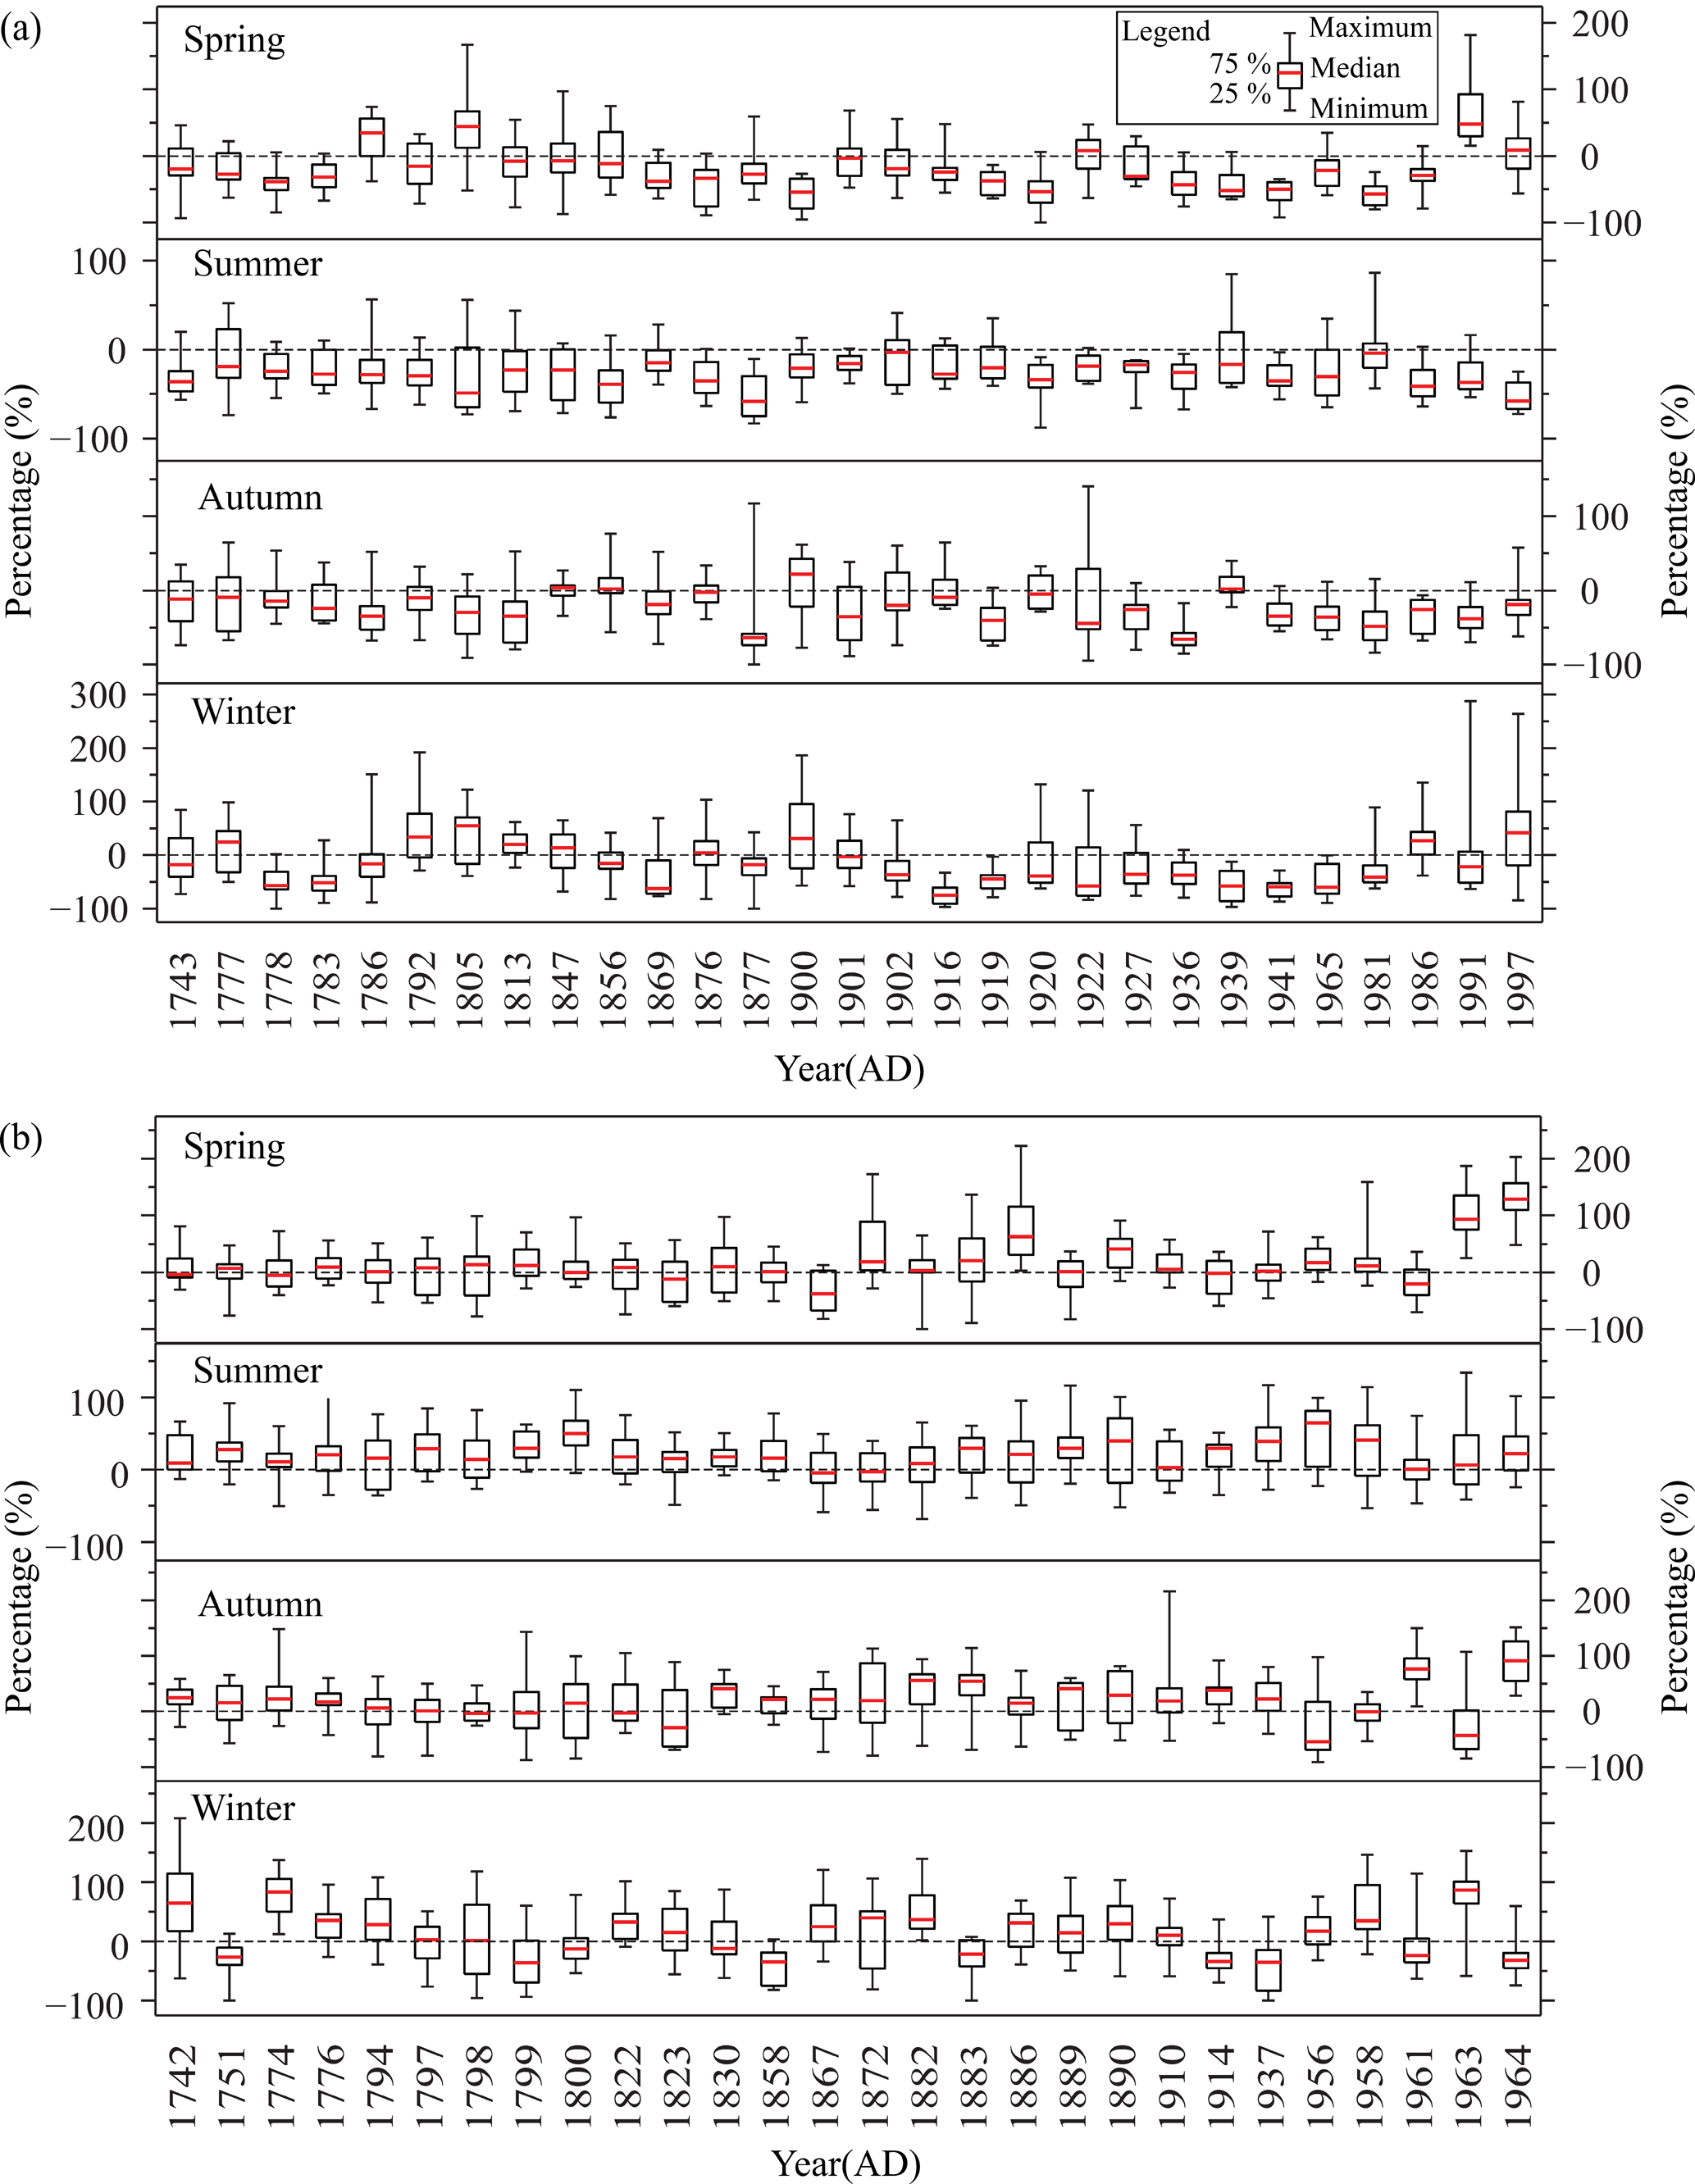
Figure 3The box-whisker plot of seasonal precipitation anomaly percentage among sites for each extreme drought (a) and flood (b) event.
3.1 Occurrence of extreme drought and flood
There were 29 extreme drought events and 28 extreme flood events identified (Fig. 2) in the period 1736–2000. Extreme drought events occurred in 1743, 1777, 1778, 1783, 1786, 1792, 1805, 1813, 1847, 1856, 1869, 1876, 1877, 1900, 1901, 1902, 1916, 1919, 1920, 1922, 1927, 1936, 1939, 1941, 1965, 1981, 1986, 1991 and 1997. Extreme flood events occurred in 1742, 1751, 1774, 1776, 1794, 1797, 1798, 1799, 1800, 1822, 1823, 1830, 1858, 1867, 1872, 1882, 1883, 1886, 1889, 1890, 1910, 1914, 1937, 1956, 1958, 1961, 1963 and 1964. Figure 3 illustrates the box-whisker plot of seasonal precipitation anomaly percentage among 17 sites for each extreme drought and flood event. It is shown that for a majority of extreme drought (flood) events, precipitation decreased (increased) evidently at most of sites for the four seasons, especially for summer and autumn, because the precipitation in summer and autumn accounts for approximately 60 % and 20 % of the annual precipitation, respectively. For example, in the extreme drought year of 1877, the regional precipitation anomaly (i.e., referenced to the average of all sites over the entire study area relative to the mean precipitation of all years) was −25 % in spring, −53 % in summer, −53 % in autumn and −23 % in winter. In the extreme flood year of 1890, the regional precipitation anomaly was 37 % in spring, 32 % in summer, 23 % in autumn and 30 % in winter. Nevertheless, in drought years of 1902 and 1981, precipitation only decreased in summer slightly, while it decreased evidently in the other three seasons. Similarly, the precipitation anomalies for different seasons at different sites also existed in several extreme flood years, such as 1794, 1823, 1867, 1872 and 1961.
Compared to the extreme droughts and floods reported in previous studies (Chen and Yang, 2013; Hao et al., 2010a, b; Shen et al., 2007, 2008; Zhang, 2005; Zheng et al., 2006), our results identified a majority of extreme drought years and 10 extreme flood years (i.e., 1751, 1800, 1822, 1823, 1883, 1889, 1937, 1956, 1963 and 1964) in their publications. Moreover, our results revealed 9 extreme drought events and 18 extreme flood events (marked ↑ in Fig. 2) which were not reported before. Meanwhile, our results also eliminated those events when the intensity may have been overestimated by the previous studies, which resulted from droughts/floods only at subregional scale or for a short duration. This is mainly because the series of seasonal precipitation was reconstructed from Yu-Xue-Fen-Cun, thus more accurate in seasons and subregions than the series of yearly dryness/wetness grade used in other studies. For example, 1785 and 1825 were reported as extreme drought years by Chen and Yang (2013) and Hao et al. (2010a), respectively. However, the drought in 1785 occurred only from late spring to early summer at several sites in the southern part of the NCP, and it did not prevail over the entire study area. The drought of 1825 occurred in summer over approximately half of the NCP, but in spring, rainfall increased by more than 50 % across nearly the entire region. Similar situations also occurred in 1826, 1832, 1846, 1878, 1899, 1928, 1929 and 1972. Meanwhile, 1757, 1761, 1819, 1894, 1898 and 1973 were reported as extreme flood years by Shen et al. (2008) and Hao et al. (2010a). However, in 1757, precipitation only increased significantly in the southern part of the NCP, except that more snowfall occurred at most sites of the entire study area in winter. In 1761, floods occurred over almost half of the NCP in spring only; but only 2 sites experienced severe drought and 3 sites experienced extreme flood throughout the whole year. In 1819 and 1894, although more snowfall occurred for most sites in winter, there were only a few sites experiencing severe flood, and no sites had extreme flood throughout the year. In 1898, more precipitation only occurred in spring but not for other seasons. In 1973, only 6 of the 17 sites experienced severe floods but no extreme floods occurred at any site throughout the year, although one site had extreme rainfall during summer time. Thus, these years cannot be identified as extreme flood events in our result.
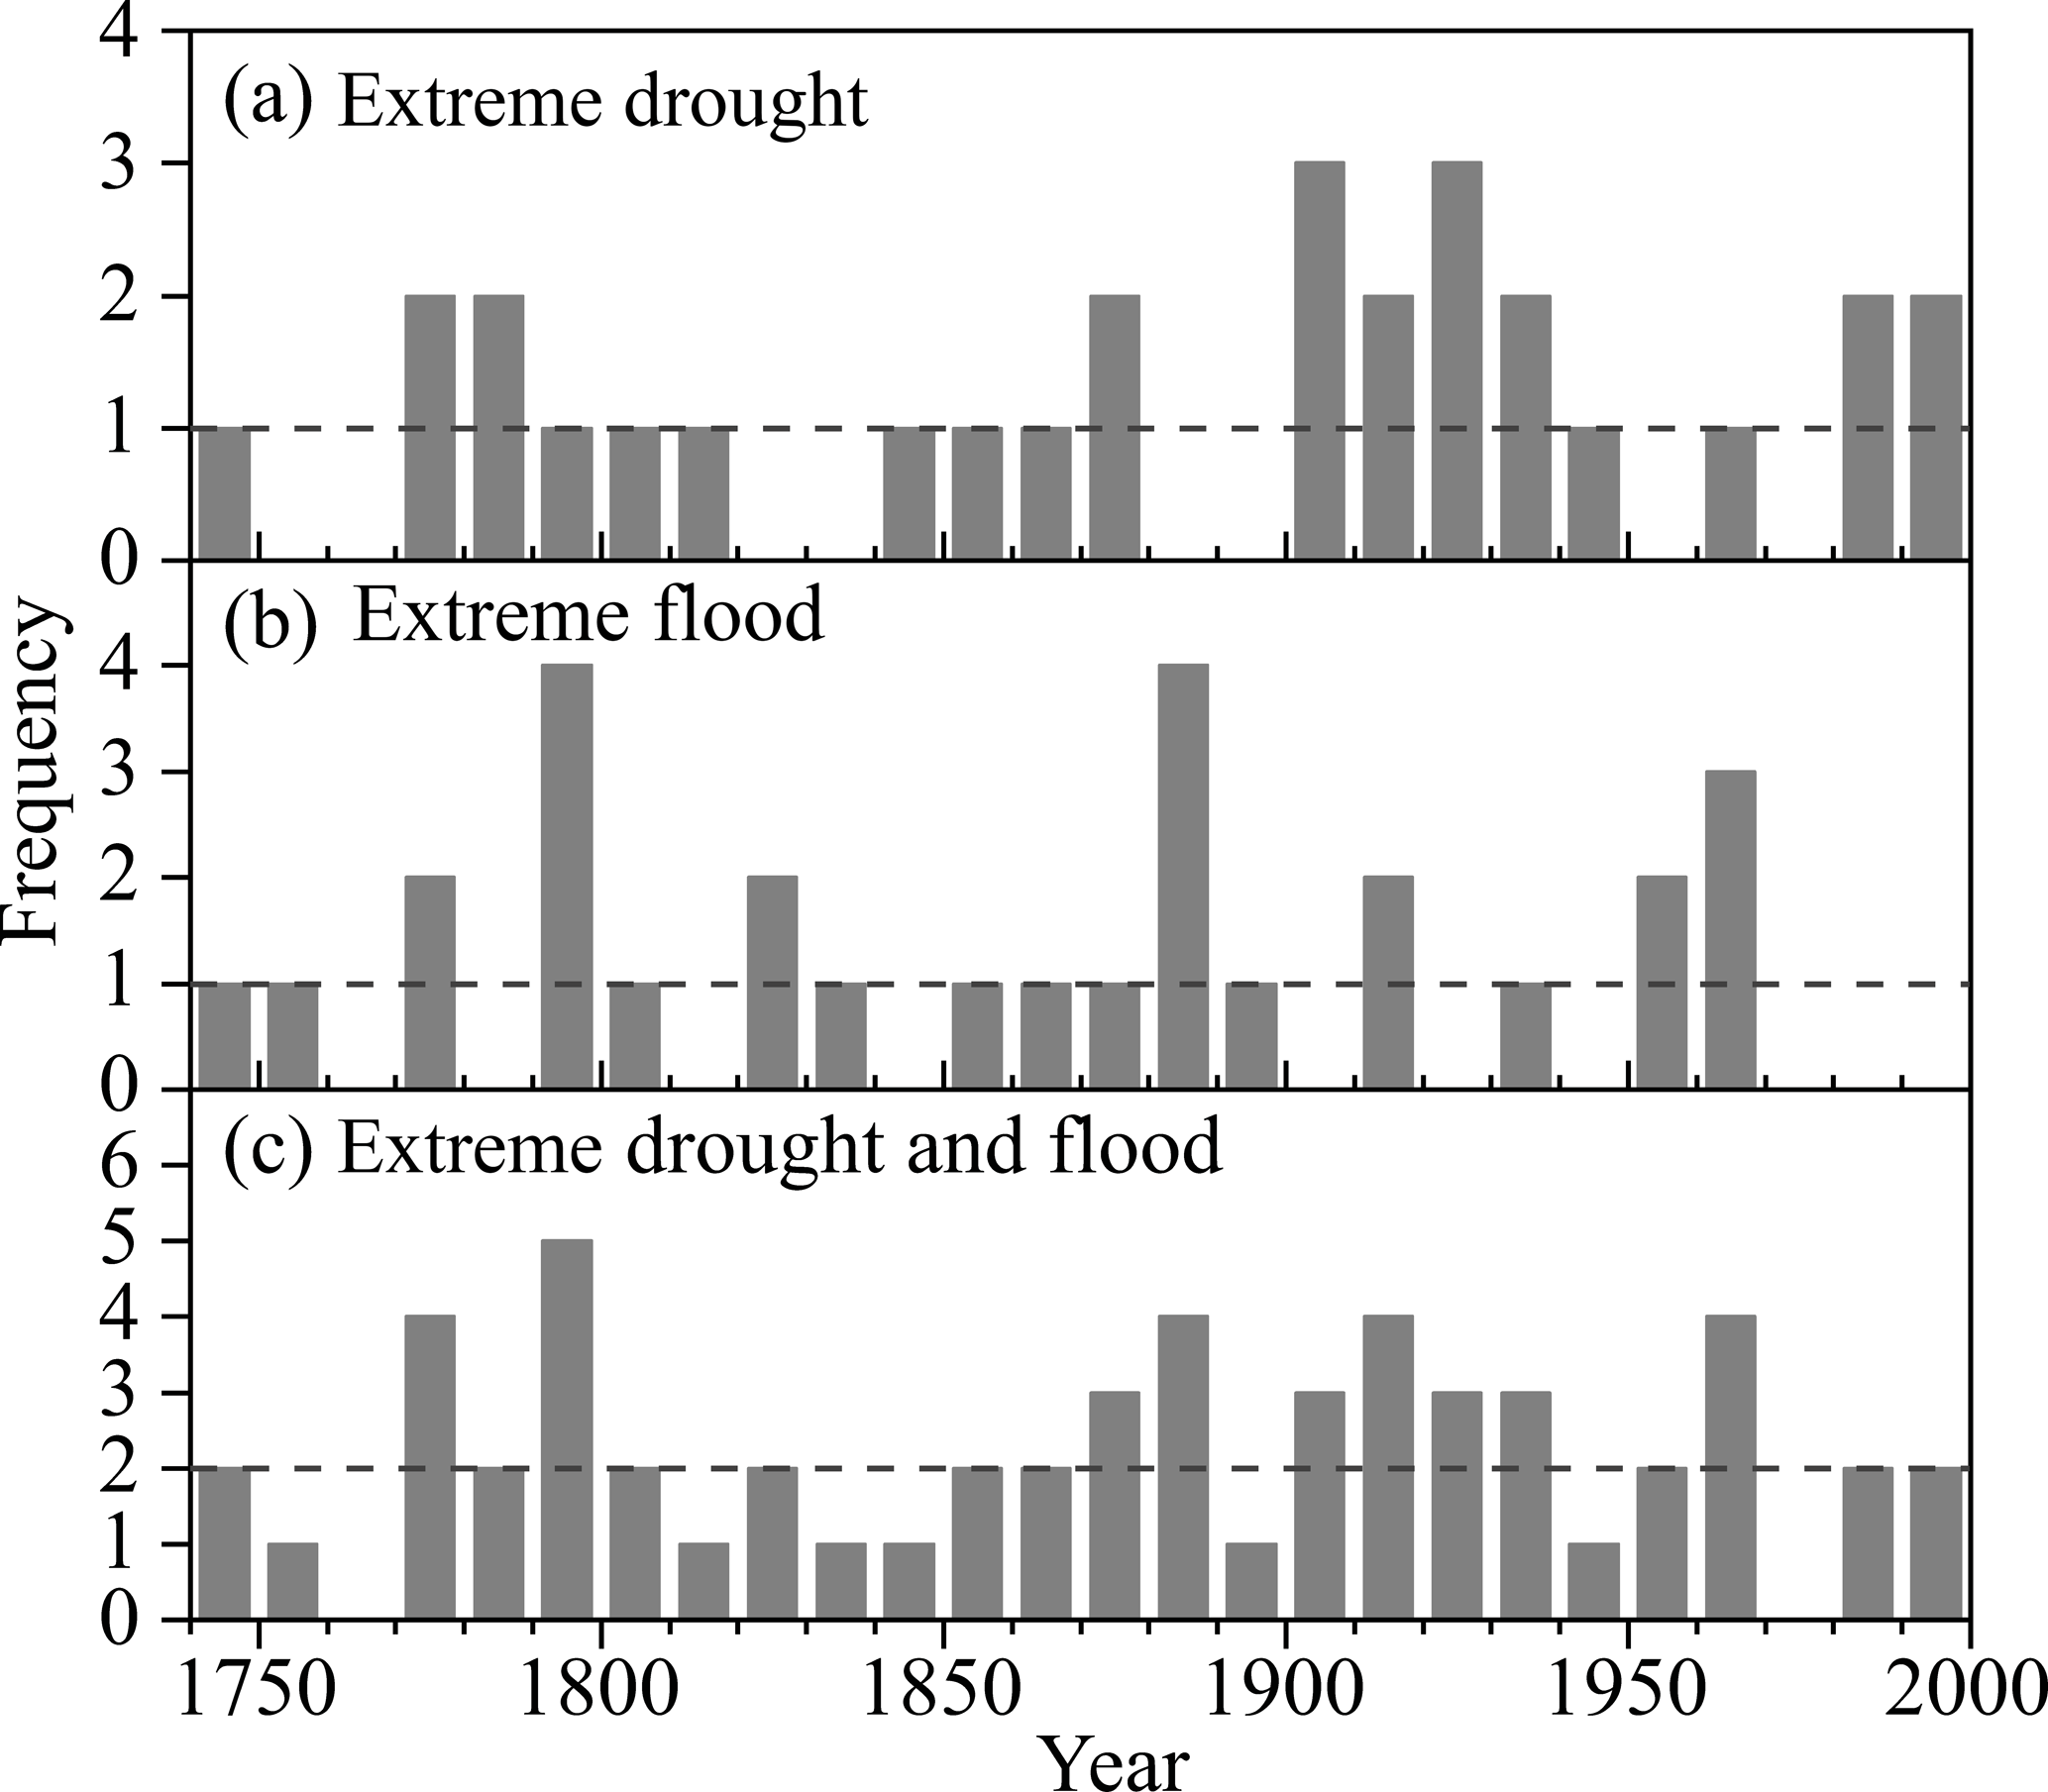
Figure 4The frequency of extreme drought and flood in North China for each decade from 1740s to 1990s.
3.2 Variation of extreme droughts and floods
Figure 4 illustrates the frequency of extreme drought and flood in the NCP for each decade from 1740s to 1990s. It shows that extreme drought occurs more frequently in the 1770s–1780s, 1870s, 1900s–1930s and 1980s–1990s with at least two extreme events for each decade, and the two decades of the 1900s and the 1920s both had three events. Moreover, some of them occurred within 2–3 years consecutively, e.g., in the periods 1777–1778, 1876–1877, 1900–1902, and 1919–1920. These consecutive events usually caused severe impacts on agriculture and society. For example, the droughts in the period 1876–1877 led to evidently poor harvests with a reduction of about 45 % and 50 % in 1876 and 1877, respectively (Hao et al., 2010b). Even worse, this consecutive extreme drought further caused evidently delayed sowing and crop failure within several years after 1877, and led to the rice price to increase by 5–10 times than that in the normal year (Hao et al., 2010b). Such persistent and spatially large bad harvests and food scarcities not only caused more than one hundred million people to die because of famine but also triggered more than one hundred thousand refugees to emigrate from the NCP to eastern Inner Mongolia (Xiao et al., 2011b), which finally resulted in more than 13 million people to die from famine and plague (W. Li et al., 1994). However, there were no extreme droughts in the 1750s–1760s, 1820s–1830s, 1880s–1890s, 1950s and 1970s. Besides, the frequency of extreme drought showed a slightly increased trend (0.29 times per 100 year) from the 1740s to 1990s, but it was not statistically significant.
More frequent extreme floods occurred in the 1770s, 1790s, 1820s, 1880s, 1910s and 1950s–1960s with two or more occurrences per decade, but no extreme flood occurred in the 1760s, 1780s, 1810s, 1840s, 1900s, 1920s, 1940s and 1970s–1990s. Meanwhile, the most frequent extreme floods (4 events) occurred in the 1790s and the 1880s, in which the consecutive extreme flood years in the period 1797–1800 caused flowages from several rivers and resulted in approximately 1∕4 of the total counties in the North China Plain to be flooded (Zheng et al., 2016). Moreover, four extreme flood years in the 1880s caused the continuous breaching of the dyke along the Yellow River from 1882 to 1890 (Zhang, 2010).
Table 1The occurrences of El Niño and La Niña events and large volcanic eruptions in the extreme drought/flood year and its previous year.
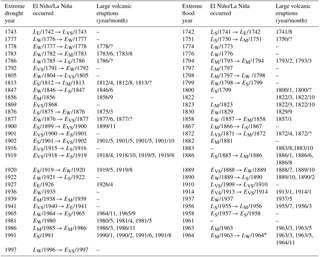
E represents El Niño, L represents La Niña, and the subscripts represent their magnitudes, which were categorized into five grades: extreme (E), very strong (VS), strong (S), moderate (M), and weak (W). The symbol “–” means that neither an El Niño/La Niña event nor a large volcanic eruption occurred. * In 1964, El Niño lasted until March, then changed into a La Niña in April.
For extreme drought and flood events in total, most of them occurred in the 1770s, 1790s, 1870s–1880s, 1900s–1930s and 1960s, among which the 1790s witnessed the highest frequency of extreme drought and flood events. Such frequent extreme droughts and floods, together with climate cooling from the late 18th century, resulted in the regional socioeconomic system becoming more vulnerable around the turn of the 19th century in the NCP (Fang et al., 2013). Furthermore, more frequent extreme floods/droughts caused many negative impacts, e.g., vulnerable food security and significant increase in disaster victims, which led to the deterioration of refugee relief and more occurrence of peasant uprising (Xiao et al., 2011a). However, no extreme drought or flood event occurred in the 1760s or 1970s.
3.3 Probabilities of the occurrences of extreme events with ENSO events and large volcanic eruptions
Table 1 shows the occurrences of ENSO (i.e., El Niño and La Niña events) and large volcanic eruptions (i.e., VEI ≥4) in the extreme drought/flood years and their previous years. It is shown that among the years before the 29 extreme droughts, 19 of them were El Niño years, 8 of them were La Niña years and 2 of them did not experience an ENSO event; and 10 of them experienced large volcanic eruptions. Among the 29 extreme drought years, 17 occurred in El Niño years, 8 occurred in La Niña years, 4 years did not experience ENSO events; and 12 years experienced large volcanic eruptions (Table 2). Among the years before the 28 extreme flood events, 11 of them were El Niño years, 9 of them were La Niña years, 8 of them did not experience ENSO events; and 11 of them experienced large volcanic eruptions. Among the 28 extreme flood years, there were 8 El Niño years, 13 La Niña years, 7 years did not experience ENSO events; and 12 years experienced large volcanic eruptions (Table 2). In total, 17 of the 29 extreme drought events and 18 of the 28 extreme flood events coincided with the occurrence of large volcanic eruptions in either the same or the previous year (Table 2).
Table 2The probabilities of extreme events occurrences with ENSO events and large volcanic eruptions.
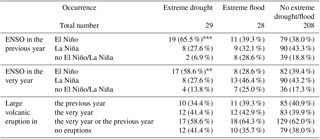
The significance level of chi-test (χ2): , p < 0.01; , p < 0.05.
The chi-square test (χ2) showed that there is a higher probability of extreme drought with the El Niño occurrence in the same year or the previous year. For example, the chi-square value is 7.997 for the occurrence of extreme drought and El Niño in the previous year, which is significant at the p<0.01 level. Regarding the occurrence of extreme drought and El Niño in the same year, the chi-square value is 4.502, which passes the p<0.05 significant level. Hao et al. (2008, 2010b) found that the precipitation over the NCP in the El Niño year or the sequent year was below that in normal years, and the severe drought of 1876–1877 was associated with the strong El Niño episode. Chen and Yang (2013) and Q. Li et al. (2011) also found that most drought events or extreme dry years in northern China might have a close link with the occurrence of El Niño during historical times. In addition, many previous studies from observation found that the El Niño could usually cause precipitation evidently decreasing in northern China not only simultaneously but also in the subsequent summer after an El Niño year (e.g., Wu et al., 2003; Lu, 2005, Zhang et al., 2017). Corresponding to the recent strong El Niño event in 2015–2016, the summer precipitation decreased by 20 % to 50 % over northern China (Zhai et al., 2016). Our result confirmed their findings. As suggested by previous studies based on observations and simulations, the mechanism of impact of El Niño on precipitation in the NCP can be summarized as follows. In the developing stage of an El Niño episode, weakened Walker Circulation could restrain the Indian summer monsoon and further trigger an anomalous barotropic cyclone over East Asia by modulating the wind fields from the western Tibetan Plateau and affecting the mid-latitude Asian wave pattern along 30–50∘ N. Correspondingly, the NCP is located in the area affected by the local downdraft airflow of that anomalous barotropic cyclone. Thus, the rainfall decreases in summer and autumn over the NCP (Wu et al., 2003; Lu, 2005). While in the peak and decaying year of El Niño, the warm sea surface temperature (SST) anomaly in the tropical Indian Ocean can trigger Kelvin waves to induce an anomalous easterlies in the equatorial atmosphere and the anomalous anticyclone over the western North Pacific (Xie et al., 2009). Since the southern flank of the western Pacific subtropical high (WPSH) prevail easterly winds, the enhanced easterlies lead to the southward shift of WPSH (Song and Zhou, 2014). The southward shift of WPSH consequently dampens the moisture transport from the Indian summer monsoon to eastern China, resulting in a significant decrease in rainfall in the NCP (Zhang et al., 2017).
However, the chi-square test demonstrated that there is no significant connection for the occurrences between extreme flood and ENSO events (Table 2). In addition, the chi-square test also suggested that no significant link exists between the occurrences of extreme drought/flood events and large volcanic eruptions, although Shen et al. (2007) had argued that the large volcanic eruptions might trigger the exceptional drought events over eastern China.
This study investigated the decadal variation of extreme drought and flood over North China based on the 17-site seasonal precipitation reconstruction for 1736–2000, in which the extreme drought/flood events were defined as those with occurrence probability lower than 10 % in the reference period of 1951–2000, by considering the probability of drought/flood occurrence in each site and spatial coverage together. It is found that there were 29 extreme droughts and 28 extreme floods in North China during 1736–2000, in which precipitation decreased (increased) evidently in most sites for all seasons, especially in summer and autumn for most of them. In 1777–1778, 1876–1877, 1900–1902 and 1919–1920, the extreme droughts occurred sequentially, and in 1797–1800, 1882–1883, 1889–1890 and 1963–1964, the extreme floods appeared consequently. Compared to the previous studies on extreme droughts and floods derived from the yearly dryness/wetness grade data, this study found 9 extreme drought events and 18 extreme flood events that had not been reported previously.
Moreover, the results showed that there was an evidently decadal variation in the occurrence of extreme drought/flood events from the 1740s to 1990s. In the 1770s–1780s, 1870s, 1900s–1930s and 1980s–1990s, the extreme drought occurred at least 2 times in each decade, among which the most frequent occurrences (3 times) were in the 1900s and the 1920s. While two or more extreme floods occurred in the 1770s, 1790s, 1820s, 1880s, 1910s and 1950s–1960s, with 1790s and 1880s having the most frequent occurrences (4 times). As the extreme drought and flood events in total, there were more frequent in the 1770s, 1790s, 1870s–1880s, 1900s–1930s and the 1960s, and the most frequent (5 events) decade was in the 1790s. In addition, comparison of the occurrences of extreme drought/flood with the chronologies of ENSO and large volcanic eruptions by the chi-square test (χ2) confirmed that there was a higher probability of the extreme drought following an El Niño episode. Nevertheless, no significant connection existed between either the occurrences of extreme flood and El Niño/La Niña episodes or between the occurrences of extreme drought/flood and large volcanic eruptions.
The archive of Yu-Xue-Fen-Cun provided the quantitative records on rainfall and snowfall with high spatial and temporal resolutions for the seasonal precipitation reconstruction from 1736, which enabled us to investigate the variation of extreme drought and flood with seasonal features. Besides Yu-Xue-Fen-Cun, China also has other historical documents (e.g., local gazettes, official histories, weather diaries, etc.) with abundant and well-dated records on weather, anomalous climate, climate-related natural disasters, the impacts of weather and climate anomalies, as well as phenology, which have been used for the reconstruction of past climates extended to more than thousands of years at resolutions of annual to decadal timescales (Ge et al., 2016). Thus, most of them could be further applied to identify the regional extreme climate events at yearly resolution or prominent decadal climate anomalies before 1736, and to investigate the long-term pattern on the occurrences of regional extreme climate events associated with anomalous forcings in future works.
All reconstructed data for the identification of extreme drought and flood events used in this study are available in the Supplement. Chronology of El Niño and La Niña events are available at https://www.ncdc.noaa.gov/paleo-search/study/8408 (NOAA, 2018).
The supplement related to this article is available online at: https://doi.org/10.5194/cp-14-1135-2018-supplement.
JZ and ZH designed the research and reconstructed the seasonal precipitation series; YY and XZ analysed the data; JZ and YY illustrated the plots. JZ, ZH and YY wrote the paper.
The authors declare that they have no conflict of interest.
This study was supported by the National Key R&D Program of China
(2016YFA0600702), the National Natural Science Foundation of China
(nos. 41430528, 41671201) and the Chinese Academy of Sciences (XDA19040101).
Edited by: Marit-Solveig Seidenkrantz
Reviewed by: two anonymous referees
Braganza, K., Gergis, J. L., Power, S. B., Risbey, J. S., and Fowler, A. M.: A multiproxy index of the El Nino-Southern Oscillation, AD 1525–1982, J. Geophys. Res.-Atmos., 114, D05106, https://doi.org/10.1029/2008jd010896, 2009.
Chinese Academy of Meteorological Science (CAMS): Yearly charts of dryness/wetness in China for the last 500 years, Cartographic Publishing House, Beijing, China, 1981 (in Chinese).
Chen, Z. and Yang, G.: Analysis of drought hazards in North China: distribution and interpretation, Nat. Hazards, 65, 279–294, 2013.
Cook, E. R., Seager, R., Heim, R. R., Vose, R. S., Herweijer, C., and Woodhouse, C.: Megadroughts in North America: Placing IPCC projections of hydroclimatic change in a long-term palaeoclimate context, J. Quaternary Sci., 25, 48–61, 2010.
Ding, Y. and Wang, H.: Newly acquired knowledge on the scientific issues related to climate change over the recent 100 years in China, Chinese Sci. Bull., 61, 1029–1041, 2016 (in Chinese).
Fang, X., Xiao, L., and Wei, Z.: Social impacts of the climatic shift around the turn of the 19th century on the North China Plain, Sci. China Earth Sci., 56, 1044–1058, 2013.
Feng, J., Wang, L., and Chen, W.: How Does the East Asian Summer Monsoon Behave in the Decaying Phase of El Nino during Different PDO Phases?, J. Clim., 27, 2682–2698, 2014.
Ge, Q., Zheng, J., Hao, Z., Zhang, P., and Wang, W.-C.: Reconstruction of historical climate in China: High-resolution precipitation data from Qing dynasty archives, B. Am. Meteorol. Soc., 86, 671–679, 2005.
Ge, Q., Zheng, J., Hao, Z., Liu, Y., and Li, M.: Recent advances on reconstruction of climate and extreme events in China for the past 2000 years, J. Geogr. Sci., 26, 827–854, 2016.
Gergis, J. L. and Fowler, A. M.: A history of ENSO events since AD 1525: implications for future climate change, Climatic Change, 92, 343–387, 2009.
Global Volcanism Program: Volcanoes of the World, v. 4.6.2, edited by: Venzke, E., Smithsonian Institution, downloaded 5 May 2017, https://doi.org/10.5479/si.GVP.VOTW4-2013, 2013.
Hao, Z. X., Zheng, J. Y., and Ge, Q. S.: Precipitation cycles in the middle and lower reaches of the Yellow River (1736–2000), J. Geogr. Sci., 18, 17–25, 2008.
Hao, Z., Ge, Q., and Zheng, J.: Variations of extreme drought/flood events over eastern China during the past 2000 years, Climatic and Environmental Research, 15, 388–394, 2010a (in Chinese).
Hao, Z., Zheng, J., Wu, G., Zhang, X., and Ge, Q.: 1876–1878 severe drought in North China: facts, impacts and climatic background, Chinese Sci. Bull., 55, 3001–3007, 2010b.
IPCC: Managing the Risks of Extreme Events and Disasters to Advance Climate Change Adaptation, A Special Report of Working Groups I and II of the Intergovernmental Panel on Climate Change, edited by: Field, C. B., Barros, V., Stocker, T. F., Qin, D., Dokken, D. J., Ebi, K.L., Mastrandrea, M. D., Mach, K. J., Plattner, G.-K., Allen, S. K., Tignor, M., and Midgley, P. M., Cambridge University Press, Cambridge, UK and New York, USA, 582 pp., 2012
IPCC: Climate Change 2013: The Physical Science Basis, Contribution of Working Group I to the Fifth Assessment Report of the Intergovernmental Panel on Climate Change, edited by: Stocker, T. F., Qin, D., Plattner, G.-K., Tignor, M., Allen, S. K., Boschung, J., Nauels, A., Xia, Y., Bex, V., and Midgley, P. M., Cambridge University Press, Cambridge, UK and New York, USA, 1535 pp., 2013.
Jiang, J., Zhang, D. E., and Fraedrich, K.: Historic climate variability of wetness in East China (960–1992): A wavelet analysis, Int. J. Climatol., 17, 969–981, 1997.
Jiang, T., Zhang, Q., Blender, R., and Fraedrich, K.: Yangtze Delta floods and droughts of the last millennium: Abrupt changes and long term memory, Theor. Appl. Climatol., 82, 131–141, 2005.
Li, J., Xie, S.-P., Cook, E. R., Morales, M. S., Christie, D. A., Johnson, N. C., Chen, F., D'Arrigo, R., Fowler, A. M., Gou, X., and Fang, K.: El Nino modulations over the past seven centuries, Nat. Clim. Change, 3, 822–826, 2013.
Li, Q., Nakatsuka, T., Kawamura, K., Liu, Y., and Song, H.: Hydroclimate variability in the North China Plain and its link with El Niño–Southern Oscillation since 1784 A.D.: Insights from tree-ring cellulose δ18O, J. Geophys. Res., 116, D22106, https://doi.org/10.1029/2011JD015987, 2011.
Li, J., Xie, S.-P., Cook, E. R., Huang, G., D'Arrigo, R., Liu, F., Ma, J., and Zheng, X.-T.: Interdecadal modulation of El Nino amplitude during the past millennium, Nat. Clim. Change, 1, 114–118, 2011.
Li, W., Cheng, X., Liu, Y., and Xia, M.: The ten greatest disasters in Modern China, Shanghai People's Publishing House, Shanghai, China, 80–113, 1994 (in Chinese).
Lu, R.: Interannual variation of North China rainfall in rainy season and SSTs in the equatorial eastern Pacific, Chinese Sci. Bull., 50, 2069–2073, 2005.
Ma, Y., Wan, J., Ye, Y., and Fang, X.: Reconstruction of flood disaster process in Haihe River drainage area in 1917, J. Palaeogeo., 17, 851–860, 2015 (in Chinese).
Man, Z.: Climatic Background of the Severe Drought in 1877, Fudan Journal (Social Sciences Edition), 6, 28–35, 2000 (in Chinese).
McGregor, S., Timmermann, A., and Timm, O.: A unified proxy for ENSO and PDO variability since 1650, Clim. Past, 6, 1–17, https://doi.org/10.5194/cp-6-1-2010, 2010.
NOAA: Gergis and Fowler 2009 Multiproxy ENSO Event Reconstructions, available at: https://www.ncdc.noaa.gov/paleo-search/study/8408, last access: 7 August 2018.
Qian, W., Chen, D., Zhu, Y., and Shen, H.: Temporal and spatial variability of dryness/wetness in China during the last 530 years, Theor. Appl. Climatol., 76, 13–29, 2003a.
Qian, W., Hu, Q., Zhu, Y., and Lee, D. K.: Centennial-scale dry-wet variations in East Asia, Clim. Dynam., 21, 77–89, 2003b.
Qin, D., Zhang J., Shan C., and Song L.: China national assessment report on risk management and adaptation of climate extremes and disasters, Science Press, Beijing, 124 pp., 2015 (in Chinese).
Shen, C., Wang, W.-C., Hao, Z., and Gong, W.: Exceptional drought events over eastern China during the last five centuries, Climatic Change, 85, 453–471, 2007.
Shen, C., Wang, W.-C., Hao, Z., and Gong, W.: Characteristics of anomalous precipitation events over eastern China during the past five centuries, Clim. Dynam., 31, 463–476, 2008.
Sigl, M., Winstrup, M., McConnell, J. R., Welten, K. C., Plunkett, G., Ludlow, F., Buentgen, U., Caffee, M., Chellman, N., Dahl-Jensen, D., Fischer, H., Kipfstuhl, S., Kostick, C., Maselli, O. J., Mekhaldi, F., Mulvaney, R., Muscheler, R., Pasteris, D. R., Pilcher, J. R., Salzer, M., Schuepbach, S., Steffensen, J. P., Vinther, B. M., and Woodruff, T. E.: Timing and climate forcing of volcanic eruptions for the past 2,500 years, Nature, 523, 543–549, 2015.
Song, F. and Zhou, T.: Interannual variability of East Asian summer monsoon simulated by CMIP3 and CMIP5 AGCMs: Skill dependence on Indian Ocean–western Pacific anticyclone teleconnection, J. Clim., 27, 1679–1697, 2014.
Stahle, D. W., D'Arrigo, R. D., Krusic, P. J., Cleaveland, M. K., Cook, E. R., Allan, R. J., Cole, J. E., Dunbar, R. B., Therrell, M. D., Gay, D. A., Moore, M. D., Stokes, M. A., Burns, B. T., Villanueva-Diaz, J., and Thompson, L. G.: Experimental dendroclimatic reconstruction of the Southern Oscillation, B. Am. Meteorol. Soc., 79, 2137–2152, 1998.
Wang, H.: The instability of the East Asian summer monsoon–ENSO relations, Adv. Atmos. Sci., 19, 1–11, 2002.
Wang, H. and He, S.: The north China/Northeastern Asia severe summer drought in 2014, J. Clim., 28, 6667–6681, 2015.
Wilson, R., Cook, E., D'Arrigo, R., Riedwyl, N., Evans, M. N., Tudhope, A., and Allan, R.: Reconstructing ENSO: the influence of method, proxy data, climate forcing and teleconnections, J. Quaternary Sci., 25, 62–78, 2010.
Wu, R., Hu, Z., and Kirtman, B. P.: Evolution of ENSO-related rainfall anomalies in East Asia, J. Clim., 16, 3742–3758, 2003.
Xiao, L., Fang, X., Huang, H., and Wei Z.: Changes in the ways of social response to floods and droughts in North China Plain during 1780–1819, J. Catastrophol., 26, 83–87, 2011a (in Chinese).
Xiao, L., Fang, X., and Ye, Y.: Agricultural development in Eastern Inner Mongolia and its climatic background during 1644–1911, Geogr. Res., 30, 1775–1782, 2011b (in Chinese).
Xie, S.-P., Hu, K., Hafner, J., Tokinaga, H., Du, Y., Huang, G., and Sampe, T.: Indian Ocean capacitor effect on Indo-western Pacific climate during the summer following El Niño, J. Clim., 22, 730–747, 2009.
Zeng, Z., Fang, X., Ye, Y., Zhang, X., and Xiao, L.: Comparison of disaster situation and causes of three extreme droughts in China over the past 300 years, J. Catastrophol., 24, 116–122, 2009 (in Chinese).
Zhai, P., Yu, R., Guo, Y., Li, Q., Ren, X., Wang, Y., Xu, W., Liu, Y., and Ding, Y.: The strong El Nino of 2015/16 and its dominant impacts on global and China's climate, J. Meteorol. Res., 30, 283–297, 2016.
Zhang, D.: 1784–1787 drought occurrence over east China in a warm climatic background, Acta Geogr. Sin., 55, 106–112, 2000 (in Chinese).
Zhang, D.: A Compendium of Chinese Meteorological Records of the Last 3000 Years, Jiangsu Education Press, Nanjing, China, 2004.
Zhang, D.: Severe drought events as revealed in the climate records of China and their temperature situations over the last 1000 years, Acta Meteorol. Sin., 19, 485–491, 2005.
Zhang, D: A Study of the Large Scale Flooding over Eastern China in 1755, Adv. Clim. Chang. Res., 3, 128–137, 2012 (in Chinese).
Zhang, D. and Liang, Y.: A long lasting and extensive drought event over China during 1876–1878, Adv. Clim. Chang. Res., 6, 106–112, 2010 (in Chinese).
Zhang, D. and Liang, Y.: Study of the heavy torrential rain over the Huang-Huai region in eastern China in 1730 – an extreme climatic event in history, Adv. Clim. Chang. Res., 12, 407–412, 2016 (in Chinese).
Zhang, G.: The research on the famine of Guangxu times (1875–1908), Shandong University, 46–48, 2010 (in Chinese).
Zhang, R., Min, Q., and Su, J.: Impact of El Nino on atmospheric circulations over East Asia and rainfall in China: Role of the anomalous western North Pacific anticyclone, Sci. China Earth Sci., 60, 1124–1132, 2017.
Zheng, J., Hao, Z., and Ge, Q.: Variation of precipitation for the last 300 years over the middle and lower reaches of the Yellow River, Sc. China Ser. D, 48, 2182–2193, 2005.
Zheng, J., Wang, W.-C., Ge, Q., Man, Z., and Zhang, P.: Precipitation variability and extreme events in eastern China during the past 1500 years, Terr. Atmos. Ocean. Sci., 17, 579–592, 2006.
Zheng, J., Mou, C., and Liu, H.: A compendium of climatic impact records derived from veritable records of the Qing Dynasty, China Meteorological Press, Beijing, China, 474–493, 2016 (in Chinese).