
the Creative Commons Attribution 4.0 License.
the Creative Commons Attribution 4.0 License.
 | 19 Oct 2026
Orbital-scale precipitation variations in the western Qaidam Basin during the Late Pliocene: evidence from magnetic parameters and median grain-size
Zeng Luo

Hansheng Wang
Xiaoli Yu
Zhongbao Zhang
Zhifen Song
Jing Yang
Wanfeng Chen
Qingda Su
Yang Lu
Shun Hua
A recent study suggests that the precipitation records of the western Qaidam Basin during the middle Piacenzian warm period (mPWP, 3.264–3.025 Ma) are broadly consistent with those of the monsoon-influenced regions, and are highly sensitive to 20 kyr precessional cycles, implying that the East Asian summer monsoon (EASM) precipitation intensified and penetrated farther westward into the Asian interior during this warm interval. However, it remains unclear whether such a precession-dominated pattern persisted throughout the Late Pliocene or was restricted to specific intervals. To address this question, we present new magnetic parameter and median grain-size records from the Gansen section for ∼ 3.6–3.25 Ma and 2.95– ∼ 1.8 Ma, and integrate them with the previously published records for 3.25–2.95 Ma to assess orbital-scale precipitation variations in the western Qaidam Basin during the Late Pliocene. The results suggest that EASM-related summer moisture reached the western Qaidam Basin during ∼ 3.6–3.25 Ma, although the associated precipitation was weaker than during 3.25–2.95 Ma. Spectral analysis further reveals that precipitation variations during ∼ 3.6–3.3 Ma were characterized mainly by eccentricity-scale (∼ 100–125 kyr) variability rather than the previously reported precession-dominated pattern during 3.25–2.95 Ma, which may reflect a nonlinear response to insolation forcing. This contrast indicates that the precession-dominated pattern was not a persistent feature throughout the Late Pliocene in the western Qaidam Basin. Instead, our results suggest that under different climatic background states, the dominant processes influencing the westward penetration of summer moisture into the western Qaidam Basin were also different, and that the 20 kyr precessional signal and eccentricity-scale variability mainly reflect these differences in forcing response. In addition, the broad correspondence between these precipitation records and the benthic δ18O stack at the 40 kyr band suggests that high-latitude ice-volume variability, potentially including Antarctic ice-sheet variability, may also have modulated precipitation variations in the basin during ∼ 3.6–3.3 Ma. These findings provide new insight into how background climate conditions may shape orbital-scale hydroclimatic responses in the Asian interior during the Late Pliocene.
- Article
(7850 KB) - Full-text XML
-
Supplement
(1197 KB) - BibTeX
- EndNote


With continued global warming, knowledge of climate variations during past warm periods has major implications for understanding future climate change. The middle Piacenzian warm period (mPWP: 3.264–3.025 Ma), a particularly well-documented warm interval during the Late Pliocene, has long been considered an ideal geological analog for interpreting the path of future anthropogenic warming (Ravelo et al., 2004; Raymo et al., 2006; Dowsett et al., 2010; Salzmann et al., 2011; Haywood et al., 2011; Lunt et al., 2012; Burke et al., 2018; Su et al., 2024; Luo et al., 2021, 2024; Zhou and Liu, 2025). Compared to the present, this interval was characterized by similar orbital configurations and geographic boundary conditions (Haywood et al., 2011; Su et al., 2024), higher atmospheric carbon dioxide concentrations (400–450 ppmv) (Bartoli et al., 2011; Badger et al., 2013; Haywood et al., 2016), small Arctic ice sheets (Brigham-Grette et al., 2013; Rahaman et al., 2020), elevated global temperatures (Burke et al., 2018), and increased sea levels (Hearty et al., 2020). Over the past two decades, numerous studies based on proxy reconstructions from loess deposits, lake sediments, and marine sediments, together with climate model simulations, have suggested that the mid-Piacenzian world was not only warmer but also wetter on most continents than today (Reguero et al., 2007; Salzmann et al., 2008, 2011; Brigham-Grette et al., 2013; Herbert et al., 2016; Yang et al., 2018; Vieira et al., 2018; Zhou and Liu, 2025). Similarly, in the Asian interior, the extent of arid regions decreased during the mPWP. For example, arid conditions in the Qaidam Basin, an important part of the Asian interior, were alleviated during the mPWP, contributing to a regional contraction of the inland arid zone (Koutsodendris et al., 2019; Huang et al., 2019; Schwarz et al., 2022; Su et al., 2024). This occurred because the influence of the East Asian summer monsoon (EASM) extended westward toward the western Qaidam Basin, bringing relatively more water vapor to this area and changing the local moisture conditions (Huang et al., 2019, 2021; Schwarz et al., 2022).
At the orbital timescale, recent precipitation records from the Gansen (GS) section of the western Qaidam Basin reveal dominant 20 kyr precessional cycles during the mPWP (Luo et al., 2024). These cycles are consistent with records from the Chinese Loess Plateau and the South China Sea (Wehausen and Brumsack, 2002; Wan et al., 2010; Luo et al., 2021), further indicating that the EASM strongly influenced precipitation in the western Qaidam Basin during this warm interval. However, EASM influence has also been suggested for other intervals of the Late Pliocene. For example, pollen records from the SG-1b core in the western Qaidam Basin show that annual mean precipitation during 3.5–3.0 Ma was about ten times higher than today and was associated with EASM (Koutsodendris et al., 2019; Schwarz et al., 2022). Hematite-content records from the HTG section of the western Qaidam Basin also suggest that the EASM affected precipitation variations in this region during the Late Pliocene (Su et al., 2024). These studies, however, inferred different dominant orbital periodicities, with Schwarz et al. (2022) arguing for dominant 100 kyr eccentricity cycles and Su et al. (2024) proposing dominant 40 kyr obliquity cycles. Consequently, it remains unclear whether the precession-dominated precipitation pattern identified during the mPWP was restricted to that interval or persisted throughout the Late Pliocene. Resolving this question requires additional high-resolution precipitation records from other intervals of the Late Pliocene.
To address this issue, we present new magnetic parameter and median grain-size records from the GS section in the western Qaidam Basin for ∼ 3.6–3.25 Ma and 2.95– ∼ 1.8 Ma. By integrating these new data with the previously published records for 3.25–2.95 Ma, we construct a longer precipitation record spanning ∼ 3.6– ∼ 1.8 Ma and compare the orbital-scale characteristics of precipitation across different Late Pliocene intervals.
The Qaidam Basin is located in the northeastern part of the Qinghai-Tibet Plateau, extending approximately from 35.9° to 39.3° N and from 90.3° to 99.3° E (Fig. 1). It is surrounded by several mountain ranges, including the Kunlun Mountains to the south, the Altyn Tagh Mountains to the northwest, the Qilian Mountains to the northeast, and the Ela Mountains to the east (Fig. 1b). This mountain-surrounding geographical pattern renders the Qaidam Basin relatively enclosed, forming a unique climate and ecological environment. Because the basin is far from major moisture sources and lies in the rain shadow of the Tibetan Plateau, mean annual precipitation is very low, ranging from only 50 to 200 mm, whereas mean annual evaporation is as high as ∼ 3000 mm (Cai et al., 2012; Wang et al., 2013; Yang et al., 2020; Luo et al., 2024). As a result, the Qaidam Basin is characterized by a hyper-arid climate, with widespread deposition of evaporite minerals such as halite, carbonates, and gypsum (Li et al., 2010; Wang et al., 2013; Luo et al., 2018, 2024).
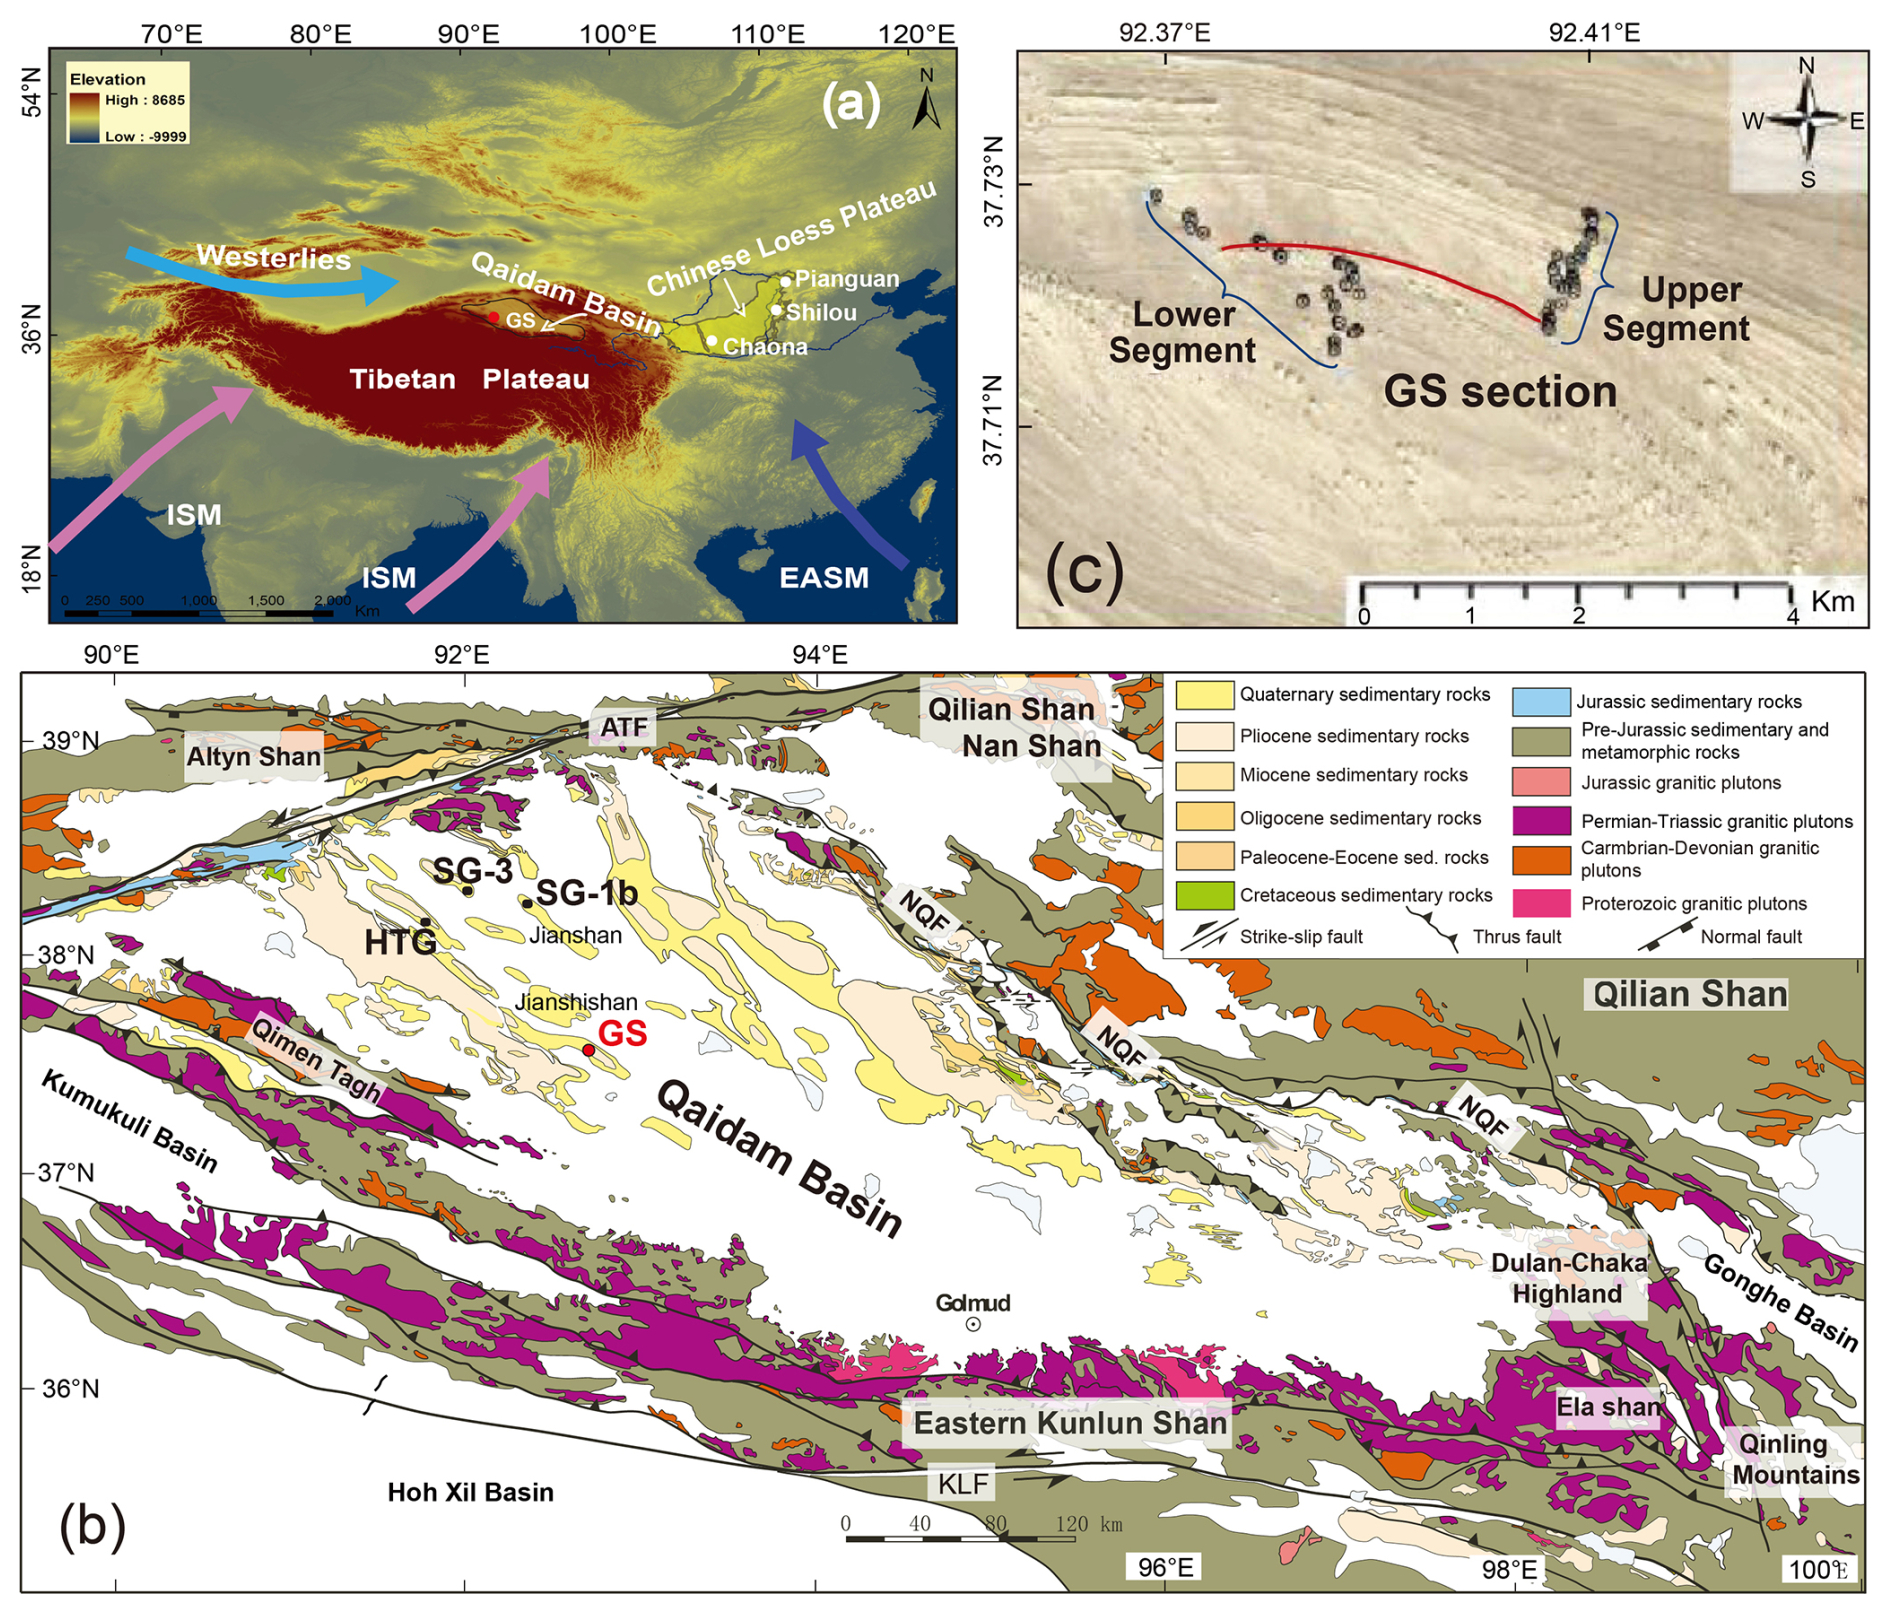
Figure 1Locations of the study GS site. (a) The modern summer atmospheric circulation pattern of Asia and the location of the GS section labeled with a red spot. ISM: Indian summer monsoon. EASM: East Asian summer monsoon. (b) Detailed geological map of the Qaidam Basin and the location of the GS section in the Qaidam Basin. ATF: Altyn Tagh fault, KLF: Kunlun fault, NQF: North Qaidam fault. This figure is modified after Bush et al. (2016). (c) A closer look at the GS section with a satellite image showing the sample locations and their distribution between the lower segment (0–226 m in stratigraphic height) and the upper segment (201–478 m in stratigraphic height) of the stratigraphic section.
The studied GS section (37.717° N, 92.38° E to 37.73° N, 92.41° E) lies on the southern flank of the anticline which is close to Jianshi Shan on the northwestern margin of the Qaidam Basin (Fig. 1b). Owing to the presence of thick salt and weathering crusts in the upper part of the section, only the lower 478 m was sampled. However, because the GS section is a composite stratigraphic succession composed of lower and upper segments that overlap between 201 and 226 m, the effective stratigraphic thickness is 453 m (Fig. 1c). The strata consist mainly of massive and laminated siltstone, interbedded with gypsum-rich siltstone and occasional sandstone beds (Fig. 2). Gypsum layers occur throughout the sequence, whereas halite layers are confined to the intervals between 0 and 95 m and between 244 and 453 m (Fig. 2). Previous paleomagnetic analyses indicate that the sampled 0–453 m interval of the GS section spans ∼ 3.6– ∼ 1.8 Ma (Luo et al., 2024).
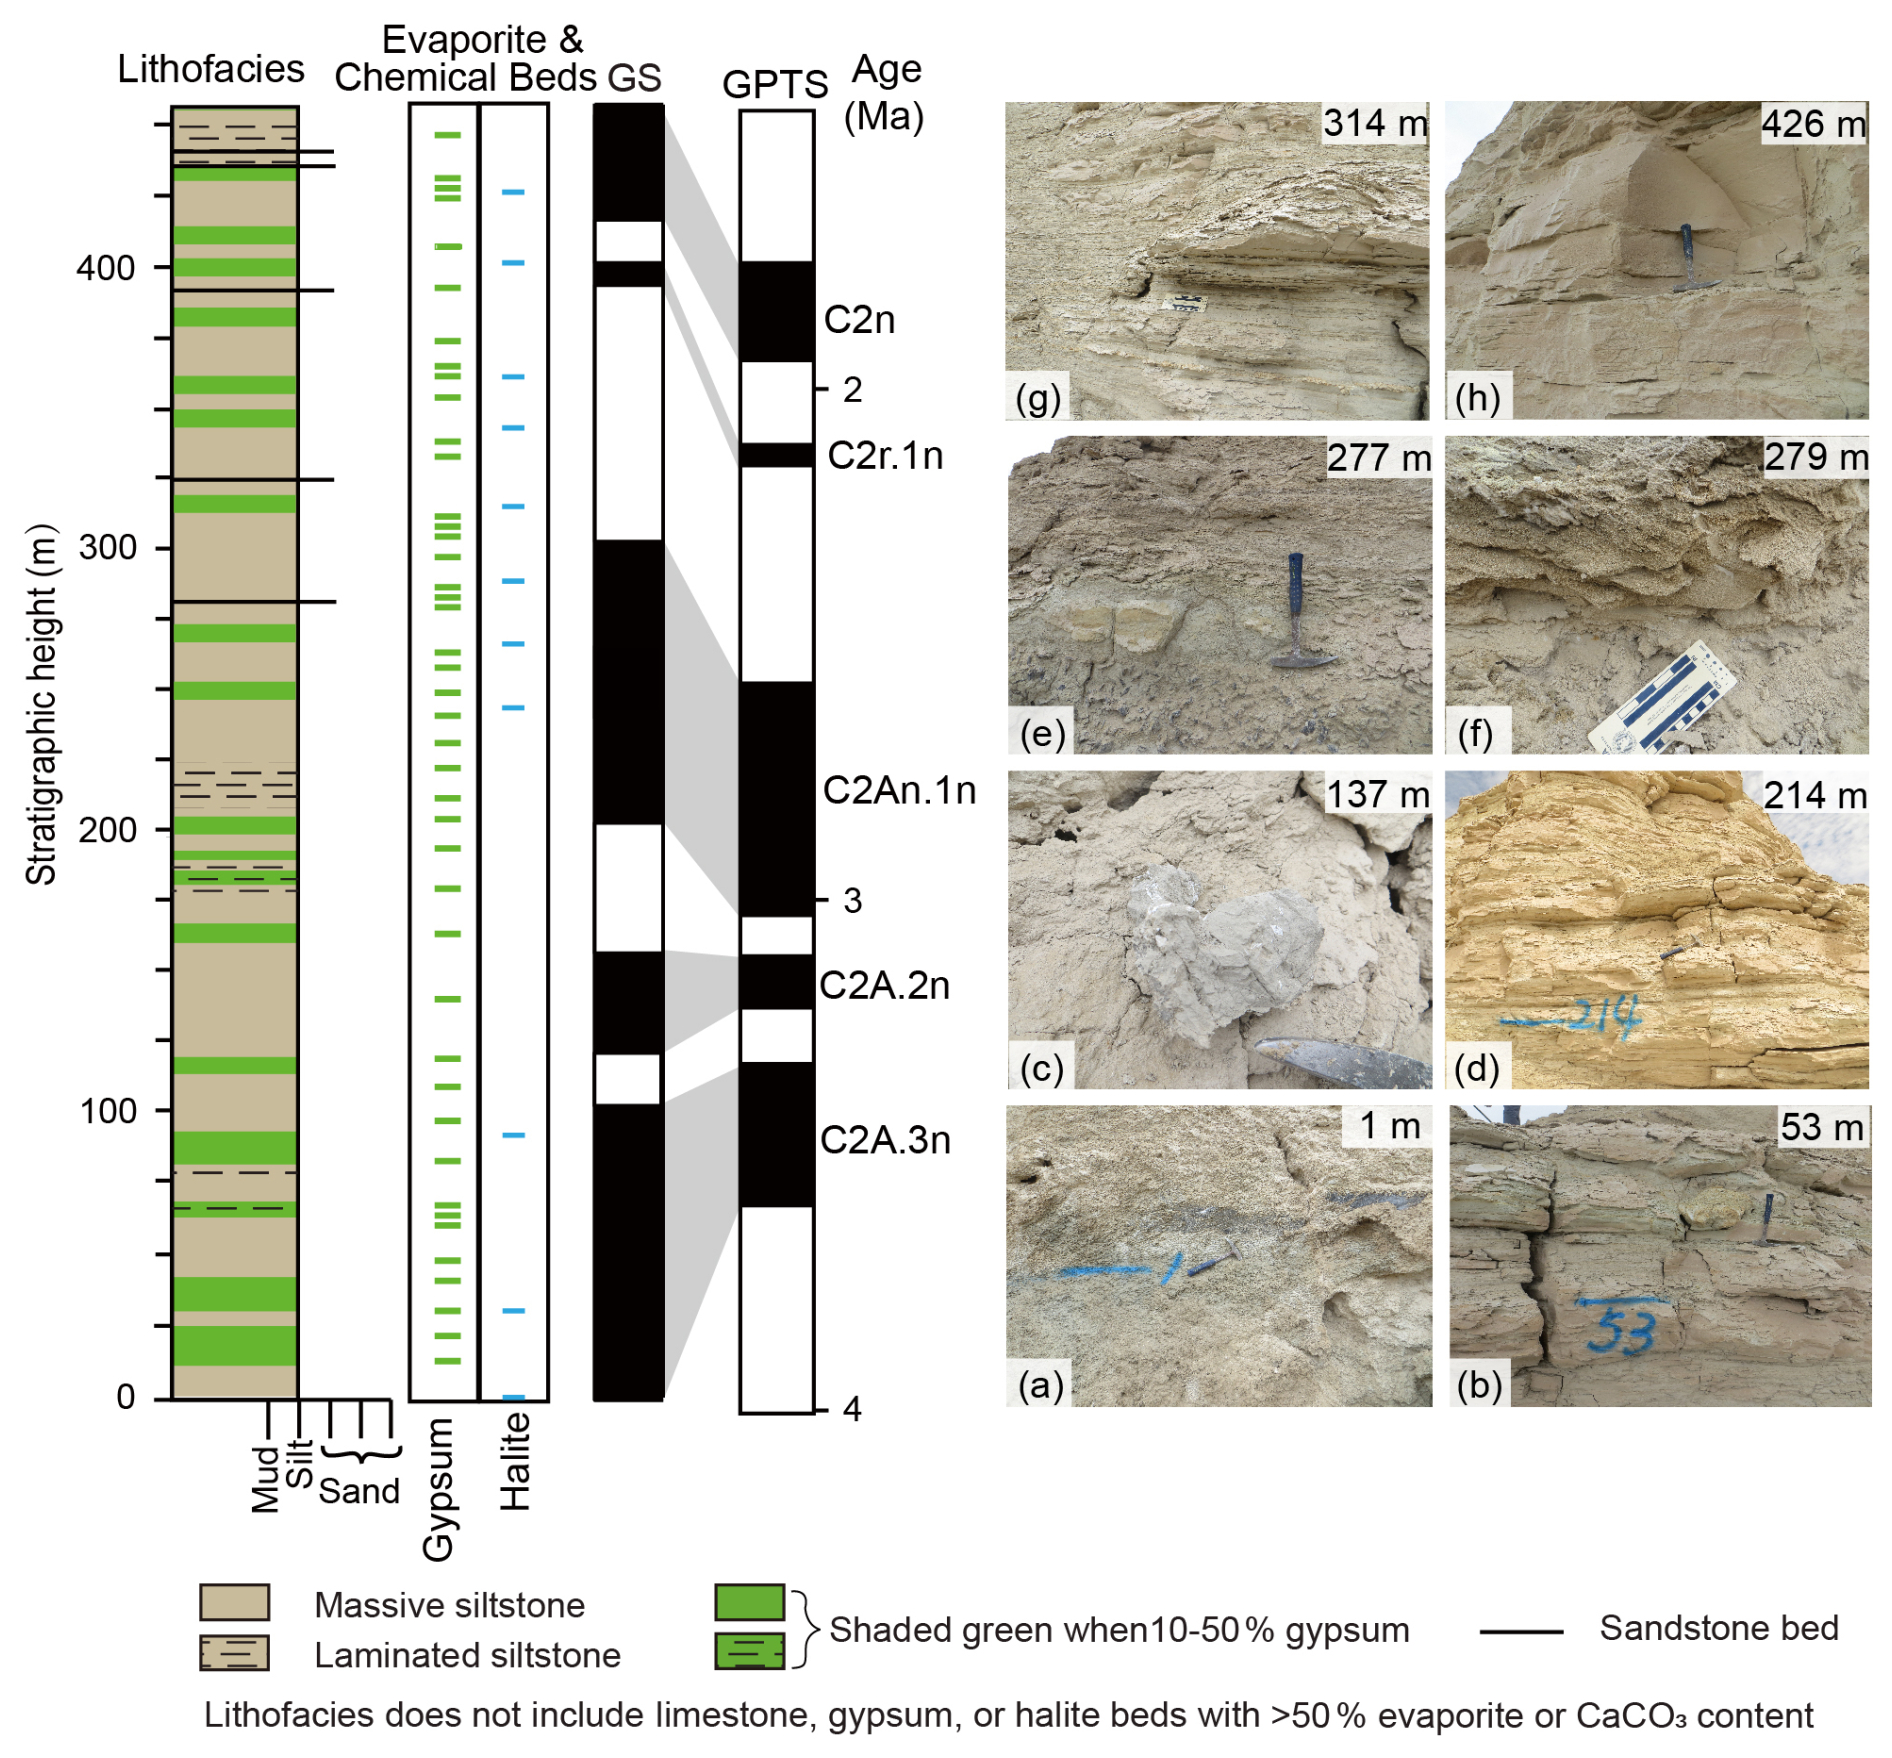
Figure 2Lithology, age model and representative sediments in the GS section.
3.1 Chronology of the GS section
The chronology of the GS section is based on the previously published paleomagnetic framework of Luo et al. (2024). In that study, the observed polarity sequence of the sampled 0–453 m interval was well correlated with the geomagnetic polarity time scale (GPTS), and 10 paleomagnetic age control points were used to establish the age model for the section (Table S1, Fig. S1a in the Supplement), indicating that the sampled interval spans ∼ 3.6– ∼ 1.8 Ma (Luo et al., 2024). Ages between adjacent paleomagnetic tie points were obtained by linear interpolation, and the sedimentation rates calculated between adjacent tie points indicate non-uniform sedimentation throughout the GS section (Table S1, Fig. S1b). Because the age model is constrained by discrete paleomagnetic tie points, some uncertainty remains in the interpolated ages between adjacent control points. Nevertheless, the paleomagnetic chronology is broadly consistent with the Plio-Quaternary age assignment of the GS strata on the regional geological map (Luo et al., 2024), providing an independent geological framework for the studied interval. Furthermore, the same paleomagnetic framework has successfully resolved significant orbital cycles in the previously published high-resolution GS record for 3.25–2.95 Ma (Luo et al., 2024), supporting the use of this chronology for orbital-scale analysis in the studied interval.
3.2 Environmental magnetic and grain-size measurements
For magnetic measurements, low-frequency and high-frequency magnetic susceptibility (χ) of the 149 samples were measured at 976 and 15 616 Hz, respectively, using the AGICO multifunction spinner Kappabridge (MFK1-FA). Frequency-dependent magnetic susceptibility (χfd) was calculated as . Isothermal remanent magnetization (IRM) was then acquired in applied fields of 1.2 and −0.3 T, respectively. Hard isothermal remanent magnetization (HIRM) was subsequently calculated as (IRM1.2 T+IRM−0.3 T)/2. Finally, the χfd HIRM (the ratio of the frequency-dependent magnetic susceptibility to the intensity of the isothermal remanent magnetization) values of the 149 samples were calculated. All magnetic measurements were carried out at the Paleomagnetism Laboratory of the China University of Geosciences, Beijing, China.
For grain-size analysis, all 149 samples were pretreated before measurement. Approximately 0.3 g of each bulk sample was first treated with 10 mL of 30 % H2O2 to remove organic matter and then with 10 mL of 10 % HCl to remove carbonates. The samples were subsequently immersed in distilled water for 12 h. After removal of the supernatant, the samples were ultrasonically dispersed in 10 mL of 10 % (NaPO3)6 solution for 10 min. Grain-size distributions were then measured using a Malvern Mastersizer 2000 laser grain-size analyzer. These measurements were conducted at the Key Laboratory of Western China's Environmental Systems, Lanzhou University.
3.3 Spectral analysis
The average temporal spacing between samples is ∼ 4 kyr for the ∼ 3.6–3.3 Ma interval and ∼ 18 kyr for the 2.95– ∼ 1.8 Ma interval. These values describe the spacing of the analyzed samples, rather than the chronological resolution or precision of the paleomagnetic age model. Because ages between adjacent paleomagnetic tie points were obtained by linear interpolation, chronological uncertainty between tie points may exceed the average sample spacing and may have a greater influence on the interpretation of the shorter 20 and 40 kyr components than on eccentricity-scale variability. Therefore, the spectral analysis was focused mainly on the densely sampled ∼ 3.6–3.3 Ma interval. For this interval, the χfd HIRM and median grain-size records were first converted from stratigraphic height to time based on the paleomagnetic age model of the GS section and then interpolated to evenly spaced 1 kyr time series. The 1 kyr interpolation was used only to regularize the time spacing of the records for spectral analysis and band-pass filtering, and does not add independent temporal information. Power spectra were calculated using the REDFIT procedure implemented in PAST 3 software, which estimates the red-noise background and tests spectral peaks against an AR(1) red-noise null model. Spectral peaks exceeding the 90 % red-noise confidence level were regarded as statistically significant. No additional detrending was applied prior to the REDFIT analysis. To test whether the main eccentricity-scale spectral result was sensitive to the interpolation procedure, we repeated the REDFIT analysis using a 2 kyr interpolation time step. The eccentricity-scale (∼ 100–125 kyr) variability remained evident in both proxy records, indicating that this feature is not an artifact of the 1 kyr interpolation (Fig. S2).
Band-pass filtering was further applied to extract the 20, 40, and 100 kyr components. The central frequencies and bandwidths used for filtering were 0.05 and 0.012 kyr−1 for the 20 kyr band, 0.024 and 0.004 kyr−1 for the 40 kyr band, and 0.01 and 0.002 kyr−1 for the 100 kyr band, respectively. The filtered GS records were then compared with the corresponding filtered insolation, eccentricity, and benthic δ18O stack.
Because the χfd HIRM and median grain-size records for 3.25–2.95 Ma have been previously published (Luo et al., 2024), the present study focuses on the newly generated data for ∼ 3.6–3.25 and 2.95– ∼ 1.8 Ma and integrates them with the published 3.25–2.95 Ma records to construct an integrated record spanning ∼ 3.6– ∼ 1.8 Ma. The combined χfd HIRM and median grain-size records are shown in Fig. 3.
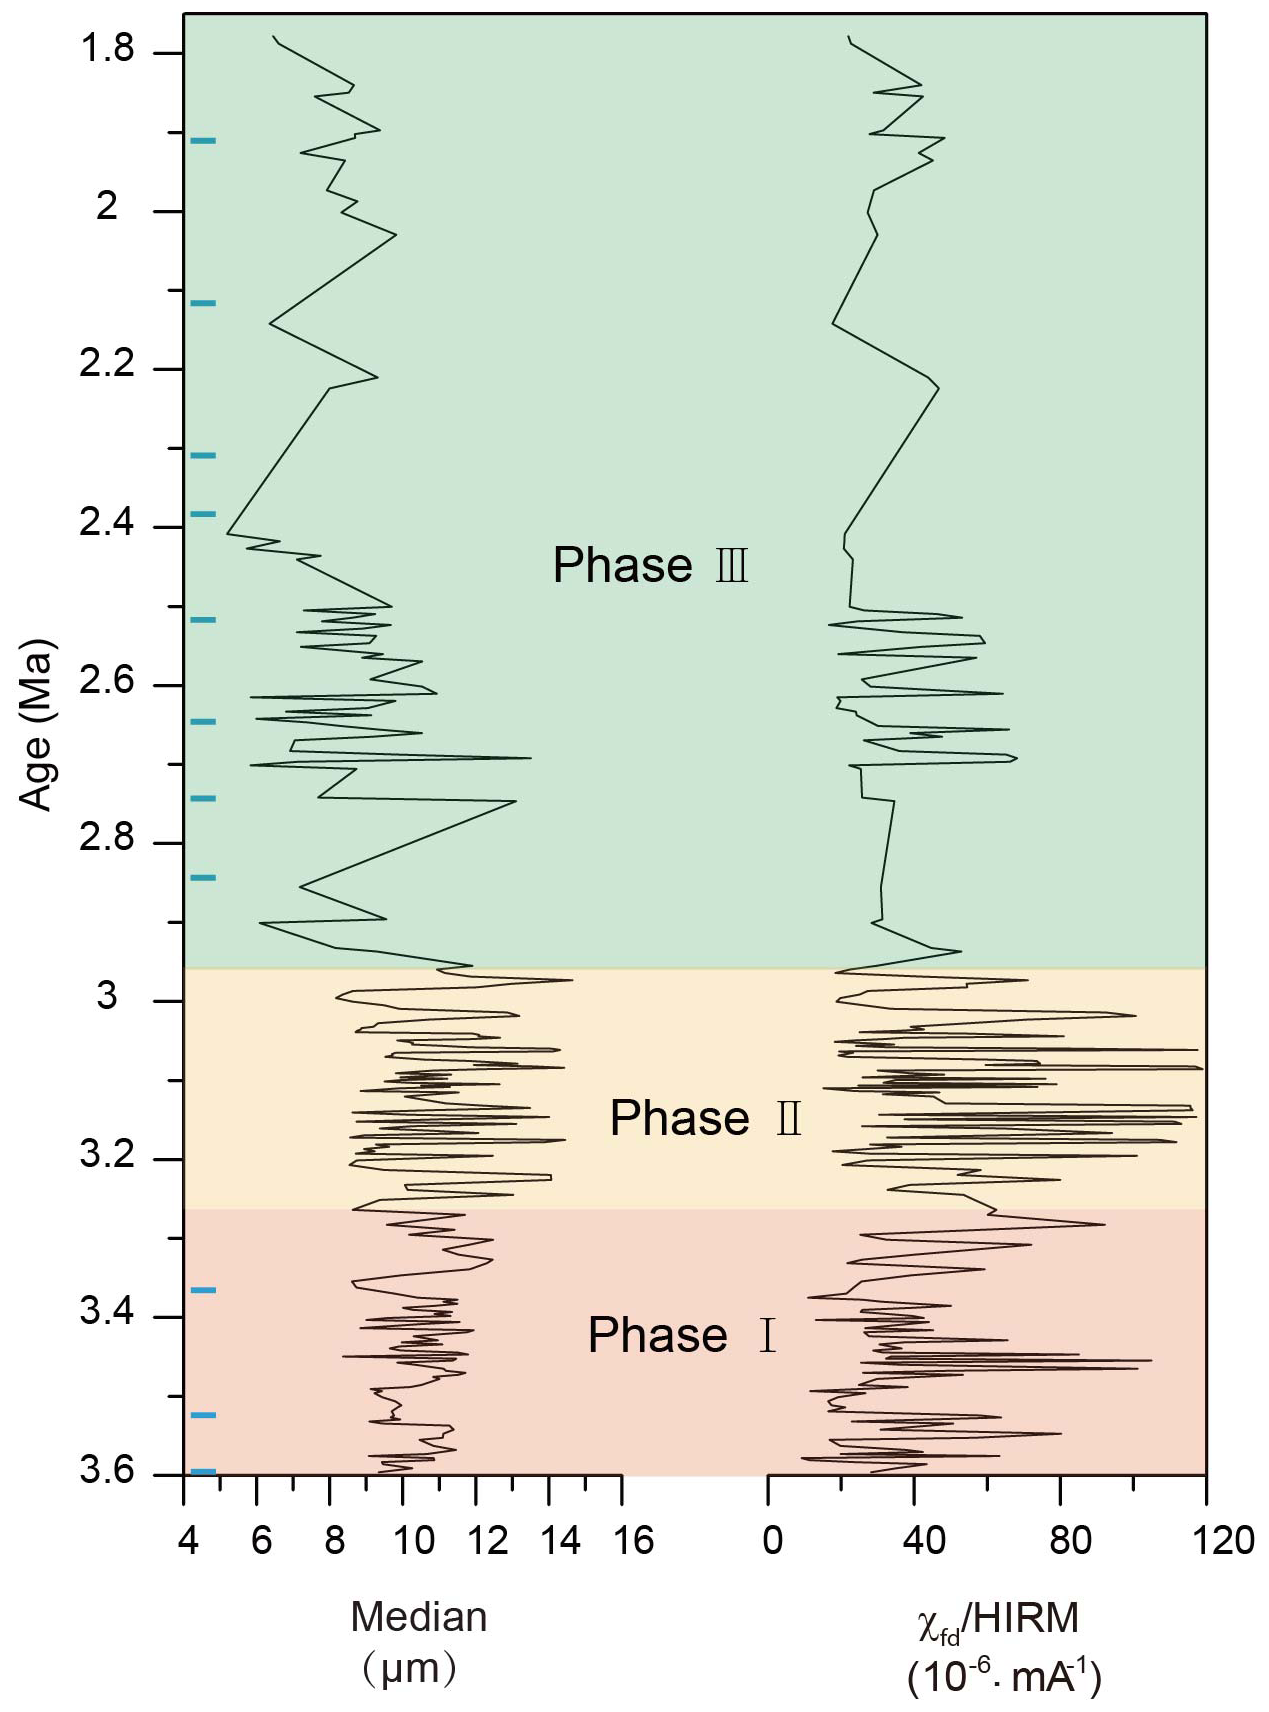
Figure 3Variation trends of the χfd HIRM and median grain-size records during ∼ 3.6–∼ 1.8 Ma. The blue rectangles represent the halite layers.
Based on lithology and the variation patterns of the χfd HIRM and median grain-size records, the paleoclimatic sequence can be divided into three phases (Fig. 3). During ∼ 3.6–3.25 Ma (0–117 m; Phase I), χfd HIRM values show large-amplitude fluctuations, ranging from 9.2 × 10⁻⁶ to 105 × 10−6 A m−1, with an average of 38.3 × 10⁻⁶ A m−1. Median grain-size values range from 8.3 to 12.4 µm, with an average of 10.48 µm. These two records display similar variation trends. In addition, the three thick halite layers observed in the stratigraphic sequence correspond well to three low-value intervals in both the χfd HIRM and median grain-size records. During 3.25–2.95 Ma (117–220 m; Phase II), the published χfd HIRM record exhibits high-frequency fluctuations, with an average of 52.6 × 10⁻⁶ A m−1. The published median grain-size record shows similar fluctuations, with an average of 11.2 µm. No thick halite layers occur in the stratigraphic sequence during this interval. During 2.95– ∼ 1.8 Ma (220–453 m; Phase III), χfd HIRM values range from 16.6 × 10⁻⁶ to 68 × 10−6 A m−1, with an average of 35 × 10−6 A m−1. Median grain-size values range from 5.2 to 13.5 µm, with an average of 8.37 µm. Lithological observations indicate that halite layers occur more frequently during 2.95– ∼ 1.8 Ma than during ∼ 3.6–3.25 Ma.
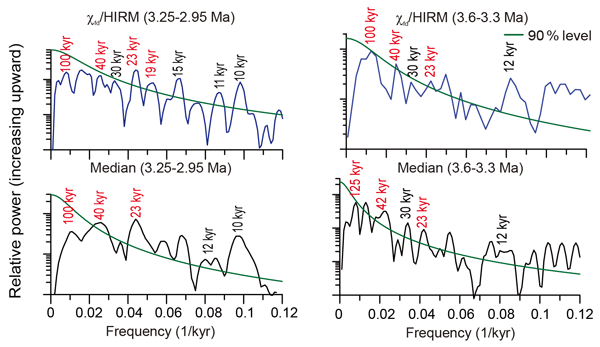
Spectral analysis shows that the strongest peak in the χfd HIRM record occurs at ∼ 100 kyr, whereas the strongest peak in the median grain-size record occurs closer to ∼ 125 kyr (Fig. 4). These results indicate prominent eccentricity-scale (∼ 100–125 kyr) variability during ∼ 3.6–3.3 Ma, accompanied by weaker ∼ 40 and ∼ 23 kyr components. In addition, several periodicities, including ∼ 30 kyr and semiprecessional (∼ 12 kyr) components, are also present and may reflect beats or harmonics of primary orbital cycles (Fig. 4). A sensitivity test based on a 2 kyr interpolation time step yielded similar eccentricity-scale spectral peaks in both proxy records, further supporting that the main eccentricity-scale variability is not caused by the 1 kyr interpolation procedure (Fig. S2).
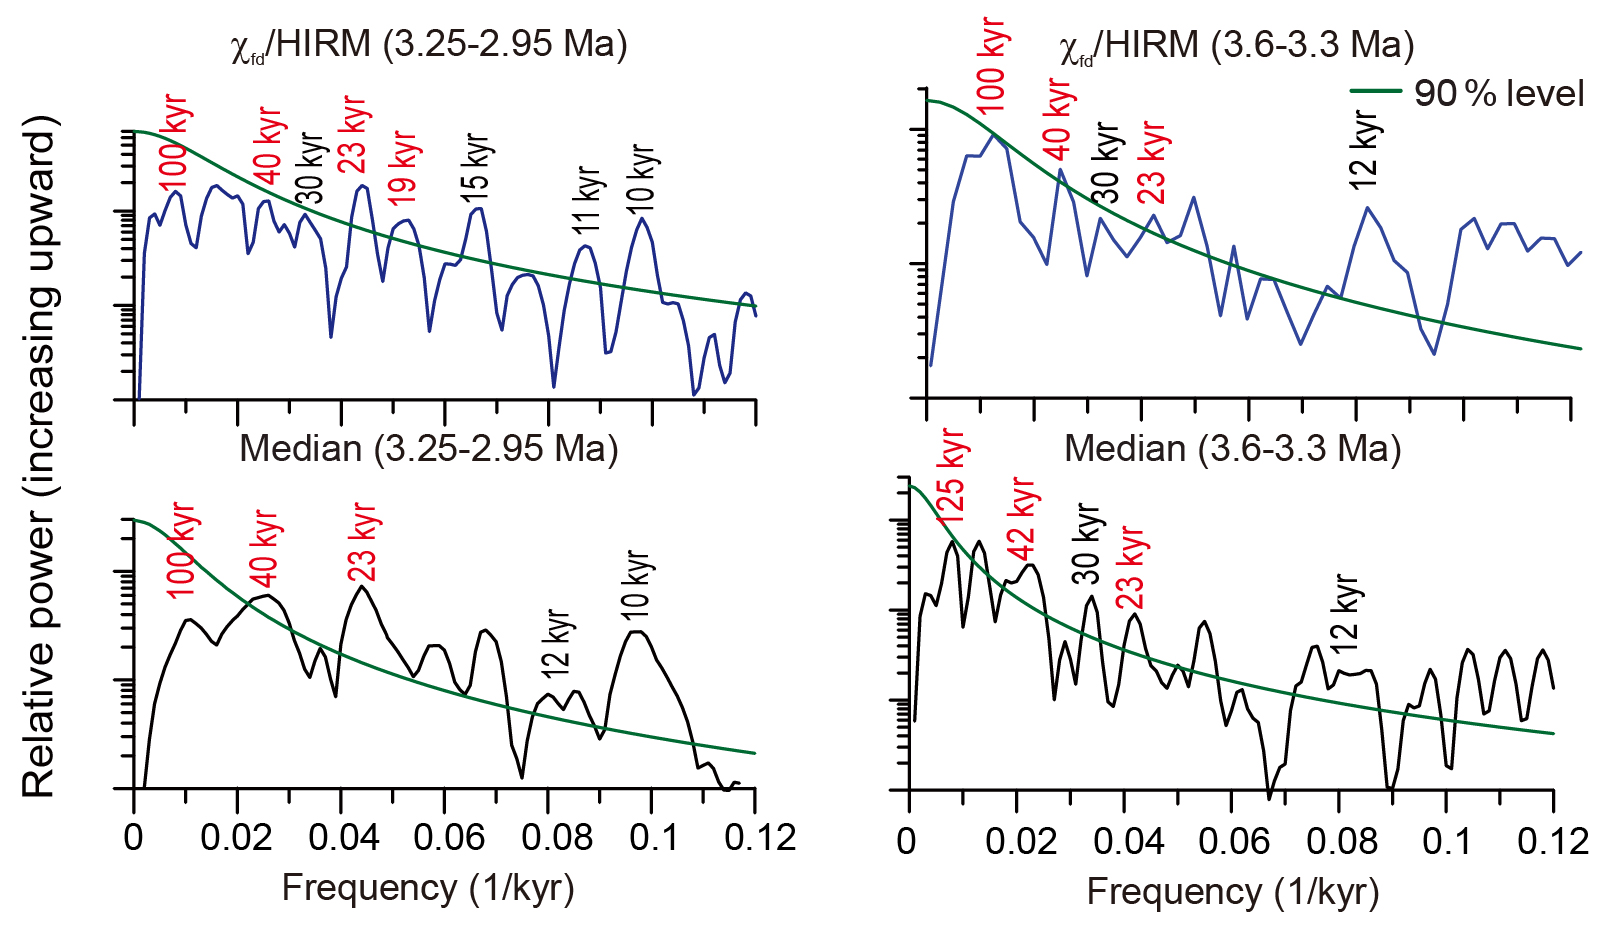
Figure 4Results of spectral analyses of the reconstructed χfd HIRM and median grain-size records during ∼ 3.6–3.3 Ma and the published χfd HIRM and median grain-size records during 3.25–2.95 Ma. Spectral analysis was performed on the interpolated 1 kyr time series using the REDFIT procedure in PAST 3 software. The spectral analysis for ∼ 3.6–3.3 Ma is based on the newly generated records, whereas those for 3.25–2.95 Ma are from Luo et al. (2024). The red-noise background and the 90 % red-noise confidence level are shown, and spectral peaks above the 90 % confidence level are considered significant.
The eccentricity-scale (∼ 100–125 kyr) variability in the χfd HIRM and median grain-size records during ∼ 3.6–3.3 Ma differs from the previously reported precession-dominated pattern during 3.25–2.95 Ma (Fig. 4). Comparison with eccentricity (Laskar et al., 2004) shows that high-eccentricity intervals broadly correspond to peak intervals in both records between ∼ 3.6 and 3.3 Ma (Fig. 5), consistent with an eccentricity-scale signal during this interval. This interpretation is further supported by broadly similar filtered variations between eccentricity and both records in the eccentricity band (Fig. 6a, e). In contrast, most high-insolation intervals shown by the June insolation gradient (30° N to 30° S) do not correspond to peak values in either record between ∼ 3.6 and 3.3 Ma (Fig. 5), unlike the relationship observed during 3.25–2.95 Ma (Luo et al., 2024). This mismatch, together with the weak 20 kyr signal (Fig. 6d, h), suggests that insolation did not directly force GS paleoclimatic variations during ∼ 3.6–3.3 Ma. In addition, five high-value intervals in the χfd HIRM and median grain-size records broadly correspond to those in the benthic δ18O stack (Lisiecki and Raymo, 2005), similar to the relationship observed during 3.25–2.95 Ma (Fig. 5). Both records also show similar filtered variations to the benthic δ18O stack at the 40 kyr band (Fig. 6b, f), but do not show a clear correspondence with insolation at the same band (Fig. 6c, g), suggesting that the 40 kyr signal in the GS χfd HIRM and median grain-size records was more closely linked to high-latitude ice-volume variability than to insolation forcing.
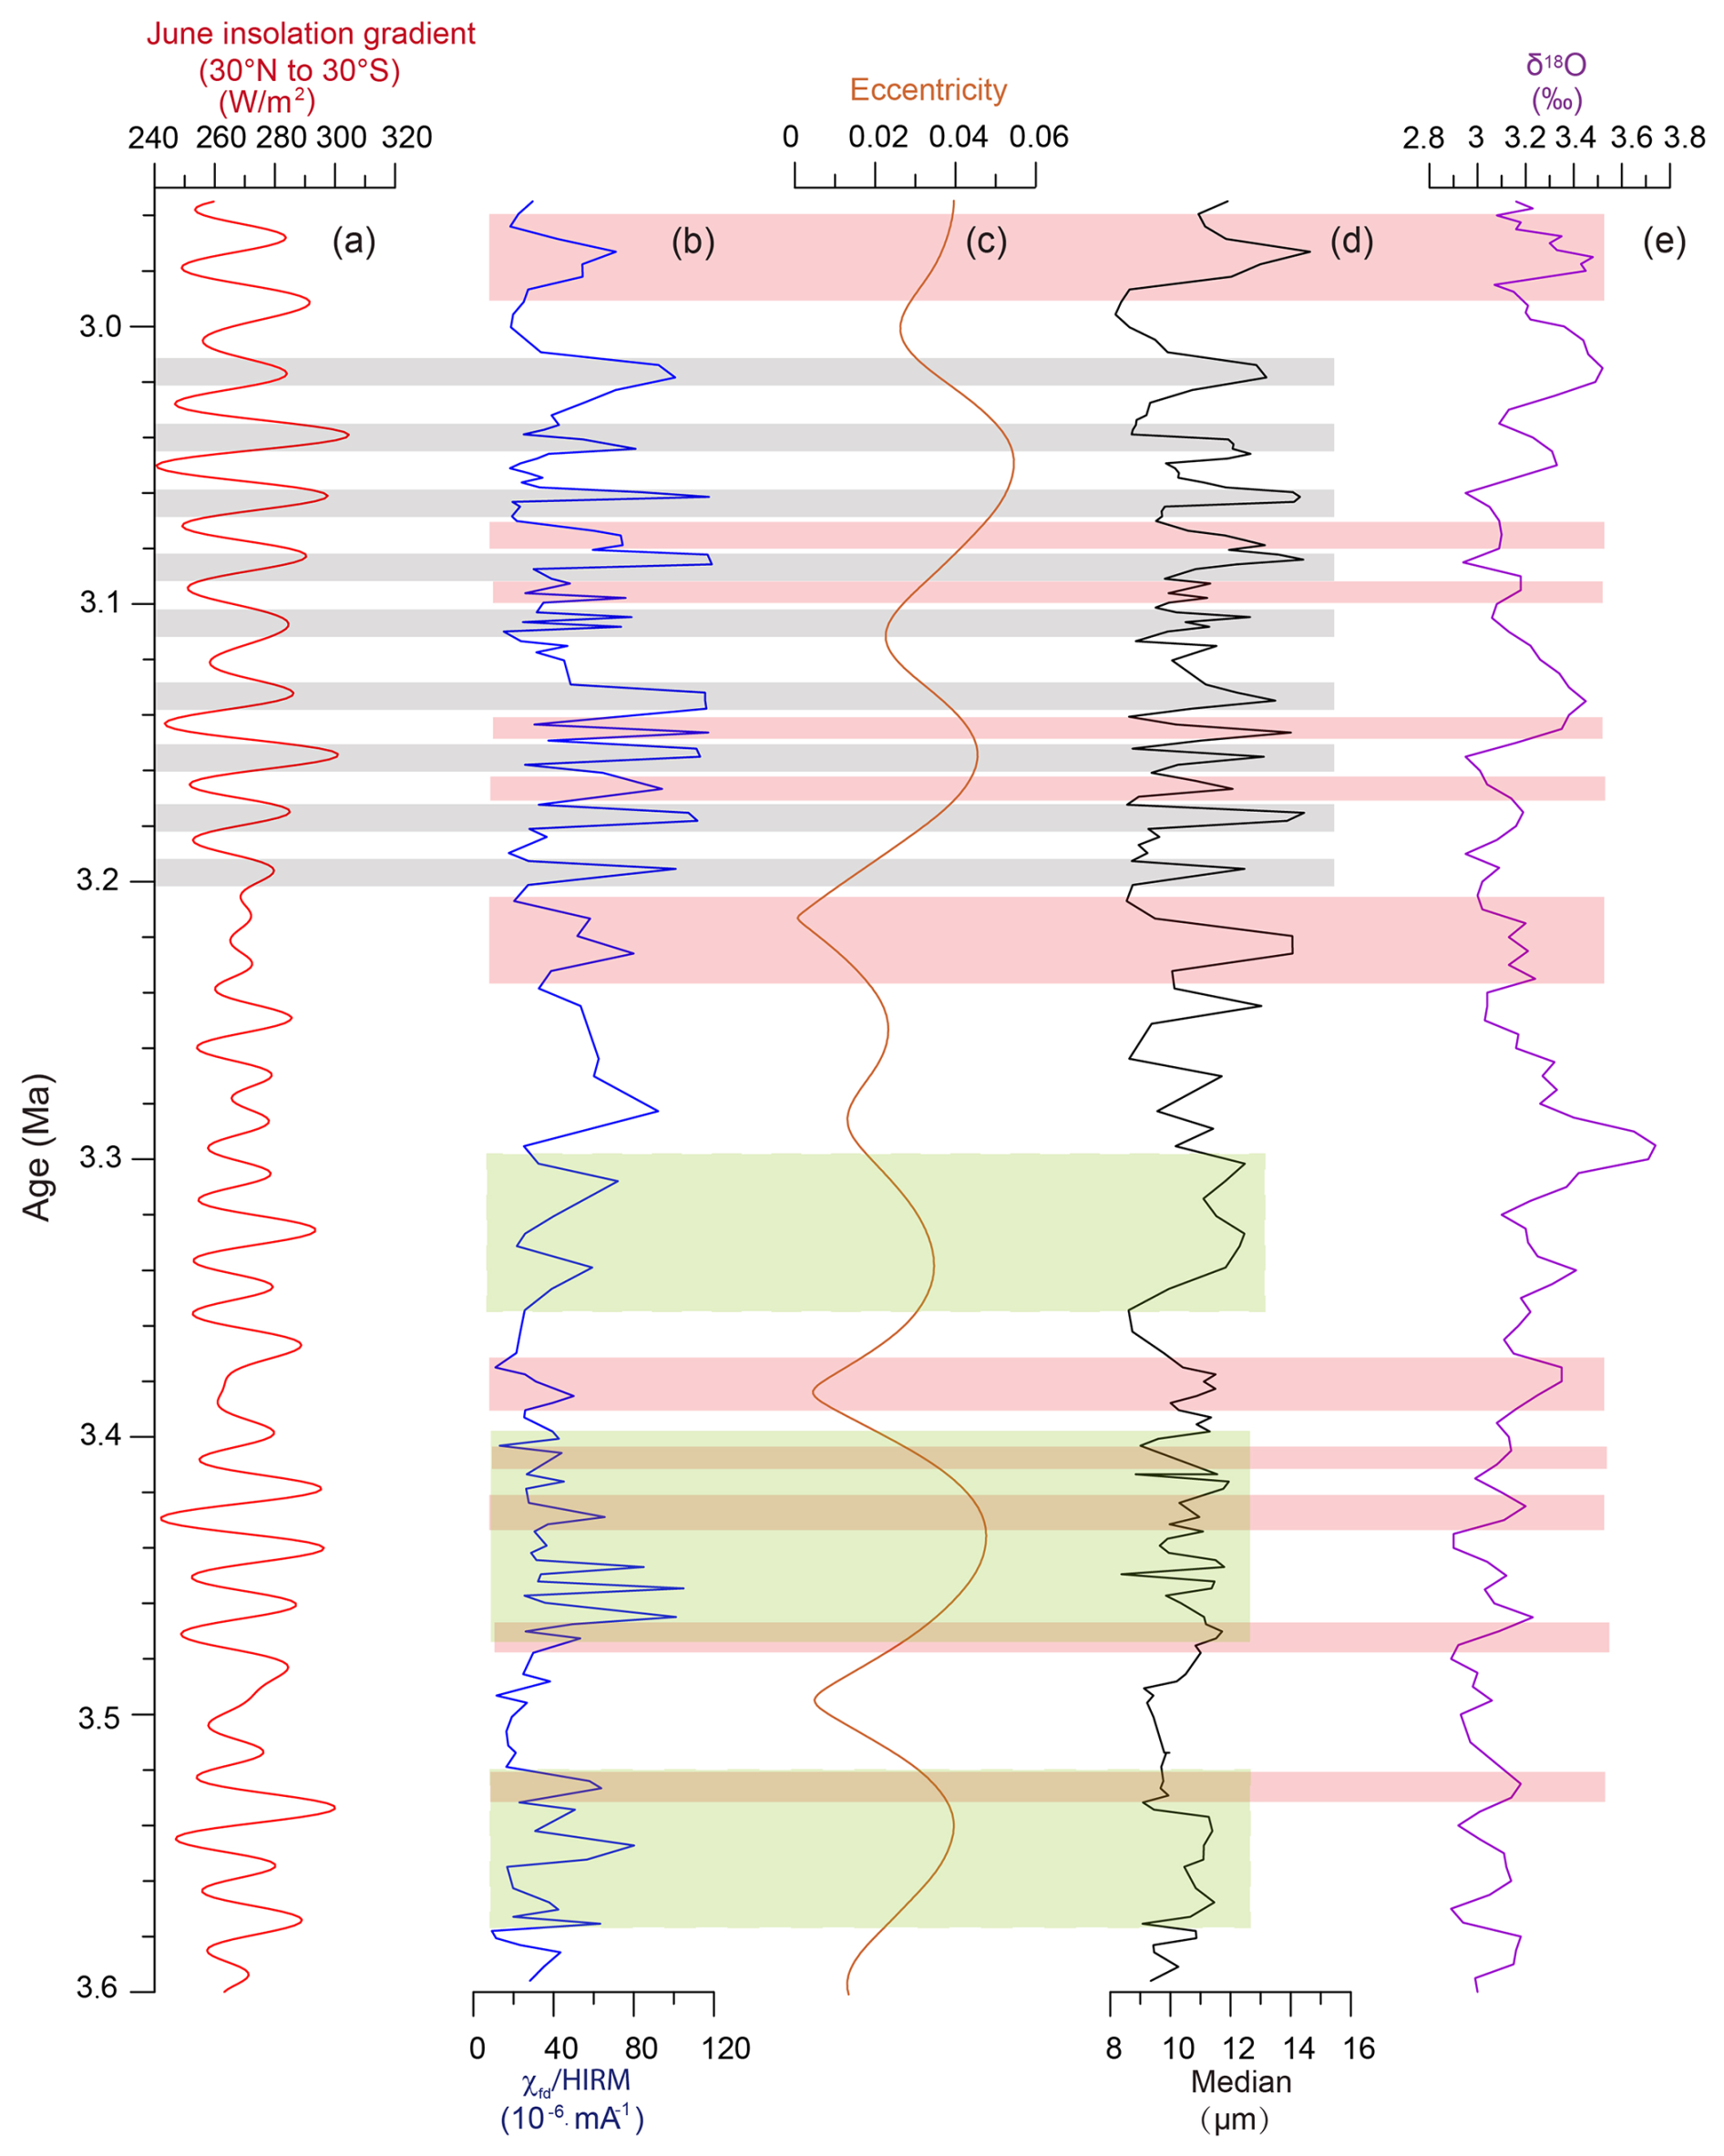
Figure 5Comparison of the GS χfd HIRM and median grain-size records with insolation, eccentricity and benthic δ18O stack during ∼ 3.6–2.95 Ma. (a) June insolation gradient (Laskar et al., 2004). (b) GS χfd HIRM. (c) GS median grain-size. (d) Eccentricity (Laskar et al., 2004). (e) Benthic δ18O stack (Lisiecki and Raymo, 2005). The χfd HIRM and median grain-size data during 3.25–2.95 Ma have been published by Luo et al. (2024). The green, gray and pink bands emphasize the potential corresponding relationships between χfd HIRM, median grain-size, benthic δ18O stack, eccentricity and insolation.
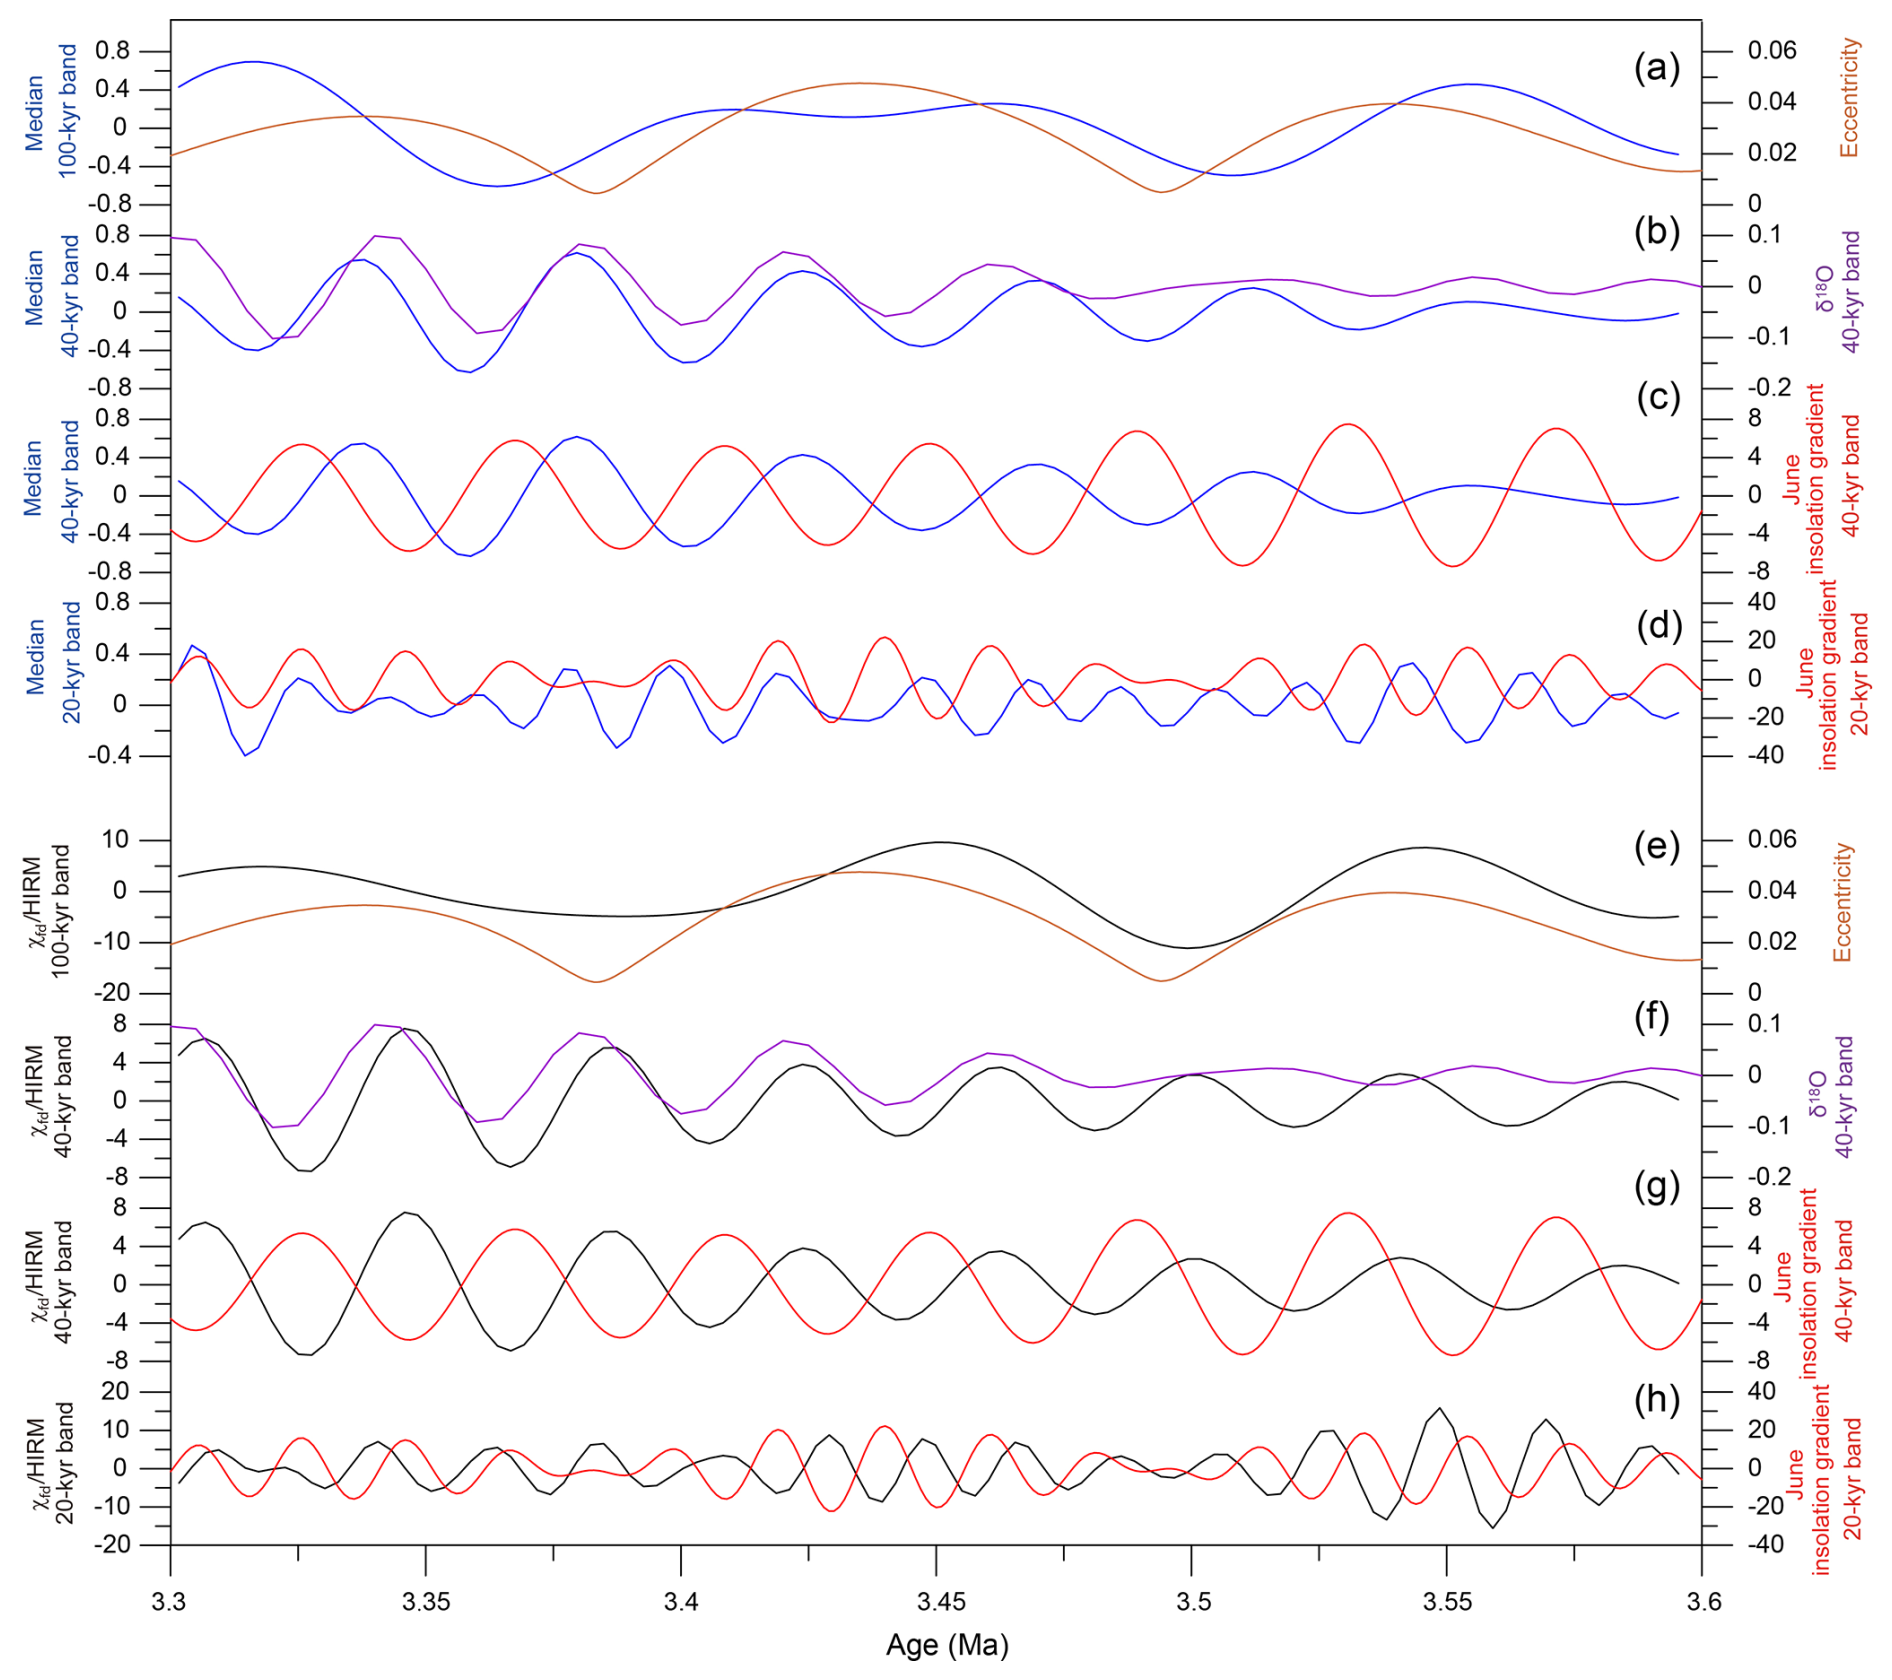
Figure 6Comparison of the filtered χfd HIRM and median grain-size records from the GS section with the eccentricity, the filtered June insolation gradient and the filtered benthic δ18O stack during ∼ 3.6–3.3 Ma. (a, e) χfd HIRM and median grain-size records at the 100 kyr band with eccentricity. (b, f) χfd HIRM, median grain-size and benthic δ18O stack at the filtered 40 kyr band. (c, g) χfd HIRM, median grain-size and June insolation gradient at the filtered 40 kyr band. (d, h) χfd HIRM, median grain-size and June insolation gradient at the filtered 20 kyr band. The 20 kyr central frequency = 0.05 kyr−1, and the bandwidth = 0.012 kyr−1. The 40 kyr central frequency = 0.024 kyr−1, and the bandwidth = 0.004 kyr−1. The 100 kyr central frequency = 0.01 kyr−1, and the bandwidth = 0.002 kyr−1.
5.1 Late Pliocene-Early Pleistocene precipitation variations in the western Qaidam Basin
The χfd HIRM proxy has been shown to be sensitive to precipitation variations in arid to semiarid environments because χfd reflects pedogenic nanometer-scale ferrimagnetic grains, whereas HIRM mainly reflects hematite formed under relatively dry conditions (Nie et al., 2017; Luo et al., 2024). Therefore, their ratio records the relative balance between wetter and drier weathering conditions. However, to interpret χfd HIRM as a precipitation proxy in the GS section, potential non-climatic influences, including post-depositional dissolution, evaporite dilution, and changes in sediment source, need to be considered. First, thermal demagnetization results reported by Luo et al. (2024) for the GS section indicate the preservation of magnetite-bearing remanence carriers, suggesting that pervasive post-depositional reductive dissolution was unlikely to have dominated the magnetic signal. Previous studies from Qaidam fluvial-lacustrine sediments further support the applicability of χfd HIRM as a precipitation proxy in settings where magnetic minerals were not significantly dissolved after deposition (Nie et al., 2017; Su et al., 2019; Ren et al., 2020). Second, although evaporite-bearing lithologies occur in the section, the χfd HIRM variations are difficult to explain by simple evaporite dilution alone, given their broad consistency with the median grain-size record (Fig. 5). Third, the GS section is dominated mainly by fine-grained lacustrine deposits with relatively uniform lithology, suggesting that major changes in sediment provenance were unlikely to be the primary driver of the observed χfd HIRM variations. These considerations support the use of χfd HIRM as a precipitation-sensitive proxy in the GS section, although minor sedimentological or post-depositional influences, including selective alteration of fine magnetic particles, evaporite dilution, and small provenance changes, cannot be entirely excluded. Median grain size can also serve as an indirect precipitation proxy because the grain size of fluvial, deltaic or nearshore lacustrine sediments is closely related to hydrodynamic conditions, which, in turn, are strongly influenced by runoff and precipitation. In the Qaidam Basin, coarser particles in closed and shallow lacustrine settings generally reflect stronger hydrodynamic conditions associated with increased runoff and precipitation (Su et al., 2019; Yang et al., 2020; Luo et al., 2024). We therefore interpret χfd HIRM and median grain size primarily as proxies for precipitation variations in the GS section.
The deposition of halite is generally associated with intensified aridity in arid regions (Song et al., 2013; Zhang et al., 2013; Gu et al., 2015; Luo et al., 2018). Therefore, the absence of halite layers likely reflects relatively wetter conditions during 3.25–2.95 Ma. This interpretation is consistent with paleoclimatic records from the HTG section in the western Qaidam Basin, which also indicate climatic wetting during the mPWP (Su et al., 2024). The χfd HIRM and median grain-size records reported here, together with the previously published GS records (Luo et al., 2024), further show that precipitation during 3.25–2.95 Ma was higher than during ∼ 3.6–3.25 and 2.95– ∼ 1.8 Ma. These observations suggest that the relatively wet climate recorded in the GS section during the mPWP was likely associated with enhanced precipitation under a strengthened EASM. Previously published records from the GS section further indicate that precipitation variations there were significantly influenced by the intensified EASM during the mPWP (Luo et al., 2024). A possible mechanism for this monsoon intensification is the intensification and westward extension of the western Pacific subtropical high (Huang et al., 2019). Climate model simulations suggest that enhanced land-sea thermal contrast between the East Asian continent and the equatorial western Pacific during the mPWP may have promoted the intensification and westward expansion of the western Pacific subtropical high, thereby enhancing the EASM (Huang et al., 2019). This inference may further imply that, under continued global warming, the Qaidam Basin could receive increased summer moisture, potentially associated with a westward extension of the western Pacific subtropical high that favors a northwestward shift in EASM precipitation.
The precipitation variations in the GS section during ∼ 3.6–2.95 Ma are similar to those recorded in the Chinese Loess Plateau and the SG-1b core from the western Qaidam Basin, both of which were influenced by the EASM (Fig. 7). This similarity suggests that EASM-related summer moisture likely also reached the GS section, at least during ∼ 3.6–3.25 Ma. From 2.95– ∼ 1.8 Ma, however, the relatively large temporal spacing between samples precludes identification of clear temporal trends in the precipitation records (Fig. 3) and prevents detailed comparison with precipitation records from the monsoon region. Nevertheless, the more frequent occurrence of halite layers suggests intensified aridification during this interval (Fig. 3). Other paleoclimatic records from the western Qaidam Basin support this interpretation. Pollen records from the SG-3 core suggest that the Qaidam Basin was a drier environment no later than ∼ 3 Ma (Miao et al., 2013), and oxygen isotope records from the HTG section indicate a generally drier climate in the basin since 2.9 Ma (Su et al., 2024). Overall, this evidence suggests enhanced aridification in the western Qaidam Basin following the Late Pliocene warmth.
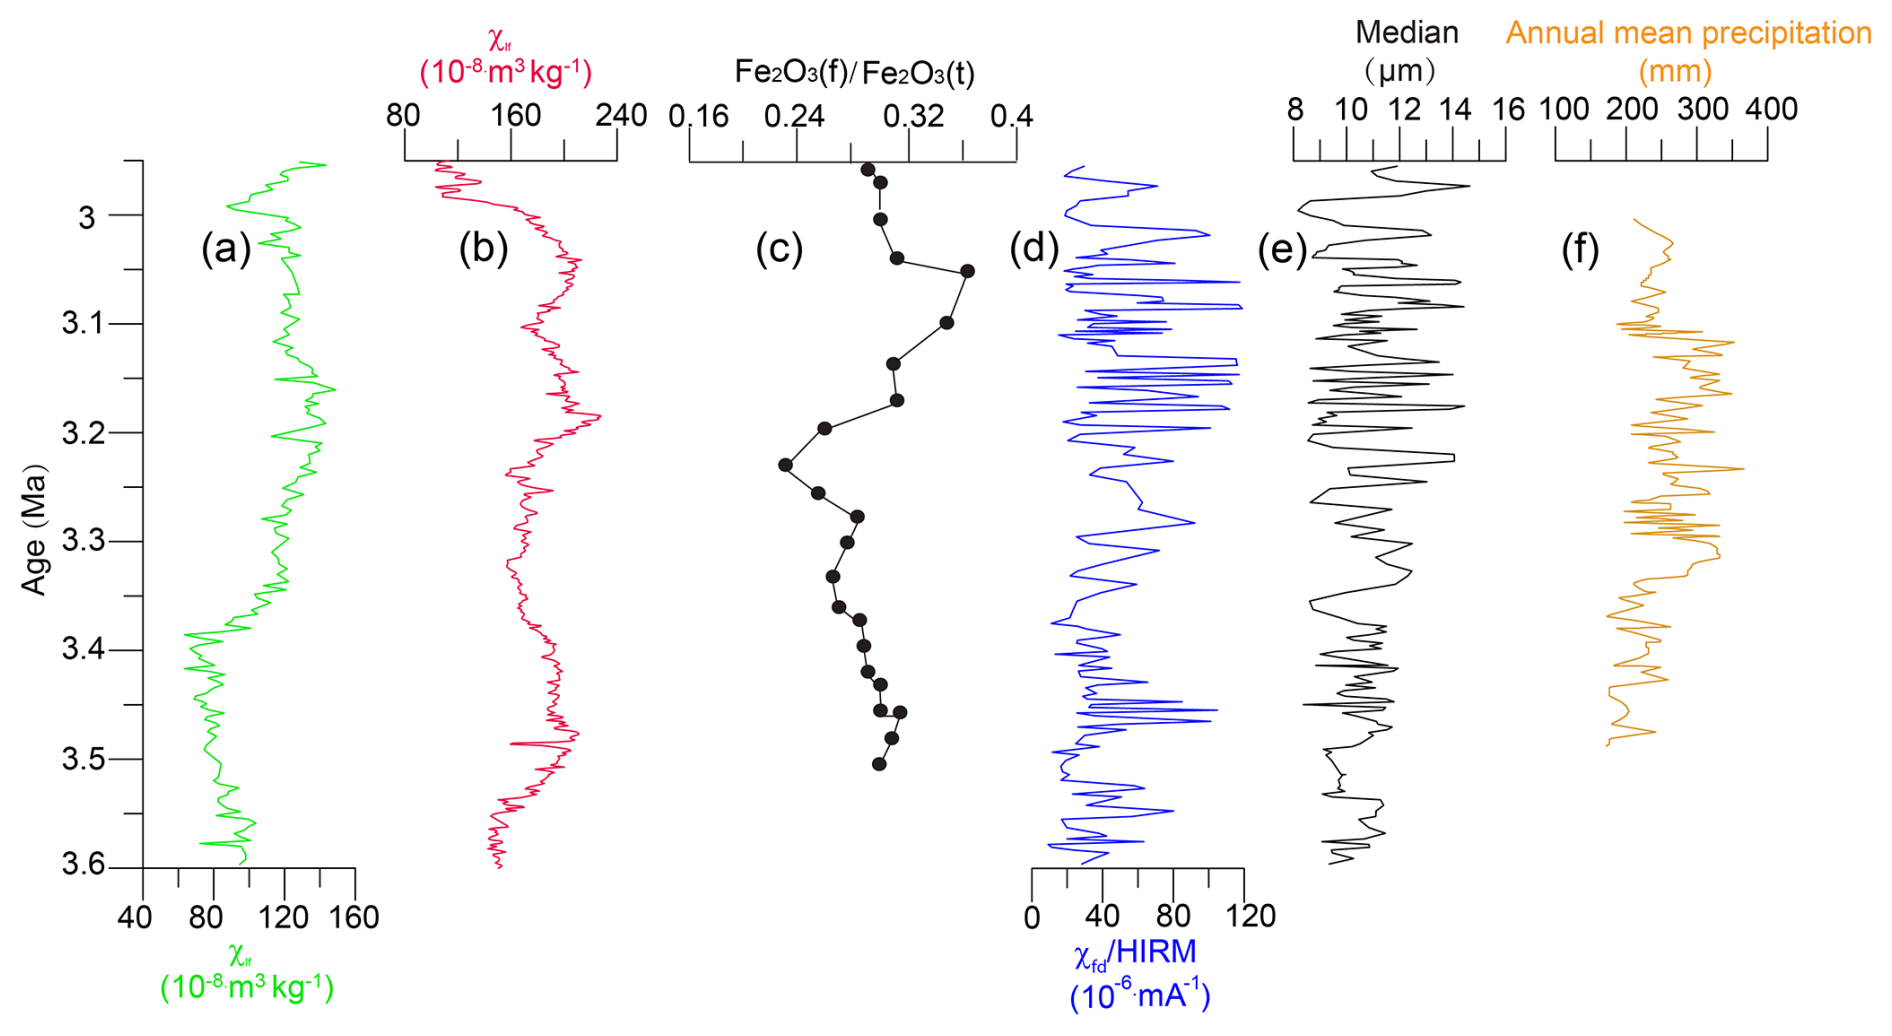
Figure 7Comparison of the GS χfd HIRM and median grain-size records with the paleoclimatic records affected by the EASM precipitation during ∼ 3.6–2.95 Ma. (a) Magnetic susceptibility at low frequency (χlf) from the Chaona section (Song et al., 2001). (b) Magnetic susceptibility at low frequency (χlf) from the Shilou section (Ao et al., 2016). (c) The ratio of free iron (Fe2O3(f)) to total iron (Fe2O3(t)) content of the Pianguan section (Yang et al., 2018). (d) GS χfd HIRM. (e) GS median grain-size. (f) Annual mean precipitation variations based on the pollen records from the SG-1b core (Schwarz et al., 2022).
5.2 Nonlinear response of precipitation to insolation forcing during ∼ 3.6–3.3 Ma
The published GS records show that precipitation in the western Qaidam Basin was dominated by the 20 kyr precessional cycles during the mPWP, and suggest that the June insolation gradient (30° N minus 30° S) directly forced precipitation variations in the Qaidam Basin during this interval (Luo et al., 2024). In contrast, the reconstructed GS records indicate prominent eccentricity-scale (∼ 100–125 kyr) variability during ∼ 3.6–3.3 Ma. Although the ∼ 3.6–3.3 Ma interval spans only ∼ 0.3 Myr and therefore contains only about three eccentricity-scale cycles (Fig. 5), both χfd HIRM and median grain-size records show their strongest spectral power in the eccentricity band, with the χfd HIRM peak at ∼ 100 kyr and the median grain-size peak closer to ∼ 125 kyr (Fig. 4). This interpretation is further supported by the similar long-term variations in the two precipitation records and by the broadly similar patterns of their filtered eccentricity-scale components (Figs. 3 and 6).
It is widely believed that the insolation variations associated with the eccentricity signal of the Earth are much weaker than those associated with the precession and obliquity signals, although eccentricity can affect the insolation variations through the modulation of precession (Luo et al., 2018; Wang et al., 2023). Therefore, the eccentricity-scale variability during ∼ 3.6–3.3 Ma may reflect a nonlinear response of precipitation to insolation forcing. This interpretation is in line with the magnetic susceptibility records from the YZ01 borehole in the Xinding Basin, Shanxi Graben, North China, revealing that precipitation was dominated by the 100 kyr eccentricity cycles before 3.3 Ma, and constituted a nonlinear response to insolation (Wang et al., 2023). Moreover, a similar nonlinear response to insolation was found in the records from the Huangdigou section in the Sanmenxia Basin, North China (Zhang et al., 2022). In the western Qaidam Basin, the pollen records from the SG-1b core reveal that there was a strong link between the 100 kyr cycles in the precipitation records and the eccentricity forcing during 3.5–3.0 Ma (Schwarz et al., 2022).
Interestingly, precipitation was stronger during intervals dominated by a 20 kyr precessional signal, whereas it was relatively weaker during intervals characterized mainly by eccentricity-scale variability. However, this contrast does not simply reflect differences in precipitation intensity itself. Rather, it suggests that the dominant processes controlling the westward penetration of summer moisture into the western Qaidam Basin varied under different climatic background states. During the wetter interval of 3.25–2.95 Ma, summer moisture associated with the EASM could penetrate farther inland, allowing precipitation to respond more directly to insolation forcing. By contrast, during ∼ 3.6–3.3 Ma, when precipitation was weaker, the eccentricity-scale variability suggests that summer moisture delivery was influenced more indirectly by changes in large-scale boundary conditions. This indirect control may reflect several plausible mechanisms through which eccentricity-scale forcing influenced precipitation in the GS section during ∼ 3.6–3.3 Ma. One possible explanation is that eccentricity-scale forcing may have modulated high-latitude ice-volume variability, including Antarctic ice-sheet variability, in a nonlinear way, and that these changes may in turn have influenced EASM intensity through changes in the thermal contrast between Eurasia and the surrounding oceans and/or through changes in Pacific and Atlantic meridional overturning circulation (Zhang et al., 2022; Wang et al., 2023). Because the Arctic ice sheets did not develop on a large scale before ∼ 2.7 Ma (Brigham-Grette et al., 2013; Rahaman et al., 2020; Bridges et al., 2023), Antarctic ice-sheet variability was likely an important component of high-latitude ice-volume changes during the Late Pliocene. Thus, in the eccentricity band, the broadly similar variations between the two GS precipitation records, eccentricity, and the benthic δ18O stack are consistent with the hypothesis that eccentricity-paced high-latitude ice-volume variability, potentially involving Antarctic ice-sheet changes, contributed to the observed eccentricity-scale signal in the GS section (Fig. 8). Another possibility is that the eccentricity-scale variability in the precipitation records could have been linked to annual insolation instead of summer insolation. Because the annual insolation integrates seasonal insolation variations caused by precession, it has stronger power in the eccentricity band and weaker power in the precession band (Laskar et al., 2004). However, more investigations are needed to validate this hypothesis.
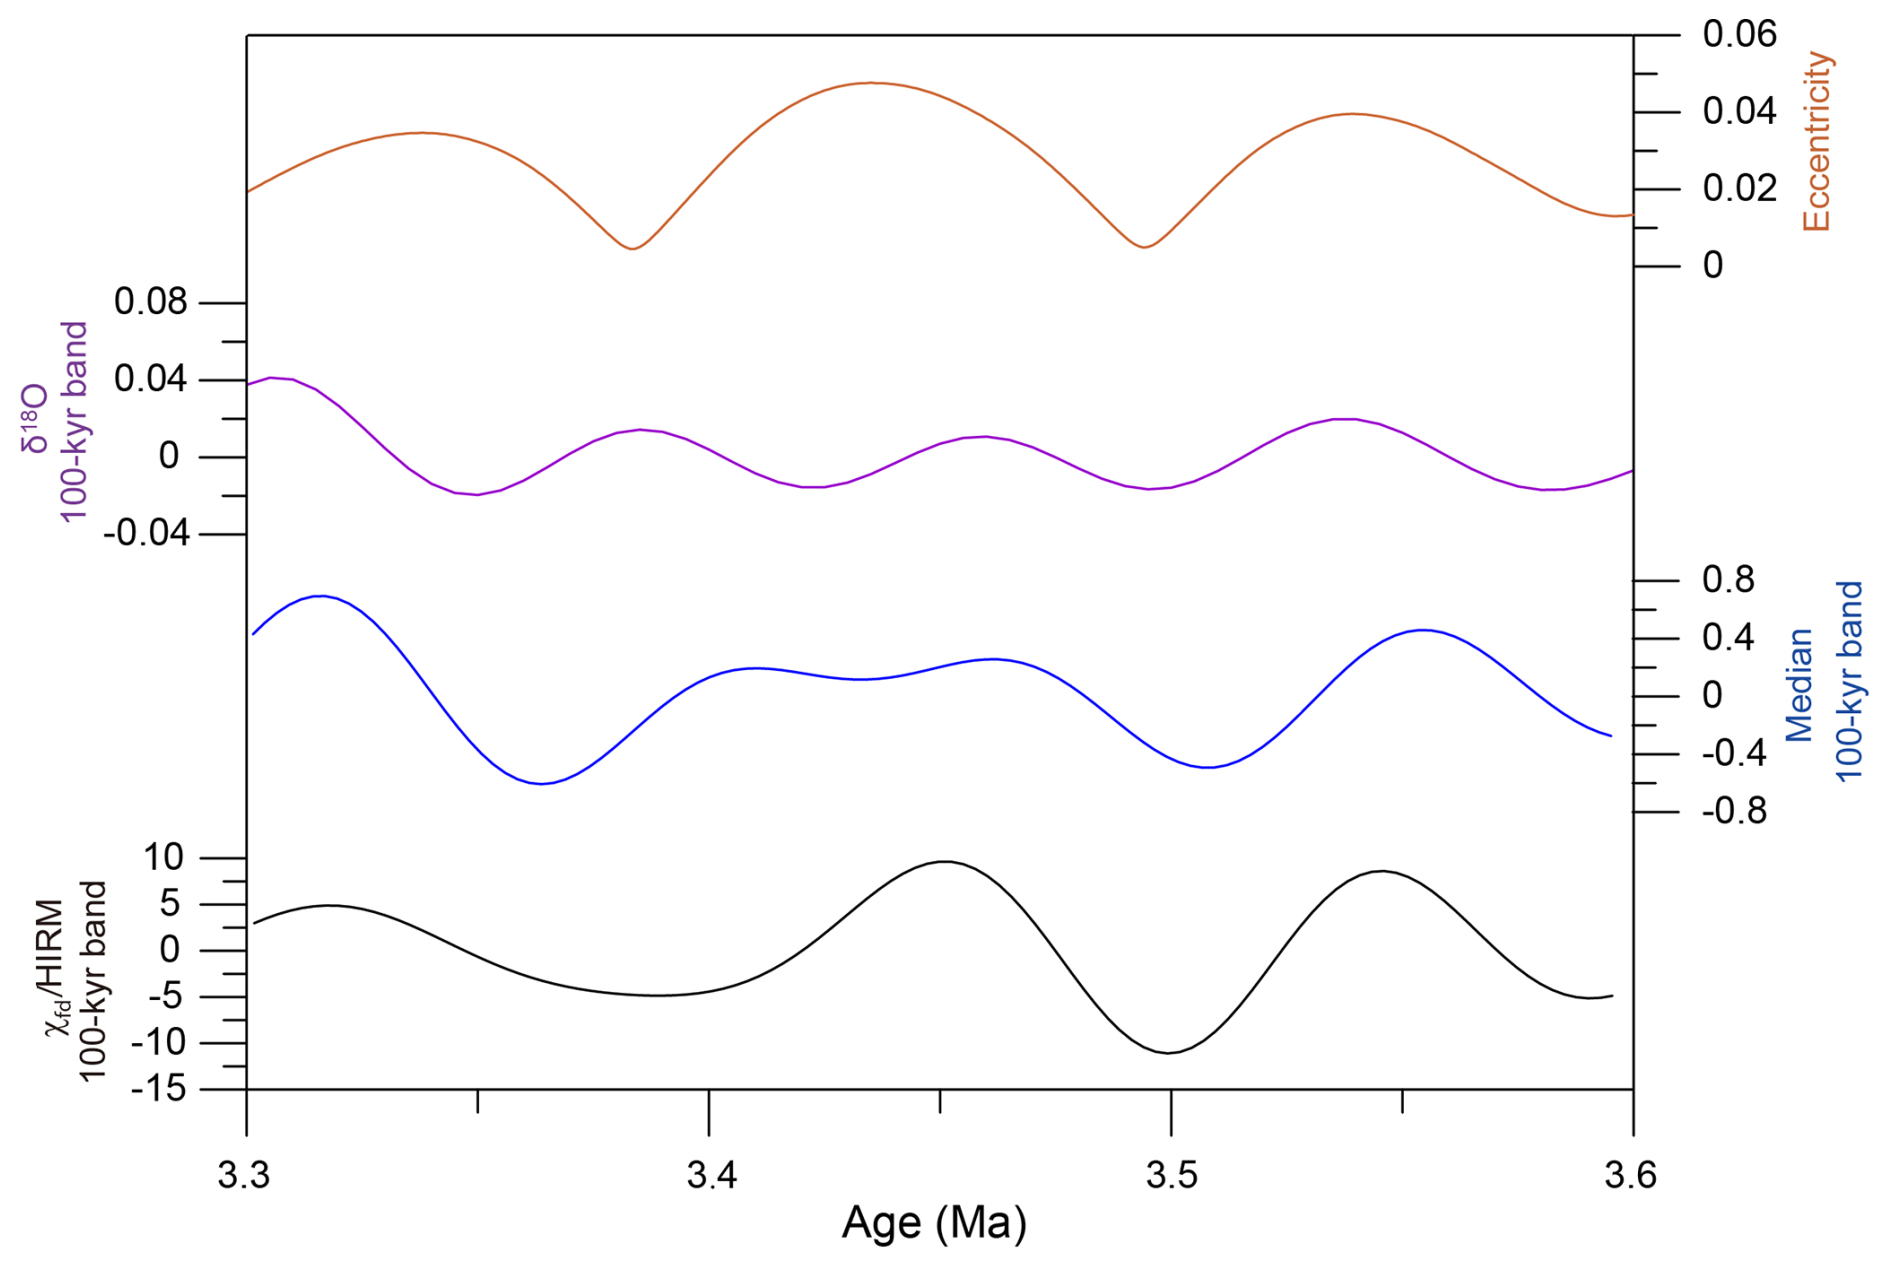
Figure 8Comparison of the χfd HIRM and median grain-size records with the eccentricity and benthic δ18O stack data. The χfd HIRM, median grain-size and benthic δ18O stack data were filtered at the 100 kyr band.
Additionally, at the 40 kyr band, our precipitation records show similar filtered variations to the benthic δ18O stack, suggesting that high-latitude ice-volume variability, potentially including Antarctic ice-sheet variability, may have contributed to precipitation changes in the Qaidam Basin during ∼ 3.6–3.3 Ma. This inference is consistent with the published GS precipitation records for 3.25–2.95 Ma (Luo et al., 2024). Together, these results suggest that high-latitude ice-volume variability, potentially including Antarctic ice-sheet variability, may have acted as an important background modulator of precipitation in the Qaidam Basin during the Late Pliocene.
Integrated χfd HIRM and median grain-size records from the GS section provide an extended reconstruction of precipitation variability in the western Qaidam Basin during ∼ 3.6– ∼ 1.8 Ma. The combined record shows that precipitation during 3.25–2.95 Ma was higher than during ∼ 3.6–3.25 and 2.95– ∼ 1.8 Ma, supporting the interpretation of relatively wetter conditions in the western Qaidam Basin during the mPWP. Comparison with previously published regional precipitation records further suggests that EASM-related summer moisture continued to reach the western Qaidam Basin during ∼ 3.6–3.25 Ma, although the associated precipitation was weaker than that during 3.25–2.95 Ma.
At the orbital timescale, precipitation variations during ∼ 3.6–3.3 Ma were characterized mainly by eccentricity-scale (∼ 100–125 kyr) variability, in contrast to the previously reported precession-dominated pattern during 3.25–2.95 Ma. This shift indicates that the precession-dominated pattern was not persistent throughout the Late Pliocene in the western Qaidam Basin. Instead, the dominant periodicity of precipitation changed through time, implying that the processes controlling the westward penetration of summer moisture into the basin varied under different climatic background states. In particular, the stronger 20 kyr signal during 3.25–2.95 Ma likely reflects a more direct response of precipitation to precessional insolation forcing under wetter conditions, whereas the eccentricity-scale (∼ 100–125 kyr) variability during ∼ 3.6–3.3 Ma suggests a more indirect forcing response under relatively drier conditions. In addition, the broad correspondence between the precipitation proxies and the benthic δ18O stack at the 40 kyr band suggests that high-latitude ice-volume variability, potentially including Antarctic ice-sheet variability, may also have modulated precipitation variations in the basin. Overall, these findings highlight that Late Pliocene precipitation variations in the western Qaidam Basin were shaped not only by changes in moisture availability, but also by shifts in the dominant climatic processes governing inland penetration of EASM-related summer moisture.
The data underlying this study are provided in the Supplement. These include the GS magnetic-parameter and median grain-size records, paleomagnetic age-control points and sedimentation-rate calculations.
The supplement related to this article is available online at https://doi.org/10.5194/cp-22-1913-2026-supplement.
All authors approved the manuscript and agreed on its submission. ZL: writing-original draft, methodology, conceptualization, formal analysis, data collection, funding acquisition, investigation, resources. HW: Writing-review and editing, investigation, data collection. XY: Writing-review and editing, investigation. ZZ, ZS, JY and WC: investigation, sample processing. QS: investigation, sample processing, funding acquisition. YL and SH: investigation.
The contact author has declared that none of the authors has any competing interests.
Publisher's note: Copernicus Publications remains neutral with regard to jurisdictional claims made in the text, published maps, institutional affiliations, or any other geographical representation in this paper. The authors bear the ultimate responsibility for providing appropriate place names. Views expressed in the text are those of the authors and do not necessarily reflect the views of the publisher.
This research has been supported by the National Natural Science Foundation of China (grant nos. 42202215, 42302213 and 42401004); the Key Foundation of the Education Department of Hunan Province (grant nos. 21A0424, 24C0341); the PhD Research Startup Foundation of Hunan University of Arts and Science (grant nos. 23BSQD05, 24BSQD79, 25BSQD58); the Fund of Geography Subject (grant no.[2022]351); the Open Foundation of MOE Key Laboratory of Western China’s Environmental System, Lanzhou University; and the Fundamental Research Funds for the Central Universities (grant no. lzujbky-2021-kb01).
This paper was edited by Asfawossen Asrat and reviewed by Rui Zhang and one anonymous referee.
Ao, H., Roberts, A. P., Dekkers, M. J., Liu, X., Rohling, E. J., Shi, Z., An, Z., and Zhao, X.: Late Miocene-Pliocene Asian monsoon intensification linked to Antarctic ice-sheet growth, Earth Planet. Sci. Lett., 444, 75–87, https://doi.org/10.1016/j.epsl.2016.03.028, 2016.
Badger, M. P. S., Schmidt, D. N., Mackensen, A., and Pancost, R. D.: High resolution alkenone palaeobarometry indicates relatively stable pCO2 during the Pliocene (3.3 to 2.8 Ma), Philos. Trans. A Math. Phys. Eng. Sci., 371, https://doi.org/10.1098/rsta.2013.0094, 2013.
Bartoli, G., Honisch, B., and Zeebe, R. E.: Atmospheric CO2 decline during the Pliocene intensification of Northern Hemisphere glaciations, Paleoceanography, 26, https://doi.org/10.1029/2010pa002055, 2011.
Bridges, J. D., Tarduno, J. A., Cottrell, R. D., and Herbert, T. D.: Rapid strengthening of westerlies accompanied intensification of Northern Hemisphere glaciation, Nat. Commun., 14, 3905, https://doi.org/10.1038/s41467-023-39557-4, 2023.
Brigham-Grette, J., Melles, M., Minyuk, P., Andreev, A., Tarasov, P., DeConto, R., Koenig, S., Nowaczyk, N., Wennrich, V., and Rosén, P.: Pliocene warmth, polar amplification, and stepped Pleistocene cooling recorded in NE Arctic Russia, Science, 340, 1421–1427, https://doi.org/10.1126/science.1233137, 2013.
Burke, K. D., Williams, J. W., Chandler, M. A., Haywood, A. M., Lunt, D. J., and Ottobliesner, B. L.: Pliocene and Eocene provide best analogs for near-future climates, Proc. Natl. Acad. Sci., 115, 13288–13293, https://doi.org/10.1073/pnas.1809600115, 2018.
Bush, M., Horton, B. K., Saylor, J. E., and Nie, J. S.: Growth of the Qaidam Basin during Cenozoic exhumation in the northern Tibetan Plateau: Inferences from depositional patterns and multiproxy detrital provenance signatures, Lithosphere, 8, 58–82, https://doi.org/10.1130/L449.1, 2016.
Cai, M. T., Fang, X. M., Wu, F. L., Miao, Y. F., and Appel, E.: Pliocene-Pleistocene stepwise drying of Central Asia: Evidence from paleomagnetism and sporopollen record of the deep borehole SG-3 in the western Qaidam Basin, NE Tibetan Plateau, Glob. Planet. Chang., 94–95, 72–81, https://doi.org/10.1016/j.gloplacha.2012.07.002, 2012.
Dowsett, H. J., Robinson, M. M., Haywood, A. M., Salzmann, U., Hill, D. J., Sohl, L. E., Chandler, M., Williams, M., Foley, K., and Stoll, D. K.: The PRISM3D paleoenvironmental reconstruction, Stratigraphy, 7, 123–139, https://doi.org/10.29041/strat.07.2.03, 2010.
Gu, N., Jiang, W. Y., Wang, L., Zhang, E. L., Yang, S. L., and Xiong, S. F.: Rainfall thresholds for the precipitation of carbonate and evaporite minerals in modern lakes in northern China, Geophys. Res. Lett., 42, 5895–5901, https://doi.org/10.1002/2015GL064340, 2015.
Haywood, A., Dowsett, H., and Dolan, A.: Integrating geological archives and climate models for the mid-Pliocene warm period, Nat. Commun., 7, 10646, https://doi.org/10.1038/ncomms10646, 2016.
Haywood, A. M., Ridgwell, A., Lunt, D. J., Hill, D. J., Pound, D. J., and Dowsett, H. J.: Are there pre-Quaternary geological analogues for a future greenhouse warming?, Philos. T. R. Soc. A, 369, 933–956, https://doi.org/10.1098/rsta.2010.0317, 2011.
Hearty, P. J., Rovere, A., Sandstrom, M. R., O'Leary, M. J., Roberts, D., and Raymo, M. E.: Pliocene-Pleistocene stratigraphy and sea-level estimates, Republic of South Africa with implications for a 400 ppmv CO2 world, Paleoceanogr. Paleoclimatol., 35, https://doi.org/10.1029/2019PA003835, 2020.
Herbert, T. D., Lawrence, K. T., Tzanova, A., Peterson, L. C., Caballero-Gill, R., and Kelly, C. S.: Late Miocene global cooling and the rise of modern ecosystems, Nat. Geosci., 9, 843–847, https://doi.org/10.1038/ngeo2813, 2016.
Huang, X. F., Jiang, D. B., Dong, X. X., Yang, S. L., Su, B. H., Li, X. Y., Tang, Z. H., and Wang, Y. D.: Northwestward Migration of the Northern Edge of the East Asian Summer Monsoon During the Mid-Pliocene Warm Period: Simulations and Reconstructions, J. Geophys. Res., 124, 1392–1404, https://doi.org/10.1029/2018jd028995, 2019.
Huang, X. F., Yang, S. L., Haywood, A., Jiang, D. B., Wang, Y. D., Sun, M. M., Tang, Z. H., and Ding, Z. L.: Warming-induced northwestward migration of the Asian summer monsoon in the geological past: Evidence from climate simulations and geological reconstructions, J. Geophys. Res-Atmos., 126, https://doi.org/10.1029/2021JD035190, 2021.
Koutsodendris, A., Allstadt, F. J., Kern, O. A., Kousis, I., Schwarz, F., Vannacci, M., Woutersen, A., Appel, E., Berke, M. A., and Fang, X. M.: Late Pliocene vegetation turnover on the NE Tibetan Plateau (Central Asia) triggered by early Northern Hemisphere glaciation, Glob. Planet. Chang., 180, 117–125, https://doi.org/10.1016/j.gloplacha.2019.06.001, 2019.
Laskar, J., Robutel, P., Joutel, F., Gastineau, M., Correia, A. C. M., and Levrard, B.: A long-term numerical solution for the insolation quantities of the Earth, Astron. Astrophys., 428, 261–285, https://doi.org/10.1051/0004-6361:20041335, 2004.
Li, M. H., Fang, X. M., Yi, C. L., Gao, S. P., Zhang, W. L., and Galy, A.: Evaporite minerals and geochemistry of the upper 400 m sediments in a core from the Western Qaidam Basin, Tibet, Quatern. Int., 218, 176–189, https://doi.org/10.1016/j.quaint.2009.12.013, 2010.
Lisiecki, L. E. and Raymo, M. E.: A Plio-Pleistocene stack of 57 globally distributed benthic δ18O records, Paleoceanography, 20, https://doi.org/10.1029/2004pa001071, 2005.
Lunt, D. J., Haywood, A. M., Schmidt, G. A., Salzmann, U., Dowsett, H. J., and Loptson, C. A.: On the causes of mid-Pliocene warmth and polar amplification, Earth Planet. Sci. Lett., 321–322, 128–138, https://doi.org/10.1016/j.epsl.2011.12.042, 2012.
Luo, Z., Su, Q. D., Wang, Z., Heermance, R. V., Garzione, C. N., Li, M., Ren, X. P., Song, Y. G., and Nie, J. S.: Orbital forcing of Plio-Pleistocene climate variation in a Qaidam Basin lake based on paleomagnetic and evaporite mineralogic analysis, Palaeogeogr. Palaeocl., 510, 31–39, https://doi.org/10.1016/j.palaeo.2017.09.022, 2018.
Luo, Z., Nie, J. S., Moe, A. E., Heermance, R. V., Garzione, C., Herbert, T. D., Wang, Z., Li, H., Zhang, R., Zhao, X. M., and Salzmann, U.: Joint insolation and ice sheet/CO2 forcing on northern China precipitation during Pliocene warmth, Sci. Bull., 66, 319–322, https://doi.org/10.1016/j.scib.2020.10.025, 2021.
Luo, Z., Wang, H. S., Heermance, R. V., Nie, J. S., Yang, J., Yu, X. L., Wang, Z., Zhang, Z., and Su, Q. D.: June insolation gradient and ice sheet forcing on Qaidam precipitation during the middle Piacenzian warm period, Palaeogeogr. Palaeocl., 648, 112277, https://doi.org/10.1016/j.palaeo.2024.112277, 2024.
Miao, Y. F., Fang, X. M., Wu, F. L., Cai, M. T., Song, C. H., Meng, Q. Q., and Xu, L.: Late Cenozoic continuous aridification in the western Qaidam Basin: evidence from sporopollen records, Clim. Past, 9, 1863–1877, https://doi.org/10.5194/cp-9-1863-2013, 2013.
Nie, J. S., Garzione, C. N., Su, Q. D., Liu, Q. S., Zhang, R., Heslop, D., Necula, C., Zhang, S. H., Song, Y. G., and Luo, Z.: Dominant 100 000 year precipitation cyclicity in a late Miocene lake from Northeast Tibet, Sci. Adv., 3, https://doi.org/10.1126/sciadv.1600762, 2017.
Rahaman, W., Smik, L., Köseoğlu, D. N. L., Tarique, M., Thamban, M., Haywood, A., Belt, S. T., and Knies, J.: Reduced Arctic sea ice extent during the mid-Pliocene Warm Period concurrent with increased Atlantic-climate regime, Earth Planet. Sci. Lett., 550, https://doi.org/10.1016/j.epsl.2020.116535, 2020.
Ravelo, A. C., Andreasen, D. H., Lyle, M., Olivarez, L. A., and Wara, M. W.: Regional climate shifts caused by gradual global cooling in the Pliocene epoch, Nature, 429, 263–267, https://doi.org/10.1038/nature02567, 2004.
Raymo, M. E., Lisiecki, L. E., and Nisancioglu, K. H.: Plio-Pleistocene ice volume, Antarctic climate, and the global δ18O record, Science, 313, 492–495, https://doi.org/10.1126/SCIENCE.1123296, 2006.
Reguero, M. A., Candela, A. M., and Alonso, R. N.: Biochronology and biostratigraphy of the Uquía Formation (Pliocene-early Pleistocene, NW Argentina) and its significance in the Great American Biotic Interchange, J. S. Am. Earth Sci., 23, 1–16, https://doi.org/10.1016/j.jsames.2006.09.005, 2007.
Ren, X. P., Nie, J. S., Saylor, J. E., Wang, X. X., Liu, F. B., and Horton, B. K.: Temperature control on silicate weathering intensity and evolution of the Neogene East Asian summer monsoon, Geophys. Res. Lett., 47, https://doi.org/10.1029/2020gl088808, 2020.
Salzmann, U., Haywood, A. M., Lunt, D. J., Valdes, P. J., and Hill, D. J.: A new global biome reconstruction and data-model comparison for the Middle Pliocene, Global Ecol. Biogeogr., 17, 432–447, https://doi.org/10.1111/j.1466-8238.2008.00381.x, 2008.
Salzmann, U., Williams, M., Haywood, A. M., Johnson, A. L. A., Kender, S., and Zalasiewicz, J.: Climate and environment of a Pliocene warm world, Palaeogeogr. Palaeocl., 309, 1–8, https://doi.org/10.1016/j.palaeo.2011.05.044, 2011.
Schwarz, F., Salzmann, U., Koutsodendris, A., Nie, J. S., Friedrich, O., Ni, J., Garzione, C., Fang, X. M., Wu, F. L., Woodward, J., Appel, E., and Prosset, J.: Controls of precipitation and vegetation variability on the NE Tibetan Plateau during the Late Pliocene warmth (∼ 3.5–3.0 Ma), Glob. Planet. Chang., 208, https://doi.org/10.1016/j.gloplacha.2021.103707, 2022.
Song, C. H., Hu, S. H., Han, W. X., Zhang, T., Fang, X. M., Gao, J. P., and Wu, F. L.: Middle Miocene to earliest Pliocene sedimentological and geochemical records of climate change in the western Qaidam Basin on the NE Tibetan Plateau, Palaeogeogr. Palaeocl., 395, 67–76, https://doi.org/10.1016/j.palaeo.2013.12.022, 2013.
Song, Y. G., Fang, X. M., Li, J. J., An, Z. S., and Miao, X. D.: The Late Cenozoic uplift of the Liupan Shan, China, Sci. China Ser. D-Earth Sci., 44, 176–184, https://doi.org/10.1007/bf02911985, 2001.
Su, Q. D., Nie, J. S., Meng, Q. Q., Heermance, R., Gong, L. S., Luo, Z., Wang, Z., Zhang, R., and Garzione, C.: Central Asian Drying at 3.3 Ma Linked to Tropical Forcing?, Geophys. Res. Lett., 46, 10561–10567, https://doi.org/10.1029/2019GL084648, 2019.
Su, Q. D., Nie, J. S., Han, W. X., Garzione, C. N., and Gao, P.: Obliquity forcing of Late Pliocene–Early Pleistocene aridification in the Qaidam Basin, NE Tibetan Plateau, Palaeogeogr. Palaeocl., 635, https://doi.org/10.1016/j.palaeo.2023.111951, 2024.
Vieira, M., Pound, M. J., and Pereira, D. I.: The Late Pliocene palaeoenvironments and palaeoclimates of the western Iberian Atlantic margin from the Rio Maior flora, Palaeogeogr. Palaeocl., 495, 245–258, https://doi.org/10.1016/j.palaeo.2018.01.018, 2018.
Wan, S. M., Tian, J., Steinke, S., Li, A. C., and Li, T. G.: Evolution and variability of the East Asian summer monsoon during the Pliocene: Evidence from clay mineral records of the South China Sea, Palaeogeogr. Palaeocl., 293, 237–247, https://doi.org/10.1016/j.palaeo.2010.05.025, 2010.
Wang, J. Y., Fang, X. M., Appel, E., and Zhang, W. L.: Magnetostratigraphic and radiometric constraints on salt formation in the Qaidam Basin, NE Tibetan Plateau, Quat. Sci. Rev., 78, 53–64, https://doi.org/10.1016/j.quascirev.2013.07.017, 2013.
Wang, Z. X., Mao, Y. D., Zhang, R., Kemp, D. B., and Huang, C. J.: Links between orbital forcing, Antarctic ice volume, and the East Asian hydrological cycle over the Pliocene, J. Geophys. Res.-Atmos., 128, https://doi.org/10.1029/2023jd039519, 2023.
Wehausen, R. and Brumsack, H. J.: Astronomical forcing of the East Asian monsoon mirrored by the composition of Pliocene South China Sea sediments, Earth Planet. Sci. Lett., 201, 621–636, https://doi.org/10.1016/S0012-821X(02)00746-X, 2002.
Yang, L. Y., Zhang, W. L., Fang, X. M., Cai, M. T., and Lu, Y.: Aridification recorded by lithofacies and grain size in a continuous Pliocene-Quaternary lacustrine sediment record in the western Qaidam Basin, NE Tibetan Plateau, Palaeogeogr. Palaeocl., 556, 109903, https://doi.org/10.1016/j.palaeo.2020.109903, 2020.
Yang, S. L., Ding, Z. L., Feng, S. H., Jiang, W. Y., Huang, X. F., and Guo, L. C.: A strengthened East Asian Summer Monsoon during Pliocene warmth: Evidence from “red clay” sediments at Pianguan, northern China, J. Asian Earth Sci., 155, 124–133, https://doi.org/10.1016/j.jseaes.2017.10.020, 2018.
Zhang, Z., Licht, A., De Vleeschouwer, D. D., Wang, Z. X., Li, Y. Z., Kemp, D. B., Tan, L. C., Zhang, R., Qaing, X. K., and Huang, C. J.: East Asian monsoonal climate sensitivity changed in the Late Pliocene in response to Northern Hemisphere glaciations, Geophys. Res. Lett., 49, https://doi.org/10.1029/2022gl101280, 2022.
Zhang, Z. G., Han, W. X., Fang, X. M., Song, C. H., and Li, X. Y.: Late Miocene–Pleistocene aridification of Asian inland revealed by geochemical records of lacustrine-fan delta sediments from the western Tarim Basin, NW China, Palaeogeogr. Palaeocl., 377, 52–61, https://doi.org/10.1016/j.palaeo.2013.03.008, 2013.
Zhou, X. Q. and Liu, C. L.: Mid-Piacenzian and future changes in South Asian precipitation under global warming, Glob. Planet. Chang., 248, 104760, https://doi.org/10.1016/j.gloplacha.2025.104760, 2025.