
the Creative Commons Attribution 4.0 License.
the Creative Commons Attribution 4.0 License.
 | 07 Oct 2026
From manual classification to transformer-based language models: assessing the quality and consistency of historical convective event records
Franck Schätz

Rüdiger Glaser
This article investigates whether Transformer-based language models could replace the labour-intensive, manual classification of convective weather phenomena found in written texts from the pre-instrumental measurement era. The training set is based on a corpus of 6999 written observations from 494 Central European sources, spanning the period from 1000 to 1817. This corpus has been linguistically normalised, ranging from Middle High German to Contemporary German.
For the training set, the text sources containing observations of thunderstorm and hail events are first classified manually using a formalised procedure. Quality assurance is initially carried out at the level of the existing textual information. To this end, evidence classes are introduced. These are based on linguistic evidence regarding the associated phenomena of thunderstorm and hail events. In the next step, the plausibility of the classified thunderstorm and hail events is assessed by checking their consistency with the DWD normal periods (1961–1990, 1991–2020).
The seasonal signal is preserved across four language stages and nine source types, from the early 15th to the early 19th century. The classified thunderstorm and hail events exhibit a plausible physical signal and show strong correlations with current observations. The trained models “ThunderstormBERT” and “HailBERT” achieve macro-F1 scores of 0.83 and 0.93 respectively. Misclassifications primarily impact the middle thunderstorm class (moderate thunderstorm), where the classification scheme is least clear-cut.
- Article
(6540 KB) - Full-text XML
- BibTeX
- EndNote


Before the introduction of instrumental and radar measurements, textual sources were often the only records of mesoscale weather events such as thunderstorm and hail events (Martius et al., 2018; Kahraman et al., 2024). They describe the course, intensity and extent of an event, as well as the damage it causes (e.g. Punge and Kunz, 2016; Taszarek et al., 2019; Hawkins et al., 2023; Luterbacher et al., 2024) and remain the most important basis for investigating the variability and risk management of extreme weather events (Brázdil et al., 2016b, a; Diodato et al., 2019; Giordani et al., 2024; Hulton and Schultz, 2024; Brönnimann et al., 2019; Glaser, 2013; Stahl et al., 2016; Erfurt et al., 2020; Cutter, 2021).
The use of written weather observations is limited not so much by the availability of sources as by the effort involved in processing them: each event must be manually identified, contextualised and classified. Consequently, only parts of large corpora have been analysed to date. Transformer-based language models such as BERT (Devlin et al., 2019) are potentially capable of carrying out high-quality and scalable automated analysis of historical texts on the topics of climate, weather and risks (see, e.g., Webersinke et al., 2022; Zhou et al., 2022; Sakaji and Kaneda, 2023).
Training such models requires data that has been validated from a linguistic perspective and checked for climatological plausibility. Historical climate records are written in the language of their era (Glaser, 2013; Schätz, 2023) and differ fundamentally from modern weather observations (Grzega, 2022). They consist of descriptions whose level of detail, temporal and spatial precision, and meteorological interpretation vary considerably (Brázdil et al., 2010; Glaser, 2013; Brönnimann et al., 2019). If these characteristics, as well as the physical plausibility of the manual classifications, are not taken into account when generating the model, the results cannot be interpreted. Consistent and validated data, in terms of both their linguistic and climate plausibility, are therefore a prerequisite for automation using Transformer-based language models.
The analysis of thunderstorm and hail events based on historical textual sources is particularly under-represented. In existing studies, historical events are classified according to frequency, intensity or damage (see Lenke, 1960; Camuffo et al., 2000; Gudd, 2004; Brázdil et al., 2016a, b; Huang et al., 2022), none of them provides a formally defined, reproducible framework that links the linguistic variability of historical descriptions with meteorological interpretation.
To bridge this gap, we are developing a text-based classification method that enables climate-relevant information on thunderstorm and hail events to be systematically recorded and categorised. To this end, a classification scheme based on associated phenomena is defined ex ante and applied to a corpus of 6999 written observations from Central European sources dating from 1000 to 1817. The data are checked at the text level for consistency and quality and checked for physical plausibility against the DWD normal periods (1961–1990 and 1991–2020).
The dataset prepared in this way is then used to train Transformer-based language models. These models can analyse further text sources on the basis of the classifications made. All models are made publicly available via Hugging Face.
This study draws on corpora that have already been normalised and temporally and geographically referenced, and focuses on their classification. Below, we provide an overview of the data and the process by which it was generated.
The dataset comprises text extracts (quotes) relating to thunderstorm and hail events in Central Europe between 1000 and 1817 (Schätz and Glaser, 2025). It is based mainly on the HISKLID2 dataset (Glaser, 2014), which has been compiled since the 1980s on the virtual research platform tambora.org (https://www.tambora.org, last access: 30 September 2026), primarily for the reconstruction of temperature and precipitation time series.
Quotes referring to thunderstorm and hail events were extracted from this collection. The dataset used (version 2.2) goes beyond the original HISKLID2 corpus and additionally includes linguistically normalised texts, standardised time data and spatial georeferencing. The complete dataset is publicly available on GitLab (https://gitlab.com/reservoirdog/hist_thunderstorm_hail_central_europe, last access: 30 September 2026).
In total, the dataset contains 6999 quotes from 494 sources, documenting 6157 thunderstorm events and 2006 hail events. 99.1 % of the quotes come from HISKLID2 (483 out of 494 sources), with the remainder from eleven additional sources, primarily 18th-century newspapers and a diary. The corpus thus represents a sample drawn from a general climate database and not a collection specifically compiled for extreme events. Of the 51 833 data records in HISKLID2, 44 834 (86.5 %) mention neither thunderstorm nor hail events, meaning that a selective choice favouring extreme events is structurally ruled out at the corpus level.
The bulk of the corpus consists of chronicles, historiographies, annals and administrative records, followed by weather records, almanacs and compilations (see Fig. 1a). In their role as observers of local environmental conditions, the authors show parallels with the early instrumental observers of the 18th and early 19th centuries (see Fig. 1b). This continuity points to comparable social conditions underpinning observational activity, although the nature of data collection differs fundamentally.
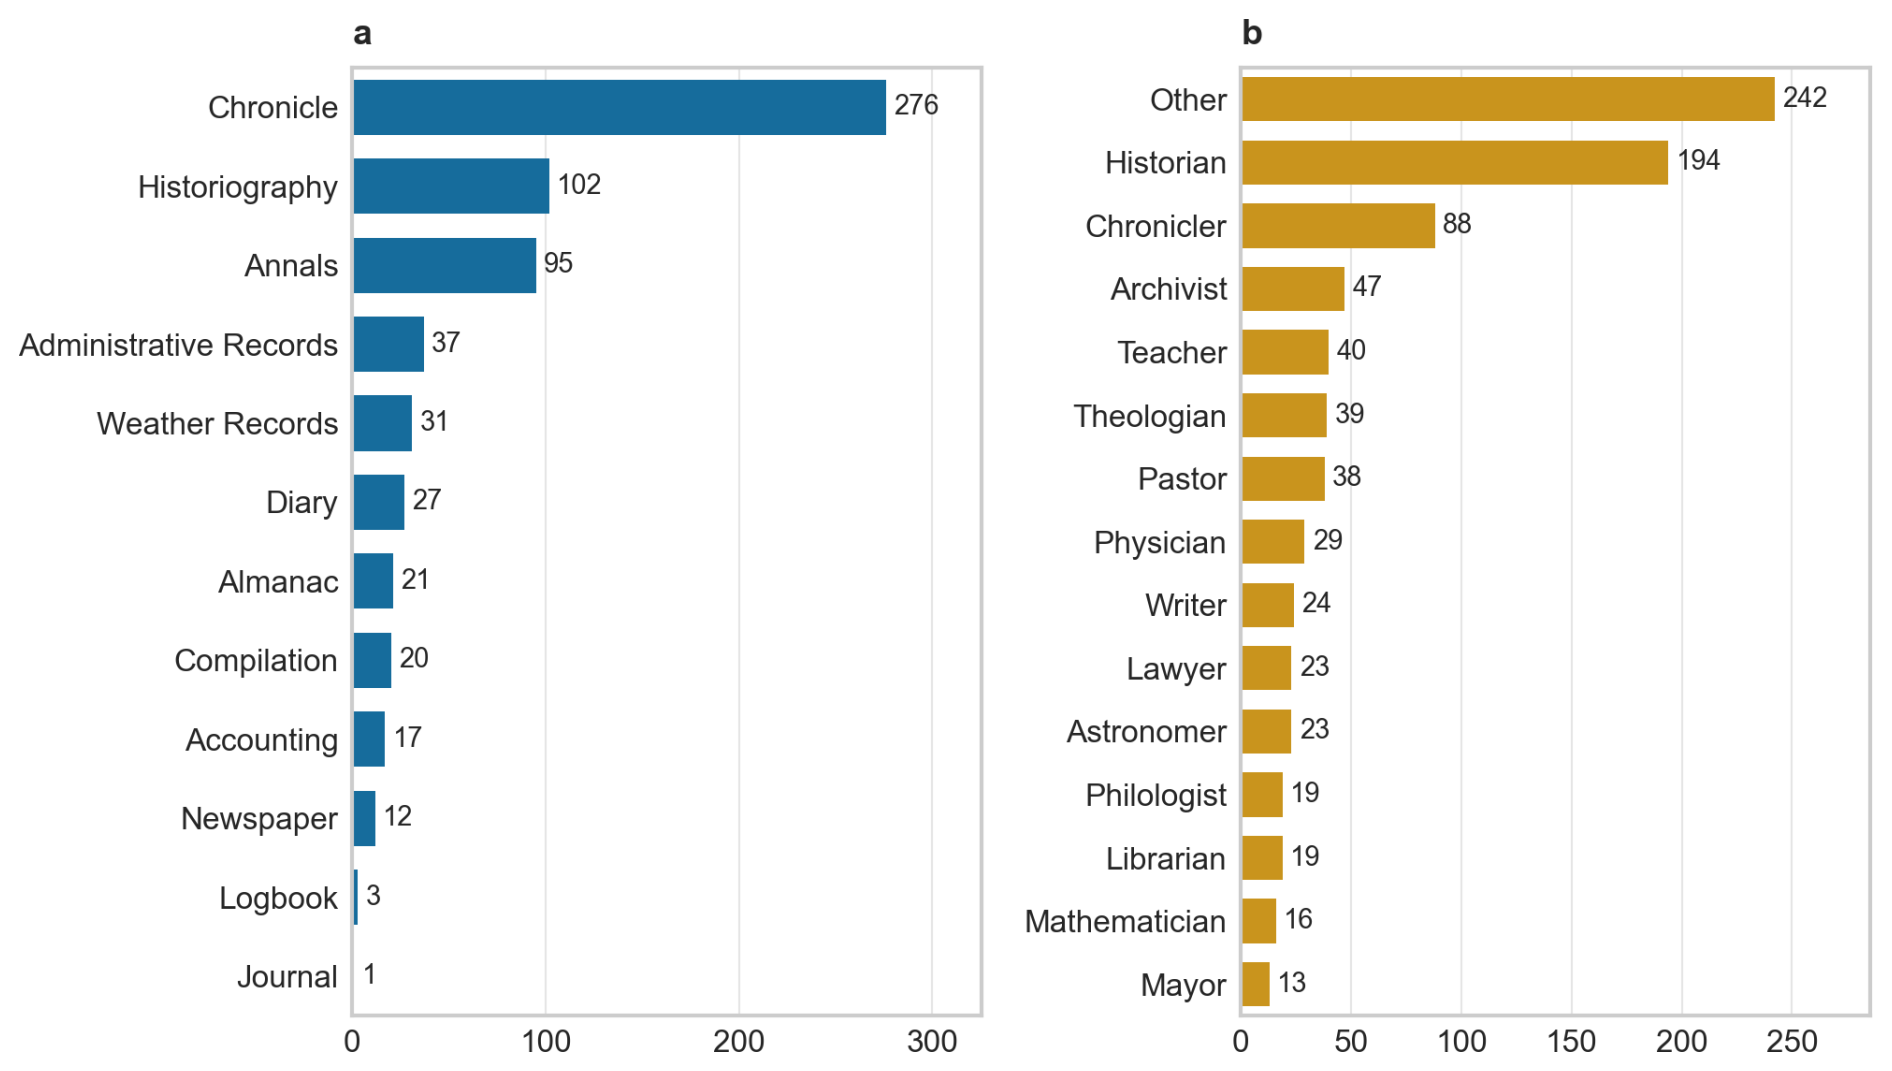
Figure 1(a) Distribution of source types in the corpus: chronicles, historiographies, annals and administrative records predominate. (b) Authors' professional groups: chroniclers, historians, theologians, teachers and administrative officials. This reflects the profile of observers in the early systematic meteorological networks of the 18th and 19th centuries, which were primarily run by highly educated individuals (cf. Bayerische Akademie der Wissenschaften, 1789; Lamont, 1844; Preußisches Meteorologisches Institut, 1897).
The quotes span four language stages: Middle High German, Early New High German, New High German and Contemporary German. Latin quotes were translated into Contemporary German prior to normalisation. When standardising the German-language quotes, grammatical modernisation was avoided; instead, lexical and orthographic normalisation was carried out. Idiomatic expressions were left in their original form in order to preserve semantic authenticity (Schätz, 2023). Obsolete or dialect-specific vocabulary was resolved using the Wörterbuchnetz (https://woerterbuchnetz.de, last access: 30 September 2026). This normalisation is a prerequisite for a consistent lexical basis and thus for the application of modern language models (Ehrmanntraut, 2025).
Table 1 provides a quantitative overview of the distribution of documented events by century and language stage. The data illustrate the linguistic heterogeneity of the corpus, as well as the transition from Latin and Middle High German sources of the Middle Ages to Early and New High German sources from the 16th century onwards. The total number of events in the corpus increases in parallel with the number of textual sources. According to Ernst (2021), the transmission of textual sources was shaped by the invention of printing (1445), the Reformation (1517) and Humboldt's educational reform (1810). A comparison of the corpus with these historical events can be found in Fig. 2.
Table 1Number of documented convective events by century and language stage. MHG = Middle High German, ENHG = Early New High German, NHG = New High German, CG = Contemporary German.
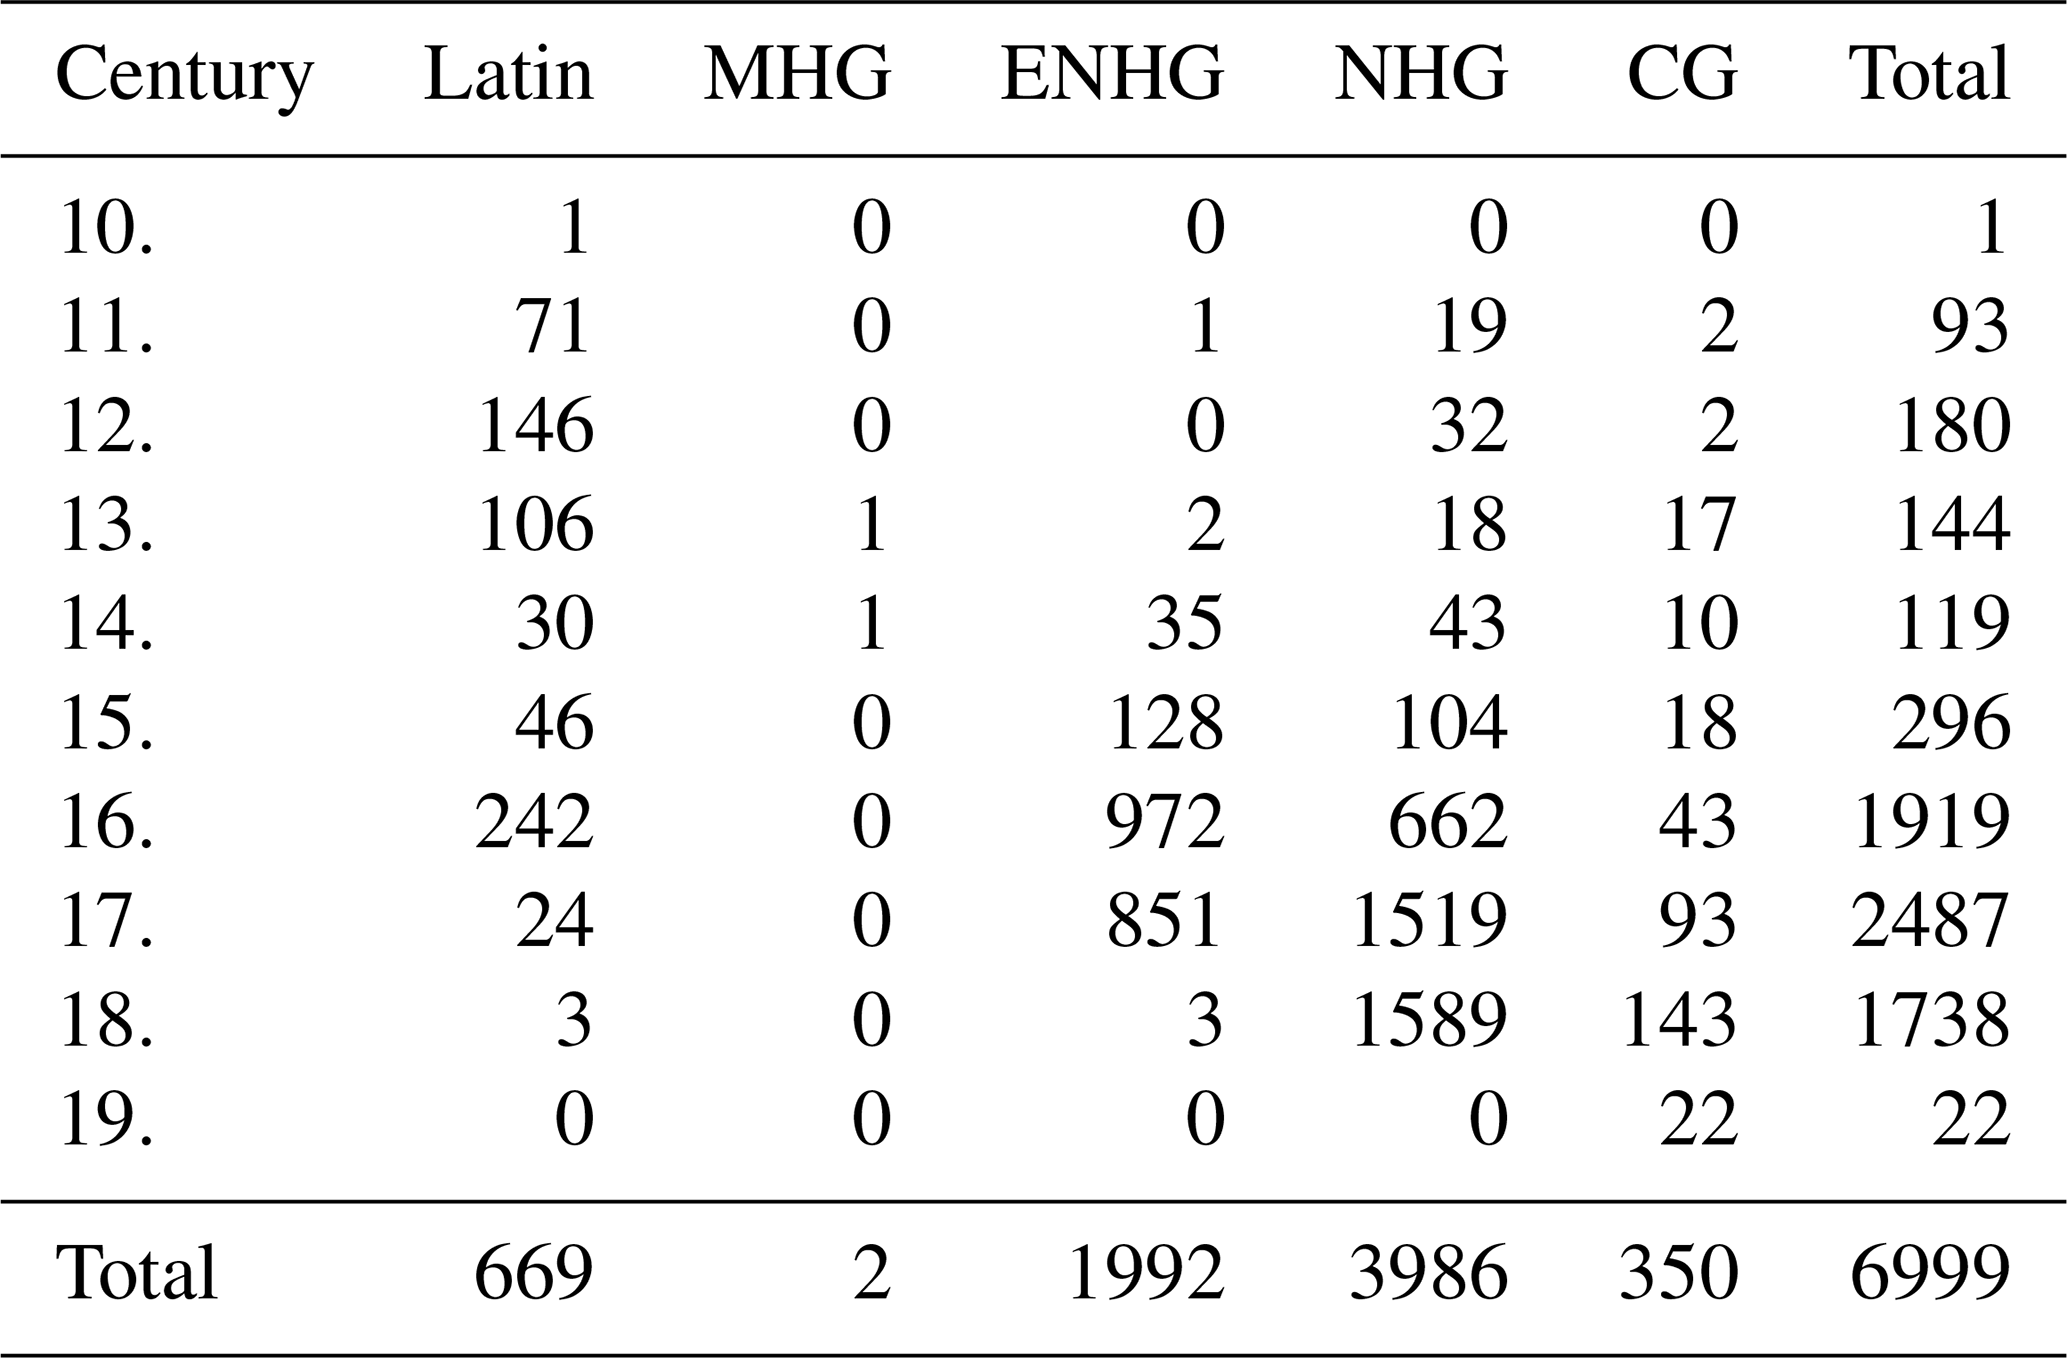
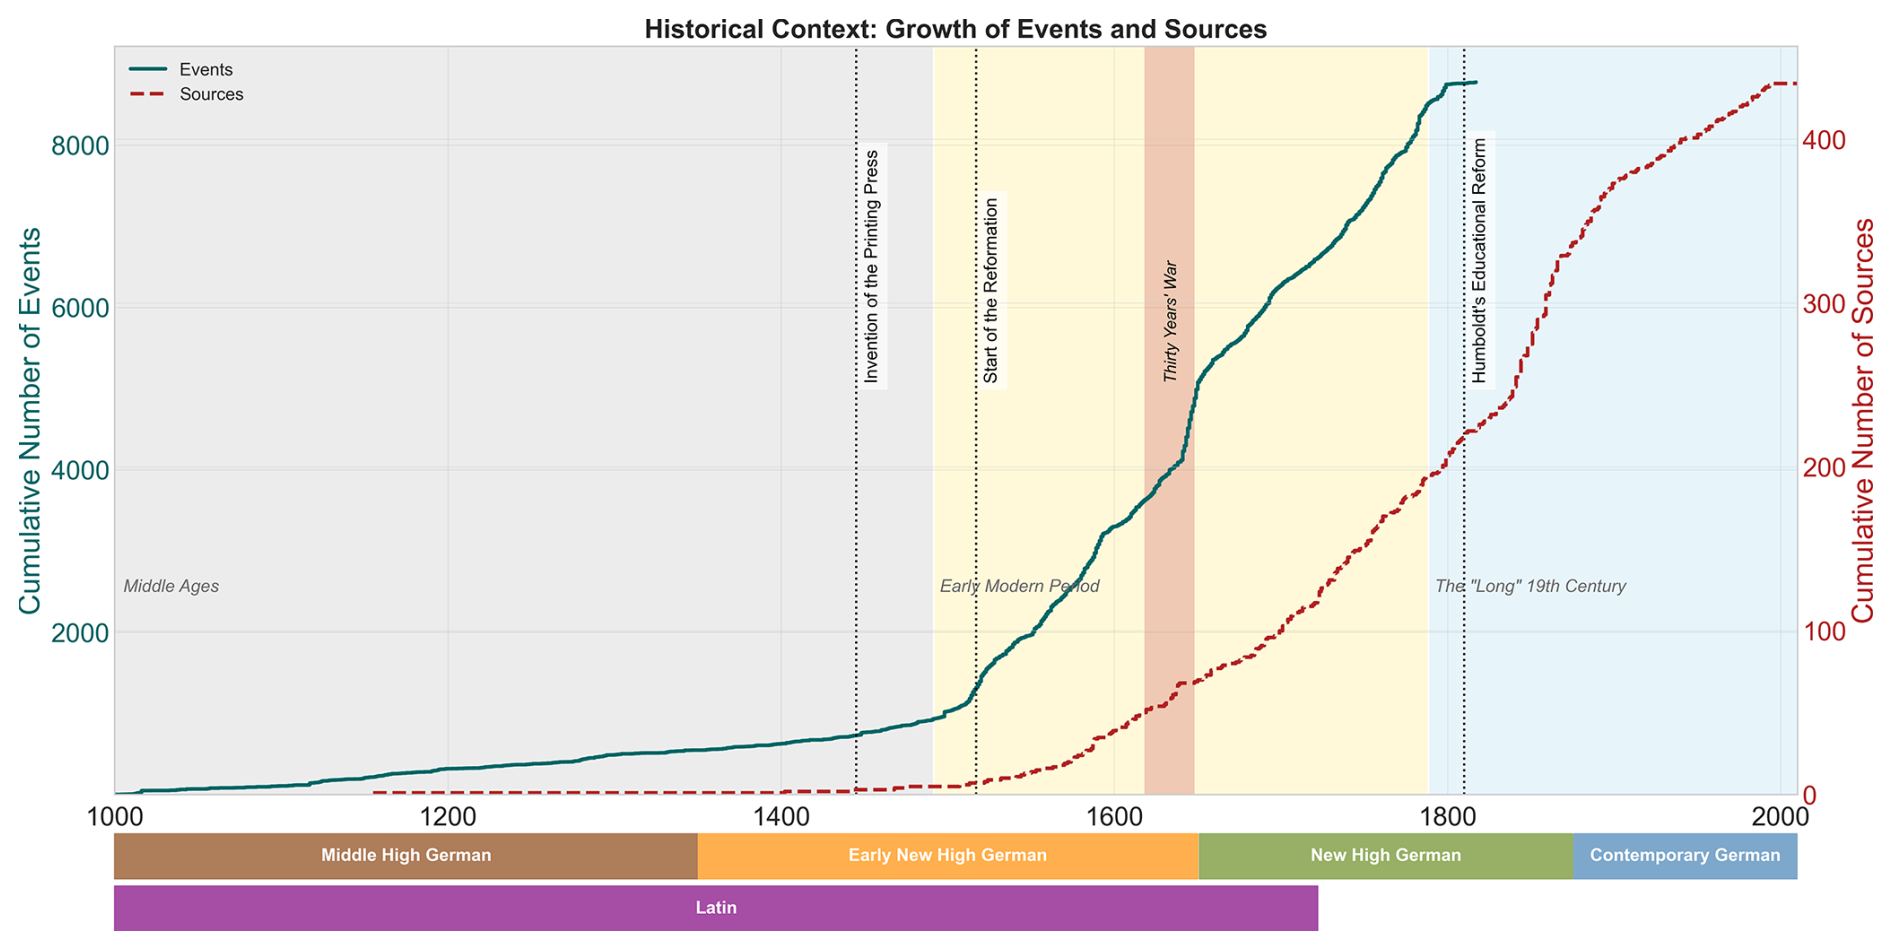
Figure 2The cumulative number of events (left axis, solid line) and sources (right axis, dotted line) over time. The shaded areas indicate the Middle Ages, the Early Modern Period and the “long” 19th century. Key historical events that have influenced the transmission of textual sources serve as points of reference. The coloured bar at the bottom shows the language stages of the corpus according to Ernst (2021). Latin continued to be used well into the early 18th century. A quantitative breakdown by century and language stage can be found in Table 1.
The dates given in the textual sources, including those based on religious or regional calendars, were deciphered using Grotefend (Grotefend, 2007). The place names were georeferenced using GeoNames (https://geonames.org, last access: 30 September 2026) and historical place name directories (e.g. Eichler and Walther, 2001; Reitzenstein, 2009, 2013). The spatial distribution of the events is concentrated in German-speaking countries, although the location from which a source originates does not necessarily correspond to the reported observation sites. In particular, newspapers report on events in several regions, often across territorial and linguistic boundaries. As shown in Fig. 3, the observations cover the climatically most relevant zones of Central Europe according to the Köppen–Geiger classification (Beck et al., 2023). The dataset thus spans several climatic regimes, including the temperate oceanic climate (Cfb), the warm-summer continental climate (Dfb) and the Mediterranean-influenced climate (Csa, Csb), as well as their maritime, continental and orographic influences.
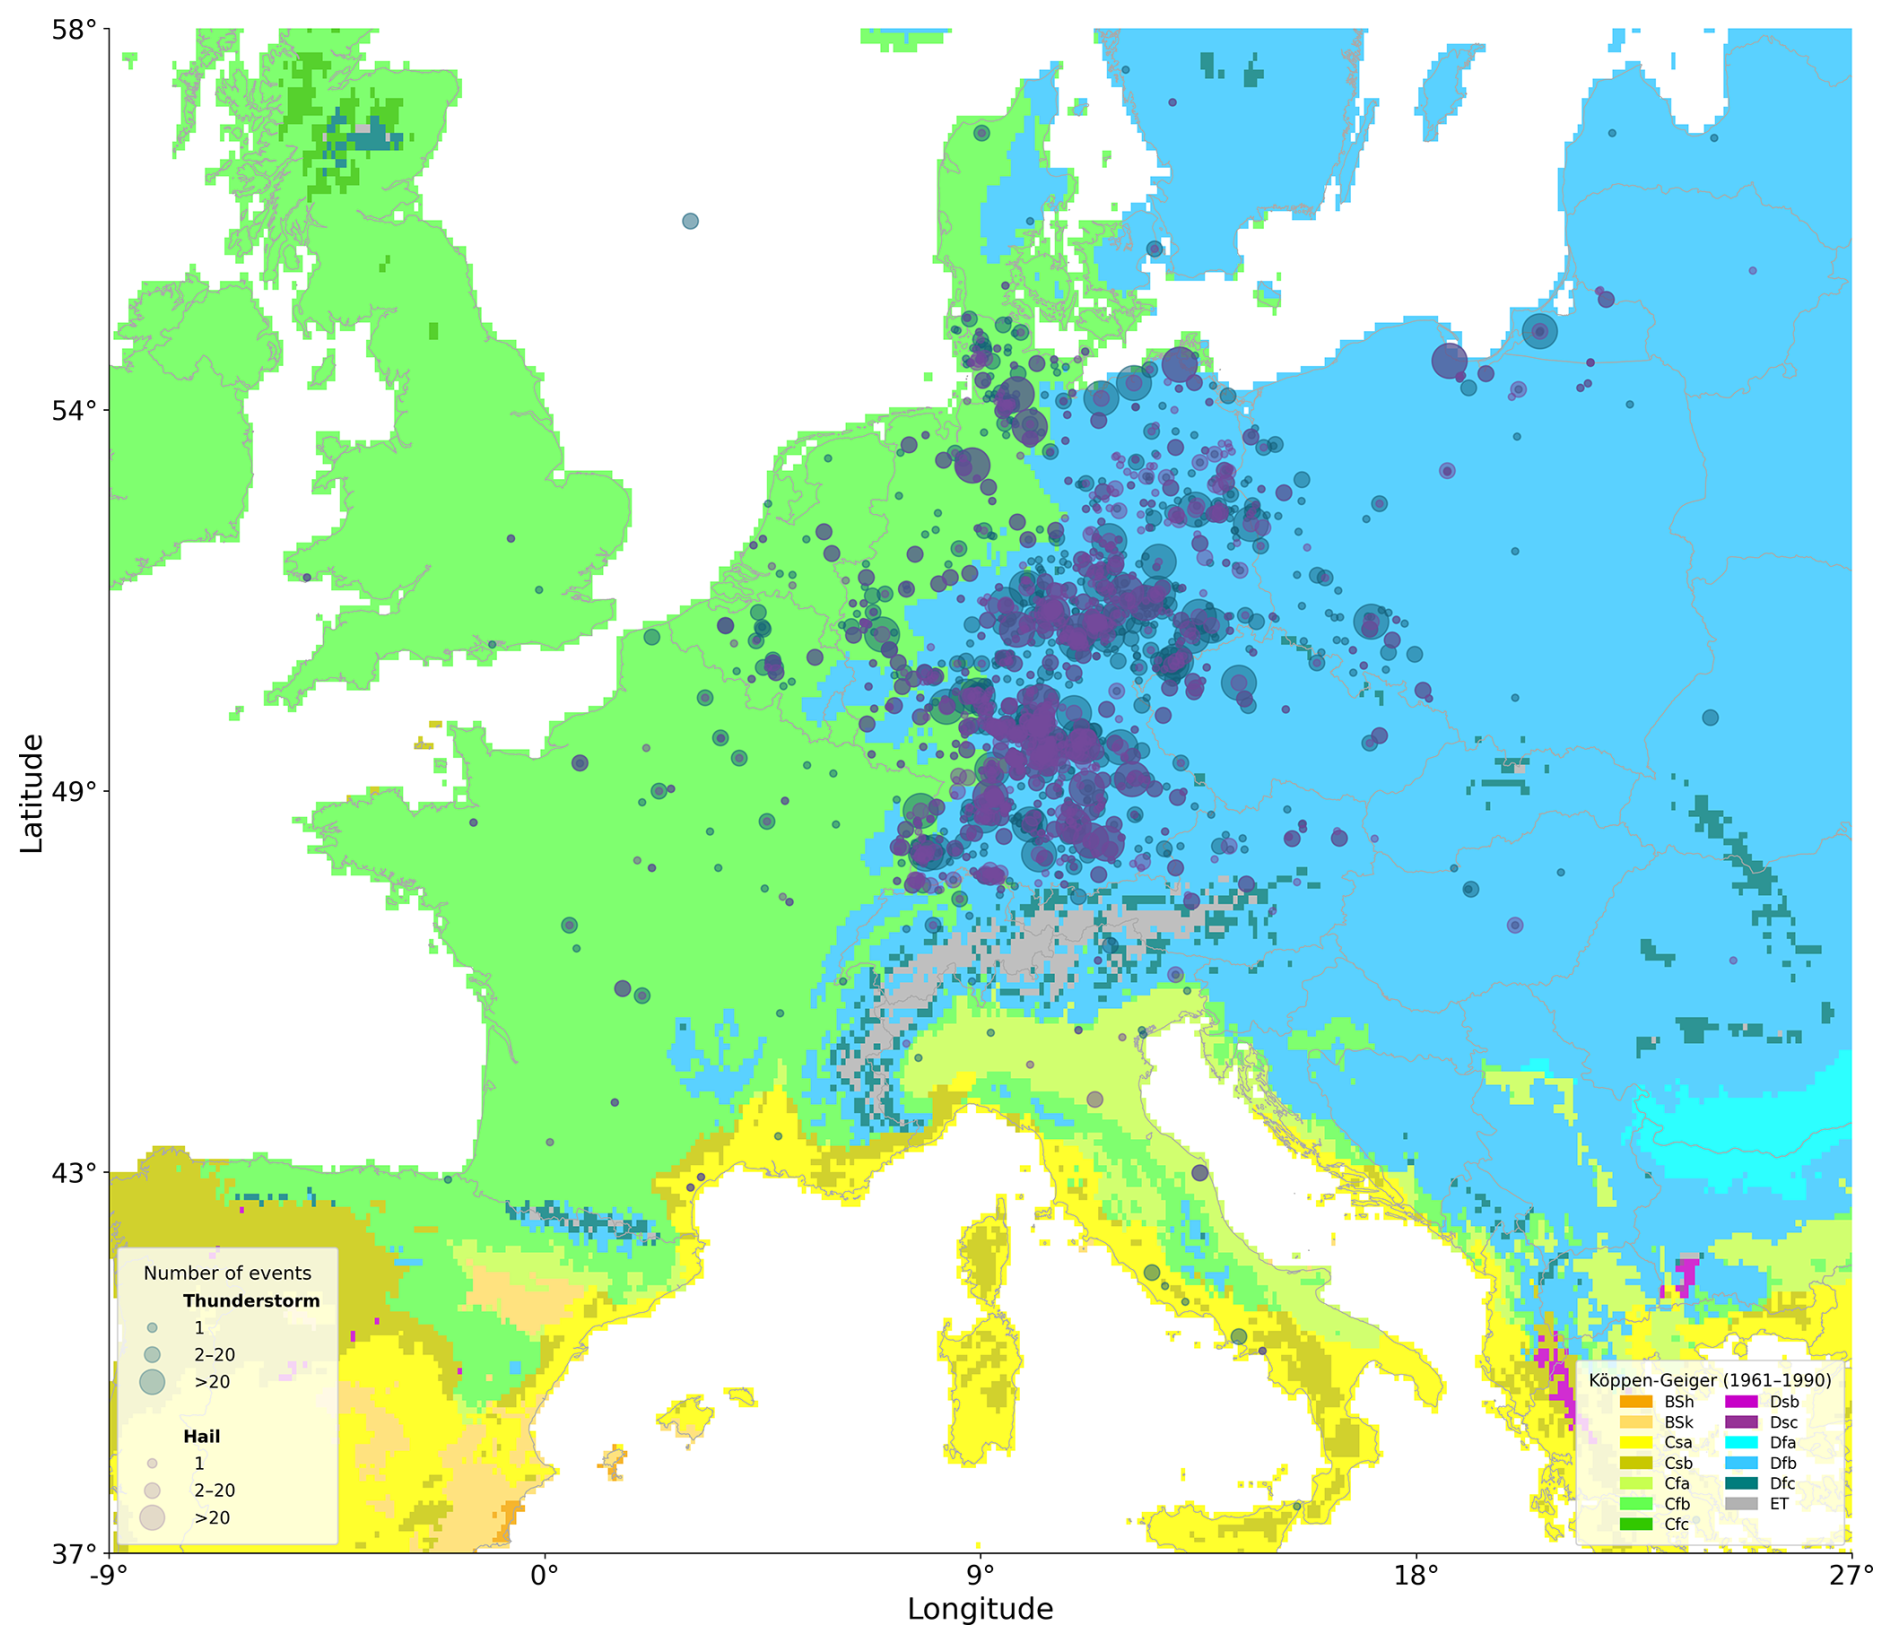
Figure 3The spatial distribution of thunderstorm and hail frequency in Europe is based on the Köppen–Geiger climate classification system. The background shows the climate zones for the 1961–1990 reference period at a resolution of 0.1°, with each zone representing a specific temperature and precipitation regime (e.g. Cfb: temperate climate without a dry season and with a warm summer, Dfb: cold climate without a dry season and with a warm summer; ET: polar tundra climate). Köppen–Geiger climate classification data courtesy of (Beck et al., 2023) (https://www.gloh2o.org/koppen, last access: 30 September 2026). Country boundaries: Porto Tapiquén (2015), based on shapes from Esri.
The classification method described in this study, including its validation, forms part of a comprehensive workflow for source evaluation (see Fig. 4). Each level consists of formally defined steps, which are documented in detail in Schätz (2023).
The normalised quotes, together with the attributes “time” (T) and “location” (L), form the basis for the classification process, which is followed by a plausibility check. The quotes and the classified thunderstorm and hail events (EI) make up the training set.
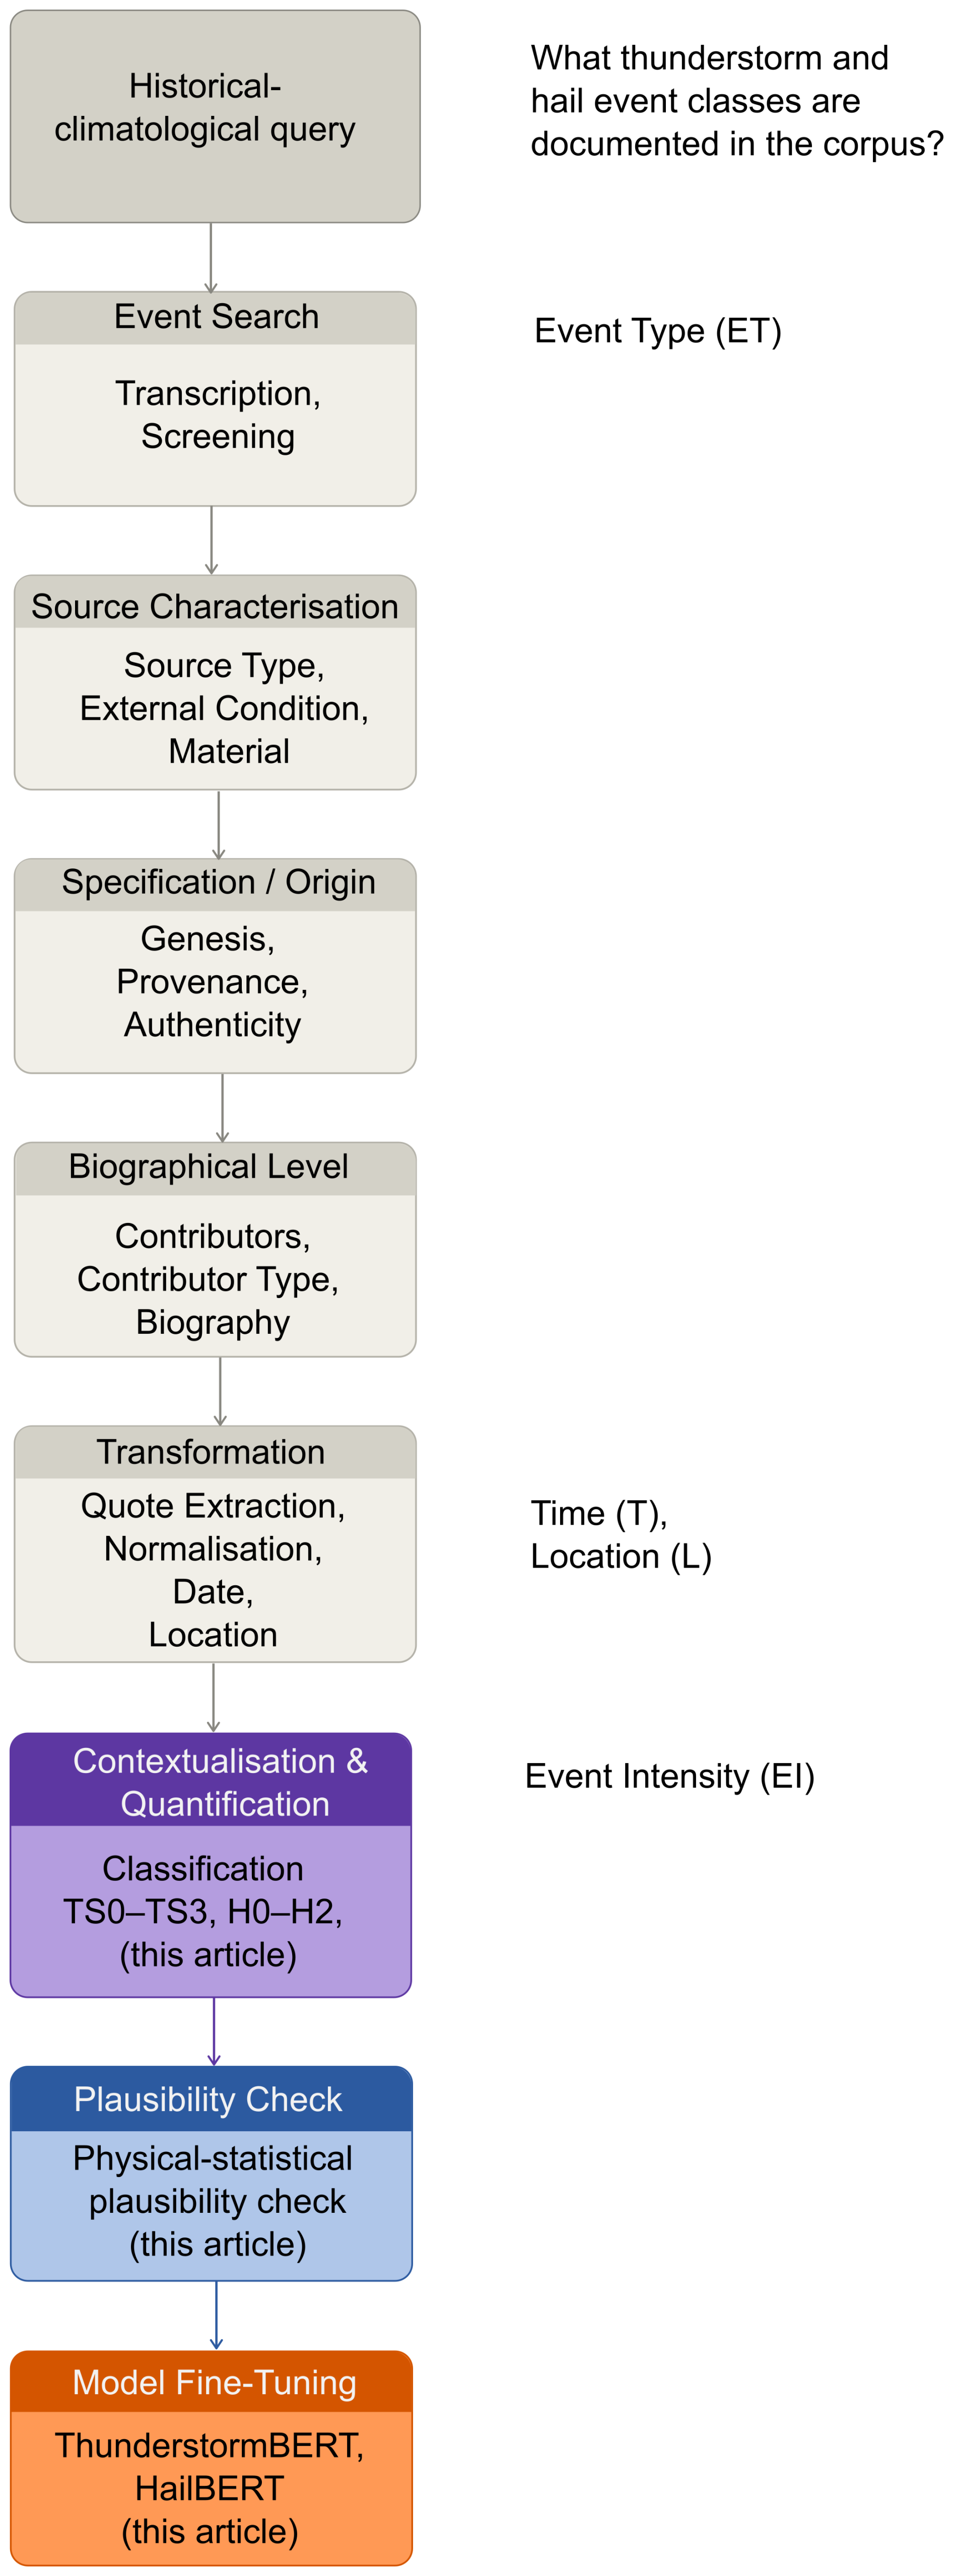
Figure 4A schematic overview of the workflow for source analysis based on Schätz (2023). Each level comprises several formally defined steps. The processes described in this article are colour-coded. The attributes generated at each level are shown on the right (ET = event type, T= time, L= location, EI = event intensity).
The underlying conceptual and formal model of the classification is set out in more detail below. It is based on the approach outlined in Schätz (2023), which describes weather and climate events using a quadruplet comprising event type (ET), time (T), location (L) and event intensity (EI). In this study, EI corresponds to the classification of thunderstorm and hail events. Formally, EI is the result of a mapping fEI that maps a quote q∈Q to a class c∈C from a finite set of uniquely defined event intensity classes C:
Classification is carried out in several stages: linguistic indications of associated phenomena are systematically recorded and analysed for their causal relationships. On this basis, the events are categorised into intensity classes. Finally, the results are linguistically validated and their physical plausibility is statistically assessed using observational data from the German Weather Service (DWD).
3.1 Classification procedure
The classification procedure is based on a classification scheme comprising five mutually exclusive thunderstorm classes and four hail classes (see Tables A1 and A2). It is based on the classification and warning system of the Deutscher Wetterdienst (DWD) (2025) and the Tornado and Storm Research Organisation (TORRO) (2025).
The analysis of the quotes takes into account the cause-and-effect relationships set out in the sources, which are referred to below as “impact pathways”. To systematically record the observations, the associated phenomena mentioned are categorised according to their physical relevance into primary, secondary, tertiary and quaternary associated phenomena (see Fig. 5). This categorisation structures the analysis of the sources and forms the basis for the subsequent classification.
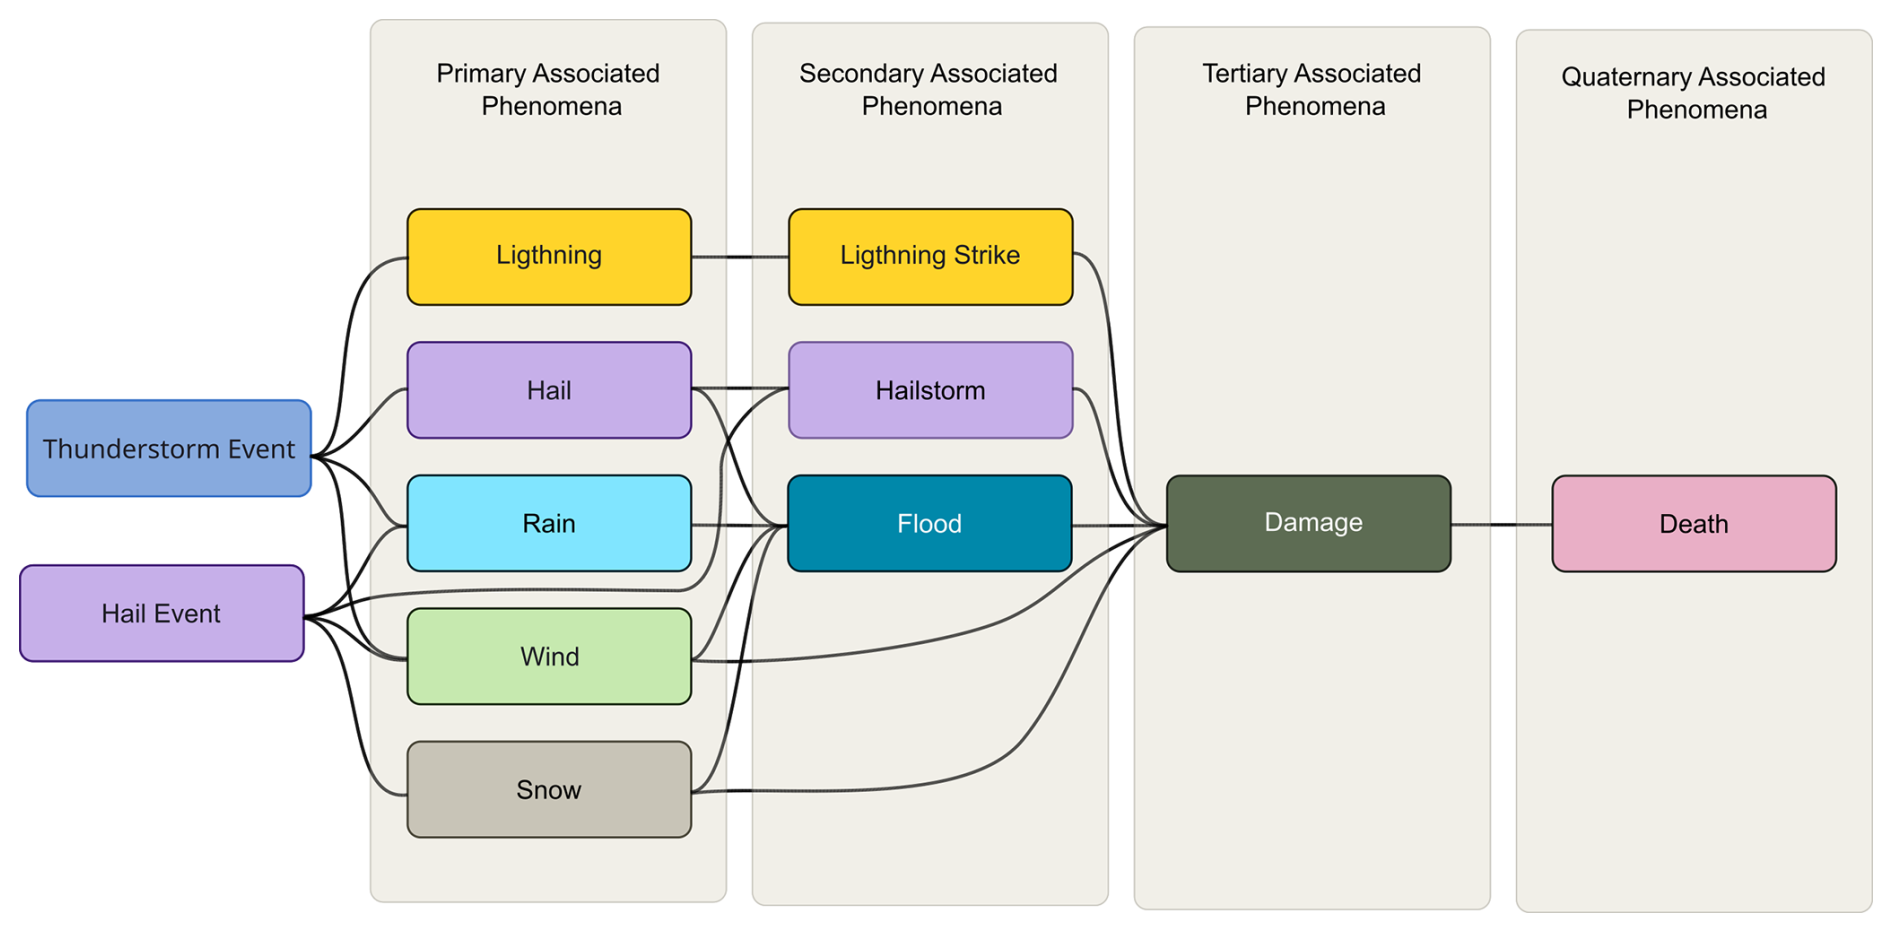
Figure 5Impact pathways of thunderstorm and hail events. The diagram illustrates the cause-and-effect relationship between thunderstorm and hail events (left) and their associated phenomena (right). Primary associated phenomena include rain, hail, lightning, snow and wind. These can trigger secondary effects such as flooding, hail damage or lightning strikes. These, in turn, can lead to tertiary effects in the form of damage. In severe cases, these can trigger quaternary effects, which may include fatalities. The classification scheme thus reflects a causal chain of meteorological processes and their ecological and societal impacts.
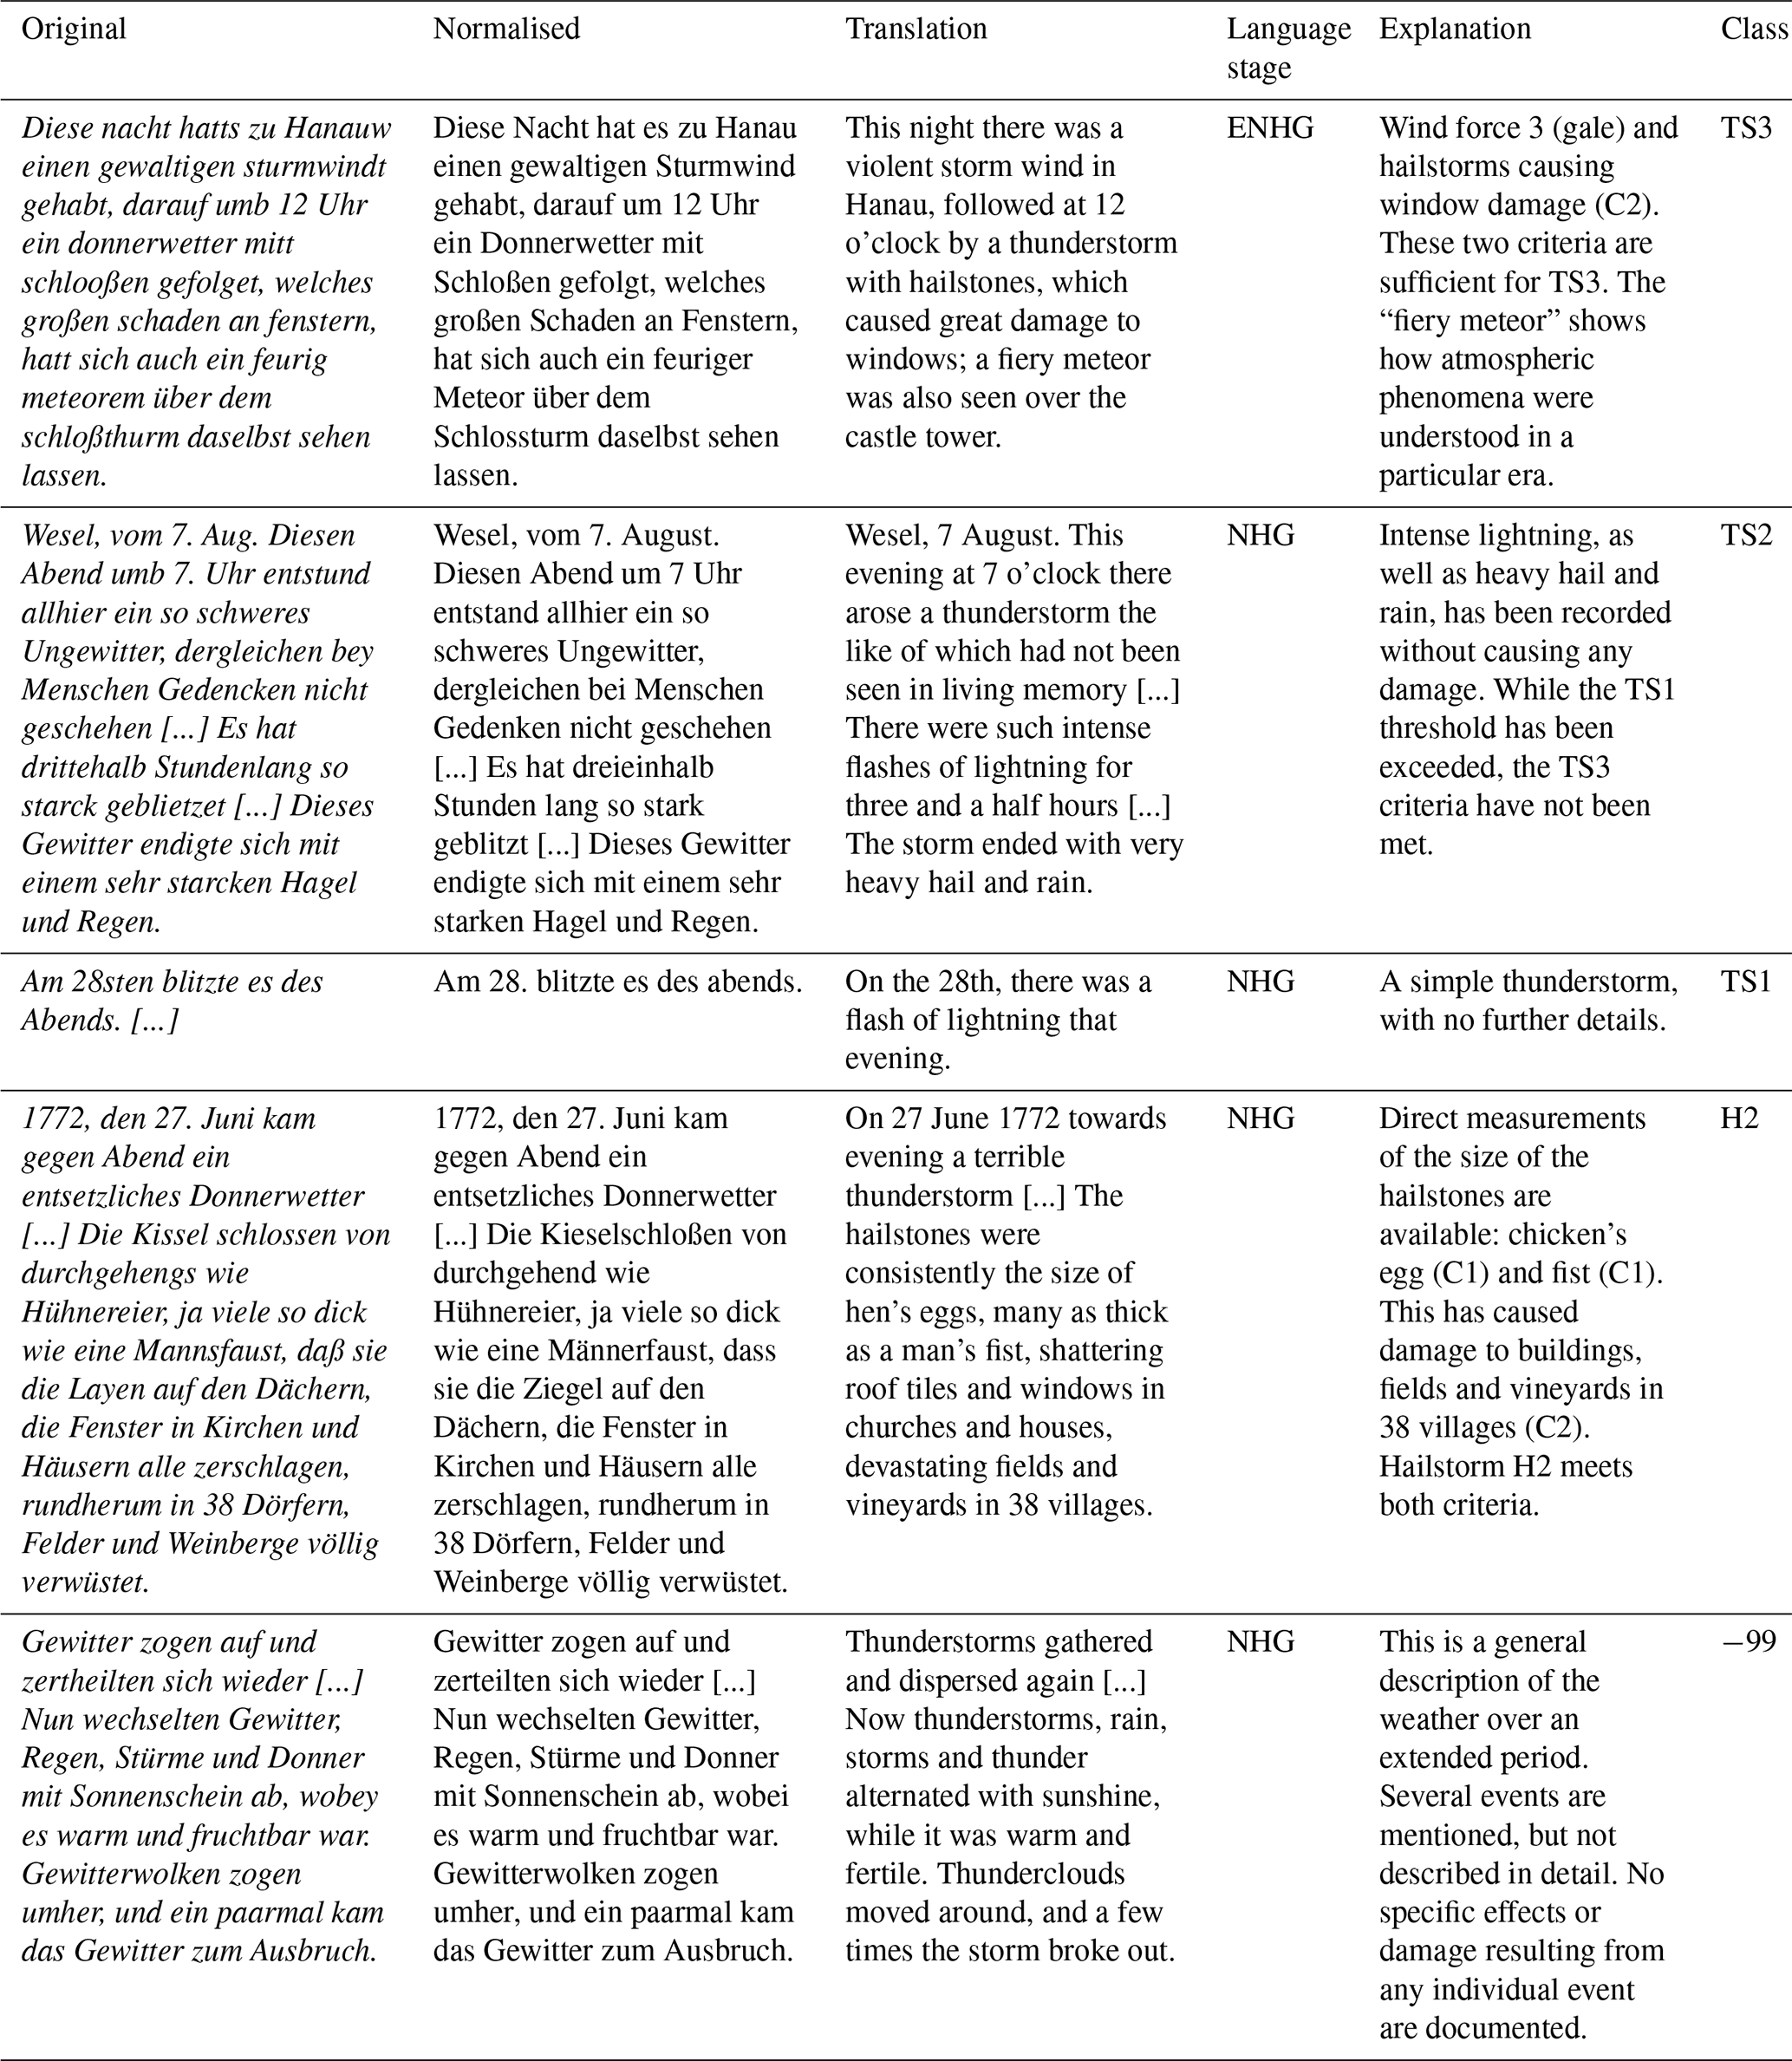
Classification is carried out in stages. First, a check is made to see whether the quote describes associated phenomena that can be clearly attributed to a thunderstorm or hail event (linguistic indicators: Table B1). Only if such indications are present are these associated phenomena taken into account and classified further. To this end, their intensity is determined on the basis of the criteria defined in Tables A3 to A5 (rain, snow, wind) and in Table A6 (hailstone size). The damage described is also classified and systematically assigned to the respective associated phenomena along the impact pathways. In the case of hail events, qualitative information on hailstone size is also taken into account (see Table A6). The low intensity class is characterised by the fact that the event is not described in further detail. Intermediate classes are assigned when the criteria for the extreme classes are not met. Table 2 shows five classified examples with Early New High German and New High German quotes.
Table 2Five examples illustrating the classification of thunderstorm and hail events. The columns show the original historical text, the normalised German form, the English translation, the language stage, the rationale for the classification and the assigned intensity class. A detailed explanation of the word-level classification procedure can be found in Fig. 6.
3.2 Validation through linguistic evidence
For historical weather observations, there is no independent benchmark against which the classification could be directly verified. In order to be able to assess the quotes critically, the evidence presented in the text is evaluated.
To this end, individual words or phrases are assigned to the previously defined evidence classes C1, C2 and C3 (see Table 3). Evidence class C1 (direct/measurable) comprises data containing specific and measurable information, for example on hailstone size, wind strength or precipitation levels. These data have the highest level of evidence, as they are most comparable to instrumental measurements. C2 (indirect/damage) comprises damage indicators that plausibly and unambiguously point to a thunderstorm or hail event, or its intensity. Examples include destroyed crops, damaged buildings or uprooted trees. C3 (relative/qualitative) has the lowest level of evidence. It comprises non-specific qualitative descriptions without explicit reference values, such as “strong”, “violent” or “terrible”.
Table 3Examples of silver labels for the phenomenon groups hail, rain and wind. Each expression is assigned to a phenomenon category and an evidence class (C1–C3), which reflects the reliability of the underlying linguistic evidence. C1 entries are based on concrete, measurable information, C2 entries are based on indirect damage indicators, and C3 entries are based on qualitative descriptors only. The complete silver label lists, including all recorded variants, can be found in Appendices B2–B4.
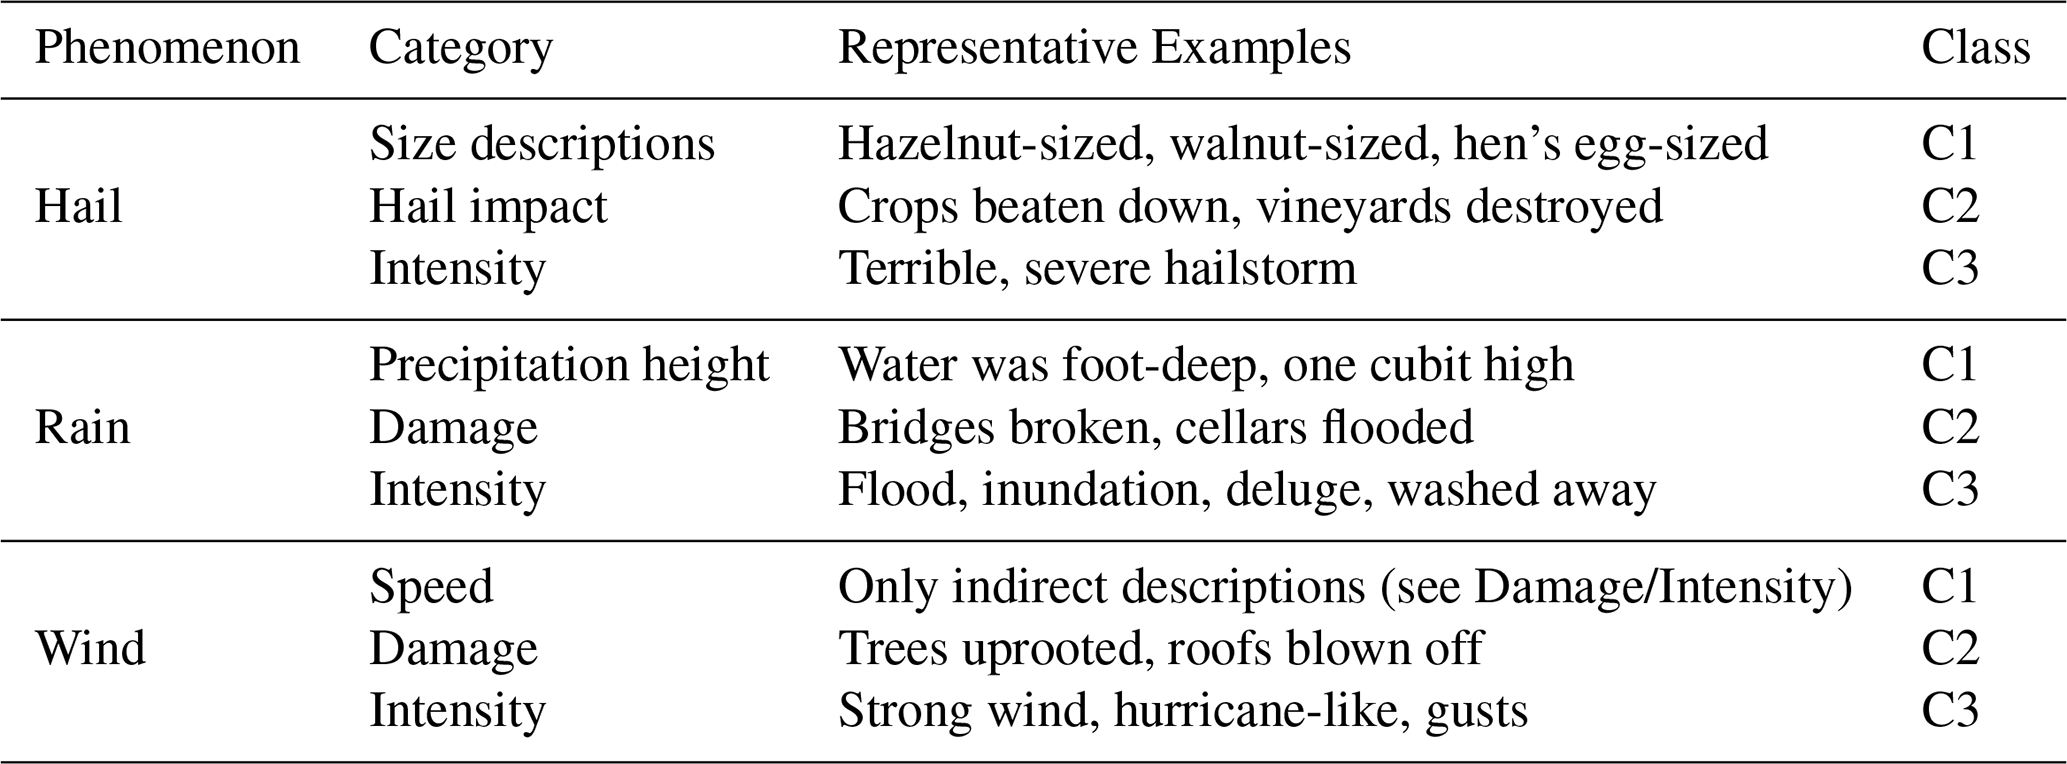
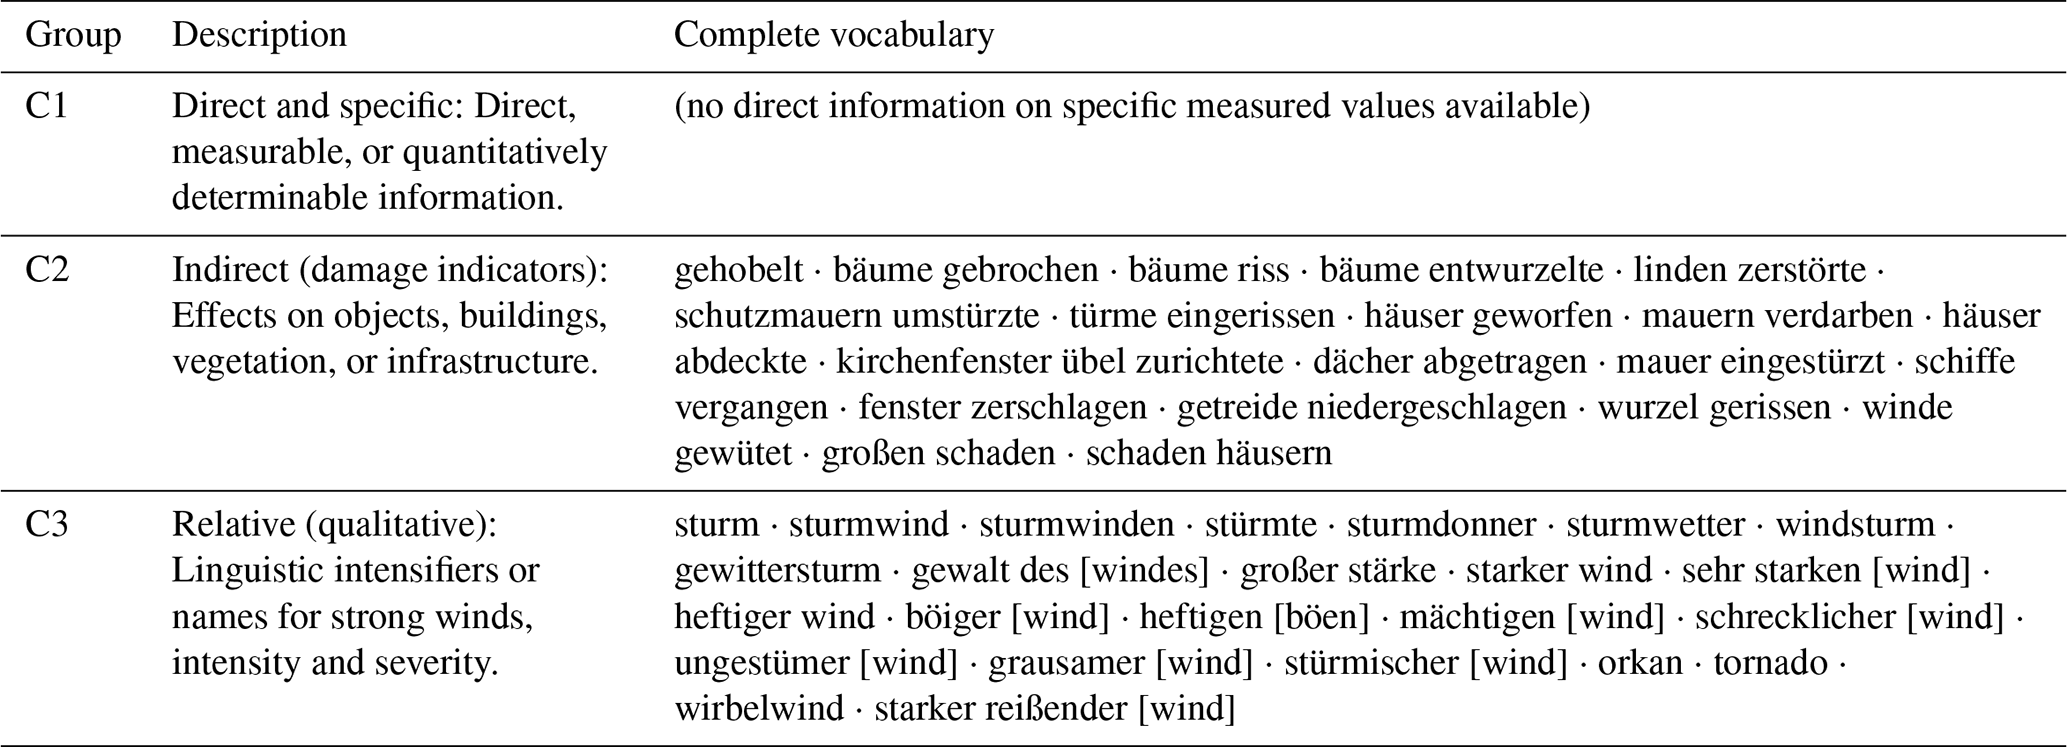
All words and phrases describing associated phenomena are extracted from the quotes. Each expression is assigned to one of the three evidence classes. This results in three lists, known as “silver labels”, which serve as linguistic indicators for the individual classes (see Table 3). A complete list of the silver labels can be found in the Appendix B2–B4.
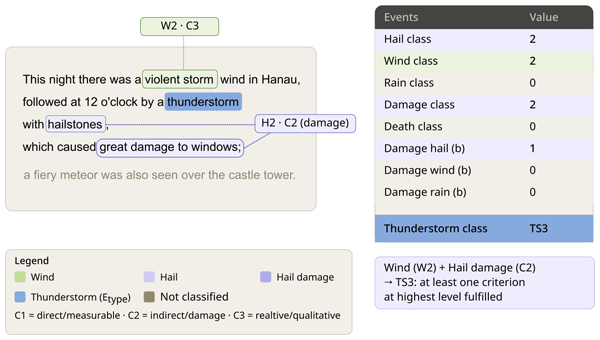
Figure 6 illustrates the classification process using a historical quote referring to a thunderstorm in Hanau. The example shows how the classification is derived from the text and how the silver labels are assigned to the evidence classes.
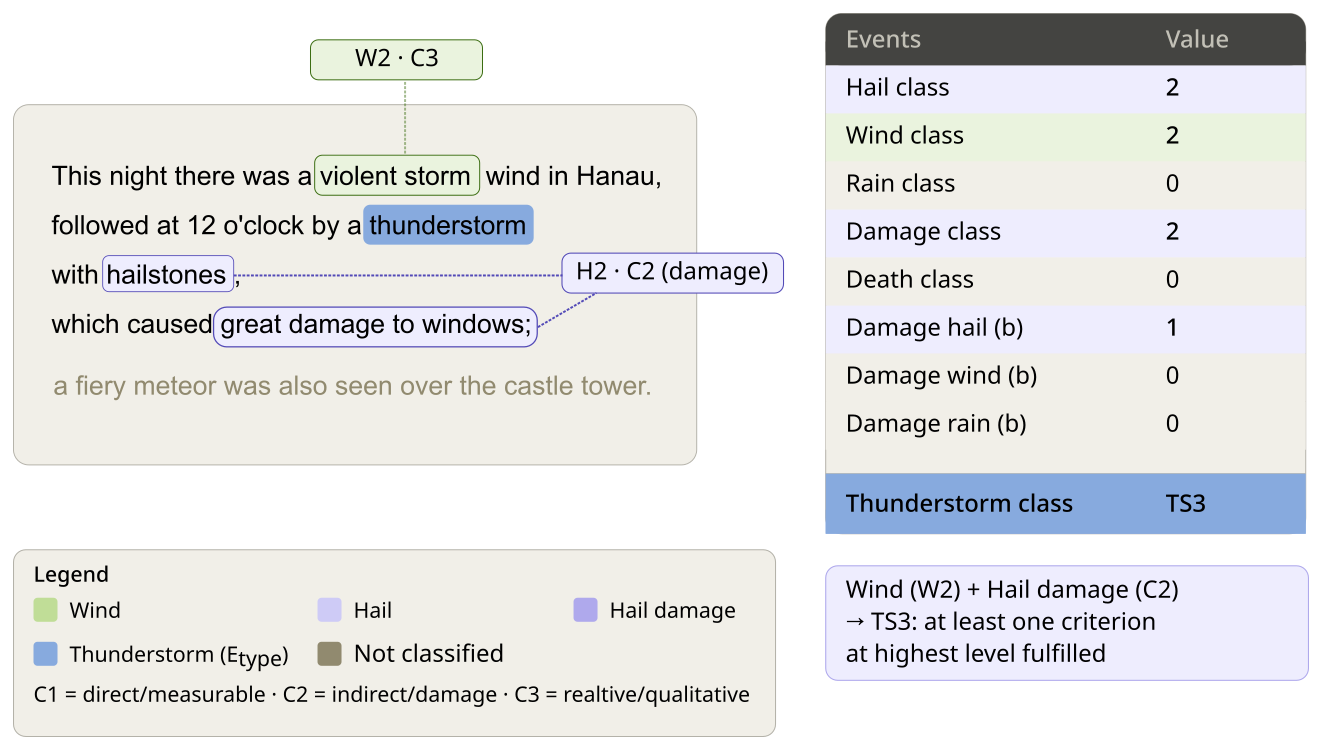
Figure 6Annotated classification of a thunderstorm event in Hanau. The associated phenomena are colour-coded: green = wind, purple = hail, blue = thunderstorm (event type), brown = unclassified. The evidence classes are specified for each annotation (C1 = direct/measurable, C2 = indirect/damage, C3 = relative/qualitative). On the right-hand side, the individual events and the hail event are coded as follows: events marked with (b) are binary (0 = absent, 1 = present). The final thunderstorm class (TS3) is derived from the wind class (W2, C3) and the hail event (H2, C2). Further text examples can be found in Table 2.
From these evidence classes, a four-level confidence index is derived for each quote as a measure of the uncertainty in interpretation. This is based on the number of robust evidence classes (C1 and C2) identified for each associated phenomenon along the impact pathways. If at least two such evidence classes are present, or if a single associated phenomenon is accompanied by classes C1 and C2, level 3 (“multiple evidence”) is assigned. A single evidence class C1 or C2 results in level 2 (“confirmed”). If only an evidence class C3 is present, level 1 (“qualitative”) is assigned. If no applicable evidence class can be assigned, level 0 (“no silver label”) is assigned. Table 4 summarises the confidence index and its derivation.
Table 4Four-level index for assessing the confidence of the classification.

3.3 Plausibility assessment against modern and historical reference series
3.3.1 Seasonal distribution of events
In order to evaluate the quality of the classified thunderstorm and hail events, we examine whether the data exhibit a physically plausible signal that corresponds to the known seasonality of convective events. This analysis assesses the suitability of the corpus as a training dataset for Transformer-based classification tasks. Since Transformer-based language models adopt the statistical patterns of their training data, any source-related biases in the annotations would be directly incorporated into the model. The presence of a realistic seasonal pattern therefore indicates that the annotated events reflect real convective activity and that the corpus provides a plausible training basis. However, this does not validate the classification of individual events, which is assessed separately on the basis of linguistic evidence.
The analysis is based on monthly aggregated count data for historical thunderstorm and hail events covering the period 1000–1817. Historical sources predominantly document only positive events, meaning that there are no systematic zero observations. As the observation density is therefore unknown, the analysis is based on relative monthly distributions. To this end, the monthly event counts for each year are normalised to an annual total of 1,
so that each year is described as a distribution across the calendar months.
The median generally provides a robust description of the typical seasonal pattern, as it is insensitive to outliers. However, in the case of highly incomplete time series with predominantly positive event reports, it is distorted, as months with rarely documented events often have zero values. This leads to a systematic downward bias and thus to an artificial flattening of the seasonal pattern. The mean of the normalised monthly proportions is therefore used as the central estimator for reconstructing the seasonal pattern over the year,
as it consistently represents the relative frequency of events across all years and preserves stable seasonal structures even when data are incomplete. Due to the prior annual normalisation, all years contribute equally to the estimate, so that the mean is not dominated by years with a high density of events, but primarily reflects the shape of the seasonal pattern.
The uncertainty of the reconstructed seasonal cycle is quantified over the years using bootstrap resampling (e.g. Wilks, 2019). 95 %-confidence intervals are derived from the resulting distributions. Stability is also tested for a time window with a high density of sources (1624–1654), which, due to its comparatively dense record, serves as an internal consistency check of the seasonal structure.
For external comparison, the reconstructed seasonal cycle is compared with DWD observational data for the normal periods 1961–1990 and 1991–2020. The 1961–1990 normal period is based on visual and auditory observations in accordance with the DWD Observer's Handbook (Deutscher Wetterdienst, 2014). The monthly totals of convective events serve as a reference. These are normalised annually following spatial aggregation, thereby ensuring the direct comparability of the relative monthly proportions. The agreement of the seasonal patterns is quantified using Spearman's rank correlation (ρ) and the root mean square error (RMSE).
In addition, the summer–winter ratio is calculated on the basis of the monthly aggregated event figures. To this end, the total number of events for the summer months of June to August (JJA) and the winter months of December to February (DJF) is determined for each year. December is assigned to the winter of the following year. Years with no documented winter events are excluded. The summer–winter ratio is calculated as the quotient of these totals. To improve comparability and stabilise the variance, the quotient is logarithmised. The resulting time series is then smoothed using a 20-year moving average (e.g. Wilks, 2019).
3.3.2 Class-specific annual distribution
In order to assess the stability of class-specific seasonal patterns, the seasonal distribution of thunderstorm events (TS1–TS3) and hail events (H1–H2) is analysed. The aim is to determine whether the classes exhibit a consistent ordering relation and whether this remains stable throughout the year.
Events are assigned to the calendar months in which they take place. If an event spans the end of one month and the start of the next (e.g. from 31 July into the following day), it is counted once in each of the months concerned. Events with unspecified dates or those lasting a very long time (e.g. “in the summer”) are not taken into account.
For each year y, each month m and each class c, the associated events are aggregated by class. The analysis is based on monthly relative proportions, so that only the class distribution is considered and no assumptions need to be made about absolute event frequencies or observation densities. The monthly class proportion is defined as
where denotes the number of events in class (c) in month (m) and year (y). The summation index c covers all classes of the respective event type (TS1–TS3, H1–H2). Thus, describes the proportion of a class out of all events observed in a specific month of a given year.
In order to limit the influence of individual years with a high density of events, the monthly class shares are first determined on an annual basis and then aggregated across the years as an unweighted mean. The seasonal class structure is estimated as the mean of the annual class shares,
where normalisation ensures that each year is included in the estimate with the same weighting, regardless of its event frequency.
The statistical uncertainty of the reconstructed class distributions is quantified over the years using bootstrap resampling. To this end, the monthly class distribution is recalculated for each bootstrap sample. Mean values and 95 % confidence intervals (2.5 % and 97.5 % quantiles) are determined from the resulting distributions.
To assess the stability of the seasonal ordering relation, the proportion of bootstrap samples in which the expected ordering relation is satisfied is also determined for each month. For thunderstorm events, the ordering relation
is used. Similarly, for hail events, the ordering relation
is applied. The resulting proportion describes the robustness of the complete ordering relation with respect to sample variability.
In addition, a weighted ordering index is calculated for the thunderstorm events, which evaluates the two sub-relations of the ordering relation separately: the relation TS1 > TS2 is weighted by 0.7 and the relation TS2 > TS3 by 0.3. A fully satisfied ordering relation (TS1 > TS2 > TS3) thus yields a value of 1, whilst partially satisfied orders yield values of 0.7 and 0.3 respectively. The index is averaged across the bootstrap samples and enables a nuanced assessment of the seasonal class structure, particularly in months with low event density or sparsely populated classes.
3.4 Influence of source type on classification
Any potential selection or reporting biases are tested for independence using a chi-squared test (e.g. Wilks, 2019). This involves analysing the relationship between source type and thunderstorm class (TS1–TS3) or hail class (H1–H2). The analysis is based on a contingency table in which the event counts are aggregated for all combinations of source type and class. Multiple mentions of individual sources are taken into account accordingly.
Under the null hypothesis (H0), it is assumed that source type and classification are independent of one another. In addition to the chi-squared test statistic (χ2), Cramér's V is calculated as a measure of effect to quantify the strength of the association. In addition, the standardised residuals are analysed to identify the combinations of source type and class that contribute most significantly to the deviation from independence.
3.5 Fine-tuning the transformer-based language model
The classified and validated datasets form the basis for fine-tuning the Transformer-based language model. The pre-trained language model mDeBERTa V3 Base, which is based on multilingual text data and exhibits a high degree of context sensitivity, is used to classify descriptions of thunderstorm and hail events. The models are adapted to the classification task (TS0–TS3 and H0–H2) through fine-tuning. The dataset is split into training, validation and test sets in a ratio of , with the split being stratified to preserve the class proportions.
The split is only stratified by class. We do not apply any grouping by source, which means that quotations from the same historical source may appear in both the training and test datasets. Therefore, the results presented describe how consistently the model reproduces the classification scheme within this corpus.
A two-stage hyperparameter search is carried out to identify suitable training parameters. In Phase A, an exploratory random search strategy is applied. To this end, a combinatorial search space is defined, consisting of learning rates , , , maximum sequence length {128,256}, label smoothing factor {0.0,0.05} and learning rate schedulers {linear,cosine}, resulting in a total of 24 possible hyperparameter combinations.
Twelve combinations are randomly selected from this search space and trained using a fixed seed. This sample corresponds to half of the entire search space and serves as an efficient exploratory coverage without the need to fully evaluate all possible configurations. For all training runs, a batch size of 16, a weight decay of 0.01, a warm-up rate of 0.06 and a training duration of five epochs are used. Training is carried out using mixed-precision (fp16) on GPU hardware. The models are evaluated after each epoch using the validation data, with the best model for each configuration selected based on the F1 score.
In Phase B, the three highest-performing hyperparameter configurations from Phase A are selected and retrained using three different random seeds for each. This allows the stability and reproducibility to be quantified in relation to stochastic influences in the training process. For each configuration, the mean and standard deviation of the F1 score are calculated across the three runs.
Finally, the models from Phase B are evaluated on the validation and test datasets using F1 scores and accuracy. For qualitative analysis, a confusion matrix is also used to identify systematic misclassifications of thunderstorm and hail events.
4.1 Seasonal Cycle
The normalised monthly proportions of thunderstorm and hail events show a pronounced seasonal cycle (Fig. 7). For both types of event, the peak occurs during the summer months of June to August (JJA). The annual pattern is characterised by an increase in spring, a summer peak and a steady decline in autumn.
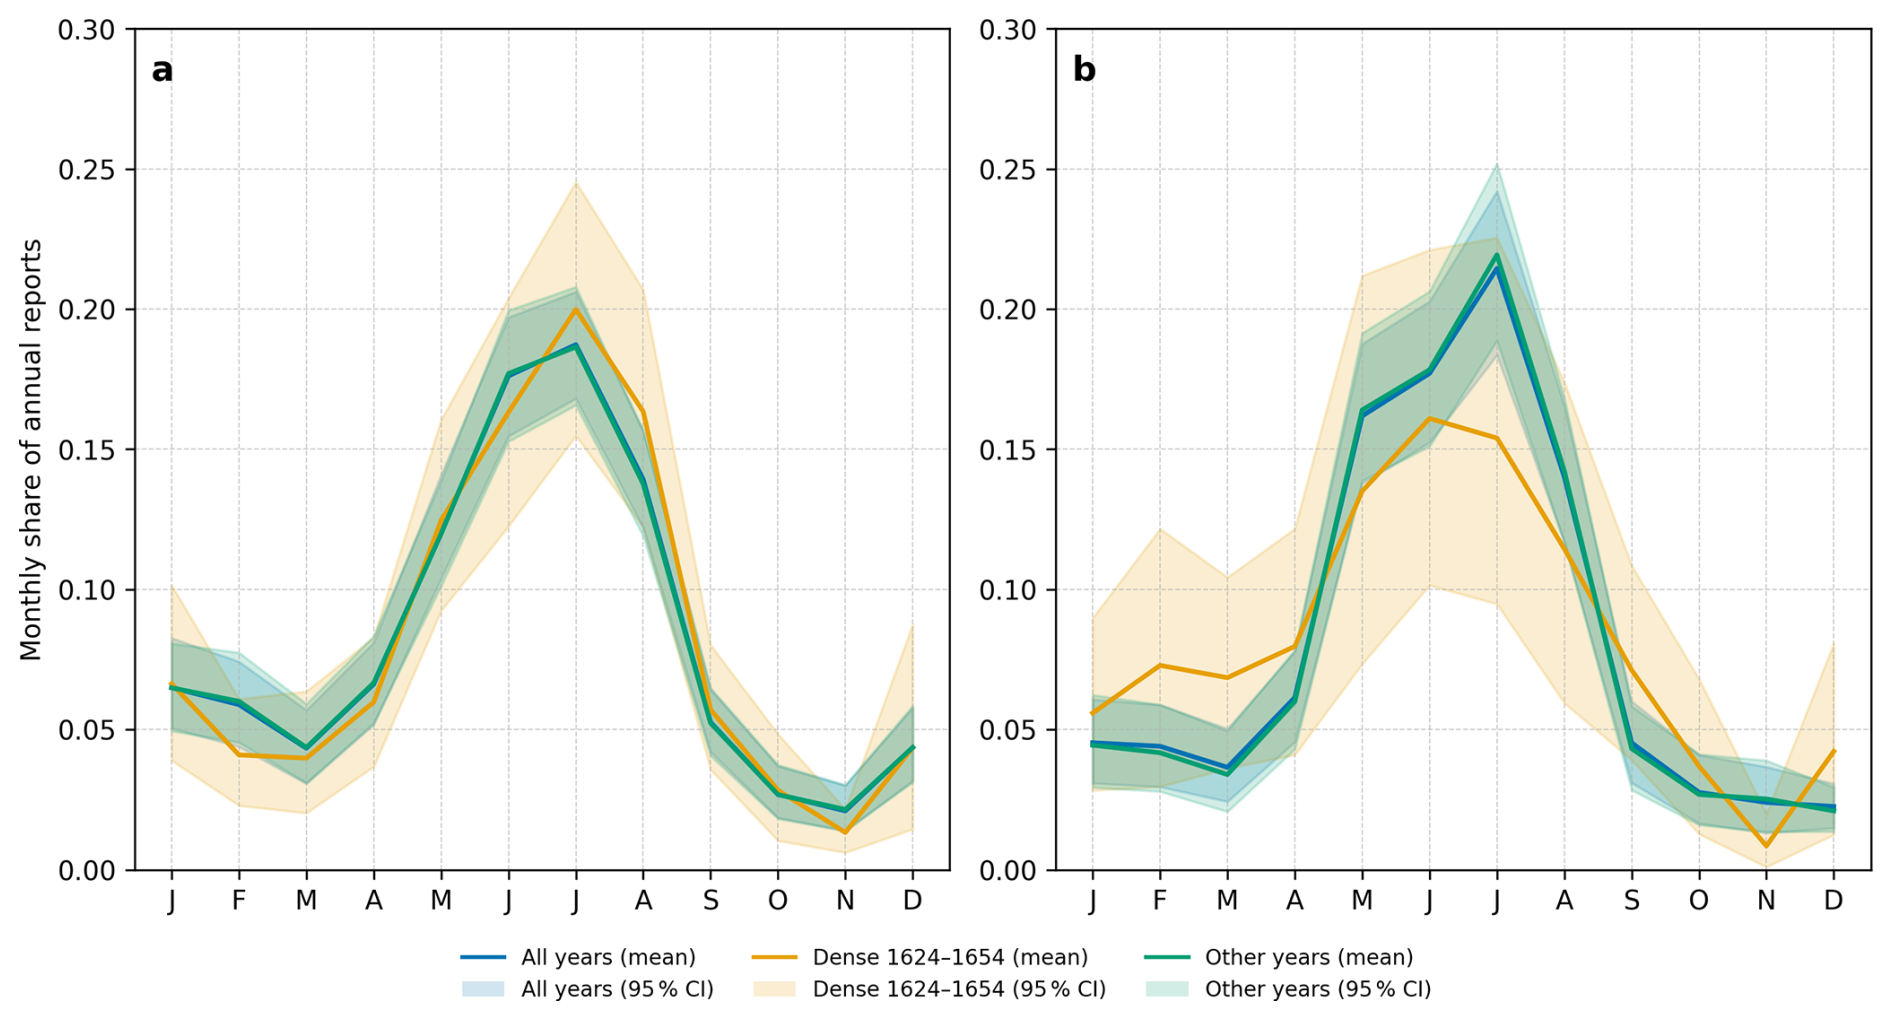
Figure 7Seasonal cycle of thunderstorm and hail events. Monthly values represent the mean fraction of annual activity (annual total = 1).
During the winter months (December, January, February), the proportions are low but consistently positive. The transitional seasons show reduced proportions compared with the summer half-year.
The annual pattern for the period (1624–1654) corresponds structurally to that of the entire period. The distribution pattern remains unchanged, whilst differences in seasonal amplitude (summer–winter contrast) are evident. Overall, this indicates a high degree of temporal stability in the relative monthly distribution.
Hail events also peak during the summer months. Compared with thunderstorm events, however, the seasonal increase begins earlier, with higher frequencies already evident in late spring (particularly March and April).
A comparison with the DWD observational data for the normal periods 1961–1990 and 1991–2020 (see Fig. 8) reveals a correlation between the seasonal patterns of normalised monthly thunderstorm frequencies. For the entire study period, the Spearman rank correlations between thunderstorm events and the DWD reference data range from 0.66 to 0.78 (RMSE ≈ 0.05), depending on the normal period and search radius. For the period 1624–1654, the correlations are higher, ranging from 0.74 to 0.86, whilst the deviations are smaller (RMSE ≈ 0.03 to 0.04). For hail events, the correlations range from 0.78 to 0.93 for the entire period (RMSE ≈ 0.03 to 0.04) and from 0.83 to 0.92 for the period 1624–1654 (RMSE ≈ 0.02 to 0.03). The results are robust to the choice of search radius (10 vs. 50 km around the historical event locations). Compared with the normal period 1991–2020, the correlations are consistently higher than when compared with 1961–1990.
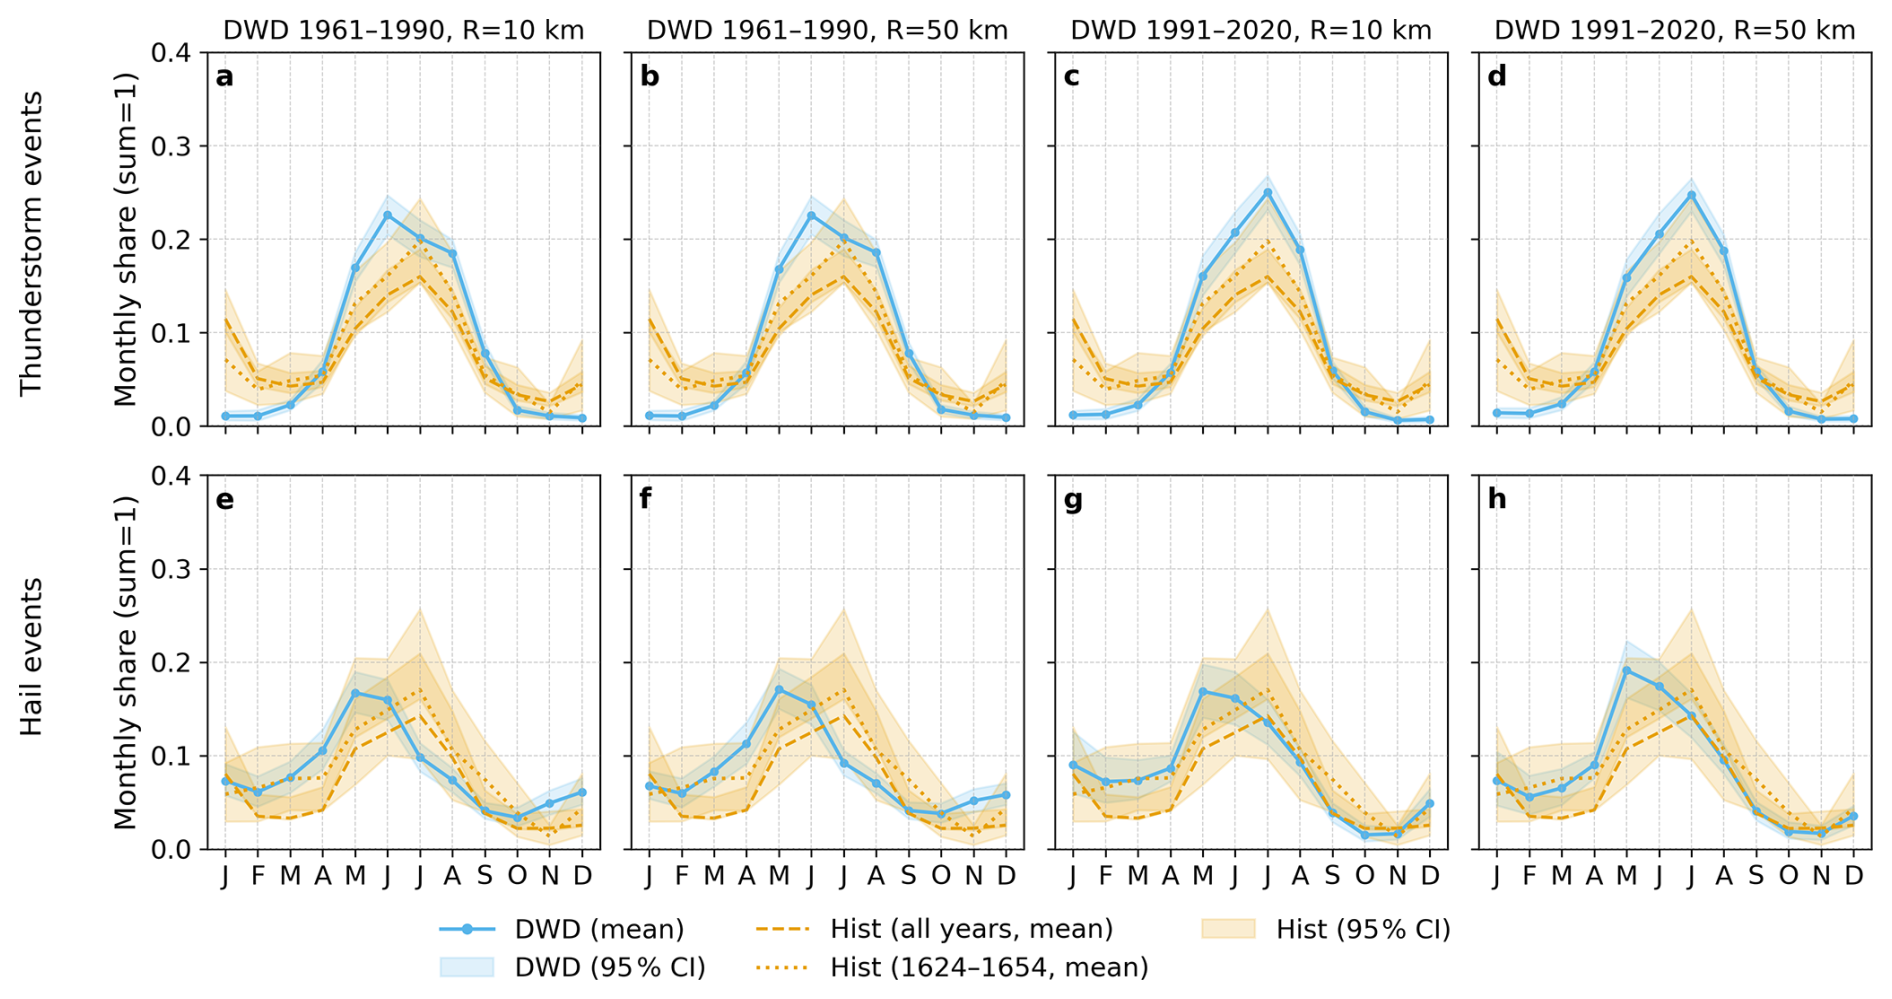
Figure 8Seasonal cycle of normalised monthly frequencies of thunderstorm and hail events from the study, compared with DWD observations for the normal periods 1961–1990 and 1991–2020. The DWD stations are selected based on their distance from the historical event locations (radius of 10 or 50 km). All values are normalised to the respective annual total, so that the relative monthly proportions are directly comparable.
The logarithmic summer-winter ratio (JJA DJF) shows predominantly positive values for thunderstorm events over the study period (Fig. 9), thus indicating that activity is predominantly concentrated in the summer. The smoothed time series (20-year average) remains above the zero line over long periods and generally fluctuates between approximately 1.0 and 2.0. Elevated values occur particularly in the late 16th and early 17th centuries, whilst phases of reduced summer activity are evident in the mid-16th and early 17th centuries. Individual years are significantly smoothed out by the averaging process and have only a minor influence on the long-term trend.
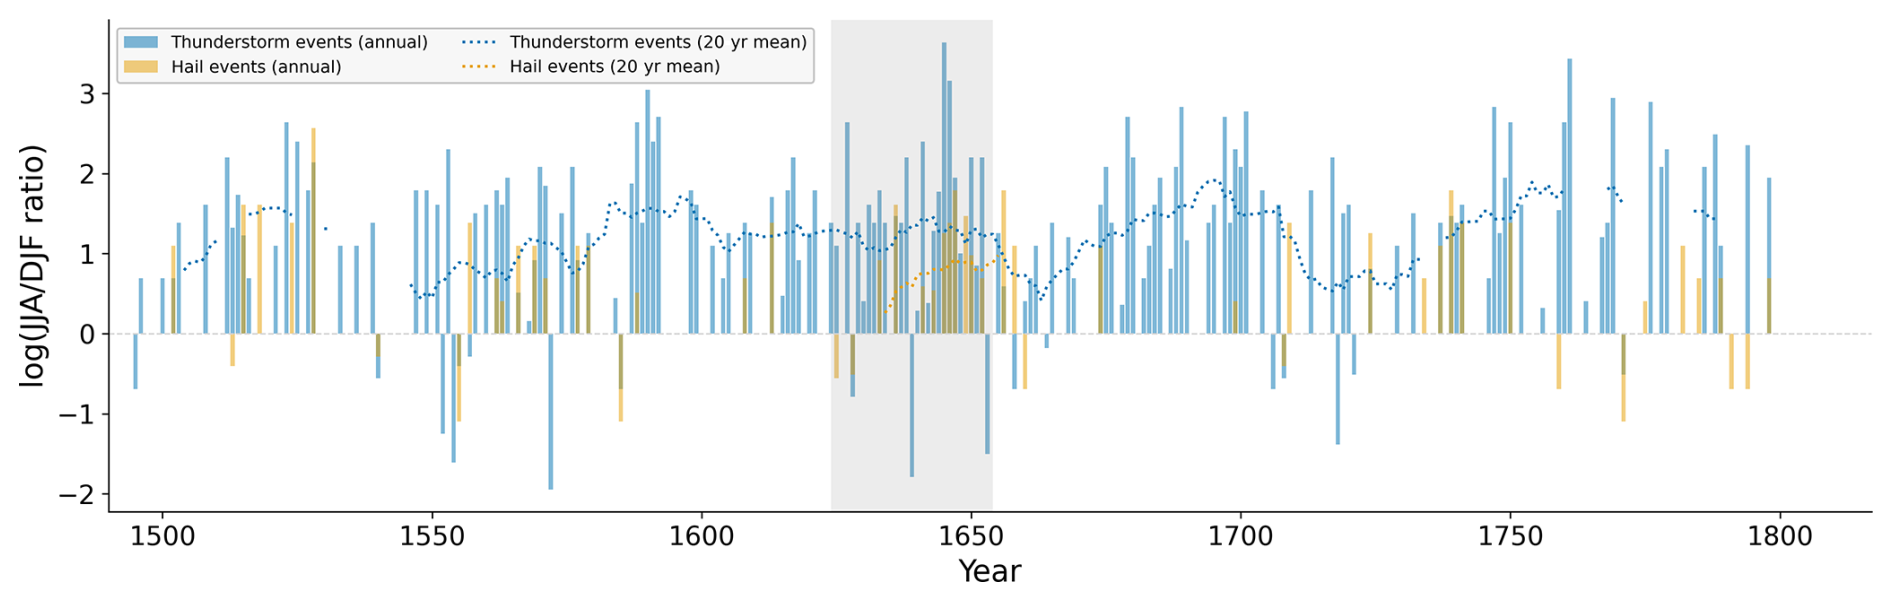
Figure 9Annual logarithmic summer-winter ratio (JJA DJF) of historical thunderstorm and hail events from 1490 onwards. The dotted lines show a centred 20-year moving average. Gaps indicate periods with fewer than ten valid annual values. The dashed horizontal line marks a balanced ratio between summer and winter events. The shaded area indicates the period 1624–1654.
For hail events, the seasonal signal is weaker overall. The logarithmic summer–winter ratio shows greater variation and, in the smoothed curve, lies predominantly in the range between approximately 0.3 and 1.0. Values close to zero or below occur from time to time, particularly in the early phase of the time series. From the second half of the 16th century onwards, there is a phase of elevated values, followed by an overall moderate and comparatively stable seasonal ratio well into the 18th century.
The strength of the seasonal signal varies with the number of documented events (Fig. 10). When the individual event types are considered separately, the monthly time series are characterised by numerous months with no documented events. Elevated monthly values occur sporadically and are often limited to individual years. In these cases, the seasonal distribution is only discernible to a limited extent.
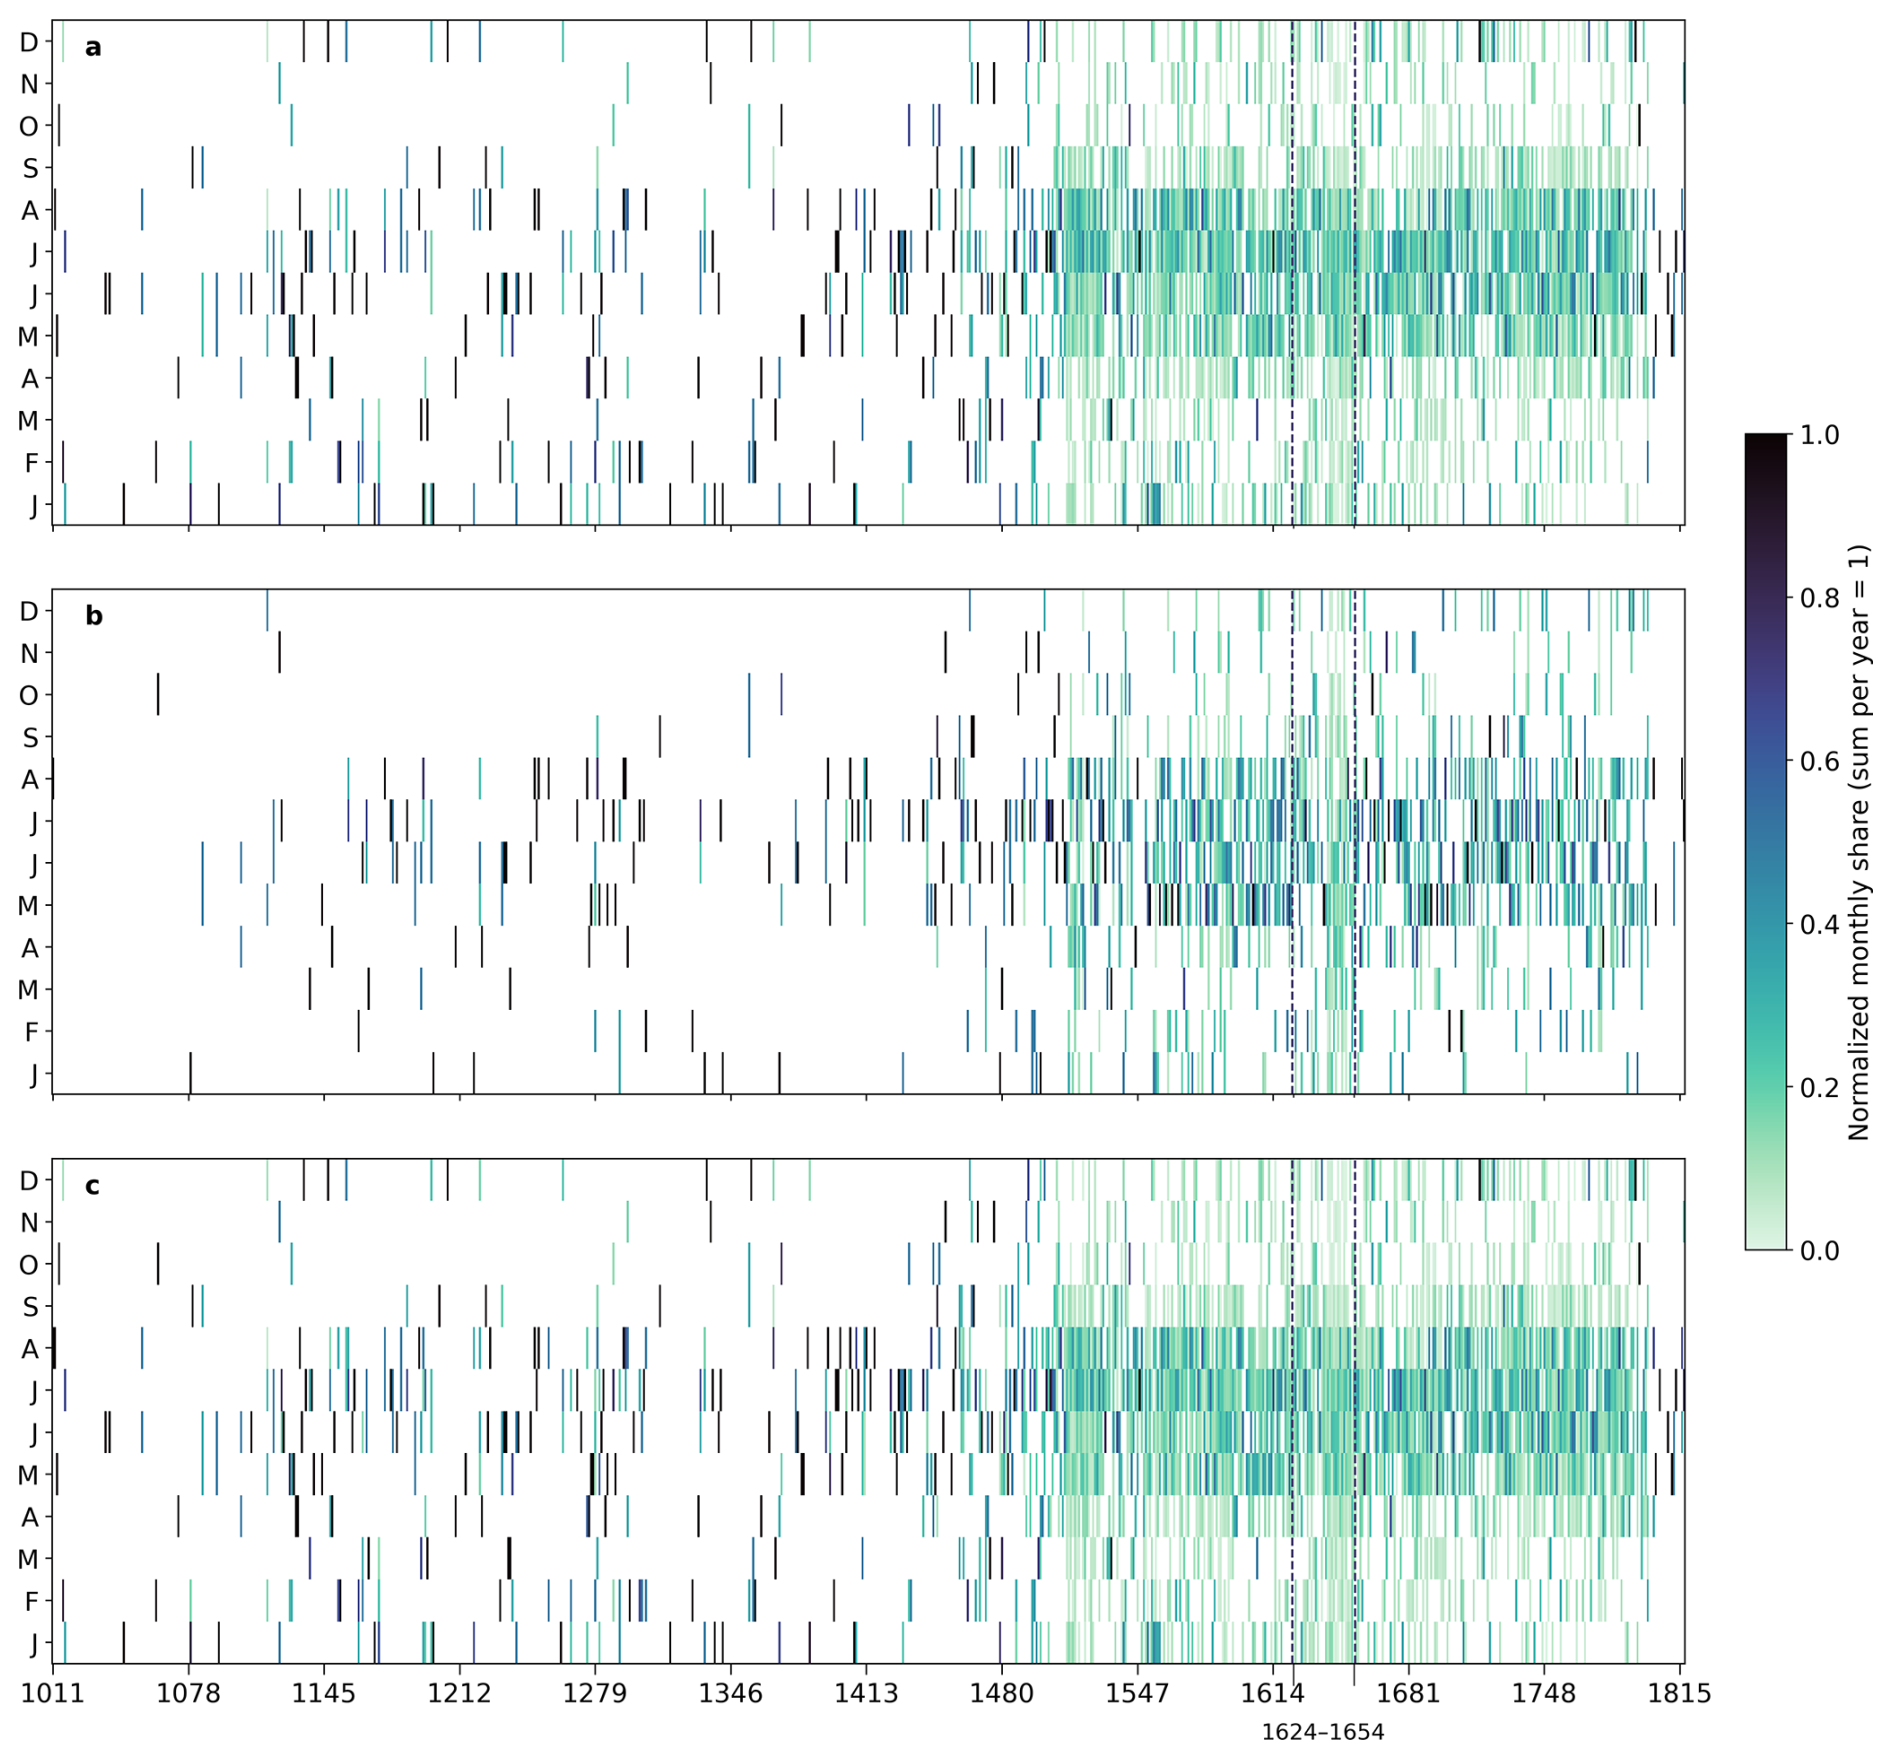
Figure 10Calendar heatmaps showing the annualised monthly proportions of thunderstorm and hail events for the entire study period. The relative monthly proportions are shown, with the number of events in each year normalised to an annual total of 1, so that the seasonal distribution can be compared independently of the absolute frequency of events. Panels: (a) thunderstorm events, (b) hail events, (c) both combined. The colour intensity corresponds to the normalised monthly proportion. The dotted vertical lines mark the boundaries of the period with a particularly high density of sources (1624–1654).
When thunderstorm and hail events are analysed together, the number of events recorded each month increases. The resulting monthly time series shows a clear distinction between the summer and winter months, with a higher proportion of events occurring between June and August, and a very low number of events occurring during the winter months. This pattern remained consistent throughout much of the study period.
Even when the corpus is stratified, the seasonal cycle of thunderstorm events remains intact. The seasonal profiles show a very high degree of consistency across the four largest language groups (Latin, Early New High German, New High German and Contemporary German) (Spearman's ρ=0.82–0.94). There is also a high degree of agreement between the source types (median ρ=0.82). The seasonal signal is therefore not tied to any particular language stage or source type. For hail events, the agreement between source types is lower, which is consistent with the relationship between source type and hail class described in Sect. 4.4.
4.2 Validation of linguistic evidence
The confidence index clearly distinguishes the classes from one another and rises monotonically between classes TS1 to TS3 and H1 to H2. Classes TS3 and H2 consistently show high values. As expected, the TS1 and H1 classes are dominated by level 0. In the TS2 thunderstorm class, the distribution of evidence classes is mixed, with levels 0 and 1 dominating. This is the class with the greatest uncertainties (see Table 5).
Table 5Distribution of the confidence index by thunderstorm and hail class. Higher levels indicate a better, more reliable classification. The “robust” column combines levels 2 and 3 of the index. Evidence class C1 is highlighted. Ø is the average of the evidence classes per quote.
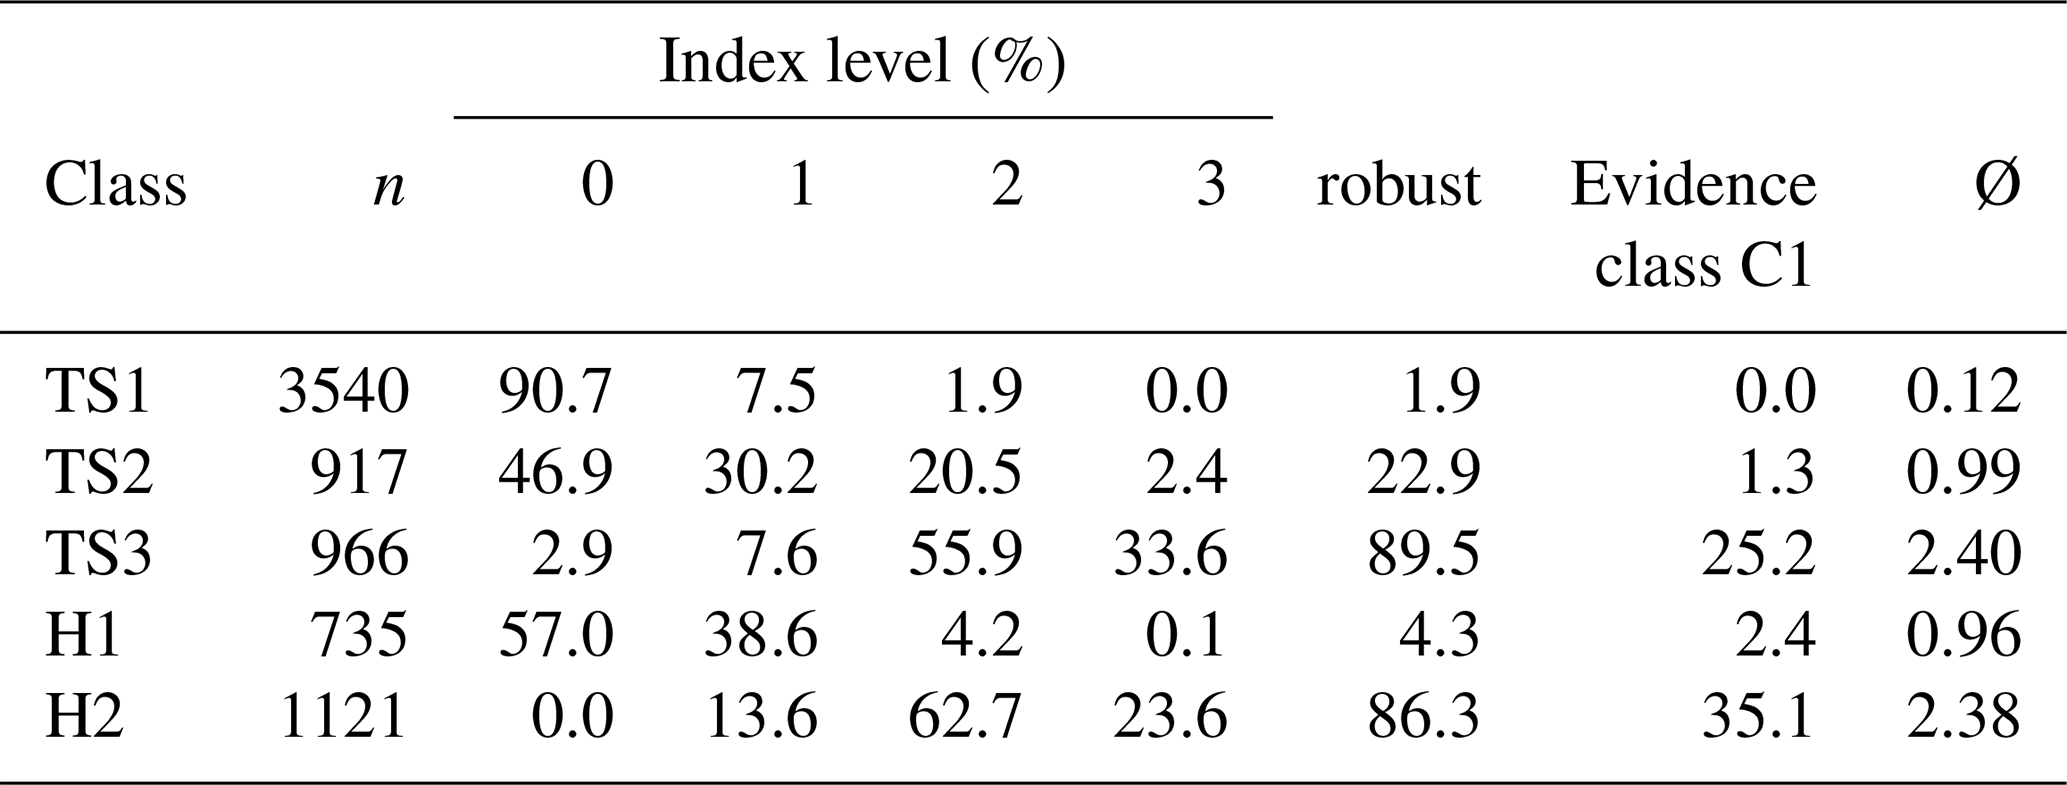
Evidence class C1, which is characterised primarily by the size of the hailstones, contributes significantly to the increase in the confidence index. This proportion rises with the thunderstorm or hail class. It occurs in 25.2 % of quotes in class TS3 and 35.1 % in class H2, whilst it is virtually never found in the lower classes (TS1: 0.0 %, H1: 2.4 %).
A small proportion of the TS3 and H2 classes must be classified as uncertain (levels 0 and 1). For TS3, this amounts to 10.5 %, and for H2, 13.6 %. Thunderstorm events are predominantly described in qualitative terms. In 2.9 % of thunderstorm events, there is no clear link between the event and the reported damage. The uncertain hail events are described in qualitative terms, but there is no information on their scale or any clearly identifiable damage.
If we look at the confidence index over the centuries, we can see that the proportions of the index levels remain relatively constant (see Fig. 11).
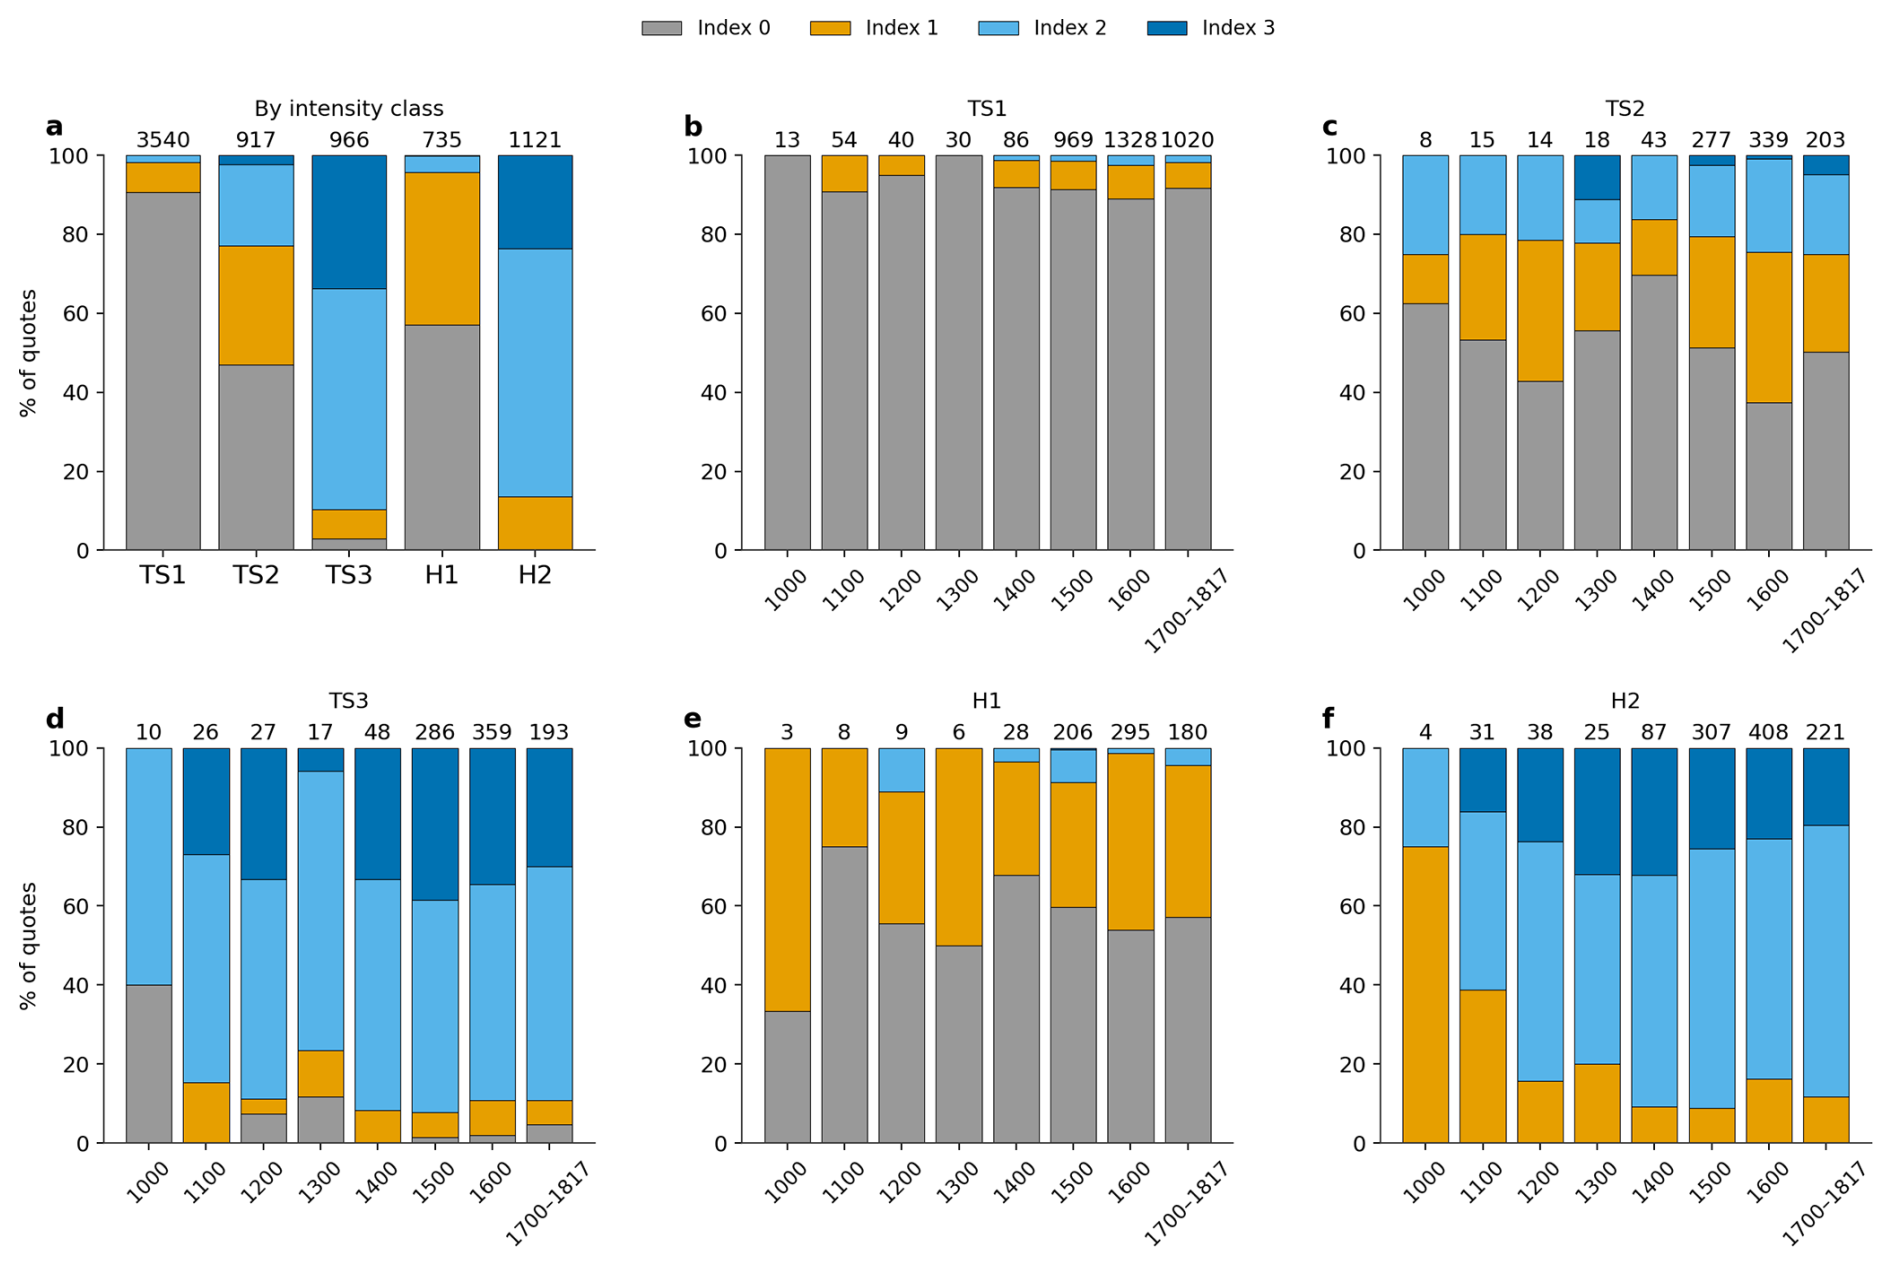
Figure 11Distribution of the confidence index (levels 0–3) by intensity class and over time. (a) Proportions of index levels by class (TS1–TS3, H1–H2), (b–f) temporal development of the index levels by class over the centuries. The final interval combines the 1700s and 1800s (up to 1817), as there are only a few quotes available for this period. Level 0 = no silver label, 1 = qualitative only (C3), 2 = confirmed (one evidence class C1 or C2), 3 = confirmed multiple times (at least two evidence classes C1/C2).
4.3 Seasonal cycle of thunderstorm and hail event classes
The weakest thunderstorm class, TS1, dominates throughout the entire study period in every month. The average monthly proportions range from around 53 % to 71 %. The proportion of class TS2 ranges from 12 %–34 %, whilst the strongest class, TS3, accounts for between around 10 % and just under 29 %. Higher proportions of TS3 occur particularly in the summer months, peaking in June (28.8 %). From November to April, the order is TS1 > TS2 > TS3. From May to October, TS3 achieves similar or higher average proportions than TS2.
The 95 %-confidence interval for the monthly class proportions is approximately ±4 %–11 %. It is narrowest during the eventful summer months and widest in October and November. The ordering relation TS1 > TS2 > TS3 remains almost consistently above 95 % from November to April, but falls to almost zero in the summer, indicating systematic violations of the ordering relation. In the transitional months of September and October, it stands at just under 50 %. The weighted ordering index, by contrast, remains high throughout the year, standing at around 70 % during the summer months and at 83 %–85 % in September and October. In summer, the ordering relation TS1 > TS2 is almost always satisfied, whilst TS2 > TS3 is almost entirely absent.
The seasonal pattern of thunderstorm classes is broadly similar for the period 1624–1654. TS1 is the dominant class in all months except February, with average proportions ranging from around 52 % to 79 %. In February, however, TS2 reaches its highest proportion at 51 %. TS2 and TS3 show greater monthly variation than in the overall dataset, particularly during the winter months. The 95 %-confidence interval is significantly wider in some cases during this period, due to the smaller number of years. Support for the ordering relation is significantly reduced during the summer half-year, falling below 20 % in July and August. Even in February, support is only slightly higher at 16 %, due to the high proportion of TS2. The weighted ordering index predominantly lies in the range of approximately 70 %–95 %, with the exception of February (41 %).
A distinct seasonal pattern in the class distribution is also evident for hail events. Over the entire period, weaker hail events of class H1 dominate during the winter and transitional months, accounting for around 65 %–86 %. In the summer months, the distribution shifts significantly towards stronger events (H2), whose proportion reaches around 77 %–82 % in the months of June to August. The 95 %-bootstrap intervals range from approximately ±5 %–14 %, being narrowest in the summer months.
This pattern persists over the period 1624–1654. The ordering relation H1 > H2 is satisfied 95 % of the time in the winter months, drops significantly in the summer months and is virtually non-existent in August. This reflects the strong seasonal shift in the class proportions (see Fig. 12).
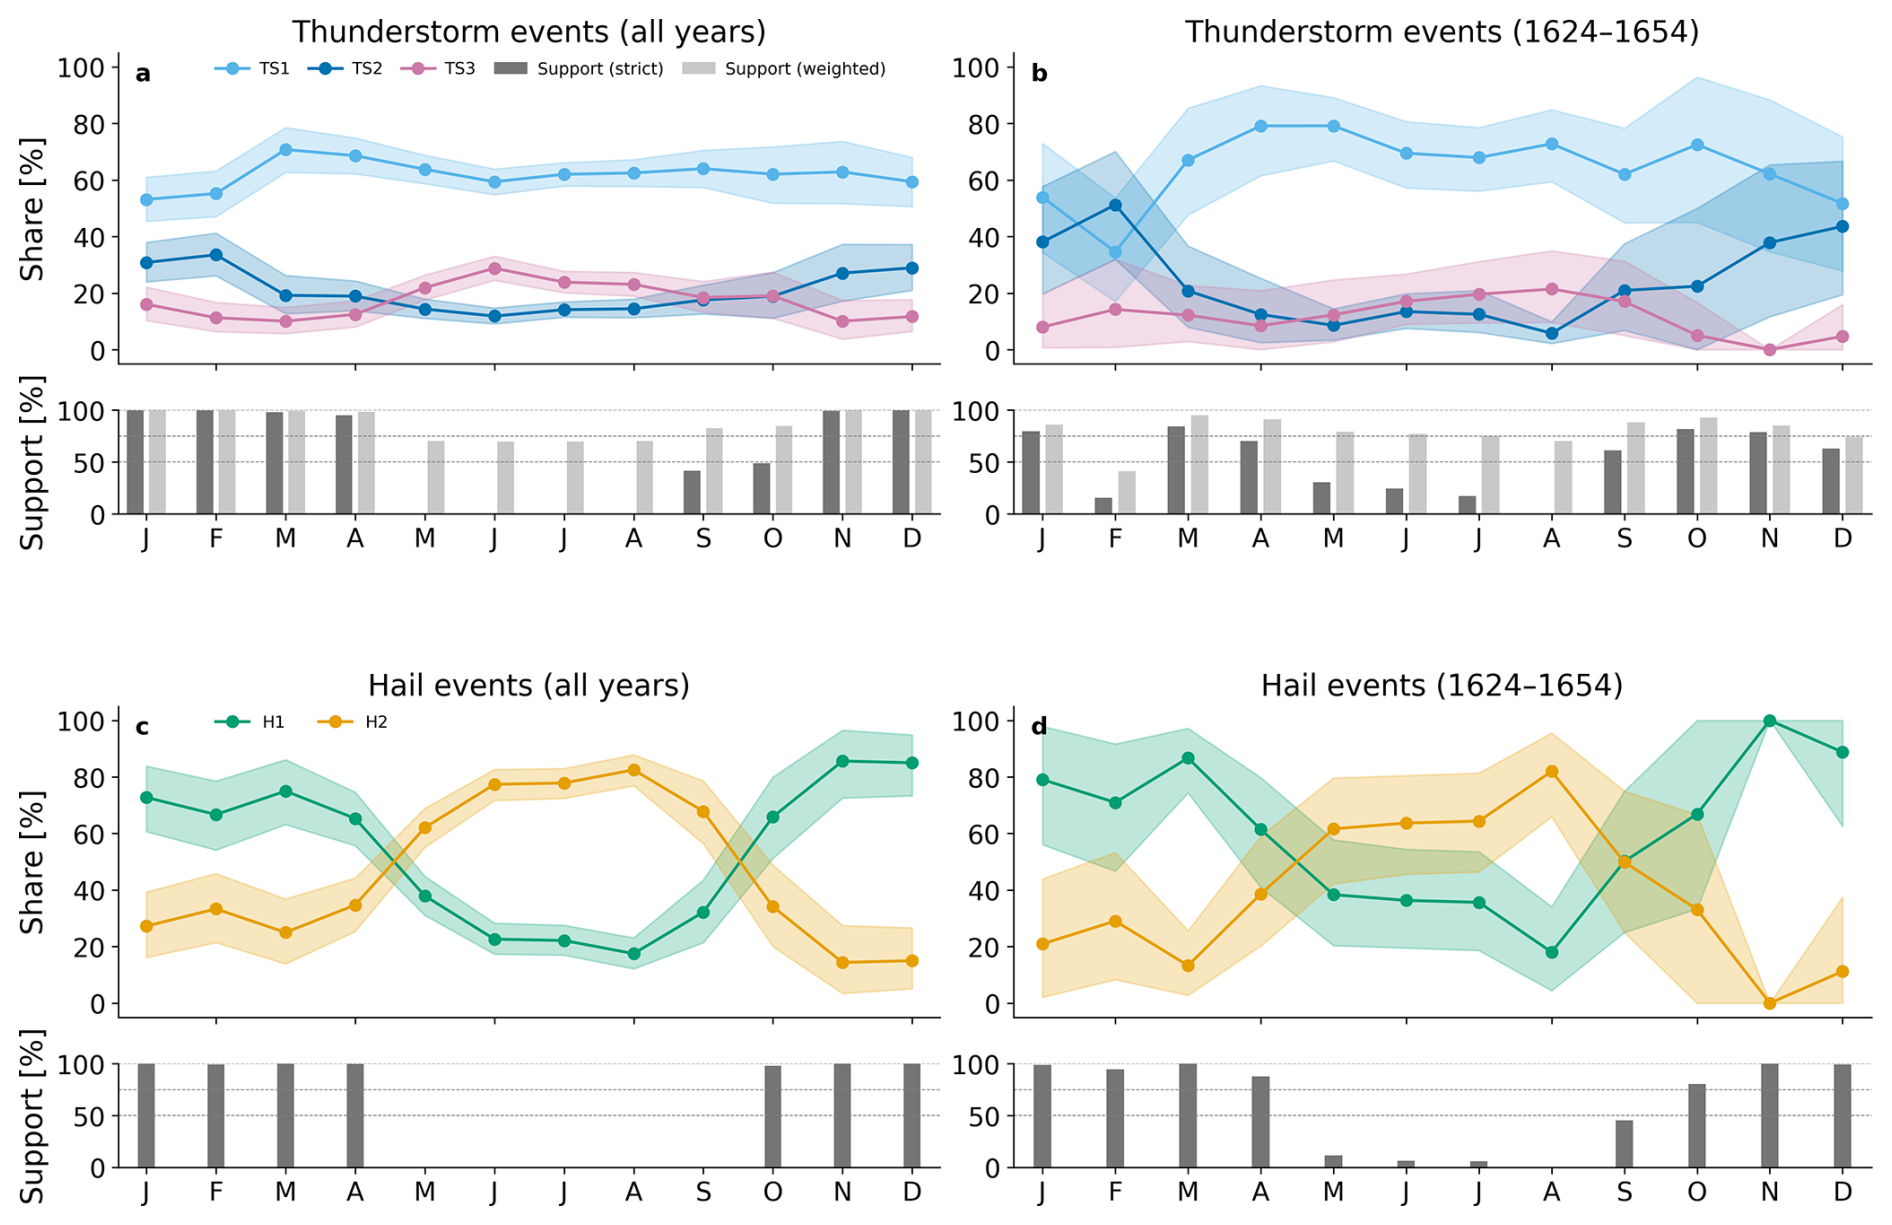
Figure 12Distribution of class proportions for thunderstorm and hail events over the entire study period and the period 1624–1654. The monthly class proportions (lines) are shown with 95 %-confidence intervals (shading), calculated from monthly distributions normalised on an annual basis. The lower panels show the proportion of bootstrap samples in which the expected ordering relation, based on the resampled monthly proportions, is satisfied.
4.4 Influence of source types on event classes
The chi-squared test for independence reveals a highly significant correlation between source type and intensity class for thunderstorm events (χ2=479.1, df=22, p<0.001). The effect size is in the moderate range (Cramér's V = 0.21).
The standardised residuals show clear differences between the source types: the weather records show a strong over-representation of class TS1 () and an under-representation of TS3 (). Chronicles, on the other hand, show higher proportions of the strongest class, TS3 (), alongside an under-representation of TS1 (). Handwritten diaries are characterised by a marked under-representation of TS3 (), whilst newspapers and historiographical works show increased proportions of TS3 ( and , respectively). These deviations contribute significantly to the overall χ2 value (Fig. 13).
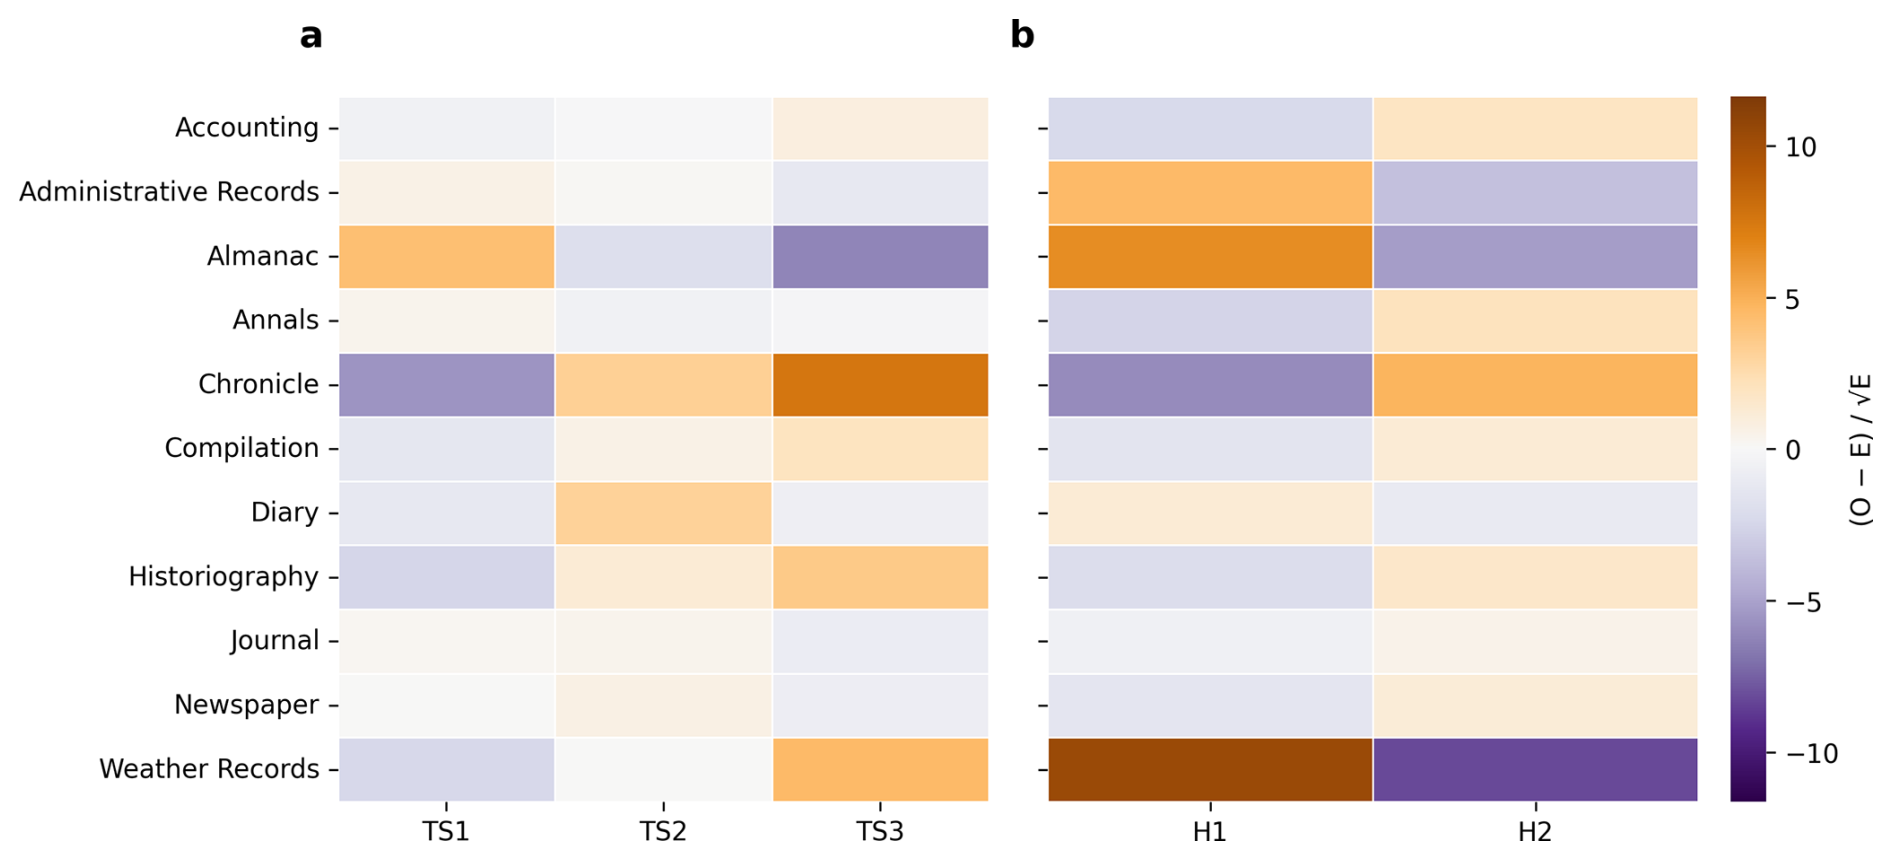
Figure 13Standardised residuals from the chi-squared tests for the relationship between source type and event class for thunderstorm events (left, TS1–TS3) and hail events (right, H1–H2). The residuals are shown for each combination of source type and class. Positive values indicate over-represented combinations, whilst negative values indicate under-represented combinations relative to the frequency expected if there were no dependence.
For hail events, too, there is a highly significant correlation between source type and intensity class (χ2=373.2, df=10, p<0.001). The effect size is significantly greater here than for thunderstorm events (Cramér's V = 0.43).
The residuals show a similar, yet more differentiated pattern: the weather records are characterised by a marked over-representation of H1 () and an under-representation of H2 (). Chronicles show increased proportions of H2 (), whilst H1 is underrepresented (). Almanacs also show increased proportions of H1 () and reduced proportions of H2 (). Administrative records are also characterised by an over-representation of H1 (). These deviations account for a large proportion of the observed χ2 value (Fig. 13).
4.5 Transformer-based language model
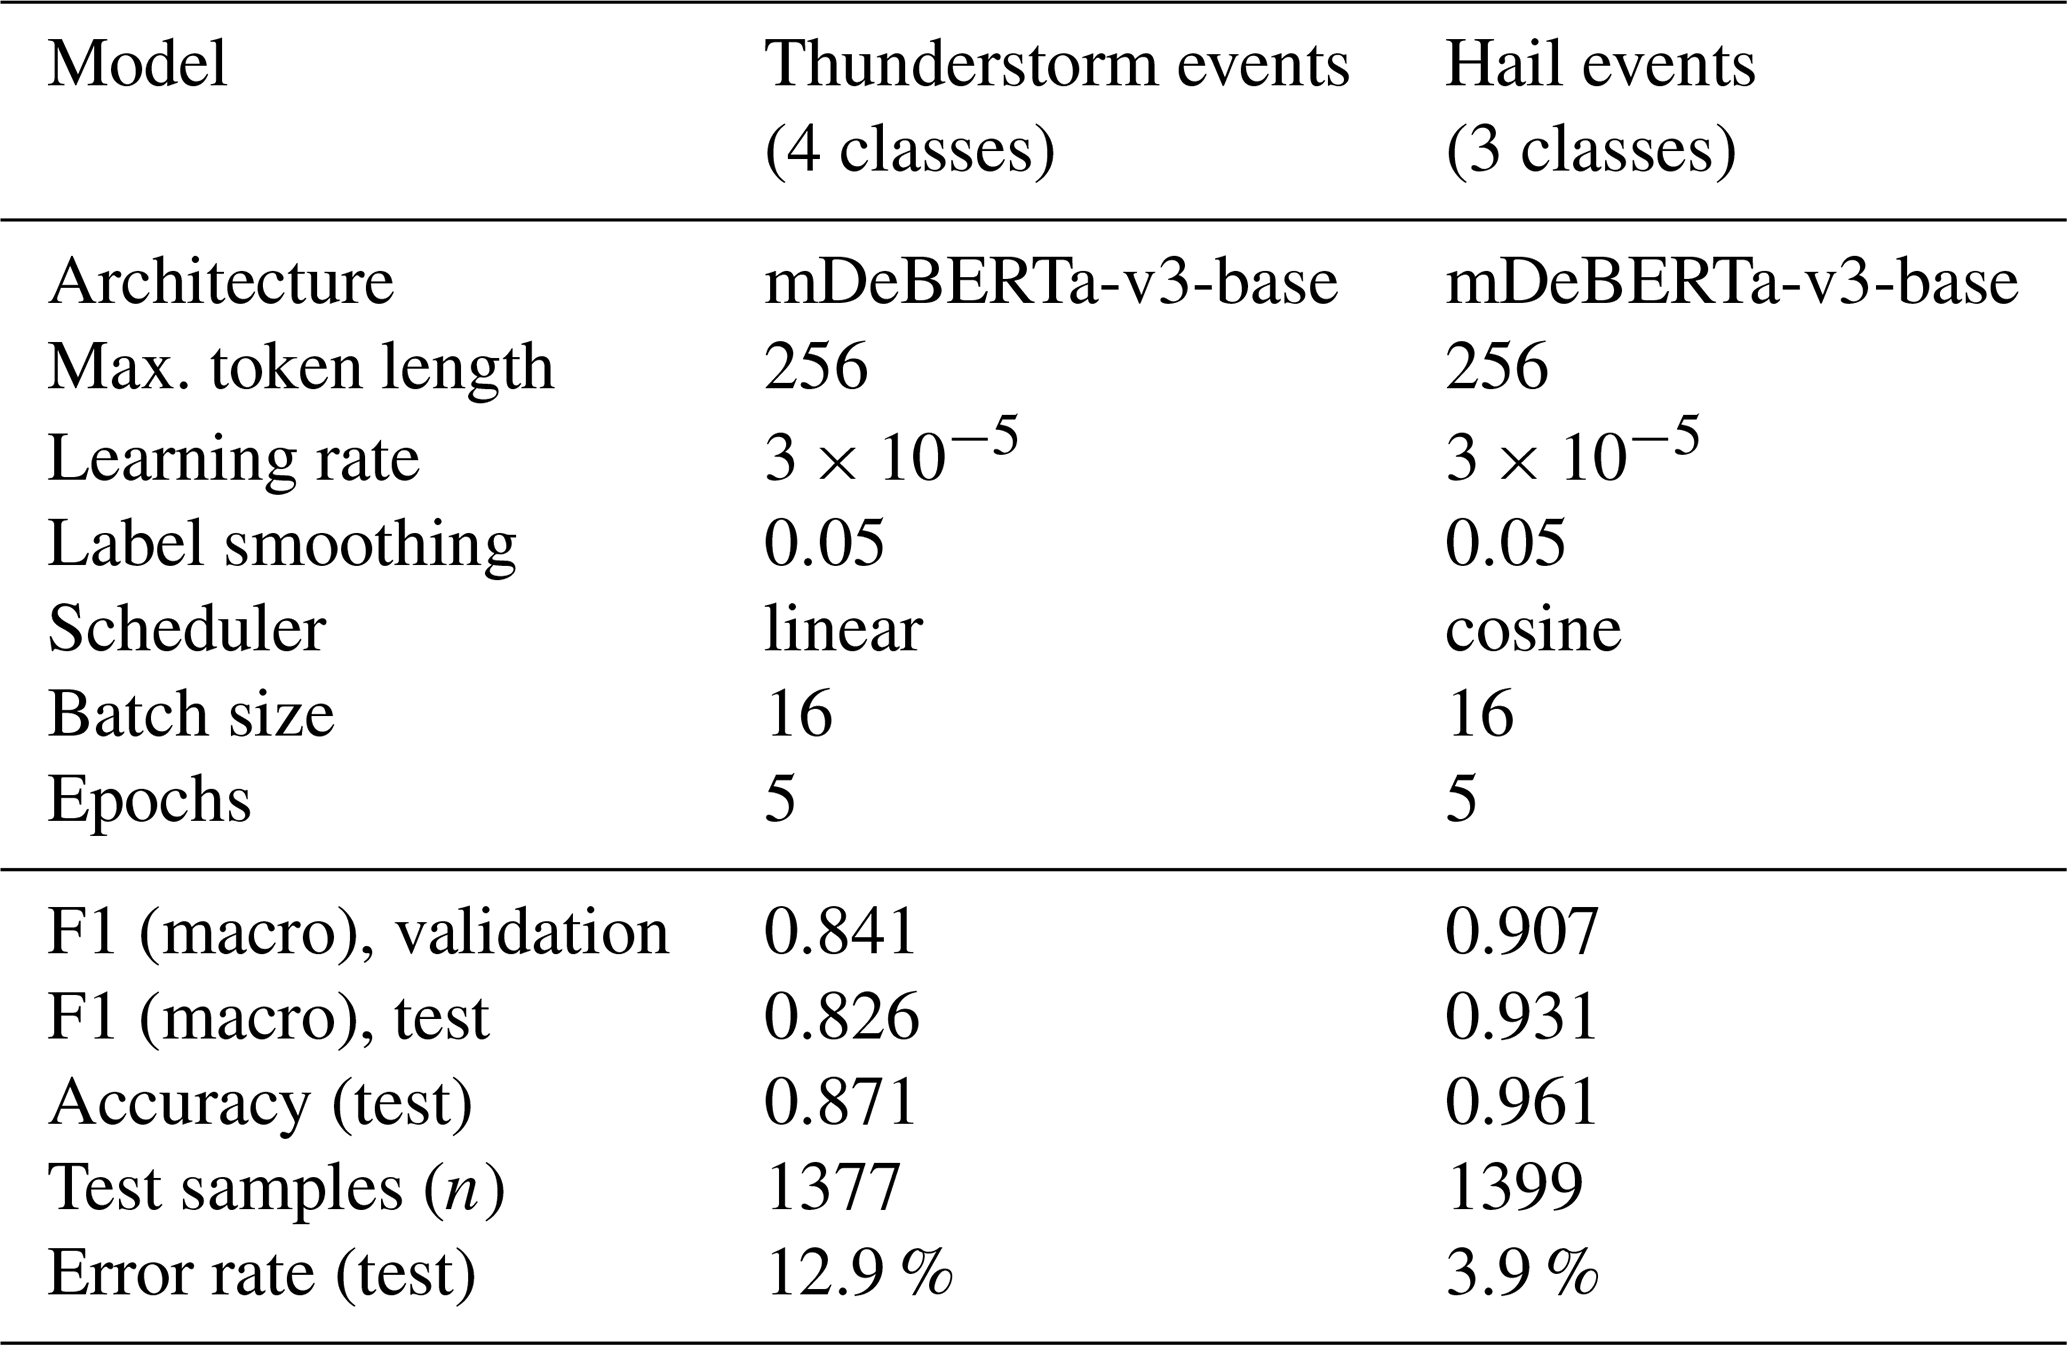
Both classification models (ThunderstormBERT, HailBERT) are based on the same Transformer architecture (mDeBERTa-v3-base). The hyperparameters given in Table 6 correspond to the optimal settings identified during model development for the respective classification task. Despite having an identical architecture, there are differences in the training setup, particularly with regard to the learning rate scheduler.
Table 6Key metrics of the language models for classifying historical thunderstorm and hail events: ThunderstormBERT and HailBERT.
ThunderstormBERT's learning curves show stable convergence after around five epochs, with no signs of significant overfitting (Fig. 14).
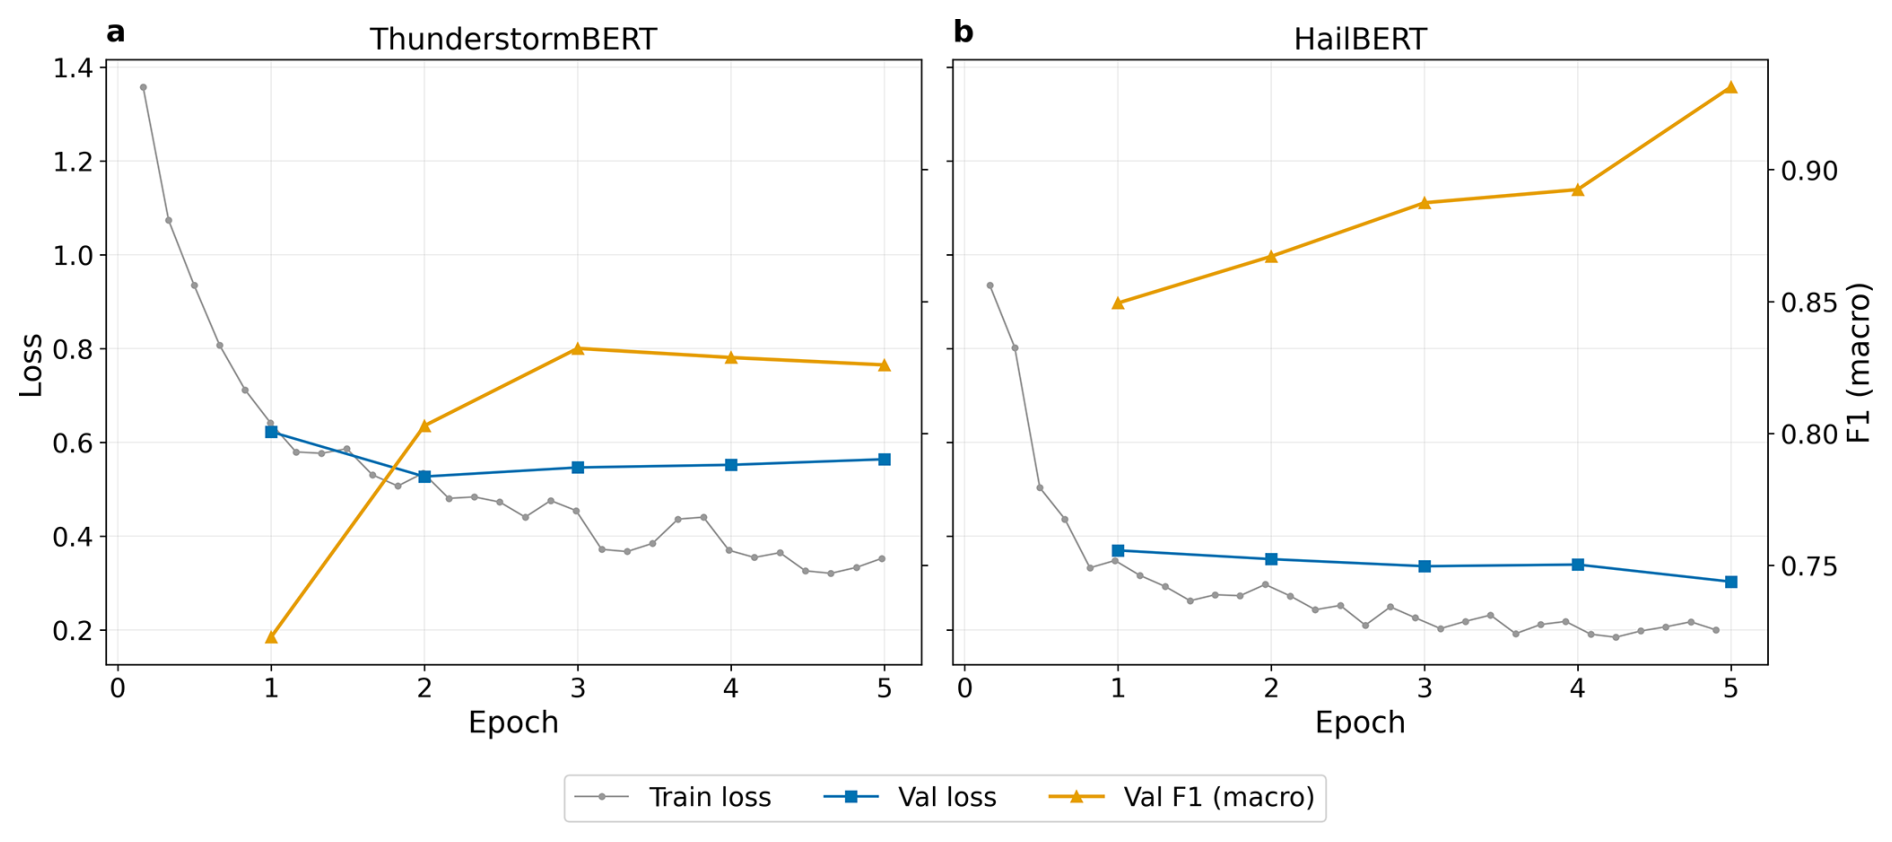
Figure 14The figure shows the trend in the training and validation metrics for ThunderstormBERT and HailBERT over 5 epochs.
ThunderstormBERT achieves a macro-averaged F1 score of 0.826 on the held-out test dataset, with an accuracy of 0.871 (corresponding to an error rate of 12.9 %). Common classes such as no thunderstorm and light thunderstorm are recognised with high precision and recall (F1 > 0.91), whilst the rarer intensity classes, as expected, exhibit lower but consistent F1 scores (Table 7). Misclassifications occur predominantly between neighbouring intensity levels (Fig. 15), which suggests gradual semantic transitions in the historical descriptions, where intensity gradations are often formulated implicitly or contextually.
Table 7Class-specific test performance of the thunderstorm model.
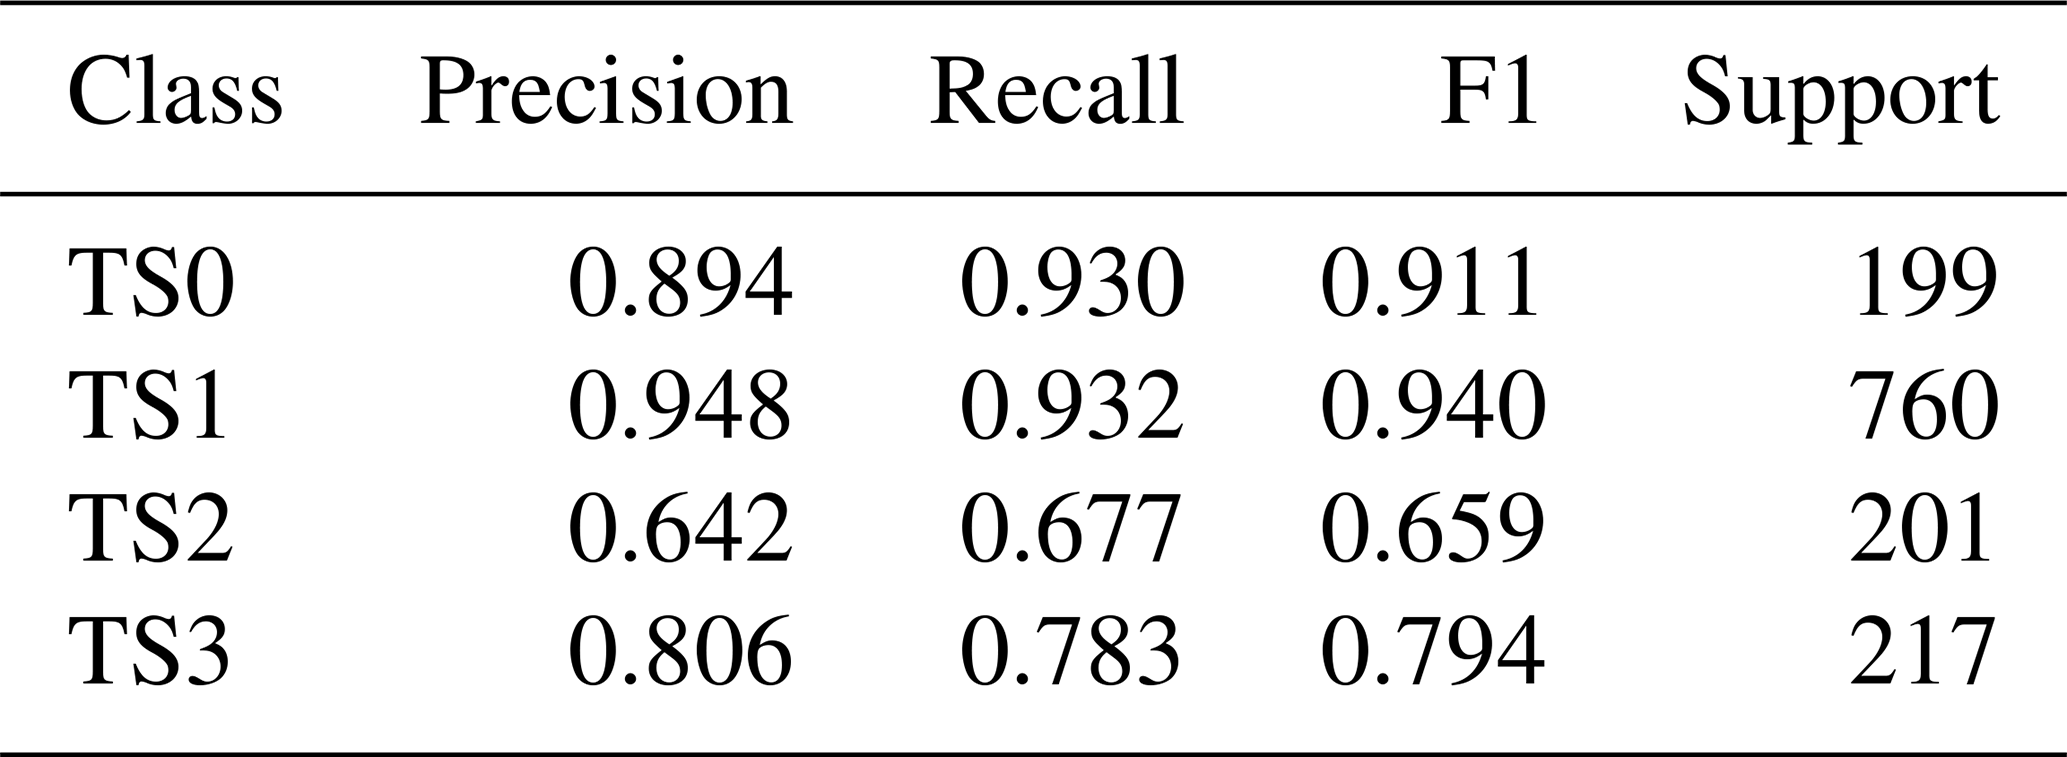
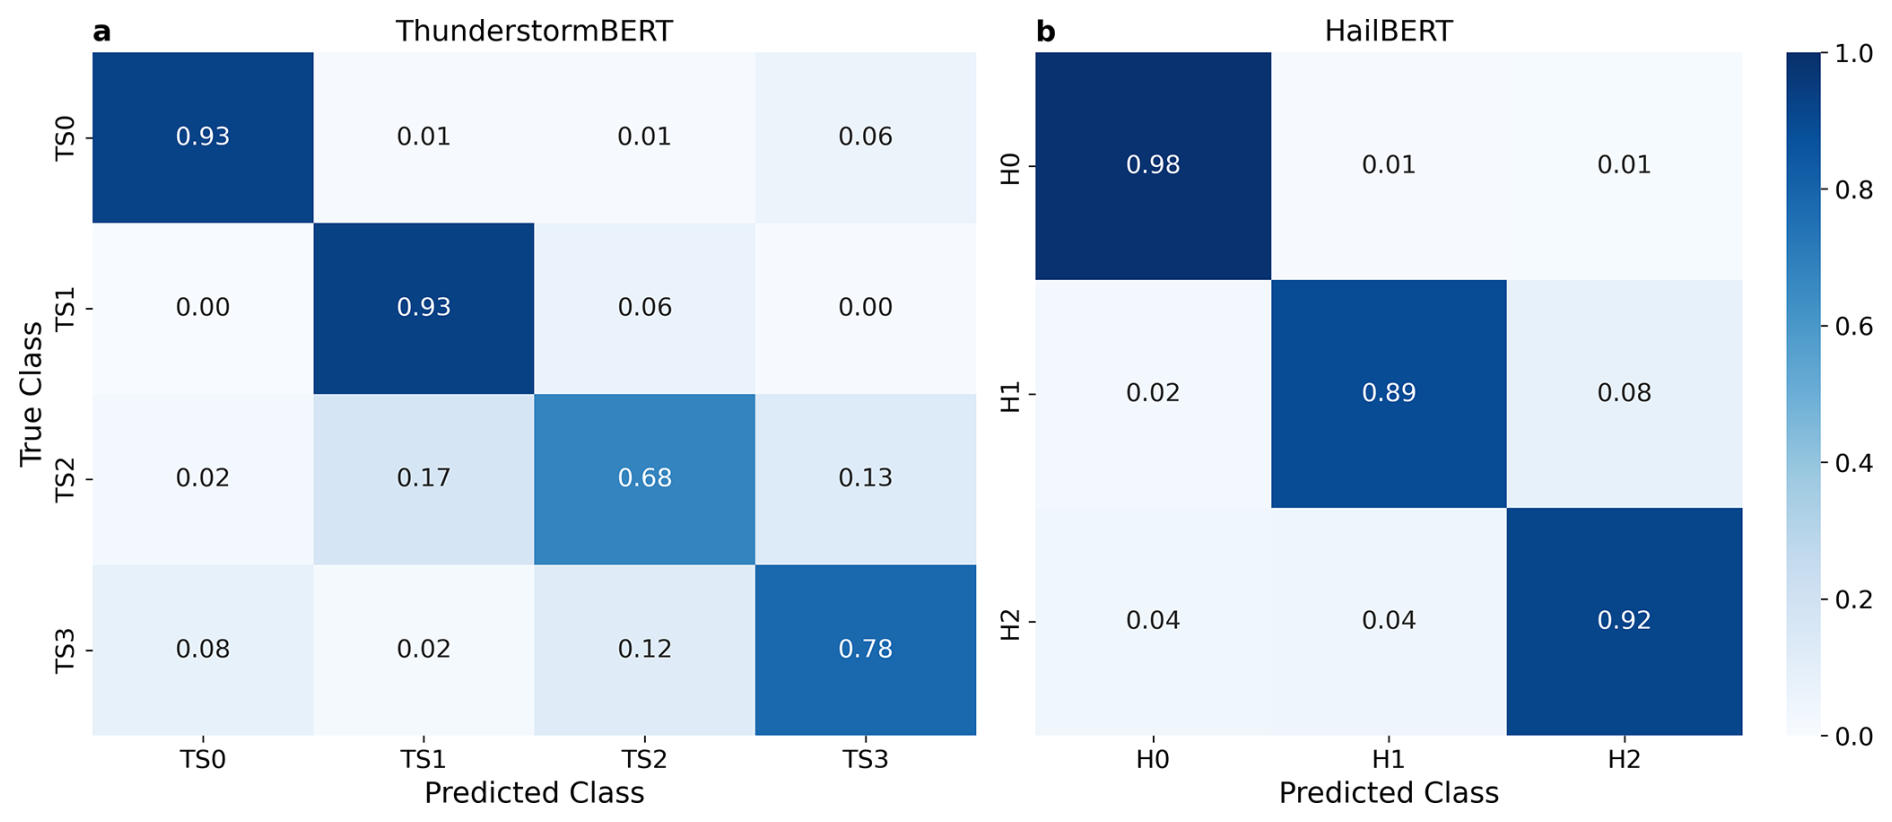
Figure 15Normalised confusion matrix for ThunderstormBERT and HailBERT on the held-out test dataset. For each true class (row), the probability that the model will predict this class correctly (diagonally) or as a different class is shown.
The learning curves for HailBERT show a continuous increase in the F1 score alongside a simultaneous decrease in loss (Fig. 14). Validation stabilises from the fourth epoch onwards, indicating efficient convergence with no signs of significant overfitting. The normalised confusion matrix shows very high separation between classes, with only a few misclassifications outside neighbouring intensity levels (Fig. 15).
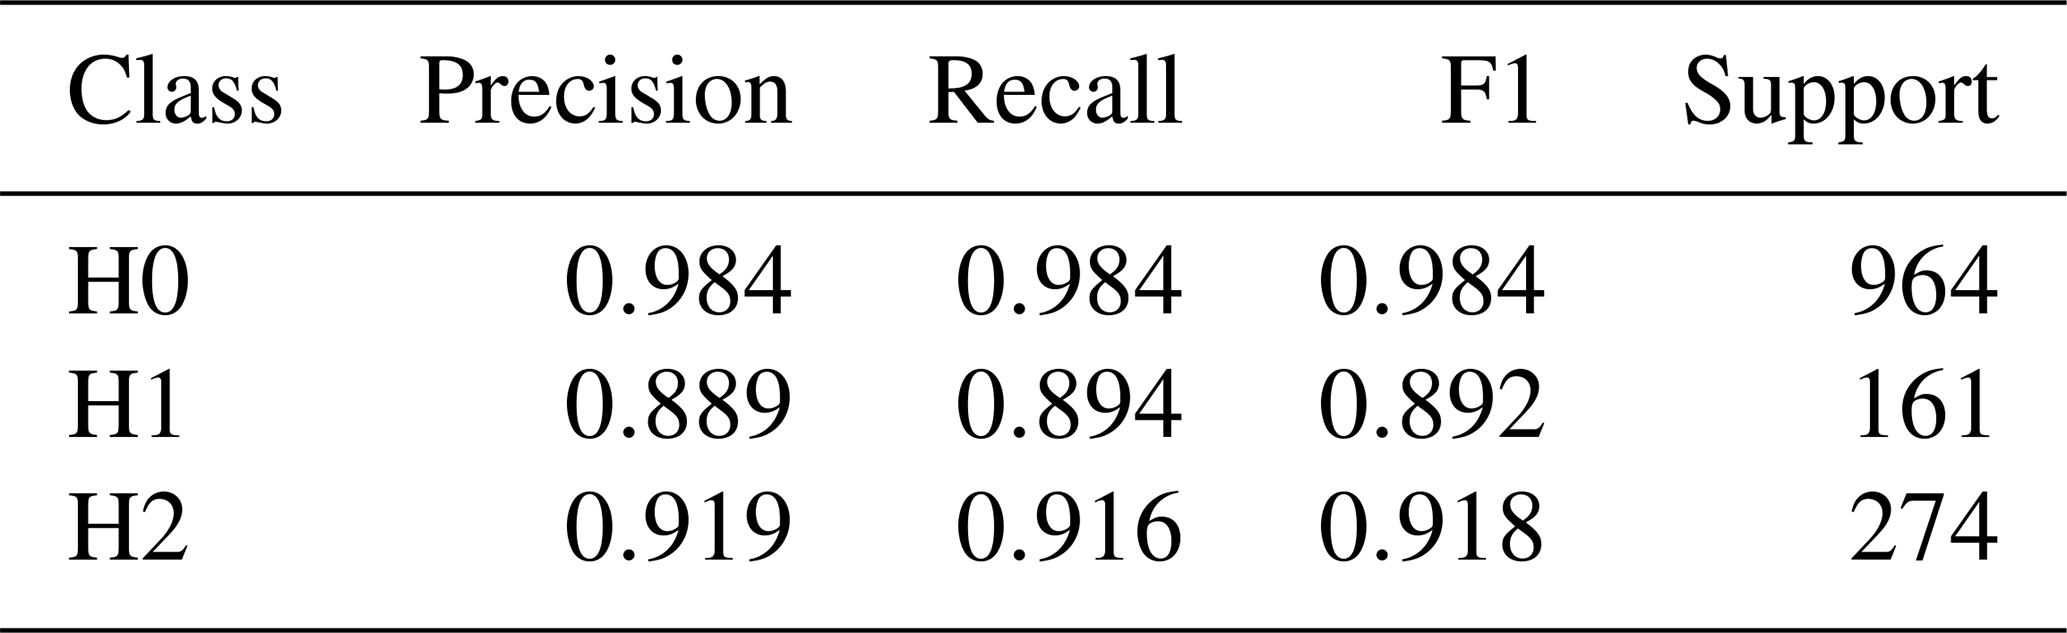
HailBERT achieves a very high overall classification performance with a macro-averaged F1 score of 0.931 and an accuracy of 0.961 (corresponding to an error rate of 3.9 %). All classes are classified with high and balanced scores (Table 8). Here, too, misclassifications are predominantly concentrated on neighbouring intensity classes, which suggests a consistent internal representation of the ordering relation. HailBERT's higher overall performance should also be interpreted in the context of the smaller number of classes and the clearer semantic distinguishability of hail events.
The study shows that, despite widely varying source density and a heterogeneous source base, historical reports of thunderstorm and hail events exhibit a remarkably stable seasonal signal. The reconstructed annual pattern is dominated by a pronounced summer maximum. The maximum identified closely matches the observational data from the DWD normal periods in terms of location, shape and amplitude. This pattern remains consistent for both the entire period and the period with the highest density of observations (1624–1654).
The high Spearman rank correlations and small variations in the normalised monthly proportions indicate that the historical observations examined in this study are consistently related to real meteorological processes at the aggregated level. Furthermore, the seasonal pattern is largely independent of observation density: significant fluctuations in the number of quotes only minimally alter the shape of the annual pattern.
A comparison with independent studies further supports these findings. The seasonal cycle shows a clear correspondence with the independent reconstructions by Lenke (1960) and Camuffo et al. (2000). This agreement is evident both for the entire time series and for the period with the highest observation density, 1624–1654 (Fig. 16). The correlation analysis supports this agreement (Hist vs. Lenke: Spearman 0.86; Hist vs. Camuffo: 0.71), with almost identical results yielded for the most densely observed period (1624–1654). This points to a robust seasonal signature of thunderstorm activity across different time periods, regions and source types, and highlights the plausibility of the reconstructed annual pattern.
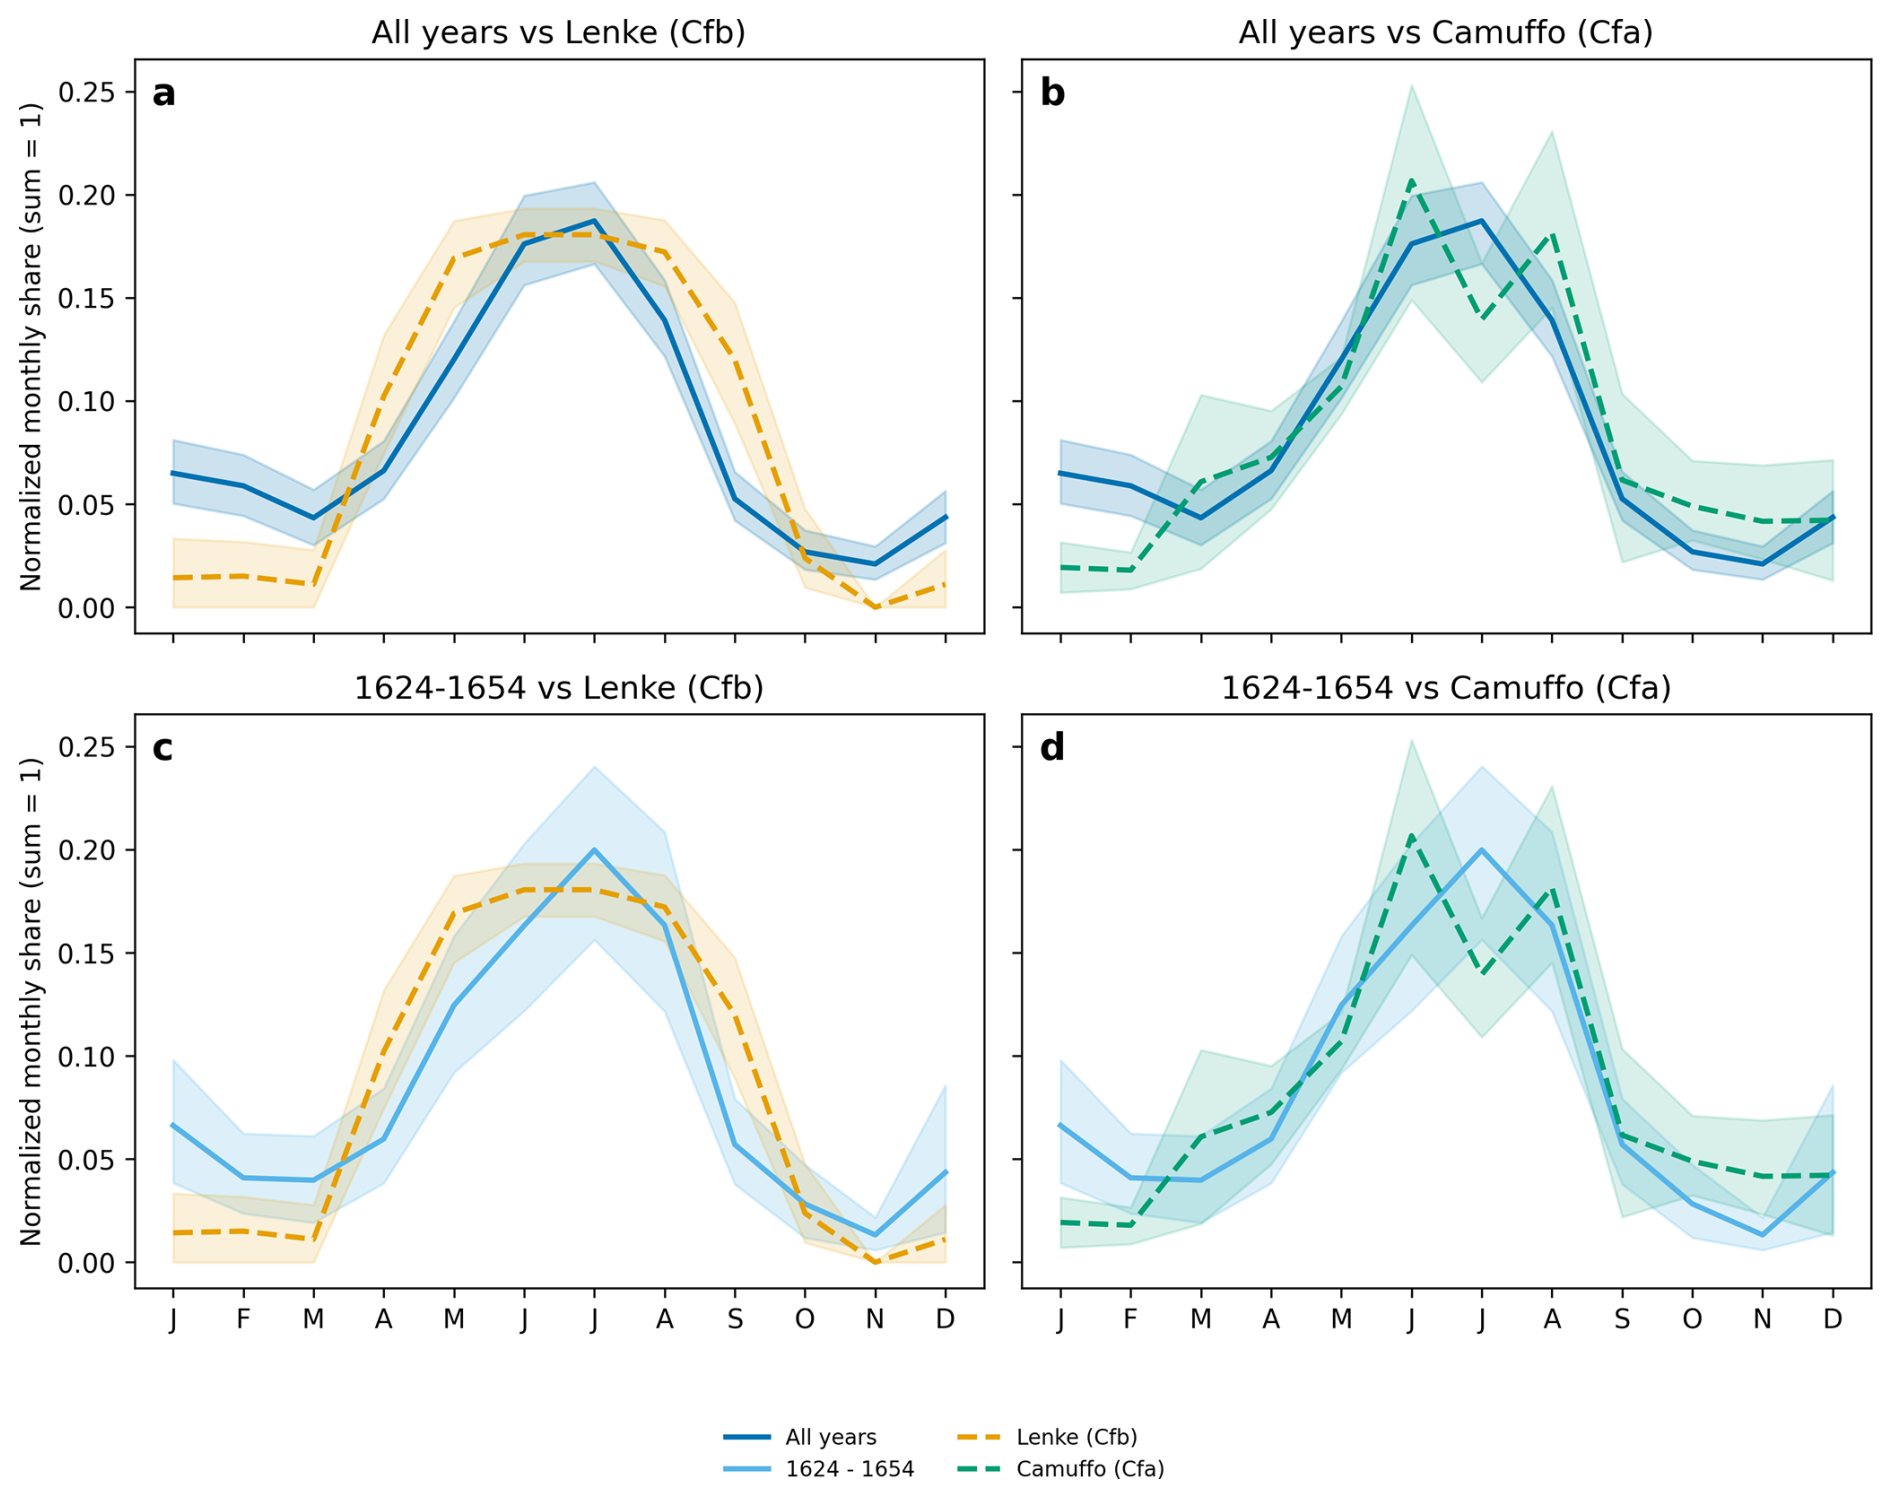
Figure 16Comparison of the seasonal cycle of thunderstorm events using two independent time series. The seasonal distributions are shown, each with 95 % bootstrap confidence intervals. The top panel shows a comparison of the complete time series from this study with Lenke (1960) (Hesse, Köppen Cfb) and Camuffo et al. (2000) (Padua, Köppen Cfa). The bottom panel shows the corresponding comparison for the period with the highest observation density (1624–1654). Despite differing climate regimes, namely the oceanic Cfb climate of central Germany and the humid subtropical Cfa climate of the Po Valley, there is a high degree of consistency in the shapes of the curves. This underlines the robustness of the seasonal pattern, characterised by a pronounced summer maximum and moderately increased winter activity, across different datasets, regions and methodological approaches.
Differences are evident for the winter: the ratio of summer to winter components (JJA vs. DJF) in the reconstructed time series of this study is approximately 3.0–3.5, whilst the values according to Camuffo et al. (2000) (6.6) and in Lenke (1960) (13.2) are more pronounced. One possible explanation for the increased observation of thunderstorm events in winter could be source-specific perceptions of winter thunderstorm and hail events, which were regarded as unusual (e.g. Camuffo et al., 2000; Glaser, 2013). Whether this is attributable to the composition of the corpus cannot be conclusively determined here.
The ratio between summer and winter (JJA DJF) remains stable above the unit line throughout the entire observation period: over more than four centuries, there are no systematic trends that would suggest changes in source density or documentation practices. The consistently pronounced summer maximum suggests that the observed seasonal pattern is primarily attributable to actual convective processes and is not due to effects of transmission or the selection of quotes.
Discernible, physically consistent seasonality is a crucial criterion for the plausibility of historical observations. The seasonality observed here shows that the reconstructed time series of thunderstorms and hail contain climatologically meaningful signals at an aggregated level. However, agreement with modern and historical reference series does not confirm the classification of individual events. Whether a particular report has been assigned to the correct intensity class can only be determined by examining linguistic evidence. The individual signals from the thunderstorm and hail classes therefore provide a more nuanced picture.
First, we consider the linguistic evidence. This shows that the classified hail events are of a consistently high quality across all periods. The majority of hail events classified as H2 have a confidence index of ≥2. The distinction between classes H1 and H2 can be clearly made on the basis of hailstone size or the intensity of the hail, which leaves little room for interpretation. Hail events with an index level of 0 are found only in class H1. In such quotes, the term “hail” stands alone and leaves no room for interpretation.
The quality of the classification of thunderstorm events differs from that of hail events: whilst the TS1 and TS3 classes exhibit a stable composition of evidence classes, TS2 shows significantly greater variability and thus greater uncertainties in interpretation. Individual TS1 events with evidence class C3 are difficult to classify due to a lack of descriptions, but do not significantly affect the overall signal. Furthermore, for a small proportion of thunderstorm events (2.9 %), the causal link between the event and the reported damage is absent, meaning that the damage does not contribute to validating the classification. Overall, it is clear that the classification of thunderstorm events is more challenging, particularly in the middle class TS2. The classification is therefore asymmetric: the high-intensity classes (TS3 and H2) are based on direct, verifiable evidence, whereas the threshold-free middle class (TS2) remains transitional with weaker evidential support. As with hail events, the composition of the confidence index remains stable across the entire period and across all classes.
The analysis of the ordering relation shows a clear dominance of thunderstorm class TS1 throughout the seasonal cycle. Class TS2 occurs at a lower but stable proportion throughout much of the year, while class TS3 achieves a higher proportion, particularly during the summer months. During the transitional seasons, the ordering relation is predominantly TS1 > TS2 > TS3. However, in the summer months, the secondary ranking repeatedly shifts to TS1 > TS3 > TS2 in the medium-range class proportions. An exception is February, during the dense observation period 1624–1654, when TS2 dominates at 51 %. However, given the small number of winter events and the correspondingly wide confidence intervals, this single outlier is not statistically significant.
These findings contradict the assumption frequently put forward in the literature that historical sources primarily record extreme weather events (cf. Lenke, 1960; Camuffo et al., 2000; Brázdil et al., 2016a, b; Burgdorf, 2022). However, such a general dominance of extreme classes cannot be confirmed for thunderstorm and hail events. Under this assumption, an ordering relation of TS3 > TS2 > TS1 would have been expected. In fact, the observations in this study predominantly follow the physical frequency distribution, with a clear dominance of weaker thunderstorm events (TS1). This suggests that, at least for thunderstorm events, there is no systematic over-representation of extreme intensities.
The differing seasonal cycles of hail classes H1 and H2 can be explained by a combination of physical and source-related effects. During the summer months, high convective energy means that hail events tend to be more intense when they occur, whilst light hail either occurs less frequently meteorologically or is documented less often due to its lower visibility. In winter and transitional seasons, by contrast, hail events predominantly occur in weaker forms, but are recorded even at low intensities due to the generally lower event density and increased sensitivity to observation. The transitional months of April and September consistently mark the change of season. This is consistent with the fact that the seasonal increase in hail events begins earlier than that for thunderstorm events, with higher proportions already evident in March and April. Noteworthy is the high correlation between the H1 data and the DWD observational data (ρ(H1, DWD) = 0.87–0.92), which generally only record light hail, whilst H2 shows a typical peak in summer. This underlines both the coherence of the class assignment at seasonal scale and the plausibility of real-world observations.
The relationship between source type and intensity class (Sect. 4.4) is significant for both thunderstorm and hail events, although to varying degrees: for thunderstorm events, the effect is small (explained variance approximately 4 %), whereas for hail events it is moderate (approximately 18 %). The reporting patterns of the source types influence the classification. However, they are not strong enough to be interpreted as a primary effect. In particular, narrative sources such as chronicles tend to document more intense hail events (H2) disproportionately, whilst weather records more frequently record weaker hail events (H1). In documentary sources, hail events appear to be considered newsworthy primarily when they cause damage or take on unusual forms. Continuous observation formats, by contrast, systematically record even lower intensities. However, the stability of the confidence index throughout the entire observation period shows that the description of thunderstorm and hail events hardly differs in terms of type and composition. This suggests that only a synoptic analysis across all sources leads to plausible results.
The results of the transformer-based language model can be contextualised within the previously obtained findings on the seasonal structure of convective events. The high data quality of the hail events and the uncertainties in thunderstorm classification influence the quality of the model. Whilst the automatic classification of hail events and thunderstorm classes TS1 and TS3 is accurate, slightly lower F1 scores are achieved for thunderstorm class TS2. The results of the model training thus reflect the results of the confidence index.
However, the results also demonstrate that the patterns observed in historical sources can be consistently reproduced at the semantic-linguistic level. Despite being trained exclusively on texts and not including any additional meteorological variables, the model reproduces the characteristic ordering relation (e.g. TS1 > TS2 > TS3 during the seasonal cycle) and the summer intensification of more severe events. These results are consistent with the corpus being coherent in terms of content: the historical texts contain sufficient meteorologically relevant information to capture both seasonal differences and differences in event severity. Since the model was trained on the same quotes, this does not constitute an independent test of the classification.
The remaining misclassifications occur almost exclusively at the boundaries between neighbouring classes, a pattern well-recognised in both meteorological practice and source-critical analysis. Our study aligns with these observations, although serious errors remain rare. Consequently, the results indicate that the model does not simply memorise formulations (overfitting), but rather identifies recurring semantic patterns. Such behaviour is consistent with a clear separation of the relevant linguistic signals within the classification scheme.
Both models produce stable and reproducible results and are suitable for the automated classification of historical weather descriptions from this corpus. In doing so, they learn the implicit structures of the historical record, including source-specific selection mechanisms, rather than smoothing them out, and thus operate in a manner consistent with the characteristics of the corpus. The observed differences in performance between thunderstorm and hail classification can be explained primarily by the different class structures and semantic discriminative power of the respective target phenomena.
Despite their varying source types and linguistic heterogeneity, the study shows that historical textual sources offer great potential for the quantitative reconstruction of convective weather events. A consistent database was created by combining source-critical analysis, rule-based classification, and linguistic validation and physical-statistical plausibility assessment. Converting qualitative descriptions into structured evidence classes and developing a confidence index made it possible to assess the data quality. Based on linguistic evidence, the classification is highly reliable for hail events and for light and severe thunderstorm events. However, there are still uncertainties regarding the moderate thunderstorm class and winter thunderstorm events, which appear to be over-represented in the sources. The qualitative composition has remained remarkably stable for over 800 years. This demonstrates that historical observations of thunderstorm and hail events exhibit minimal linguistic variation, allowing typical patterns to be identified in the descriptions. This makes automated classification all the more relevant, as demonstrated by the successful use of a multilingual BERT model for detecting and classifying thunderstorm and hail events. Both models can classify unseen quotes from the corpus.
Overall, this study shows that Transformer-based language models can extract climatologically plausible information from systematically processed historical data. The formally defined classification procedure with an evidence-based quality assessment provides a reproducible framework that explicitly considers both the variability in the language used to describe historical events and the meteorological interpretation required for climatological analysis. This extends existing approaches in a useful way.
The high quality of the observations can be explained by the significant social role of thunderstorm and hail events in pre-industrial agrarian societies, among other things. Such events posed an existential threat in these societies and were therefore documented in great detail. This dataset provides new insights into the study of convective weather in the context of climate change. As instrumental and radar-based observation series only span a few decades, long-term reference data from the pre-industrial climate regime is necessary to contextualise the natural variability of thunderstorm and hail activity. The period covered here, which extends back to the year 1000, provides such a basis. However, a key question remains: how does the internal variability of convective activity in the natural climate regime compare with today's anthropogenically influenced conditions? This dataset and the classification tools it provides form a basis for answering this question, which can be further developed through expanded spatial and temporal coverage in future work. The empirical results apply to the German-speaking source corpus of Central Europe. The classification method itself is designed to be language-independent. However, it must be recreated using the same corpus-based procedure for each new target language. The next step is therefore to apply the method to comparable corpora in other languages, such as French or English.
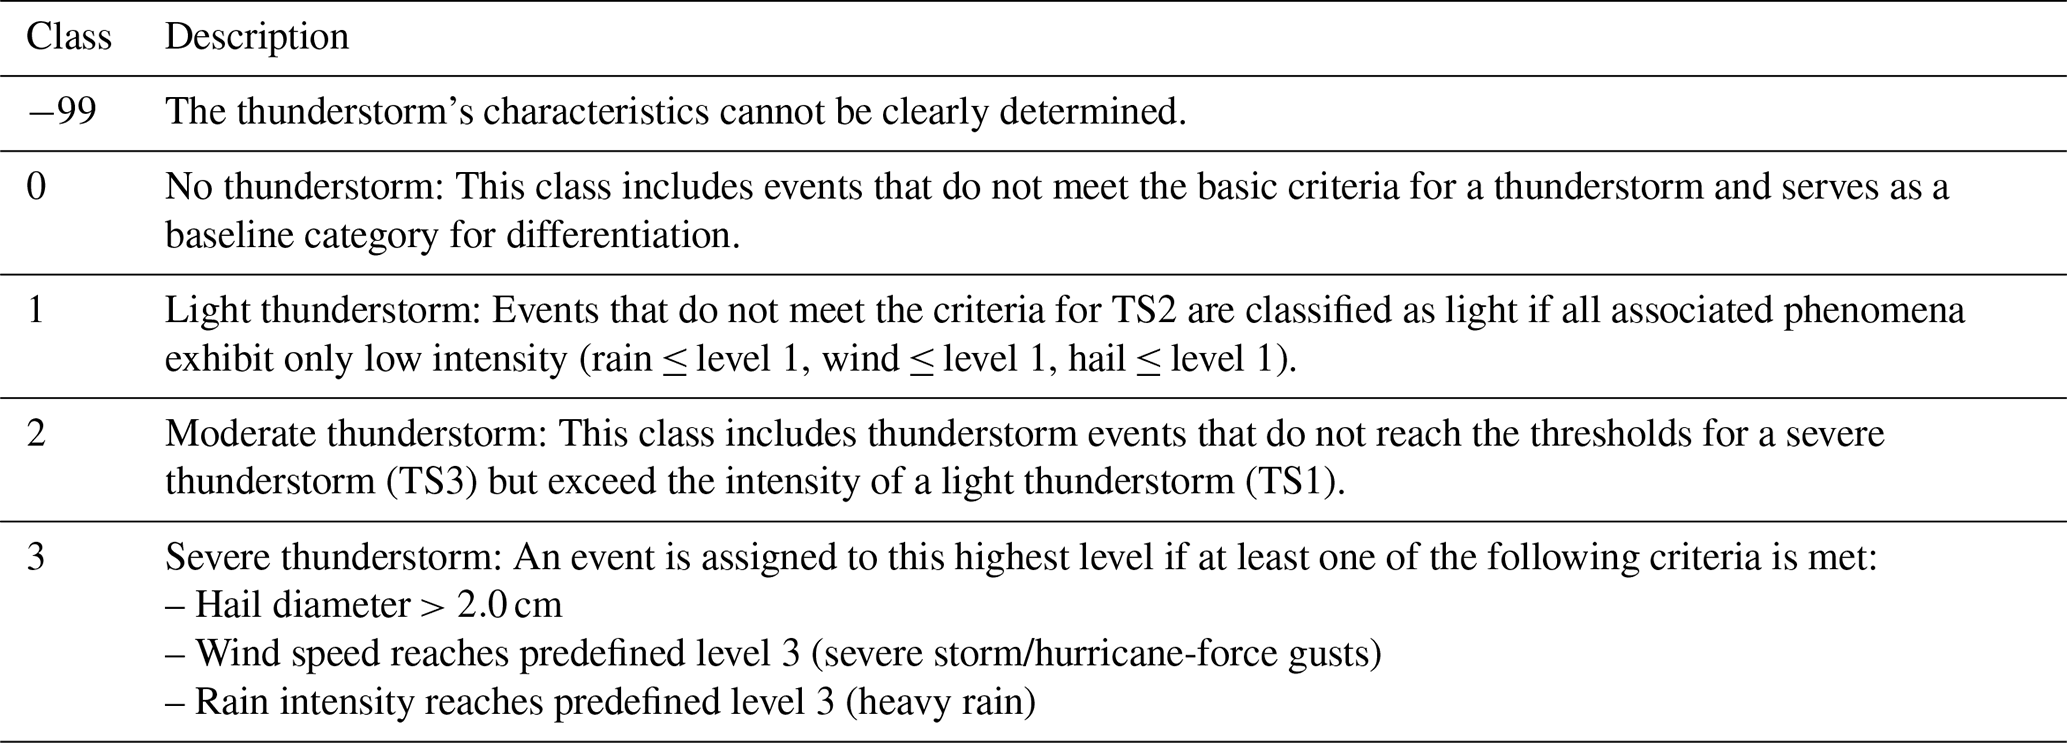
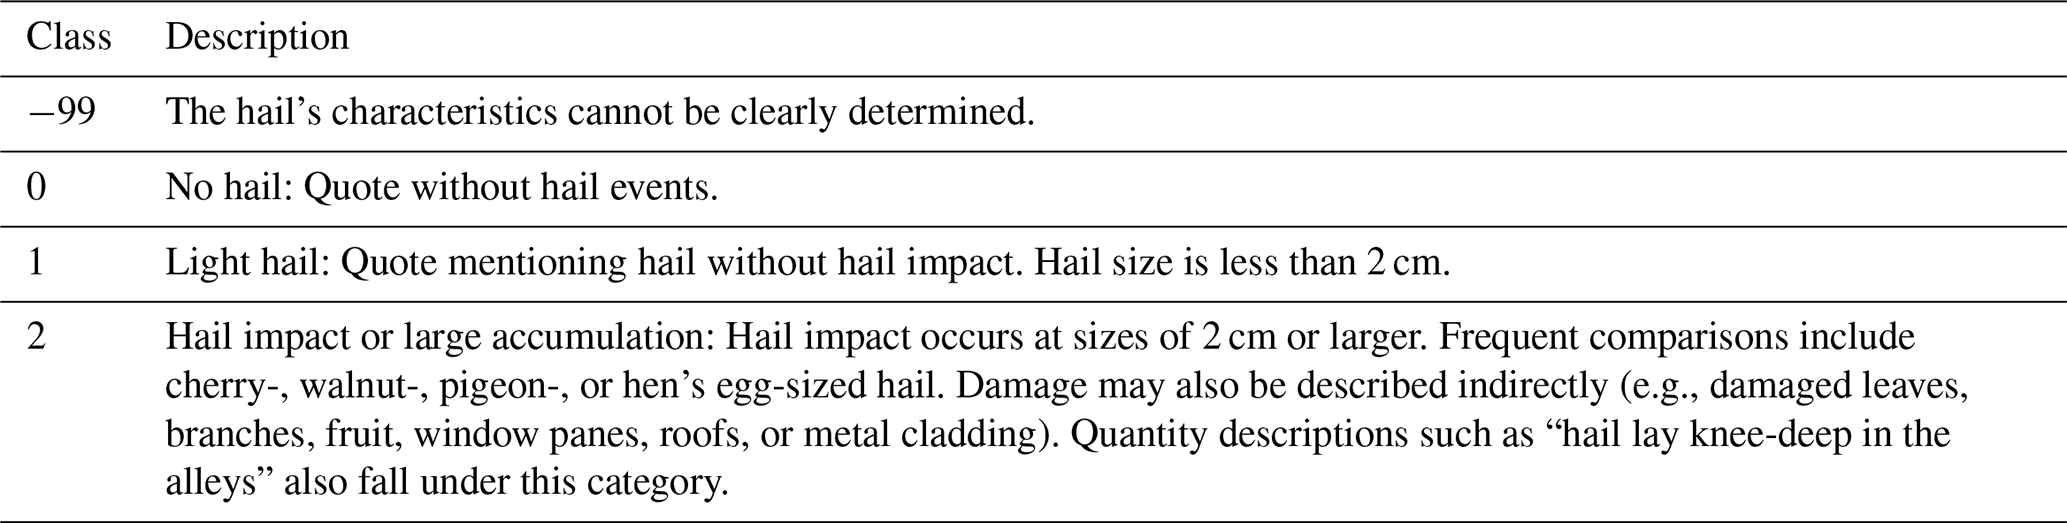
Table A3Classification of rain intensity during thunderstorm and hail events.
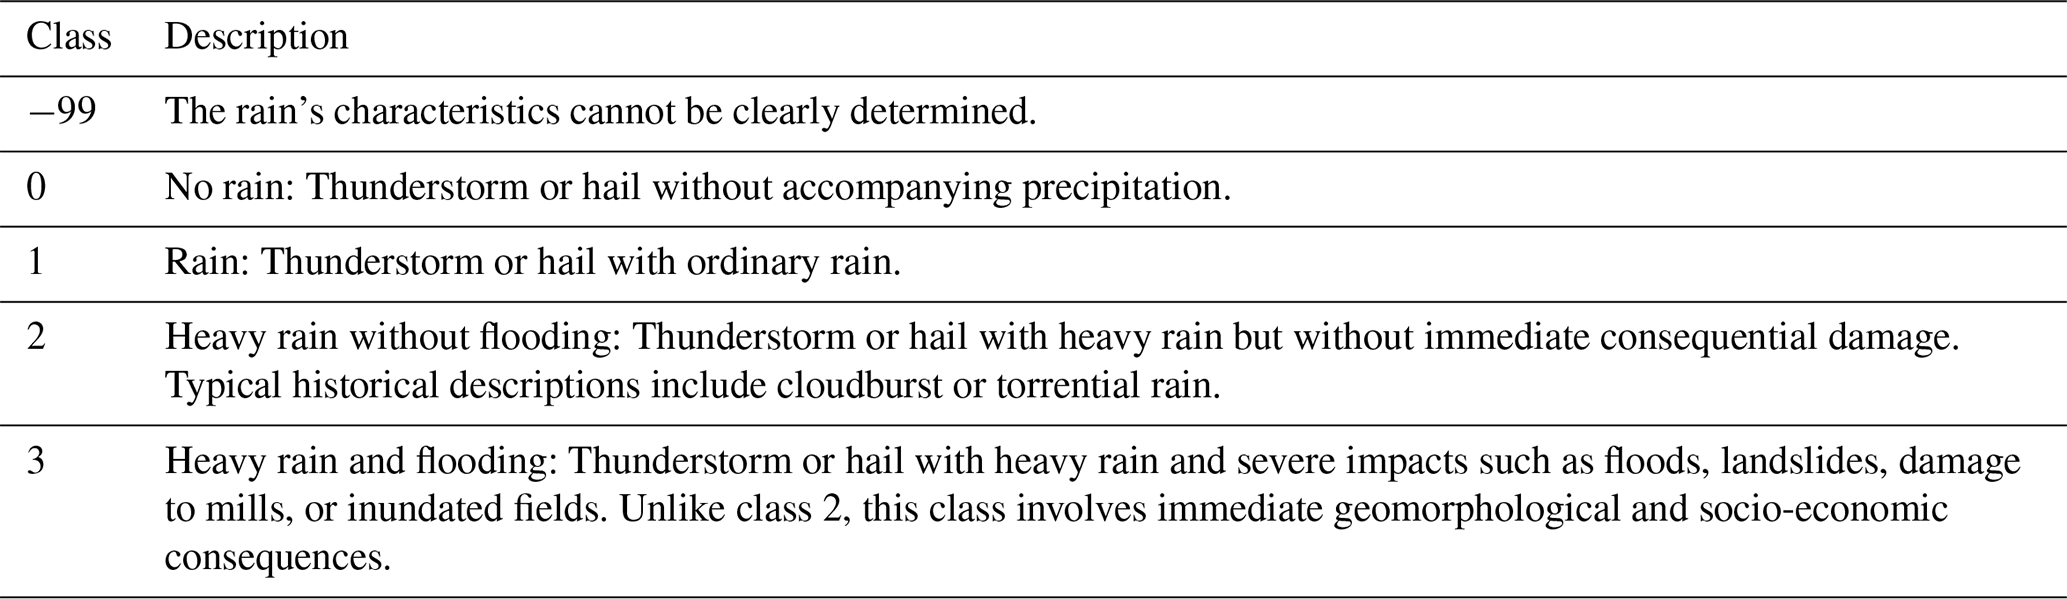
Table A4Classification of snow intensity during thunderstorm and hail events.
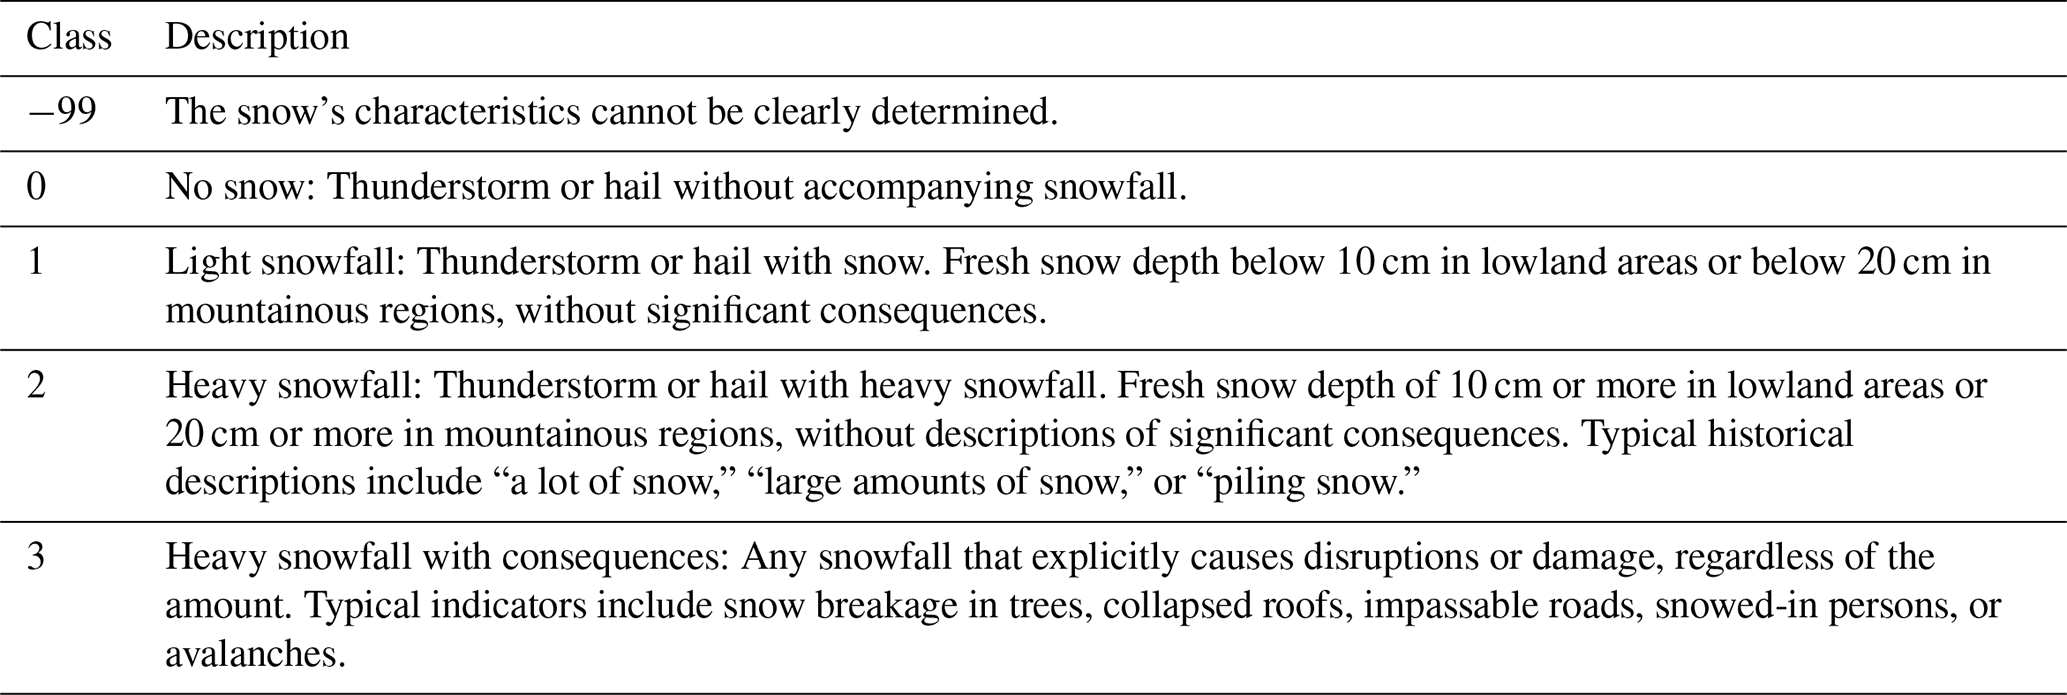
Table A5Classification of wind intensity during thunderstorm and hail events.
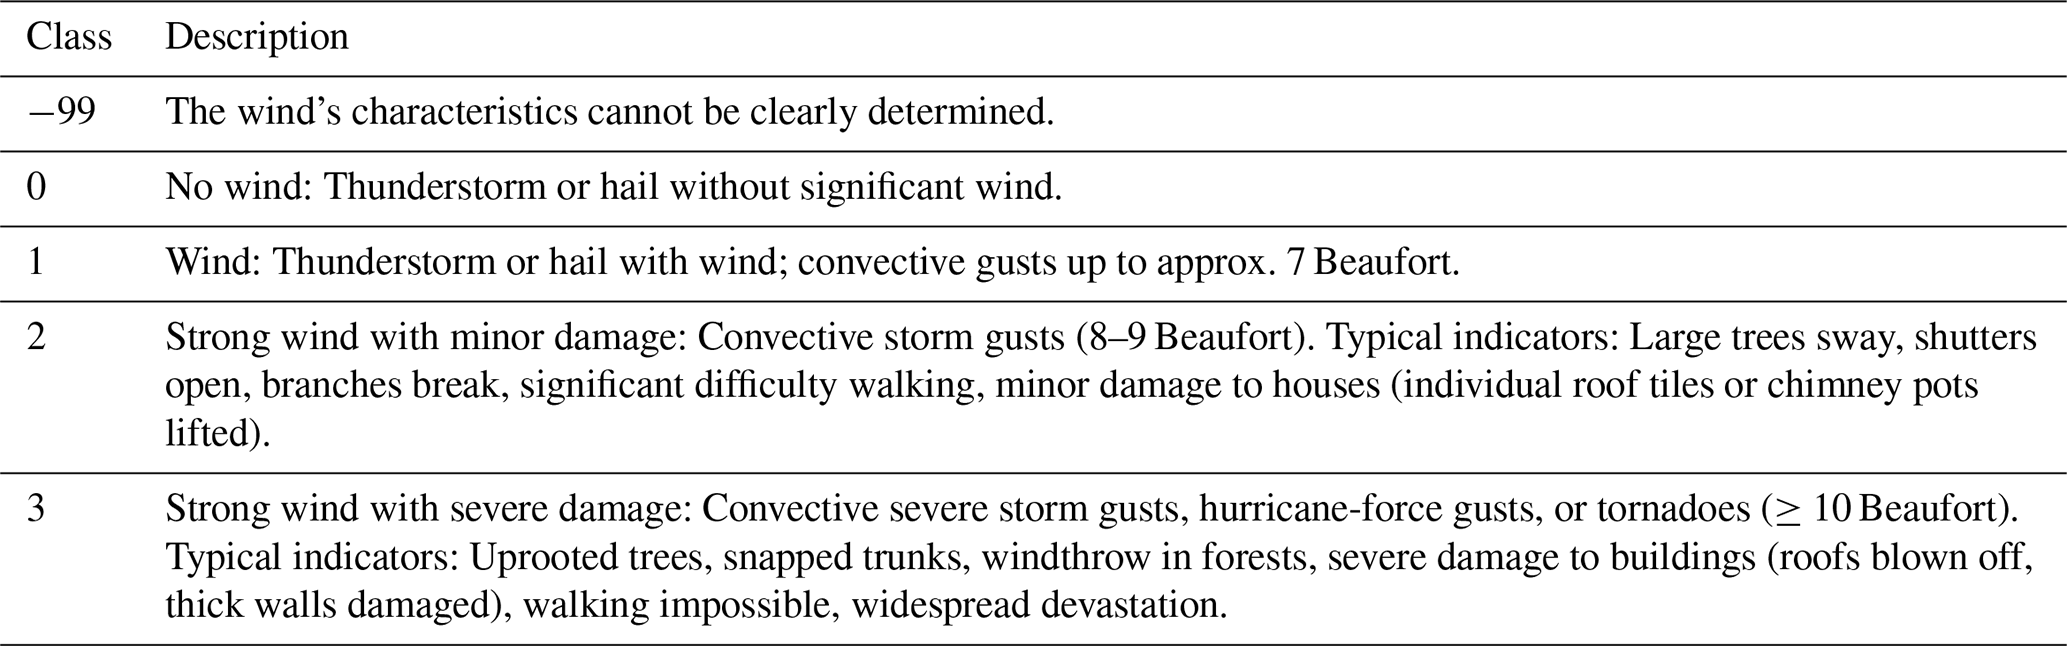
Table A6Standardised terms and size specifications for historical hail descriptions. The table summarises typical expressions from historical sources used to describe hail events; by assigning them to standardised size ranges and energy levels, it enables consistent and comparable classification of hail intensity within the classification scheme. The thresholds follow established meteorological and climatological references. The decisive 2 cm threshold for hailstones follows European Severe Storms Laboratory (ESSL) (2025) and Tornado and Storm Research Organisation (TORRO) (2025), above which the kinetic energy of hailstones increases disproportionately, raising the probability of substantial damage to agricultural crops, buildings and infrastructure.
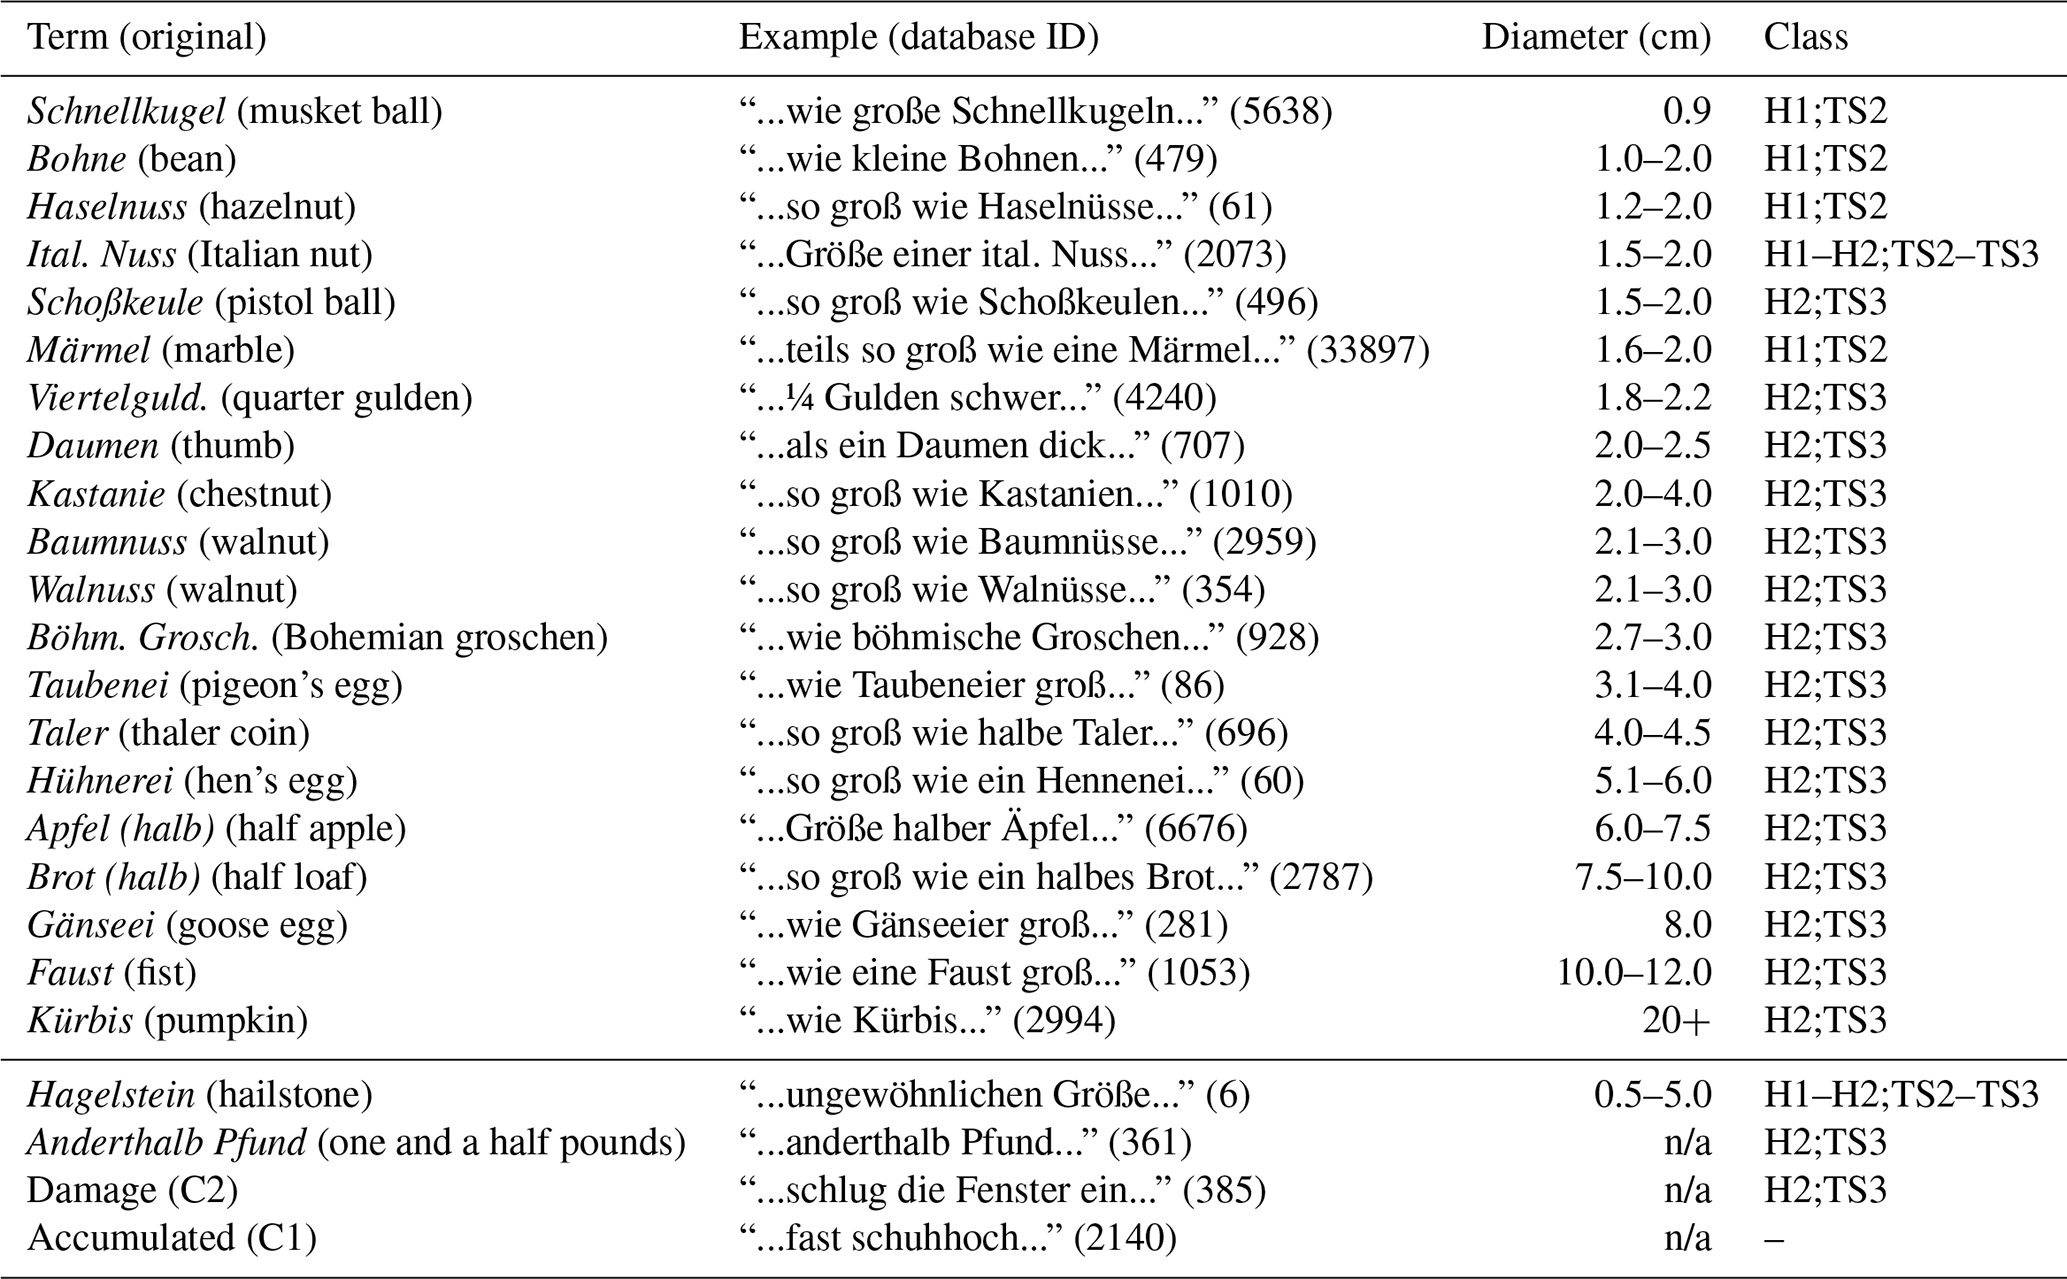
n/a: not applicable (no size specification).
Table B1Linguistic indicators for thunderstorm and hail events and their associated phenomena (wind, rain, snow) in historical sources.
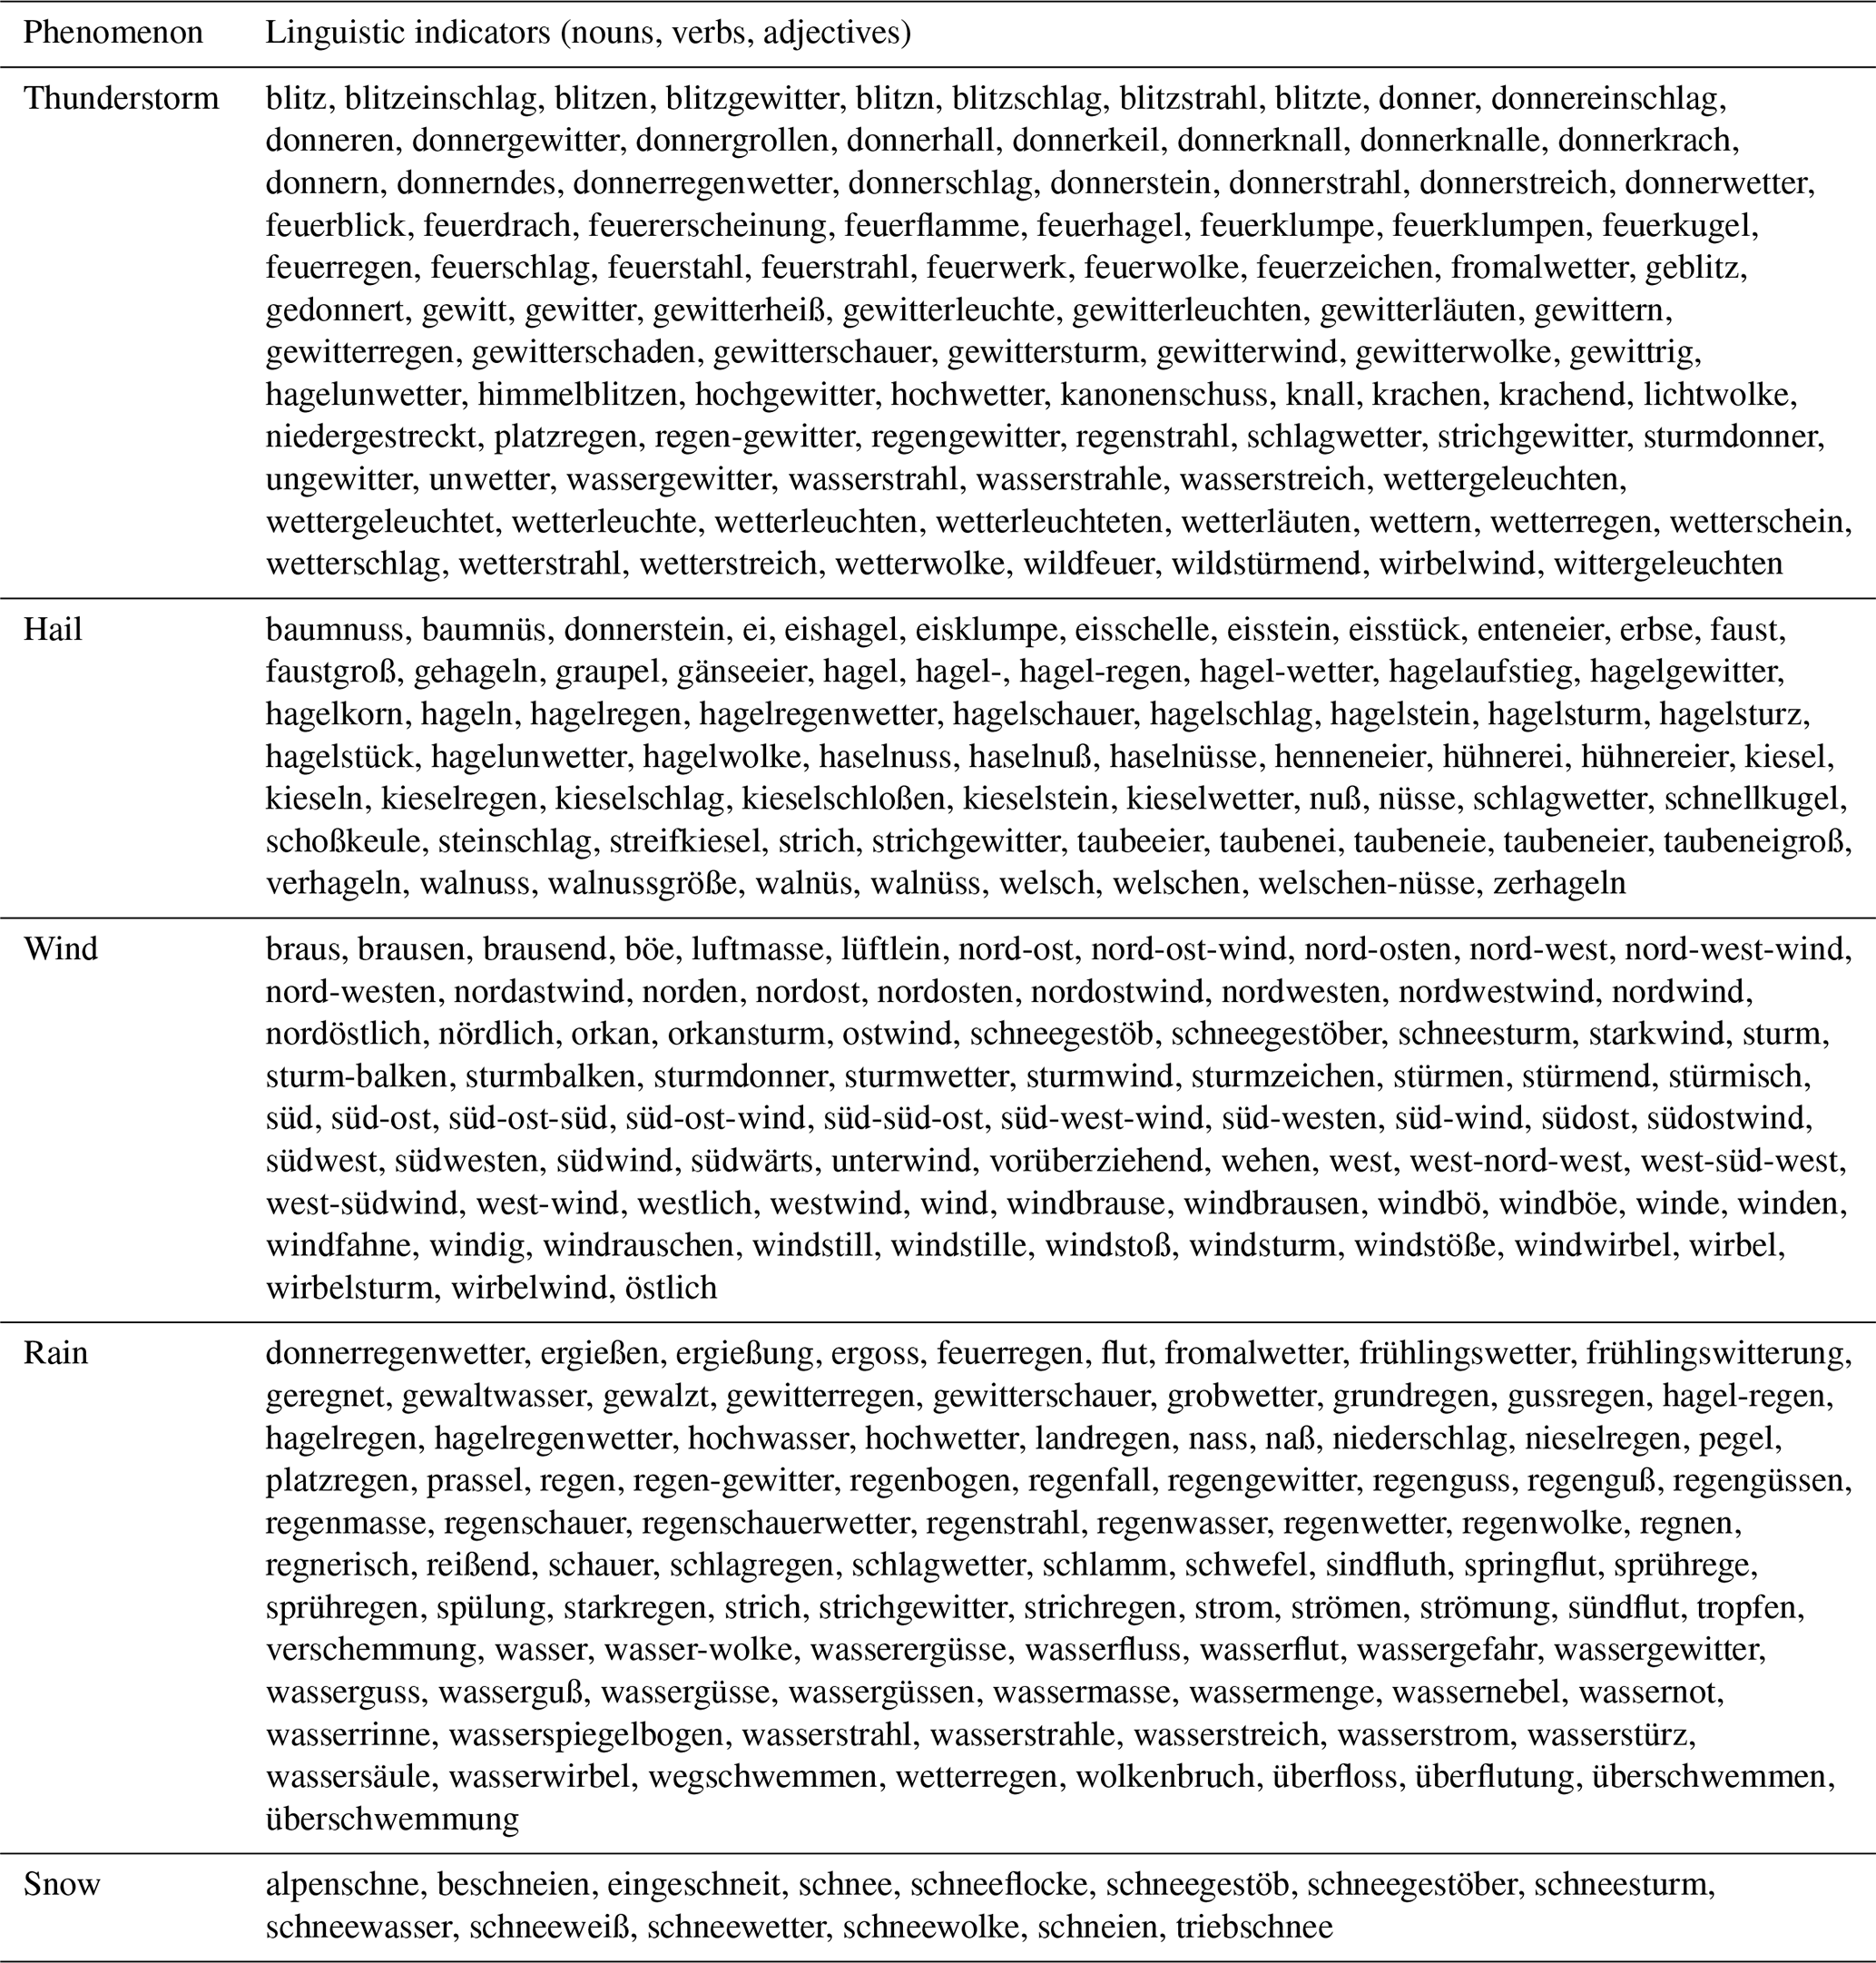
Table B2Vocabulary for semantic identification of hail in the corpus used (silver labels).
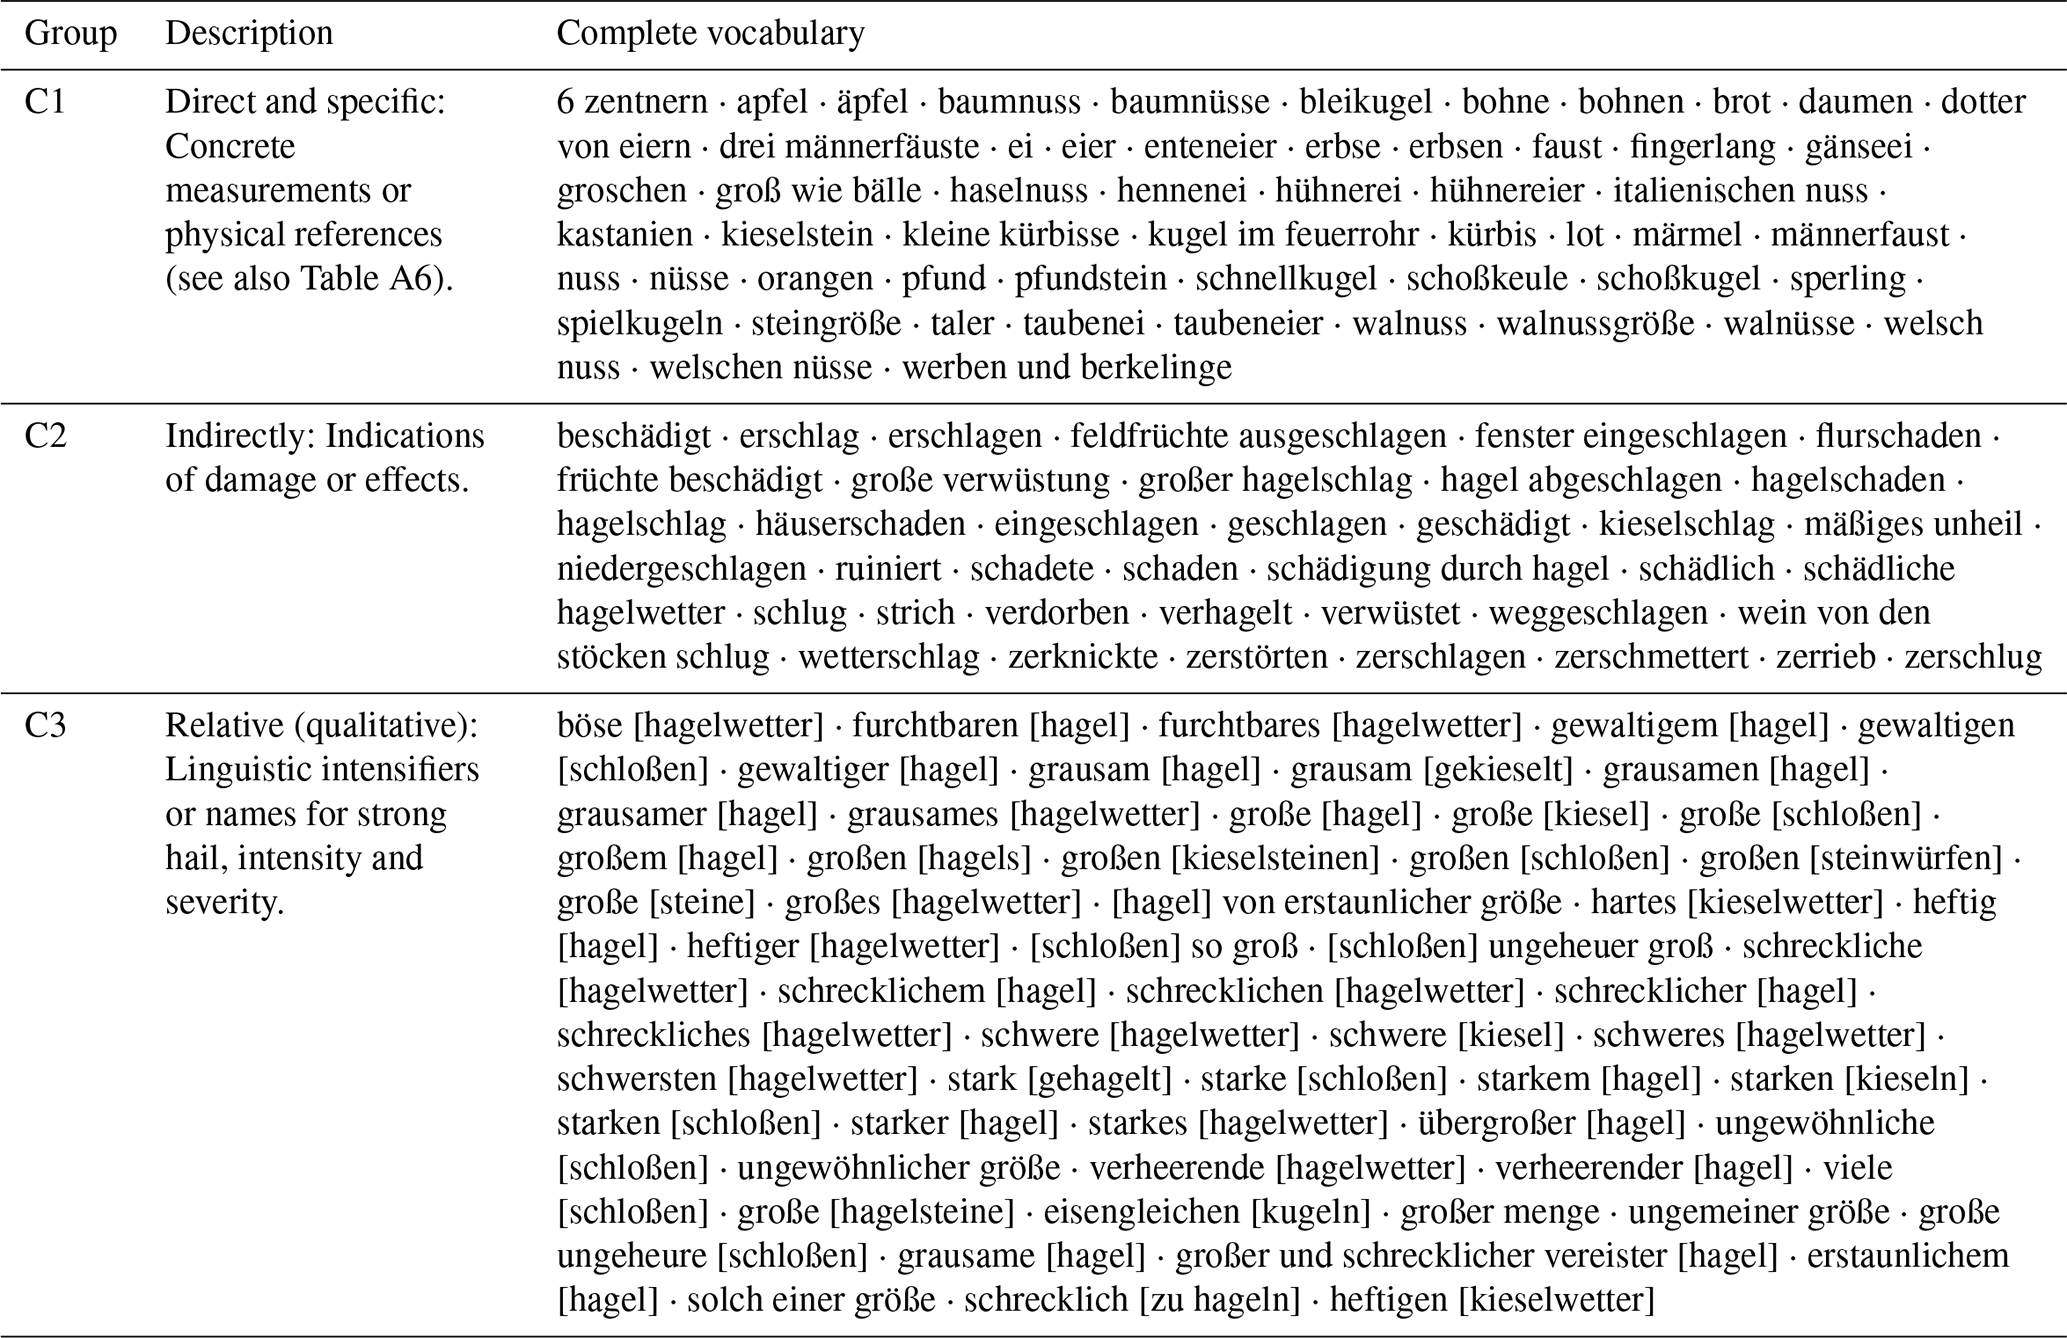
Table B3Vocabulary for the semantic identification of rain in the corpus used (silver labels).
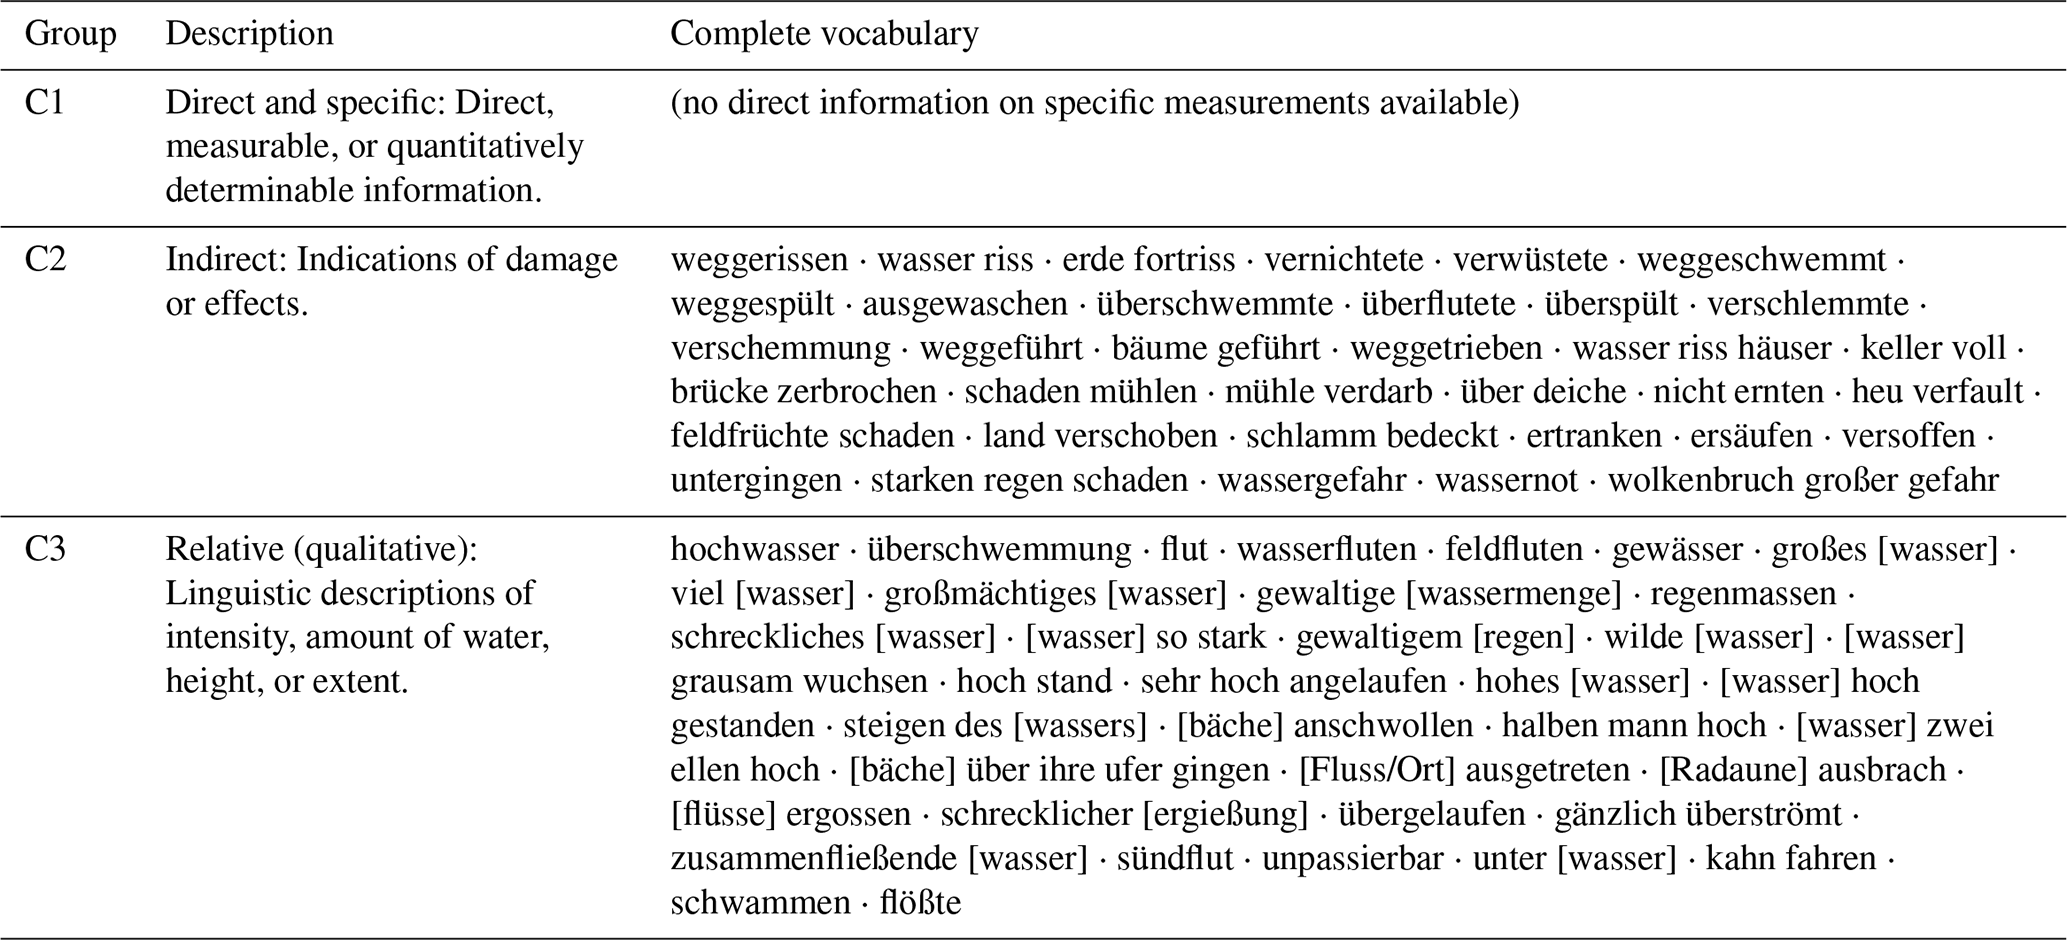
Table B4Vocabulary for semantic identification of wind in the corpus used (silver labels).
The data set of historical thunderstorm and hail observations is available at https://doi.org/10.60493/834bd-mww13 (Schätz and Glaser, 2025). The fine-tuned models ThunderstormBERT-de-v1 and HailBERT-de-v1 are available at https://doi.org/10.57967/hf/6982 (Schätz, 2025b) and https://doi.org/10.57967/hf/6989 (Schätz, 2025a).
FS designed the study, developed the workflows, the classification scheme and the “silver label” word lists, compiled the corpus, normalised it, and carried out the optimisation and evaluation of the models. In addition, he carried out the analysis and the historical-climatological interpretation and wrote the manuscript. RG supervised the project, contributed to the conceptual design, the development of the classification scheme and the historical-climatological interpretation, provided the underlying datasets and assisted in the compilation and normalisation of the corpus. Furthermore, he reviewed and edited the manuscript.
The contact author has declared that neither of the authors has any competing interests.
Publisher's note: Copernicus Publications remains neutral with regard to jurisdictional claims made in the text, published maps, institutional affiliations, or any other geographical representation in this paper. The authors bear the ultimate responsibility for providing appropriate place names. Views expressed in the text are those of the authors and do not necessarily reflect the views of the publisher.
The authors employed Anthropic's “Claude” and “DeepL” to translate the manuscript from German into English.
This open-access publication was funded by the University of Freiburg.
This paper was edited by Linden Ashcroft and reviewed by two anonymous referees.
Bayerische Akademie der Wissenschaften: Der Baierischen Akademie der Wissenschaften in München meteorologische Ephemeriden, vol. 8, Bayerische Akademie der Wissenschaften, München, https://nbn-resolving.org/urn:nbn:de:bvb:12-bsb10332543-1, 1789. a
Beck, H. E., McVicar, T. R., Vergopolan, N., Berg, A., Lutsko, N. J., Dufour, A., Zeng, Z., Jiang, X., van Dijk, A. I. J. M., and Miralles, D. G.: High-resolution (1 km) Köppen-Geiger maps for 1901–2099 based on constrained CMIP6 projections, Scientific Data, 10, 724, https://doi.org/10.1038/s41597-023-02549-6, 2023. a, b
Brázdil, R., Dobrovolný, P., Luterbacher, J., Moberg, A., Pfister, C., Wheeler, D., and Zorita, E.: European climate of the past 500 years: new challenges for historical climatology, Climatic Change, 101, 7–40, https://doi.org/10.1007/s10584-009-9783-z, 2010. a
Brázdil, R., Chromá, K., Valášek, H., Dolák, L., and Řezníčková, L.: Damaging hailstorms in South Moravia, Czech Republic, in the seventeenth to twentieth centuries as derived from taxation records, Theor. Appl. Climatol., 123, 185–198, https://doi.org/10.1007/s00704-014-1338-1, 2016a. a, b, c
Brázdil, R., Chromá, K., Valášek, H., Dolák, L., Řezníčková, L., Zahradníček, P., and Dobrovolný, P.: A long-term chronology of summer half-year hailstorms for South Moravia, Czech Republic, Clim. Res., 71, 91–109, https://doi.org/10.3354/cr01432, 2016b. a, b, c
Brönnimann, S., Martius, O., Rohr, C., Bresch, D. N., and Lin, K. E.: Historical weather data for climate risk assessment, Ann. NY Acad. Sci., 1436, 121–137, https://doi.org/10.1111/nyas.13966, 2019. a, b
Burgdorf, A.-M.: A global inventory of quantitative documentary evidence related to climate since the 15th century, Clim. Past, 18, 1407–1428, https://doi.org/10.5194/cp-18-1407-2022, 2022. a
Camuffo, D., Cocheo, C., and Enzi, S.: Seasonality of instability phenomena (hailstorms and thunderstorms) in Padova, northern Italy, from archive and instrumental sources since AD 1300, The Holocene, 10, 635–642, https://doi.org/10.1191/095968300666845195, 2000. a, b, c, d, e, f
Cutter, S. L.: The Changing Nature of Hazard and Disaster Risk in the Anthropocene, Ann. Am. Assoc. Geogr., 111, 819–827, https://doi.org/10.1080/24694452.2020.1744423, 2021. a
Deutscher Wetterdienst: Beobachterhandbuch für Wettermeldestellen des synoptisch-klimatologischen Mess- und Beobachtungsnetzes, Vorschriften und Betriebsunterlagen 3 (VuB 3 BHB), Deutscher Wetterdienst, Offenbach am Main, 2014. a
Deutscher Wetterdienst (DWD): Offizielle Webseite des Deutschen Wetterdienstes, https://www.dwd.de/ (last access: 24 September 2026), 2025. a
Devlin, J., Chang, M.-W., Lee, K., and Toutanova, K.: BERT: Pre-training of Deep Bidirectional Transformers for Language Understanding, in: Proceedings of the 2019 Conference of the North American Chapter of the Association for Computational Linguistics: Human Language Technologies, Volume 1 (Long and Short Papers), 4171–4186, Association for Computational Linguistics, Minneapolis, Minnesota, https://doi.org/10.18653/v1/N19-1423, 2019. a
Diodato, N., Ljungqvist, F. C., and Bellocchi, G.: A millennium-long reconstruction of damaging hydrological events across Italy, Sci. Rep., 9, 9963, https://doi.org/10.1038/s41598-019-46207-7, 2019. a
Ehrmanntraut, A.: Historical German Text Normalization Using Type- and Token-Based Language Modeling, arXiv [preprint], https://doi.org/10.48550/arXiv.2409.02841, 2025. a
Eichler, E. and Walther, H. (Eds.): Historisches Ortsnamenbuch von Sachsen, no. 21 in Quellen und Forschungen zur sächsischen Geschichte, Akademie, Berlin, ISBN 978-3-05-003728-8, 2001. a
Erfurt, M., Skiadaresis, G., Tijdeman, E., Blauhut, V., Bauhus, J., Glaser, R., Schwarz, J., Tegel, W., and Stahl, K.: A multidisciplinary drought catalogue for southwestern Germany dating back to 1801, Nat. Hazards Earth Syst. Sci., 20, 2979–2995, https://doi.org/10.5194/nhess-20-2979-2020, 2020. a
Ernst, P.: Deutsche Sprachgeschichte: eine Einführung in die diachrone Sprachwissenschaft des Deutschen, no. 2583 in utb Sprachwissenschaft, Facultas, Wien, 3rd edn., ISBN 978-3-8252-5532-9, 2021. a, b
European Severe Storms Laboratory (ESSL): European Severe Storms Laboratory: official website, https://www.essl.org/cms/ (last access: 24 September 2026), 2025. a
Giordani, A., Kunz, M., Bedka, K. M., Punge, H. J., Paccagnella, T., Pavan, V., Cerenzia, I. M. L., and Di Sabatino, S.: Characterizing hail-prone environments using convection-permitting reanalysis and overshooting top detections over south-central Europe, Nat. Hazards Earth Syst. Sci., 24, 2331–2357, https://doi.org/10.5194/nhess-24-2331-2024, 2024. a
Glaser, R.: Klimageschichte Mitteleuropas: 1200 Jahre Wetter, Klima, Katastrophen, Primus, Darmstadt, 3rd edn., ISBN 3-86312-350-6, 2013. a, b, c, d
Glaser, R.: HISKLID: Historische Klimadatenbank, https://freidok.uni-freiburg.de/proj/3720 (last access: 24 September 2026), 2014. a
Grotefend, H.: Taschenbuch der Zeitrechnung des deutschen Mittelalters und der Neuzeit, Hahn, Hannover, 14th edn., ISBN 978-3-7752-5177-8, 2007. a
Grzega, J.: Climatic Conditions and Lexis: Some Diachronic Notes on Weather‐Related Words in English and Other European Languages, T. Philol. Soc., 120, 320–331, https://doi.org/10.1111/1467-968X.12243, 2022. a
Gudd, M.: Gewitter und Gewitterschäden im südlichen hessischen Berg- und Beckenland und im Rhein-Main-Tiefland 1881 bis 1980, PhD thesis, Johannes Gutenberg-Universität Mainz, https://doi.org/10.25358/OPENSCIENCE-3426, 2004. a
Hawkins, E., Brohan, P., Burgess, S. N., Burt, S., Compo, G. P., Gray, S. L., Haigh, I. D., Hersbach, H., Kuijjer, K., Martínez-Alvarado, O., McColl, C., Schurer, A. P., Slivinski, L., and Williams, J.: Rescuing historical weather observations improves quantification of severe windstorm risks, Nat. Hazards Earth Syst. Sci., 23, 1465–1482, https://doi.org/10.5194/nhess-23-1465-2023, 2023. a
Huang, S.-Y., Wu, S.-Y., Chen, Y.-J., Tsai, R. T.-H., and Fan, I.-C.: Climate event classification based on historical meteorological records and its presentation on a Spatio-Temporal research platform, Digit. Scholarsh. Hum., 37, 1022–1032, https://doi.org/10.1093/llc/fqab099, 2022. a
Hulton, F. and Schultz, D. M.: Climatology of large hail in Europe: characteristics of the European Severe Weather Database, Nat. Hazards Earth Syst. Sci., 24, 1079–1098, https://doi.org/10.5194/nhess-24-1079-2024, 2024. a
Kahraman, A., Kendon, E. J., and Fowler, H. J.: Climatology of severe hail potential in Europe based on a convection-permitting simulation, Clim. Dynam., 62, 6625–6642, https://doi.org/10.1007/s00382-024-07227-w, 2024. a
Lamont, J. v.: Gewitterbeobachtungen von Ansbach, Burglengenfeld, Dillingen, Gunzenhausen, Hof, Hohenpeißenberg, Neustadt a.d.A., Würzburg von 1842 u. 1843, Annalen für Meteorologie, Erdmagnetismus und verwandte Gegenstände, 1844, 147–167, https://www.digitale-sammlungen.de/en/view/bsb10133287 (last access: 24 September 2026), 1844. a
Lenke, W.: Klimadaten von 1621–1650 nach Beobachtungen des Landgrafen Hermann IV. von Hessen (Uranophilus Cyriandrus), Tech. Rep. 63, Deutscher Wetterdienst, Offenbach am Main, https://www.dwd.de/DE/leistungen/pbfb_verlag_berichte/pdf_einzelbaende/63_pdf.pdf?__blob=publicationFile&v=3 (last access: 24 September 2026), 1960. a, b, c, d, e
Luterbacher, J., Allan, R., Wilkinson, C., Hawkins, E., Teleti, P., Lorrey, A., Brönnimann, S., Hechler, P., Velikou, K., and Xoplaki, E.: The Importance and Scientific Value of Long Weather and Climate Records; Examples of Historical Marine Data Efforts across the Globe, Climate, 12, 39, https://doi.org/10.3390/cli12030039, 2024. a
Martius, O., Hering, A., Kunz, M., Manzato, A., Mohr, S., Nisi, L., and Trefalt, S.: Challenges and Recent Advances in Hail Research, B. Am. Meteorol. Soc., 99, ES51–ES54, https://doi.org/10.1175/BAMS-D-17-0207.1, 2018. a
Porto Tapiquén, C. E.: Europe [shapefile], Orogénesis Soluciones Geográficas, Porlamar, Venezuela, based on shapes from Environmental Systems Research Institute (ESRI), https://github.com/efrainmaps/shapefiles-es (last access: 30 September 2026), 2015. a
Preußisches Meteorologisches Institut: Ergebnisse der Gewitter-Beobachtungen 1892/94, Behrend, Berlin, https://dwdbib.dwd.de/retrosammlung/periodical/titleinfo/586912 (last access: 30 September 2026), 1897. a
Punge, H. and Kunz, M.: Hail observations and hailstorm characteristics in Europe: A review, Atmos. Res., 176–177, 159–184, https://doi.org/10.1016/j.atmosres.2016.02.012, 2016. a
Reitzenstein, W.-A. F. v.: Lexikon fränkischer Ortsnamen. Herkunft und Bedeutung. Oberfranken, Mittelfranken, Unterfranken, C.H. Beck, München, ISBN 978-3-406-59131-0, 2009. a
Reitzenstein, W.-A. F. v.: Lexikon schwäbischer Ortsnamen. Herkunft und Bedeutung. Bayerisch-Schwaben, C.H. Beck, München, ISBN 978-3-406-65208-0, 2013. a
Sakaji, H. and Kaneda, N.: Indexing and Visualization of Climate Change Narratives Using BERT and Causal Extraction, in: 2023 IEEE International Conference on Big Data (BigData), 5674–5683, https://doi.org/10.1109/BigData59044.2023.10386320, 2023. a
Schätz, F.: Voraussetzungen und Grenzen der Auswertung klimarelevanter Informationen historischer Textquellen mit Hilfe von Automatisierungsprozessen, Dissertation, Albert-Ludwigs-Universität Freiburg, Freiburg im Breisgau, https://doi.org/10.6094/UNIFR/244079, 2023. a, b, c, d, e
Schätz, F.: HailBERT-de-v1, Hugging Face [code], https://doi.org/10.57967/hf/6989, 2025a. a
Schätz, F.: ThunderstormBERT-de-v1, Hugging Face [code], https://doi.org/10.57967/hf/6982, 2025b. a
Schätz, F. and Glaser, R.: Historical Climate Observations of Thunderstorms and Hail in Central Europe (1000–1900), FreiData [data set], https://doi.org/10.60493/834bd-mww13, 2025. a, b
Stahl, K., Kohn, I., Blauhut, V., Urquijo, J., De Stefano, L., Acácio, V., Dias, S., Stagge, J. H., Tallaksen, L. M., Kampragou, E., Van Loon, A. F., Barker, L. J., Melsen, L. A., Bifulco, C., Musolino, D., de Carli, A., Massarutto, A., Assimacopoulos, D., and Van Lanen, H. A. J.: Impacts of European drought events: insights from an international database of text-based reports, Nat. Hazards Earth Syst. Sci., 16, 801–819, https://doi.org/10.5194/nhess-16-801-2016, 2016. a
Taszarek, M., Allen, J., Púčik, T., Groenemeijer, P., Czernecki, B., Kolendowicz, L., Lagouvardos, K., Kotroni, V., and Schulz, W.: A Climatology of Thunderstorms across Europe from a Synthesis of Multiple Data Sources, J. Climate, 32, 1813–1837, https://doi.org/10.1175/JCLI-D-18-0372.1, 2019. a
Tornado and Storm Research Organisation (TORRO): The TORRO Hail Intensity Scale (H-Scale), https://www.torro.org.uk/research/hail/hscale (last access: 24 September 2026), 2025. a, b
Webersinke, N., Kraus, M., Bingler, J. A., and Leippold, M.: ClimateBert: A Pretrained Language Model for Climate-Related Text, arXiv [preprint], https://doi.org/10.48550/arXiv.2110.12010, 2022. a
Wilks, D. S.: Statistical methods in the atmospheric sciences: an introduction, Elsevier, Amsterdam, 4th edn., ISBN 978-0-12-816527-0, 2019. a, b, c
Zhou, B., Zou, L., Mostafavi, A., Lin, B., Yang, M., Gharaibeh, N., Cai, H., Abedin, J., and Mandal, D.: VictimFinder: Harvesting rescue requests in disaster response from social media with BERT, Computers, Environment and Urban Systems, 95, 101824, https://doi.org/10.1016/j.compenvurbsys.2022.101824, 2022. a