the Creative Commons Attribution 4.0 License.
the Creative Commons Attribution 4.0 License.
 | 21 Jan 2026
A continuous 6000 a age depth relationship for the remainder of the Weißseespitze summit glacier based on 39Ar and 14C dating
David Wachs
Azzurra Spagnesi
Pascal Bohleber
Andrea Fischer
Martin Stocker-Waldhuber
Alexander Junkermann
Carl Kindermann
Linus Langenbacher
Niclas Mandaric
Joshua Marks
Florian Meienburg
Theo M. Jenk
Markus K. Oberthaler
Werner Aeschbach
Associated with ongoing global warming, prolonged periods of negative mass balance affect even Alpine glaciers in high summit regions, which are also prime candidates for paleoclimate-related ice core studies. This greatly complicates the already challenging task of establishing an age-depth relationship where now both, the age at depth and at the surface is an unknown. Radiometric ice dating methods are an important key to tackle this challenge. This study presents a comprehensive age-depth profile of the summit glacier of Weißseespitze (WSS, 3500 m a.s.l.) in the Austrian Alps, utilizing a combination of radiometric dating methods – 39Ar and 14C. Ice cores from drilling campaigns conducted in 2019, 2023, and 2024 were analyzed to overcome challenges posed by extensive ice loss and surface melting that limit traditional dating techniques. All 39Ar samples were measured using atom trap trace analysis (ATTA). Surface mass balance (SMB) data since 2019 were used to align core depths across years, and all samples were referenced to height above bedrock to standardize comparisons.
Age modeling using least squares fitting and Monte Carlo sampling was performed for three glaciological models: Nye, Raymond, and a two-parameter (2p) model to test their applicability. The 2p model provided the best fit ( = 0.4), closely matching the data and providing a continuous age-depth scale. The model yielded a mean accumulation rate of 0.53 m w.e. a−1 (1σ range: 0.38–0.63 m w.e. a−1) and a thinning parameter p = 0.92 (1σ: 0.81–0.97), the former agreeing with current accumulation estimates.
The results show that the surface ice dates back approximately 400 a, emphasizing the extent of recent ice loss. Apart from this, the continuous age-depth relation shows no sign of prolonged periods of mass loss at WSS within the 6000 a glaciation history prior to today.
This work underscores the utility of 39Ar dating in alpine glaciology, enabling precise reconstruction of age-depth relationships even under advanced glacial retreat and enhancing our understanding of Holocene climate history in the Eastern Alps.
- Article
(2215 KB) - Full-text XML
-
Supplement
(1020 KB) - BibTeX
- EndNote


Glaciers constitute one of the most valuable climate archives on Earth. They do not only record climate variability in their size and location, under specific conditions they can also archive atmospheric signals in their ice matrix and the enclosed bubbles. While polar ice sheets provide long records on global climate signals (e.g. EPICA community members, 2004), non-polar glaciers record more regional signals. However, as they are located in closer proximity to human settlements, they are also able to record the anthropogenic impact on a regional scale. High elevation glaciers can hereby provide continuous signals covering large parts of the Holocene (Bohleber, 2019; Bohleber et al., 2018; Jenk et al., 2009; Legrand et al., 2025). However, with the current mass loss of Alpine glacier ice an almost complete disappearance of glaciers from most parts of the Alps is expected within this century (Hartl et al., 2025b). Therefore, there is particular urgency to retrieve the ice records before they are irrevocably gone.
A crucial step toward a meaningful interpretation of any signal from an ice core is the construction of a precise and robust chronology. For Alpine glaciers the common approach via layer counting often fails because of complex wind-dominated snow deposition and rapid layer thinning with depth. Furthermore, the prolonged negative surface mass balance associated with ongoing warming adds a new level of complexity: the melting of the surface leading to unknown surface ages. Under these circumstances, radiometric dating methods are the only way to determine a chronology for an ice core (e.g. Festi et al., 2021). With the current persistent mass loss, surface ages can be in the range of several centuries. In this age range on the one hand traditionally applied tracers like 3H and 210Pb fail due to their short half-lives and on the other hand 14C dating is hampered due to ambiguities in the calibration curve and the low carbon content of ice (Ramsey, 1995; Reimer et al., 2013). To cover the intermediate age range that is present in the upper layers of most Alpine ice caps, the radiometric dating tracer 39Ar is the optimal candidate. With a half-life of 268 ± 3 (Golovko, 2023) it spans an age range of roughly 50–1000 a. After a first application to ice samples by Feng et al. (2019) and to an ice core by Ritterbusch et al. (2022) it is now available as a routine measurement for glacier ice dating. First examples for the value of 39Ar in glacier dating in combination with micro-radiocarbon ages have been provided by Legrand et al. (2025) and Hou et al. (2025).
In this work, the 39Ar dating tracer is applied to the upper part of the summit glacier of the Weißseespitze (WSS, 3500 m a.s.l.), Austria. The glacier has a dome shaped geometry, a rare feature for Alpine glaciers, which is favorable for the preservation of old ice. In combination with the 14C data presented in Bohleber et al. (2020), the complete remaining ice profile is now covered by radiometrically measured ages. By applying different models to the age-depth profile, a suitable model is determined (2p model, Bolzan, 1985; Thompson et al., 1990) and a continuous time scale is established despite 80 % of the original glacier already having disappeared.
The time scale reaches from a 2019 surface age of almost 400 a back to about 6000 a at the base of the glacier. It is an example of the relevance of a combination of 39Ar and 14C to cover the age profile of a glacier in times where surface ages have become unknown due to mass loss, calling for radiometric dating methods to fill the gap.
The WSS summit glacier (3500 m a.s.l.) marks the highest point of the Gepatschferner glacier. Its dome-shaped geometry makes it particularly interesting as it offers conditions of very slow ice flow and therefore good preservation conditions for old ice. Figure 1 shows an overview of the study site as well as photos depicting the summit glacier (also see Fig. S1 in the Supplement for further aerial photos of the summit region). Measurements of borehole temperatures indicate that the ice is still frozen to the bedrock with mean annual ice temperature at the lowest sensor (∼ 1 m above bedrock) at around −3.3 °C and maximum values not exceeding −2.6 °C (Bohleber et al., 2020; Fischer et al., 2022; Stocker-Waldhuber et al., 2022b). The ice thickness of the summit glacier was measured to be 10 m at the ice divide by Bohleber et al. (2020) and is rapidly declining (compare Table 1 and Fischer et al., 2022; Hartl et al., 2025a; Stocker-Waldhuber et al., 2022a). Fischer et al. (2022) provides a detailed discussion of historical sources and states a maximum elevation of the ice cap at the end of the 19th century at about 3534 m a.s.l., translating to an ice cap thickness of about 47 m. Current average surface mass loss rates are projected to result in a complete loss of the summit glacier within the next 10–20 a. Recent ice thickness measurements from 2025 revealed a remaining ice cap thickness of less than 6 m close to the drilling site.
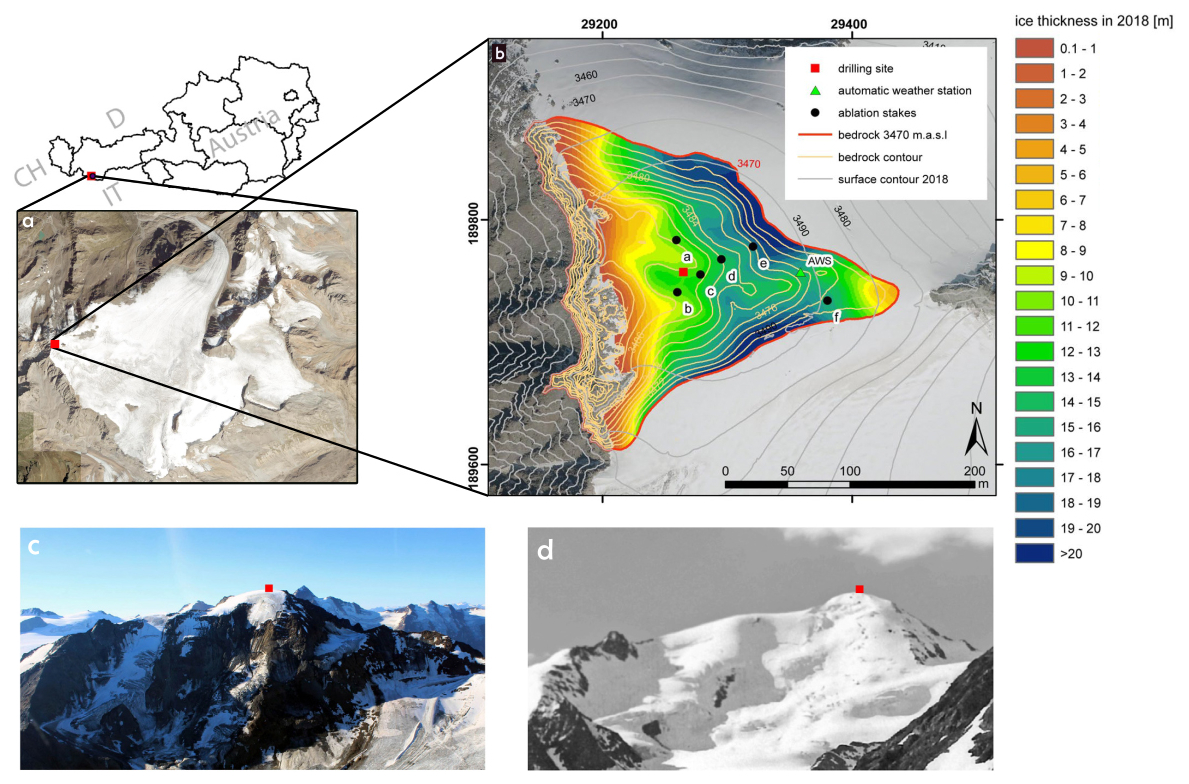
Figure 1Drilling site at the summit glacier of Weißseespitze (red square), source: http://maps.tirol.gv.at (last access: 23 October 2024) (a). Bedrock topography from the GPR measurements and calculated ice thickness in 2018 (from Fischer et al., 2022) (b). View of the Weißseespitze ice cap in (c) 2019 and (d) 1930. Adapted from Fischer et al. (2022) and Spagnesi et al. (2023).
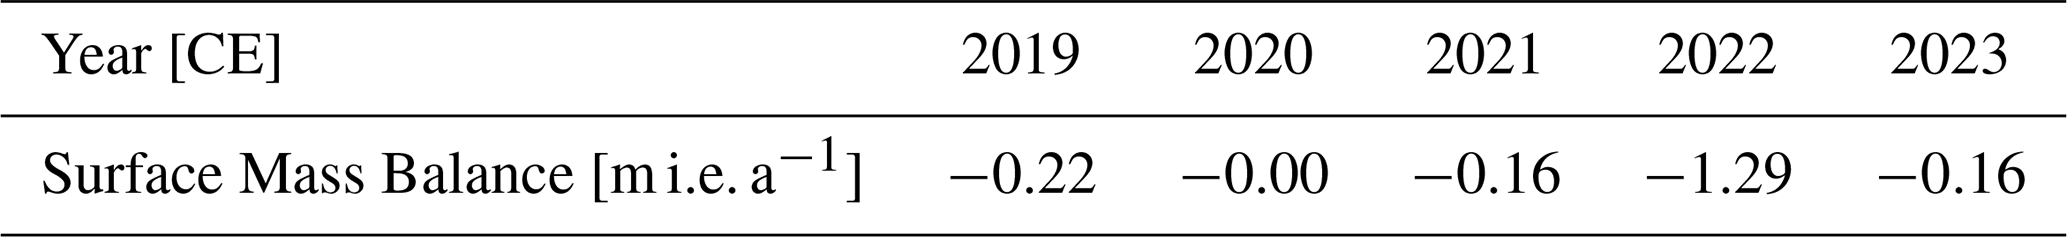
Table 1Annual SMB taken from Stocker-Waldhuber et al. (2025) and Hartl et al. (2025a). The values indicate the mass loss during the summer of the respective year. The sampling at WSS always took place in the spring before the mass loss of the respective year.
Furthermore, also the basal layers will soon rise above 0 °C in temperature and cause the loss of the oldest ice remains frozen to the bedrock, which constitute an alternative climate signal for periods of low ice cover in the Alps (Bohleber et al., 2020).
2.1 Surface Mass Balance and depth-scale alignment
Combining the data sets from ice samples retrieved in different years allows for a complete coverage of the profile of the ice sheet on WSS by measured ages. However, as the cores taken in 2023 and 2024 were not drilled to bedrock and no common horizon was visible in the ice, the depth scale has to be established from the annual surface offsets. For this, the annual SMB, listed in Table 1, is considered. As indicated by Fischer et al. (2022) and Hartl et al. (2025a), the ablation can vary strongly across the summit region where differences between ablation stakes of up to 75 cm were seen. Furthermore, despite using a precise GPS to find the drilling location from former years, spatial deviations of up to 10 m are possible. Figure 1b shows that this can lead to depth topography changes of up to about 2 m. However, the effect is probably significantly smoothed out by the snow and ice build-up and effects like wind erosion. A well-visible dust layer that melted out quite homogeneously across the summit region in 2022 (see Fig. S2), rather points towards spatial layer height variations around 10–20 cm. In consequence, depth values of years other than 2019 are shifted according to the values in Table 1 and a conservative error of 1 m is estimated. GNSS measurements at the ablation stake positions show that the horizontal movement is almost zero, as can be expected for the ice divide setting with the remaining relatively thin ice cover. All (repeated) point measurements of the stake positions are located within a few meters to each other and are randomly distributed within the measurement accuracy (compare Fig. 2 in Hartl et al., 2025a). Horizontal movement, therefore, did not further affect the alignment of the drilling position.
Furthermore, as depth always refers to a reference surface, which in this setting is changing over time, everything is discussed in terms of height over bedrock in the following, instead of depth below some annual surface. The conversion was done with the 2019 thickness of the ice sheet of 10.2 m (from the logging data of the 2019 sampling campaign, length of core 1) and the surface mass balance listed in Table 1. With this measure, a more general metric is established, which can more easily be applied to potential future ice cores that are drilled to bedrock. Nonetheless, because the wording is otherwise uncommon, the profile of ages throughout the ice column is still referred to as age-depth profile.
2.2 Last steady state
All the models which are used in the following to fit the data describe glaciers in a steady state. This means that the conditions at the last steady state (LSS) at WSS have to be estimated and the models have to be fitted accordingly. The basic Sorge's law of glaciology states that the age-depth profile of an ice sheet remains constant under steady-state conditions. From Fischer et al. (2022), WSS is estimated to have experienced its LSS around the year 1914 ± 50 at an ice thickness of 47 ± 10 m. The timing of the LSS was chosen as the last time interval which showed no significant ice loss. However, accounting for the low accuracy of the early data stemming mostly from old maps and aerial photos, a conservative error of 50 a is chosen. This way, the LSS is estimated to lie between the Little Ice Age (LIA) maximum around 1864 and the beginning of in situ SMB measurements in 1969. With these estimates, the measured ages can be shifted to the time of the last steady state to fit the models before translating the age profiles back to 2019.
3.1 Sample retrieval and processing
In March 2019, two parallel ice cores were drilled at the ice divide with nearly flat bed conditions. Analysis for micro-radiocarbon ice dating was performed on discrete samples from one of the cores at the Paul Scherrer Institute (PSI), and 3H was measured on three additional shallow cores from the same location at Seibersdorf Laboratories (Bohleber et al., 2020). The 3H analysis showed no sign of the elevated levels from after the 1960s, indicating surface ages beyond 60 a. The radiocarbon analysis, conducted for samples from the lowest 6 m above bedrock, revealed an age profile that increases with depth reaching a maximum calibrated 14C age of approximately 6000 a at the bottom and decreasing to below 1000 a at approximately 5 m above bedrock. A comprehensive account of the data set and the sample processing can be found in Bohleber et al. (2020).
To better constrain the ages at the top of the ice column, several sampling campaigns have been conducted in recent years to obtain ice for 39Ar dating. In June 2023, a first attempt to retrieve a new core at the summit of WSS was conducted, however retrieving only 2.16 m with a thermal 3′′ drill due to equipment failure.
A second attempt was conducted in May 2024, which again experienced a failure of the drilling equipment. Still, four surface samples and several cores (both, thermally and mechanically drilled) were taken. An overview of the sampling of the different years is given in Fig. 2.
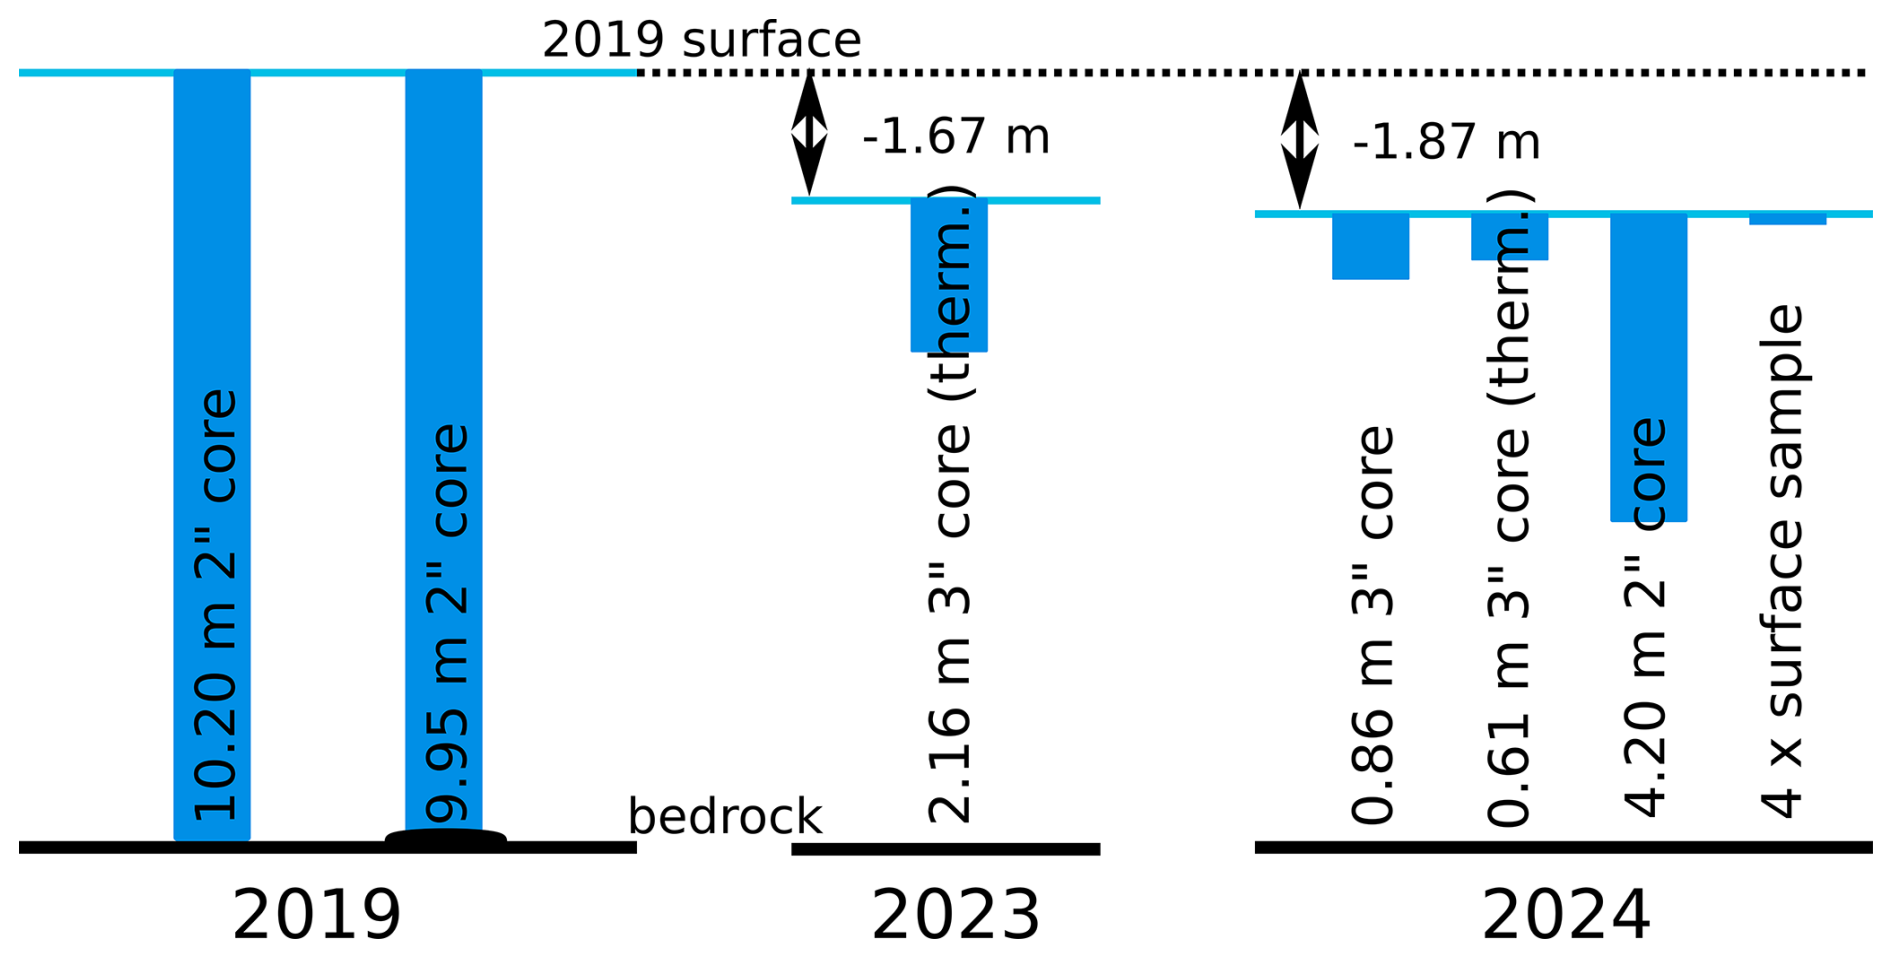
Figure 2Overview of the ice core drilling of different years. Indicated are the length of the samples, the type of sample (retrieval method) as well as the changes in surface height above bedrock between the sampling years.
For the 2023 and 2024 campaigns, the ice was packed into insulation boxes on site and transported to the cold-room facilities (−20 °C) at the Institute of Environmental Physics, Heidelberg. Here, the ice was decontaminated by cutting off the outer 2 mm and the gas in the air bubbles extracted and purified following the procedure described by Feng et al. (2019) and Arck et al. (2025). The combined ice pieces were transferred into a 12.6 L stainless steel container and after evacuating the container, the ice was melted and the released gas captured on liquid nitrogen cooled activated charcoal traps. To purify the contained argon, all reactive gases were removed using two getters at 900 °C and room temperature in series (Arck et al., 2025). The remaining > 98 % pure argon gas was collected on an activated charcoal trap. Using this method, between 0.4 to 1 mL of pure argon was extracted from 2.5 to 4.6 kg of sample ice.
3.2 39Ar measurement and analysis
39Ar measurements were conducted in the ATTA laboratory at the Kirchhoff-Institute for Physics, Heidelberg. The atom-optical ATTA method enables the cooling and trapping of individual atoms in order to count them (for details see Ebser et al., 2018 and Lu et al., 2014). 39Ar is measured as an isotopic abundance (39Ar/Ar) and reported in percent modern argon (pmAr), which is the sample abundance normalized to the modern atmospheric abundance (RA). By comparing the obtained count rate to reference measurements with known isotopic abundance, the 39Ar abundance in the sample can be inferred. With usual count rates of around 6 39Ar atoms h−1 for modern concentrations, sample measurements were conducted in a gas recycling mode over 20 h to ensure high enough statistics (Ebser et al., 2018; Feng et al., 2019). Reference measurements were done with an enriched reference gas (10 RA), which was measured for 2 h to obtain similar statistics to the samples. Furthermore, to account for background counts in the apparatus, blank measurements are conducted on a weekly basis and incorporated into the data analysis.
The newly developed data analysis applied in this work incorporates all reference and blank measurements over a measurement period with an unchanged, stably operating apparatus, typically spanning one to several weeks. The data analysis employs the underlying Poissonian statistics of atom counting to fit the time between atom detection events with the exponential distribution
where denotes a rate parameter which is a function of the abundance in the sample, the performance of the apparatus (determined by the reference measurements), and of Δt itself due to contamination build-up in the system. The rate of the latter is determined by blank measurements. The contamination build-up originates from the recirculation of the sample gas in the apparatus allowing for an accumulation of degassing 39Ar from the vacuum parts. Furthermore, the data evaluation routine performs a quality check of the measurement by testing for statistical outliers in the atom detection frequency, rejecting irregular measurements due to potential instabilities in the measurement. The details of the data analysis routine will be published elsewhere.
The measurements were carried out as part of a measurement period of several months in 2024 during which the measurement operation was continuously working under very stable conditions regarding count rates and blank measurements. Reference, sample and blank measurements were carried out under strictly equal conditions.
The resulting 39Ar abundance is translated to an age using the 39Ar half-life of 268 ± 3 a and a reconstructed atmospheric input curve similar to Gu et al. (2021).
Radiometric age dating
Table 2 gives an overview of all measured samples. The 39Ar samples are from the 2023 and 2024 sampling campaigns. All ages are already corrected for the varying atmospheric input function. Two samples, indicated with an asterisk, did not provide enough gas for a measurement and had to be diluted with 39Ar-free Ar. The presented abundances and ages are already corrected for this mixing.
Table 2Overview of all samples from the 2019, 2023 and 2024 ice cores which were analyzed for 39Ar and 14C. The 39Ar measurements were conducted in Heidelberg, 14C measurements originate from Bohleber et al. (2020), except for sample 15, which was analyzed in 2024. The height above bedrock values are calculated as indicated in Sect. 2.1 Surface Mass Balance and depth-scale alignment. Ages are given in years as input curve corrected values before 2019. Argon values with an * indicate samples which were diluted with 39Ar dead argon prior to the measurement to provide enough gas. The shown pmAr and age values are already corrected for this dilution. Italicized samples were not considered in the final analysis due to reasons discussed in section “Radiometric age dating”.
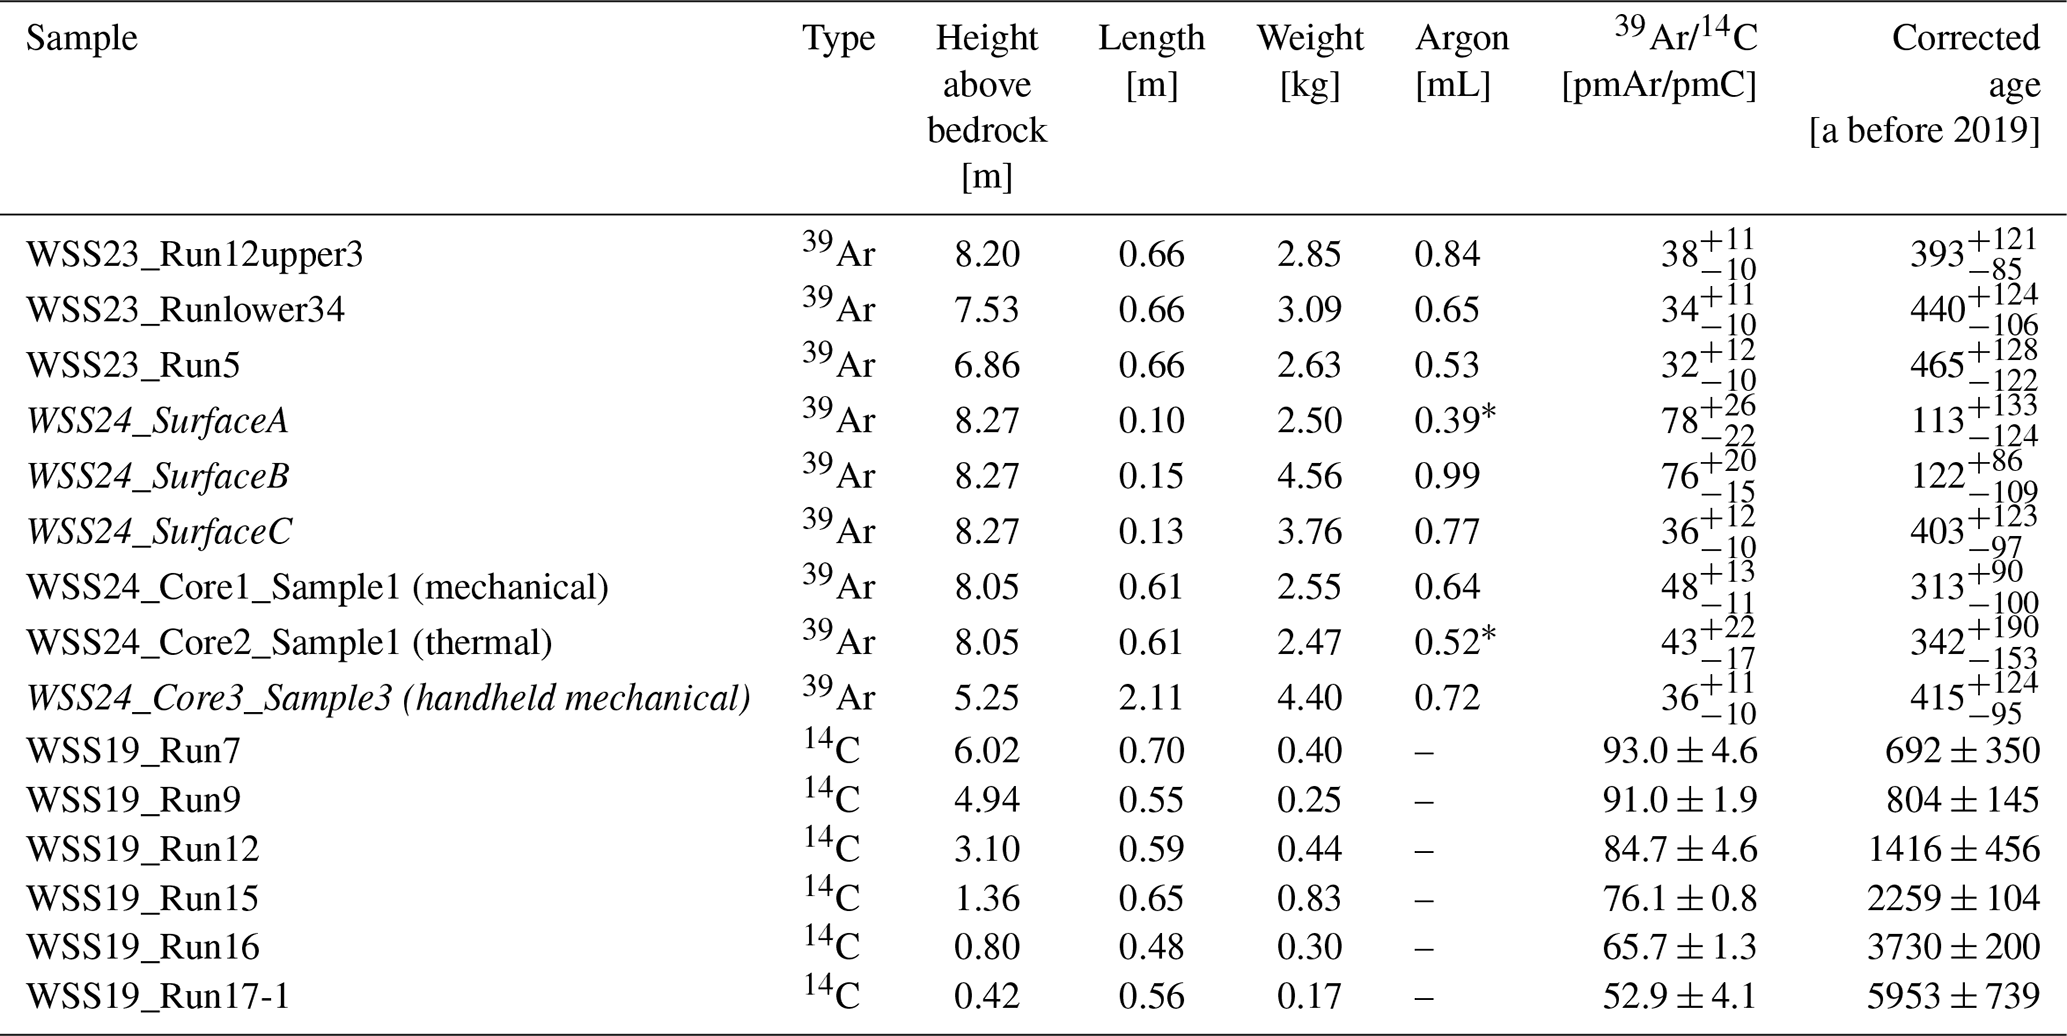
The 14C samples were measured on an ice core from 2019 and all except one are presented in the publication by Bohleber et al. (2020). The additional data point of the same core, WSS_Run15, was also measured at PSI in 2024 and added to the dataset.
Figure 3 shows a depth profile of all 39Ar and 14C ages. The colors indicate the different years of sampling. Furthermore, data points not considered in the following are indicated in red. This selection was due to several quality checks. The samples WSS24_SurfaceA and WSS24_SurfaceB were discarded due to atmospheric contamination originating from incomplete cleaning of the ice prior to the gas extraction. Sample WSS24_Core3_Sample3 consisted of very brittle ice and was therefore likely to incorporate modern atmospheric air. Finally, sample WSS24_SurfaceC did not pass the final data analysis due to unstable measurement conditions.
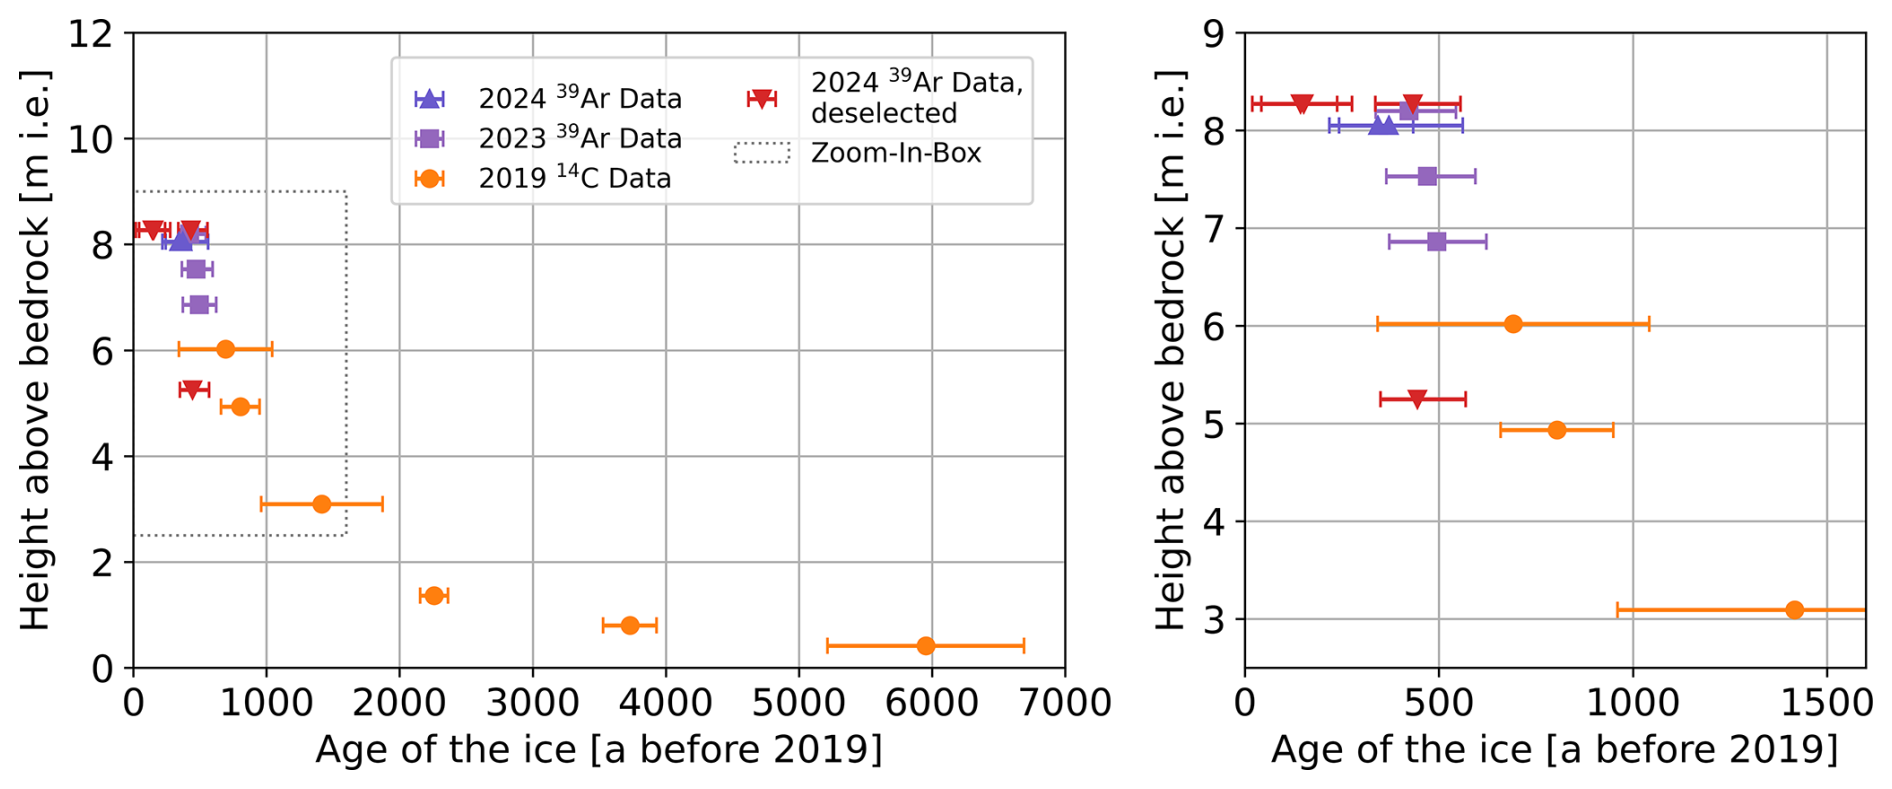
Figure 3All 39Ar and 14C data points from WSS plotted as age vs. height above bedrock (in meters ice equivalent (m i.e.)), depth intervals of the data points are not included for better visibility. On the left, the full profile can be seen, on the right a close-up view of the upper (younger) part is displayed. Data from different years are indicated in different colors. The red data points did not pass the quality checks as discussed in the main text and will be omitted from further analysis.
5.1 Age models
Three models were fitted by least squares (Python Scipy curve_fit, Virtanen et al., 2020) to the combined 39Ar and 14C data to test their applicability to the setting. In the following, all models are stated in terms of the age t in dependance of the height above bedrock h. The relation of h to the otherwise employed depth coordinate z is given by , with H being the ice thickness in the steady state.
The first applied model is given by the Nye timescale (Nye, 1957, 1963), described by
where the model parameter b denotes the accumulation rate.
The second applied model was proposed by Raymond (1983) and is conceptualized for an ice-divide type setting:
The third model fitted to the data is the 2-parameter (2p) model by Bolzan (1985) and Thompson et al. (1990), which was successfully applied to an Alpine ice core from Colle Gnifetti by Jenk et al. (2009) and is given by:
Effectively, the 2p model adds a thinning parameter p to the Raymond model that was originally added to account for a non-isothermal polar ice sheet (Bolzan, 1985). For p = 1, the 2p model equals the Raymond model.
5.2 Monte Carlo sampling and fitting
To obtain sensible age error estimates for the models, a Monte Carlo (MC) sampling based approach was developed. Both the 39Ar and the 14C age data are given by non-symmetric probability distributions. Their non-Gaussian shape stems from the non-linear relationship between isotope abundance and age due to the exponential radioactive decay law as well as the varying atmospheric input functions of both tracers, and, in the case of 39Ar, the underlying counting statistics of the 39Ar measurement. To consider the full information of the distributions, an approach via MC sampling from the age distributions was taken. For each realization the distribution of each sample age was sampled and the obtained ensemble fitted with the model. The fitting of each realization was done by least squares fitting. While the best fit was obtained from fitting the measured values, the age uncertainties of the models at each depth were taken as the respective quantile of the MC fit realizations at each depth. Thus, the full complexity of the distributions for each data point can be accounted for in the fitting procedure. This was done for the data at hand with a sampling number of nMC = 105.
Additional to the sampling from the age distributions of each measurement, the depth uncertainty of the 39Ar measurements derived from the depth scale alignment (see Sect. 2.1 Surface Mass Balance and depth-scale alignment) with an error of 1 m as well as the timing and thickness uncertainties for the LSS (1914 ± 50, 47 ± 10 m, see Sect. 2.2 Last steady state) of the glacier were MC sampled as Gaussian distributed values with the indicated values as 3 standard deviations. The following analysis is conducted for height in meters ice equivalent (m i.e.), however no assumptions have been made regarding the firn thickness at the LSS, which would introduce a small thickness reduction in units of m i.e. due to the low firn density. Exemplary model fits showed no mentionable difference (few permille) in the age-depth relation for firn layers around 20 m.
With this approach, the non-linear interplay of the different parameters and their uncertainties are considered in the final age uncertainties by fitting statistically distributed data ensembles which contain all uncertainties in their distributions.
There is a distinct difference between the two employed tracers. While 14C dates the microscopic carbon deposits in the ice and thus the actual ice matrix, 39Ar dates the gas trapped in the ice. The time interval between snowfall and the pore close-off further down in the firn column causes an age difference between dating tracers in the ice matrix and the gas, referred to as Δage. To correct for this difference, 30 a of Δage were added to the 39Ar ages in the fitting process, an estimate based on the findings at nearby glaciers by Festi et al. (2021) and Gabrielli et al. (2016).
5.3 Difference between models
Table 3 lists the fitting results for the three models. From its last column, displaying the reduced chi-squared value, it is apparent that the Nye model is not able to capture the age profile of this ice cap. The model does not capture the thinning of the annual layers in the deeper parts as is also apparent from the visualization in Fig. 4. The two other models, conceptualized for an ice divide setting, are better suited to describe the age-depth relationship at WSS because of the dome shaped summit glacier. Due to its flat bed and therefore low flow conditions, it resembles the setting of an ice divide. The for the Raymond and 2p model are below 1 and thus demonstrate the good applicability of the models. As the 2p model shows the better fit quality it will be discussed in more detail in the following.
Table 3Parameters for the best fit of the measured data and the 1σ boundaries from the MC fitting. Accumulation rate values are converted to meter water equivalent (m w.e.) by multiplying with an ice density of 900 kg m−3 (Festi et al., 2021).
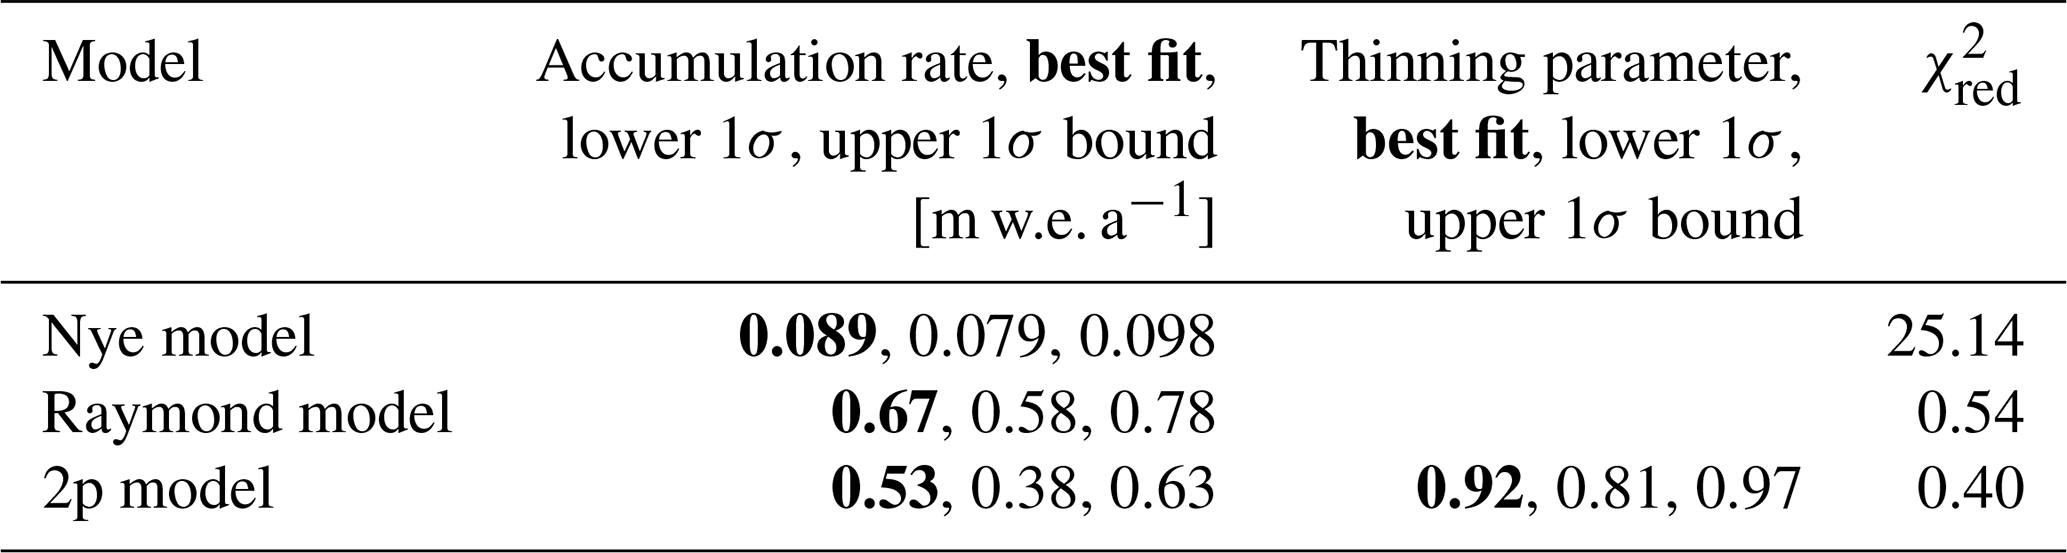
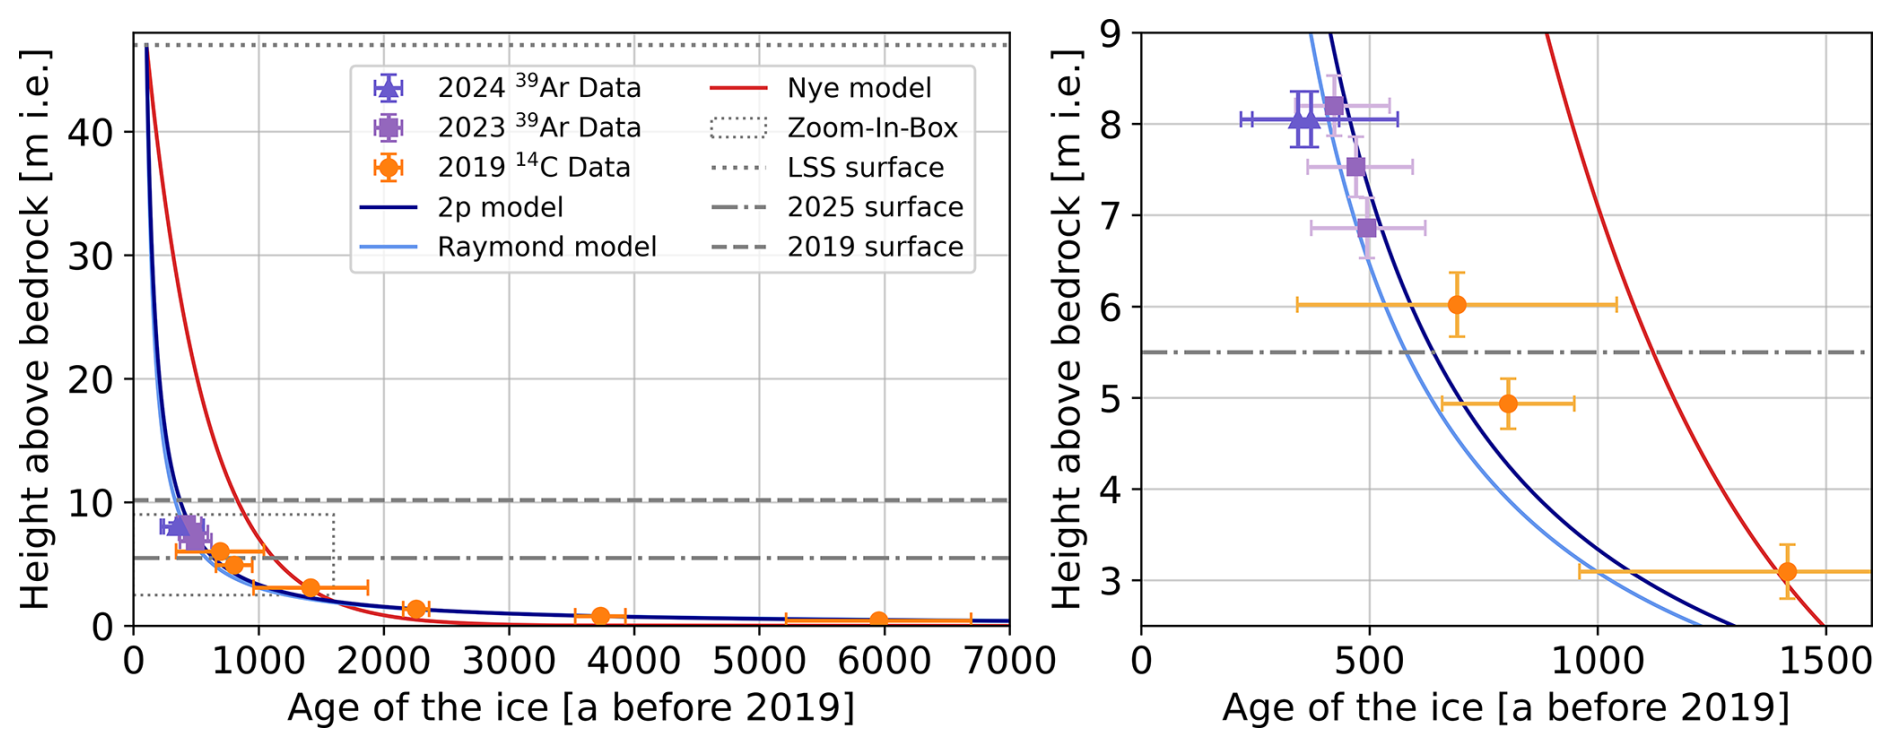
Figure 4Plot of the best fits of the different models (the respective parameters can be found in Table 3) and age data points vs. their height above bedrock (in meters ice equivalent). The maximum of the height axis is set to the last steady state (LSS) from 1914 (47 m ice thickness) and thus the full age-depth profile during the LSS is shown. The left side shows the full profile; the right side shows a close-up view of the younger section. The depth error bars indicate the length of the sample, not the depth uncertainty.
5.4 Surface ages
In the case of a glacier which is losing significant amounts of ice on its surface every year, each surface age needs an indication of the year it refers to. For the years 2023 and 2024, the uppermost 39Ar measurements show ages of 300–400 a (compare Table 2). However, the samples consist of more than 60 cm long core pieces, so that a precise surface age cannot be given. Unfortunately, all three measurements from more shallow surface blocks had to be discarded (compare section “Radiometric age dating”).
From the 2p model, the surface age for 2019, at 10.2 m above bedrock, is a, for 2023 a, and for 2024 a. The surface loss between 2019 and 2023 amounted to 1.67 m, while between 2023 and 2024 only 16 cm were lost.
These ages are clearly pre-industrial and show how far the prolonged mass loss is diminishing ice core records in Alpine regions and that 39Ar was the only tracer to accurately constrain the surface age of this glacier. While tracers like 3H or 210Pb can determine young surface ages and thus complement 14C ages from lower layers, this is often not possible anymore with the progressing melting of glaciers in the Alps. Without reliable surface ages, however, even if e.g. layer counting is possible, it can only provide a floating age-depth relationship with limited informative value.
The presented data set shows an example of the reconstruction of the age-depth relationship from a glacier of which only the lower ∼ 20 % are remaining, a setting which will become more frequent in the coming years. The combination of 39Ar and 14C data allows to fully cover of the important age ranges.
Also depicted in Fig. 4 is the 2025 spring glacier surface after the 2024 summer melt, leaving the ice cap at a thickness of less than 6 m and emphasizing the rapid decline of the glacier.
5.5 Accumulation rate
One of the parameters fitted by the 2p model is the accumulation rate. However, the interpretation of the result is not trivial, as data from 6000 a is fitted to obtain this value. Due to the changing climatic history of the region and probably also changing weather patterns it cannot be expected that this parameter remained constant over time. Therefore, the result should be understood as a net accumulation rate parameter that gives a rough estimate of the long-term net accumulation rate average over the last six millennia. It should be noted that this does not trivially translate into a precipitation rate or other climatic factors. The 2p model results in a best fit value of b = 0.53 m w.e. a−1, with 68.3 % of the MC realizations resulting in values between 0.38 and 0.63 m w.e. a−1 (1σ interval). Within the 1σ interval this agrees with the value of 0.59 m w.e. which Fischer et al. (2022) gives for the total precipitation in months of snow accumulation for the years 1800 to 2014 (based on the HISTALP data from Auer et al., 2007).
The other fitted parameter, the thinning parameter p, results in a value of p = 0.92, with 68.3 % of the MC realizations resulting in values between 0.81 and 0.97. This parameter was introduced by Bolzan (1985) to account for non-isothermal conditions in the ice sheet, with p = 1 being the result for isothermal conditions (Raymond model). It is therefore not surprising to obtain a value close to 1 for a thin Alpine glacier, as was also found in the study of Jenk et al. (2009) for Colle Gnifetti (p = 0.867 ± 0.048).
5.6 Age-depth profile
With the 39Ar data points completing the coverage of the whole ice column with measured ages and a suitable model to fit the data, the age-depth profile of the WSS summit glacier is well constrained. In Fig. 5 the resulting best fit of the 2p model and its uncertainties are displayed in an overview plot as well as a residual plot. The uncertainty ranges of the model (for 1σ, 2σ, and 3σ shaded in different shades of blue) are computed as the respective quantiles from the distribution of the MC model fit realizations at each depth and therefore incorporate all measurement and LSS uncertainties. Figures S3 and S4 give an overview of the distribution of the fit parameters for all fit realizations with indicated best fit parameters.
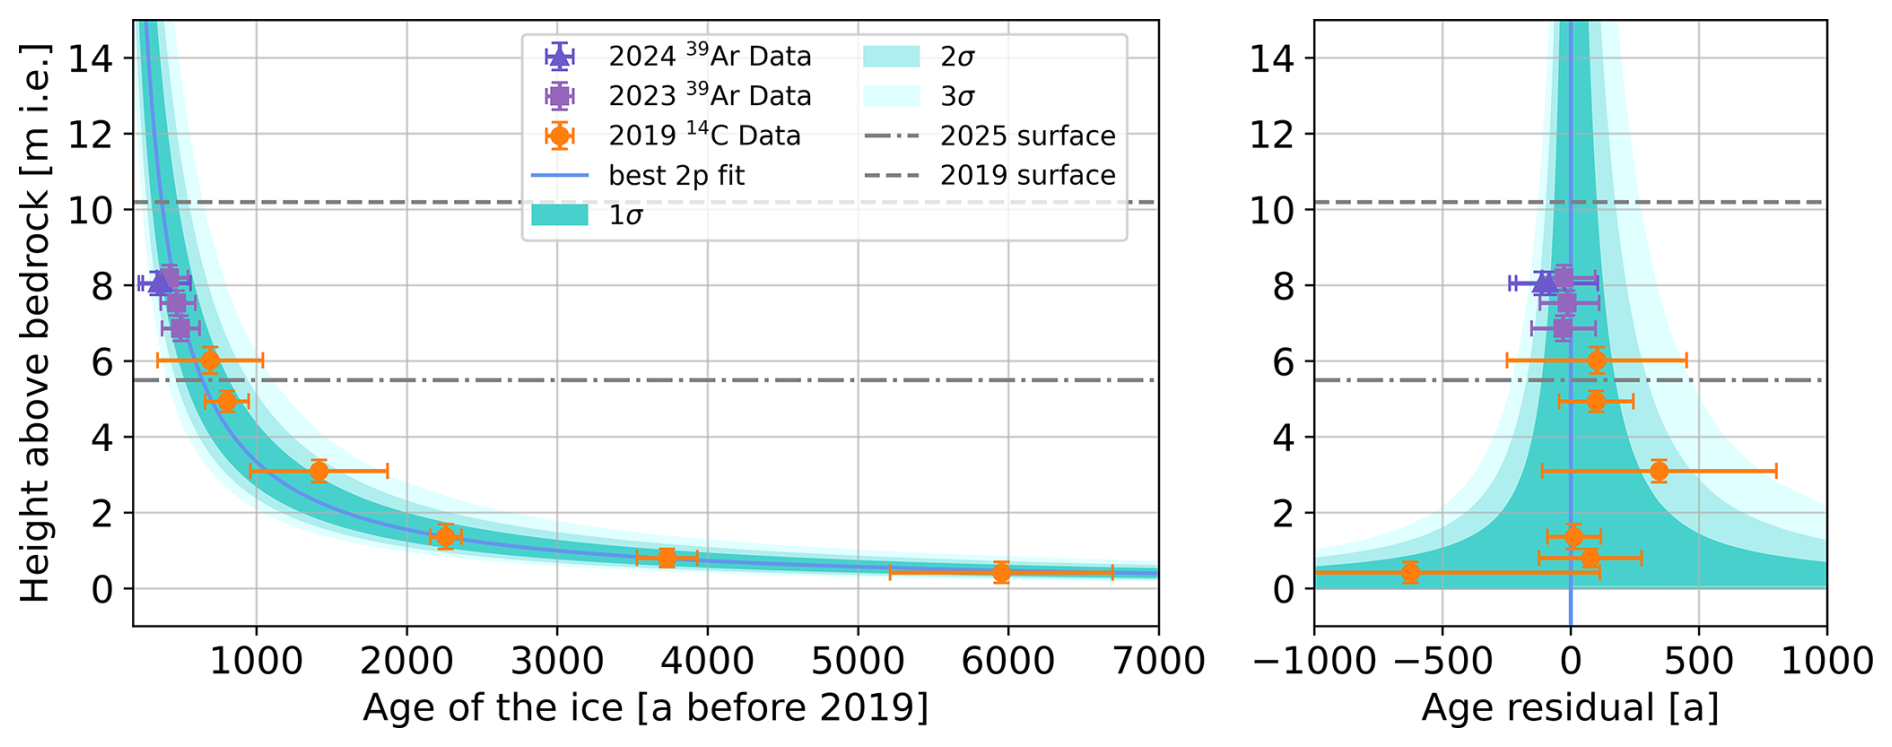
Figure 5Plot of the age-depth relationship from the 2p model on the left. On the right, a residual plot of the model and data points for better visualization. The shaded areas indicate the model age uncertainties obtained from the 1σ, 2σ, and 3σ values from the MC fitting. The depth error bars indicate the length of the sample, not the depth uncertainty.
Considering the large amount of ice loss observed at WSS over the past decades, the question arises if the WSS summit has experienced similar periods of strong mass loss during the ∼ 6000 a recorded in the glacier ice. At least for the past 2000 a, a hiatus in the order of 400 annual layers seems to be unlikely given the good fit of the model to the data with errors of measurements and fit well below 400 a. For deeper layers, this is harder to constrain as the absolute errors of the 14C ages increase. Overall, melt events erasing several hundred years cannot be excluded for times > 2000 a BP, however indications for such events are absent in the dataset.
The models employed in this work are certainly simplifications. However, in order to draw conclusions from the limited data set, the complexity has to be reduced by a model. By the successful application of the 2p model in this work, we show that we can generate a good fit that is consistent with the hypothesis of no hiatus based on a simplifying assumption. This simplifying assumption is that of a constant net accumulation rate and thinning parameter over the whole profile of the ice column. In order to assess if this assumption is tenable, we performed a model fit with only the lower six sample ages, which represent all 14C samples and compare them to the full fit. It results in an accumulation rate parameter of blower = 0.42 (1σ interval: 0.30 to 0.56) [m w.e. a−1]. Comparing this to the original value of b = 0.53 (1σ interval: 0.38 to 0.63) [m w.e. a−1] ascertains that they only deviate within their 1σ intervals and therefore the difference is not significant. The same applies to the thinning parameter (plower = 0.84; 1σ interval: 0.72 to 0.93). This result gives confidence that the net accumulation rate did not significantly change between the older and younger parts of the ice profile, at least to the degree to which we can resolve it. Thus, the 2p model, despite its simplifying assumptions, does not lead to a problematic oversimplification and is able to capture the important aspects of the setting at the WSS summit glacier. The interpretation of this seemingly stable net accumulation rate in terms of climatic factors at this location is not trivial and can hardly be done in a non-speculative way with the data at hand. It will have to be done elsewhere in conjunction with more data.
A second conclusion can be drawn from comparing the purely 14C data based model analysis with the one containing all 14C and 39Ar sample ages. The consistency between the fit results ascertains the compatibility of the dating techniques and shows how 39Ar data helps to determine the younger parts of an age-depth model based on data and not only as a pure extrapolation of the older part.
In summary, this study shows the great value that 39Ar dating has for alpine ice core dating. On the one hand, it provides surface ages where they become increasingly old thereby surpassing the range of traditional dating tracers. It can, on the other hand, also complete age-depth profiles where surface ages might still be acquired, but an obvious age data gap is present between the young age tracer results and the old ones as seen for example in the work of Jenk et al. (2009) and Gabrielli et al. (2016). Legrand et al. (2025) for the first time demonstrated the smooth closure of such a gap with 39Ar in a long ice core from the high elevation summit glacier at Dôme du Goûter. More recently, also Hou et al. (2025) presented a similar combination of 210Pb, 39Ar, and 14C to cover the full dating range of a Tibetan ice core. For the study at hand, the 39Ar tracer was the only way to obtain precise age constraints for the upper half of the ice core and in combination with 14C ages results in a well-covered age-depth profile.
5.7 Sensitivity analysis with newly proposed 39Ar half-life
In a recent (not yet peer-reviewed) publication by the DEAP Collaboration (2025), the 39Ar half-life was redetermined by the direct observation of the decay curve. The proposed value for the half-life is 302 ± 8stat ± 6sys a. This is a significant relative increase of 13 % from the former value by Golovko (2023) and would affect all 39Ar ages. To estimate the effect of this change, the 2p model was fitted to the updated 39Ar ages together with the original 14C ages. The updated 39Ar ages were calculated also considering an atmospheric input curve corrected for the new half-life. The new ages are systematically older but lie within the uncertainties of the original age values stated above.
The resulting fit parameter values are: b = 0.48 (1σ interval: 0.35 to 0.57) [m w.e. a−1] and p = 0.88 (1σ interval: 0.77 to 0.93) and thus do not change significantly with the new proposed half-life. The of the 2p model fit reduces to 0.26 due to the slight increase of all 39Ar age values (by 60–70 a for the ages around 400 a), which causes the 39Ar ages to agree better with the trend of the upper 14C ages (see Figs. S5 and S6).
5.8 Different sampling methods
During the 2023 and 2024 sampling campaigns, different sampling techniques were employed to retrieve the ice. Surface samples were taken by chain saw and ice cores were drilled mechanically and thermally (compare Table 2). Unfortunately, all surface samples had to be discarded from the data set due to different quality checks (see above). However, both mechanically and thermally drilled samples were successfully dated. The agreement of the measured abundances between both methods is a strong indication that thermally drilled samples do not suffer from systematic modern air contamination. This was an open question because of the meltwater that fills the borehole during thermal drilling and the potential post-coring refreezing that could enclose modern air in previously open cracks in the ice. As thermal drilling offers the opportunity for more seasonally independent ice core retrieval, this outcome supports the robustness and the more versatile application of the 39Ar dating tracer.
5.9 Employing the time scale for interregional Ca2+ signal comparison
By establishing a reliable age-depth scale for the WSS summit glacier, depth resolved data can now be evaluated with its corresponding age information, making the interpretation of the data set as well as the comparison with other data sets and archives feasible. Spagnesi et al. (2023) published profiles of major ions, stable water isotopes and other tracers for the WSS summit glacier, showing a distinct peak in all major ion concentrations as well as levoglucosan at a depth of 6.4 m. The detailed investigation of the WSS isotope and impurity time series warrants a separate investigation. For a first comparison with other Alpine ice core data, we selected the Ca2+ profile, since a connection between high Ca2+ peaks and the occurrence of Saharan dust transport to the Alps is well established (e.g. Wagenbach et al., 1996). Considering that a meaningful comparison with WSS requires Alpine ice core data comprising an age span starting 400 a ago at reasonable time resolution, the immediate target is Colle Gnifetti (CG) – a well-characterized site with millennial time series (e.g. Wagenbach et al., 2012). The comparison is done as an example of how the derived age-depth relation can be applied to the interpretation of e.g. chemical profiles, despite the proneness of high elevation summit glacier sites to losing parts of the annual precipitation to wind erosion and therefore not preserving the complete record. It should therefore be noted that the presented records might suffer from such seasonal or long-term biases, the detailed analysis of which however is beyond the scope of this example.
We compared the WSS Ca2+ profile to a Ca2+ record from Colle Gnifetti (Bohleber et al., 2018). Interestingly, both Ca2+ records feature an outstanding anomaly around 1175. Applying the here derived age-depth scale to the WSS Ca2+ data and plotting it together with the CG data in Fig. 6, shows the good temporal alignment of the two anomalies within the uncertainties of the WSS time scale and not regarding the uncertainties of the CG time scale. Identifying the Ca2+ peak with a Saharan dust event, the agreement within these two Ca2+ records suggests that this dust event reached into both, the Western and the Eastern Alps. This implies a large Saharan dust event may have impacted large parts of central Europe at that time. On a tentative note, aligning the major peak in both data sets would require an offset of the WSS timescale of approximately 50 a. Such a shift results also in the temporal alignment of several smaller peaks between 1550 and 1700, possibly indicating further regional-scale dust signals recorded across the Alps. The dashed line in Fig. 6 shows the WSS Ca2+ record with a 50 a offset on the WSS timescale to visualize the alignment of the peaks.
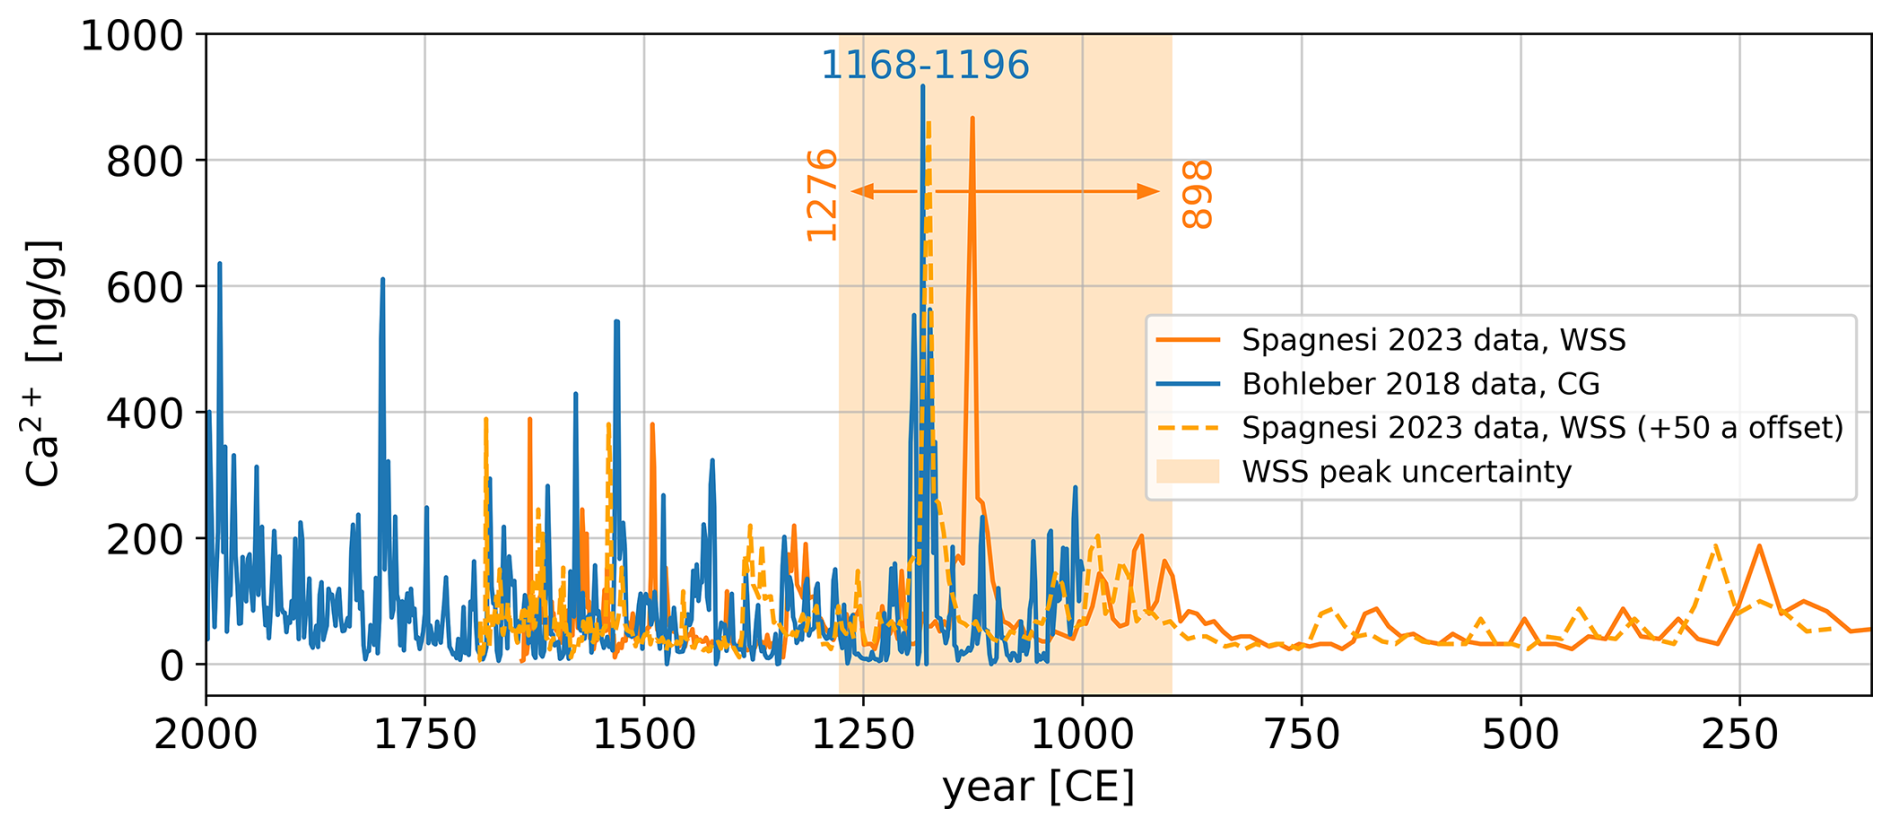
Figure 6Ca2+ data from WSS (Spagnesi et al., 2023) are plotted against time using the conversion of depth to age derived in this work. Ca2+ data from Colle Gnifetti (Bohleber et al., 2018) are plotted for comparison. The shaded area and its boundary values indicate the 1σ age uncertainty of the major peak of the WSS data set due to its time scale uncertainty. The blue values indicate the extent of the CG peak in years, not considering its time scale uncertainties. Adding a 50 a offset to the WSS timescale results in good alignment of the major peak around 1175 and also smaller peaks between 1550 and 1700.
The integration of 39Ar and 14C ages enabled a comprehensive coverage of the remaining age profile of the WSS summit glacier through radiometrically measured ice ages. It was demonstrated that in the remaining 10 m of the glacier (as of 2019) a continuous record of 6000 a was present, although with already ∼ 400 a of record having been lost at the surface. Despite the loss of roughly 80 % of the original glacier profile over the past ∼ 110 a, glaciological models were successfully applied to the age profile, showing strong agreement with the measured age data. This approach enabled the establishment of a reliable and continuous age-depth relationship for the 10 m above bedrock. The fact that the age-depth relation is continuous shows that no prolonged periods of mass loss have existed at WSS within the 6000 a glaciation history prior to today.
To derive error estimates for the model ages, MC sampling was employed, accounting for the age distributions of the measurements and as well as additional uncertainties associated with the LSS and the common depth scale. Consequently, reasonable error estimates were generated, yielding age uncertainties of 100–200 a for most of the age profile, increasing with depth. Furthermore, it was shown that different drilling methods did not influence the 39Ar age results, emphasizing the robustness of the method.
With the obtained age-depth scale, depth resolved Ca2+ from WSS ice cores from Spagnesi et al. (2023) could now be compared more precisely to other archives, enabling broader contextualization within regional and global paleoclimatic data. A Ca2+ record from CG published by Bohleber et al. (2018) shows a unique peak around 1175. Comparing this to the WSS data set reveals a good temporal alignment of the two signals and possibly further peaks between 1550 and 1700, making the case for period of strong, interregional Saharan dust events in central Europe.
This work shows that successfully establishing an age-depth relation for a substantially diminished glacier by the combination of 39Ar and 14C measurements has a general implication for non-polar ice core research also in other mountain regions: even under conditions of sustained mass loss and surfaces ages beyond a century, reliable time scales can be derived with the help of appropriate radiometric tracers.
The probability density functions of the 39Ar and 14C measurements as well as the depth vs. age data from the 2p model, including respective uncertainties, are available at: https://doi.org/10.5281/zenodo.16528315 (Wachs et al., 2025).
The supplement related to this article is available online at https://doi.org/10.5194/cp-22-173-2026-supplement.
DW performed the 39Ar measurements, the formal analysis and the writing. LL and JM performed the sample preparation and first formal analysis. MSW and AF were leading the drilling campaigns. AF, PB, WA and MO provided supervision, acquisition of funds, project administration and reviewed the manuscript. AS did the measurement and the analysis of the CFA data and helped with reviewing the manuscript. AJ, CK, NM and FM provided technical support in the laboratory, performed earlier work on data evaluation and helped reviewing the manuscript. TJ performed and supervised the 14C measurements at PSI and helped reviewing the manuscript.
The contact author has declared that none of the authors has any competing interests.
Publisher's note: Copernicus Publications remains neutral with regard to jurisdictional claims made in the text, published maps, institutional affiliations, or any other geographical representation in this paper. The authors bear the ultimate responsibility for providing appropriate place names. Views expressed in the text are those of the authors and do not necessarily reflect the views of the publisher.
We are grateful to many colleagues for their support during the different stages of the sampling campaigns and lab work. The whole Heidelberg ATTA group is acknowledged for their support in the preparation and measurement of the 39Ar samples. For the 14C dating at PSI, Margit Schwikowski is acknowledged for the coordination of the measurements and Michelle Worek for the additional measurement in 2024. We acknowledge financial support by German Research Foundation and the Austrian Science Fund.
This research has been supported by the Deutsche Forschungsgemeinschaft (German Research Foundation) (grant nos. AE 93/22-1 and OB 164/17-1) and the Austrian Science Fund under the DACH program (FWF: I 5246-N) and by the projects Cold Ice 1 and 2 (FWF: P29256-N36 and P34399-N).
This paper was edited by Eric Wolff and reviewed by Wei Jiang and one anonymous referee.
Arck, Y., Meienburg, F., Wachs, D., Beyersdorfer, S., Kersting, A., Schmidt, M., Oberthaler, M., and Aeschbach, W.: Sampling and Purification Methods for Dating by Atom Trap Trace Analysis in Various Environmental Applications, ACS Earth Space Chem., 9, 1927–1937, https://doi.org/10.1021/acsearthspacechem.5c00128, 2025.
Auer, I., Böhm, R., Jurkovic, A., Lipa, W., Orlik, A., Potzmann, R., Schöner, W., Ungersböck, M., Matulla, C., Briffa, K., Jones, P., Efthymiadis, D., Brunetti, M., Nanni, T., Maugeri, M., Mercalli, L., Mestre, O., Moisselin, J.-M., Begert, M., Müller-Westermeier, G., Kveton, V., Bochnicek, O., Stastny, P., Lapin, M., Szalai, S., Szentimrey, T., Cegnar, T., Dolinar, M., Gajic-Capka, M., Zaninovic, K., Majstorovic, Z., and Nieplova, E.: HISTALP – historical instrumental climatological surface time series of the Greater Alpine Region, Int. J. Climatol., 27, 17–46, https://doi.org/10.1002/joc.1377, 2007.
Bohleber, P.: Alpine Ice Cores as Climate and Environmental Archives, in: Oxford Research Encyclopedia of Climate Science, Oxford University Press, https://doi.org/10.1093/acrefore/9780190228620.013.743, 2019.
Bohleber, P., Erhardt, T., Spaulding, N., Hoffmann, H., Fischer, H., and Mayewski, P.: Temperature and mineral dust variability recorded in two low-accumulation Alpine ice cores over the last millennium, Clim. Past, 14, 21–37, https://doi.org/10.5194/cp-14-21-2018, 2018.
Bohleber, P., Schwikowski, M., Stocker-Waldhuber, M., Fang, L., and Fischer, A.: New glacier evidence for ice-free summits during the life of the Tyrolean Iceman, Scientific Reports, 10, 20513, https://doi.org/10.1038/s41598-020-77518-9, 2020.
Bolzan, J. F.: Ice flow at the Dome C ice divide based on a deep temperature profile, J. Geophys. Res., 90, 8111–8124, https://doi.org/10.1029/JD090iD05p08111, 1985.
DEAP Collaboration: Direct Measurement of the 39Ar Half-life from 3.4 Years of Data with the DEAP-3600 Detector, arXiv [preprint], https://doi.org/10.48550/arXiv.2501.13196, 22 January 2025.
Ebser, S., Kersting, A., Stöven, T., Feng, Z., Ringena, L., Schmidt, M., Tanhua, T., Aeschbach, W., and Oberthaler, M. K.: 39Ar dating with small samples provides new key constraints on ocean ventilation, Nat. Commun., 9, 5046, https://doi.org/10.1038/s41467-018-07465-7, 2018.
EPICA community members: Eight glacial cycles from an Antarctic ice core, Nature, 429, 623–628, https://doi.org/10.1038/nature02599, 2004.
Feng, Z., Bohleber, P., Ebser, S., Ringena, L., Schmidt, M., Kersting, A., Hopkins, P., Hoffmann, H., Fischer, A., Aeschbach, W., and Oberthaler, M. K.: Dating glacier ice of the last millennium by quantum technology, P. Natl. Acad. Sci. USA, 116, 8781–8786, https://doi.org/10.1073/pnas.1816468116, 2019.
Festi, D., Schwikowski, M., Maggi, V., Oeggl, K., and Jenk, T. M.: Significant mass loss in the accumulation area of the Adamello glacier indicated by the chronology of a 46 m ice core, The Cryosphere, 15, 4135–4143, https://doi.org/10.5194/tc-15-4135-2021, 2021.
Fischer, A., Stocker-Waldhuber, M., Frey, M., and Bohleber, P.: Contemporary mass balance on a cold Eastern Alpine ice cap as a potential link to the Holocene climate, Sci. Rep., 12, 1331, https://doi.org/10.1038/s41598-021-04699-2, 2022.
Gabrielli, P., Barbante, C., Bertagna, G., Bertó, M., Binder, D., Carton, A., Carturan, L., Cazorzi, F., Cozzi, G., Dalla Fontana, G., Davis, M., De Blasi, F., Dinale, R., Dragà, G., Dreossi, G., Festi, D., Frezzotti, M., Gabrieli, J., Galos, S. P., Ginot, P., Heidenwolf, P., Jenk, T. M., Kehrwald, N., Kenny, D., Magand, O., Mair, V., Mikhalenko, V., Lin, P. N., Oeggl, K., Piffer, G., Rinaldi, M., Schotterer, U., Schwikowski, M., Seppi, R., Spolaor, A., Stenni, B., Tonidandel, D., Uglietti, C., Zagorodnov, V., Zanoner, T., and Zennaro, P.: Age of the Mt. Ortles ice cores, the Tyrolean Iceman and glaciation of the highest summit of South Tyrol since the Northern Hemisphere Climatic Optimum, The Cryosphere, 10, 2779–2797, https://doi.org/10.5194/tc-10-2779-2016, 2016.
Golovko, V. V.: Application of the most frequent value method for 39Ar half-life determination, Eur. Phys. J. C, 83, 930, https://doi.org/10.1140/epjc/s10052-023-12113-6, 2023.
Gu, J.-Q., Tong, A. L., Yang, G.-M., Hu, S.-M., Jiang, W., Lu, Z.-T., Purtschert, R., and Ritterbusch, F.: Reconstruction of the atmospheric 39Ar/Ar history, Chem. Geol., 583, 120480, https://doi.org/10.1016/j.chemgeo.2021.120480, 2021.
Hartl, L., Covi, F., Stocker-Waldhuber, M., Baldo, A., Fugazza, D., Di Mauro, B., and Naegeli, K.: Loss of accumulation zone exposes dark ice and drives increased ablation at Weißseespitze, Austria, The Cryosphere, 19, 3329–3353, https://doi.org/10.5194/tc-19-3329-2025, 2025a.
Hartl, L., Schmitt, P., Schuster, L., Helfricht, K., Abermann, J., and Maussion, F.: Recent observations and glacier modeling point towards near-complete glacier loss in western Austria (Ötztal and Stubai mountain range) if 1.5 °C is not met, The Cryosphere, 19, 1431–1452, https://doi.org/10.5194/tc-19-1431-2025, 2025b.
Hou, S., Jenk, T. M., Jiang, W., Zhang, W., Hu, H., Feng, X., Li, H., Wu, S.-Y., Pang, H., Yu, J., Huang, R., Lu, Z.-T., Yang, G.-M., Bender, M., and Schwikowski, M.: A radiometric timescale challenges the chronology of the iconic 1992 Guliya ice core, Science Advances, 11, eadx8837, https://doi.org/10.1126/sciadv.adx8837, 2025.
Jenk, T. M., Szidat, S., Bolius, D., Sigl, M., Gäggeler, H. W., Wacker, L., Ruff, M., Barbante, C., Boutron, C. F., and Schwikowski, M.: A novel radiocarbon dating technique applied to an ice core from the Alps indicating late Pleistocene ages, J. Geophys. Res.-Atmos., 114, D14305, https://doi.org/10.1029/2009JD011860, 2009.
Legrand, M., McConnell, J. R., Preunkert, S., Wachs, D., Chellman, N. J., Rehfeld, K., Bergametti, G., Wensman, S. M., Aeschbach, W., Oberthaler, M. K., and Friedrich, R.: Alpine ice core record of large changes in dust, sea-salt, and biogenic aerosol over Europe during deglaciation, PNAS Nexus, 4, pgaf186, https://doi.org/10.1093/pnasnexus/pgaf186, 2025.
Lu, Z.-T., Schlosser, P., Smethie, W. M., Sturchio, N. C., Fischer, T. P., Kennedy, B. M., Purtschert, R., Severinghaus, J. P., Solomon, D. K., Tanhua, T., and Yokochi, R.: Tracer applications of noble gas radionuclides in the geosciences, Earth-Sci. Rev., 138, 196–214, https://doi.org/10.1016/j.earscirev.2013.09.002, 2014.
Nye, J. F.: The distribution of stress and velocity in glaciers and ice-sheets, P. Roy. Soc. Lond. A Mat., 239, 113–133, https://doi.org/10.1098/rspa.1957.0026, 1957.
Nye, J. F.: Correction Factor for Accumulation Measured by the Thickness of the Annual Layers in an Ice Sheet, J. Glaciol., 4, 785–788, https://doi.org/10.3189/S0022143000028367, 1963.
Ramsey, C. B.: Radiocarbon Calibration and Analysis of Stratigraphy: The OxCal Program, Radiocarbon, 37, 425–430, https://doi.org/10.1017/S0033822200030903, 1995.
Raymond, C. F.: Deformation in the Vicinity of Ice Divides, J. Glaciol., 29, 357–373, https://doi.org/10.3189/S0022143000030288, 1983.
Reimer, P. J., Bard, E., Bayliss, A., Beck, J. W., Blackwell, P. G., Ramsey, C. B., Buck, C. E., Cheng, H., Edwards, R. L., Friedrich, M., Grootes, P. M., Guilderson, T. P., Haflidason, H., Hajdas, I., Hatté, C., Heaton, T. J., Hoffmann, D. L., Hogg, A. G., Hughen, K. A., Kaiser, K. F., Kromer, B., Manning, S. W., Niu, M., Reimer, R. W., Richards, D. A., Scott, E. M., Southon, J. R., Staff, R. A., Turney, C. S. M., and Plicht, J. van der: IntCal13 and Marine13 Radiocarbon Age Calibration Curves 0–50,000 Years cal BP, Radiocarbon, 55, 1869–1887, https://doi.org/10.2458/azu_js_rc.55.16947, 2013.
Ritterbusch, F., Tian, L., Tong, A.-M., Gu, J.-Q., Jiang, W., Lu, Z.-T., Shao, L., Tang, M.-X., Yang, G.-M., Zhang, M.-J., and Zhao, L.: A Tibetan ice core covering the past 1,300 years radiometrically dated with 39Ar, P. Natl. Acad. Sci. USA, 119, e2200835119, https://doi.org/10.1073/pnas.2200835119, 2022.
Spagnesi, A., Bohleber, P., Barbaro, E., Feltracco, M., De Blasi, F., Dreossi, G., Stocker-Waldhuber, M., Festi, D., Gabrieli, J., Gambaro, A., Fischer, A., and Barbante, C.: Preservation of chemical and isotopic signatures within the Weißseespitze millennial old ice cap (Eastern Alps), despite the ongoing ice loss, Front. Earth Sci., 11, 1322411, https://doi.org/10.3389/feart.2023.1322411, 2023.
Stocker-Waldhuber, M., Seiser, B., and Fischer, A.: Ice thickness data Weißseespitze/Austria, PANGAEA [data set], https://doi.org/10.1594/PANGAEA.939817, 2022a.
Stocker-Waldhuber, M., Seiser, B., and Fischer, A.: Meteorological data Weißseespitze/Austria, 2017 et seq, PANGAEA [data set], https://doi.org/10.1594/PANGAEA.939830, 2022b.
Stocker-Waldhuber, M., Hartl, L., Seiser, B., Bertolotti, G., Gschwentner, A., and Fischer, A.: Point mass balance (floating date) Weißseespitze (Tyrol, Austria) 2017 et seq, PANGAEA [data set], https://doi.org/10.1594/PANGAEA.982344, 2025.
Thompson, L. G., Mosley-Thompson, E., Davis, M. E., Bolzan, J. F., Dai, J., Klein, L., Gundestrup, N., Yao, T., Wu, X., and Xie, Z.: Glacial Stage Ice-Core Records from the Subtropical Dunde Ice Cap, China, Ann. Glaciol., 14, 288–297, https://doi.org/10.3189/S0260305500008776, 1990.
Virtanen, P., Gommers, R., Oliphant, T. E., Haberland, M., Reddy, T., Cournapeau, D., Burovski, E., Peterson, P., Weckesser, W., Bright, J., van der Walt, S. J., Brett, M., Wilson, J., Millman, K. J., Mayorov, N., Nelson, A. R. J., Jones, E., Kern, R., Larson, E., Carey, C. J., Polat, İ., Feng, Y., Moore, E. W., VanderPlas, J., Laxalde, D., Perktold, J., Cimrman, R., Henriksen, I., Quintero, E. A., Harris, C. R., Archibald, A. M., Ribeiro, A. H., Pedregosa, F., and van Mulbregt, P.: SciPy 1.0: fundamental algorithms for scientific computing in Python, Nat. Methods, 17, 261–272, https://doi.org/10.1038/s41592-019-0686-2, 2020.
Wachs, D., Spagnesi, A., Bohleber, P., Fischer, A., Stocker-Waldhuber, M., Junkermann, A., Kindermann, C., Langenbacher, L., Mandaric, N., Marks, J., Meienburg, F., Jenk, T. M., Oberthaler, M., and Aeschbach, W.: dataset Wachs et al., 2025 “A continuous 6000 year age depth relationship for the remainder of the Weißseespitze summit glacier based on 39Ar and 14C dating”, Zenodo [data set], https://doi.org/10.5281/zenodo.16528315, 2025.
Wagenbach, D., Preunkert, S., Schäfer, J., Jung, W., and Tomadin, L.: Northward Transport of Saharan Dust Recorded in a Deep Alpine Ice Core, in: The Impact of Desert Dust Across the Mediterranean, edited by: Guerzoni, S. and Chester, R., Springer Netherlands, Dordrecht, 291–300, https://doi.org/10.1007/978-94-017-3354-0_29, 1996.
Wagenbach, D., Bohleber, P., and Preunkert, S.: Cold, alpine ice bodies revisited: what may we learn from their impurity and isotope content?, Geogr. Ann. A, 94, 245–263, https://doi.org/10.1111/j.1468-0459.2012.00461.x, 2012.