
the Creative Commons Attribution 4.0 License.
the Creative Commons Attribution 4.0 License.
 | 08 Sep 2026
Quantifying Southern Hemisphere dust sources during the Last Glacial-Interglacial Transition using rare earth elements in the EPICA Dome C ice core
Sibylle Boxho

Aubry Vanderstraeten
Nadine Mattielli
Goulven G. Laruelle
Aloys Bory
Paolo Gabrielli
Steeve Bonneville
Dust deposits in ice cores provide a valuable archive of past atmospheric circulation, offering insights into climate dynamics during key climate transitions such as the last glacial termination. Here, we present a novel high-resolution reconstruction of dust provenance in the EPICA Dome C (EDC) ice core from 33.7 to 2.8 kyr BP, based on Rare Earth Element (REE) patterns. Using a statistical unmixing algorithm on 279 samples, we quantify, for the first time, contributions from key Southern Hemisphere dust sources. During the late Marine Isotope Stage 3 (MIS3), the Last Glacial Maximum (LGM) and Heinrich Stadial 1 (HS1), dust at EDC was dominated by Patagonian sources, ∼ 65 %–75 % of total deposition, with secondary inputs from Australia (∼ 9 %–11 %), Southern Africa (∼ 5 %–9 %), New Zealand (∼ 6 %–14 %), and Puna-Altiplano (∼ 2 %–4 %). After ∼ 14.5 kyr BP, and especially during the Holocene, the dust assemblage shifted toward greater contributions from low-latitude sources including Australia (21 %–28 %), Southern Africa (∼ 8 %–9 %), and the Puna-Altiplano (∼ 8 %–9 %) – while the Patagonian contribution decreased to an average of ∼ 43 %–53 %, New Zealand (∼ 4 %–10 %) – and source compositions became more variable. This transition in dust provenance contribution is supported by our modeled Sr-Nd isotope composition of EDC dust, which also aligns with changes observed in other East Antarctic ice cores. Comparison with the EDML ice core provenance record reveals overall agreement in major sources and timing of the shifts but also highlights regional variations in the secondary contributions, with EDC showing more consistent inputs from Australia and EDML from Southern Africa. The coherence of the provenance shift recorded at EDC and EDML ice cores points to a common large-scale control, in line with the influence of eustatic sea-level rise and postglacial reorganization of fluvial sediment routing and availability in southern South America.
- Article
(1468 KB) - Full-text XML
-
Supplement
(1714 KB) - BibTeX
- EndNote


Antarctic ice cores preserve long-range atmospheric dust at high temporal resolution and provide a unique window into past changes in continental aridity, atmospheric circulation, and Earth system during major climate transitions (Lambert et al., 2008; Grousset and Biscaye, 2005). Variations in dust flux and composition recorded in these archives have been central to our understanding of glacial–interglacial climate dynamics, particularly through the role of mineral dust in Southern Ocean iron fertilization and its impact on atmospheric CO2 concentrations (Martínez-García et al., 2014; Lambert et al., 2015, 2021; Weber et al., 2022; Yamamoto et al., 2019). However, translating Antarctic dust records into quantitative constraints on past climate processes requires robust reconstructions of dust provenance and an understanding of how source-specific emissions respond to climatic and geomorphological change.
Geochemical fingerprinting of dust and sediments from Potential Source Area (PSA) upwind of Antarctica has therefore been a central component of dust provenance studies. Southern South America (SSA), Southern Africa (SAF), Australia (AUS), New Zealand (NZ), and ice-free regions of Antarctica (ANT) have been identified as the dominant Southern Hemisphere PSAs (e.g., Grousset and Biscaye, 2005; Delmonte et al., 2010; Gili et al., 2017). While radiogenic isotope systems such as Sr–Nd and Pb have been widely used to trace dust sources, their application is limited by the relatively large sample masses required, which restricts temporal resolution – particularly at remote, high-elevation sites such as EPICA Dome C (EDC), where dust fluxes have decreased by up to a factor of ∼ 25 from glacial to interglacial conditions (Delmonte et al., 2008, 2017). In addition, overlapping isotopic signatures among PSAs and the effects of dust mixing during transport complicate quantitative source apportionment (Gaiero et al., 2004; Delmonte et al., 2020).
Rare Earth Element patterns (i.e., the concentration profiles of the lanthanoid series) offer a promising complementary approach to overcome these limitations. Because the lanthanoid series captures multi-dimensional geochemical information, REE patterns allow greater discriminatory power than elemental ratios alone, while requiring substantially smaller sample sizes and thus enabling higher temporal resolution. Previous applications of REE measurements in Antarctic ice cores achieved multi-decadal resolution but were limited in their ability to quantitatively resolve mixed dust sources (e.g., Gabrielli et al., 2010; Wegner et al., 2012). Recently, Vanderstraeten et al. (2023) introduced a novel statistical apportionment framework based on REE pattern fitting, producing the first quantitative, decadal- to centennial-scale reconstruction of dust provenance at EPICA Dronning Maud Land (EDML) across the Last Glacial–Interglacial Transition (LGIT). That study revealed pronounced and time-dependent changes in dust source contributions to East Antarctica. During the Last Glacial Maximum, dust reaching EDML was dominated by high-latitude sources, particularly Patagonia (PAT) and New Zealand, consistent with enhanced glaciogenic sediment production, expanded continental shelves, and strong Southern Westerly Winds (Vanderstraeten et al., 2023). During deglaciation and the early Holocene, contributions from lower-latitude PSAs such as Southern Africa, Australia, and the Puna–Altiplano Plateau (PAP) increased as high-latitude dust emissions declined.
Beyond documenting changing provenance, Vanderstraeten et al. (2023) suggested that distinct physical mechanisms controlled dust delivery at distinct stages of the LGIT. During Heinrich Stadial 1, reductions in dust flux occurred without major provenance changes pointing to enhanced atmospheric wet scavenging as the main driver of dust flux reduction. In contrast, the shift from high-to-low latitude sources after ∼ 14.5 kyr BP likely reflects geomorphological thresholds in Patagonia. These include sea-level rise and the submergence of continental shelf, as well as a major hydrological reorganization of Patagonian rivers (Delmonte et al., 2017; Davies et al., 2020; Thorndycraft et al., 2019). Together, these processes would have reduced the volume of sediment available to aeolian deflation (Vanderstraeten et al., 2023; Delmonte et al., 2017).
While EDML provides a sensitive record of dust provenance changes in the Atlantic sector of East Antarctica, it remains unclear to what extent these source shifts are representative of the broader East Antarctic Plateau. EPICA Dome C, located further inland at high elevation, receives lower dust fluxes and integrates longer atmospheric transport pathways, making it particularly sensitive to changes in large-scale circulation and dust residence time. EDC has played a central role in reconstructions of Southern Hemisphere dust variability and climate coupling, yet quantitative, high-resolution provenance reconstructions across the LGIT remain limited at this site due to analytical challenges associated with low dust concentrations. Here, we apply the REE-based statistical provenance framework developed for EDML to the EPICA Dome C dust dataset of Gabrielli et al. (2010). Our study aims at (1) establishing a quantitative record of dust provenance in EDC throughout the LGIT and particularly during the Holocene, (2) confronting and validating the EDC results from our REE pattern-based model against Sr-Nd isotopic data published in the literature, (3) examining shifts in dust provenance at EDC in relation to regional climatic changes and (4) contrasting this new EDC provenance with the coeval record in EDML in the Atlantic sector of the Antarctic continent to assess spatial variability of dust deposition across East Antarctica during the LGIT.
Dust rare Earth Element Pattern Over Time (“DEEPOT” algorithm)
To identify and quantify dust source contributions to ice core samples, we developed a numerical approach based on a constrained least-squares algorithm. This method solves a system of linear equations using only positive coefficients, as source contributions represent physical proportions of dust and thus cannot take negative values. The fit between the REE patterns measured in the EDC ice core and those reported in our database (Table S1 in the Supplement) from known potential source areas (PSA) across the Southern Hemisphere is optimized using these coefficients to quantify the mixing between all PSAs. A detailed description of the methodology is provided in Vanderstraeten et al. (2023).
Briefly, our analysis used the REE dataset from the EDC ice core originally published by Gabrielli et al. (2010) comprising 294 Dust samples from Ice Core (DIC). The dataset spans from the late MIS 3 to the late Holocene (33.699 to 2.852 kyr BP). Except for the interval between 21.7 and 27.3 kyr BP, where only four samples were available, the record can be considered quasi-continuous owing to its high temporal resolution, with an average spacing of approximately 100 years (60–140 years between adjacent samples). The age model follows the EDC3 chronology (Parrenin et al., 2007). Each sample integrates between 2–3 years of deposition during the Holocene and 4–5 years during the LGM.
Out of the original 294 REE patterns, 15 were excluded due to missing data for one or more of the 14 REEs analyzed. Additionally, gadolinium (Gd) concentrations were systematically removed from all samples because their low and often unreliable values introduced more noise than discriminatory power to the calculations. The remaining 279 REE patterns (each comprising 13 REE concentration values) were normalized to the Upper Continental Crust (UCC) composition (Rudnick and Gao, 2003) and corrected using element-specific factors (cfi) as described in Gabrielli et al. (2010) and Vanderstraeten et al. (2023) (Eq. 1). These element-specific correction factors account for partial dissolution resulting from the acid-leaching extraction method used during REE quantification (Gabrielli et al., 2010). Since this method does not fully dissolve all mineral particles, we applied cfi derived from parallel measurements of fully digested EDC samples (three replicates of one glacial and one interglacial sample) to obtain total REE concentrations allowing fitting with REE patterns from our provenance database (Gabrielli et al., 2006; Vanderstraeten et al., 2023).
To fit the REE patterns from EDC, we compiled a comprehensive database of 245 REE patterns from well-established Dust Source (DS) regions across the Southern Hemisphere (Fig. S1 and Table S1 in the Supplement). This dataset includes samples from Southern South America (SSA), subdivided into Patagonia (PAT; 39 DS covering mainland Patagonia and Tierra del Fuego), Central Western Argentina (CWA; 5 DS), and the Puna-Altiplano Plateau (PAP; 14 DS from Northern and Southern Puna and Southern Altiplano). Additional sources include Southern Africa (SAF; 23 DS from Namibia and Botswana), Australia (AUS; 107 DS, predominantly from the central and southeastern regions), New Zealand (NZ; 25 DS, from the South Island), and Antarctica (ANT; 32 DS from the McMurdo Dry Valleys, representing ice-free sources). Following Vanderstraeten et al. (2023), “Dust Sources” (DS) refer to individual samples collected within a given PSA. Multiple DS may originate from the same location when samples were collected during different seasons (see Table S1). As in most provenance studies, the robustness of the unmixing results ultimately depends on the representativeness of the source dataset, and additional sampling would help better capture the natural geochemical variability of the different source areas.
As for the EDC samples, all PSA REE patterns were normalized to the UCC composition of Rudnick and Gao (2003) and Gd values were removed. Dust source apportionment was conducted using a constrained least-squares approach, in which the REE pattern of each EDC sample was modeled as a linear combination of PSA end-members. The model estimates the respective Contributions of each Dust Source (CDS1…245) by solving the system of matrices (Eq. 2) with non-negativity constraints, minimizing the resulting values, and ensuring that all contributions are physically meaningful (i.e., no negative values). This optimization was implemented using the lsqnonneg function in MATLAB.
In practical terms, the source apportionment algorithm involves solving a system where the input matrix-comprising “n” rows (one for each UCC-normalized REE) and 245 columns (one for each DS) is multiplied by a vector of 245 coefficients (CDS1…245). For any given sample, this vector of 245 components represents the proportional contribution of each DS required to best approximate the REE signature of a given dust ice core (DICLa-Lu) sample. The solution minimizes the residual between the modeled REE composition (i.e., the product of the input matrix and the CDS vector) and the measured DIC REE pattern. Importantly, only a subset of the 245 dust sources typically contributes to the best-fit solution for a given sample – i.e., sources with CDS > 0 while sources with CDS = 0 are excluded from the fit.
To evaluate the impact of uncertainties in REE concentrations of DIC samples and their associated correction factors (cfi) on the model outputs, we performed Monte Carlo (MC) simulations for each DIC sample. Analytical uncertainties associated with REE concentrations in EDC dust range between 2 % and 10 % (1 relative standard deviation), depending on the specific REE − Dusti (Gabrielli et al., 2006). In each MC simulation, cfi and Dusti values were randomly selected following normal distributions constrained by their respective mean values and variability to represent these uncertainties. The algorithm then recalculated the best-fit source contributions (CDS values) by minimizing Eq. (2). Each DIC sample was subjected to 2000 MC simulations generating distributions of source contributions (in % of total deposition) that form probability density functions for each dust source, subsequently aggregated by PSA or specific sub-regions. Because individual Monte Carlo (MC) realizations do not necessarily include all PSAs in the optimal solution, the resulting PDFs are not always normally distributed and may be asymmetric or even bimodal, reflecting both the most frequent contribution and the probability of negligible or absent contributions in some simulations. The median of each PSA-specific PDF was taken as the best estimate of its contribution to the total dust load of a given DIC sample. To quantify the dispersion of the MC solutions, the 25th (Q1) and 75th (Q3) percentile of each PSA-specific PDF were also calculated and reported (Table S2), providing a quantitative measure of the variability associated with the source apportionment. In addition, the robustness of the source apportionment was assessed by examining the ranking of PSAs across the ensemble of MC simulations. For each time step, PSA contributions were ranked in every simulation in order from greatest to least contribution (i.e., Rank 1 to Rank 7) and the probability that a given PSA occupies a particular rank was calculated from the 2000 MC realizations.
Finally, the total dust influx to EDC – derived from non-sea-salt calcium flux (nssCa2+ in ; Fischer et al., 2007) – was used to convert PSA contributions into absolute dust fluxes (Fig. S2). To assess the quality of each fit, we computed the correlation coefficient (R) between the measured and modeled REE patterns for every MC simulation. The 2000 R values per DIC sample formed a PDF from which the median R value was taken as the representative measure of fit quality. We determined that R ≥ 0.67 corresponds to a statistically significant match (p < 0.01, two-tailed test, degrees of freedom = 10), confirming a robust agreement between the reconstructed and observed REE signatures.
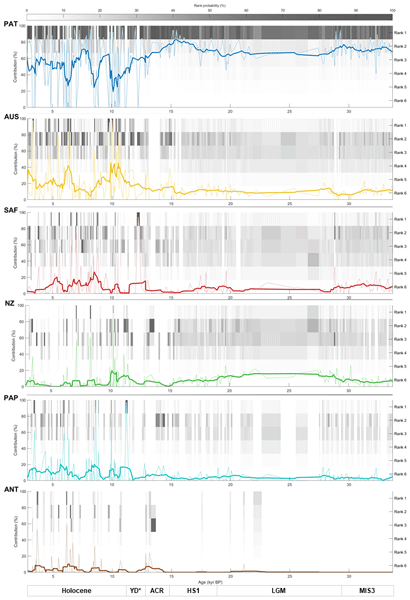
Out of the 279 DIC samples treated by our algorithm, 41 did not meet the R threshold (R ≥ 0.67) and were excluded from the provenance record. Except for one, these excluded samples are all younger than 14 kyr BP and have very low REE concentrations, near the detection limit. Such low concentrations are consistent with minimal dust input to EDC after HS1 (Gabrielli et al., 2010; Fischer et al., 2007). At these levels, element-specific analytical noise exacerbated by varying ionization efficiencies and UCC normalization distorts the REE patterns, rendering fitting meaningless. For the remaining 238 DIC samples (85.3 % of the total amount of samples considered), the PSA mixes calculated by the model were considered meaningful compared to the uncertainties associated with the measurement and characterized by an average correlation coefficient (R) of 0.852. These DIC samples span from 33.7 to 2.8 kyr BP and form the basis of the dust provenance record presented here. Figure 1 and Table S2 summarize the relative contributions (in % of total deposition) while the fluxes from specific PSAs are presented in Fig. S2. In addition, Fig. 1 displays the probability that each PSA occupies a given contribution rank across the 2000 MC simulations (grayscale shading). Darker shades indicate a higher likelihood that a source consistently occupies that rank, providing a visual indication of the stability of the source apportionment through time. Our record spans major climatic intervals: the end of Marine Isotope Stage 3 (MIS3; 57–29 kyr BP), the Last Glacial Maximum (LGM; 29–18 kyr BP), Heinrich Stadial 1 (HS1; 18–14.7 kyr BP), the Antarctic Cold Reversal (ACR; 14.7–12.9 kyr BP), the Younger Dryas (YD*; 12.9–11.7 kyr BP), and the Holocene (11.7–2.8 kyr BP), including the Early Holocene (11.7–8.2 kyr BP) and the Middle Holocene (8.2–2.8 kyr BP) (Veres et al., 2013). The term YD is retained for consistency with the established chronology of the 12.9–11.7 kyr BP interval, although its climatic expression in Antarctica and the broader Southern Hemisphere differs from that observed in the North Atlantic region.
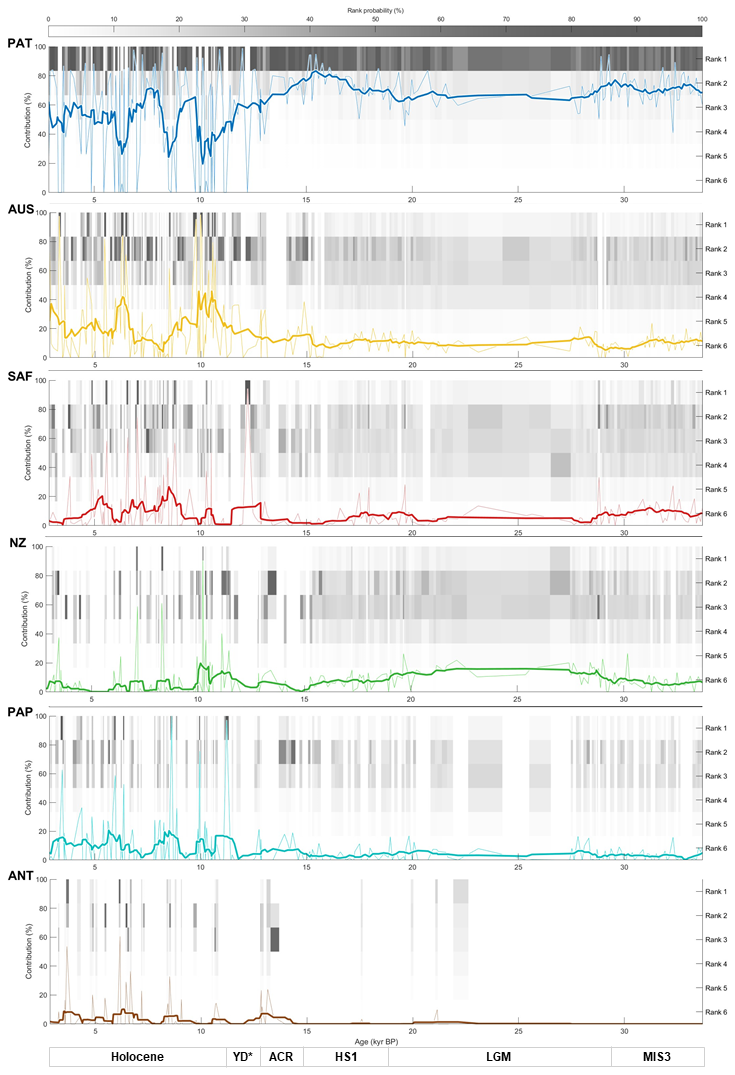
Figure 1Evolution of dust PSA contributions to the EDC ice core during the Last Glacial–Interglacial Transition (LGIT; 33.699–2.852 kyr BP; % of total dust deposition for each PSA; Table S2). Bold lines represent a 9-step moving average. Climate intervals (MIS3, LGM, HS1, ACR, YD*, and Holocene) are indicated along the bottom axis. Central Western Argentina (PSA 7) is omitted because its contribution to the dust assemblage is negligible. Darker shading indicates a higher probability, based on 2000 Monte Carlo simulations, that a source occupies a given rank (Rank 1–7, from greatest to least contribution), providing a measure of the stability of source apportionment through time.
Patagonia is the dominant dust source throughout most of the record, a result also reflected by the high probability that this source occupies the first rank in the Monte Carlo ensemble. It contributes 71.8 % and 65.4 % (i.e. mean of the contributions – Table S3) of the total dust deposition at the end of MIS 3 and during the LGM respectively, increasing to 75.4 % during HS1. Overall, the PSA dust assemblage during HS1 is marked by a stable and homogeneous apportionment. During the ACR and YD*, contributions of PAT declined to 68.5 % and 62.5 % (average contributions), respectively, with the downward trend continuing into the early Holocene. Three distinct minima in PAT contributions occur at 10, 8.6, and 6.3 kyr BP. The Holocene interval is also characterized by a marked increase in high-frequency variability in PAT contributions (and lower PSA ranking) compared to the relatively stable glacial conditions. Despite increased variability, PAT remains the primary source of dust during the Early to Middle Holocene, contributing to 43.3 %–53.4 % of total deposition. Among the 39 DS from PAT, our algorithm highlights three specific REE patterns collected in or near the Valdes Peninsula. Those DS represent aeolian materials gathered during dust sampling campaigns and therefore reflect regional mixed input rather than single lithological sources (Gili et al., 2017; Gaiero et al., 2004). Their mafic compositions, reflected by LREE (light REE) depletions, show positive Eu anomalies relative to UCC (Gili et al., 2017; Gaiero et al., 2004).
Other Southern Hemisphere PSAs contribute over the LGIT to EDC dust deposition with inputs from: AUS, SAF, PAP, NZ, and ANT in decreasing order of importance (Table S3). In contrast to PAT, those PSA generally occupy lower and more variable ranks within the MC ensemble, reflecting their secondary contributions and strong competition among sources. During MIS 3, the LGM, and HS1, AUS accounted, on average, for 9.1 %, 10.8 % and 11.2 % of total dust deposition, respectively. AUS contributions rose slightly after 14.5 kyr BP at 11.5 % during the ACR, ∼ 15 % during the YD*, and 23.9 % during the Holocene, with two prominent maxima centered around 9.5–10 kyr BP and ∼ 6.3 kyr BP (Fig. 1 – Table S3). SAF maintained relatively stable contributions ranging between ∼ 5 % and 9 % on average during MIS3, the LGM, HS1 and the ACR, followed by a sharp increase during the YD* with 13.3 %. Although SAF input drops to minimal levels (∼ 2 %) between 9.5 and 12 kyr BP, it rebounds in the Holocene, averaging ∼ 8.8 %. NZ was the second-largest contributor during the LGM with an average of 13.8 % but its influence steadily declines over time: 6.4 % during HS1, and 6 %, 3.3 %, and 6.1 % during the ACR, YD*, and the Holocene, respectively. The PAP contributes modestly during the MIS3, the LGM and HS1, with average values below 4 %, increasing to 5.4 % during the ACR, primarily from the South Puna region. In the Holocene, a compositional shift occurs, marked by the emergence of South Altiplano dust, which even becomes dominant in several samples, contributing over 90 % (% total deposition) at 11.2, 10, 8.6, 6, and 3.5 kyr BP. In contrast, contributions of the Southern Puna, when present, remained consistently below 20 % during this interval (Fig. S4). On average, PAP accounts for 8.6 % of the total Holocene dust input to EDC ice core (Table S3). Antarctic dust contributions (ANT) are rare and very low prior to ∼ 13 kyr BP but increased during the ACR, YD* and Holocene to reach on average ∼ 4 %. Other PSAs, including CWA, did not contribute measurably to EDC dust assemblage during the studied interval (see Table S2).
We present the first quantitative record of dust provenance in the EPICA Dome C ice core spanning the entire LGIT (Fig. 1). Our results indicate that, during the LGM, atmospheric dust deposition at EDC was dominated by inputs from PAT, with smaller but measurable contributions from NZ, AUS, SAF and PAP dust (in decreasing order of importance). This composition remained relatively stable throughout HS1, despite a pronounced decline in total dust deposition after ∼ 18 kyr BP. A shift in dust source contributions becomes evident after ∼ 14.5 kyr BP, characterized by larger proportions from AUS, SAF, PAP, and ANT, while the relative contributions from PAT and NZ declined. In the following sections, we evaluate the consistency of our provenance reconstruction with the expected isotopic composition of dust measured in EDC and other East Antarctic ice cores; discuss the shift in dust provenance occurring along the LGIT in conjunction with regional climatic evolution; and compare our provenance record from EDC with that of the EDML ice core (Vanderstraeten et al., 2023).
4.1 Isotopic and REE compositions of dust in EDC
Our calculations highlight a major shift in dust provenance occurred at the onset of the ACR, marking a transition from a dust assemblage dominated by high-latitude source, namely PAT and NZ, to a more diverse mixture with significantly increased contributions from low-latitude sources, including AUS, SAF and PAP. This shift already described by Gili et al. (2022) and Vanderstraeten et al. (2023) is consistent with the glacial-interglacial changes in the isotopic composition of dust deposited at EDC. Although those isotopic shifts had already been recognized, their temporal evolution remained less well constrained because isotope measurements are available at a much lower sampling resolution than the REE records from Antarctic ice cores. For instance, Delmonte et al. (2004a) reported 87Sr 86Sr ratios of ∼ 0.709 and ϵNd values ranging from −1.66 to −2.46 for LGM dust at EDC, whereas Holocene dust typically displays more radiogenic 87Sr 86Sr ratios (∼ 0.710) and more negative ϵNd values (−4.51 to −5.68) (Delmonte et al., 2007). Similar shifts in dust isotopic composition observed in Holocene dust from the Vostok ice core further support the hypothesis of a change in source regions (Basile et al., 1997; Delmonte et al., 2008). However, the available Sr-Nd isotope data for both the LGM and Holocene at EDC remain sparse, and the isotopic differences between these intervals are relatively subtle. Nevertheless, these observations are consistent with a change in dust provenance, which can be investigated in greater detail using the higher-resolution REE record presented here. This Holocene change is also accompanied by a much greater variability in the Sr–Nd signature than during LGM, as observed in both the ice core dust and modern dust including those from Berkner Island as reported in Fig. 2. To evaluate whether the provenance changes inferred from the REE mixing model account for this isotopic variability, we calculated the expected Nd and Sr isotopic composition of the dust in EDC. For each sample of the LGIT, the relative contribution of each PSA (CONTR) was multiplied by its average Sr and Nd concentrations, [Sr]PSA, [Nd]PSA, to obtain concentration-weighted contributions, [X]mix (Table S4, i.e. Eq. 3).
where “X” is the Sr or the Nd concentration. The composite isotopic ratios (CIRmix) were then calculated for (87Sr 86Sr) and ϵNd in Eq. (4), where the mean isotopic signatures are represented by CIRPSA (Table S4 and associated graph).
The modeled isotopic signatures for the LGM in Fig. 2 cluster around lower 87Sr 86Sr and higher ϵNd values, consistent with a provenance dominated by less weathered, mafic lithologies in accordance with large Patagonian and New Zealand contributions (modeled isotopic signature for the end of MIS3, HS1, ACR, and the YD* are shown in Fig. S5). In the Holocene, the modeled and measured isotopic compositions (Table S5) show a broad range, trending toward more radiogenic Sr and less radiogenic Nd isotopic values. This indicates a more heterogeneous and weathered source assemblage – consistent with greater inputs from AUS, SAF, and PAP (Figs. 2 and S5). The slightly broader range of modeled LGM and Holocene values relative to the measurements primarily reflects the much higher temporal resolution of the REE-based record compared to the sparse isotopic dataset. The isotopic data, compiled from different sites and available only for a few discrete time intervals, likely represent time-averaged conditions and therefore underestimate the variability of dust sources. In contrast, the quasi-continuous REE record enables the model to resolve short-term variability and transient source-mixing events. Despite those limitations, our modeled isotopic compositions generally agree with those measured in EDC (and with other East Antarctic dust records) during both glacial and interglacial intervals supporting the robustness of our DEEPOT algorithm and reinforcing the interpretation that a distinctive shift in dust provenance occurred over the LGIT.
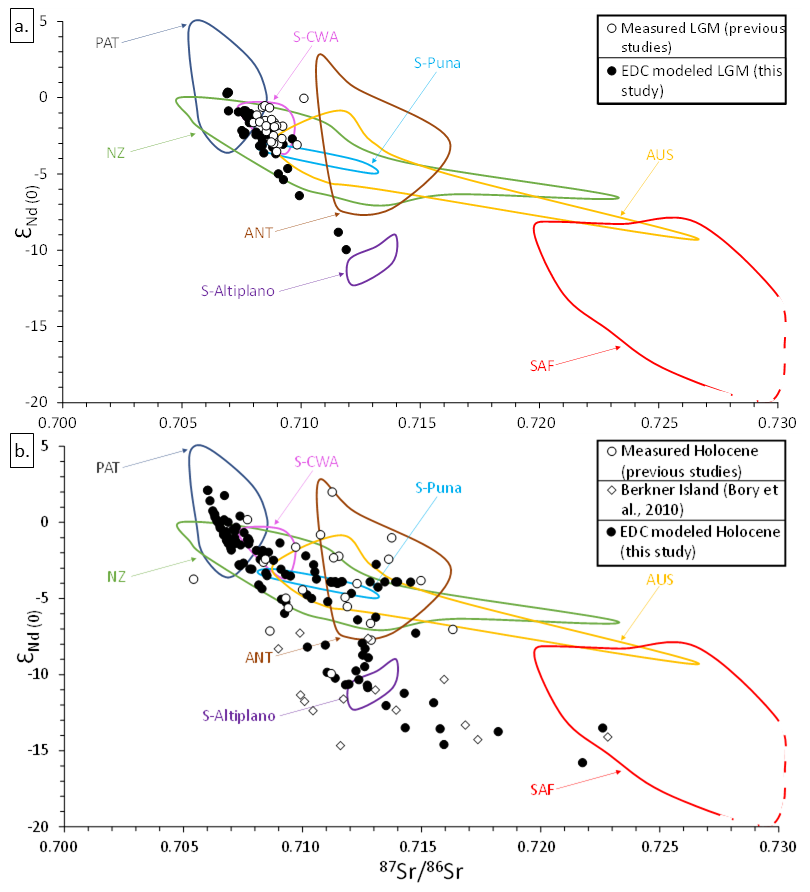
Figure 2(a) Measured 87Sr 86Sr and ϵNd(0) isotopic compositions of dust in EDC, Taylor Dome, Taylor Glacier, Komsomolskaya, Dome B, Old Dome C ice cores during the LGM (Table S5, open symbols) are compared with expected isotopic values calculated using the REE mixing model applied to EDC samples (solid dots; see Sect. 4.1). (b) Measured isotopic compositions of modern dust collected on Berkner Island and Holocene dust from Taylor Glacier, Taylor Dome, Talos Dome (Table S5, open symbols), representative of Holocene dust deposition, are compared with expected isotopic values calculated for the Holocene using the REE mixing model applied to EDC samples (solid dots). Colored frames indicate the isotopic fields of the main dust potential source areas (PSAs) (data from Grousset et al., 1992; Delmonte et al., 2004b; Gingele and De Deckker, 2005; De Deckker et al., 2014; Revel-Rolland et al., 2006; Gaiero, 2007; Gili et al., 2017, 2022; Li et al., 2020; Koffman et al., 2021; Blakowski et al., 2016). Note that the SAF domain is more extensive than shown in the figure and that the ANT is represented by the McMudro Dry Valleys. For details on the calculation see Table S4.
4.2 Persistence of high-latitude dust sources at EDC before 14.5 kyr BP
During cold periods, glacial outwash plains played an important role in sediment mobilization and dust supply to the atmosphere in the Southern Hemisphere (Bullard et al., 2016). Extensive ice sheets produced large amounts of fine sediment which were effectively spread by wide, migrating braided river systems. Exposed to arid, cold conditions and strong westerly winds, those deposits would routinely dry out and provide a major source of dust for long-range transport (Sugden et al., 2009). Such conditions were especially prevalent in PAT where the Patagonian Ice Sheet reached its maximum spatial extent between ∼ 34 and 29.4 kyr BP, covering much of the Andes with an ice mass 2090 km long and 350 km wide (Davies et al., 2020). Concomitantly, sea level was ∼ 135 m lower than present-day, exposing additional land and expanding Patagonian outwash plains by ∼ 763 × 103 km2 relative to modern conditions (Vanderstraeten et al., 2023). These factors collectively explain the predominance and relative stability of PAT dust contributions and, by extension, those from SSA to EDC during the LGM and MIS3. Isotopic studies consistently demonstrate the significance of Patagonian sources in glacial dust deposited across East Antarctica (EA) (e.g., Grousset et al., 1992; Basile et al., 1997; Gaiero, 2007; Gili et al., 2017; Delmonte et al., 2020). Model simulations (i.e., Albani et al., 2012; Krätschmer et al., 2022) also support this view, estimating that SSA and AUS sources together supplied 70 %–90 % (here, PAT + AUS is ∼ 76.2 %) of the dust reaching EA during the LGM. Using the Sr-Nd isotope composition of dust, Coppo et al. (2022) estimated LGM dust composition over EA as 64 % from SSA, 15 % from Antarctica, 11 % from AUS, 5 % from SAF, and 5 % from NZ.
Our results for SSA, which include here PAT + PAP (+ CWA), are in general agreement with those of Coppo et al. (2022), with a combined contribution of ∼ 69.4 % during LGM, alongside ∼ 10.8 % from AUS (Figs. 3 and S6; Table S3). However, we find a higher average contribution from NZ (13.8 %), making it the second-largest dust source to EDC during the LGM. This contrasts with Koffman et al. (2021), who argued against significant NZ dust input to EA on the basis of combined Sr-Nd-Pb isotope compositions. Nevertheless, the extensive South Island ice sheet, the enlarged NZ continental shelf (∼ 62 000 km2, Vanderstraeten et al., 2023; 75 000 km2 in Koffman et al., 2021), and cold, windy LGM conditions likely favored enhanced NZ dust emissions capable of reaching Antarctica (Williams et al., 2015). Consistent with this interpretation, present-day forward air-mass trajectories indicate that NZ dust could contribute 14 %–32 % to inland Antarctic deposition (Neff and Bertler, 2015). Our previous EDML ice core work detected an average NZ contribution of ∼ 6 % throughout the LGM (Vanderstraeten et al., 2023). In contrast, PAP contributions during the LGM were minimal (4 %), likely due to persistent wet conditions in the South Altiplano linked to the Sajsi and Tauca lake phases (Blard et al., 2011; Placzek et al., 2006). Consistently, Pampean Loess accumulation rates – largely sourced from PAP dust – were low during both the LGM and HS1 (Coppo et al., 2022).
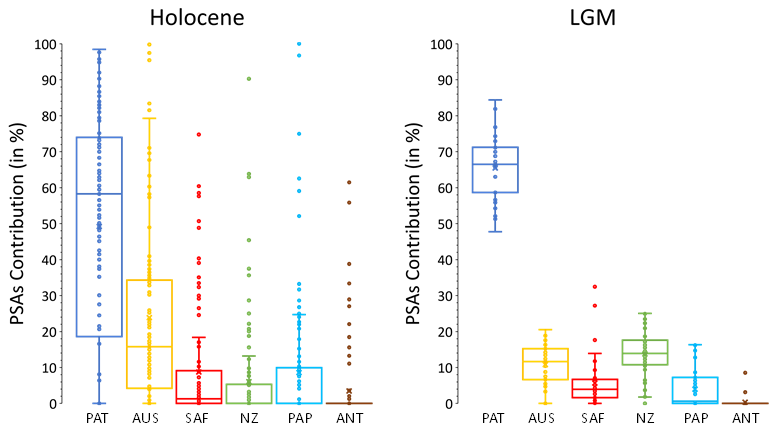
Figure 3Box plots of provenance contributions (%) to dust deposited in the EDC ice core during the Holocene and Last Glacial Maximum (LGM). Horizontal lines within the boxes indicate the median contribution for each source, crosses denote the mean, box boundaries represent the first and third quartiles, and whiskers indicate the minimum and maximum values. For PAP, NZ, and ANT during the Holocene, median contributions are 0 %, reflecting the large number of time steps with no contribution from these sources, despite episodic non-zero contributions that result in positive mean values. Box plots for HS1, ACR, and YD* are shown in Fig. S6.
Although CWA has been proposed as an important PSA in southern South America during LGM (Gili et al., 2017), it is notably absent from our EDC provenance record. A similar absence was observed in the EDML record (Vanderstraeten et al., 2023), despite this site being the closest to, and directly downwind of, SSA. The REE patterns of CWA are relatively flat when normalized to UCC, with most samples showing overall REE depletion, a slight enrichment of HREE, and a moderate positive Eu anomaly. Because this REE composition differs markedly from the dominant Patagonian sources, a substantial contribution from CWA would leave a clear geochemical imprint in the REE composition of EDC dust. In addition, the CWA “hypothesis” is based on isotopic evidence; however, the strong overlap between the isotopic signatures of CWA (ϵNd ≈ −4 to 0; 87Sr 86Sr ≈ 0.707–0.712; Gili et al., 2017) and those of Patagonia, Southern Puna, the Darling Basin, southeastern Australia and New-Zealand complicates the clear discrimination of these sources (Fig. 2). Taken together, these lines of evidence suggest that CWA is unlikely to represent a major dust source in the EDC and EDML records.
Overall, the LGM dust assemblage at EDC was dominated by high-latitude, fluvio-glaciogenic sources – PAT and NZ – which together accounted for ∼ 79.2 % of total deposition, on average. Lower-latitude PSAs (AUS, SAF, PAP) supplied the remaining ∼ 20.5 % of the LGM dust (Figs. 3 and S6; Table S3). This dominance persisted into HS1, with high-latitude sources amounting to 81.7 % despite a sharp decline in dust flux to EDC starting at ∼ 18 kyr BP (Figs. S2 and S3). Because vegetation cover and aridity in Eastern Patagonia remained broadly similar during HS1 relative to LGM (Markgraf et al., 2007; Quade and Kaplan, 2017), the most plausible explanation for the stability in the dust composition is enhanced “rainout” during long-range transport, particularly in the mid-latitudes, acting as an effective barrier to polar dust delivery (Markle et al., 2018). This reduced transport efficiency coincides with rising temperatures between 18 and 15 kyr BP, as indicated by elevated δ18O values in EDC (Fig. S3). The persistence of high-latitude dominance before 14.5 kyr BP reflects a dust transport regime sustained by extensive ice sheets, widespread outwash plains, and strong westerly winds – a system that maintained a remarkably stable provenance pattern until the onset of the LGIT. The following section examines how this balance shifted under the warmer, wetter, and more variable climate of the deglaciation and Holocene (from 14.5 until 2.8 kyr BP).
4.3 Drivers of dust provenance variability after 14.5 kyr BP
After the HS1-ACR transition, our unmixing model reveals a marked increase in the variability of dust provenance at EDC (Fig. 1), characterized by higher-frequency changes in source contributions compared to LGM. This observation is also a defining feature of our provenance record in EDML (Vanderstraeten et al., 2023). This increased variability reflects a fundamental reorganization of the dust cycle following deglaciation, driven by a combination of changes in dust sources availability and atmospheric transport efficiency. Three interrelated processes likely govern the variability of dust composition after 14.5 kyr BP. First, the decline in the availability of fluvio-glaciogenic sediment subjected to deflation on the eastern flanks of Patagonia (and South Island in NZ) reduced the dominance of large sources that had characterized East Antarctic dust deposition during LGM and HS1 (see above in Sect. 4.2 and Vanderstraeten et al., 2023 for detailed discussion). Second, rising temperatures and enhanced wet scavenging along transport pathways increased during HS1 and later intervals, reducing airborne particle lifetimes and the efficiency of long-range dust transport (Lambert et al., 2008; Markle et al., 2018). Because wet scavenging is inherently intermittent and spatially heterogeneous, changes in precipitation patterns may have differentially affected dust transported from distinct source regions, thereby contributing not only to lower dust fluxes but also to greater temporal variability in the relative source contributions recorded at EDC. Third, a lengthening of transport trajectories associated with changes in the location of the moisture source regions supplying Antarctic precipitation, as inferred from deuterium-excess values after 14.5 kyr BP (Fig. S3; Stenni et al., 2010).
Together, these processes favored a more diverse and temporally variable mixture of dust sources reaching the East Antarctic Plateau and are reflected in a clear shift from high- to lower-latitude dust contributions after 14.5 kyr BP. Average Holocene inputs from AUS, PAP, and SAF reach 23.9 %, 8.6 %, and 8.8 %, respectively, compared to 10.8 %, 5.7 %, and 4.0 % during the LGM (Table S3). Conversely, average contributions from PAT and NZ declined during the Holocene to 49.2 % and 6.1 %, respectively (vs. 65.4 % and 13.8 % during LGM). Those proportions are broadly consistent with present-day Antarctic dust deposition from the DustCOMM model that estimates contributions from SSA to EA at 70 ± 20 % (Kok et al., 2021) – compared to 57.8 % in our record when combining PAT, CWA, and PAP, in the Holocene. DustCOMM model also predicts dust contributions from AUS and SAF at 18 % (ranging from 6 % to 36 %) and 10 % (ranging from 3 % to 13 %), respectively (Kok et al., 2021), which aligns reasonably well with our results for AUS and SAF (Table S3). A similar transition from high- to low-latitude dust sources was observed by Coppo et al. (2022), although their model indicates a much more pronounced reduction in SSA input – down to 30 ± 11 % – compared to our SSA estimate of 57.8 % (Table S3). Their results show comparable contributions from AUS and SAF – i.e., 23 % and 14 %, respectively vs. 23.9 % and 8.8 %, here – and a large Antarctic component (24 % vs. 3.5 % here), specifically from the McMurdo Dry Valleys and nearby Southern Victoria Land volcanoes. Although our dust source database also covers McMurdo Dry Valleys, our results suggest only very limited inputs (see discussion in Sect. 4.4). The resulting shift toward lower-latitude dust sources after 14.5 kyr BP is expressed through distinct regional emission dynamics, discussed below for each major source region, and is further assessed at the East Antarctic scale through comparison of the EDC and EDML provenance records in Sect. 4.5.
4.4 Regional source responses to the glacial-interglacial transition
Following a pronounced decline after ∼ 14.5 kyr BP, Patagonian contributions reach minimum values around 10 kyr BP (Fig. 4). Interestingly, those minima coincide with an early Holocene thermal maximum (11–9 kyr BP) which is clearly expressed in the δ18O record from EDC and more broadly across Antarctica (Masson et al., 2000) as well as in other Southern Hemisphere records (Kilian and Lamy, 2012; Bianchi and Gersonde, 2004). Those climatic conditions likely reduced the thermal gradient between the mid and high latitudes, resulting in persistently weakened wind intensities. Such conditions are recorded at Macquarie Island (sub-Antarctic southwest Pacific 54° S – Saunders et al., 2018), in Potrok Aike maar (52° S, Patagonia; Lisé-Pronovost et al., 2015) and in the Southern Ocean south and east of New Zealand (Fletcher and Moreno, 2011). These changes may be linked to a poleward shift of Southern Westerly Winds (SWW) belt (Quade and Kaplan, 2017; Moreno et al., 2010). At first glance, those conditions appear unfavorable for dust emissions from Patagonia. However, this interval also corresponds to drier conditions and widespread increase in fire activity in eastern Patagonia (Fig. 4 – Moreno et al., 2010; Power et al., 2008; Markgraf et al., 2007). Such conditions likely enhanced dust emissions through vegetation loss and soil destabilization making sediments more susceptible to aeolian deflation upon the return of stronger SWW (Dukes et al., 2018; Wagner et al., 2021). After ∼ 8 kyr BP, the strengthening of the SWW coincides with elevated PAT contribution between ∼ 8 and 7 kyr BP. Apart from a marked drop in PAT contributions between 6.5 and 6 kyr BP, strong SWW conditions have prevailed since ∼ 5 kyr BP in south Patagonia and correspond to an average PAT contribution of ∼ 50 %.
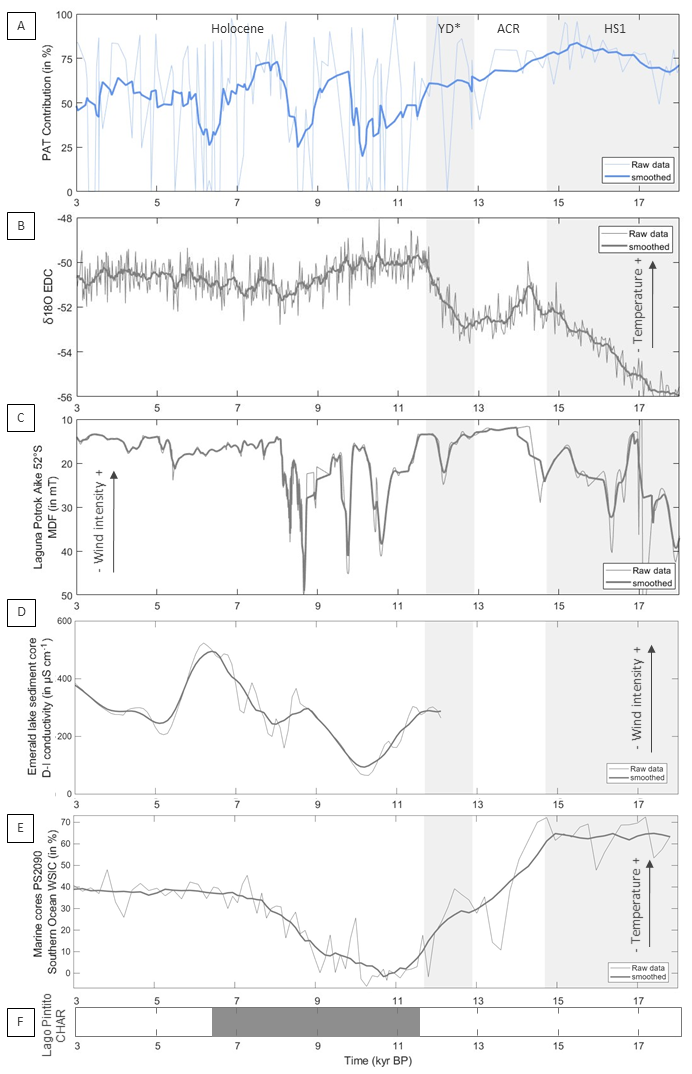
Figure 4Comparison of Patagonian dust contribution with temperature, wind intensity and fire proxies. (A) DEEPOT contribution of Patagonian dust to EDC ice core modeled in this study; (B) δ18O from the EDC ice core (EPICA Community Members, 2006); (C) Median Destructive Field (MDF) of isothermal remanent magnetization from Laguna Potrok Aike in Southern Patagonia (Lisé-Pronovost et al., 2015); (D) Diatom-inferred (D-I) conductivity from Emerald lake in Macquarie Island (in µS cm−1) (Saunders et al., 2018); (E) Southern Ocean winter sea-ice concentration from marine core PS2090 (WSIC in %) (Bianchi and Gersonde, 2004; Saunders et al., 2018); (F) Macroscopic charcoal accumulation rates with gray band marking increased accumulation rate in Lago Pintito (Patagonia) (Moreno et al., 2021). Bold lines in panels denote the 9-step moving average.
Regarding Australia (Fig. 1), our algorithm identifies it as the second-most important supplier of dust to EDC during the Holocene, with the Darling sub-basin as the dominant source region in agreement with Pb isotope evidence (De Deckker et al., 2010). Although Gili et al. (2016) dismissed AUS as a major Antarctic dust source, later studies re-evaluated its role, suggesting that Australian dust reached TALDICE and Taylor Glacier mainly during interglacials (De Deckker, 2019, 2020). Modeling and back-trajectory analyses further indicate that modern Australian dust dominates over the Pacific Southern Ocean and western Antarctic coasts and can reach EDC (Albani et al., 2012; Krinner et al., 2010; Li et al., 2008; Neff and Bertler, 2015). Hydrological reconstructions indicate that central Australia – particularly the Lake Eyre and Lake Frome basins – experienced prolonged wet conditions between ∼ 4 and 14.5 kyr BP (Magee et al., 2004; Singh and Luly, 1991). These humid intervals would have substantially suppressed dust emissions from central Australia. In contrast, the Darling Basin underwent a pronounced dry phase between ∼ 11.5 and 9.5 kyr BP that coincides with a peak in AUS dust contributions to EDC. Conversely, two humid phases in the Darling Basin (∼ 13.5–11.5 and 9.5–7.5 kyr BP, potentially extending to 5.5 kyr BP) correspond to reduced dust fluxes from AUS (Gingele et al., 2007; Stanley and De Deckker, 2002). The mid- to late Holocene (post-8.2 kyr BP) in Australia is characterized by increasing climatic instability with alternating wet and dry periods likely influenced by El-Niño–Southern Oscillation (ENSO) or Interdecadal Pacific Oscillation (IPO) variability (Gingele et al., 2007; Stanley and De Deckker, 2002; Bullard and McTainsh, 2003; Lamb et al., 2009). This climatic variability is consistent with the large fluctuations in AUS contributions to EDC during this interval.
Southern African dust sources are associated with three systems: the Makgadikgadi Complex (including Sua Pan), the Etosha Pan, and ephemeral river valleys along the Namibian coast (Wiggs et al., 2022; Gili et al., 2022; Prospero et al., 2002). During the Holocene, our results show an increasing trend in SAF dust contribution to EDC ice core (Figs. 1 and S4), which is consistent with an enhanced aeolian deposition of fine-grained material recorded in sediment core from the Walvis Ridge in Southeast Atlantic Ocean suggesting increasing aridity in southern western Africa (Stuut et al., 2002). Among SAF sources, the Namibian coast and ephemeral riverbeds were detected most frequently, though their overall contributions were smaller than those from the Etosha and Makgadikgadi systems. This pattern aligns with the large spatial extent and the strong climatic sensitivity of ephemeral Namibian rivers, which experienced episodic flow and channel aggradation in response to Holocene climate variability and now constitute the primary source of dust plumes (Stone et al., 2010).
The Puna-Altiplano Plateau emerges as a secondary dust contributor to EDC after 14.5 kyr BP, consistent with its strong sensitivity to aridification and the desiccation of riverbeds, alluvial fans, and paleolake systems. Dust from the South Puna contributes throughout the record, whereas the Southern Altiplano becomes active only after ∼ 11.2 kyr BP (Fig. S4), which coincides with the final desiccation of paleolake Coipasa and the establishment of persistent arid conditions (Condom et al., 2004; Blard et al., 2011; Placzek et al., 2006). Although Northern Puna has been suggested in several studies as a major source to EA (e.g., Gili et al., 2017; Gili et al., 2022; Gaiero et al., 2013), marked differences in Ce, Sm, Eu and LREE contents allow our algorithm to distinguish between Northern and Southern Puna revealing a clear dominance of South Puna contribution in EDC. Recently, Pullen et al. (2022) showed that South Puna was an active dust source area during the late Pleistocene and Holocene periods. The combined PAP dust assemblage – comprising a mafic component from the South Puna and a crustal component from the Southern Altiplano – is also consistent with Sr-Nd isotopic compositions of SSA sources and that of the Pampean loess reported by Coppo et al. (2022). Overall, the relatively important contribution of PAP to East Antarctica during interglacial periods is consistent with previous provenance studies (Gili et al., 2016, 2017; Gaiero et al., 2013; Gili et al., 2022).
Antarctic dust from the McMurdo Dry Valleys is only detected in EDC after 13 kyr BP which is consistent with the deglaciation timing of the low-elevation valleys included in the DS database (Diaz et al., 2020). In contrast, higher-elevation valleys in the McMurdo region have remained ice-free since the Miocene and have accumulated substantial atmospheric material from distal sources – especially during glacial periods. As a result, those areas display REE patterns strongly influenced by deposition from Australia, Patagonia, and New Zealand (Diaz et al., 2020). In order to avoid the risk of conflating distal and local Antarctic signals potentially leading to overestimation of the Antarctic contribution, we excluded those high-elevation areas from the DS database. Furthermore, dust transport from ice-free coastal areas to EDC has been shown to be very limited (Delmonte et al., 2013).
4.5 Spatial and temporal comparisons of EDC and EDML dust provenance records
Although several studies have proposed quantitative estimates of dust provenance in East Antarctic ice cores for specific climatic intervals, the only quasi-continuous record directly comparable to our EDC reconstruction is our recent study on the EDML ice core (Vanderstraeten et al., 2023). In Figs. 5 and 6 (for millennial trends), we compared the contributions of PAT, NZ, SAF, AUS, ANT and PAP from both cores between 7.5 and 27 kyr BP. Note however that results for ACR and YD* are tentative due to the limited number of samples covering those periods in EDC (8 and 9 samples in ACR and YD*, respectively, compared to 49 and 28 in EDML). At first glance in Fig. 6, the dust provenance compositions of the two cores appear broadly similar, supporting the idea that atmospheric dust deposition across East Antarctica during the LGIT was relatively uniform. This hypothesis had been previously proposed for the LGM, MIS 4, and MIS 6 by Fischer et al. (2007) and Marino et al. (2009), based on similar geochemical dust emission patterns and major element signatures in both cores, suggesting a shared glaciogenic dust source from SSA. A more detailed comparison, however, reveals subtle differences between EDC and EDML provenance contributions highlighting how atmospheric circulation modulates dust delivery to Antarctica (Delmonte et al., 2004b).
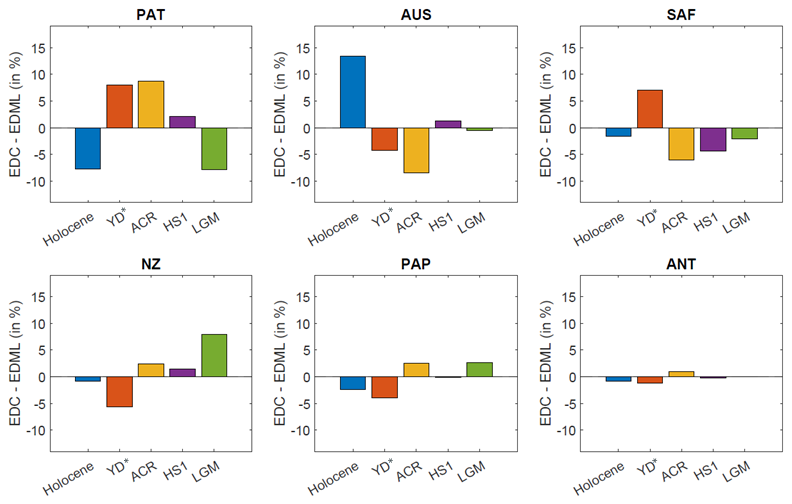
Figure 5Histograms representing the differences in provenance contributions ([PSA average contributions in EDC] − [PSA average contributions in EDML] in %) averaged over periods for each PSA between EDC and EDML ice cores (see Table S3).
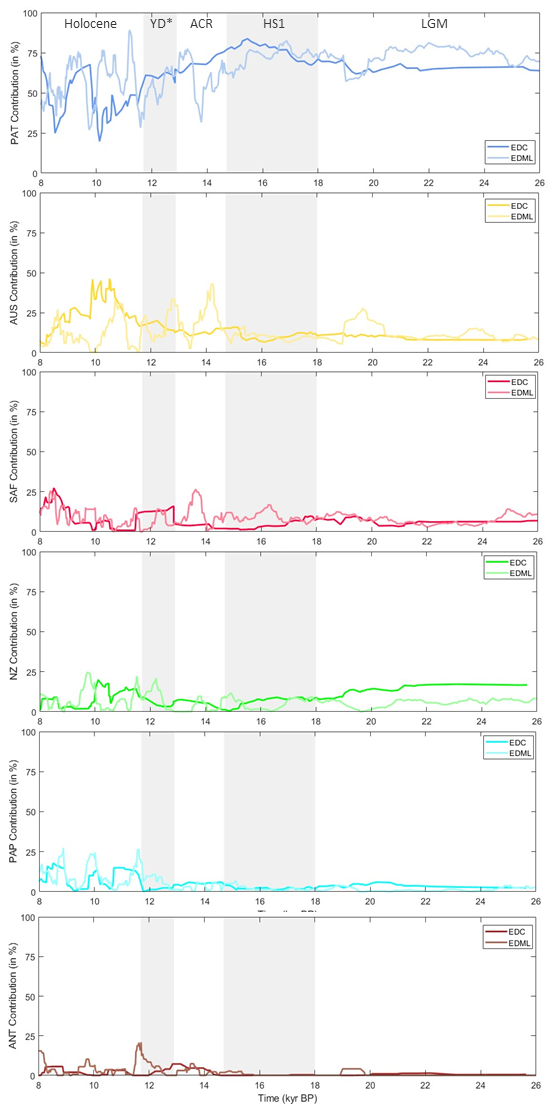
Figure 6Comparison of the total contributions of the main dust PSAs in the EDC (Table S2) and EDML ice cores (Vanderstraeten et al., 2023) across the LGIT (9-steps moving average).
Average dust source contributions during the LGM indicate that EDC received a greater proportion of NZ dust than EDML (+7.9 %, i.e., [PSA average LGM contributions in EDC] − [PSA average LGM contributions in EDML] Fig. 5 based on Table S3), compensated by an equivalent reduction in contributions from PAT (−7.7 %). During HS1, provenance compositions at both cores converge, with differences in PSA contributions not exceeding ∼ 4.4 %. In contrast, the ACR and YD* intervals exhibit a slight enrichment of Patagonian dust (+8.7 % and +8.0 %) in EDC, primarily at the expense of Southern African and Australian contributions. In the Holocene, the discrepancies become more pronounced: EDC appears to receive substantially less PAT dust (−7.7 %) but higher contributions of Australian dust (+13.3 %) than EDML. These differences are consistent with the geographic positioning of the two sites: EDML is exposed to the storm track in the Atlantic sector, and thus well positioned to receive dust from Patagonia brought in the mid-troposphere by the SWW. In contrast, EDC, located at the interior of EAP and the Indian Ocean sector, is comparatively insulated from such mid-latitude air masses incursions by the polar vortex. Nevertheless, planetary Rossby waves can disturb this polar vortex, allowing intrusions of mid-latitude or even low-latitude air masses (Baldwin and Dunkerton, 2001; Woollings et al., 2023). In such cases, dust from low-latitude PSAs – either uplifted to high altitudes (∼ 6–10 km a.s.l.) or directly deflated from elevated terrains such as the Puna–Altiplano Plateau – can be entrained southwestward by the subtropical jet (STJ) into the polar front jet (PFJ) and transported to central Antarctica. For example, dust from the high-altitude Puna–Altiplano has been observed to follow this pathway beyond 50° S (Gili et al., 2017; Gaiero et al., 2013), while similar mechanisms over southeast Australia can inject dust into the STJ–PFJ system (Yang et al., 2024). Nguyen et al. (2019) demonstrated that prevailing southwesterly winds in central and southeastern Australia, combined with the Great Dividing Range, can uplift dust to altitudes of 4–6 km, enabling its long-range transport to the Indian Ocean sector of Antarctica. Other studies have similarly identified regions in Australia as significant contributors to both western and eastern Antarctica (De Deckker et al., 2019; Revel-Rolland et al., 2006; Vallelonga et al., 2002). The enhanced contributions of low-latitude sources to EDC during the Holocene reflect both warmer climate circulation patterns – favoring poleward STJ trajectories and interactions with PFJ (Ding et al., 2011) – and increased aridity in low-latitude regions (see above), which likely amplified dust emissions and transport from these sources.
In addition to the regional differences in dust provenance between EDC and EDML, both records reveal synchronous millennial-scale changes in dust source contributions. Notably, between 15 and 14 kyr BP, both ice cores show a marked decline in Patagonian dust contributions (Fig. 6), accompanied by increasing inputs from Australia, Southern Africa and PAP. This shift from high- to lower-latitude dust sources is effectively decoupled from the earlier, more gradual yet massive decline in total dust deposition that began around 19–18 kyr BP and continued until ∼ 15 kyr BP in both cores (Figs. S2, S3 and S4). As detailed in Vanderstraeten et al. (2023), this provenance shift coincides with several major large-scale events: the large Antarctic Iceberg Discharge AID6, the onset of the Bølling interstadial in the Northern Hemisphere, and the rapid sea-level rise associated with Meltwater Pulse 1A (Weber et al., 2014). This transgression submerged vast areas of the Patagonian and New Zealand continental shelves, significantly reducing the availability of exposed, deflatable sediments and thereby curtailing PAT and NZ dust emissions to Antarctica. Simultaneously, the progressive deglaciation of the Patagonian Ice Sheet triggered substantial changes in regional riverine systems. New drainage pathways opened up effectively redirecting a large portion of the river catchment from the Atlantic to the Pacific Ocean, hence decreasing sediment supply and changing the planform (from braided to meandering) of rivers flowing on the eastern flank of Patagonia (Thorndycraft et al., 2019; Davies et al., 2020; Skirrow et al., 2021; Gaiero et al., 2003; Caldenius, 1932). These hydrological and geomorphological transformations further limited the potential for dust production in Patagonia. The combined effects of continental shelf submergence in Patagonia (and New Zealand), along with drainage reversals and reorganized river networks, led to a persistent decline in high-latitude dust contributions. Those phenomena induced a relative increase in dust input from lower-latitude source regions such as Australia, Southern Africa, and the Puna-Altiplano, further enhanced by the long-term trend of increasing aridity in these regions and the greater efficiency of long-range atmospheric transport from low-latitude to Antarctica (see above). Collectively, the patterns observed at both EDC and EDML suggest that eustatic sea-level rise and postglacial hydrological reorganization in Patagonia had broad and long-lasting effects on Antarctic dust composition during the LGIT.
This study presents the first high-resolution quantitative reconstruction of dust provenance in the EDC ice core over the Last Glacial-Interglacial Transition (LGIT). Our results reveal a distinct shift in dust source composition from glacial to interglacial periods. During the MIS3, LGM and Heinrich Stadial 1, dust reaching EDC was predominantly derived from high-latitude glaciogenic sources, particularly Patagonia and New Zealand, reflecting the extensive outwash plains, cold and arid conditions, and efficient dust mobilization mechanisms in those regions. From ∼ 14.5 kyr BP onward, a marked reorganization in dust provenance occurred, characterized by a relative decline in high-latitude PSA contributions and a corresponding rise in dust from low-latitude sources such as Australia, Southern Africa and the Puna-Altiplano Plateau. As such, those results confirm our previous study on the EDML dust record showing similar a shift that we ascribed to a complex interplay of hydrological rearrangement processes in Patagonia and the rapid submersion of its shelf. This shift in provenance is effectively decoupled from the massive decline in dust deposition that occurred between 18 and 15 kyr BP due to changing atmospheric transport dynamics. Comparisons with the EDML record reveal both broad similarities and specific key regional differences in dust provenance across East Antarctica: while millennial-scale changes were broadly synchronous, the relative contributions of PAT, SAF, NZ and AUS differed, reflecting regional climatic dynamics in their respective source areas. Finally, our findings emphasize the role of glacial-eustatic and hydrological feedbacks – particularly sea-level rise, drainage reversals, and paleolake desiccation – in reshaping dust source activation and transport. These processes, in turn, contributed to the persistent reorganization of the Southern Hemisphere dust cycle during the LGIT, with implications for biogeochemical fluxes, atmospheric circulation (chemistry and physics), and climate feedbacks on glacial-interglacial timescales.
All data needed to evaluate the conclusions in the paper are present in the paper and/or the Supplement. Additional data related to the paper may be requested from the authors. Correspondence and requests should be addressed to Sibylle Boxho (sibylle.boxho@ulb.be).
The supplement related to this article is available online at https://doi.org/10.5194/cp-22-1655-2026-supplement.
P.G. performed the measurements; A.V., St.B and G.L. developed together the model; Si.B and St.B. analyzed the data and wrote the manuscript draft. All authors discussed the results and commented on the manuscript.
The contact author has declared that none of the authors has any competing interests.
Publisher's note: Copernicus Publications remains neutral with regard to jurisdictional claims made in the text, published maps, institutional affiliations, or any other geographical representation in this paper. The authors bear the ultimate responsibility for providing appropriate place names. Views expressed in the text are those of the authors and do not necessarily reflect the views of the publisher.
All the authors would like to thank the reviewers, Austin Carter and Bess G. Koffman, for their constructive feedbacks, which greatly improved the quality of this manuscript. The authors thank Laurent Charlet for the collection of six new samples in Namibia.
This research has been supported by the Fonds De La Recherche Scientifique - FNRS (grant no. FRS-FNRS CDR-J.0017.22, FRS-FNRS CDR-J.0110.23F, and FRS-FNRS CDR-J.0159.25), the Agence Nationale de la Recherche (CaPPA project at the LOG grant no. ANR-ll-LABX-0005-01), and the Centre national d'études spatiales (CNES grant no. TOSCA/DOC). Goulven G. Laruelle is research associate of the F.R.S-FNRS at the Université Libre de Bruxelles (ULB).
This paper was edited by Christo Buizert and reviewed by Austin Carter and Bess G. Koffman.
Albani, S., Delmonte, B., Maggi, V., Baroni, C., Petit, J.-R., Stenni, B., Mazzola, C., and Frezzotti, M.: Interpreting last glacial to Holocene dust changes at Talos Dome (East Antarctica): implications for atmospheric variations from regional to hemispheric scales, Clim. Past, 8, 741–750, https://doi.org/10.5194/cp-8-741-2012, 2012.
Baldwin, M. P. and Dunkerton, T. J.: Stratospheric Harbingers of Anomalous Weather Regimes, Science, 294, 581–584, https://doi.org/10.1126/science.1063315, 2001.
Basile, I., Grousset, F. E., Revel, M., Petit, J. R., Biscaye, P. E., and Barkov, N. I.: Patagonian origin of glacial dust deposited in East Antarctica (Vostok and Dome C) during glacial stages 2, 4 and 6, Earth Planet. Sc. Lett., 146, 573–589, https://doi.org/10.1016/S0012-821X(96)00255-5, 1997.
Bianchi, C. and Gersonde, R.: Climate evolution at the last deglaciation: the role of the Southern Ocean, Earth Planet. Sc. Lett., 228, 407–424, https://doi.org/10.1016/j.epsl.2004.10.003, 2004.
Blakowski, M. A., Aciego, S. M., Delmonte, B., Baroni, C., Salvatore, M. C., and Sims, K. W. W.: A Sr-Nd-Hf isotope characterization of dust source areas in Victoria Land and the McMurdo Sound sector of Antarctica, Quaternary Sci. Rev., 141, 26–37, https://doi.org/10.1016/j.quascirev.2016.03.023, 2016.
Blard, P.-H., Sylvestre, F., Tripati, A. K., Claude, C., Causse, C., Coudrain, A., Condom, T., Seidel, J.-L., Vimeux, F., Moreau, C., Dumoulin, J.-P., and Lavé, J.: Lake highstands on the Altiplano (Tropical Andes) contemporaneous with Heinrich 1 and the Younger Dryas: new insights from 14C, U–Th dating and δ18O of carbonates, Quaternary Sci. Rev., 30, 3973–3989, https://doi.org/10.1016/j.quascirev.2011.11.001, 2011.
Bory, A., Wolff, E., Mulvaney, R., Jagoutz, E., Wegner, A., Ruth, U., and Elderfield, H.: Multiple sources supply eolian mineral dust to the Atlantic sector of coastal Antarctica: Evidence from recent snow layers at the top of Berkner Island ice sheet, Earth Planet. Sc. Lett., 291, 138–148, https://doi.org/10.1016/j.epsl.2010.01.006, 2010.
Bullard, J. E. and McTainsh, G. H.: Aeolian-fluvial interactions in dryland environments: examples, concepts and Australia case study, Progress in Physical Geography: Earth and Environment, 27, 471–501, https://doi.org/10.1191/0309133303pp386ra, 2003.
Bullard, J. E., Baddock, M., Bradwell, T., Crusius, J., Darlington, E., Gaiero, D., Gassó, S., Gisladottir, G., Hodgkins, R., McCulloch, R., McKenna‐Neuman, C., Mockford, T., Stewart, H., and Thorsteinsson, T.: High‐latitude dust in the Earth system, Rev. Geophys., 54, 447–485, https://doi.org/10.1002/2016RG000518, 2016.
Caldenius, C. C.: Las Glaciaciones Cuaternarias en la Patagonia y Tierra del Fuego, Geografiska Annaler, 14, 1–164, https://doi.org/10.1080/20014422.1932.11880545, 1932.
Condom, T., Coudrain, A., Dezetter, A., Brunstein, D., Delclaux, F., and Jean-Emmanuel, S.: Transient modelling of lacustrine regressions: two case studies from the Andean Altiplano, Hydrol. Process., 18, 2395–2408, https://doi.org/10.1002/hyp.1470, 2004.
Coppo, R., Cosentino, N. J., Torre, G., Del Rio, I., Sawakuchi, A. O., Berman, A. L., Koester, E., Delmonte, B., and Gaiero, D. M.: Coeval minimum south American and maximum Antarctic last glacial maximum dust deposition: A causal link, Quaternary Sci. Rev., 295, 107768, https://doi.org/10.1016/j.quascirev.2022.107768, 2022.
Davies, B. J., Darvill, C. M., Lovell, H., Bendle, J. M., Dowdeswell, J. A., Fabel, D., García, J.-L., Geiger, A., Glasser, N. F., Gheorghiu, D. M., Harrison, S., Hein, A. S., Kaplan, M. R., Martin, J. R. V., Mendelova, M., Palmer, A., Pelto, M., Rodés, Á., Sagredo, E. A., Smedley, R. K., Smellie, J. L., and Thorndycraft, V. R.: The evolution of the Patagonian Ice Sheet from 35 ka to the present day (PATICE), Earth-Sci. Rev., 204, 103152, https://doi.org/10.1016/j.earscirev.2020.103152, 2020.
De Deckker, P.: An evaluation of Australia as a major source of dust, Earth-Sci. Rev., 194, 536–567, https://doi.org/10.1016/j.earscirev.2019.01.008, 2019.
De Deckker, P.: Airborne dust traffic from Australia in modern and Late Quaternary times, Global Planet. Change, 184, 103056, https://doi.org/10.1016/j.gloplacha.2019.103056, 2020.
De Deckker, P., Norman, M., Goodwin, I. D., Wain, A., and Gingele, F. X.: Lead isotopic evidence for an Australian source of aeolian dust to Antarctica at times over the last 170,000 years, Palaeogeogr. Palaeocl., 285, 205–223, https://doi.org/10.1016/j.palaeo.2009.11.013, 2010.
De Deckker, P., Munday, C. I., Brocks, J., O'Loingsigh, T., Allison, G. E., Hope, J., Norman, M., Stuut, J.-B. W., Tapper, N. J., and van der Kaars, S.: Characterisation of the major dust storm that traversed over eastern Australia in September 2009; a multidisciplinary approach, Aeolian Res., 15, 133–149, https://doi.org/10.1016/j.aeolia.2014.07.003, 2014.
Delmonte, B., Basile-Doelsch, I., Petit, J.-R., Maggi, V., Revel-Rolland, M., Michard, A., Jagoutz, E., and Grousset, F.: Comparing the Epica and Vostok dust records during the last 220,000 years: stratigraphical correlation and provenance in glacial periods, Earth-Sci. Rev., 66, 63–87, https://doi.org/10.1016/j.earscirev.2003.10.004, 2004a.
Delmonte, B., Petit, J. R., Andersen, K. K., Basile-Doelsch, I., Maggi, V., and Ya Lipenkov, V.: Dust size evidence for opposite regional atmospheric circulation changes over east Antarctica during the last climatic transition, Clim. Dynam., 23, 427–438, https://doi.org/10.1007/s00382-004-0450-9, 2004b.
Delmonte, B., Petit, J. R., Basile-Doelsch, I., Jagoutz, E., and Maggi, V.: 6. Late quaternary interglacials in East Antarctica from ice-core dust records, in: The Climate of Past Interglacials, vol. 7, edited by: Sirocko, F., Claussen, M., Goñi, M. F. S., and Litt, T., Elsevier, 53–73, https://doi.org/10.1016/S1571-0866(07)80031-5, 2007.
Delmonte, B., Andersson, P. S., Hansson, M., Schöberg, H., Petit, J. R., Basile-Doelsch, I., and Maggi, V.: Aeolian dust in East Antarctica (EPICA-Dome C and Vostok): Provenance during glacial ages over the last 800 kyr: Aeolian Dust in East Antarctica, Geophys. Res. Lett., 35, L07703, https://doi.org/10.1029/2008GL033382, 2008.
Delmonte, B., Andersson, P. S., Schöberg, H., Hansson, M., Petit, J. R., Delmas, R., Gaiero, D. M., Maggi, V., and Frezzotti, M.: Geographic provenance of aeolian dust in East Antarctica during Pleistocene glaciations: preliminary results from Talos Dome and comparison with East Antarctic and new Andean ice core data, Quaternary Sci. Rev., 29, 256–264, https://doi.org/10.1016/j.quascirev.2009.05.010, 2010.
Delmonte, B., Baroni, C., Andersson, P. S., Narcisi, B., Salvatore, M. C., Petit, J. R., Scarchilli, C., Frezzotti, M., Albani, S., and Maggi, V.: Modern and Holocene aeolian dust variability from Talos Dome (Northern Victoria Land) to the interior of the Antarctic ice sheet, Quaternary Sci. Rev., 64, 76–89, https://doi.org/10.1016/j.quascirev.2012.11.033, 2013.
Delmonte, B., Paleari, C. I., Andò, S., Garzanti, E., Andersson, P. S., Petit, J. R., Crosta, X., Narcisi, B., Baroni, C., Salvatore, M. C., Baccolo, G., and Maggi, V.: Causes of dust size variability in central East Antarctica (Dome B): Atmospheric transport from expanded South American sources during Marine Isotope Stage 2, Quaternary Sci. Rev., 168, 55–68, https://doi.org/10.1016/j.quascirev.2017.05.009, 2017.
Delmonte, B., Winton, H., Baroni, M., Baccolo, G., Hansson, M., Andersson, P., Baroni, C., Salvatore, M. C., Lanci, L., and Maggi, V.: Holocene dust in East Antarctica: Provenance and variability in time and space, The Holocene, 30, 546–558, https://doi.org/10.1177/0959683619875188, 2020.
Diaz, M. A., Welch, S. A., Sheets, J. M., Welch, K. A., Khan, A. L., Adams, B. J., McKnight, D. M., Cary, S. C., and Lyons, W. B.: Geochemistry of aeolian material from the McMurdo Dry Valleys, Antarctica: Insights into Southern Hemisphere dust sources, Earth Planet. Sc. Lett., 547, 116460, https://doi.org/10.1016/j.epsl.2020.116460, 2020.
Ding, Q., Steig, E. J., Battisti, D. S., and Küttel, M.: Winter warming in West Antarctica caused by central tropical Pacific warming, Nat. Geosci., 4, 398–403, https://doi.org/10.1038/ngeo1129, 2011.
Dukes, D., Gonzales, H. B., Ravi, S., Grandstaff, D. E., Van Pelt, R. S., Li, J., Wang, G., and Sankey, J. B.: Quantifying Postfire Aeolian Sediment Transport Using Rare Earth Element Tracers, J. Geophys. Res.-Biogeo., 123, 288–299, https://doi.org/10.1002/2017JG004284, 2018.
EPICA Community Members: One-to-one coupling of glacial climate variability in Greenland and Antarctica, Nature, 444, 195–198, https://doi.org/10.1038/nature05301, 2006.
Fischer, H., Fundel, F., Ruth, U., Twarloh, B., Wegner, A., Udisti, R., Becagli, S., Castellano, E., Morganti, A., Severi, M., Wolff, E., Littot, G., Röthlisberger, R., Mulvaney, R., Hutterli, M. A., Kaufmann, P., Federer, U., Lambert, F., Bigler, M., Hansson, M., Jonsell, U., De Angelis, M., Boutron, C., Siggaard-Andersen, M.-L., Steffensen, J. P., Barbante, C., Gaspari, V., Gabrielli, P., and Wagenbach, D.: Reconstruction of millennial changes in dust emission, transport and regional sea ice coverage using the deep EPICA ice cores from the Atlantic and Indian Ocean sector of Antarctica, Earth Planet. Sc. Lett., 260, 340–354, https://doi.org/10.1016/j.epsl.2007.06.014, 2007.
Fletcher, M.-S. and Moreno, P. I.: Zonally symmetric changes in the strength and position of the Southern Westerlies drove atmospheric CO2 variations over the past 14 k.y., Geology, 39, 419–422, https://doi.org/10.1130/G31807.1, 2011.
Gabrielli, P., Barbante, C., Turetta, C., Marteel, A., Boutron, C., Cozzi, G., Cairns, W., Ferrari, C., and Cescon, P.: Direct determination of rare earth elements at the subpicogram per gram level in antarctic ice by ICP-SFMS using a desolvation system, Analytical chemistry, 78, 1883–1889, https://doi.org/10.1021/ac0518957, 2006.
Gabrielli, P., Wegner, A., Petit, J. R., Delmonte, B., De Deckker, P., Gaspari, V., Fischer, H., Ruth, U., Kriews, M., Boutron, C., Cescon, P., and Barbante, C.: A major glacial-interglacial change in aeolian dust composition inferred from Rare Earth Elements in Antarctic ice, Quaternary Sci. Rev., 29, 265–273, https://doi.org/10.1016/j.quascirev.2009.09.002, 2010.
Gaiero, D. M.: Dust provenance in Antarctic ice during glacial periods: From where in southern South America?, Geophys. Res. Lett., 34, L17707, https://doi.org/10.1029/2007GL030520, 2007.
Gaiero, D. M., Probst, J.-L., Depetris, P. J., Bidart, S. M., and Leleyter, L.: Iron and other transition metals in Patagonian riverborne and windborne materials: geochemical control and transport to the southern South Atlantic Ocean, Geochim. Cosmochim. Ac., 67, 3603–3623, https://doi.org/10.1016/S0016-7037(03)00211-4, 2003.
Gaiero, D. M., Depetris, P. J., Probst, J.-L., Bidart, S. M., and Leleyter, L.: The signature of river- and wind-borne materials exported from Patagonia to the southern latitudes: a view from REEs and implications for paleoclimatic interpretations, Earth Planet. Sc. Lett., 219, 357–376, https://doi.org/10.1016/S0012-821X(03)00686-1, 2004.
Gaiero, D. M., Simonella, L., Gassó, S., Gili, S., Stein, A. F., Sosa, P., Becchio, R., Arce, J., and Marelli, H.: Ground/satellite observations and atmospheric modeling of dust storms originating in the high Puna-Altiplano deserts (South America): Implications for the interpretation of paleo-climatic archives: Dust storms from Puna-Altiplano deserts, J. Geophys. Res.-Atmos., 118, 3817–3831, https://doi.org/10.1002/jgrd.50036, 2013.
Gili, S., Gaiero, D. M., Goldstein, S. L., Chemale Jr., F., Koester, E., Jweda, J., Vallelonga, P., and Kaplan, M. R.: Provenance of dust to Antarctica: A lead isotopic perspective: Pb isotopic signature in Antarctic dust, Geophys. Res. Lett., 43, 2291–2298, https://doi.org/10.1002/2016GL068244, 2016.
Gili, S., Gaiero, D. M., Goldstein, S. L., Chemale, F., Jweda, J., Kaplan, M. R., Becchio, R. A., and Koester, E.: Glacial/interglacial changes of Southern Hemisphere wind circulation from the geochemistry of South American dust, Earth Planet. Sc. Lett., 469, 98–109, https://doi.org/10.1016/j.epsl.2017.04.007, 2017.
Gili, S., Vanderstraeten, A., Chaput, A., King, J., Gaiero, D. M., Delmonte, B., Vallelonga, P., Formenti, P., Di Biagio, C., Cazanau, M., Pangui, E., Doussin, J.-F., and Mattielli, N.: South African dust contribution to the high southern latitudes and East Antarctica during interglacial stages, Commun. Earth Environ., 3, 129, https://doi.org/10.1038/s43247-022-00464-z, 2022.
Gingele, F., De Deckker, P., and Norman, M.: Late Pleistocene and Holocene climate of SE Australia reconstructed from dust and river loads deposited offshore the River Murray Mouth, Earth Planet. Sc. Lett., 255, 257–272, https://doi.org/10.1016/j.epsl.2006.12.019, 2007.
Gingele, F. X. and De Deckker, P.: Clay mineral, geochemical and Sr–Nd isotopic fingerprinting of sediments in the Murray–Darling fluvial system, southeast Australia, Aust. J. Earth Sci., 52, 965–974, https://doi.org/10.1080/08120090500302301, 2005.
Grousset, F. E. and Biscaye, P. E.: Tracing dust sources and transport patterns using Sr, Nd and Pb isotopes, Chem. Geol., 222, 149–167, https://doi.org/10.1016/j.chemgeo.2005.05.006, 2005.
Grousset, F. E., Biscaye, P. E., Revel, M., Petit, J.-R., Pye, K., Joussaume, S., and Jouzel, J.: Antarctic (Dome C) ice-core dust at 18 k.y. B.P.: Isotopic constraints on origins, Earth Planet. Sc. Lett., 111, 175–182, https://doi.org/10.1016/0012-821X(92)90177-W, 1992.
Kilian, R. and Lamy, F.: A review of Glacial and Holocene paleoclimate records from southernmost Patagonia (49–55° S), Quaternary Sci. Rev., 53, 1–23, https://doi.org/10.1016/j.quascirev.2012.07.017, 2012.
Koffman, B. G., Goldstein, S. L., Winckler, G., Borunda, A., Kaplan, M. R., Bolge, L., Cai, Y., Recasens, C., Koffman, T. N. B., and Vallelonga, P.: New Zealand as a source of mineral dust to the atmosphere and ocean, Quaternary Sci. Rev., 251, 106659, https://doi.org/10.1016/j.quascirev.2020.106659, 2021.
Kok, J. F., Adebiyi, A. A., Albani, S., Balkanski, Y., Checa-Garcia, R., Chin, M., Colarco, P. R., Hamilton, D. S., Huang, Y., Ito, A., Klose, M., Li, L., Mahowald, N. M., Miller, R. L., Obiso, V., Pérez García-Pando, C., Rocha-Lima, A., and Wan, J. S.: Contribution of the world's main dust source regions to the global cycle of desert dust, Atmos. Chem. Phys., 21, 8169–8193, https://doi.org/10.5194/acp-21-8169-2021, 2021.
Krätschmer, S., van der Does, M., Lamy, F., Lohmann, G., Völker, C., and Werner, M.: Simulating glacial dust changes in the Southern Hemisphere using ECHAM6.3-HAM2.3, Clim. Past, 18, 67–87, https://doi.org/10.5194/cp-18-67-2022, 2022.
Krinner, G., Petit, J.-R., and Delmonte, B.: Altitude of atmospheric tracer transport towards Antarctica in present and glacial climate, Quaternary Sci. Rev., 29, 274–284, https://doi.org/10.1016/j.quascirev.2009.06.020, 2010.
Lamb, P. J., Leslie, L. M., Timmer, R. P., and Speer, M. S.: Multidecadal variability of Eastern Australian dust and Northern New Zealand sunshine: Associations with Pacific climate system, J. Geophys. Res., 114, D09106, https://doi.org/10.1029/2008JD011184, 2009.
Lambert, F., Delmonte, B., Petit, J. R., Bigler, M., Kaufmann, P. R., Hutterli, M. A., Stocker, T. F., Ruth, U., Steffensen, J. P., and Maggi, V.: Dust-climate couplings over the past 800,000 years from the EPICA Dome C ice core, Nature, 452, 616–619, https://doi.org/10.1038/nature06763, 2008.
Lambert, F., Tagliabue, A., Shaffer, G., Lamy, F., Winckler, G., Farias, L., Gallardo, L., and De Pol‐Holz, R.: Dust fluxes and iron fertilization in Holocene and Last Glacial Maximum climates, Geophys. Res. Lett., 42, 6014–6023, https://doi.org/10.1002/2015GL064250, 2015.
Lambert, F., Opazo, N., Ridgwell, A., Winckler, G., Lamy, F., Shaffer, G., Kohfeld, K., Ohgaito, R., Albani, S., and Abe-Ouchi, A.: Regional patterns and temporal evolution of ocean iron fertilization and CO2 drawdown during the last glacial termination, Earth Planet. Sc. Lett., 554, 116675, https://doi.org/10.1016/j.epsl.2020.116675, 2021.
Li, C., Sonke, J. E., Le Roux, G., Van der Putten, N., Piotrowska, N., Jeandel, C., Mattielli, N., Benoit, M., Wiggs, G. F. S., and De Vleeschouwer, F.: Holocene dynamics of the southern westerly winds over the Indian Ocean inferred from a peat dust deposition record, Quaternary Sci. Rev., 231, 106169, https://doi.org/10.1016/j.quascirev.2020.106169, 2020.
Li, F., Ginoux, P., and Ramaswamy, V.: Distribution, transport, and deposition of mineral dust in the Southern Ocean and Antarctica: Contribution of major sources, J. Geophys. Res., 113, D10207, https://doi.org/10.1029/2007JD009190, 2008.
Lisé-Pronovost, A., St-Onge, G., Gogorza, C., Haberzettl, T., Jouve, G., Francus, P., Ohlendorf, C., Gebhardt, C., and Zolitschka, B.: Rock-magnetic proxies of wind intensity and dust since 51,200 cal BP from lacustrine sediments of Laguna Potrok Aike, southeastern Patagonia, Earth Planet. Sc. Lett., 411, 72–86, https://doi.org/10.1016/j.epsl.2014.11.007, 2015.
Magee, J. W., Miller, G. H., Spooner, N. A., and Questiaux, D.: Continuous 150 k.y. monsoon record from Lake Eyre, Australia: Insolation-forcing implications and unexpected Holocene failure, Geology, 32, 885–888, https://doi.org/10.1130/G20672.1, 2004.
Marino, F., Castellano, E., Nava, S., Chiari, M., Ruth, U., Wegner, A., Lucarelli, F., Udisti, R., Delmonte, B., and Maggi, V.: Coherent composition of glacial dust on opposite sides of the East Antarctic Plateau inferred from the deep EPICA ice cores, Geophys. Res. Lett., 36, L23703, https://doi.org/10.1029/2009GL040732, 2009.
Markgraf, V., Whitlock, C., and Haberle, S.: Vegetation and fire history during the last 18,000 cal yr B.P. in Southern Patagonia: Mallín Pollux, Coyhaique, Province Aisén (45°41′30′′ S, 71°50′30′′ W, 640 m elevation), Palaeogeogr. Palaeocl., 254, 492–507, https://doi.org/10.1016/j.palaeo.2007.07.008, 2007.
Markle, B. R., Steig, E. J., Roe, G. H., Winckler, G., and McConnell, J. R.: Concomitant variability in high-latitude aerosols, water isotopes and the hydrologic cycle, Nat. Geosci., 11, 853–859, https://doi.org/10.1038/s41561-018-0210-9, 2018.
Martínez-García, A., Sigman, D. M., Ren, H., Anderson, R. F., Straub, M., Hodell, D. A., Jaccard, S. L., Eglinton, T. I., and Haug, G. H.: Iron Fertilization of the Subantarctic Ocean During the Last Ice Age, Science, 343, 1347–1350, https://doi.org/10.1126/science.1246848, 2014.
Masson, V., Vimeux, F., Jouzel, J., Morgan, V., Delmotte, M., Ciais, P., Hammer, C., Johnsen, S., Lipenkov, V. Ya., Mosley-Thompson, E., Petit, J.-R., Steig, E. J., Stievenard, M., and Vaikmae, R.: Holocene Climate Variability in Antarctica Based on 11 Ice-Core Isotopic Records, Quaternary Res., 54, 348–358, https://doi.org/10.1006/qres.2000.2172, 2000.
Moreno, P. I., Francois, J. P., Moy, C. M., and Villa-Martínez, R.: Covariability of the Southern Westerlies and atmospheric CO2 during the Holocene, Geology, 38, 727–730, https://doi.org/10.1130/G30962.1, 2010.
Moreno, P. I., Henríquez, W. I., Pesce, O. H., Henríquez, C. A., Fletcher, M. S., Garreaud, R. D., and Villa-Martínez, R. P.: An early Holocene westerly minimum in the southern mid-latitudes, Quaternary Sci. Rev., 251, 106730, https://doi.org/10.1016/j.quascirev.2020.106730, 2021.
Neff, P. D. and Bertler, N. A. N.: Trajectory modeling of modern dust transport to the Southern Ocean and Antarctica, J. Geophys. Res.-Atmos., 120, 9303–9322, https://doi.org/10.1002/2015JD023304, 2015.
Nguyen, H. D., Riley, M., Leys, J., and Salter, D.: Dust Storm Event of February 2019 in Central and East Coast of Australia and Evidence of Long-Range Transport to New Zealand and Antarctica, Atmosphere, 10, 653, https://doi.org/10.3390/atmos10110653, 2019.
Parrenin, F., Barnola, J.-M., Beer, J., Blunier, T., Castellano, E., Chappellaz, J., Dreyfus, G., Fischer, H., Fujita, S., Jouzel, J., Kawamura, K., Lemieux-Dudon, B., Loulergue, L., Masson-Delmotte, V., Narcisi, B., Petit, J.-R., Raisbeck, G., Raynaud, D., Ruth, U., Schwander, J., Severi, M., Spahni, R., Steffensen, J. P., Svensson, A., Udisti, R., Waelbroeck, C., and Wolff, E.: The EDC3 chronology for the EPICA Dome C ice core, Clim. Past, 3, 485–497, https://doi.org/10.5194/cp-3-485-2007, 2007.
Placzek, C., Quade, J., and Patchett, P. J.: Geochronology and stratigraphy of late Pleistocene lake cycles on the southern Bolivian Altiplano: Implications for causes of tropical climate change, GSA Bulletin, 118, 515–532, https://doi.org/10.1130/B25770.1, 2006.
Power, M. J., Marlon, J., Ortiz, N., Bartlein, P. J., Harrison, S. P., Mayle, F. E., Ballouche, A., Bradshaw, R. H. W., Carcaillet, C., Cordova, C., Mooney, S., Moreno, P. I., Prentice, I. C., Thonicke, K., Tinner, W., Whitlock, C., Zhang, Y., Zhao, Y., Ali, A. A., Anderson, R. S., Beer, R., Behling, H., Briles, C., Brown, K. J., Brunelle, A., Bush, M., Camill, P., Chu, G. Q., Clark, J., Colombaroli, D., Connor, S., Daniau, A.-L., Daniels, M., Dodson, J., Doughty, E., Edwards, M. E., Finsinger, W., Foster, D., Frechette, J., Gaillard, M.-J., Gavin, D. G., Gobet, E., Haberle, S., Hallett, D. J., Higuera, P., Hope, G., Horn, S., Inoue, J., Kaltenrieder, P., Kennedy, L., Kong, Z. C., Larsen, C., Long, C. J., Lynch, J., Lynch, E. A., McGlone, M., Meeks, S., Mensing, S., Meyer, G., Minckley, T., Mohr, J., Nelson, D. M., New, J., Newnham, R., Noti, R., Oswald, W., Pierce, J., Richard, P. J. H., Rowe, C., Sanchez Goñi, M. F., Shuman, B. N., Takahara, H., Toney, J., Turney, C., Urrego-Sanchez, D. H., Umbanhowar, C., Vandergoes, M., Vanniere, B., Vescovi, E., Walsh, M., Wang, X., Williams, N., Wilmshurst, J., and Zhang, J. H.: Changes in fire regimes since the Last Glacial Maximum: an assessment based on a global synthesis and analysis of charcoal data, Clim. Dynam., 30, 887–907, https://doi.org/10.1007/s00382-007-0334-x, 2008.
Prospero, J. M., Ginoux, P., Torres, O., Nicholson, S. E., and Gill, T. E.: Environmental characterization of global sources of atmospheric soil dust identified with the Nimbus 7 total ozone mapping spectrometer (TOMS) absorbing aerosol product, Rev. Geophys., 40, https://doi.org/10.1029/2000RG000095, 2002.
Pullen, A., Barbeau, D. L., Leier, A. L., Abell, J. T., Ward, M., Bruner, A., and Fidler, M. K.: A westerly wind dominated Puna Plateau during deposition of upper Pleistocene loessic sediments in the subtropical Andes, South America, Nat. Commun., 13, 3411, https://doi.org/10.1038/s41467-022-31118-5, 2022.
Quade, J. and Kaplan, M. R.: Lake-level stratigraphy and geochronology revisited at Lago (Lake) Cardiel, Argentina, and changes in the Southern Hemispheric Westerlies over the last 25 ka, Quaternary Sci. Rev., 177, 173–188, https://doi.org/10.1016/j.quascirev.2017.10.006, 2017.
Revel-Rolland, M., De Deckker, P., Delmonte, B., Hesse, P., Magee, J., Basiledoelsch, I., Grousset, F., and Bosch, D.: Eastern Australia: A possible source of dust in East Antarctica interglacial ice, Earth Planet. Sc. Lett., 249, 1–13, https://doi.org/10.1016/j.epsl.2006.06.028, 2006.
Rudnick, R. L. and Gao, S.: 3.01 Composition of the Continental Crust, in: Treatise on Geochemistry, Vol. 03, edited by: Holland, H. D. and Turekian, K. K., Pergamon, Oxford, 1–64, https://doi.org/10.1016/B0-08-043751-6/03016-4, 2003.
Saunders, K. M., Roberts, S. J., Perren, B., Butz, C., Sime, L., Davies, S., Van Nieuwenhuyze, W., Grosjean, M., and Hodgson, D. A.: Holocene dynamics of the Southern Hemisphere westerly winds and possible links to CO2 outgassing, Nat. Geosci., 11, 650–655, https://doi.org/10.1038/s41561-018-0186-5, 2018.
Singh, G. and Luly, J.: Changes in vegetation and seasonal climate since the last full glacial at Lake Frome, South Australia, Palaeogeogr. Palaeocl., 84, 75–86, https://doi.org/10.1016/0031-0182(91)90036-Q, 1991.
Skirrow, G. K., Smedley, R. K., Chiverrell, R. C., and Hooke, J. M.: Planform change of the Río Chubut (∼ 42° S, ∼ 70° W, Argentina) in response to climate drivers in the southern Andes, Geomorphology, 393, 107924, https://doi.org/10.1016/j.geomorph.2021.107924, 2021.
Stanley, S. and De Deckker, P. D.: A Holocene record of allochthonous, aeolian mineral grains in an Australian alpine lake; implications for the history of climate change in southeastern Australia, J. Paleolimnol., 27, 207–219, https://doi.org/10.1023/A:1014249404845, 2002.
Stenni, B., Masson-Delmotte, V., Selmo, E., Oerter, H., Meyer, H., Röthlisberger, R., Jouzel, J., Cattani, O., Falourd, S., Fischer, H., Hoffmann, G., Iacumin, P., Johnsen, S. J., Minster, B., and Udisti, R.: The deuterium excess records of EPICA Dome C and Dronning Maud Land ice cores (East Antarctica), Quaternary Sci. Rev. 29, 146–159, https://doi.org/10.1016/j.quascirev.2009.10.009, 2010.
Stone, A. E. C., Thomas, D. S. G., and Viles, H. A.: Late Quaternary palaeohydrological changes in the northern Namib Sand Sea: New chronologies using OSL dating of interdigitated aeolian and water-lain interdune deposits, Palaeogeogr. Palaeocl., 288, 35–53, https://doi.org/10.1016/j.palaeo.2010.01.032, 2010.
Stuut, J.-B. W., Prins, M. A., Schneider, R. R., Weltje, G. J., Jansen, J. H. F., and Postma, G.: A 300-kyr record of aridity and wind strength in southwestern Africa: inferences from grain-size distributions of sediments on Walvis Ridge, SE Atlantic, Mar. Geol., 180, 221–233, https://doi.org/10.1016/S0025-3227(01)00215-8, 2002.
Sugden, D. E., McCulloch, R. D., Bory, A. J.-M., and Hein, A. S.: Influence of Patagonian glaciers on Antarctic dust deposition during the last glacial period, Nat. Geosci., 2, 281–285, https://doi.org/10.1038/ngeo474, 2009.
Thorndycraft, V. R., Bendle, J. M., Benito, G., Davies, B. J., Sancho, C., Palmer, A. P., Fabel, D., Medialdea, A., and Martin, J. R. V.: Glacial lake evolution and Atlantic-Pacific drainage reversals during deglaciation of the Patagonian Ice Sheet, Quaternary Sci. Rev., 203, 102–127, https://doi.org/10.1016/j.quascirev.2018.10.036, 2019.
Vallelonga, P., Van de Velde, K., Candelone, J.-P., Morgan, V. I., Boutron, C. F., and Rosman, K. J. R.: The lead pollution history of Law Dome, Antarctica, from isotopic measurements on ice cores: 1500 AD to 1989 AD, Earth Planet. Sc. Lett., 204, 291–306, https://doi.org/10.1016/S0012-821X(02)00983-4, 2002.
Vanderstraeten, A., Mattielli, N., Laruelle, G. G., Gili, S., Bory, A., Gabrielli, P., Boxho, S., Tison, J.-L., and Bonneville, S.: Identifying the provenance and quantifying the contribution of dust sources in EPICA Dronning Maud Land ice core (Antarctica) over the last deglaciation (7–27 kyr BP): A high-resolution, quantitative record from a new Rare Earth Element mixing model, Sci. Total Environ., 881, 163450, https://doi.org/10.1016/j.scitotenv.2023.163450, 2023.
Veres, D., Bazin, L., Landais, A., Toyé Mahamadou Kele, H., Lemieux-Dudon, B., Parrenin, F., Martinerie, P., Blayo, E., Blunier, T., Capron, E., Chappellaz, J., Rasmussen, S. O., Severi, M., Svensson, A., Vinther, B., and Wolff, E. W.: The Antarctic ice core chronology (AICC2012): an optimized multi-parameter and multi-site dating approach for the last 120 thousand years, Clim. Past, 9, 1733–1748, https://doi.org/10.5194/cp-9-1733-2013, 2013.
Wagner, R., Schepanski, K., and Klose, M.: The Dust Emission Potential of Agricultural‐Like Fires-Theoretical Estimates From Two Conceptually Different Dust Emission Parameterizations, J. Geophys. Res.-Atmos., 126, e2020JD034355, https://doi.org/10.1029/2020JD034355, 2021.
Weber, M. E., Clark, P. U., Kuhn, G., Timmermann, A., Sprenk, D., Gladstone, R., Zhang, X., Lohmann, G., Menviel, L., Chikamoto, M. O., Friedrich, T., and Ohlwein, C.: Millennial-scale variability in Antarctic ice-sheet discharge during the last deglaciation, Nature, 510, 134–138, https://doi.org/10.1038/nature13397, 2014.
Weber, M. E., Bailey, I., Hemming, S. R., Martos, Y. M., Reilly, B. T., Ronge, T. A., Brachfeld, S., Williams, T., Raymo, M., Belt, S. T., Smik, L., Vogel, H., Peck, V. L., Armbrecht, L., Cage, A., Cardillo, F. G., Du, Z., Fauth, G., Fogwill, C. J., Garcia, M., Garnsworthy, M., Glüder, A., Guitard, M., Gutjahr, M., Hernández-Almeida, I., Hoem, F. S., Hwang, J.-H., Iizuka, M., Kato, Y., Kenlee, B., OConnell, S., Pérez, L. F., Seki, O., Stevens, L., Tauxe, L., Tripathi, S., Warnock, J., and Zheng, X.: Antiphased dust deposition and productivity in the Antarctic Zone over 1.5 million years, Nat. Commun., 13, 2044, https://doi.org/10.1038/s41467-022-29642-5, 2022.
Wegner, A., Gabrielli, P., Wilhelms-Dick, D., Ruth, U., Kriews, M., De Deckker, P., Barbante, C., Cozzi, G., Delmonte, B., and Fischer, H.: Change in dust variability in the Atlantic sector of Antarctica at the end of the last deglaciation, Clim. Past, 8, 135–147, https://doi.org/10.5194/cp-8-135-2012, 2012.
Wiggs, G. F. S., Baddock, M. C., Thomas, D. S. G., Washington, R., Nield, J. M., Engelstaedter, S., Bryant, R. G., Eckardt, F. D., Von Holdt, J. R. C., and Kötting, S.: Quantifying Mechanisms of Aeolian Dust Emission: Field Measurements at Etosha Pan, Namibia, J. Geophys. Res.-Earth, 127, e2022JF006675, https://doi.org/10.1029/2022JF006675, 2022.
Williams, P. W., McGlone, M., Neil, H., and Zhao, J.-X.: A review of New Zealand palaeoclimate from the Last Interglacial to the global Last Glacial Maximum, Quaternary Sci. Rev., 110, 92–106, https://doi.org/10.1016/j.quascirev.2014.12.017, 2015.
Woollings, T., Li, C., Drouard, M., Dunn-Sigouin, E., Elmestekawy, K. A., Hell, M., Hoskins, B., Mbengue, C., Patterson, M., and Spengler, T.: The role of Rossby waves in polar weather and climate, Weather Clim. Dynam., 4, 61–80, https://doi.org/10.5194/wcd-4-61-2023, 2023.
Yamamoto, A., Abe-Ouchi, A., Ohgaito, R., Ito, A., and Oka, A.: Glacial CO2 decrease and deep-water deoxygenation by iron fertilization from glaciogenic dust, Clim. Past, 15, 981–996, https://doi.org/10.5194/cp-15-981-2019, 2019.
Yang, Y., Carey-Smith, T., and Turner, R.: The merged and superposed sub-tropical jet and polar-front jet in the southwest Pacific: A case study, Atmos. Sci. Lett., 25, e1203, https://doi.org/10.1002/asl.1203, 2024.