the Creative Commons Attribution 4.0 License.
the Creative Commons Attribution 4.0 License.
 | 05 Jun 2026
Non-linear climatic response to the weakening of the Atlantic Meridional Overturning Circulation during glacial times
Yanxuan Du
Josephine R. Brown
Laurie Menviel
Himadri Saini
Russell N. Drysdale
David K. Hutchinson
Calla N. Gould-Whaley
The climatic response to the weakening of the Atlantic Meridional Overturning Circulation (AMOC) is investigated under glacial conditions representative of Heinrich Stadial 5 using a fully coupled Earth System Model (ACCESS-ESM1.5). We find that the climatic response to an AMOC slowdown or shutdown, respectively representing Dansgaard–Oeschger (D–O) and Heinrich stadials, is non-linear. Global mean temperature and precipitation anomalies increase linearly with an AMOC slowdown; however, crossing the threshold of AMOC shutdown results in non-linear and more complex atmospheric circulation and climate responses. The atmosphere partially compensates for the significantly reduced oceanic energy transport due to AMOC shutdown through alterations in the cross-equatorial Hadley Cell (HC), with pronounced changes in boreal winter season. The northern winter HC is enhanced and expanded, while the southern winter HC is weakened but increased in width due to a northward shift of the ascending branch resulting from the AMOC shutdown. This drives seasonal climate variability in the tropical and subtropical regions via changes in the subtropical high pressure systems, subtropical jet, Southern Hemisphere mid-latitude westerly winds and other climate features such as the monsoon systems, with significant impacts on Australasian hydroclimate. The study demonstrates the potential location of a threshold in the climate system between linear slowdown and nonlinear shutdown of the AMOC, with differing climate impacts being broadly consistent with available proxy records for Heinrich and D–O stadials. This further highlights the importance of not crossing the threshold of AMOC shutdown in the future.
- Article
(16447 KB) - Full-text XML
-
Supplement
(4675 KB) - BibTeX
- EndNote


The Last Glacial Period (LGP, ∼ 115 000 to 11 700 years ago) was characterised by repeated millennial-scale climate oscillations, which are commonly referred to as Dansgaard-Oeschger (D–O) events (Dansgaard et al., 1993). During each D–O event, Greenland temperature experienced an abrupt transition to a relatively warm Interstadial period, after which the temperature gradually decreased within a few centuries before an abrupt cooling to near-full glacial conditions (Stadial period), with the latter accompanied by a weakening of the Atlantic Meridional Overturning Circulation (AMOC) (Barker et al., 2009; Corrick et al., 2020; Menviel et al., 2014b). During stadials, reduced northward oceanic heat transport induced by a weaker AMOC resulted in heat accumulation in the South Atlantic, thus leading to Antarctic warming with a lag of ∼ 200 years (Barker et al., 2009; EPICA Community Members, 2006; Stocker and Johnsen, 2003; WAIS Divide Project Members, 2015). During some of the coldest D–O stadials, massive iceberg discharges into the North Atlantic Ocean led to a substantial weakening or shutdown of the AMOC (Barker et al., 2015; Broecker et al., 1992; Broecker, 1994; Henry et al., 2016; Zhou and McManus, 2024). These episodes are known as Heinrich events (HEs; Bond et al., 1992; Heinrich, 1988), and the cold time periods that contain such events are named Heinrich stadials (HS) (Heinrich, 1988). Despite some debates about the usage of different Heinrich terminologies (e.g. Andrews and Voelker, 2018; Hodell et al., 2017), throughout this paper we follow the consistent usage of the term “Heinrich stadial” as in previous studies (Barker et al., 2015; Sanchez Goñi and Harrison, 2010), as described above.
During D–O stadials, paleoclimate proxy records suggest cooler and drier conditions in the North Atlantic and in many regions over Eurasia and North America (Izumi et al., 2023; Martrat et al., 2007). Temperature changes in Greenland ice core records show relatively similar amplitudes between D–O and HS (Kindler et al., 2014; Svensson et al., 2008). However, sea surface temperature (SST) estimates from marine sediment records from the Iberian Margin display a temperature decrease up to twice as large in HS compared to D–O stadials (Martrat et al., 2007). The climatic response during HS is similar in direction but greater in magnitude than D–O stadials due to the large magnitude of changes in AMOC strength, and thus heat redistribution, via changes in oceanic and atmospheric circulation (Izumi et al., 2023; Menviel et al., 2020; Pedro et al., 2018; Stocker and Johnsen, 2003). Whilst a seasonal southward migration of the Intertropical Convergence Zone (ITCZ) has been inferred during mild stadials, year-round displacement of the ITCZ position is suggested during HS (Deplazes et al., 2013). Nevertheless, it remains unclear whether the climate response to Heinrich and D–O stadials is linearly related to AMOC weakening.
Many D–O and HS occurred during Marine Isotope Stage 3 (MIS3, ∼ 59.4–27.8 ka; Sanchez Goñi and Harrison, 2010); however, most simulations of D–O events are performed under Last Glacial Maximum (LGM, 21 ka) boundary conditions. Few studies have performed simulations under MIS3-like conditions (e.g. Armstrong et al., 2023; Guo et al., 2019; Niu et al., 2025; Saini et al., 2024, 2025b; Zhang et al., 2021; Zhang and Prange, 2020), with only three PMIP4/CMIP6 models utilised (Guo et al., 2019; Niu et al., 2025; Saini et al., 2025b), including ACCESS-ESM1.5 (Saini et al., 2025b). Heinrich stadial 5 (HS5; ∼ 48.8–47.6 ka; Menviel et al., 2014b; Sanchez Goñi and Harrison, 2010) occurred during MIS3, when both hemispheres were receiving higher summer insolation relative to pre-industrial (PI) levels due to greater obliquity (Berger, 1978). The atmospheric CO2 concentration was lower than PI (Köhler et al., 2017). Global sea level was ∼ 60–65 m lower than PI (Shakun et al., 2015), with extensive Laurentide and Scandinavian ice sheets (Gowan et al., 2021). Model simulations under 49 ka boundary conditions (orbital, ice sheet, albedo, etc.) representing a satisfactory quasi-equilibrium “interstadial” climate – indicate drying across the Maritime continent and enhanced precipitation across Northern Australia during austral summer (Saini et al., 2025b). In this study, we further perform freshwater forcing experiments at 49 ka to explore and provide an analysis of the dynamics of climate changes in D–O and HS simulations, with implications on Australasian climates. While there are limited proxy reconstructions of HS5 climate over Australasia, the results of this study will provide a suite of outputs that can be used in future paleo model-data comparisons.
Many modelling studies have investigated the climatic response to AMOC variability in the past (Cheng et al., 2007; Chiang et al., 2014; Chiang and Friedman, 2012; Du et al., 2025; Kageyama et al., 2013; Lee et al., 2011; Menviel et al., 2014b; Saini et al., 2025a), including during the pre-industrial period (Ben-Yami et al., 2024; Jackson et al., 2015; Orihuela-Pinto et al., 2022; Saini et al., 2025a). A weakened AMOC leads to cooling in the North Atlantic with slow warming over the Southern Ocean and Antarctica due to reduced northward oceanic heat transport (Stocker and Johnsen, 2003). The ITCZ shifts southwards towards the warmer hemisphere due to changes in the interhemispheric temperature gradient, leading to an increase in Southern Hemisphere (SH) monsoon precipitation and reduced precipitation in Northern Hemisphere (NH) monsoons (Cheng et al., 2012; Zhang et al., 2023). This is consistent with paleoclimate records, which suggest weakening of the Indian (Deplazes et al., 2014) and East Asian (Wang et al., 2008; Xue et al., 2025), monsoons and strengthening of the South American (Campos et al., 2019; Wang et al., 2007) and Indo-Australian monsoons (Ayliffe et al., 2013; Scroxton et al., 2022) during D–O and HS. Nevertheless, few studies have investigated the large-scale processes through which the impacts of AMOC variations on tropical atmospheric circulation are transmitted to the SH mid-latitudes and Australasian regions.
AMOC variability is linked to large-scale reorganisation of atmospheric and ocean circulation heat transport. Reduced northward oceanic heat transport as a result of AMOC weakening is partially compensated by an increase in the cross-equatorial atmospheric heat transport, via changes in the ITCZ and Hadley Cell (HC) (Bischoff and Schneider, 2014; Frierson et al., 2013; Kang et al., 2008; Lee et al., 2011; Pedro et al., 2018). The ITCZ is the region where low-level trade winds converge and form ascending branches of the Hadley Cell (HC) (Lionello et al., 2024). A southward shift in the ITCZ also moves the rising branch of the HC southwards, leading to changes in the strength of the northern and southern HCs (Chiang et al., 2014; Chiang and Friedman, 2012; Lee et al., 2011; Saini et al., 2025a; Zhang and Delworth, 2005; Zhang et al., 2023). Changes in the HC greatly influence large-scale climate features such as the subtropical high pressure systems (subtropical ridge; STR), located at the surface descending branch of the HC (Nguyen et al., 2013), and atmospheric circulation including the mid-latitude westerly winds, affecting global hydroclimate accordingly (Chiang et al., 2014; Chiang and Friedman, 2012; Lionello et al., 2024; McGee et al., 2014; Orihuela-Pinto et al., 2022; Zhang and Delworth, 2005). A limited number of proxy and modelling studies suggest a southward shift and intensification of the SH westerlies during austral winter (June–July–August; JJA) during North Atlantic cold events (Anderson et al., 2009; Lee et al., 2011; Timmermann et al., 2007; Whittaker et al., 2011). The consistency of this response to an AMOC slowdown, however, remains an open question in current modelling studies (e.g. Lee et al., 2011).
In this study, we investigate the climatic changes associated with D–O and HS at 49 ka – coinciding with HS5 – using the Earth System Model ACCESS-ESM1.5. This model has demonstrated high skill in simulating the SH and Australian climates (Grose et al., 2020; Ziehn et al., 2020). We compare the linearity in the climatic responses to changes in AMOC transport, taking an AMOC shutdown as an analogue of HS conditions and an AMOC weakening as an analogue of a D–O stadial. The results expand on previous studies by focusing on the SH climate response beyond the Atlantic Ocean, including exploring the mechanisms leading to large-scale climate change in Australasia. The results aim to provide a detailed description of SH climate response associated with AMOC variability under glacial climates from a modelling perspective and are briefly compared with proxy records to assess model-data agreement.
2.1 Model description
In this study, we use the Australian Community Climate and Earth System Simulator (ACCESS) Earth System Model (ESM) version 1.5, which participated in the Coupled Model Intercomparison Project Phase 6 (CMIP6) and includes an interactive carbon cycle (Ziehn et al., 2020). The resolution of the atmospheric model component (UK Met Office Unified Model, UM) is 1.875° longitude × 1.25° latitude × 38 levels (Martin et al., 2010; The HadGEM2 Development Team, 2011). It is coupled to the land surface model, which is the Community Atmosphere Biosphere Land Exchange (CABLE) model (Kowalczyk et al., 2013). The ocean component uses the Geophysical Fluid Dynamics Laboratory Modular Ocean Model 5.1 (MOM5.1; Griffies, 2012) and sea ice component uses the Los Alamos Community Ice Code model CICE4.1 (Hunke and Lipscomb, 2010). The ocean and sea-ice components use a common horizontal grid of 360 × 300 cells at a nominal 1° resolution, with meridional refinement of grid spacing down to 0.33° at the equator and down to ∼ 0.4° in the Southern Ocean and a tripolar grid with land-based poles at 65° N over Eurasia and North America (Ziehn et al, 2020). More details of the model description and performance are provided in Ziehn et al. (2020). Previous studies have performed freshwater hosing experiments to alter the AMOC strength in pre-industrial, interglacial boundary conditions, historical and future simulations using this model (Du et al., 2025; Pontes and Menviel, 2024; Saini et al., 2025a), with acceptable AMOC sensitivity to freshwater perturbations within the range of CMIP6 models (Weijer et al., 2020).
2.2 Heinrich 5 climate simulation at 49 ka
The model was first integrated under 49 ka boundary conditions starting from the PI simulation (Table 1; Saini et al., 2025b). The model is forced by 49 ka orbital parameters (Berger, 1978), greenhouse gas concentrations (Köhler et al., 2017); and ice-sheet extent and topography corresponding to 52.5 ka (Gowan et al., 2021), with closest match to ∼ 48–52 ka sea level estimates (Shakun et al., 2015). Vegetation was modified to reflect the presence of continental ice sheets, including the conversion of forest to bare soil between the Cordilleran and Laurentide ice sheets. Additionally, C3 (photosynthetic growth form) crops in the PI simulation were replaced by surrounding vegetation types. The land-sea mask and river runoff are also adjusted to reflect the modified topography (see details in Saini et al., 2025b).
Table 1Full boundary conditions for the 49 ka simulation relative to PI (reproduced from Saini et al., 2025b).
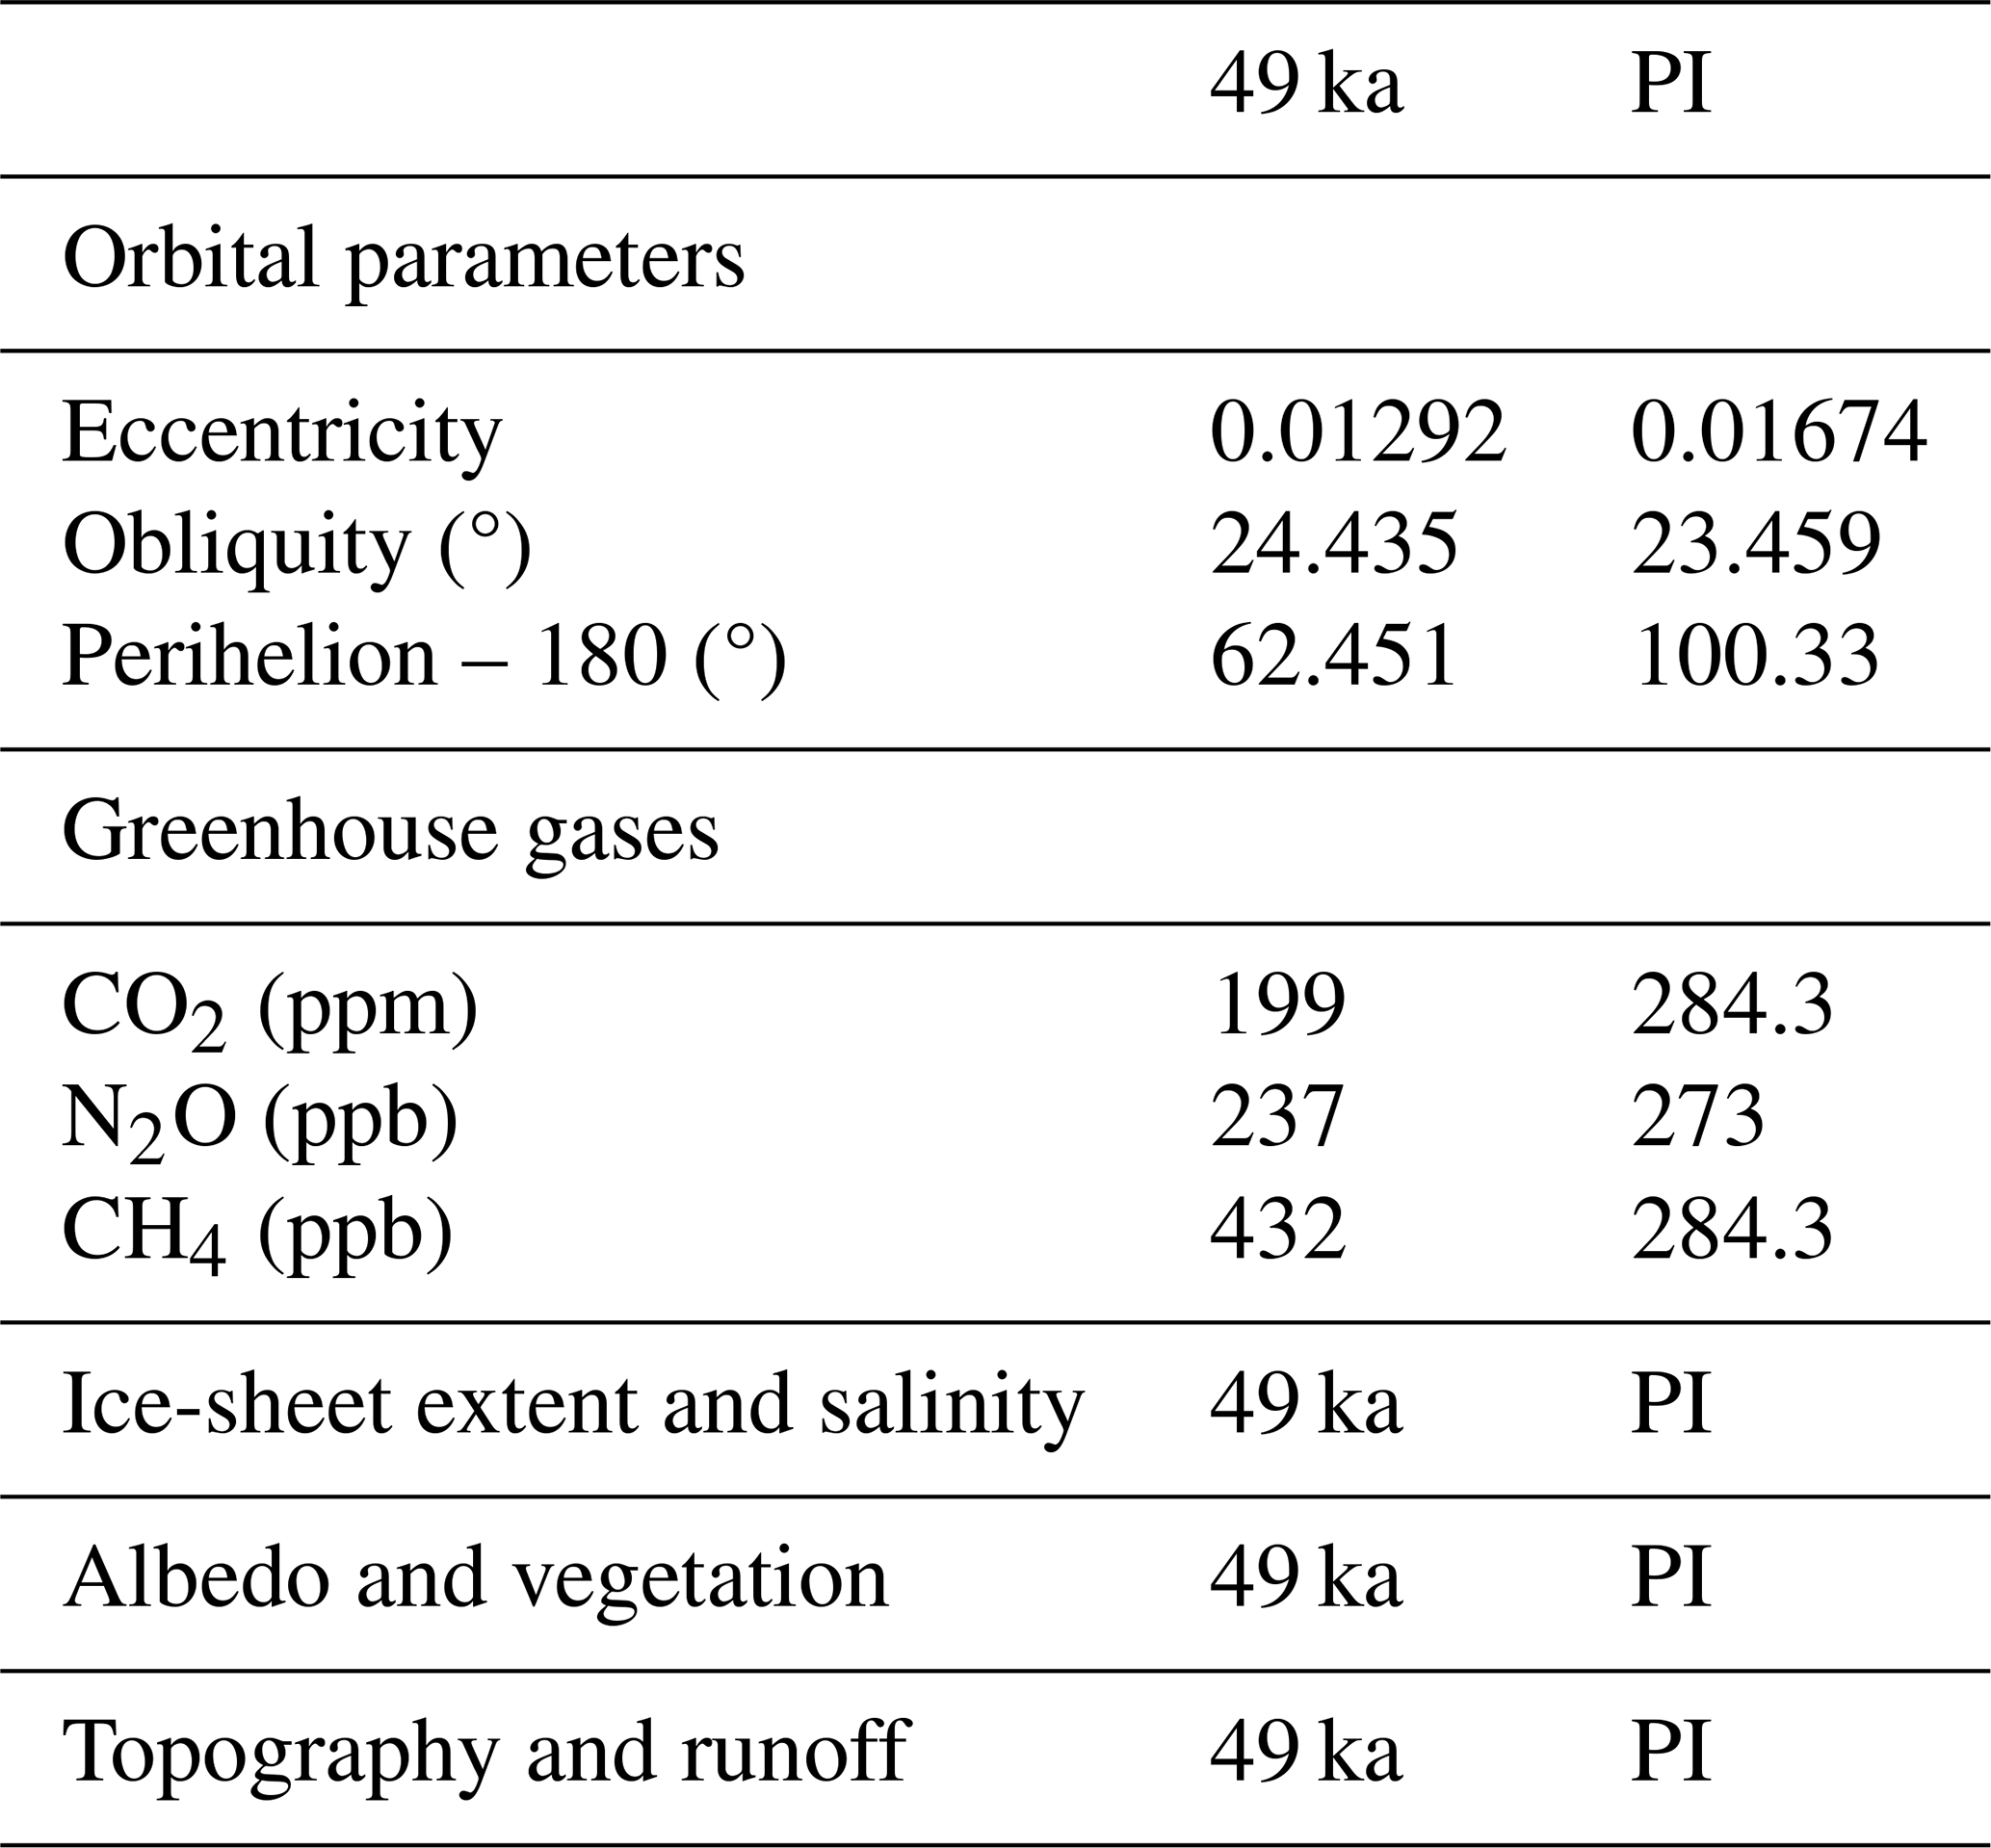
The 49 ka simulation was run with step-wise changes in boundary conditions for a total of 1555 model years, with the last 760 years implemented with full boundary conditions (49ka-full in Saini et al., 2025b). The last 100 years in 49ka-full show relatively stable surface air temperature and sea-surface temperatures (Saini et al., 2025b, Fig. A1). We therefore consider this as a quasi-equilibrium state for the 49 ka climate, and define this period as the 49ka_control experiment in this study. This 49ka_control displays a stronger AMOC strength than PI (31 Sv compared to 21 Sv for PI), which is considered to represent interstadial conditions at 49 ka. The stronger AMOC at 49 ka is due to changes in the topography and expansion of the ice sheets in the model, which enhances the North Atlantic gyres and cyclonic circulation in the Labrador Sea (Saini et al., 2025b). Simulated globally averaged surface air temperatures are 2.7 °C lower than PI, and global mean SST is 1.2 °C lower. Drier conditions are simulated over the NH high latitudes and most land areas of the SH relative to PI (Saini et al., 2025b, Fig. 2c).
2.3 Experimental design for D–O and HS at 49 ka
For this study, North Atlantic meltwater hosing experiments (Table 2) are performed from the quasi-equilibrium state conditions (49ka_control). Freshwater fluxes are added into the North Atlantic (50–70° N, 70–0° W) to alter the AMOC strength in the model, similar to previous studies (Du et al., 2025; Pontes and Menviel, 2024; Saini et al., 2025a).
Table 2North Atlantic freshwater hosing experiments performed at 49 ka. The forcing strength (Sv), release duration (yr), analysis period, and the AMOC mean strength (Sv) at analysis period (change relative to 49ka_control) are listed for each experiment.
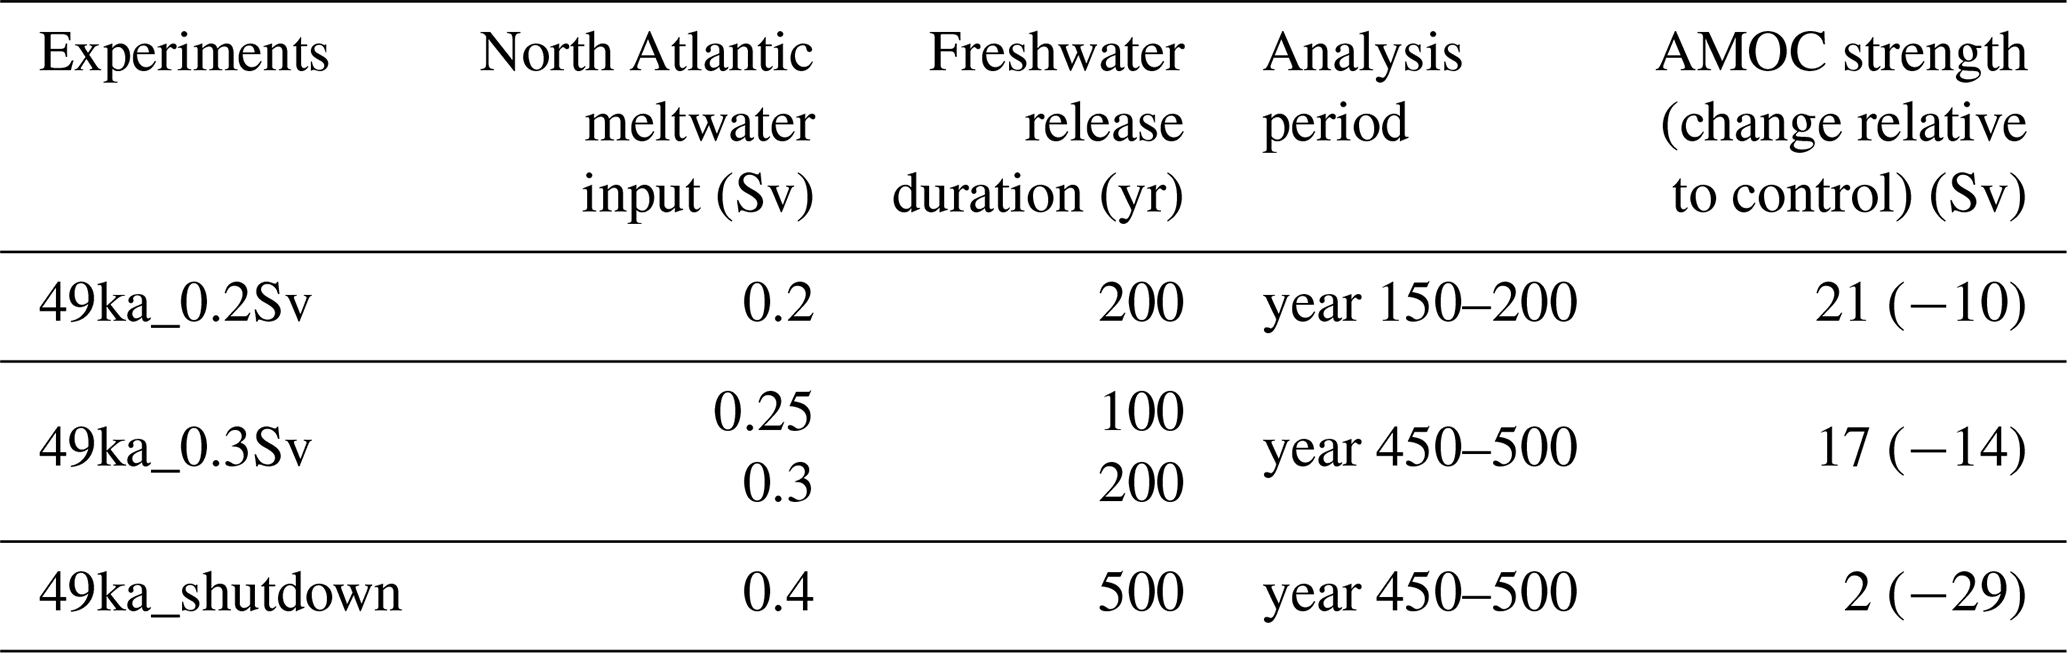
Previous modelling studies suggest that D–O stadials are associated with a ∼ 50 % AMOC slowdown, while HS are more likely to be close to a complete shutdown of the AMOC (e.g. Malmierca-Vallet et al., 2023; Menviel et al., 2020), even though the exact changes in the AMOC transport during D–O and HS are still poorly constrained from proxy records (Henry et al., 2016; Lynch-Stieglitz, 2017).
To simulate D–O stadials, we add 0.2 and 0.3 Sv of freshwater in the northern North Atlantic under constant 49ka boundary conditions (49ka_0.2Sv and 49ka_0.3Sv experiments). This leads to ∼ 32 % and ∼ 50 % AMOC reductions relative to the 49ka_control, respectively (see detailed changes in Table 2). We also perform an AMOC shutdown experiment with a constant 0.4 Sv freshwater forcing to simulate HS (49ka_shutdown; Table 2). See Fig. S1 in the Supplement for changes in the mixed layer depth in each simulation.
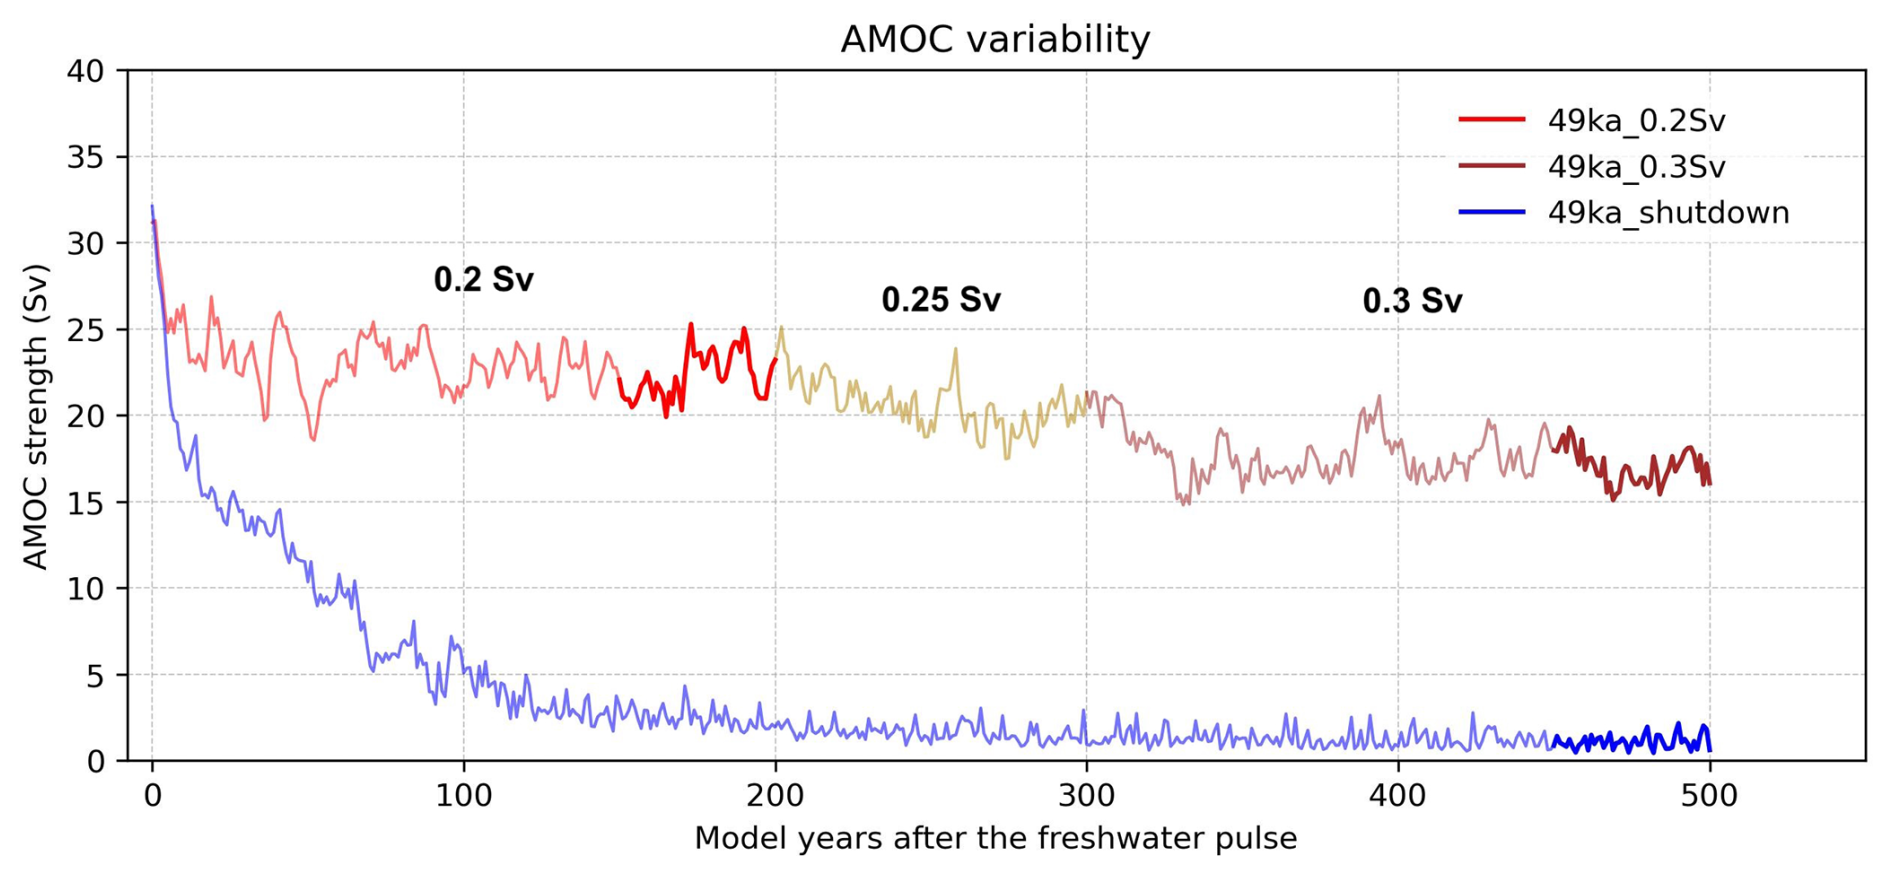
Figure 1Time series of AMOC strength (Sv) after the freshwater pulse at year 0 for the D–O stadial (red-yellow-brown) and HS (blue) experiments. Darker colours indicate 50-year analysis period shown in Table 2. AMOC strength is calculated as the maximum value of the overturning streamfunction between 30 and 50° N and below 500 m depth, in the Atlantic basin.
The AMOC evolution for each simulation is shown in Fig. 1. In 49ka_shutdown, the AMOC takes ∼ 100 model years to shut down (below 5 Sv is considered shutdown; Saini et al., 2025a). The simulation is then continued for another 400 model years for the model to fully respond to the shutdown, especially at southern high latitudes. The last 50 years of the simulation is used for analysis (dark blue in Fig. 1).
To explore pseudo D–O stadial conditions, we consider both the 49ka_0.2Sv, and 49ka_0.3Sv experiments. For 49ka_0.2Sv, we analyse years 150–200 (dark red in Fig. 1). To further weaken the AMOC, 49ka_0.2Sv is continued first forced with 0.25 Sv meltwater input, then with 0.3 Sv (see Fig. 1). The analysis period for 49ka_0.3Sv is the 50-year interval from year 450 to 500 (dark brown in Fig. 1), which corresponds to the same integration time as the 49ka_shutdown experiment to allow for better comparisons. The 49ka_0.2Sv and 49ka_0.3Sv experiments are hereafter referred to as D–O stadial or slowdown experiment, and the 49ka_shutdown experiments are also referred to as HS or shutdown experiment. AMOC weakening refers to all three experiments.
2.4 Calculation metrics
The NH and SH HC strength is calculated as the maximum and minimum value of the atmospheric mass streamfunction at 500 hPa in DJF and JJA, respectively. The width of the HC is calculated from the latitudes of zero mass streamfunction at mid-tropospheric level (500 hPa) as edges of the ascending and descending branches (Frierson et al., 2007; Seo et al., 2014). The mass streamfunction is interpolated to 0.5° latitude resolution for the calculations.
The ITCZ position in this study is defined as the latitude of zero zonal-mean meridional mass streamfunction at 850 hPa, corresponding to the cross-equatorial ascending branch of the northern (DJF)/southern (JJA) Hadley Cells. This definition provides a more direct dynamical linkage to HC variability than the conventional precipitation-based metrics (e.g. Braconnot et al., 2007), while yielding consistent ITCZ positions across both approaches (Bian and Räisänen, 2024; Bischoff and Schneider, 2014).
SH westerlies strength is calculated as the 850 hPa zonal mean maximum wind speed between 40 to 60° S, whilst the position of the SH westerly winds refers to the latitude of the maximum wind speed interpolated to 0.5° latitude resolution, consistent with previous studies (e.g. Du et al., 2024; Saini et al., 2025b). Changes in the SH westerlies are calculated across different ocean basins, the longitude range for the Atlantic Ocean covers between 70 and 0° W, the Pacific Ocean 130° E–70° W, and the Indian Ocean from 0 to 130° E.
The STR position and intensity over Australia is calculated as the maximum mean sea level pressure (MSLP) value zonally averaged over 140–150° E between 10 and 45° S. The zonal mean MSLP values are then interpolated to 0.5° latitude resolution, followed by a fitted cubic spline to detect the latitude of maximum pressure. The latitude is the STR location, and the pressure value is the STR intensity (Grose et al., 2015).
Finally, monsoon domains are defined as regions in which the wet monsoon season precipitation rate exceeds the dry season rate by at least 2.5 mm d−1, and is responsible for at least 55 % of the annual precipitation (Wang et al., 2011; Yeung et al., 2021).
3.1 Overview of the climate response during pseudo D–O and HS
First, we provide an overview of annual temperature and precipitation changes in our D–O and HS simulations relative to the 49ka_control climate and compare the linearity between the climatic responses to each hosing experiment by normalising the temperature and precipitation response to a “per Sv” AMOC decrease. Then, we evaluate the changes in seasonal large-scale atmospheric circulations by investigating the changes in Hadley Cell, MSLP, and SH westerly winds to AMOC weakening. Finally, we investigate the influence of changes in these climate features on Australasian climates.
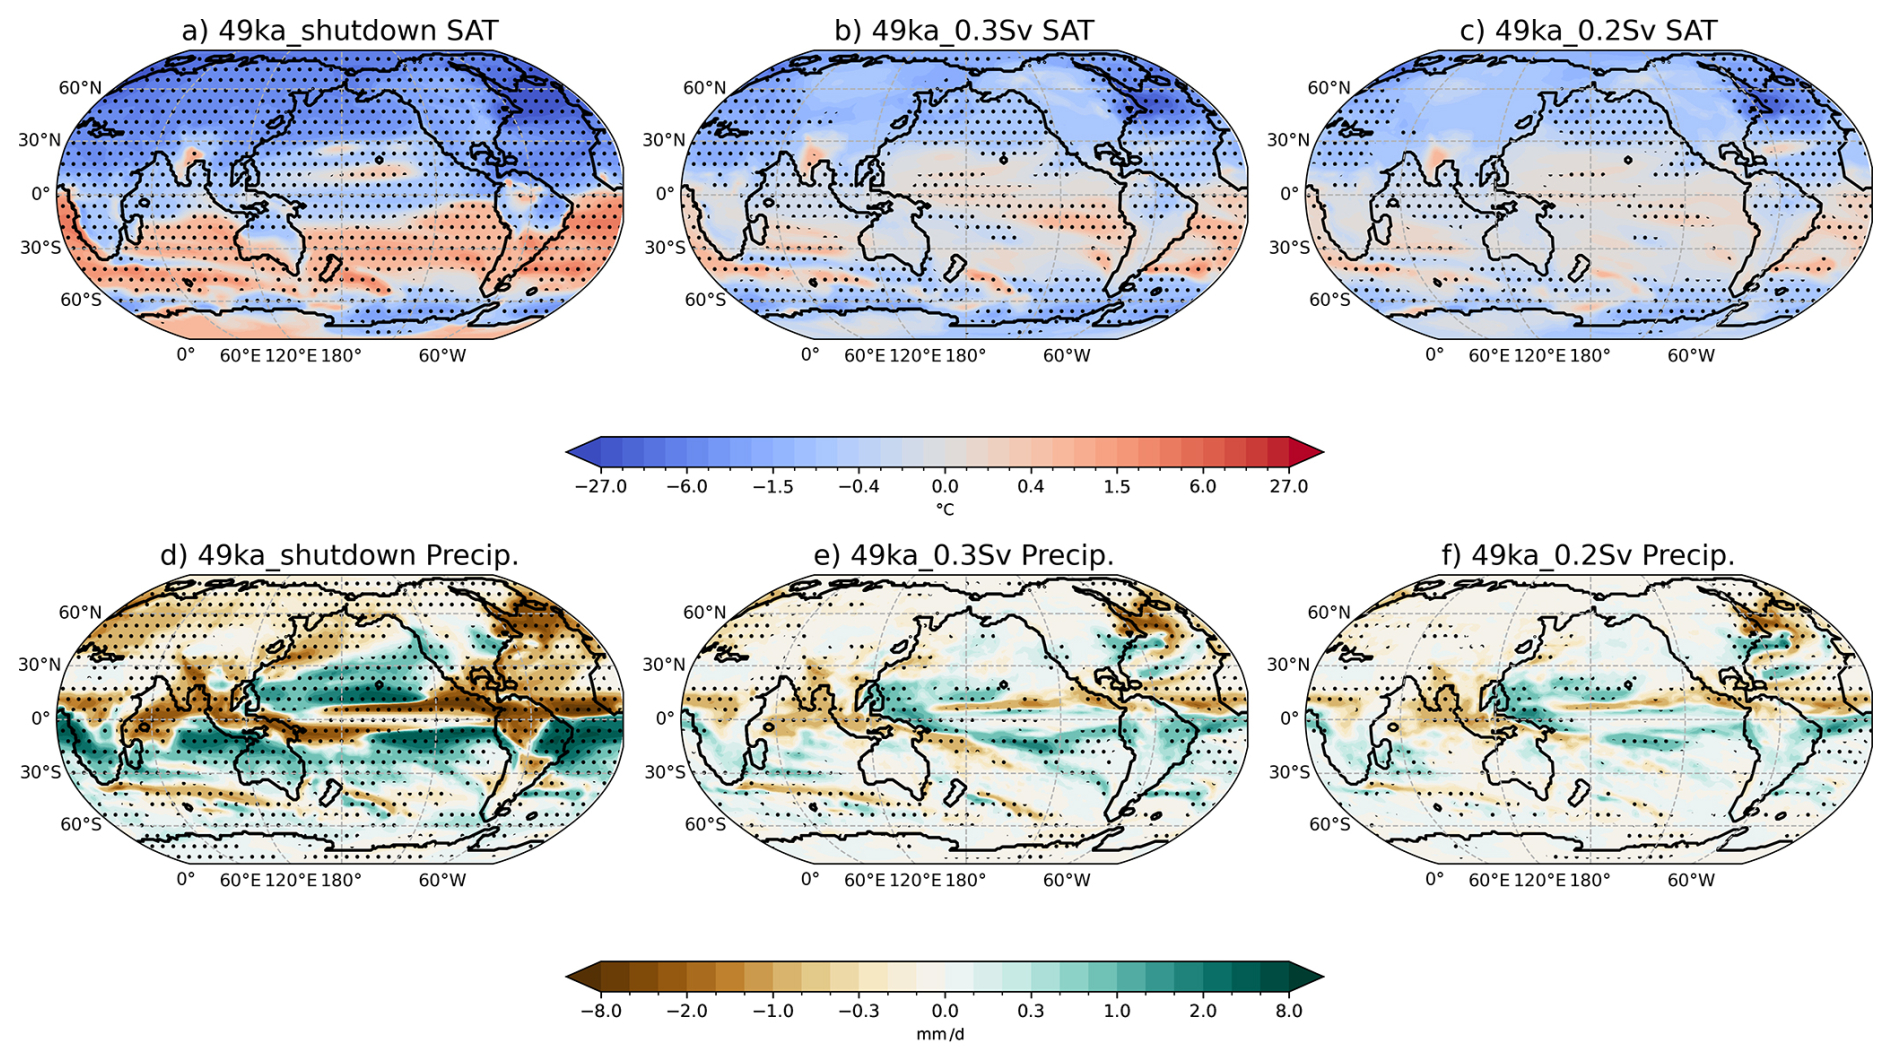
Figure 2Annual (a–c) Surface Air Temperature (SAT; in °C) and (d–f) precipitation (in mm d−1) anomalies relative to 49ka_control in each simulation. Stippling indicates statically significant differences from the control at the 95 % confidence level according to the Student's t-test.
The meridional oceanic heat transport to the North Atlantic is reduced by ∼ 77 % (∼ 1 PW at 30° N) in the HS experiment (see Fig. S2). This change is larger than previous model simulations of AMOC shutdowns under LGM conditions that found an average ∼ 40 % reduction in Atlantic meridional heat transport (∼ 0.8 PW at 30° N) (Menviel et al., 2008, 2020; Stouffer et al., 2006). The larger reduction in meridional oceanic heat transport can be explained by the large AMOC reduction simulated here (29 Sv reduction compared to an averaged of 15 Sv in previous LGM experiments; Kageyama et al., 2013). In the D–O stadial simulations with ∼ 50 % and 32 % AMOC reductions (Fig. 2e, f), the simulated reductions in ocean heat transport at 30° N are limited to 25 % and 16 %, respectively (Fig. S2), which exert weak constraints on the atmospheric response.
In the HS simulation, significantly reduced heat transport leads to a widespread significant NH mean cooling of 3.8 °C, with maximum annual mean surface air temperature (SAT) decrease of up to 26.3 °C in the Labrador Sea (Fig. 2a) due to the large decrease in the AMOC strength, while the SH displays a significant warming (mean 0.43 °C) from 0 to 55° S. Simulated SSTs show up to 15.4 °C cooling in the North Atlantic, and up to 6.5 °C warming in the South Atlantic (Fig. S3a). Over Antarctica, significantly colder conditions are simulated in the Ross and Weddell Seas (Fig. 2a), which could be related to changes in sea ice extent or negative low pressure anomalies over the region (Fig. 6b). The SAT patterns in the D–O stadial simulations show generally similar responses to the interhemispheric response in HS, with NH cooling and some SH warming anomalies relative to 49ka_control (Fig. 2b, c). The small reductions in the northward oceanic heat transport in D–O stadial simulations are only sufficient to induce some significant warming beyond the Atlantic Ocean, reaching into the Indian and eastern Pacific Oceans (Fig. 2b, c).
To compensate the significantly reduced ocean heat transport in the HS experiment, the ITCZ is pushed southwards towards the warmer hemisphere. The precipitation is significantly reduced by a mean of 2.3 mm d−1 to the north of the equator in the Atlantic Ocean and greatly enhanced to the south in the HS experiment (Fig. 2d). The pattern extends to every ocean basin, indicating a global-wise southward shift of the annual mean ITCZ position in HS. This further leads to enhanced precipitation intensity in the South Pacific Convergence Zone (SPCZ) region (10–30° S, 155° E–140° W) (Fig. 2d). In the D–O stadial simulations, the southward displacement pattern of the ITCZ is mostly evident over the Atlantic Ocean, extending into the eastern equatorial Pacific. The global precipitation patterns show similar responses between the slowdown simulations (Fig. 2e, f); however, greatly different from the HS simulation, particularly in the tropical and subtropical regions. The SPCZ precipitation is slightly reduced in the D–O stadial experiments (Fig. 2e, f), which is the opposite of the shutdown experiment. Widespread drying is simulated over much of the NH associated with the cooling in all experiments, which is consistent with previous modelling results with a weaker AMOC (e.g. Jackson et al., 2015).
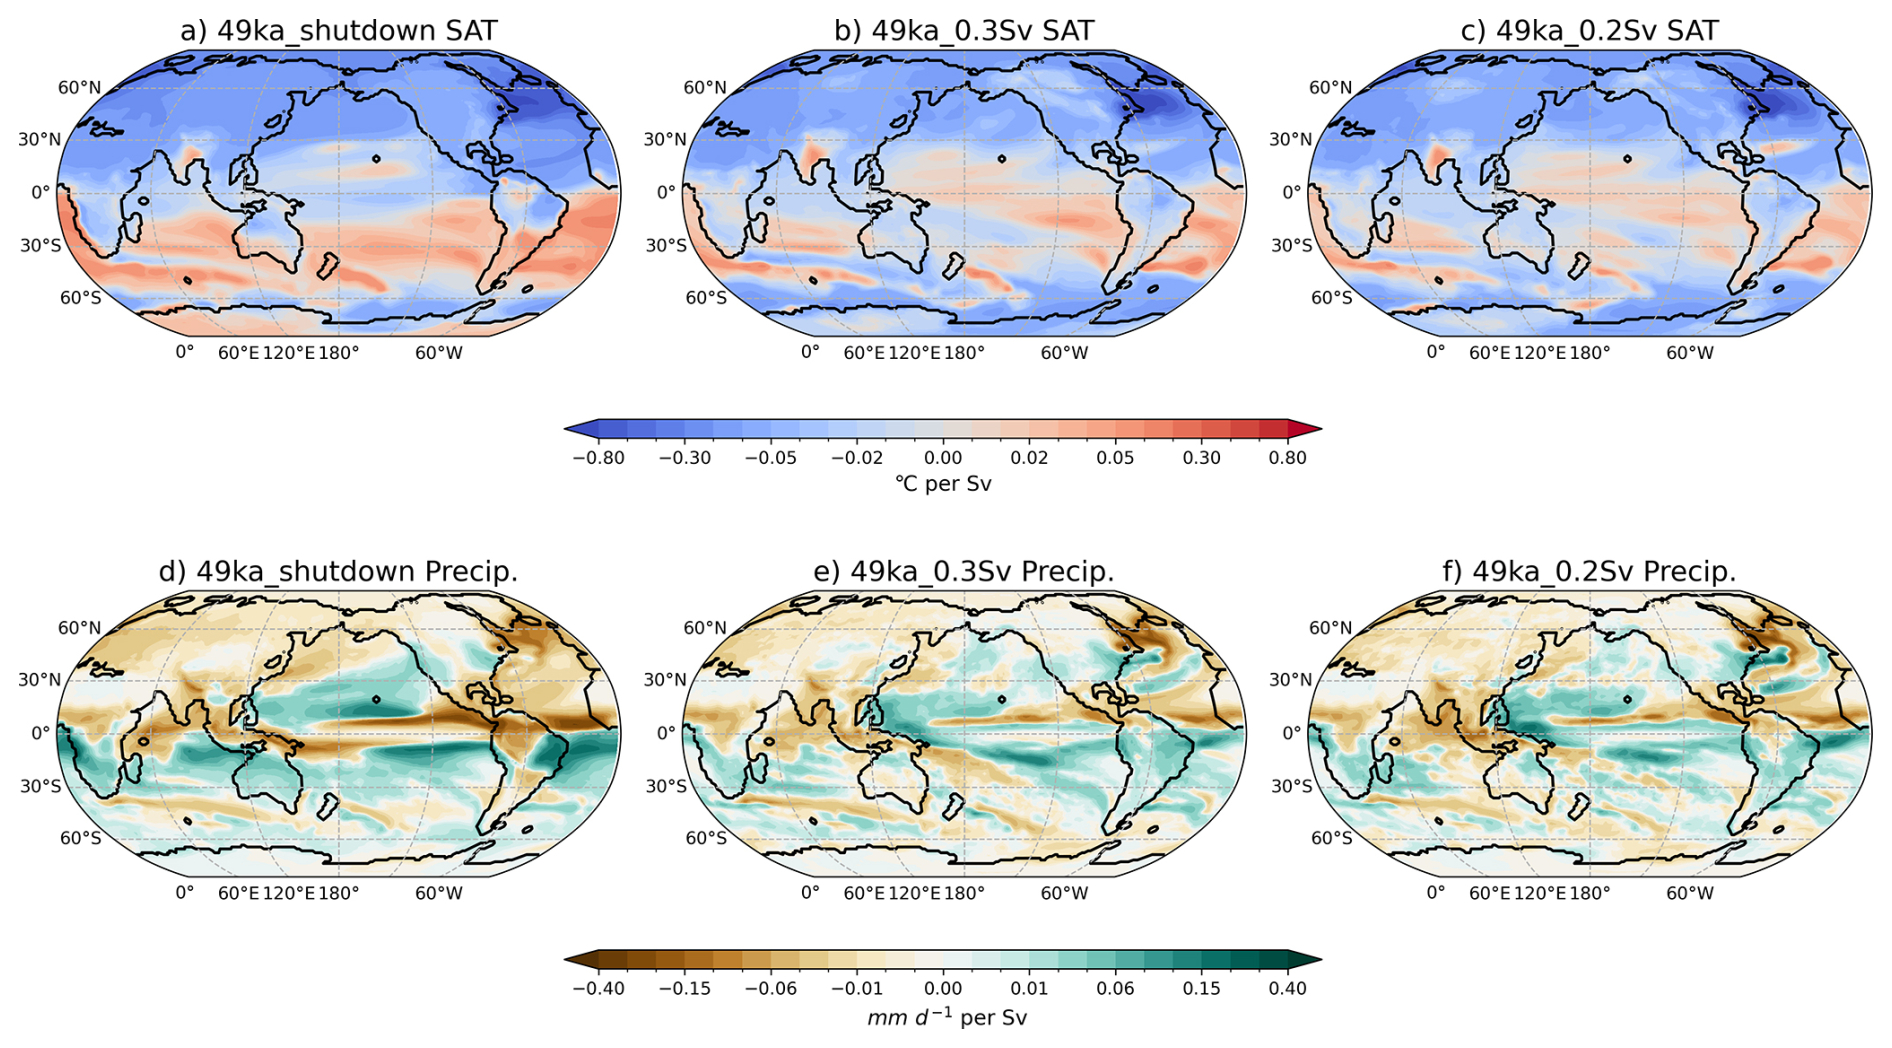
Figure 3Normalised annual surface air temperature anomalies (SAT; °C per Sv), and precipitation anomalies per Sv AMOC decrease (mm d−1 per Sv) relative to 49ka_control in each simulation.
To further quantify the linearity of changes, we normalise the temperature and precipitation response to a “per Sv” AMOC decrease relative to 49ka_control (Fig. 3). The D–O stadial simulations with 10 and 14 Sv decrease in AMOC strength show the same degree of annual mean temperature and precipitation changes per Sv change (details in Table S1), which indicate linear relationships. This can be seen from the regions of significant changes in the 49ka_0.2Sv experiment (Fig. 2c, f) being enhanced in magnitude and expanded in areal extent in the 49ka_0.3Sv simulation (Fig. 2b, e), and similar normalised spatial patterns between the two experiments (Fig. 3b, c, e, f). Nevertheless, crossing the tipping point of a full shutdown of the AMOC under glacial conditions leads to around 1.3 times the global annual average temperature cooling per Sv AMOC decrease compared to D–O stadial experiments (see Table S1). More specifically, NH temperature displays up to 1.6 times more cooling in 49ka_shutdown, while the SH (from 0 to 55° S) experiences up to 6.8 times warmer temperatures per Sv than in the slowdown experiments (see Fig. 3a–c for normalised spatial patterns). This large difference in SH temperature changes between the D–O and HS simulations are attributed to a simulated SH mean cooling in D–O stadial experiments while a SH warming is simulated in the HS (Table S1; Fig. 3a–c). Globally averaged precipitation changes under AMOC shutdown are also ∼ 1.3 times larger per Sv of AMOC reduction than in the AMOC slowdown simulations, with the NH becoming ∼ 2 times drier and the SH ∼ 3 times wetter per Sv compared to the D–O slowdown simulations (Table S1; Fig. 3d–f).
3.2 Non-linear response in large-scale seasonal atmospheric circulations and mechanisms
In this section, we investigate the drivers of the diverse hydroclimate response in the simulations by examining the changes in the HC, and the associated changes in the MSLP, 850 hPa wind circulations, including the SH mid-latitude westerly winds, and the STR using the metrics described in Sect. 2.3.
3.2.1 Alterations in the Hadley Cell
In response to the AMOC weakening, the annual mean ITCZ position shifts southwards in all simulations (Fig. 2d–f) to generate the cross-equatorial atmospheric energy transport to partially compensate for the reduced northward oceanic heat transport. This drives alterations in the strength and width of the HC. Notably, the atmospheric compensation is highly seasonal. In the HS simulation, the TOA energy transport anomaly at 30° N reaches ∼ 1.05 PW in DJF but only ∼ 0.19 PW in JJA (Fig. S4) to compensate for the ∼ 1 PW annual reduction in the North Atlantic ocean heat transport (seasonal variation is minimal). This leads to more pronounced changes in the HC and ITCZ responses during DJF. As a result, the NH HC strengthens in DJF while the SH HC weakens in JJA in all simulations (Figs. 4 & 5).
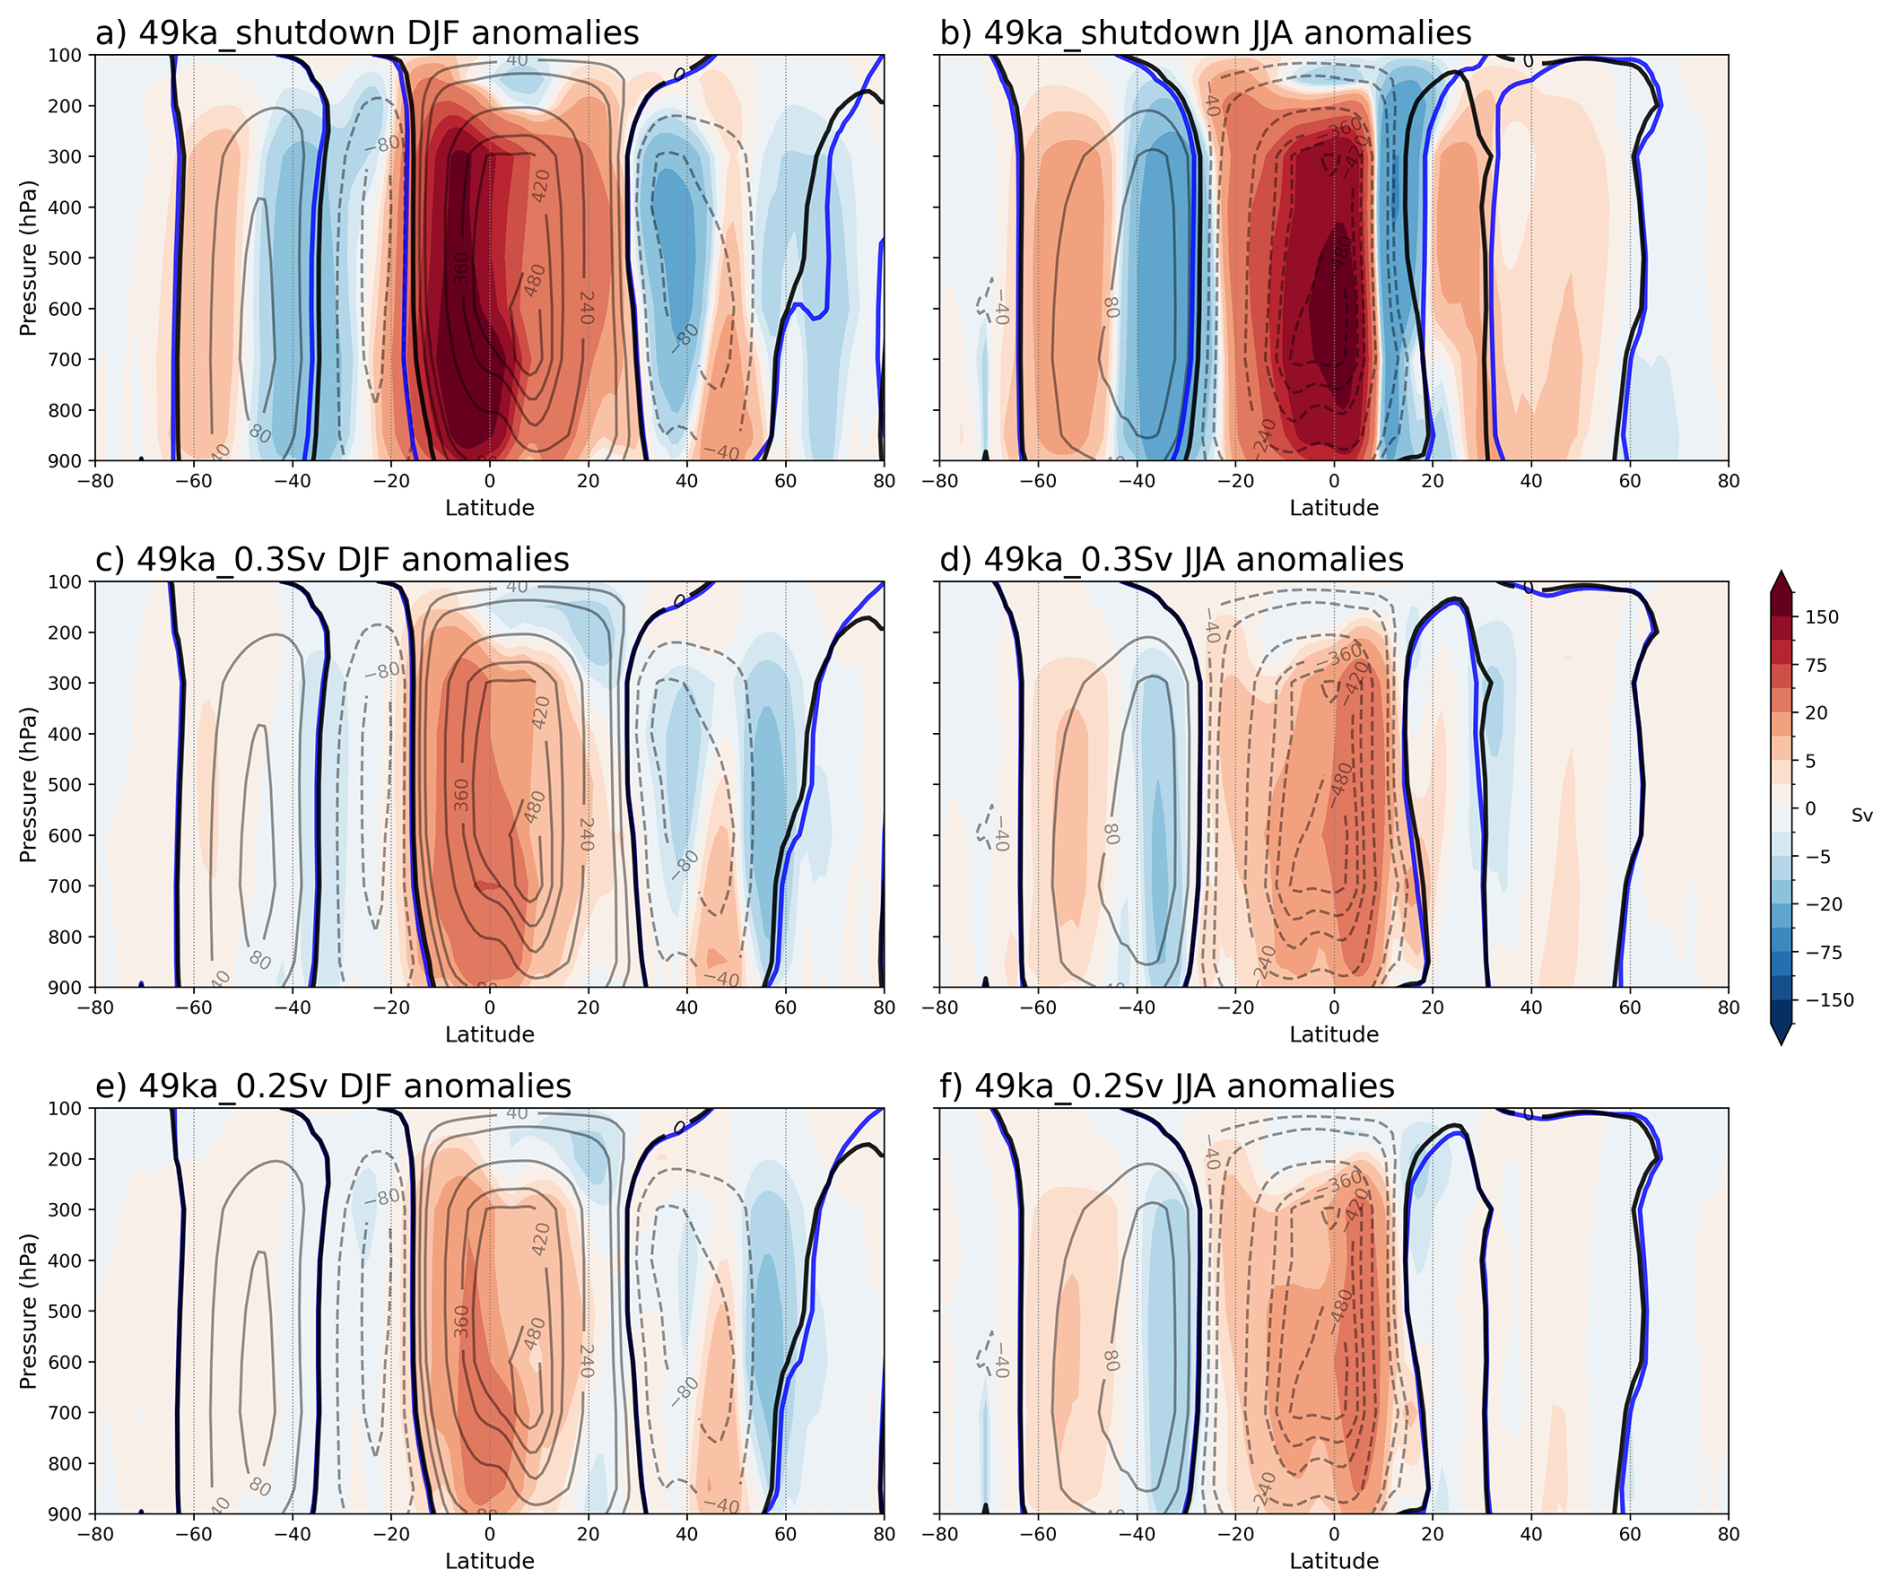
Figure 4DJF and JJA 49ka_shutdown (a, b), 49ka_0.3Sv (c, d), and 49ka_0.2Sv (e, f) minus 49ka_control atmospheric mass streamfunction anomalies (Sv, shading). Black contours (solid = positive; dashed = negative) are 49ka_control absolute streamfunction values. The thick black and blue lines represent the zero contour in 49ka_control and each freshwater hosing experiments, respectively.
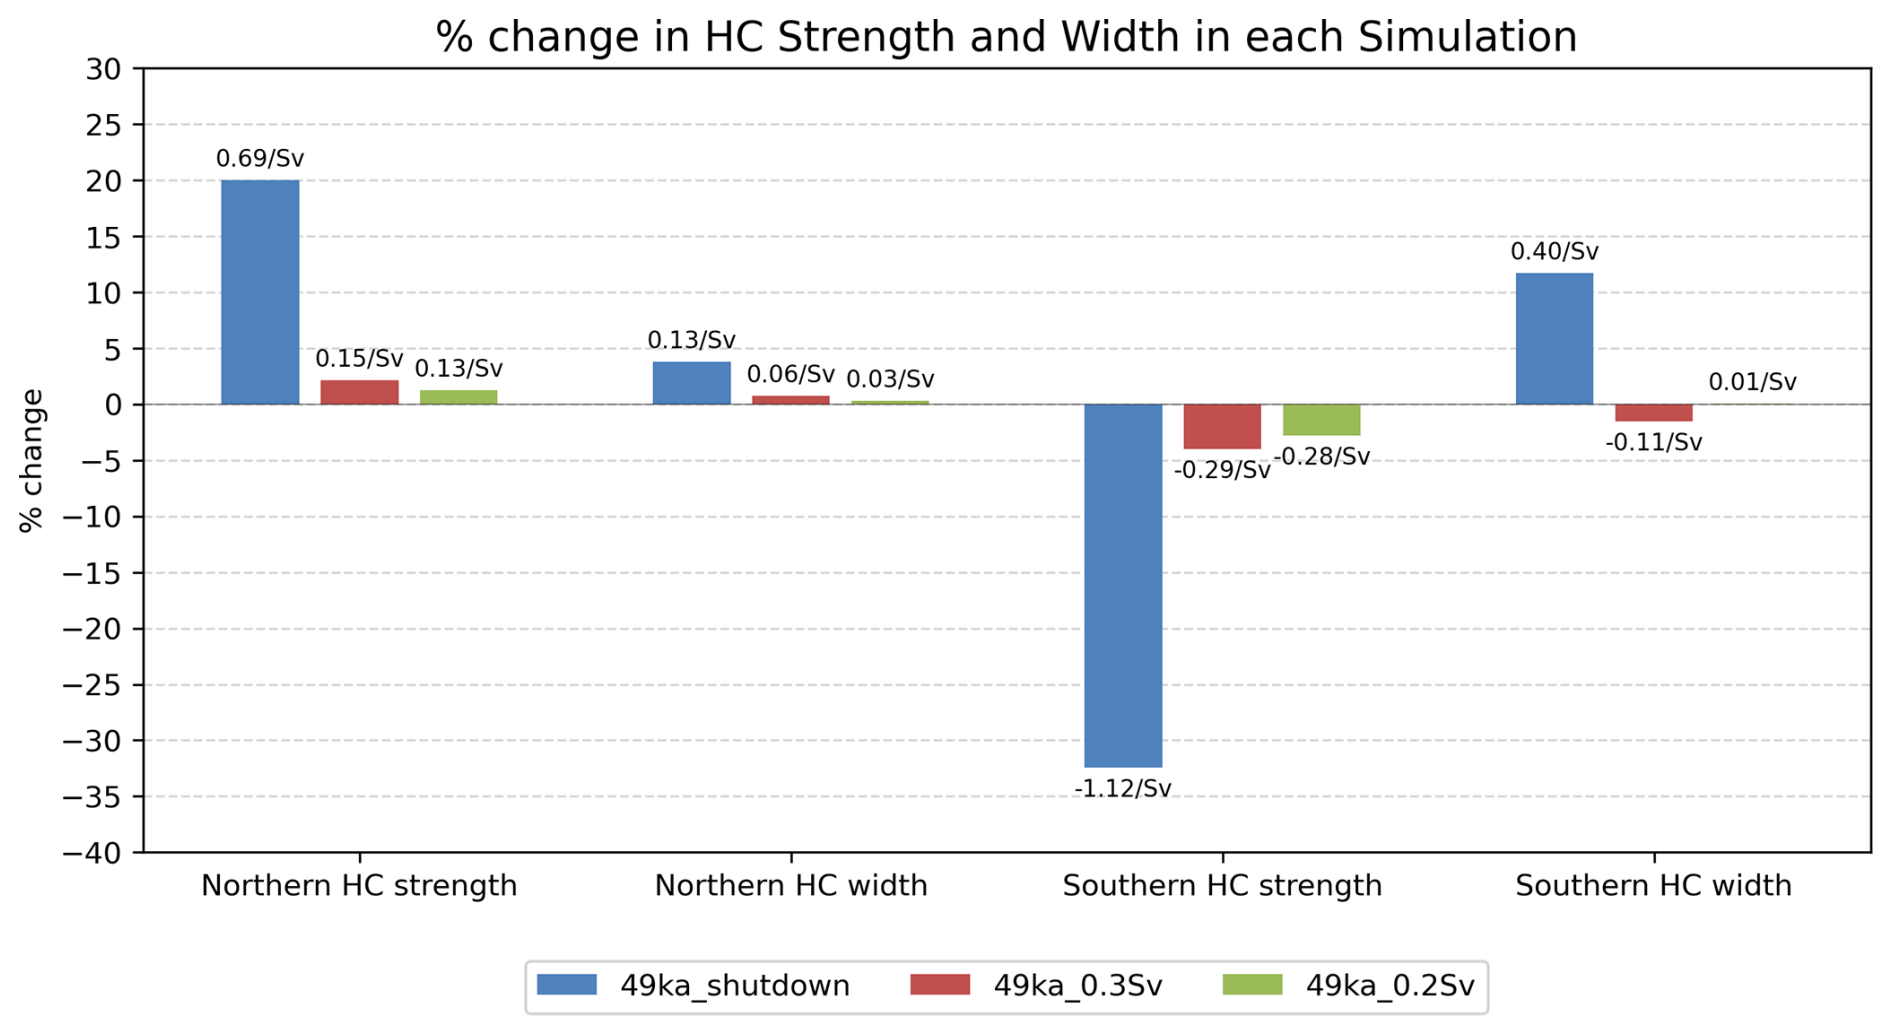
Figure 5Percentage of absolute changes in the NH wintertime (DJF) HC and SH winter (JJA) HC strength and width at 500 hPa in the 49ka_shutdown, 49ka_0.3Sv and 49ka_0.2Sv simulations (values in Table S2). Normalised changes in percentage per Sv AMOC decrease are shown on top of each bar. The method for the calculations is described in Sect. 2.4.
In boreal winter (DJF), as the ascending branch of the HC, the ITCZ at 850 hPa shifts southwards by 0.82 and 0.34°, respectively in the 49ka_0.2Sv and 49ka_0.3Sv slowdown simulations, compared to a significant southward shift of 3.57° to ∼ 15.8° S in the 49ka_shutdown simulation (thick lines in Fig. 4a, c, e). The northern HC strengthens and expands in width at 500 hPa in all simulations (Fig. 5). The northern HC central position with maximum HC strength shifts southwards by 10° to 1.88° S in the 49ka_shutdown simulation, however, remains unchanged at around 8.13° N in the slowdown simulations (Fig. 4a, c, and e). The northern HC strength increases by 20 % due to the AMOC shutdown compared to an increase of less than 2.3 % in the slowdown simulations (Fig. 5). The NH HC width increases slightly between 49ka_0.2Sv and 49k_0.3Sv simulations but is more than doubled in the shutdown simulation (Fig. 5), and is dominated by the southward shift in the ascending branch of the NH HC at 500 hPa, albeit with little change in location of the descending branch (Fig. 4a, c, e).
In austral winter (JJA), with a weaker northwards atmospheric heat transport of ∼ 0.19 PW at 30° N (Fig. S4), the ITCZ, as calculated by the location of the 850 hPa zero mass streamfunction (as described in Sect. 2.3), shifts northwards by 0.97° to around 20.14° N, associated with a large expansion of the SH HC width by 11.7 % in the 49ka_shutdown experiment (Fig. 5). Due to the AMOC shutdown, the ascending branch of the SH HC shifts northward by 3.5° at 500 hPa, contributing to the negative anomalies around 18.4° N simulated in the 49ka_shutdown experiment (Fig. 4b), which are not seen in the slowdown simulations (Fig. 4d, f). This northward shift in the JJA ITCZ and ascending branch reduces the cross-equatorial energy transport in JJA, which explains the smaller JJA atmospheric compensation to the AMOC shutdown. The SH HC strength in JJA is significantly reduced by 32.5 % in 49ka_shutdown, compared to 4 % and 2.8 % in the 49ka_0.3 Sv and 49ka_0.2 Sv slowdown experiments, respectively (Fig. 5). The ITCZ response at 850 hPa in the D–O stadial simulations is undetectable (thick lines in Fig. 4d, f), consistent with negligible JJA energetic constraints on the atmosphere. A 2.9 % reduction in the SH HC meridional extent is simulated in 49ka_0.3Sv due to southward shift in the SH HC ascending branch, while no change is observed in the 49ka_0.2 Sv experiment results (Fig. 5). All these changes suggest a non-linear response of the HC between the slowdown and shutdown simulations, accompanied by a pronounced seasonal asymmetry.
3.2.2 Changes in the subtropical pressure systems and circulation
Changes in the HC strength and width influence the STR and surface wind stress associated with the subtropical descending branch of the HC. In the shutdown simulation, the position of the southern JJA HC descending branch is shifted southwards by 1.5° from 27.2° S with reduced strength while the northern DJF HC strength is enhanced with a small northward shift (0.1°) in the position of the subtropical descending branch (Fig. 5 and Table S2). The position of the descending branches in the slowdown simulations changes by less than 0.3° (Table S2).
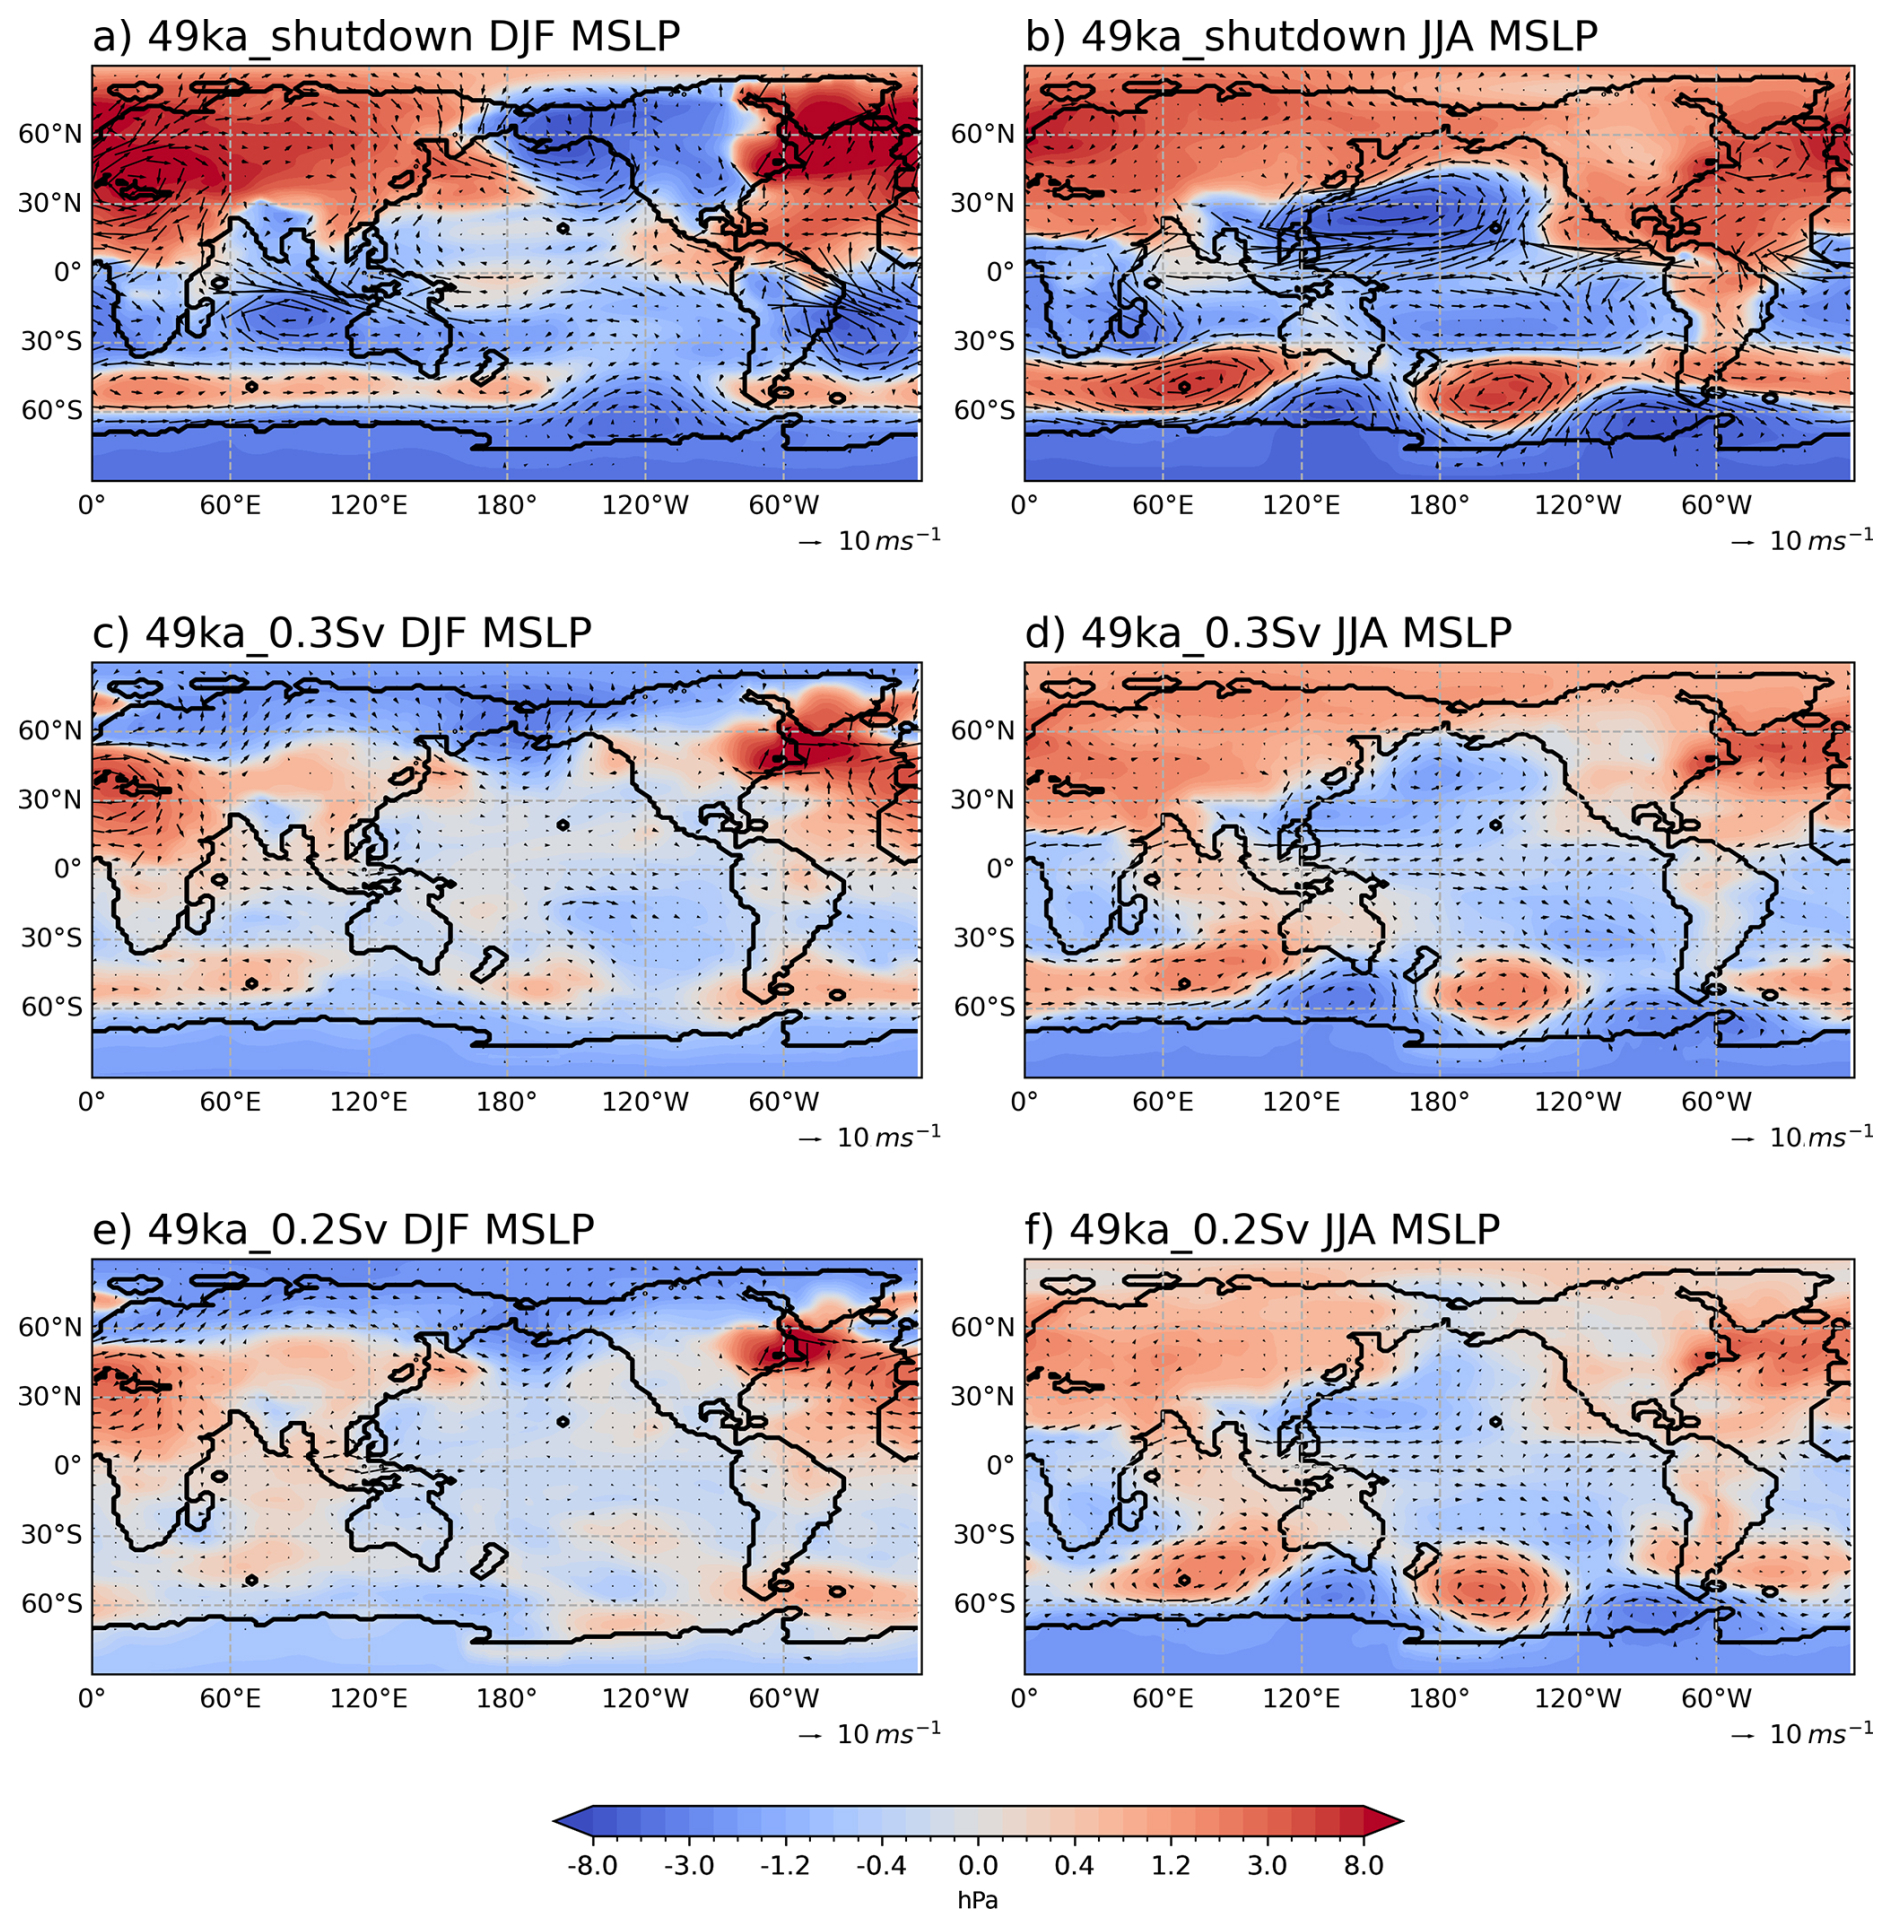
Figure 6DJF (a, c, e) and JJA (b, d, f) MSLP anomalies (hPa) in each simulation relative to 49ka_control, with 850 hPa wind vector anomalies.
In DJF, there is an increase in pressure in the northern subtropical regions over Africa, the Atlantic and the eastern Pacific in response to an enhancement of the descending branch of the northern HC in all simulations (Fig. 6a, c, e). The upper-level subtropical jet strengthens in the NH across all experiments (Fig. S5a, c, e), associated with stronger subtropical cyclonic circulation and positive surface pressure anomalies over Europe and the North Atlantic (Fig. 6a, c, e). A decrease in surface pressure in the SH subtropical regions is shown in the shutdown simulation (Fig. 6a) due to weakened DJF southern HC strength (Fig. 4a). The slowdown simulations show different patterns compared to the 49ka_shutdown experiment (Fig. 6c, e). This difference in the spatial pattern is most likely driven by the small changes in the DJF southern HC strength in the slowdown simulations. In the 49ka_shutdown experiment (Fig. 6a), it is evident that the surface wind changes are consistent with the southward shift in the ITCZ to ∼ 15.8° S, particularly over the Indian and South Atlantic Oceans, with westerly anomalies to the north and easterly anomalies to the south. This change in the winds generates anomalous cyclonic circulation over the Indian and south Atlantic Oceans, associated with weakened surface pressure due to the AMOC shutdown (Fig. 6a).
In austral winter (JJA), the SH MSLP at ∼ 27° S weakens in all simulations in response to a weaker southern HC (Fig. 6b, d, f), with some slight strengthening over the Indian Ocean in the slowdown simulations (Fig. 6d, f). The upper-level subtropical jet at 200 hPa weakens as a response of weakened southern HC (Fig. S5b, d, f). In the shutdown simulation, the subpolar low pressure belt shows negative surface pressure anomalies, while positive surface pressure anomalies of up to 5.7 hPa are found between 40 and 60° S in the Indian and Pacific basins (Fig. 6b). This increase in the positive anomalies is primarily due to a southward expansion of the southern HC, with its descending branch shifting to ∼ 27° S, which then drives a southward shift of the high pressure systems in the HS simulation. The subpolar low-pressure belt is enhanced and pushed southward, particularly in the South Pacific and Indian basins. The 200 hPa subtropical jet around 30° S weakens due to a decrease of the southern HC (Fig. S5b). The mid-latitude jet is enhanced around 50 to 70° S, with a weakened South Pacific split jet (Fig. S5b). This further leads to increased SH westerlies and Rossby wave propagation pattern anomalies around 40 and 60° S (Fig. 6b). These responses are consistent with Lee et al. (2011) proposed SH circulation responses to North Atlantic cooling. The slowdown simulations display a broadly similar spatial pattern in the mid-high southern latitudes (Fig. 6d and f), resulting from a strengthening of the ascending branch and weakening of the descending branch of the southern Ferrell cell (Fig. 4b, d, f). The differences in pressure response between the shutdown and slowdown simulations are likely attributable to the large shift in the southern HC descending branch in the shutdown simulation, while no shift is simulated in the D–O stadial simulations (Fig. 4b, d, f). In the NH, a region of low surface pressure with negative MSLP anomalies of up to 7.2 hPa in the North Pacific subtropics is simulated in the 49ka_shutdown experiment in JJA (Fig. 6b), associated with significantly increased precipitation (Fig. S6f), which corresponds to a northward displacement of JJA ITCZ position to ∼ 20.1° N. The surface winds adjust to changes in the surface pressure and ITCZ shifts, generating an anomalous subtropical cyclonic circulation over the North Pacific subtropical regions in the shutdown experiment (Fig. 6b), which is less evident in the slowdown simulations due to smaller changes in the southern HC (Fig. 6d, f).
3.2.3 Changes in the SH mid-latitude westerly winds
In this section, we explore the impacts of the altered HC on SH mid-latitude westerly winds. Changes in the position and intensity of the SH westerly winds are evaluated, defining the SH westerlies strength as the zonal mean maximum wind speed between 40 to 60° S at 850 hPa and the position of the SH westerly winds as the latitude of the maximum wind speed, interpolated to 0.5° latitude resolution.
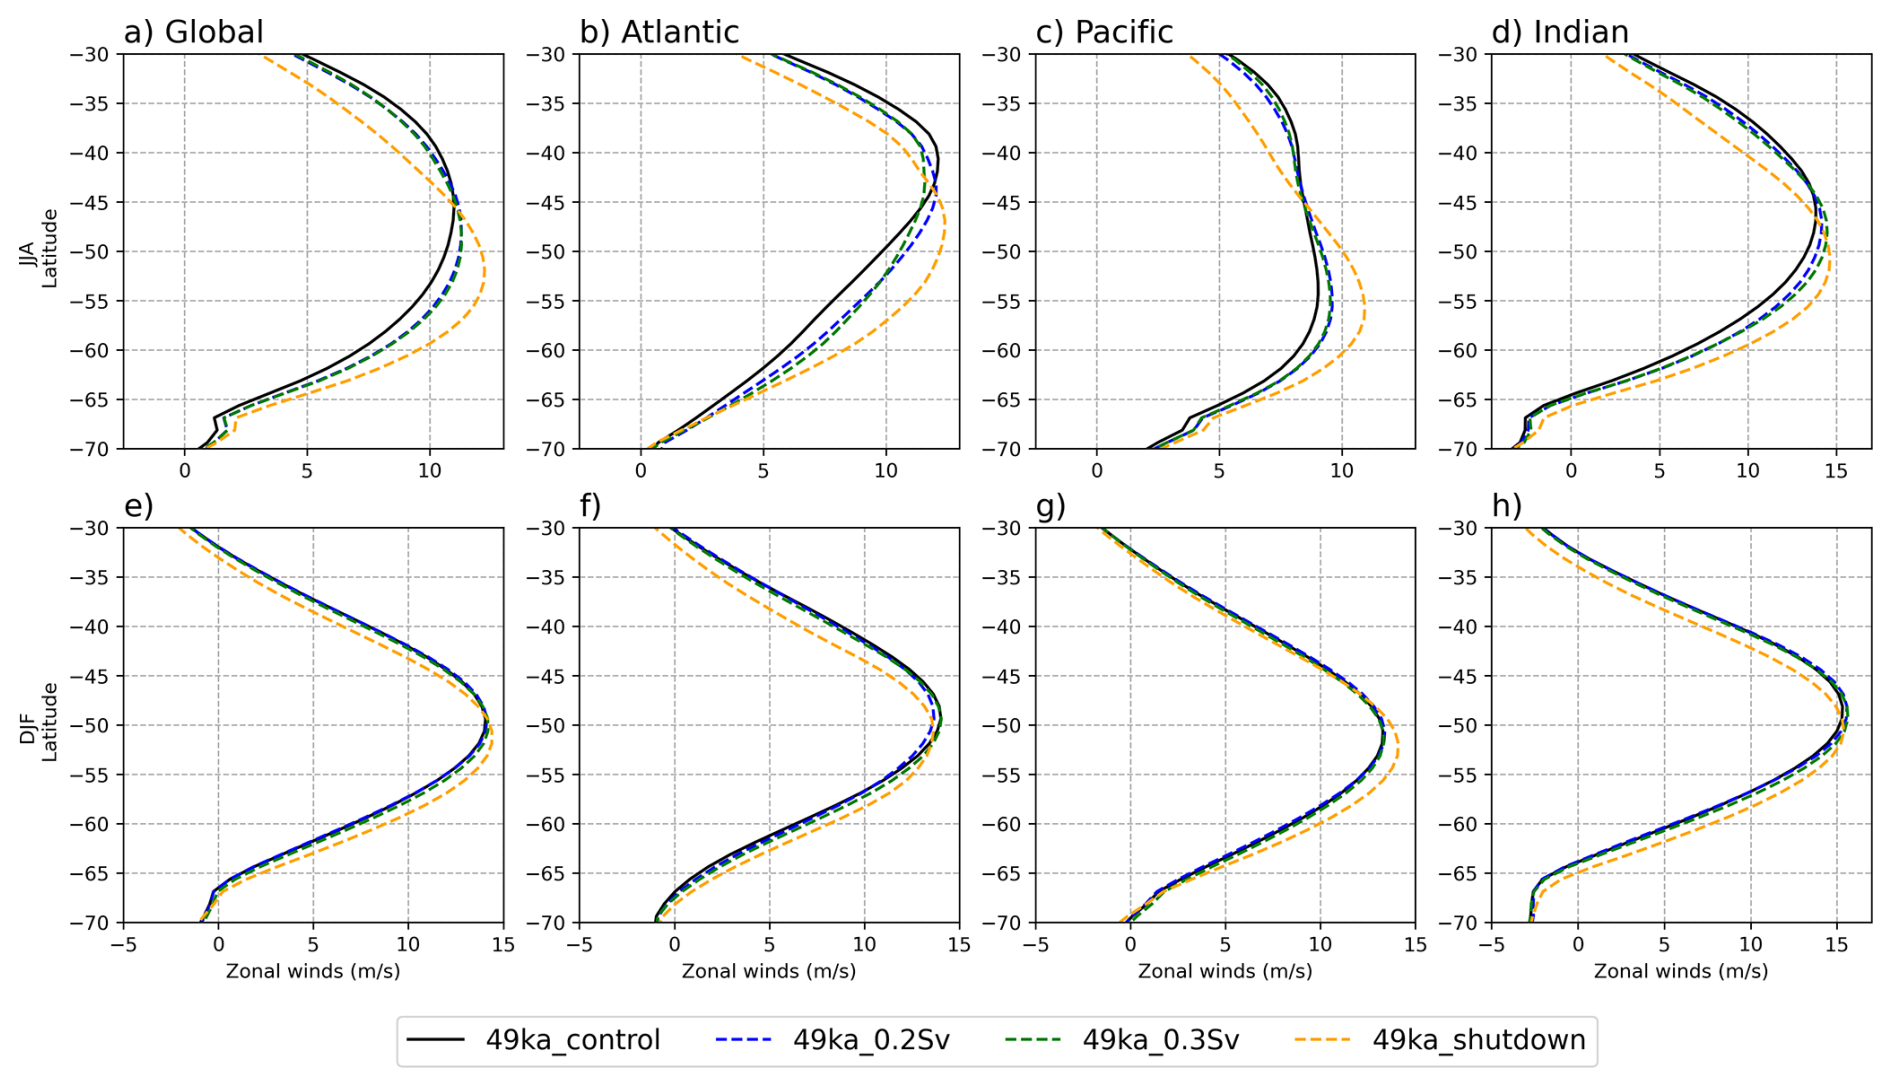
Figure 7Southern Hemisphere JJA (a–d) and DJF (e–h) 850 hPa average westerly wind speed (m s−1) in each simulation relative to 49ka_control (in black) globally, and across each ocean basin (longitude range defined in Sect. 2.4).
The globally averaged SH westerlies strength increases by 11.4 % and shifts southwards by 6.5° to ∼ 52° S in 49ka_shutdown in JJA, due to the weakening of the southern winter HC and southward displacement of its descending branch (Fig. 7a). Similarly, global mean strengthening and southward displacement of the SH westerlies are simulated in DJF (Fig. 7e), but the changes are smaller than those simulated during JJA. The strengthening of the westerlies is driven by enhanced meridional sea surface temperature gradient in the Southern Ocean due to high latitude cooling near the Ross/Weddell sectors (Fig. S6c), associated with the weakened SH subtropical jet (Fig. S5).
The westerlies show the strongest intensification over the South Pacific Ocean in both seasons, with more than 21 % at around 55° S in JJA (Fig. 7c) and 6 % at ∼ 51° S in DJF (Fig. 7g). There is little change in the meridional position over the Pacific basin (Fig. 7c, g), while the SH westerlies in JJA shift southwards by 6 and 5° over the Atlantic and Indian Oceans, respectively (Fig. 7b, d). Over the Atlantic basin, there is no change in the westerly strength in the shutdown experiment in JJA and DJF (Fig. 7b, f). The strength in the slowdown simulations is slightly reduced relative to 49ka_control in both seasons. This is different from other ocean basins, which experience enhanced westerly strength in the slowdown simulations relative to 49ka_control. This may be due to the stronger temperature response to AMOC slowdown in the Atlantic Ocean than other basins, which drives the distinct Atlantic response. In addition, the different alterations of the SH HC in HS relative to D–O stadial simulations (Fig. 5) may contribute to the difference in Atlantic response between the HS and D–O stadial experiments, where the climate is most sensitive to AMOC weakening. Future studies will examine the basin-dependent changes in the westerlies in more detail.
In summary, the SH westerlies strength and meridional position in the AMOC slowdown experiments (49ka_0.2Sv and 49ka_0.3Sv) show little differences in their response to AMOC weakening (Fig. 7), despite some variations over the Atlantic and Indian Oceans in JJA due to slightly different changes in the southern winter HC. The strength increases slightly over the Pacific and Indian basins with no meridional displacement in the slowdown experiments relative to 49ka_control in JJA (Fig. 7c, d), while weaker and southward SH westerlies are simulated over the Atlantic (Fig. 7b). Relatively little change is simulated in the slowdown simulations in DJF (Fig. 7e–h). However, when the AMOC is shut down, the SH westerlies response seems to follow the tendency over the Pacific Ocean with increased strength in both seasons (Fig. 7c, g), while more complex responses are simulated in the other ocean basins.
3.3 Impacts on seasonal Australasian climate
In this section, we investigate the climatic changes over Australia and the surrounding region in response to AMOC slowdown and shutdown at 49 ka and propagated by large-scale changes in atmospheric circulation discussed above.
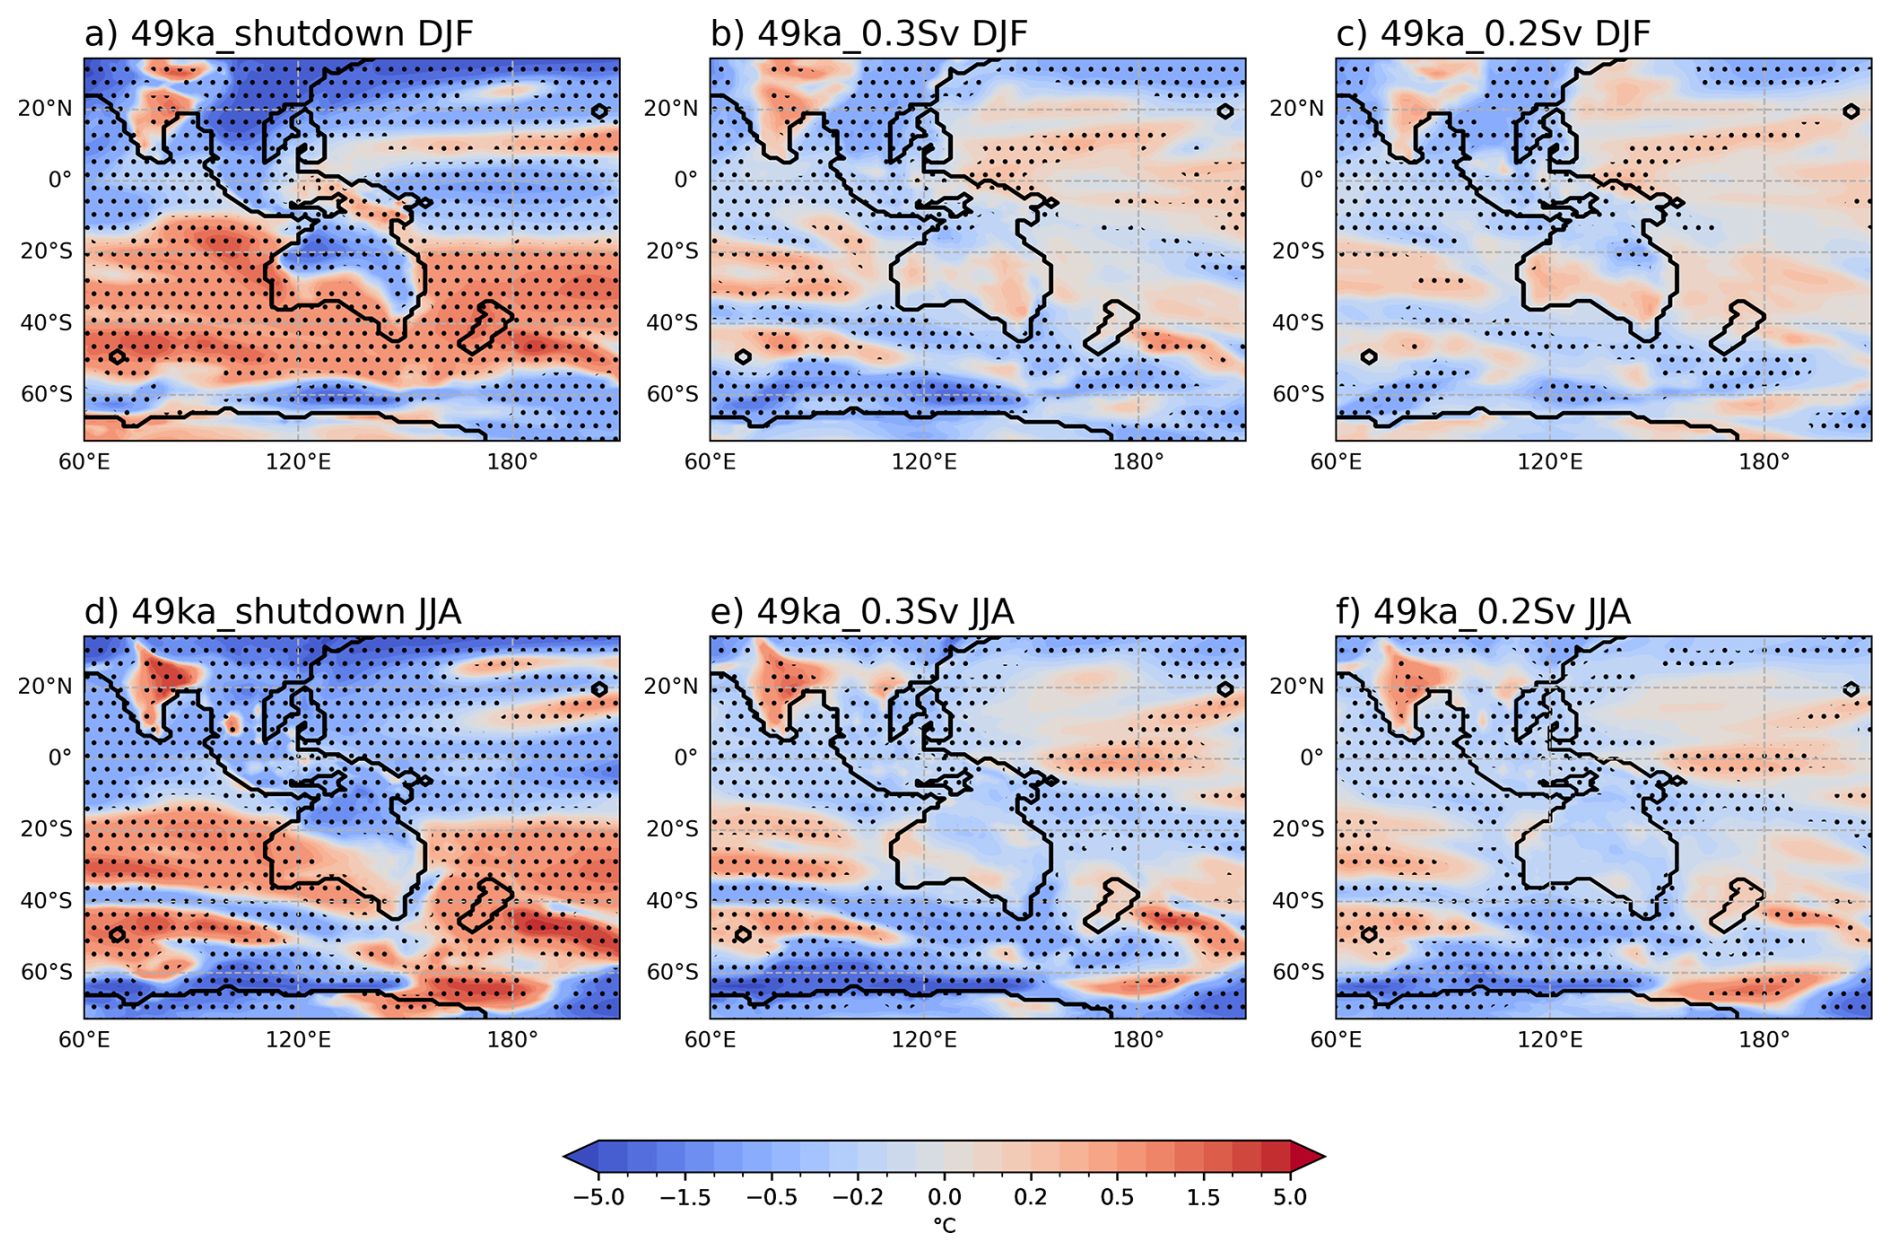
Figure 8Australian annual DJF (a–c) and JJA (d–f) surface air temperature (SAT; in °C) anomalies in each simulation relative to 49ka_control. Stippling indicates areas with significant changes at the 95 % confidence level according to a Student's t-test.
The northern half of the Australian continent, as well as parts of New Guinea, are simulated to be colder while the southern part of Australia is warmer in the shutdown simulation in both DJF and JJA seasons (Fig. 8a, d). This is consistent with previous AMOC weakening experiments performed with the same model under interglacial background climates (Du et al., 2025; Saini et al., 2025a). However, the amplitude of this temperature gradient is smaller in the slowdown experiments (Fig. 8b–c, e–f). The 49ka_0.2Sv experiment displays a similar pattern as 49ka_shutdown in DJF, even though the changes are insignificant (Fig. 8c). In JJA, an overall cooling pattern is simulated across Australia in the slowdown experiments (Fig. 8e, f), while significant warming anomalies are simulated over southern Australia due to AMOC shutdown (Fig. 8d).
Over New Zealand, significant warming is triggered by AMOC shutdown (Fig. 8a, d), while small temperature changes are suggested in the slowdown experiments, with significant cooling to the south and warming to the east of New Zealand (Fig. 8b–c, e–f).
The current hydroclimate of northern Australia and nearby Maritime Continent and New Guinea are influenced by the Indo-Australian summer monsoon in the austral summer (DJF), while southern Australian and New Zealand hydroclimate is more affected by a northward shift of the SH westerly winds in austral winter (JJA) season. Moreover, the STR, as the surface descending branch of the Hadley Cell, undergoes meridional displacement with the seasons, greatly influencing the timing of moisture delivery over Australia (Grose et al., 2015; Pepler et al., 2018).
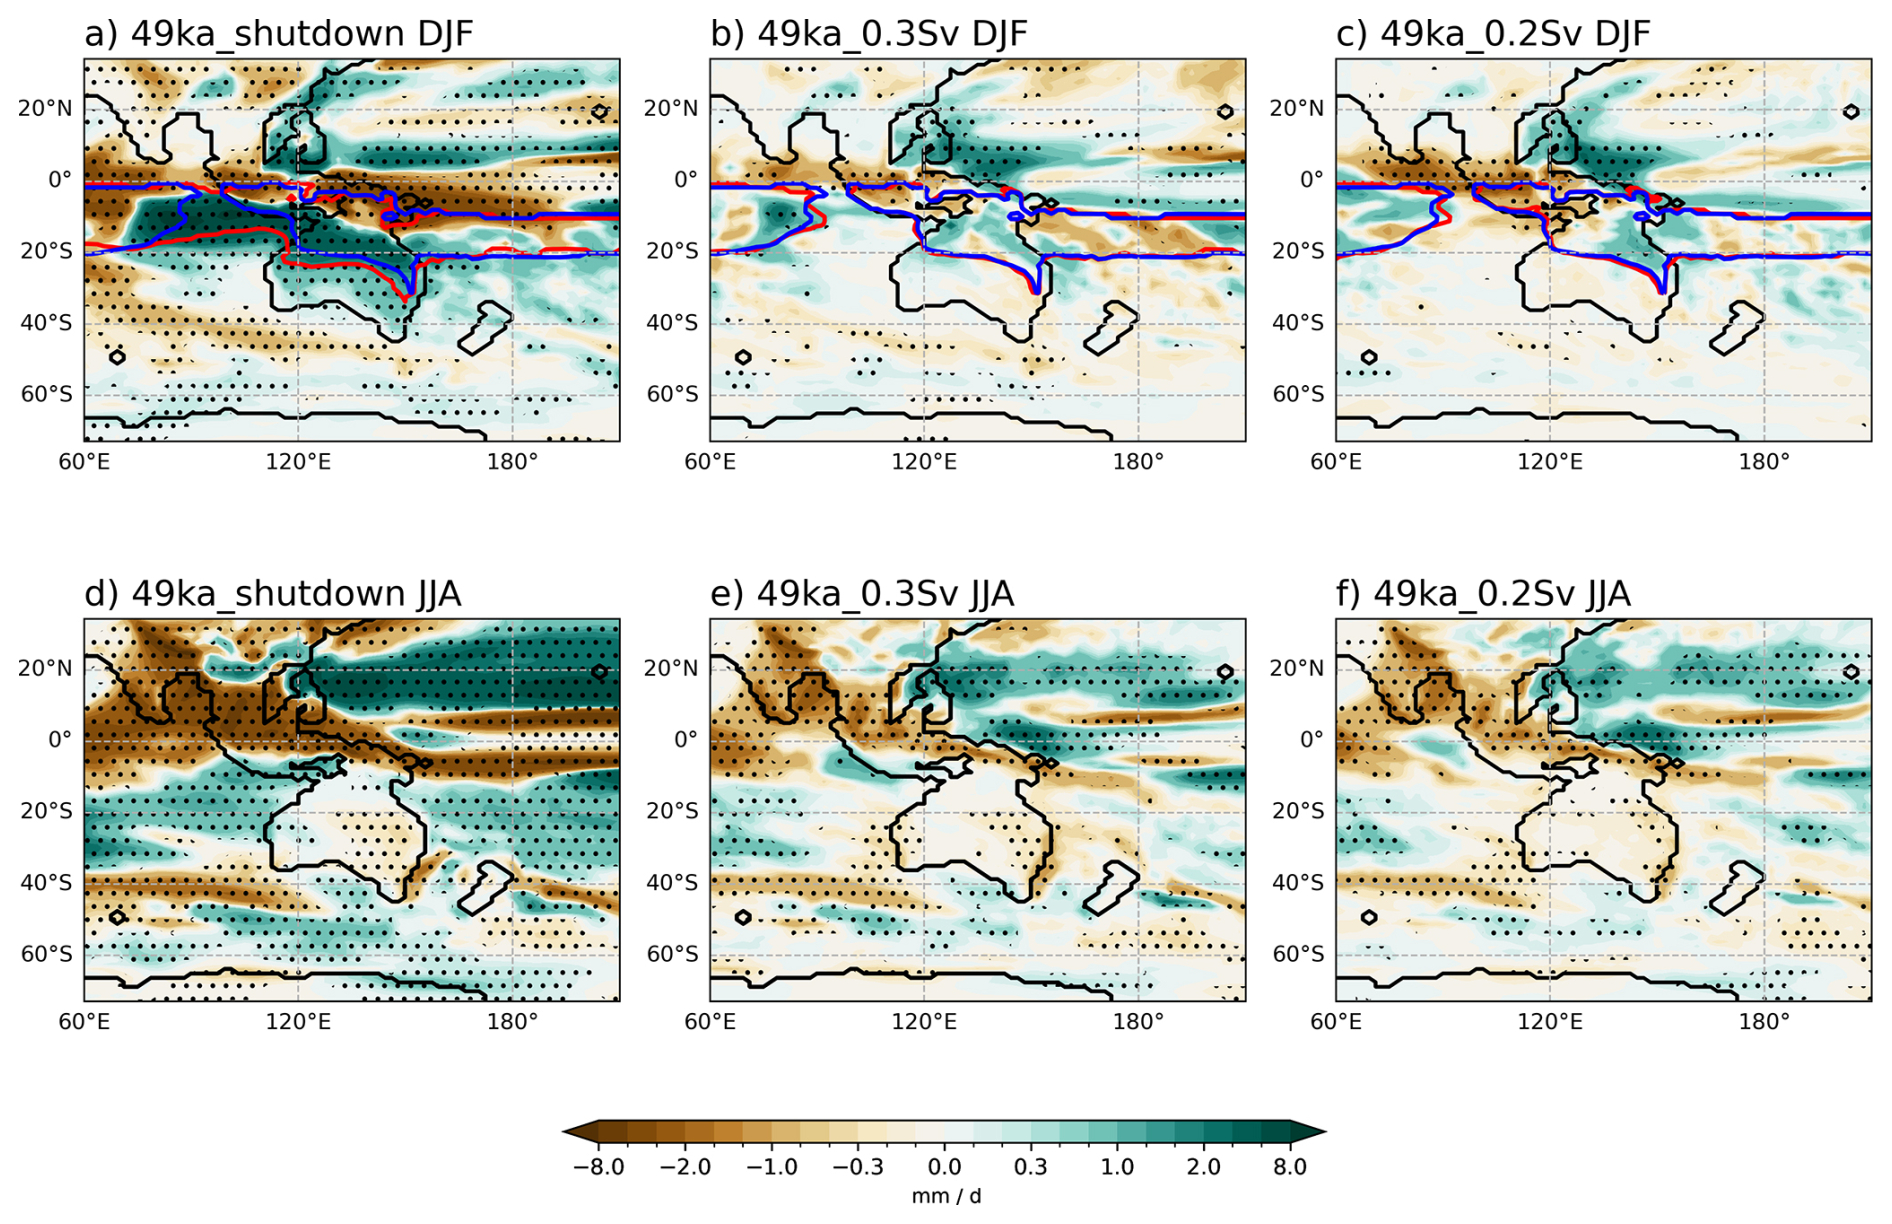
Figure 9Australian DJF (a–c) and JJA (d–f) precipitation anomalies in each simulation relative to 49ka_control (mm d−1). The blue contours in DJF (a–c) represent the 49ka_control monsoon domains while the red contours indicate monsoon domains in each hosing experiments Stippling indicates areas with significant changes at the 95 % confidence level according to a Student's t-test.
In the shutdown experiment, significantly increased precipitation in DJF is simulated across the Australian continent south of 10 ° S, with an up to 6 mm d−1 increase in northern Australia due to AMOC shutdown (Fig. 9a). The increase is likely driven by stronger north-westerly winds associated with an enhanced and expanded Indo-Australian summer monsoon (see Fig. 9a, where blue contours represent 49ka_control monsoon domain, and red contours represent the monsoon domains in the shutdown and slowdown experiments). The STR shifts southwards by 1° to around 41° S, allowing more tropical moisture to reach central Australia while drier conditions prevail around the high-pressure regions (Fig. 9a). The STR shift is associated with significantly lower summer (DJF) temperatures of more than 2 °C over northern Australia and New Guinea due to increased precipitation and cloud, whereas most of the SH mid-latitudes are warmer (Fig. 8a). In the slowdown simulations, parts of northern Australia and New Guinea receive a small increase in monsoon precipitation (Fig. 9b, c), but little change in the spatial extent of the monsoon is simulated relative to 49ka_control. Reduced DJF SPCZ precipitation is simulated, corresponding to the warming anomalies over the area (Fig. 8b, c).
During the austral winter (JJA), significant drying is simulated along the east coast of Australia, extending to central Australia in all simulations (Fig. 9d–f). This drying trend is due to slightly increased pressure across Australia and New Zealand (Fig. 6b, d, f). In HS simulation, the JJA STR is shifted southward by 1° to ∼ 30° S, associated with a displaced descending branch of the southern HC. The southward shift of the STR suppresses the mid-latitude frontal systems associated with low pressure that brings the cold south-westerly winds and precipitation into southern Australia in winter, as occurs under modern climate, which then leads to drying conditions in southeastern Australia in HS (Fig. 9d). The drying pattern over southern Australia in JJA is consistent across all experiments, which may be due to the southward shift of the SH westerlies in all simulations (Fig. 7a). The STR position and intensity remains unchanged in the slowdown simulations in both seasons.
In this study, we performed freshwater hosing experiments to slow down and shut down the AMOC under glacial conditions at 49 ka to represent D–O and HS, respectively. We explored how the large-scale climate features, such as the atmospheric circulation and precipitation respond to different magnitudes of AMOC weakening and their impacts on SH regional climates.
4.1 Climatic response to AMOC shutdown in HS simulation
In this section, we present a diagnostic of the role of energetic constraints in shaping the atmospheric response to AMOC weakening through simulations of HS at 49 ka, as well as how that leads to the SH mid-latitude changes and hydroclimate response around Australasia through changes in the cross-equatorial Hadley Cells.
The northward oceanic heat transport is reduced by ∼ 77 % at 30° N in the HS simulation (Fig. S2), which generates a significant interhemispheric energy imbalance that is primarily compensated by the atmospheric response, particularly in DJF (Fig. S4) – through a southward shift of the annual ITCZ, and a reorganization of the HC strength and width. The winter (DJF) northern HC strengthens and increases in width, with a southward shift in its ascending branch (ITCZ position), while the southern wintertime (JJA) HC weakens but increases in width due to a small northward shift in the JJA ITCZ position at 850 hPa. The northward shift in the JJA ITCZ reduces the cross-equatorial heat transport, which explains the smaller contributions to atmospheric compensation in JJA. Note that the simulated change in the southern JJA width is different from responses under the Last Interglacial and PI boundary conditions using the same model (Saini et al., 2025a). This difference may be due to the different background states between warm interglacial and cold glacial climates, with more investigation needed in the future. Nevertheless, our findings of an enhanced northern HC and weaker southern HC in response to AMOC weakening are consistent with previous modelling studies (Chiang et al., 2014; Chiang and Friedman, 2012; Lee et al., 2011; Saini et al., 2025a).
Changes in the subtropical high surface pressure (STR) are associated with variations in the descending branch of the HC. An increase in DJF MSLP is simulated in the NH subtropics due to enhanced descending branch of the northern HC, while the opposite weakening of the STR is seen in the SH (Fig. 10). A strong decrease in surface pressure accompanied by anomalous cyclonic circulation is simulated over North Pacific in JJA, associated with significantly increased precipitation over the region (Fig. S6f). The upper-level SH subtropical jet weakens in JJA as a result of weakened southern winter HC. Global mean SH mid-latitude westerly winds at 850 hPa strengthen and migrate southwards in both JJA and DJF, which further leads to strengthened upwelling of the cold deep waters across the Antarctic circumpolar latitudes and drives surface Southern Ocean cooling (Anderson et al., 2009). The strengthening of the SH westerly winds may also explain the increase in atmospheric CO2 concentration during Heinrich 5 inferred from proxy records via the Southern Ocean (Menviel et al., 2014a; Wendt et al., 2024).
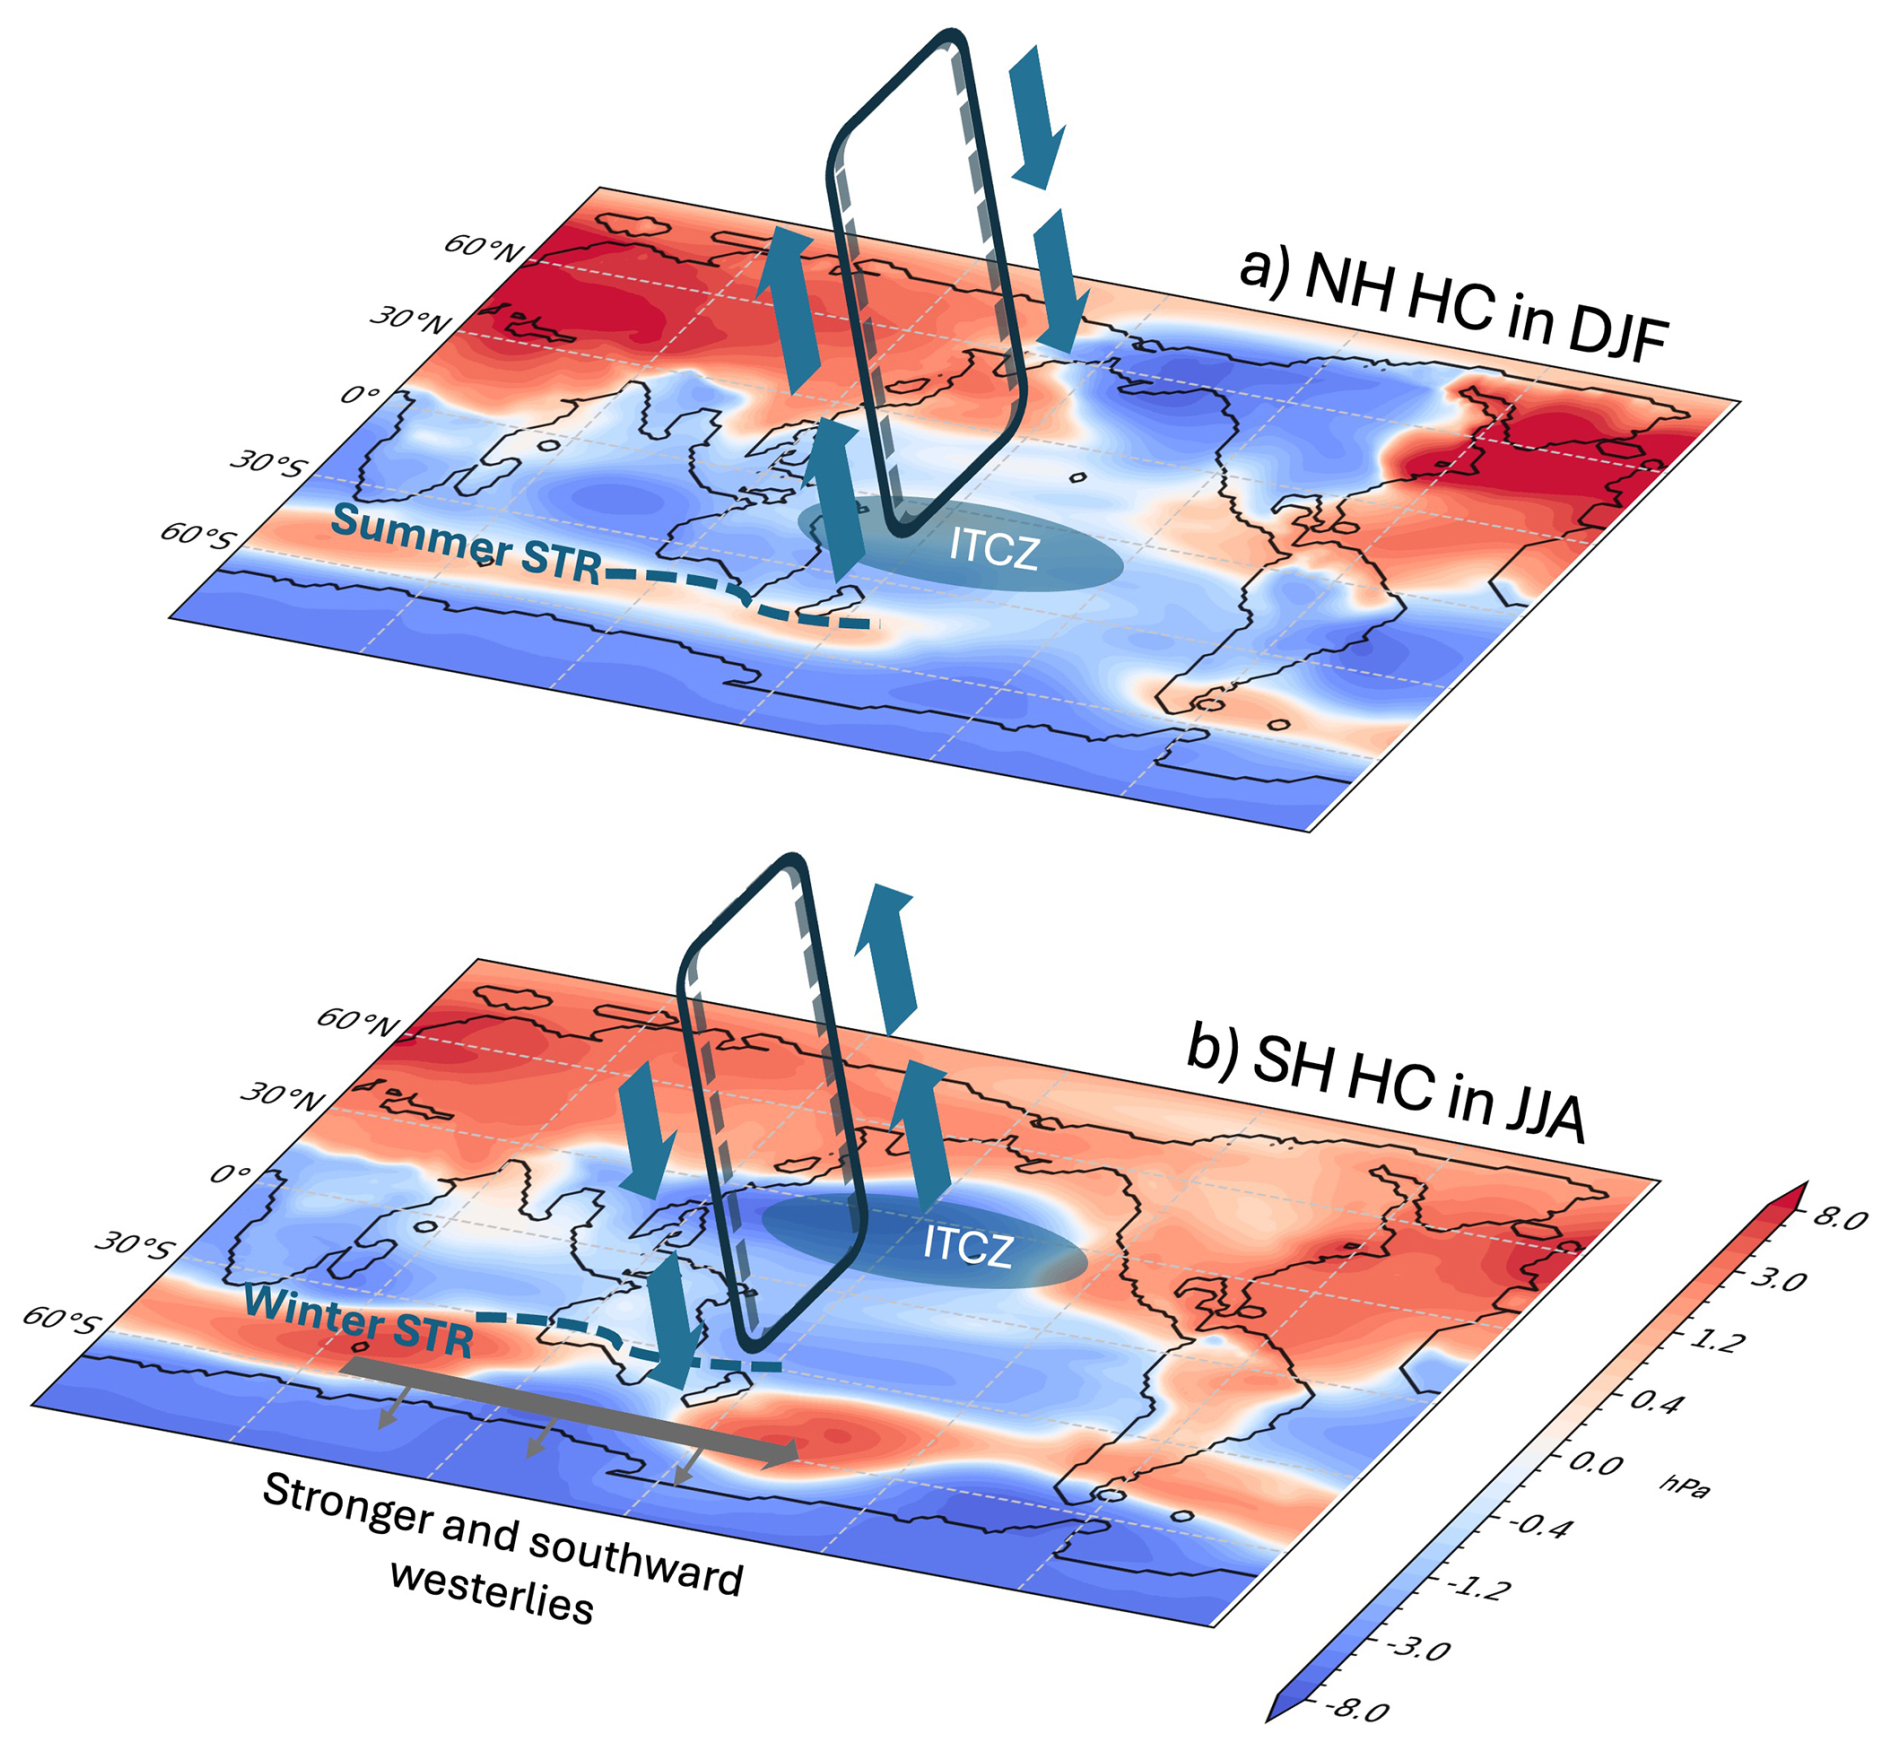
Figure 10Schematic of changes in (a) NH HC in DJF, and (b) SH HC in JJA in the 49ka_shutdown simulation, plotted over MSLP (hPa) anomalies relative to 49ka_control. Dashed lines represent 49ka_control, solid lines represent 49ka_shutdown HC.
The STR over the Australian region is weaker and moves southwards in both seasons. The austral summer (DJF) STR sits south of the Australian continent during the HS (Fig. 10a), which allows tropical moisture from the expanded Indo-Australian monsoon domain to reach southern Australia, leading to significantly enhanced precipitation across the Australian continent south of ∼ 10° S. A southward shift in the winter (JJA) STR reduces the fronts that pass over southern Australia, leading to drier conditions over southern Australia along with the enhanced and southwards displacement of the SH westerlies (Fig. 10b).
The simulated atmospheric circulation response to AMOC shutdown agrees with previous modelling studies, suggesting weaker South Pacific jet, stronger SH westerlies (Bard and Rickaby, 2009; Chiang et al., 2014; Lee et al., 2011), and increased SH monsoon precipitation (Cheng et al., 2012; Zhang et al., 2023) due to AMOC weakening. The results of this study can provide an example of the climate response to a strong AMOC reduction that can be compared with available proxy records to better understand the processes at play.
4.2 Non-linear climatic response between D–O and HS
In this study, we use normalised temperature and precipitation response to the AMOC decrease to quantify the linearity of climatic changes. The global area-averaged precipitation and temperature anomalies show linear changes per Sv of AMOC decrease in AMOC slowdown simulations at 49 ka, with roughly −0.003 mm d−1 and −0.05 °C per Sv change for both the 0.2 and 0.3 Sv experiments, respectively (see more details in Table S1). However, crossing the threshold of AMOC shutdown between 0.3 and 0.4 Sv triggers a different response in precipitation and temperature patterns which do not continue this linear response either globally or regionally (Fig. 3). The Australian temperature field between the slowdown and shutdown experiments shows relatively linear changes (Fig. 8), but this is not the case for hydroclimates, particularly during the DJF monsoon season (Fig. 9). The magnitude of global annual changes in precipitation and temperature in the shutdown experiment are 1.3 times as large per Sv relative to the slowdown simulations (Fig. 3 for spatial patterns), with larger changes in the SH (Table S1). This appears to be due to the non-linear responses in the large-scale atmospheric circulations such as the Hadley Cell, leading to different responses in the climatic processes (e.g. pressure system, westerly winds, etc.) between AMOC slowdown and AMOC shutdown.
We attribute this non-linearity between D–O and HS climate responses primarily to a threshold in the ocean heat transport response between the modest reductions associated with AMOC slowdown and the much larger reductions due to AMOC shutdown. The northward ocean heat transport in D–O stadial simulations is reduced by less than 25 % at 30° N (Fig. S2), which imposes a weak energetic constraint on the atmosphere. This results in minimal compensation by the atmosphere and consequently insignificant anomalies in the Hadley circulation and regional atmospheric responses. This study provides a possible location of the threshold in hosing strength between linear weakening and nonlinear shutdown, but it is important to note that the location is likely to differ between models and climate states both in the real world and in simulations. Comparison of simulations from different climate models would also provide evidence of the robustness of model responses to AMOC weakening under glacial conditions. Future studies performing longer simulations would be useful to explore slower responses, such as changes in sea ice extent and Southern Ocean temperatures.
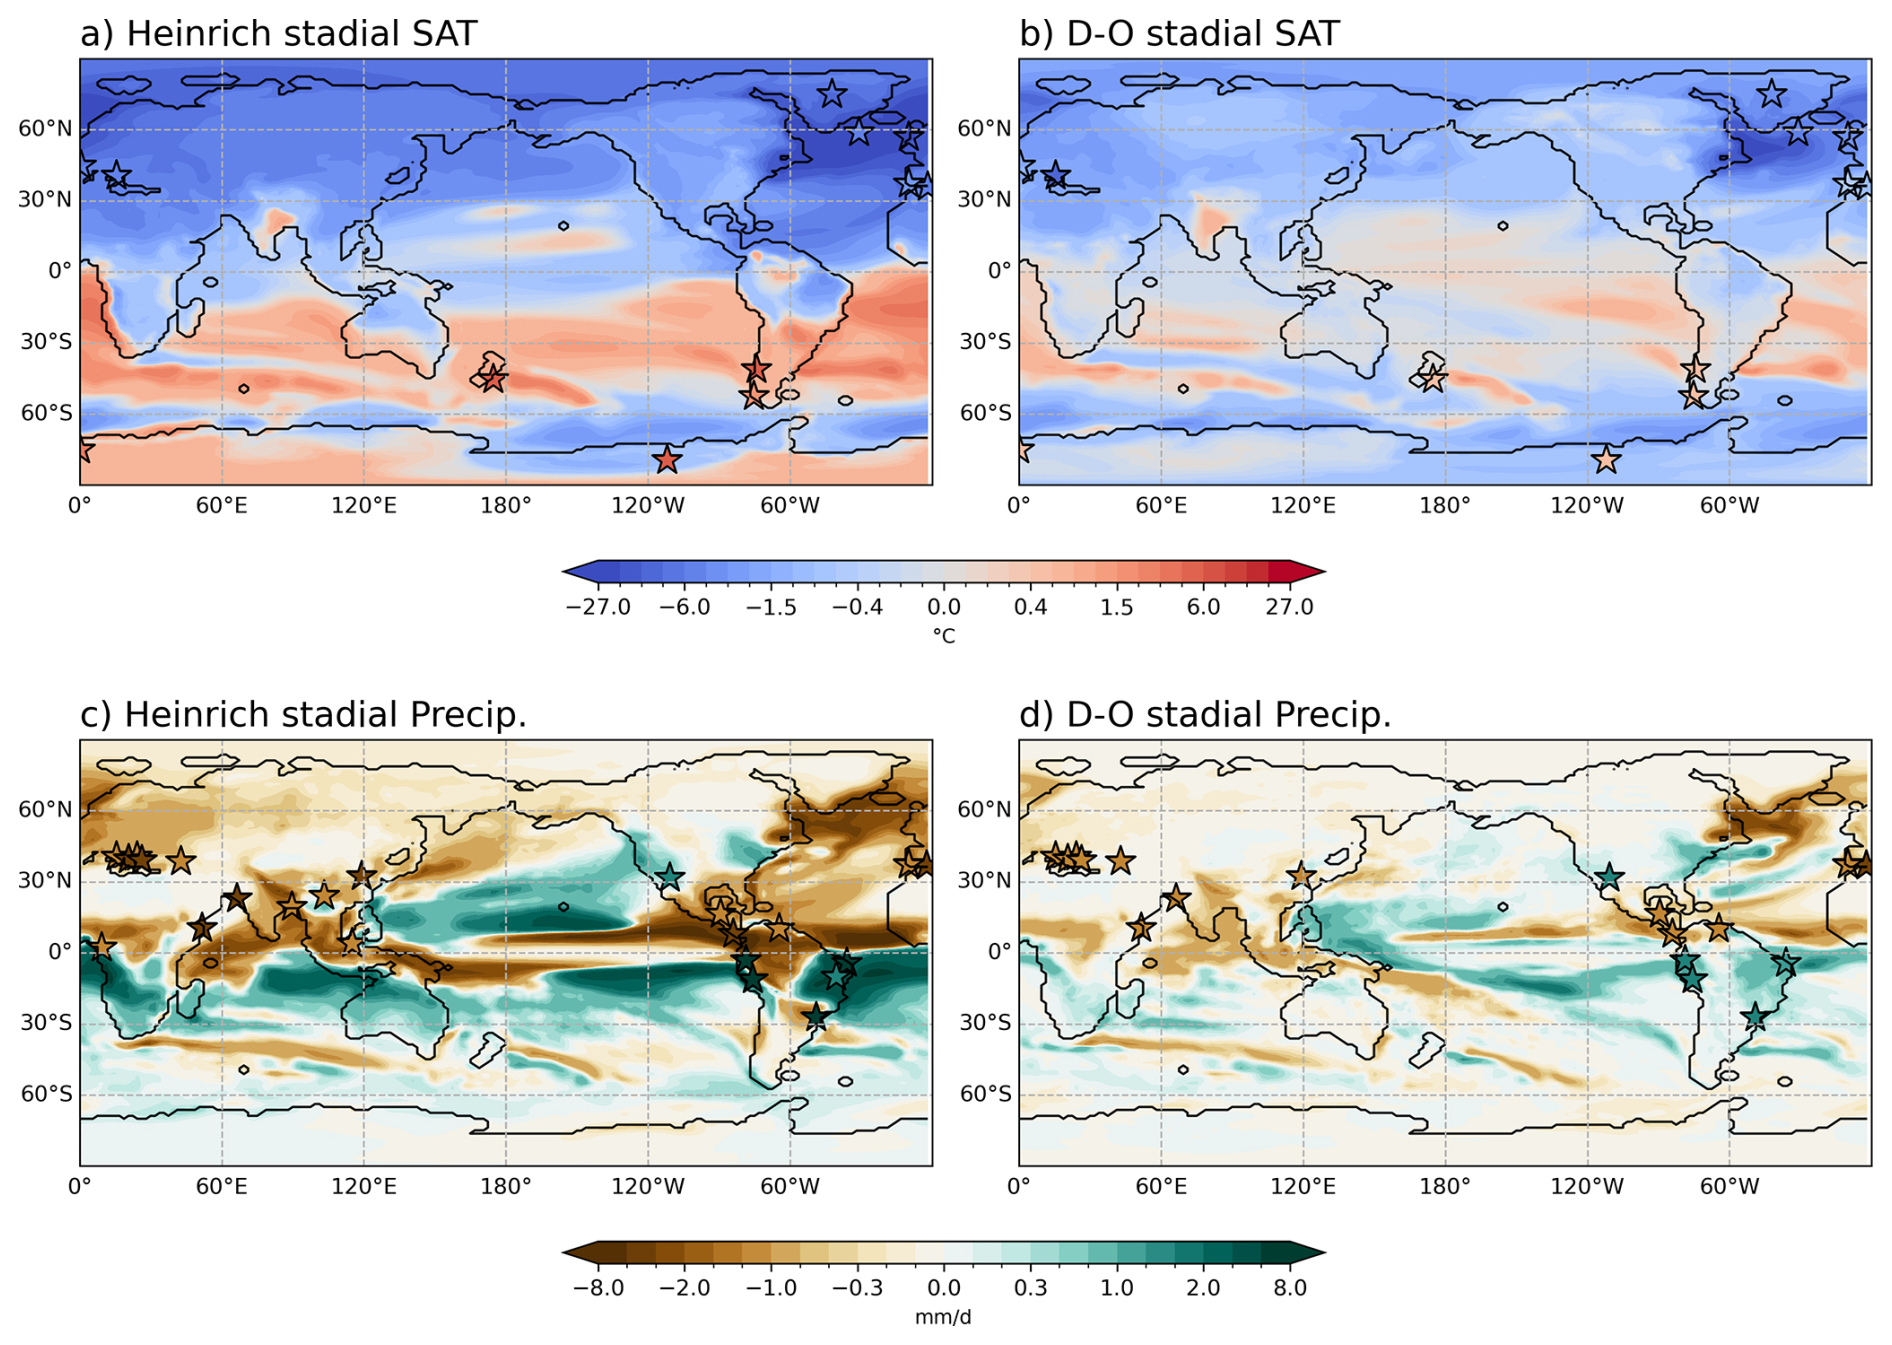
Figure 11Model simulations of annual surface air temperature (a, b; °C) and precipitation (c, d; mm d−1) anomalies in 49ka_shutdown (Heinrich stadial; left column) and 49ka_0.3Sv (D–O stadial; right column) simulations relative to 49ka_control with MIS3 proxy records indicated by stars taken from Menviel et al. (2020).
4.3 Robustness of the simulations
Our experimental setup was designed to assess the multi-centennial-scale impact of an AMOC shutdown and an AMOC slowdown on the climate system. The experiments were designed to obtain the AMOC slowdown and shutdown states with the smallest freshwater input. Although the input fluxes are idealized and significantly higher than current estimates (Zhou and McManus, 2024), the experimental design is consistent with the MIS3 protocol (Malmierca-Vallet et al., 2023), and similar to the recent North Atlantic Hosing Model Intercomparison Project (NaHOsMIP), in which 0.3 Sv is added in the North Atlantic for more than 100 model years to simulate the climate response to an AMOC shutdown in CMIP models (Ben-Yami et al., 2024; Diamond et al., 2025; Jackson et al., 2023). The difference in the input fluxes arises from the different sensitivity of AMOC to freshwater perturbations across models. In ACCESS-ESM1.5, the AMOC response to North Atlantic freshwater fluxes depends on both the magnitude and duration of the meltwater input (Du et al., 2025). In our experimental design, a pulse of 0.3 Sv for a few hundred years does not lead to an AMOC shutdown under 49 ka boundary conditions (Fig. 1). This highlights the issue of this model's sensitivity to freshwater forcing.
In this study, the 49ka_0.3Sv experiment is obtained from a two-step increase in freshwater input of 0.25 Sv for 100 model years followed by 0.3 Sv of 200 years after the 49ka_0.2Sv experiment. Nevertheless, this setup should not significantly affect the large-scale climate response given the length of the simulations performed here (500 years), nor should the exact location of the meltwater input in the subpolar North Atlantic, based on previous experiments with different North Atlantic meltwater input location, duration and magnitudes (Pontes and Menviel, 2024; Du et al., 2025; Saini et al., 2025a). Future studies should perform a thorough examination of the impact of meltwater input location on the climate response.
Lastly, this study uses the last 50 years of each hosing experiment to assess the climate responses. When using the 30-year running-mean values for the last 150 years in each experiment, the results are consistent with our 50-year average (Fig. S7). We note that only one model was used, and a future study could examine the linearity in multiple models.
4.4 Model-data comparison for D–O and HS
We now compare our model simulations with available proxy records for D–O and HS during MIS3 (Menviel et al., 2020), focusing on temperature and precipitation anomalies in 49ka_shutdown versus the 49ka_0.3Sv experiment (as representative of HS and D–O stadial respectively in Fig. 11). Our model simulation is generally consistent with these proxy records, as well as with the proxy benchmarks summarized by Izumi et al. (2023) in their Tables 1 and 3, with colder and drier conditions over the NH, a weakened NH summer monsoon, and stronger South American and South African monsoons. However, the monsoon responses from our simulations in the South American and South African domains are more complex (Fig. S8). Moreover, our simulated monsoon changes for HS5 (Fig. S8a) are consistent with proxy records indicating weaker Indian (Deplazes et a. 2013) and East Asian summer monsoons (Zhang et al., 2024), as well as southward displacement and strengthening of the IASM (Carolin et al., 2013; Ayliffe et al., 2013; Scroxton et al., 2022). Both D–O and HS simulations appear to be consistent with high-resolution proxy records of surface moisture from Australia in HS1, suggesting wetter conditions during North Atlantic cooling events (Denniston et al., 2013, 2017; Treble et al., 2017). In future work, we plan to compare our simulation of Heinrich and D–O stadials with HS5 records in more detail.
This study investigates the climate response to AMOC slowdown and AMOC shutdown under 49 ka glacial conditions, corresponding to the time of HS5. The simulation results are relatively consistent with proxy records for global temperature and precipitation changes, presenting a plausible insight into the SH and Australasian hydroclimate responses to AMOC weakening, through changes in the seasonal HC and atmospheric circulation. The linearity of the temperature and precipitation responses to the magnitude of AMOC decrease is explored. The NH is cooled by an average 3.8 °C in HS while most of the SH shows significant warming. In the AMOC shutdown experiment, a pronounced southward shift of the DJF ITCZ is simulated, associated with stronger DJF atmospheric compensation for the reduced NH ocean heat transport than in JJA. This asymmetric atmospheric response leads to a strengthened northern winter (DJF) HC and weakened southern wintertime (JJA) HC, influencing the seasonal climate response in the tropical and subtropical regions. Significantly increased precipitation is simulated over the entire Australian continent in summer (DJF) due to enhancement and southward expansion of the Indo-Australian summer monsoon and a southward shift of the STR, which allows tropical moisture to reach southern Australia in HS. However, this is not seen in the AMOC slowdown simulations representing D–O stadials, with an insignificant increase in precipitation in northern Australia and drier conditions to the south. This is due to the subdued response of HC strength and width. The JJA period is much drier over Australia in the HS simulation, possibly due to an intensification and southward migration of the SH westerly winds. This drying pattern is also observed in the D–O stadial simulations.
Our results suggest that the climate system responds linearly to a slowdown of the AMOC; but once the threshold of AMOC shutdown is crossed, a more complex atmospheric circulation and climate response emerges. We identify a possible threshold in the hosing strength between 0.3 and 0.4 Sv for triggering an AMOC shutdown in the ACCESS-ESM1.5 model, ultimately leading to the non-linear response of the climate system under glacial conditions. Although the background state is fundamentally different from present or future warming conditions, the amount of freshwater input required to trigger the non-linear response may be comparable, given that a freshwater input of 0.4 Sv is necessary to shut down the AMOC under both PI and Last Interglacial (127 ka) background conditions (Saini et al., 2025a). Nevertheless, given the variability and unprecedented nature of future climates, additional simulations across different background climate conditions, as well as multi-model comparisons under glacial conditions, are needed to provide more comprehensive insights.
The model outputs are available at https://doi.org/10.5061/dryad.tht76hff1 (Du et al., 2026).
The supplement related to this article is available online at https://doi.org/10.5194/cp-22-1105-2026-supplement.
YD, JRB, LM, and RND designed the study. YD performed the modelling simulations (model configuration from HS and DKH), conducted the analysis and wrote the manuscript with the input from JRB, LM, RND, DKH, and CNG provided comments on the manuscript.
At least one of the (co-)authors is a member of the editorial board of Climate of the Past. The peer-review process was guided by an independent editor, and the authors also have no other competing interests to declare.
Publisher's note: Copernicus Publications remains neutral with regard to jurisdictional claims made in the text, published maps, institutional affiliations, or any other geographical representation in this paper. The authors bear the ultimate responsibility for providing appropriate place names. Views expressed in the text are those of the authors and do not necessarily reflect the views of the publisher.
Yanxuan Du, Josephine R. Brown, Laurie Menviel, Himadri Saini, Russell N. Drysdale, and Calla N. Gould-Whaley acknowledge the funding from the Australian Research Council (ARC) (grant no. DP220102134). Josephine R. Brown received support from ARC Centre of Excellence for Weather of the 21st Century (grant no. CE230100012). Laurie Menviel acknowledges support from ARC (grant no. SR200100008). David K. Hutchinson acknowledges support from ARC (grant no. DE220100279). We also acknowledge Dr Shih-Yu Lee and Dr Marlene Klockmann for their thoughtful and constructive comments which greatly improved the manuscript. This research was supported by the Australian Government's National Collaborative Research Infrastructure Strategy (NCRIS), with access to computational resources provided by the National Computational Infrastructure (NCI) through the National Computational Merit Allocation Scheme as well as the UNSW allocation scheme 10.26190/PMN5-7J50. This research was supported by the Research Computing Services NCI Access scheme at The University of Melbourne. The authors thank CSIRO for developing the ACCESS-ESM1.5 model configuration and making it freely available to researchers. This research used the ACCESS-ESM1.5 model infrastructure provided by ACCESS-NRI, which is enabled by the Australian Government's National Collaborative Research Infrastructure Strategy (NCRIS).
This research has been supported by the Australian Research Council (grant no. DP220102134), the Australian Research Council (grant no. SR200100008), and the Australian Research Council (grant nos. DE220100279 and CE230100012).
This paper was edited by Marisa Montoya and reviewed by Marlene Klockmann and one anonymous referee.
Anderson, R. F., Ali, S., Bradtmiller, L. I., Nielsen, S. H. H., Fleisher, M. Q., Anderson, B. E., and Burckle, L. H.: Wind-Driven Upwelling in the Southern Ocean and the Deglacial Rise in Atmospheric CO2, Science, 323, 1443–1448, https://doi.org/10.1126/science.1167441, 2009.
Andrews, J. T. and Voelker, A. H. L.: “Heinrich events” (& sediments): A history of terminology and recommendations for future usage, Quaternary Sci. Rev., 187, 31–40, https://doi.org/10.1016/j.quascirev.2018.03.017, 2018.
Armstrong, E., Izumi, K., and Valdes, P.: Identifying the mechanisms of DO-scale oscillations in a GCM: a salt oscillator triggered by the Laurentide ice sheet, Clim. Dynam., 60, 3983–4001, https://doi.org/10.1007/s00382-022-06564-y, 2023.
Ayliffe, L., Gagan, M., Zhao, J., Drysdale, R. N., Hellstrom, J. C., Hantoro, W. S., Griffiths, M. L., Scott-Gagan, H., St Pierre, E., Cowley, J. A., and Suwargadi, B. W.: Rapid interhemispheric climate links via the Australasian monsoon during the last deglaciation, Nat. Commun., 4, 2908, https://doi.org/10.1038/ncomms3908, 2013.
Bard, E. and Rickaby, R. E. M.: Migration of the subtropical front as a modulator of glacial climate, Nature, 460, 380–383, https://doi.org/10.1038/nature08189, 2009.
Barker, S., Diz, P., Vautravers, M. J., Pike, J., Knorr, G., Hall, I. R., and Broecker, W. S.: Interhemispheric Atlantic seesaw response during the last deglaciation, Nature, 457, 1097–1102, https://doi.org/10.1038/nature07770, 2009.
Barker, S., Chen, J., Gong, X., Jonkers, L., Knorr, G., and Thornalley, D.: Icebergs not the trigger for North Atlantic cold events, Nature, 520, 333–336, https://doi.org/10.1038/nature14330, 2015.
Ben-Yami, M., Good, P., Jackson, L. C., Crucifix, M., Hu, A., Saenko, O., Swingedouw, D., and Boers, N.: Impacts of AMOC Collapse on Monsoon Rainfall: A Multi-Model Comparison, Earth's Future, 12, e2023EF003959, https://doi.org/10.1029/2023EF003959, 2024.
Berger, A.: Long-Term Variations of Daily Insolation and Quaternary Climatic Changes, J. Atmos. Sci., 35, 2362–2367, https://doi.org/10.1175/1520-0469(1978)035<2362:LTVODI>2.0.CO;2, 1978.
Bian, J. and Räisänen, J.: Mid-holocene changes in the global ITCZ: meridional structure and land–sea rainfall differences, Clim. Dynam., 62, 10683–10701, https://doi.org/10.1007/s00382-024-07470-1, 2024.
Bischoff, T. and Schneider, T.: Energetic Constraints on the Position of the Intertropical Convergence Zone, J. Climate, 27, 4937–4951, https://doi.org/10.1175/JCLI-D-13-00650.1, 2014.
Bond, G., Heinrich, H., Broecker, W., Labeyrie, L., McManus, J., Andrews, J., Huon, S., Jantschik, R., Clasen, S., Simet, C., Tedesco, K., Klas, M., Bonani, G., and Ivy, S.: Evidence for massive discharges of icebergs into the North Atlantic ocean during the last glacial period, Nature, 360, 245–249, https://doi.org/10.1038/360245a0, 1992.
Braconnot, P., Otto-Bliesner, B., Harrison, S., Joussaume, S., Peterchmitt, J.-Y., Abe-Ouchi, A., Crucifix, M., Driesschaert, E., Fichefet, Th., Hewitt, C. D., Kageyama, M., Kitoh, A., Loutre, M.-F., Marti, O., Merkel, U., Ramstein, G., Valdes, P., Weber, L., Yu, Y., and Zhao, Y.: Results of PMIP2 coupled simulations of the Mid-Holocene and Last Glacial Maximum – Part 2: feedbacks with emphasis on the location of the ITCZ and mid- and high latitudes heat budget, Clim. Past, 3, 279–296, https://doi.org/10.5194/cp-3-279-2007, 2007.
Broecker, W., Bond, G., Klas, M., Clark, E., and McManus, J.: Origin of the northern Atlantic's Heinrich events, Clim. Dynam., 6, 265–273, https://doi.org/10.1007/BF00193540, 1992.
Broecker, W. S.: Massive iceberg discharges as triggers for global climate change, Nature, 372, 421–424, https://doi.org/10.1038/372421a0, 1994.
Carolin, S., Cobb, K., Adkins, J., Clark, B., Conroy, J., Lejau, S., Malang, J., and Tuen, A.: Varied Response of Western Pacific Hydrology to Climate Forcings over the Last Glacial Period, Science, 340, https://doi.org/10.1126/science.1233797, 2013.
Campos, J. L. P. S., Cruz, F. W., Ambrizzi, T., Deininger, M., Vuille, M., Novello, V. F., and Strikis, N. M.: Coherent South American Monsoon variability during the last millennium revealed through high-resolution proxy records, Geophys. Res. Lett., 46, 8261–8270, https://doi.org/10.1029/2019GL082513, 2019.
Cheng, H., Sinha, A., Wang, X., Cruz, F. W., and Edwards, R. L.: The Global Paleomonsoon as seen through speleothem records from Asia and the Americas, Clim. Dynam., 39, 1045–1062, https://doi.org/10.1007/s00382-012-1363-7, 2012.
Cheng, W., Bitz, C. M., and Chiang, J. C. H.: Adjustment of the global climate to an abrupt slowdown of the Atlantic meridional overturning circulation, in: Geophysical Monograph Series, edited by: Schmittner, A., Chiang, J. C. H., and Hemming, S. R., American Geophysical Union, Washington, D. C., 173, 295–313, https://doi.org/10.1029/173GM19, 2007.
Chiang, J. C. H. and Friedman, A. R.: Extratropical Cooling, Interhemispheric Thermal Gradients, and Tropical Climate Change, Annu. Rev. Earth Planet. Sci., 40, 383–412, https://doi.org/10.1146/annurev-earth-042711-105545, 2012.
Chiang, J. C. H., Lee, S.-Y., Putnam, A. E., and Wang, X.: South Pacific Split Jet, ITCZ shifts, and atmospheric North–South linkages during abrupt climate changes of the last glacial period, Earth Planet. Sc. Lett., 406, 233–246, https://doi.org/10.1016/j.epsl.2014.09.012, 2014.
Corrick, E. C., Drysdale, R. N., Hellstrom, J. C., Capron, E., Rasmussen, S. O., Zhang, X., Fleitmann, D., Couchoud, I., and Wolff, E.: Synchronous timing of abrupt climate changes during the last glacial period, Science, 369, 963–969, https://doi.org/10.1126/science.aay5538, 2020.
Dansgaard, W., Johnsen, S. J., Clausen, H. B., Dahl-Jensen, D., Gundestrup, N. S., Hammer, C. U., Hvidberg, C. S., Steffensen, J. P., Sveinbjörnsdottir, A. E., Jouzel, J., and Bond, G.: Evidence for general instability of past climate from a 250-kyr ice-core record, Nature, 364, 218–220, https://doi.org/10.1038/364218a0, 1993.
Denniston, R. F., Wyrwoll, K.-H., Asmerom, Y., Polyak, V. J., Humphreys, W. F., Cugley, J., Woods, D., LaPointe, Z., Peota, J., and Greaves, E.: North Atlantic forcing of millennial-scale Indo-Australian monsoon dynamics during the Last Glacial period, Quaternary Sci. Rev., 72, 159–168, https://doi.org/10.1016/j.quascirev.2013.04.012, 2013.
Denniston, R. F., Asmerom, Y., Polyak, V. J., Wanamaker, A. D., Ummenhofer, C. C., Humphreys, W. F., Cugley, J., Woods, D., and Lucker, S.: Decoupling of monsoon activity across the northern and southern Indo-Pacific during the Late Glacial, Quaternary Sci. Rev., 176, 101–105, https://doi.org/10.1016/j.quascirev.2017.09.014, 2017.
Deplazes, G., Lückge, A., Peterson, L. C., Timmermann, A., Hamann, Y., Hughen, K. A., Röhl, U., Laj, C., Cane, M. A., Sigman, D. M., and Haug, G. H.: Links between tropical rainfall and North Atlantic climate during the last glacial period, Nat. Geosci., 6, 213–217, https://doi.org/10.1038/ngeo1712, 2013.
Diamond, R., Sime, L. C., Schroeder, D., Jackson, L. C., Holland, P. R., De Asenjo, E. A., Bellomo, K., Danabasoglu, G., Hu, A., Jungclaus, J., Montoya, M., Meccia, V. L., Saenko, O. A., and Swingedouw, D.: A Weakened AMOC Could Cause Southern Ocean Temperature and Sea-Ice Change on Multidecadal Timescales, J. Geophys. Res.-Oceans, 130, e2024JC022027, https://doi.org/10.1029/2024JC022027, 2025.
Du, Y., Brown, J. R., and Sniderman, J. M. K.: Last Glacial Maximum climate and atmospheric circulation over the Australian region from climate models, Clim. Past, 20, 393–413, https://doi.org/10.5194/cp-20-393-2024, 2024.
Du, Y., Brown, J. R., Menviel, L., Saini, H., and Drysdale, R. N.: The Impacts of an AMOC Slowdown on Southern Hemisphere and Australian Climates at 8.2 ka in ACCESS-ESM1.5 Model, J. Geophys. Res.-Atmos., 130, e2024JD042432, https://doi.org/10.1029/2024JD042432, 2025.
Du, Y., Brown, J. R., Menviel, L., Saini, H., Drysdale, R. N., Hutchinson, D. K., and Gould-Whaley, C. N.: Data from: Non-linear climatic response to the weakening of the Atlantic Meridional overturning circulation during glacial times, Dryad [data set], https://doi.org/10.5061/dryad.tht76hff1, 2026.
EPICA Community Members: One-to-one coupling of glacial climate variability in Greenland and Antarctica, Nature, 444, 195–198, https://doi.org/10.1038/nature05301, 2006.
Frierson, D. M. W., Lu, J., and Chen, G.: Width of the Hadley cell in simple and comprehensive general circulation models, Geophys. Res. Lett., 34, 2007GL031115, https://doi.org/10.1029/2007GL031115, 2007.
Frierson, D. M. W., Hwang, Y.-T., Fučkar, N. S., Seager, R., Kang, S. M., Donohoe, A., Maroon, E. A., Liu, X., and Battisti, D. S.: Contribution of ocean overturning circulation to tropical rainfall peak in the Northern Hemisphere, Nat. Geosci., 6, 940–944, https://doi.org/10.1038/ngeo1987, 2013.
Gowan, E. J., Zhang, X., Khosravi, S., Rovere, A., Stocchi, P., Hughes, A. L. C., Gyllencreutz, R., Mangerud, J., Svendsen, J.-I., and Lohmann, G.: A new global ice sheet reconstruction for the past 80 000 years, Nat. Commun., 12, https://doi.org/10.1038/s41467-021-21469-w, 2021.
Griffies, S. M.: Elements of MOM5, GFDL Ocean Group Technology, Rep. No. 7. NOAA/Geophysical Fluid Dynamics Laboratory, 2012.
Grose, M., Timbal, B., Wilson, L., Bathols, J., and Kent, D.: The subtropical ridge in CMIP5 models, and implications for projections of rainfall in southeast Australia, Aust. Meteorol. Ocean., 65, 90–106, https://doi.org/10.22499/2.6501.007, 2015.
Grose, M. R., Narsey, S., Delage, F. P., Dowdy, A. J., Bador, M., Boschat, G., Chung, C., Kajtar, J. B., Rauniyar, S., Freund, M. B., Lyu, K., Rashid, H., Zhang, X., Wales, S., Trenham, C., Holbrook, N. J., Cowan, T., Alexander, L., Arblaster, J. M., and Power, S.: Insights From CMIP6 for Australia’s Future Climate, Earth's future, 8, e2019EF001469, https://doi.org/10.1029/2019EF001469, 2020.
Guo, C., Nisancioglu, K. H., Bentsen, M., Bethke, I., and Zhang, Z.: Equilibrium simulations of Marine Isotope Stage 3 climate, Clim. Past, 15, 1133–1151, https://doi.org/10.5194/cp-15-1133-2019, 2019.
Heinrich, H.: Origin and Consequences of Cyclic Ice Rafting in the Northeast Atlantic Ocean During the Past 130,000 Years, Quaternary Res., 29, 142–152, https://doi.org/10.1016/0033-5894(88)90057-9, 1988.
Henry, L. G., McManus, J. F., Curry, W. B., Roberts, N. L., Piotrowski, A. M., and Keigwin, L. D.: North Atlantic ocean circulation and abrupt climate change during the last glaciation, Science, 353, 470–474, https://doi.org/10.1126/science.aaf5529, 2016.
Hodell, D. A., Nicholl, J. A., Bontognali, T. R. R., Danino, S., Dorador, J., Dowdeswell, J. A., Einsle, J., Kuhlmann, H., Martrat, B., Mleneck-Vautravers, M. J., Rodríguez-Tovar, F. J., and Röhl, U.: Anatomy of Heinrich Layer 1 and its role in the last deglaciation: HEINRICH EVENT 1, Paleoceanography, 32, 284–303, https://doi.org/10.1002/2016PA003028, 2017.
Hunke, E. C. and Lipscomb, W. H.: CICE: The Los Alamos sea ice model documentation and software user’s manual, Version 4.1, LACC06‐012, Los Alamos National Laboratory, 2010.
Izumi, K., Armstrong, E., and Valdes, P.: Global footprints of dansgaard-oeschger oscillations in a GCM, Quaternary Sci. Rev., 305, 108016, https://doi.org/10.1016/j.quascirev.2023.108016, 2023.
Jackson, L. C., Kahana, R., Graham, T., Ringer, M. A., Woollings, T., Mecking, J. V., and Wood, R. A.: Global and European climate impacts of a slowdown of the AMOC in a high resolution GCM, Clim. Dynam., 45, 3299–3316, https://doi.org/10.1007/s00382-015-2540-2, 2015.
Jackson, L. C., Alastrué de Asenjo, E., Bellomo, K., Danabasoglu, G., Haak, H., Hu, A., Jungclaus, J., Lee, W., Meccia, V. L., Saenko, O., Shao, A., and Swingedouw, D.: Understanding AMOC stability: the North Atlantic Hosing Model Intercomparison Project, Geosci. Model Dev., 16, 1975–1995, https://doi.org/10.5194/gmd-16-1975-2023, 2023.
Kageyama, M., Merkel, U., Otto-Bliesner, B., Prange, M., Abe-Ouchi, A., Lohmann, G., Ohgaito, R., Roche, D. M., Singarayer, J., Swingedouw, D., and Zhang, X.: Climatic impacts of fresh water hosing under Last Glacial Maximum conditions: a multi-model study, Clim. Past, 9, 935–953, https://doi.org/10.5194/cp-9-935-2013, 2013.
Kang, S. M., Held, I. M., Frierson, D. M. W., and Zhao, M.: The Response of the ITCZ to Extratropical Thermal Forcing: Idealized Slab-Ocean Experiments with a GCM, J. Climate, 21, 3521–3532, https://doi.org/10.1175/2007JCLI2146.1, 2008.
Kindler, P., Guillevic, M., Baumgartner, M., Schwander, J., Landais, A., and Leuenberger, M.: Temperature reconstruction from 10 to 120 kyr b2k from the NGRIP ice core, Clim. Past, 10, 887–902, https://doi.org/10.5194/cp-10-887-2014, 2014.
Köhler, P., Nehrbass-Ahles, C., Schmitt, J., Stocker, T. F., and Fischer, H.: A 156 kyr smoothed history of the atmospheric greenhouse gases CO2, CH4, and N2O and their radiative forcing, Earth Syst. Sci. Data, 9, 363–387, https://doi.org/10.5194/essd-9-363-2017, 2017.
Kowalczyk, E., Stevens, L., Law, R., Dix, M., Wang, Y., Harman, I., Haynes, K., Srbinovsky, J., Pak, B., and Ziehn, T.: The land surface model component of ACCESS: description and impact on the simulated surface climatology, Aust. Meteorol. Ocean., 63, 65–82, https://doi.org/10.22499/2.6301.005, 2013.
Lee, S., Chiang, J. C. H., Matsumoto, K., and Tokos, K. S.: Southern Ocean wind response to North Atlantic cooling and the rise in atmospheric CO2: Modeling perspective and paleoceanographic implications, Paleoceanography, 26, 2010PA002004, https://doi.org/10.1029/2010PA002004, 2011.
Lionello, P., D'Agostino, R., Ferreira, D., Nguyen, H., and Singh, M. S.: The Hadley circulation in a changing climate, Ann. NY Acad. Sci., 1534, 69–93, https://doi.org/10.1111/nyas.15114, 2024.
Lynch-Stieglitz, J.: The Atlantic Meridional Overturning Circulation and Abrupt Climate Change, Annu. Rev. Mar. Sci., 9, 83–104, https://doi.org/10.1146/annurev-marine-010816-060415, 2017.
Malmierca-Vallet, I., Sime, L. C., and the D–O community members: Dansgaard–Oeschger events in climate models: review and baseline Marine Isotope Stage 3 (MIS3) protocol, Clim. Past, 19, 915–942, https://doi.org/10.5194/cp-19-915-2023, 2023.
Martin, G. M., Milton, S. F., Senior, C. A., Brooks, M. E., Ineson, S., Reichler, T., and Kim, J.: Analysis and Reduction of Systematic Errors through a Seamless Approach to Modeling Weather and Climate, J. Climate, 23, 5933–5957, https://doi.org/10.1175/2010JCLI3541.1, 2010.
Martrat, B., Grimalt, J. O., Shackleton, N. J., De Abreu, L., Hutterli, M. A., and Stocker, T. F.: Four Climate Cycles of Recurring Deep and Surface Water Destabilizations on the Iberian Margin, Science, 317, 502–507, https://doi.org/10.1126/science.1139994, 2007.
McGee, D., Donohoe, A., Marshall, J., and Ferreira, D.: Changes in ITCZ location and cross-equatorial heat transport at the Last Glacial Maximum, Heinrich Stadial 1, and the mid-Holocene, Earth Planet. Sc. Lett., 390, 69–79, https://doi.org/10.1016/j.epsl.2013.12.043, 2014.
Menviel, L., Timmermann, A., Mouchet, A., and Timm, O.: Climate and marine carbon cycle response to changes in the strength of the Southern Hemispheric westerlies, Paleoceanography, 23, https://doi.org/10.1029/2008PA001604, 2008.
Menviel, L., England, M. H., Meissner, K. J., Mouchet, A., and Yu, J.: Atlantic-Pacific seesaw and its role in outgassing CO 2 during Heinrich events: Heinrich CO 2, Paleoceanography, 29, 58–70, https://doi.org/10.1002/2013PA002542, 2014a.
Menviel, L., Timmermann, A., Friedrich, T., and England, M. H.: Hindcasting the continuum of Dansgaard–Oeschger variability: mechanisms, patterns and timing, Clim. Past, 10, 63–77, https://doi.org/10.5194/cp-10-63-2014, 2014b.
Menviel, L. C., Skinner, L. C., Tarasov, L., and Tzedakis, P. C.: An ice–climate oscillatory framework for Dansgaard–Oeschger cycles, Nat. Rev. Earth Environ., 1, 677–693, https://doi.org/10.1038/s43017-020-00106-y, 2020.
Nguyen, H., Evans, A., Lucas, C., Smith, I., and Timbal, B.: The Hadley Circulation in Reanalyses: Climatology, Variability, and Change, J. Climate, 26, 3357–3376, https://doi.org/10.1175/JCLI-D-12-00224.1, 2013.
Niu, L., Knorr, G., Ackermann, L., Krebs-Kanzow, U., and Lohmann, G.: Eurasian ice sheet formation promoted by weak AMOC following MIS 3, NPJ Clim. Atmos. Sci., 8, 85, https://doi.org/10.1038/s41612-025-00982-5, 2025.
Orihuela-Pinto, B., England, M. H., and Taschetto, A. S.: Interbasin and interhemispheric impacts of a collapsed Atlantic Overturning Circulation, Nat. Clim. Chang., 12, 558–565, https://doi.org/10.1038/s41558-022-01380-y, 2022.
Pedro, J. B., Jochum, M., Buizert, C., He, F., Barker, S., and Rasmussen, S. O.: Beyond the bipolar seesaw: Toward a process understanding of interhemispheric coupling, Quaternary Sci. Rev., 192, 27–46, https://doi.org/10.1016/j.quascirev.2018.05.005, 2018.
Pepler, A., Ashcroft, L., and Trewin, B.: The relationship between the subtropical ridge and Australian temperatures, J. South. Hemisph. Earth Syst. Sci., 68, 201–214, https://doi.org/10.22499/3.6801.011, 2018.
Pontes, G. M. and Menviel, L.: Weakening of the Atlantic Meridional Overturning Circulation driven by subarctic freshening since the mid-twentieth century, Nat. Geosci., https://doi.org/10.1038/s41561-024-01568-1, 2024.
Saini, H., Meissner, K. J., Menviel, L., and Kvale, K.: Transient Response of Southern Ocean Ecosystems During Heinrich Stadials, Paleoceanography and Paleoclimatology, 39, e2023PA004754, https://doi.org/10.1029/2023PA004754, 2024.
Saini, H., Pontes, G., Brown, J. R., Drysdale, R. N., Du, Y., and Menviel, L.: Australasian Hydroclimate Response to the Collapse of the Atlantic Meridional Overturning Circulation Under Pre-Industrial and Last Interglacial Climates, Paleoceanography and Paleoclimatology, 40, e2024PA004967, https://doi.org/10.1029/2024PA004967, 2025a.
Saini, H., Hutchinson, D. K., Brown, J. R., Drysdale, R. N., Du, Y., and Menviel, L.: The Influence of Glacial Northern Hemisphere Ice Sheets On Atmospheric Circulation, EGUsphere [preprint], https://doi.org/10.5194/egusphere-2025-1990, 2025b.
Sanchez Goñi, M. F. and Harrison, S. P.: Millennial-scale climate variability and vegetation changes during the Last Glacial: Concepts and terminology, Quaternary Sci. Rev., 29, 2823–2827, https://doi.org/10.1016/j.quascirev.2009.11.014, 2010.
Scroxton, N., Gagan, M. K., Ayliffe, L. K., Hantoro, W. S., Hellstrom, J. C., Cheng, H., Edwards, R. L., Zhao, J. X., Suwargadi, B., and Rifai, H.: Antiphase response of the Indonesian–Australian monsoon to millennial-scale events of the last glacial period., Sci. Rep., 12, 20214, https://doi.org/10.1038/s41598-022-21843-8, 2022.
Seo, K., Frierson, D. M. W., and Son, J.: A mechanism for future changes in Hadley circulation strength in CMIP5 climate change simulations, Geophys. Res. Lett., 41, 5251–5258, https://doi.org/10.1002/2014GL060868, 2014.
Shakun, J. D., Lea, D. W., Lisiecki, L. E., and Raymo, M. E.: An 800-kyr record of global surface ocean δ 18 O and implications for ice volume-temperature coupling, Earth Planet. Sc. Lett., 426, 58–68, https://doi.org/10.1016/j.epsl.2015.05.042, 2015.
Stocker, T. F. and Johnsen, S. J.: A minimum thermodynamic model for the bipolar seesaw, Paleoceanography, 18, https://doi.org/10.1029/2003PA000920, 2003.
Stouffer, R. J., Yin, J., Gregory, J. M., Dixon, K. W., Spelman, M. J., Hurlin, W., Weaver, A. J., Eby, M., Flato, G. M., Hasumi, H., Hu, A., Jungclaus, J. H., Kamenkovich, I. V., Levermann, A., Montoya, M., Murakami, S., Nawrath, S., Oka, A., Peltier, W. R., Robitaille, D. Y., Sokolov, A., Vettoretti, G., and Weber, S. L.: Investigating the Causes of the Response of the Thermohaline Circulation to Past and Future Climate Changes, J. Climate, 19, 1365–1387, https://doi.org/10.1175/JCLI3689.1, 2006.
Svensson, A., Andersen, K. K., Bigler, M., Clausen, H. B., Dahl-Jensen, D., Davies, S. M., Johnsen, S. J., Muscheler, R., Parrenin, F., Rasmussen, S. O., Röthlisberger, R., Seierstad, I., Steffensen, J. P., and Vinther, B. M.: A 60 000 year Greenland stratigraphic ice core chronology, Clim. Past, 4, 47–57, https://doi.org/10.5194/cp-4-47-2008, 2008.
The HadGEM2 Development Team: G. M. Martin, Bellouin, N., Collins, W. J., Culverwell, I. D., Halloran, P. R., Hardiman, S. C., Hinton, T. J., Jones, C. D., McDonald, R. E., McLaren, A. J., O'Connor, F. M., Roberts, M. J., Rodriguez, J. M., Woodward, S., Best, M. J., Brooks, M. E., Brown, A. R., Butchart, N., Dearden, C., Derbyshire, S. H., Dharssi, I., Doutriaux-Boucher, M., Edwards, J. M., Falloon, P. D., Gedney, N., Gray, L. J., Hewitt, H. T., Hobson, M., Huddleston, M. R., Hughes, J., Ineson, S., Ingram, W. J., James, P. M., Johns, T. C., Johnson, C. E., Jones, A., Jones, C. P., Joshi, M. M., Keen, A. B., Liddicoat, S., Lock, A. P., Maidens, A. V., Manners, J. C., Milton, S. F., Rae, J. G. L., Ridley, J. K., Sellar, A., Senior, C. A., Totterdell, I. J., Verhoef, A., Vidale, P. L., and Wiltshire, A.: The HadGEM2 family of Met Office Unified Model climate configurations, Geosci. Model Dev., 4, 723–757, https://doi.org/10.5194/gmd-4-723-2011, 2011.
Timmermann, A., Okumura, Y., An, S.-I., Clement, A., Dong, B., Guilyardi, E., Hu, A., Jungclaus, J. H., Renold, M., Stocker, T. F., Stouffer, R. J., Sutton, R., Xie, S.-P., and Yin, J.: The Influence of a Weakening of the Atlantic Meridional Overturning Circulation on ENSO, J. Climate, 20, 4899–4919, https://doi.org/10.1175/jcli4283.1, 2007.
Treble, P. C., Baker, A., Ayliffe, L. K., Cohen, T. J., Hellstrom, J. C., Gagan, M. K., Frisia, S., Drysdale, R. N., Griffiths, A. D., and Borsato, A.: Hydroclimate of the Last Glacial Maximum and deglaciation in southern Australia's arid margin interpreted from speleothem records (23–15 ka), Clim. Past, 13, 667–687, https://doi.org/10.5194/cp-13-667-2017, 2017.
WAIS Divide Project Members: Precise interpolar phasing of abrupt climate change during the last ice age, Nature, 520, 661–665, https://doi.org/10.1038/nature14401, 2015.
Wang, B., Kim, H.-J., Kikuchi, K., and Kitoh, A.: Diagnostic metrics for evaluation of annual and diurnal cycles, Clim. Dynam., 37, 941–955, https://doi.org/10.1007/s00382-010-0877-0, 2011.
Wang, X., Auler, A., Edwards, R., Cheng, H., Ito, E., Wang, Y., Kong, X., and Solheid, M.: Millennial-scale precipitation changes in southern Brazil over the past 90,000 years, Geophys. Res. Lett., 34, https://doi.org/10.1029/2007GL031149, 2007.
Wang, Y., Cheng, H., Edwards, R. L., Kong, X., Shao, X., Chen, S., Wu, J., Jiang, X., Wang, X., and An, Z.: Millennial- and orbital-scale changes in the East Asian monsoon over the past 224,000 years, Nature, 451, 1090–1093, 2008.
Weijer, W., Cheng, W., Garuba, O. A., Hu, A., and Nadiga, B. T.: CMIP6 Models Predict Significant 21st Century Decline of the Atlantic Meridional Overturning Circulation, Geophys. Res. Lett., 47, e2019GL086075, https://doi.org/10.1029/2019GL086075, 2020.
Wendt, K. A., Nehrbass-Ahles, C., Niezgoda, K., Noone, D., Kalk, M., Menviel, L., Gottschalk, J., Rae, J. W. B., Schmitt, J., Fischer, H., Stocker, T. F., Muglia, J., Ferreira, D., Marcott, S. A., Brook, E., and Buizert, C.: Southern Ocean drives multidecadal atmospheric CO 2 rise during Heinrich Stadials, Proc. Natl. Acad. Sci. USA, 121, https://doi.org/10.1073/pnas.2319652121, 2024.
Whittaker, T. E., Hendy, C. H., and Hellstrom, J. C.: Abrupt millennial-scale changes in intensity of Southern Hemisphere westerly winds during marine isotope stages 2–4, Geology, 39, 455–458, https://doi.org/10.1130/G31827.1, 2011.
Xue, Y.-X., Wu, Y., Chen, C.-J., Li, J.-Y., Cheng, H., Shen, C.-C., Zhang, J., and Li, T.-Y.: Evolution of the Asian summer monsoon during the Heinrich events 1–6, Global Planet. Change, 245, 104680, https://doi.org/10.1016/j.gloplacha.2024.104680, 2025.
Yeung, N. K.-H., Menviel, L., Meissner, K. J., Taschetto, A. S., Ziehn, T., and Chamberlain, M.: Land–sea temperature contrasts at the Last Interglacial and their impact on the hydrological cycle, Clim. Past, 17, 869–885, https://doi.org/10.5194/cp-17-869-2021, 2021.
Zhang, R. and Delworth, T. L.: Simulated Tropical Response to a Substantial Weakening of the Atlantic Thermohaline Circulation, J. Climate, 18, 1853–1860, https://doi.org/10.1175/JCLI3460.1, 2005.
Zhang, W., Qiu, W., Jiang, X., Cai, B., and Shen, C.-C.: East Asian summer monsoon evolution during Heinrich Stadial 5, Palaeogeogr. Palaeoclimatol. Palaeoecol., 654, https://doi.org/10.1016/j.palaeo.2024.112467, 2024.
Zhang, X. and Prange, M.: Stability of the Atlantic overturning circulation under intermediate (MIS3) and full glacial (LGM) conditions and its relationship with Dansgaard-Oeschger climate variability, Quaternary Sci. Rev., 242, 106443, https://doi.org/10.1016/j.quascirev.2020.106443, 2020.
Zhang, X., Barker, S., Knorr, G., Lohmann, G., Drysdale, R., Sun, Y., Hodell, D., and Chen, F.: Direct astronomical influence on abrupt climate variability, Nat. Geosci., 14, 819–826, https://doi.org/10.1038/s41561-021-00846-6, 2021.
Zhang, X., Prange, M., Ma, L. B., and Liu, J.: Nonlinear Response of Global Monsoon Precipitation to Atlantic Overturning Strength Variations During Marine Isotope Stage 3, J. Geophys. Res.-Atmos., 128, https://doi.org/10.1029/2023jd038521, 2023.
Zhou, Y. and McManus, J. F.: Heinrich event ice discharge and the fate of the Atlantic Meridional Overturning Circulation, Science, 384, 983–986, https://doi.org/10.1126/science.adh8369, 2024.
Ziehn, T., Chamberlain, M. A., Law, R. M., Lenton, A., Bodman, R. W., Dix, M., Stevens, L., Wang, Y.-P., and Srbinovsky, J.: The Australian Earth System Model: ACCESS-ESM1.5, J. South. Hemisph. Earth Syst. Sci., 70, 193–214, https://doi.org/10.1071/ES19035, 2020.