the Creative Commons Attribution 4.0 License.
the Creative Commons Attribution 4.0 License.
 | 22 May 2026
A multimillennial Alpine ice core chronology synchronized with an accurately dated Arctic Pb record
Paolo Gabrielli
Michele Bertó
Giuliano Dreossi
Daniela Festi
Werner Kofler
Mai Winstrup
Klaus Oeggl
Margit Schwikowski
Barbara Stenni
A low-latitude, high-altitude Alpine ice core record was obtained in 2011 from the glacier Alto dell'Ortles (3859 m, Eastern Alps, Italy). A preliminary timescale (TC2016) based on absolute time markers such as a peak in 3H activity, from 210Pb dating, and 14C dating of carbonaceous particles and organic remains provided evidence of one of the oldest Alpine ice core records, extending back to the last Northern Hemisphere Climatic Optimum and spanning the last ∼ 7000 years. Here we present additional time markers that corroborate the multimillennial nature of the Alto dell'Ortles ice cores and significantly reduce the uncertainty of the chronology. First, 14C dating of an additional organic fragment (a charred spruce needle) discovered next to the basal ice provided an age (232 ± 126 BCE) which agrees with previous 14C dates in the oldest part of the record. Second, novel seasonally resolved pollen records from the upper firn/ice portion of the Alto dell'Ortles cores were combined with δ18O and dust annual variations to refine the dating for the 20th century by means of an automatic algorithm (Straticounter; between 1927 and 2011 CE) and visual counting (from 1900 to 1926 CE). The new and previous time markers were combined into a revised intermediate timescale (CP2025/1) by fitting with Markov chain Monte Carlo simulation (COPRA model). CP2025/1 then served as the basis for temporal synchronization of a novel Pb concentration record obtained from the Alto dell'Ortles cores to a well-dated (±5 years) Pb record from an array of Arctic ice cores (AN), with synchronisation performed for the period from 175 BCE to 1755 CE. Possible ties for matching the two Pb records were thereby constrained by the requirement that resulting age shifts remained within the range of overlap between the 1–2σ dating uncertainty of CP2025/1 and the uncertainty estimates of the selected tie-points (1–2σ, in the ancient part; 1σ, in the recent part). The correlation obtained after synchronization is 0.44 (Pearson's r, p < 0.001), demonstrating that these two distant atmospheric Pb records share a large portion of their variability back to 200 BCE. Most importantly for this study, the synchronization resulted in a further refined, final timescale with a strongly reduced dating uncertainty (CP2025/2). Investigation of CP2025/2 using a simple 1-D ice flow model suggests that non-steady-state conditions, particularly changes in net accumulation rates, must be considered to fully explain the obtained age-depth relationship. The new Alto dell'Ortles CP2025/2 chronology of improved accuracy and precision will allow to constrain Central European Holocene climatic and environmental histories emerging from this high-altitude glacial archive. The novel combination of methodologies used may also be adopted to build, or improve, the chronologies of other ice cores extracted from low-latitude/high-altitude glaciers which typically suffer from larger dating uncertainties when compared to well-dated polar records.
- Article
(6826 KB) - Full-text XML
-
Supplement
(2775 KB) - BibTeX
- EndNote


Ice cores extracted from polar regions and high-altitude/low-latitudes glaciers are archives of past climatic-environmental histories as they record physical, chemical and biological characteristics of the past atmosphere. To interpretate this information, it is of fundamental importance to link the englacial depth of the various ice sections to the timing of the original snow deposition. This provides a function that is commonly known as chronology.
Counting annual layers, establishing time markers (e.g. volcanic horizons, 10Be, 3H peaks etc.), synchronizing with other dated paleo-records, and developing ice flow models are widely used methods to precisely and accurately date ice cores from polar regions (Parrenin et al., 2007; Svensson et al., 2020), where the negligible/slow horizontal flow at the drilling sites and the largely below freezing englacial temperatures allow a full physical-chemical preservation of the ice stratigraphy and the time markers embedded within the accumulated snow layers. In contrast, dating ice layers from high-altitude/low-latitude glaciers is more challenging because of: (i) their smaller ice thicknesses, implying that counting annual layers is usually limited to the upper 50 to 100 m (typically covering only a few centuries) (Schwikowski et al., 2014); (ii) a larger horizontal flow at the drilling sites that can quickly alter/disrupt the original ice stratigraphy (Thompson et al., 2000), and; (iii) increasingly widespread post depositional processes that are linked to modern warmer air temperature and summer meltwater percolation which can overprint (or prevent the full conservation of) the time markers embedded in the glaciers (Gabrielli et al., 2010).
In 2011 we extracted four 60–75 m long ice cores located within 10 m from each other from the Alto dell'Ortles glacier (3859 m), near the summit of Mt. Ortles (3905 m) in the Eastern Alps, Italy. By using the three ∼ 75 m longest cores (from now on cores #1, #2 and #3; with core #4 of only ∼ 60 m being archived for future analyses) we demonstrated that the upper firn portion of the Alto dell'Ortles glacier was temperate, with intense summer meltwater percolation that possibly affected this drilling site since the 1980s. However, the underlying ice was cold (−2.8 °C near the bedrock) (Gabrielli et al., 2012) which preserved stratigraphy that was thousands of years old (Gabrielli et al., 2016). Our discovery of millennial-age ice in the Eastern Alps was corroborated by another ice core record extracted from the nearby drilling site of Weißseespitze (3500 m, Austria) where 14C dating above the basal ice resulted in an age of 5.9 ± 0.7 kyr cal BP (Bohleber et al., 2020). Together these two studies expand findings from the Western Alps, where even older bottom ice was discovered at Colle Gnifetti (14C date of > 15 kyr cal BP; Jenk et al., 2009) and at Dôme du Goûter (9.4 ± 0.4 kyr cal BP, with ice below estimated to be at least 12 kyr; Legrand et al., 2025), to the Eastern sector of the Alps.
In order to develop an initial chronology, we previously identified well-defined 3H and beta activity peaks at 41 m depth from atmospheric thermonuclear testing attributed to 1963 and used the activity of 210Pb to date the Alto dell'Ortles cores to 59 m depth (∼ 1930 CE) (Gabrielli et al., 2016). In addition, determination of a 14C age of a larch needle embedded near the basal ice, along with 14C dating of several ice samples (using the water insoluble organic carbon fraction entrapped; WIOC-14; Uglietti et al., 2016; Jenk et al., 2009; Hoffmann et al., 2018) allowed us to obtain absolute time markers from the deepest ice, the age of which was calculated to date back to ∼ 7000 years. All the age constraints obtained were used to build an initial chronology (TC2016 from now on) by means of Markov chain Monte Carlo simulation (COPRA model; Breitenbach et al., 2012), which also provided time uncertainty as a function of depth from a few years in the upper modern firn layers to ±500 years in the deepest portion of this ice core (Gabrielli et al., 2016).
A large uncertainty in TC2016 not only exists for the basal layers of the ice core but also at intermediate depths (60–72 m), dated between 1900 and 200 CE (e.g., ∼ ±50 years at 1850 CE, ∼ ±100 at 1650 CE and ∼ ±400 at 500 CE). The relative time uncertainty of the intermediate portion of the record (50 %–70 %) was higher than both for the modern (1900–2011 CE, 5 %–25 % uncertainty) and the oldest (200 CE–5000 BCE; 10 %–30 % uncertainty) sections. The large uncertainty of this intermediate section essentially arises from (i) a lack of time markers such as volcanic horizons; and (ii) the availability of only two WIOC 14C ages (1355 ± 205 and 429 ± 286 CE) above 72 m depth, with the younger of them characterized by a relatively large uncertainty due to the limits of the applied 14C method for ages of less than 500 years (combination of increased analytical uncertainty for small samples and the relative flatness of the atmospheric 14C calibration curve during this period; Uglietti et al., 2016). Altogether, the large absolute and relative uncertainty posed questions on the suitability of TC2016 for the reconstruction of meaningful climatic and environmental histories of the Alps and Central Europe from these cores.
Here we report additional stratigraphic/time markers, which, while confirming TC2016 within its uncertainty, allow its improvement. Therefore, using the same approach as used for TC2016, a first intermediate timescale was built, in the following named CP2025/1, which already gaining from an improved depth alignment of the three Alto dell'Ortles cores used (by an increased number of tie points obtained from the δ18O records, and newly available Pb records), as well as from new, additional age constraints from: (1) 14C dating of an additional organic fragment (charred spruce needle; 232 ± 126 BCE) discovered near the bottom ice (72.82 m) in core #1; and (2) the automated counting of annual layers with Straticounter (Winstrup et al., 2012; Winstrup, 2016) based on pollen, δ18O and dust records from core #1 from 2011 to 1927 CE (51 m depth in core #1) and visual counting from 1926 to 1900 CE (57 m depth in core #1). To further refine the chronology, the CP2025/1 timescale then served as the basis to apply a temporal synchronization between the high resolution non-crustal Pb concentration (ncPb) record from core #3 with a well-dated (±5 years) Arctic record (McConnell et al., 2019) for the period from 1755 CE back to 175 BCE. Thereby, allowed shifts in age were constrained by the requirement to be consistent within the CP2025/1 dating uncertainty, largely defined by the absolute dating (i.e., the calibrated 14C age probability range). Last, for a model based assessment and discussion, the finally derived, empirical chronology CP2025/2, of improved accuracy and precision, was compared to results from the Dansgaard-Johnsen ice flow model (Dansgaard and Johnsen, 1969) applied to the Alto dell'Ortles drilling site.
The first step to develop a more accurate chronology was to revise the previously published (Gabrielli et al., 2016) common depth scale for the three Alto dell'Ortles cores, using core #2 for depth reference as we did for TC2016 (see Sect. S1 in the Supplement). Depth realignments of core #2 with cores #1 and #3 were performed in two steps using the Analyseries 2.0.8 software (Paillard et al., 1996). First, the δ18O records were more finely matched using additional tie points between cores #1 and #2 (for a total of 122 points) and between cores #3 and #2 (87 points). In this case the 122 tie points between cores #2 and #1 provide a Pearson correlation r = 0.78 (significant at p < 0.01) between all the δ18O values aligned on core #2 depth while 87 tie points between cores #2 and #3 give r = 0.79 (p < 0.01). For comparison, in TC2016 the 17 tie points between cores #2 and #1 provided r = 0.72 (p < 0.01) while 14 tie points in cores #2 and #3 gave r = 0.67 (p < 0.01). The increase in r underlines the improvement in the depth alignments compared to the one performed previously for TC2016 as also illustrated in Fig. 1.
Figure 1Revised depth alignments using the δ18O records from the Alto dell'Ortles cores #1 (in black, continuous and dotted lines), #2 (in blue, continuous and dotted lines) and #3 (in red, continuous and dotted lines) over the entire lengths (upper panel) and the bottom portions (lower panel) of the cores. A common core #2 depth (x axis) is used in the mid panel for display of the three matched records. δ18O records in the top and bottom panels are shown on their original depth scales. Blue vertical lines indicate the δ18O tie points while red lines indicate tie points obtained through the Pb records of cores #1 and #3 (see Fig. 2). Adapted from Fig. 10 in Gabrielli et al. (2016).
While a more detailed alignment was obtained (Fig. 1, blue vertical lines), a lack of tie points persisted within the 60–73 m depth interval between cores #2 and #3. In TC2016 this was an unresolved issue only realized after publication, resulting in a depth misalignment of a few tens of cm, and consequentially in a significant time lag (up to ∼ 300 years) between the three cores (see Sect. S1 in the Supplement). To also refine the depth alignment of cores #2 and #3 in this interval, 31 additional tie points were considered in this study (Fig. 1, red vertical lines). Those were determined by matching the main features in the high resolution Pb concentration records from independent analysis in cores #1 and #3; by discrete Inductively Coupled Plasma Mass Spectrometry (ICP-MS) and continuous flow analysis (CFA) ICP-Sector Field MS (ICP-SFMS) at the University of Venice and at the Ohio State University, respectively (Gabrieli, 2008; Gabrieli and Barbante, 2014) (Fig. 2). Details on the Pb concentration analysis are provided in Sect. S2 in the Supplement, which also includes a brief discussion of the method induced offset in absolute concentrations observed between cores #1 and #3. We note that, since the Pb records are used exclusively for depth alignment in this section and for synchronization in Sect. 5 – with the primary goal of improving the chronology, particularly in terms of uncertainty – a detailed environmental, geochemical, or historical interpretation lies beyond the scope of this manuscript.
Figure 2Pb concentrations in the deep portion of cores #3 (red; Continuous Flow Analysis ICP-SFMS, the Ohio State University) and #1 (blue; discrete ICP-MS analysis, University of Venice) at their respective #1 and #3 depth scales (upper two panels) and matched to core #3 depth (lower panel).
With Pb not determined in core #2 due to insufficient ice volume, depth alignment based on the Pb records between 60 and 73 m was performed in three steps: (i) by matching the Pb concentration records in cores #1 and #3 (31 tie points obtained) using Analyseries 2.0.8 software (Paillard et al., 1996) (Fig. 2); (ii) by then transferring the depths of the 31 Pb points in core #1 to core #2 using the depth map obtained by matching cores #1 and #2 using δ18O, see above; and (iii) by linking the δ18O stable isotope records in cores #2 and #3 over this interval using as a guide the depth of the 31 supplemental Pb tie points. The final correlation obtained within this depth interval between the two Pb records is r = 0.91 (p < 0.01). We note that the significant correlations between the δ18O and Pb records from the different Alto dell'Ortles cores indicates a high degree of reproducibility, which confirms the absence of any observed stratigraphic disturbance at this drilling site (Gabrielli et al., 2016).
By use of the improved depth alignment of the three Alto dell'Ortles cores, the already existing time markers from TC2016 and new markers, obtained from the respective analyses in the three cores (Table 1), could be combined on a revised common depth scale (Tables S1–S3; subsequently used to construct the revised time scale, see Sects. 4 and 6). A new time marker in the deepest portion was obtained from an additional 14C age (Sect. 3.1). To refine the chronology of the younger part from 1900 to 2011 CE, three additional time constraints (2006, 1995, 1986 CE; Table 3) and 113 new annual time markers obtained by instrumental and visual annual layer counting (ALC) of pollen, dust and δ18O were considered, while also still relying on the beta and 3H activity peaks related to 1955 and 1963 CE, respectively, previously used also in the construction of TC2016 (Sect. 3.2).
Table 1Empirical parameters used to date the Alto dell'Ortles ice cores.
3.1 New 14C time marker near the bottom ice (232 BCE)
An intact larch needle at 73.25 m in core #1 provided a 14C calibrated age of 659 ± 102 BCE (Gabrielli et al., 2016), which was useful for dating the older part of TC2016. More recently we extracted a charred spruce needle from core #1 at 72.82 m (Fig. 3). Spruce are very common conifers in the Alps, including the Mt. Ortles area. Atmospheric vertical convection most likely transported the two needles from a lower elevation to the Alto dell'Ortles glacier. The charring of the needle likely resulted from a local forest fire, the heat from which may have produced or intensified atmospheric convection. This fragment, which contained 57 µg of carbon, was radiocarbon dated at the Paul Scherrer Institute using the Bern AMS facility (LARA Laboratory, University of Bern, Switzerland) (Szidat et al., 2014) and provided a conventional 14C calibrated age of 232 ± 126 BCE (Bern AMS sample number BE-12451.1.1). This date is stratigraphically consistent with the 14C date (659 ± 102 BCE) of the first larch needle found at 73.25 m in core #1 and with the shallower/younger and deeper/older WIOC 14C ages (see Table 2). Within the range of uncertainty, the 14C calibrated age (232 ± 126 BCE) of the charred needle found at 72.82 m is consistent with the TC2016 dating (146 ± 370 BCE) at the same depth. Thus, these new 14C data fits within the existing sequence, confirming the continuous increase of age with depth that was observed previously (Gabrielli et al., 2016). In addition, we can exclude the possibility of stratigraphic disruption due to ice flow at this depth, at least within the 14C age uncertainty. All 14C ages were calibrated using the OxCal program 4.4.4 (Ramsey, 2021) with the IntCal20 radiocarbon calibration curve (Reimer et al., 2020) and reported uncertainties indicate the 1σ range.
Table 2Information on 14C analyses of organic material from the Alto dell'Ortles cores (adapted from Table 2 in Gabrielli et al., 2016). Tubes #104b and #105b in core #1 refer to the respective sections in which the two conifer needles were found. All other 14C ages were obtained from analysis of the water insoluble organic carbon fraction (WIOC-14) extracted from the corresponding ice sections of cores #1 and #3. All radiocarbon dates were (re)calibrated using the IntCal20 calibration curve (OcXal v4.4.4). The reported uncertainties (i.e. the age range for calibrated age) indicate the 1σ range with μ-age denoting the age of highest probability density. For the selection of data points used for the revised timescale refer to text and to Gabrielli et al. (2016).
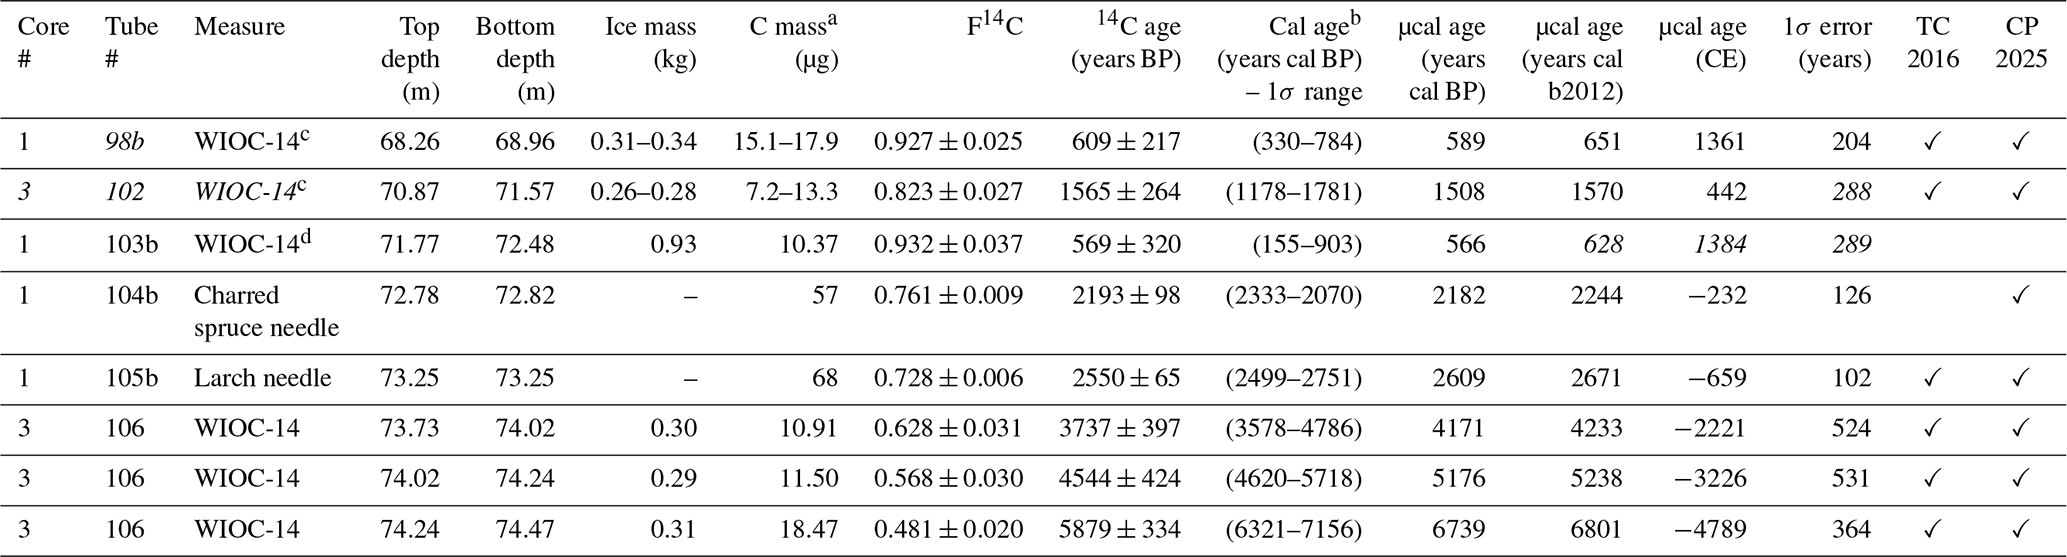
a Pure C extracted and available for AMS analysis after combustion. b 14C calibration was performed in OxCal v4.4.4 (Ramsey, 2021; Bronk Ramsey, 2009) with IntCal20, the Northern Hemisphere atmospheric calibration curve (Reimer et al., 2020). c Provided ice sample and C mass indicates the range for the three subsamples of 98b and 102, and F14C (and resulting ages) indicates their combined result (Gabrielli et al., 2016; Uglietti et al., 2016). d Outlier (values in italic), explained by an exceptionally large ice sample volume processed, and a resulting small C mass available for a single AMS measurement (Gabrielli et al., 2016).
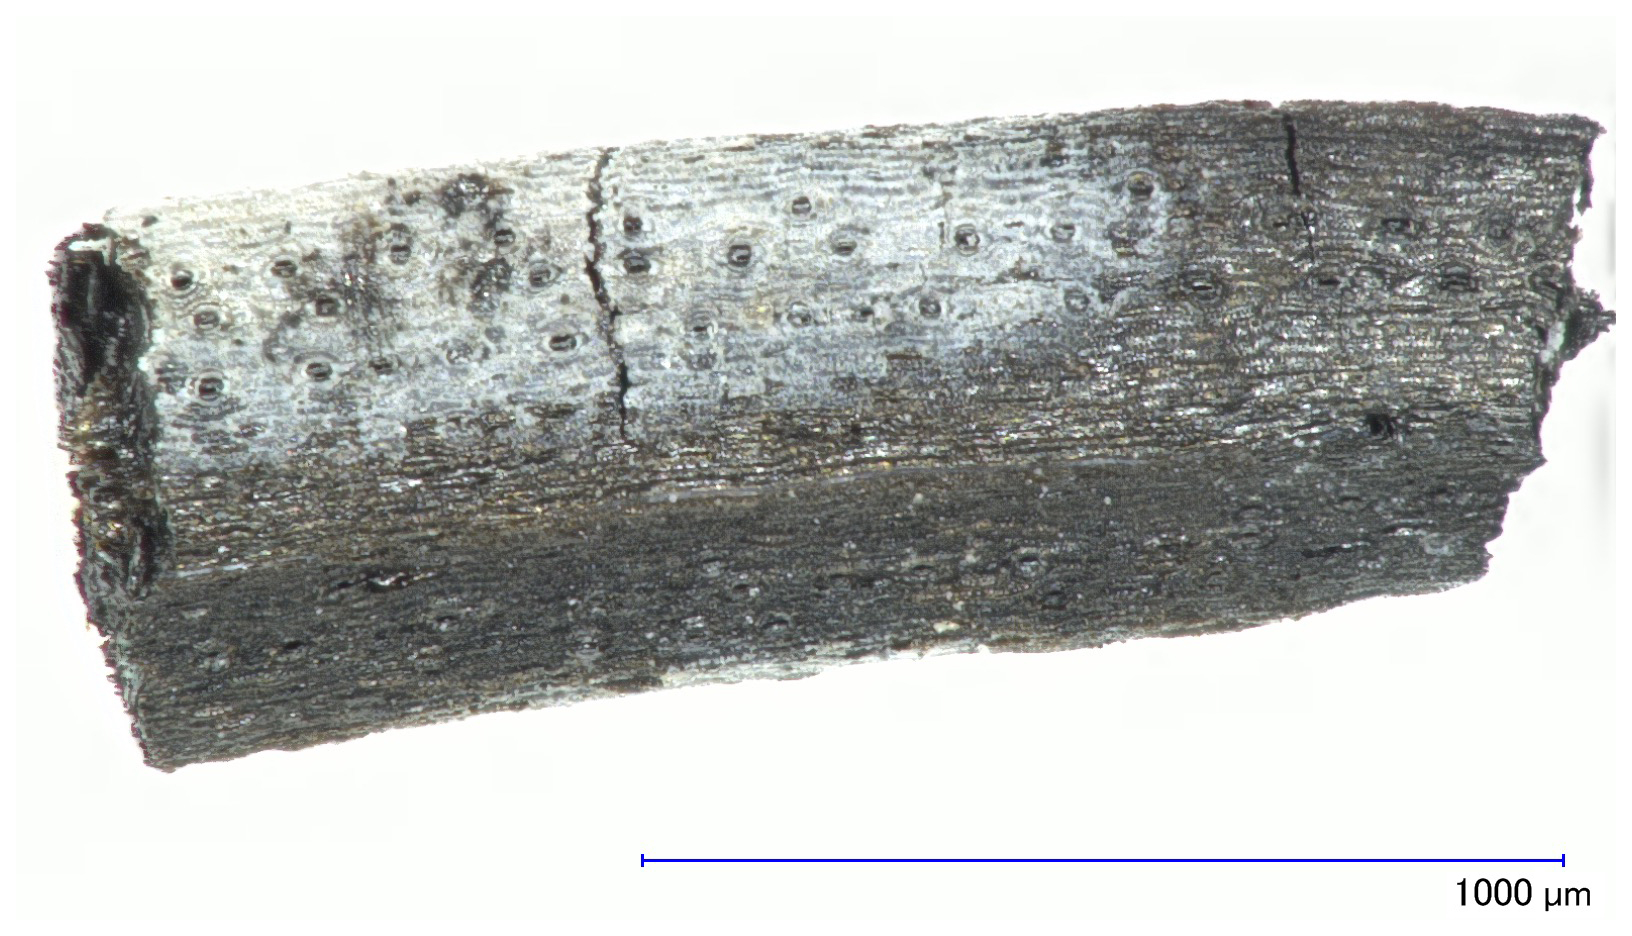
Figure 3The charred spruce needle fragment found in core #1 at 72.82 m depth and 14C dated to 232 ± 126 (1σ) BCE. The image was produced by using a Kayence VHX 2000 digital microscope at the University of Innsbruck.
3.2 Annual layer counting (1900-2011 CE)
A clear seasonal pollen signal was reported from the shallow firn temperate layers (10 m depth) in the Alto dell'Ortles glacier (Festi et al., 2015, 2017). New pollen records of relative and total concentration values were obtained from core #1. Despite recent intense summer meltwater percolation, the seasonality of the pollen record appears to be conserved in the firn and in the lower ice portion. This is demonstrated by pollen concentration, δ18O and dust concentration identified within the well-dated 1955–1963 CE interval which was constrained by beta and 3H activity peaks. These three parameters consistently show high values during the warm seasons (late spring to late summer) and low values during the cold seasons (Fig. 4). In particular, pollen age-markers correspond to winter/spring of each given year as pollen concentration in the atmosphere is high during spring/summer, while little or no pollen is present in winter. This situation is reflected in the corresponding seasonal ice core layers.
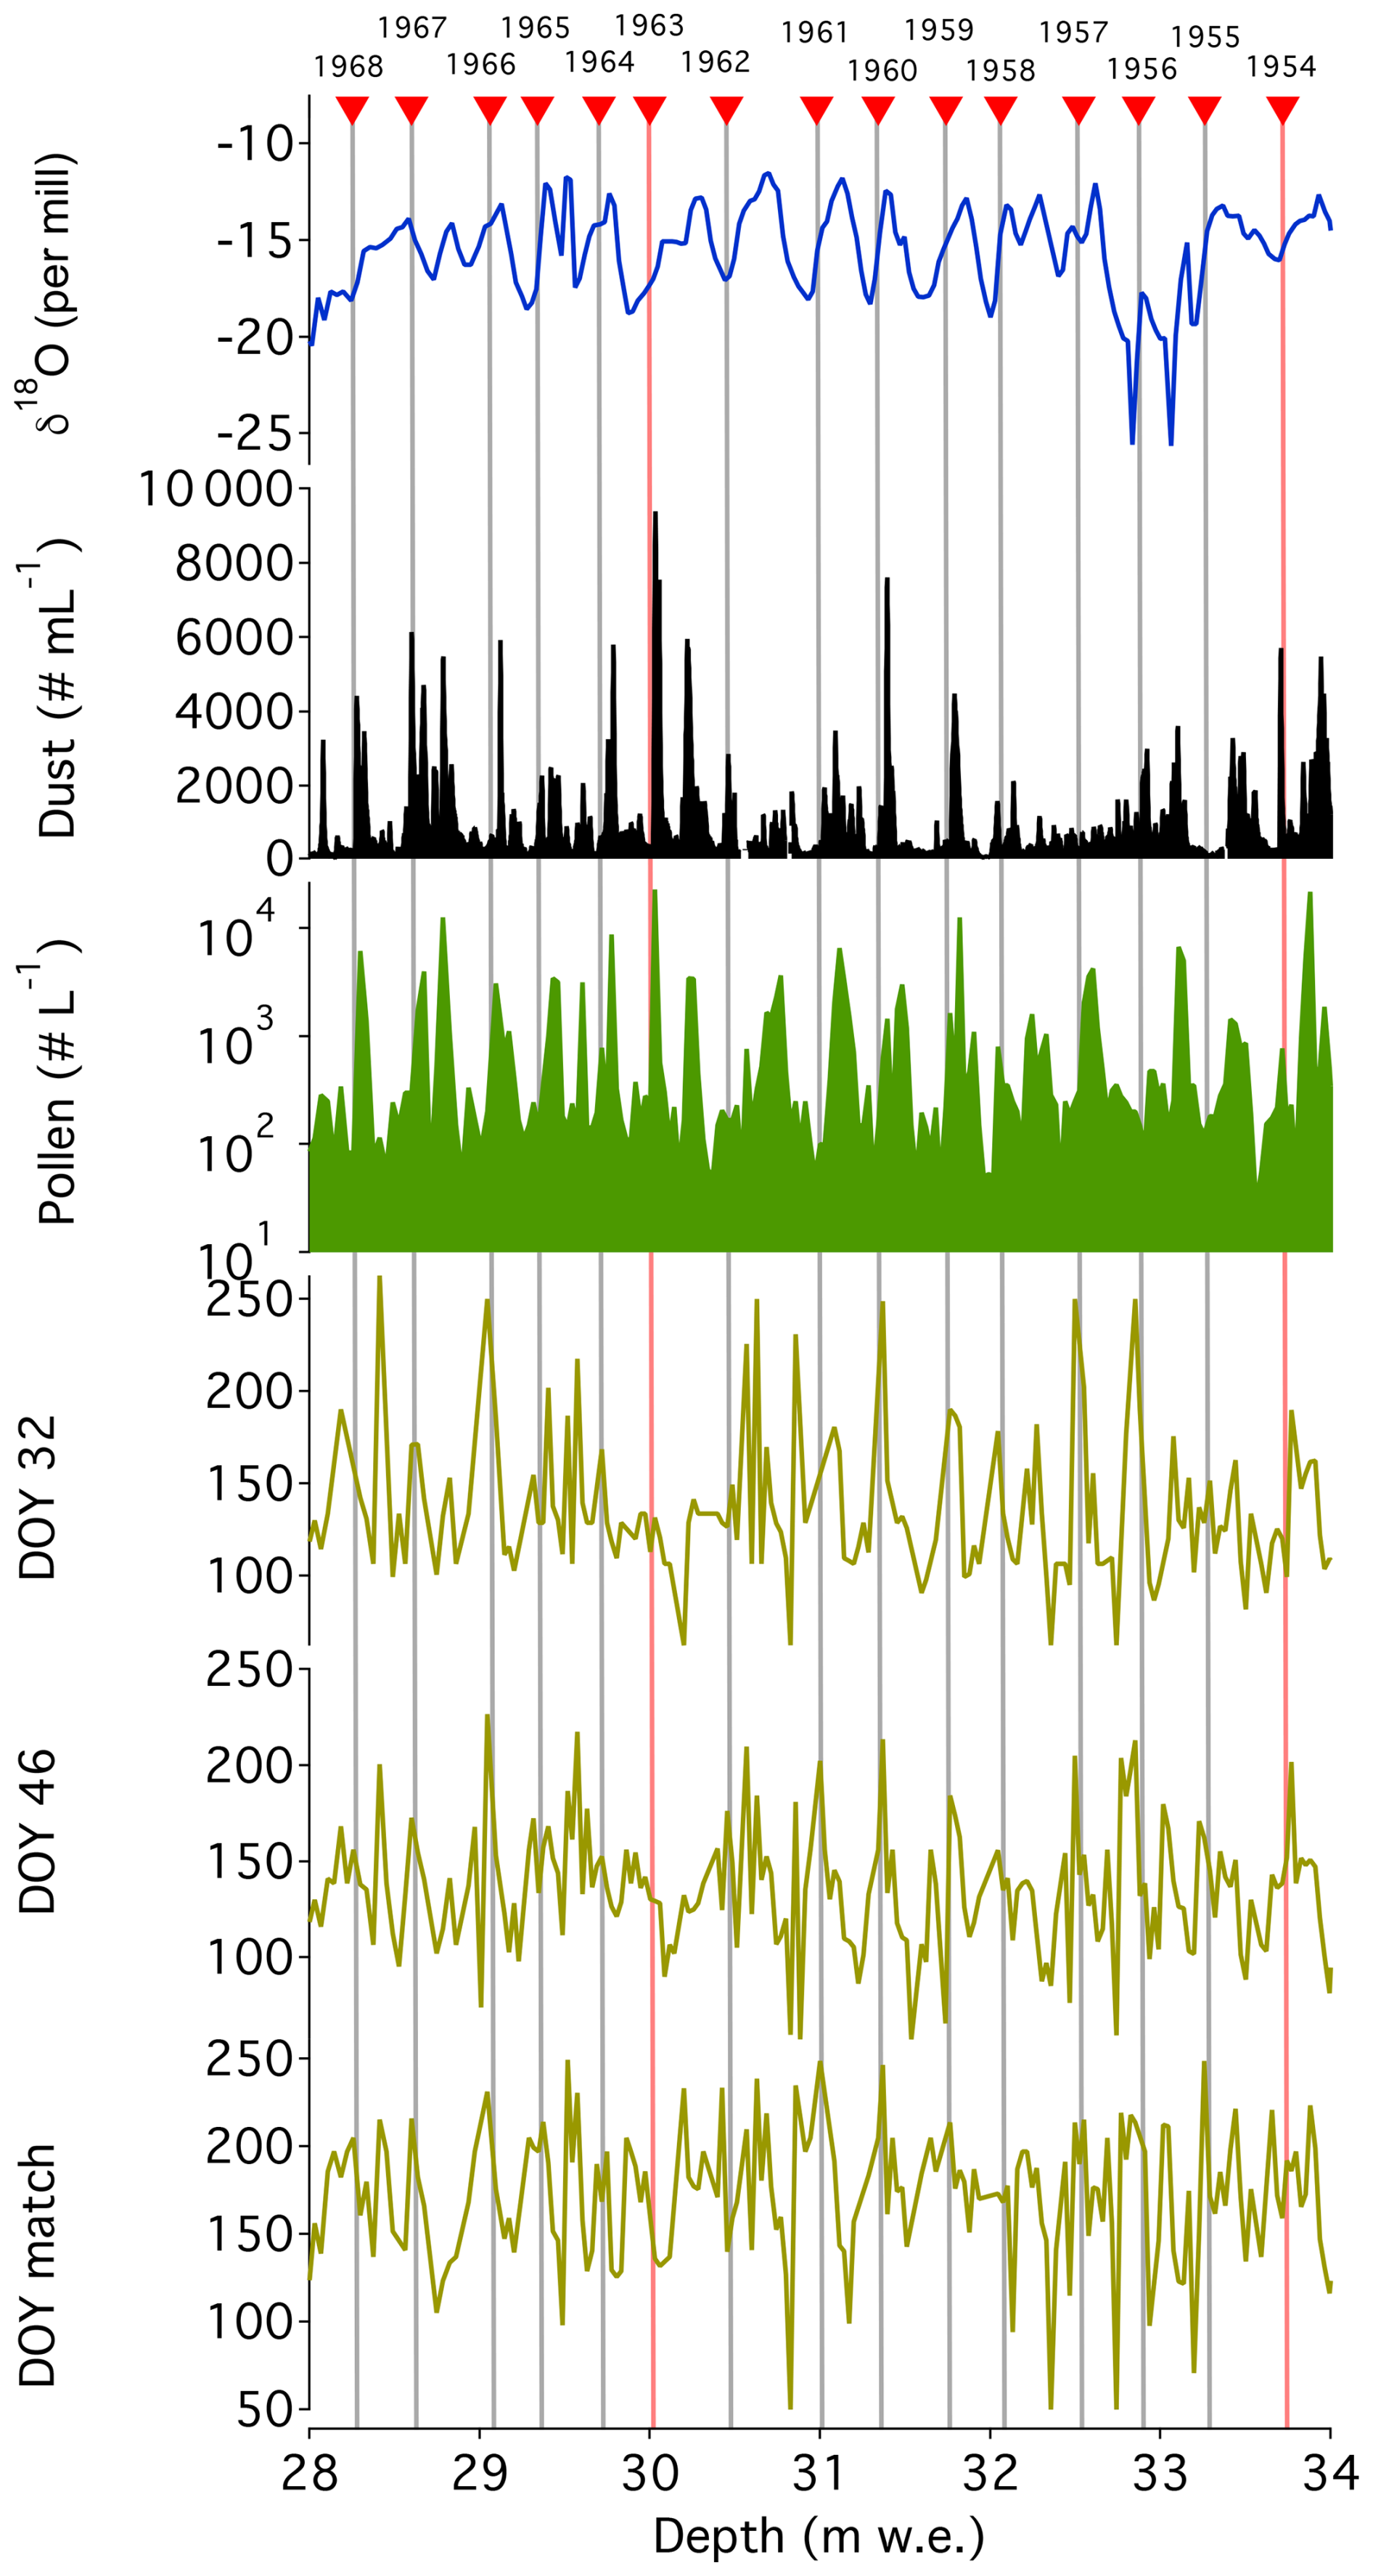
Figure 4Annual layers between 28 and 34 m w.e. in core #1 shown in δ18O, dust and pollen concentrations, Day-Of-the-Year (DOY) 32 and 46 and DOY depth-to-day match variations (see text). Red vertical lines indicate time markers from the 3H and beta activity peaks (Gabrielli et al., 2016). See also Figs. S5 and S6 in the Supplement which display annual layers in previous periods of the 20th century.
To produce an annual-layer-counted timescale from the 2011 glacier surface (below the last winter snow) to 53 m (41 m water equivalent; m w.e.) depth, we applied the StratiCounter algorithm (Winstrup et al., 2012; Winstrup, 2016) to a combination of pollen concentrations, δ18O and dust concentration, and three additional pollen records described in detail below. See Table S1 and Figs. 4 and S1. Note that StratiCounter also produces an age uncertainty interval for the resulting timescale. Below 53 m (41 m w.e.) depth, where the StratiCounter analysis became more uncertain, we attempted visual counting down to 57 m (45 m w.e.), where the combined annual signals become indistinguishable (see Fig. S2).
The additional three pollen records used were: (i) Day Of the Year, which considers 32 pollen types (DOY32) or; (ii) 46 types (DOY46) with known blooming time and; (iii) a depth-to-day-match of the pollen compositional record obtained using 10 years of data collected at the nearby Bolzano airborne pollen monitoring station (∼ 70 km from the drilling site; https://ean.polleninfo.eu/Ean/, last access: 10 June 2017). The three pollen records were weighted as a single line of information by StratiCounter as they are not independent. Briefly, each of these three records was derived from the different classified pollen types and provided an estimate of the pollen ensemble depositional day-of-year (DOY; values between 1 and 365) based on the observed pollen type spectra composition in the ice core (for details please see Festi et al., 2017).
The derived annual layers were compared and subsequently adjusted within the derived timescale uncertainty to independently fixed time markers that were identified in core #1 (Table 3). These include three known horizons with high levels of radioactivity: the beta activity peak from the Chernobyl accident in 1986; beta and 3H peaks from atmospheric nuclear tests attributed to 1963; and a first beta intensity peak from detectable radioactive fallout in 1955 (Gabrielli et al., 2016, 2011). Two additional time markers were assigned by comparing spruce (Picea abies) pollen concentrations with observations from the nearby pollen measuring stations at Innsbruck and Obergurgl (Bortenschlager and Bortenschlager, 2003). The records from these stations are the longest (44 and 41 years, respectively) in this area and contain evidence of three exceptional blooming years in 2006, 1995 and 1992. While the strongest episode in 1992 does not correspond to large spruce concentrations in the Alto dell'Ortles core, the 1995 and 2006 events are characterized by high and broad pollen peaks in the firn portion of the core. The ages of all the marker horizons fall within the derived uncertainty of the StratiCounter timescale. By using these five time markers as guides for adjustments, we removed 2 years between 18.2 and 33.89 m w.e. thereby producing the final annual-layer-counted timescale.
Table 3Time markers in the upper portion of the Alto dell'Ortles cores, which were used as fixed horizons, and required a small adjustement of the StratiCounter annual layer counting by 2 years to match.
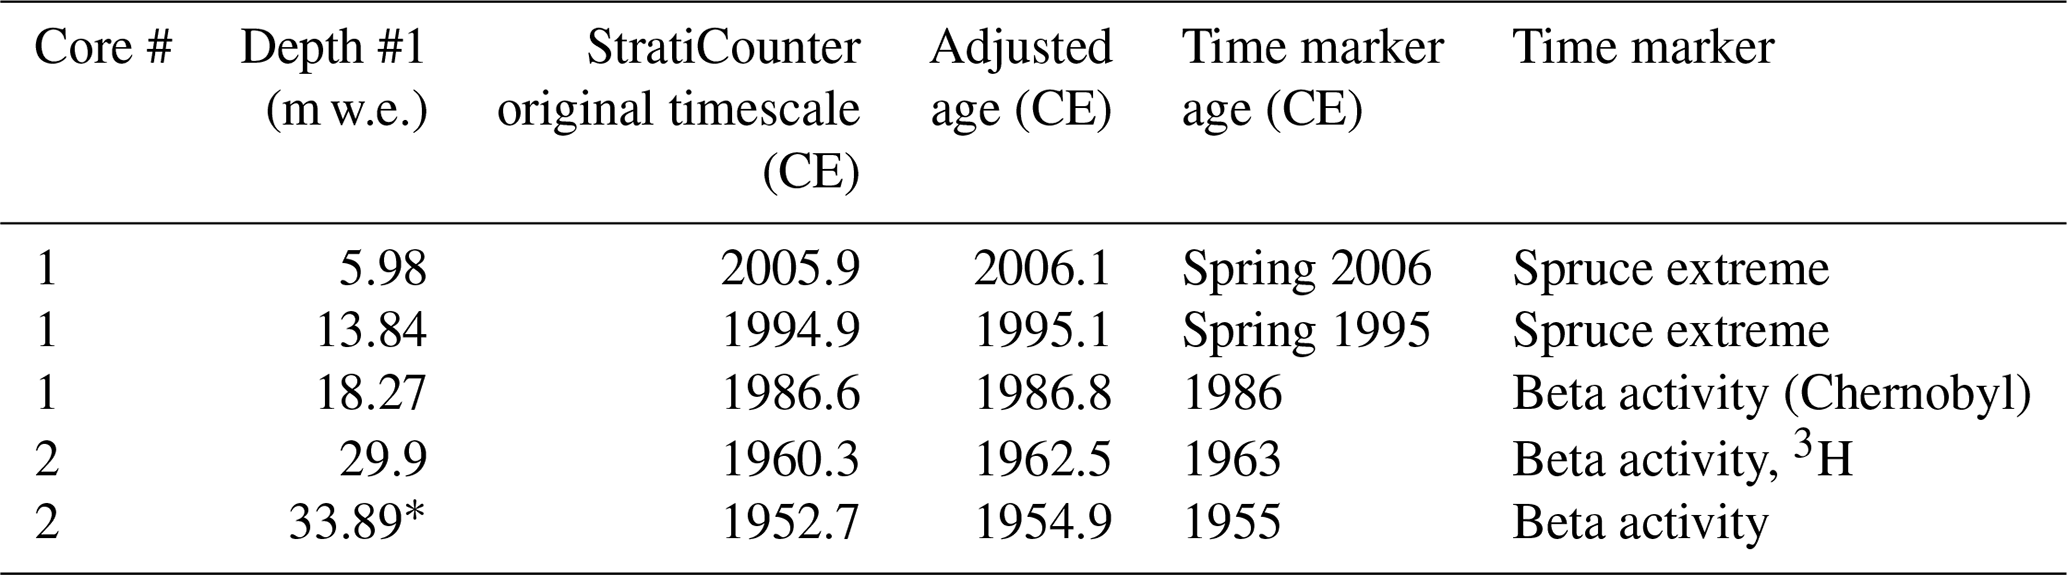
∗ Transferred from core #2.
We compared the new annual counted timescale obtained by StratiCounter with the 210Pb ages derived from the upper part of core #2 that were used to constrain TC2016 (Fig. S3). The two independent time scales are in good agreement down to 53 m (41 m w.e.; ∼ 1940 CE), while they diverge below. This offset can partly be explained by the fact that the initial dating by 210Pb did not account for any layer thinning (not applied because statistically not evident for the measured activity concentrations). Additionally, a slight offset in the 210Pb ages due to imprecise determination of the background from supported lead – no plateau in activity concentration for clear determination of the 210Pb background level (Gäggeler et al., 2020) was reached for the sampled sections, and its determination thus based on one single data point only – cannot be excluded. In any case, the annual layer counting down to 57 m (45 m w.e.) results in a dating which is supported by the good match between the Alto dell'Ortles and AN Pb records (see Sects. 5 and 6). In conclusion, the counted annual layers were adopted to replace the 210Pb time markers initially used in TC2016.
By combining the time markers established in TC2016 with the new, additional markers presented in Sect. 3 on the revised common depth scale (Sect. 2), a preliminary revised version of the previously published TC2016 timescale was constructed; in the following denoted as CP2025/1. In line with the development of TC2016, the continuous depth-age relationship of the Alto dell'Ortles cores (Fig. 5) was built by fitting all the empirical time markers (defined in m w.e. depth and years before 2012; Table S2) by means of Markov chain Monte Carlo simulation (COPRA model, 2000 simulation runs), thereby accounting for their linked uncertainty ranges. This provides a depth-age relationship with an associated depth-time dependent uncertainty (Breitenbach et al., 2012). For the most recent portion of the chronology (2011–1927), the original uncertainty of the single annual layers provided by StratiCounter (1–10 years) was retained. Overall, 113 annual time markers provided by StratiCounter from 2012 to 1900, anchored by five distinct time horizons (Table 3) were combined with seven 14C dated layers in the deep part of the record (651 CE back to around 7000 years before present) (Fig. 5).
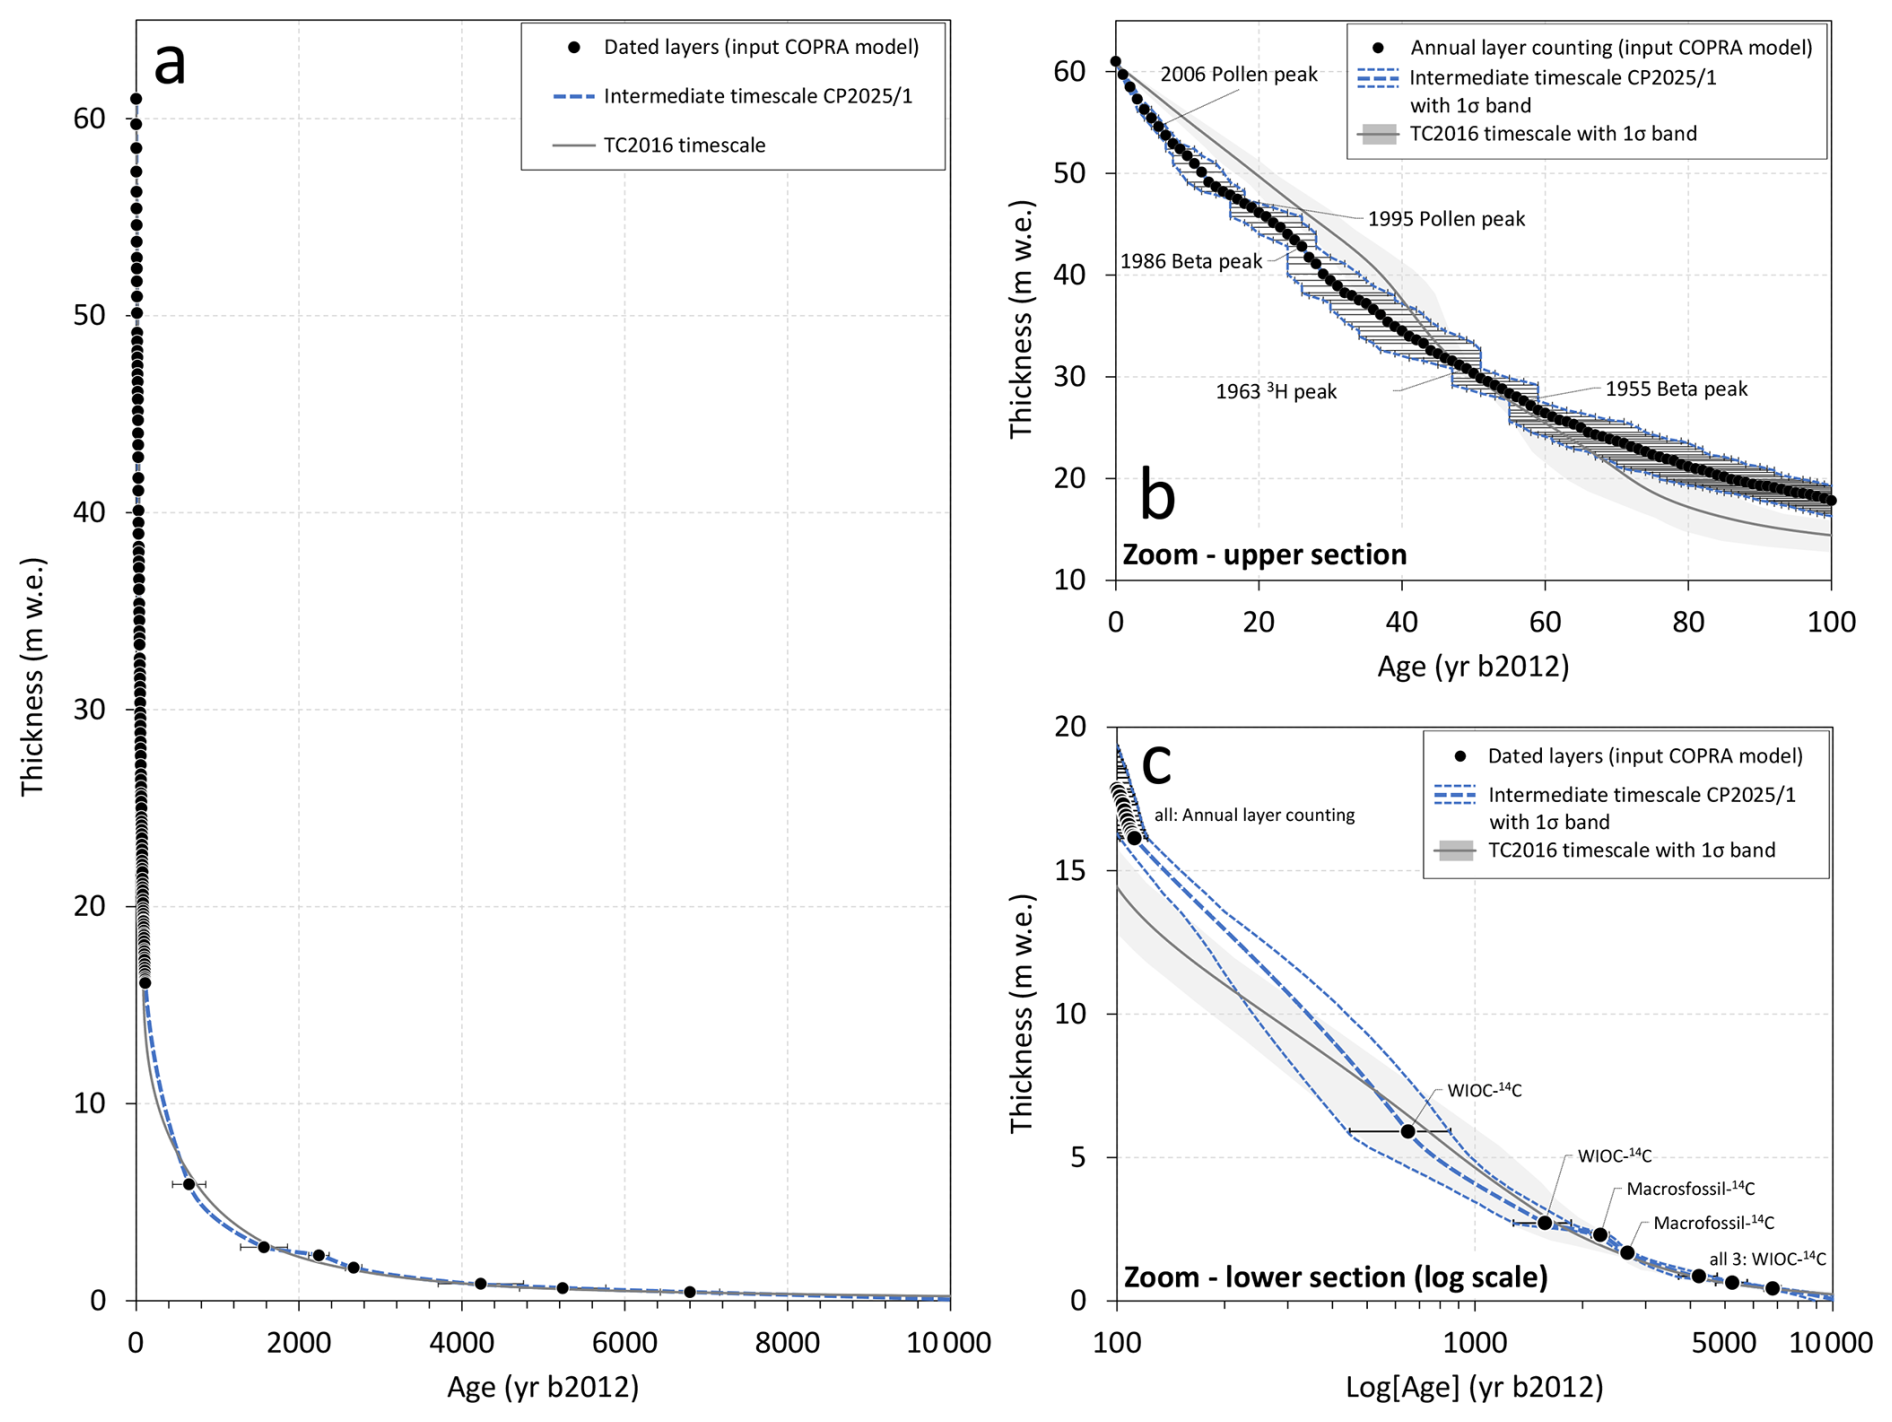
Figure 5Comparison of the TC2016 and the updated, intermediate Alto dell'Ortles (CP2025/1) timescales obtained by using COPRA. The different time markers for construction (see Table S2) are indicated by symbols with error bars representing their uncertainty by the linked dating methods (1σ range for 14C cal ages; see text for others). Shown in panel (a) for the entire length of the ice core from surface, indicated by the uppermost point, to bedrock covering the entire period of the Alto dell'Ortles ice archive, in panel (b) for the last 100 years, and in panel (c) for the older part of the record (> 100 years) on a logarithmic age scale. The core #2 reference depth (Sect. 2) is here expressed as thickness, with the surface of depth zero corresponding to the total of 61.15 m w.e. (74.88 m).
Comparison of this updated Alto dell'Ortles timescale (CP2025/1) with the previously published TC2016 chronology is displayed in Fig. 5. As a result of replacing the dating by 210Pb with the new time markers from the annual layer counting (constrained by the three additional time markers of 2006, 1995, 1986; Sect. 3.2), the two timescales differ significantly during the most recent 20 years. Also, CP2025/1 is around 20-100 years older between 1920 and 1600 CE, while elsewhere, CP2025/1 and TC2016 agree within their uncertainties (Fig. 5).
Six well-dated ncPb records from Arctic ice cores were shown to document the spatial and temporal changes in Arctic lead pollution from 200 BCE to 2010 CE, before the 19th-century Industrial Revolution, primarily caused by European emissions related to past mining operation in Central Europe and the Mediterranean region (McConnell et al., 2019). They display periods of increase in atmospheric ncPb from the Roman period (see also McConnell et al., 2025), through the Early Middle Ages to the 1970s industrial peak. Superimposed on these major variations, distinct multiannual to multidecadal variations exist, marked by increases coincident with the exploitation of mining regions for Pb and Ag metallurgical production, decreases coincident with climate disruptions, famines, major wars, and plagues occurring in Europe and the Mediterranean region during the last two millennia (McConnell et al., 2019).
Using Pb records for synchronizing alpine and Arctic ice core chronologies has previously been applied (Preunkert et al., 2019; Osman et al., 2021). The underlying geochemical assumption is that an anthropogenic Pb signal from emission sources located in the European region and recorded even in Arctic ice, will most likely be imprinted, at essentially the same time, also in ice archives located much closer to these sources. Because the Alps – with Alto dell'Ortles being part of them – represent a central archive of past atmospheric pollution in Europe (e.g., Preunkert et al., 2019; Eichler et al., 2023), we adopted this synchronisation approach, choosing one of the above mentioned Arctic records characterized by their imprinted signal of European Pb emission.
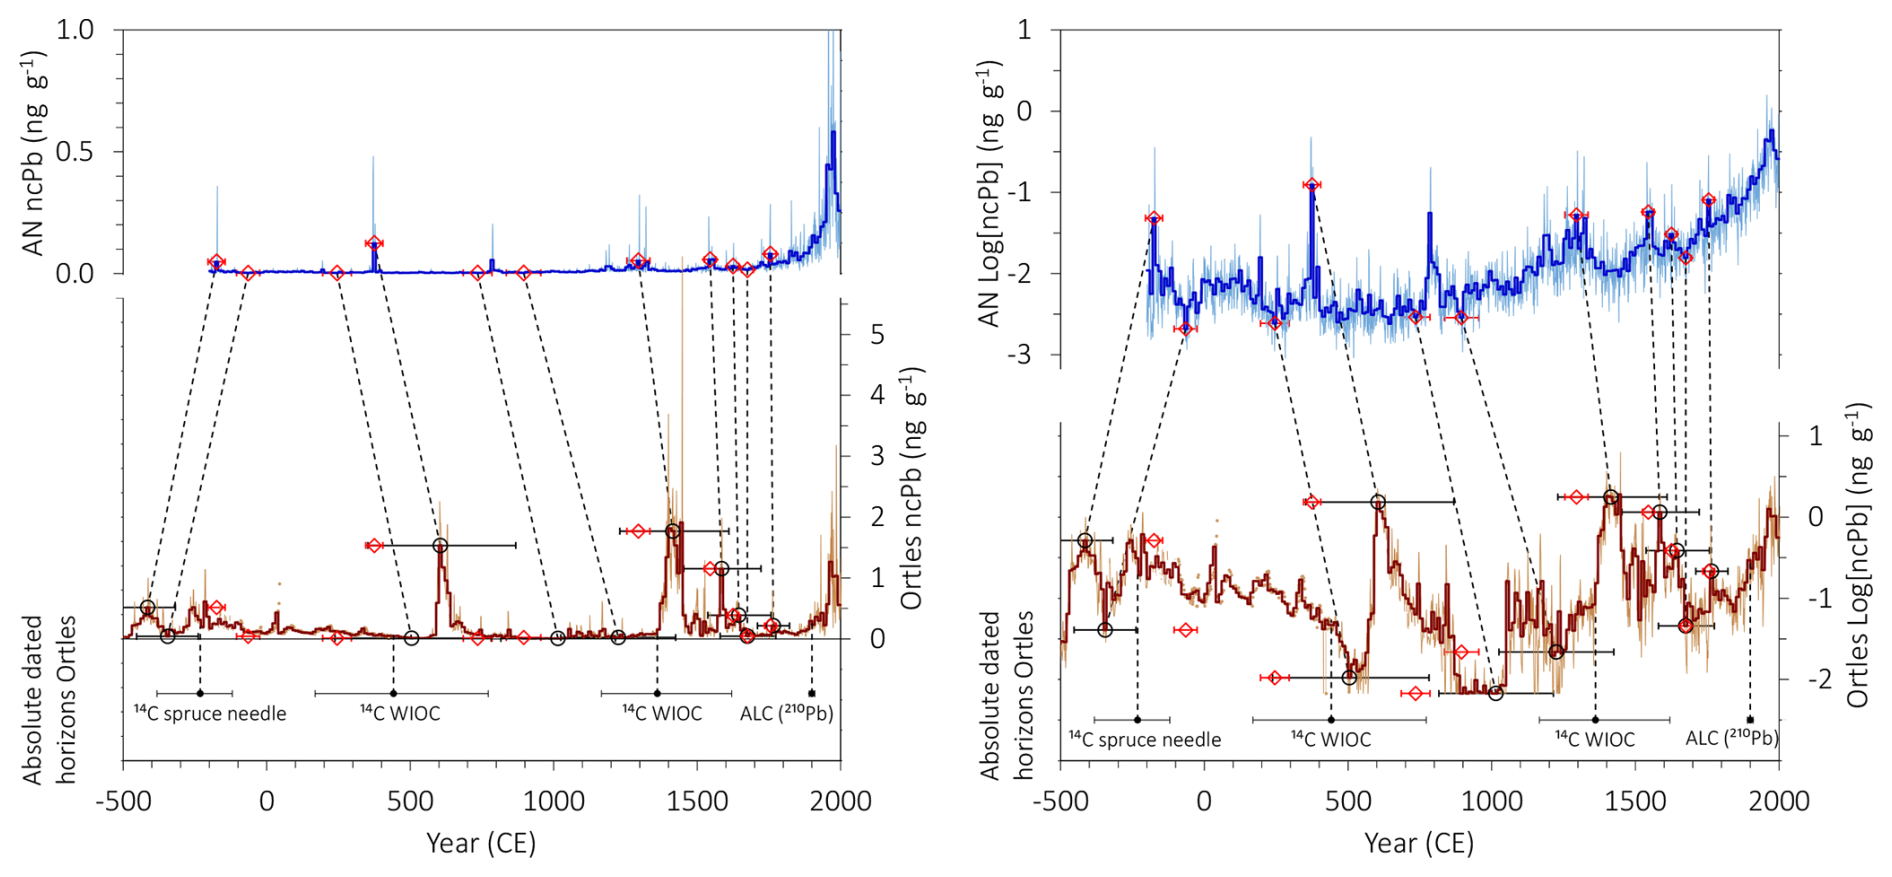
Figure 6Synchronization of non-crustal lead (ncPb) from the Alto dell'Ortles core #3 (in dark red) on the CP2025/1 timescale with the corresponding record from Akademii Nauk (AN; in blue) on its well-dated (≤ ±5 years) chronology used as reference (McConnell et al., 2019). Thin and thick lines show annual and 10-year averages, respectively. The tie points selected for synchronization by wiggle-matching are connected by the thin dashed lines and are indicated by red diamonds (AN; error bars indicating the uncertainty estimates of the selected tie points) and black circles (Alto dell'Ortles; error bars indicating the 1σ uncertainty linked to CP2025/1). To facilitate visual assessment of the resulting age shifts, the red diamonds are also shown next to the corresponding black-circle tie points from Alto dell'Ortles. Absolute ages from 14C dating (or annual layer counting) are shown at the bottom (black dots indicate the μ-age and error bars in the 1σ range), with the thick black dashed line connecting to the record for visualizing the time horizons used to construct CP2025/1. Same for both panels, except for ncPb concentrations being plotted on a logarithmic scale on the right panel.
Among the six Arctic records, the one from the Akademii Nauk ice cap in Severnaya Zemlya, Russian Arctic (AN) was selected for the following reasons. While, like the other Arctic records, it shows similarities with the high-resolution ncPb record from the Alto dell'Ortles ice core (Fig. 6), (i) it contains one of the longest continuous chronologies from 200 BCE to 1999 CE; (ii) this record is characterized by the largest Pb amplitude signal; and, (iii) it is suggested by atmospheric modelling to be the record most strongly influenced by Pb emissions from silver mining and metallurgical activities in central Europe, the region close to Alto dell'Ortles, during the past millennia (McConnell et al., 2019). Also, the uncertainty of the AN chronology was estimated to be low; up to a maximum of ±5 years with less than 2 years uncertainty at the known volcanic time horizons within the Greenland reference record (McConnell et al., 2019). Considering the relatively small dating uncertainty over the entire time covered by the AN record, when compared to the typical dating uncertainty for high altitude ice cores, the potential benefit of synchronisation becomes evident.
In detail, the synchronisation of ncPb from AN was performed with the continuous flow analysis Pb record from Alto dell'Ortles core #3 because of its higher resolution when compared to the record from core #1. Alto dell'Ortles ncPb was obtained from Pb concentrations corrected for mineral dust contribution by using a Pb Rb ratio of 0.51 (value obtained for a section between 69.55 and 69.94 m depth, characterized by the lowest Pb concentrations) which is reasonably consistent with the ratio of 0.15 provided for the upper crust by Wedepohl (1995). Values below the detection limit were replaced by half the analytical detection limit of Pb (Sect. S4 in the Supplement). Synchronisation was performed with the records on their respective time scales, i.e., the intermediate CP2025/1 timescale for Alto dell'Ortles (see Sect. 4), using the Analyseries 2.0.8 software (Paillard et al., 1996). Thereby, to avoid over-interpretation of individual data points and to account for the reported dating uncertainty of AN (≤ ±5 years), the records were averaged to a 10-year time resolution. For subsequent matching of the midpoints of the 10-year averages, only the most prominent features (obvious peak maxima and minima) were matched (see below). In addition, multiple constraints were applied: (i) final shifts in age should not exceed the initial CP2025/1 dating uncertainty range (i.e., overlap at least within 2σ uncertainties of CP2025/1 and the final uncertainty estimate), and also remain within 2σ of the calibrated 14C age probability range at the respective sampling horizons; (ii) compression or expansion of time intervals between tie-points should not produce larger/smaller amplitudes in layer-thickness variations than those derived from the initial CP2025/1 age scale (feature implemented for control in Analyseries). Age uncertainty estimates for the tie points were derived by combining the reported dating uncertainty of AN with a visual, best-possible assessment of how well the assigned peak maxima and minima are represented in either record. For example, a broad minimum, or several nearly equally low values occurring within close (i.e., decadal) proximity, would result in a larger uncertainty, estimated as approximately the half-width of the feature(s).
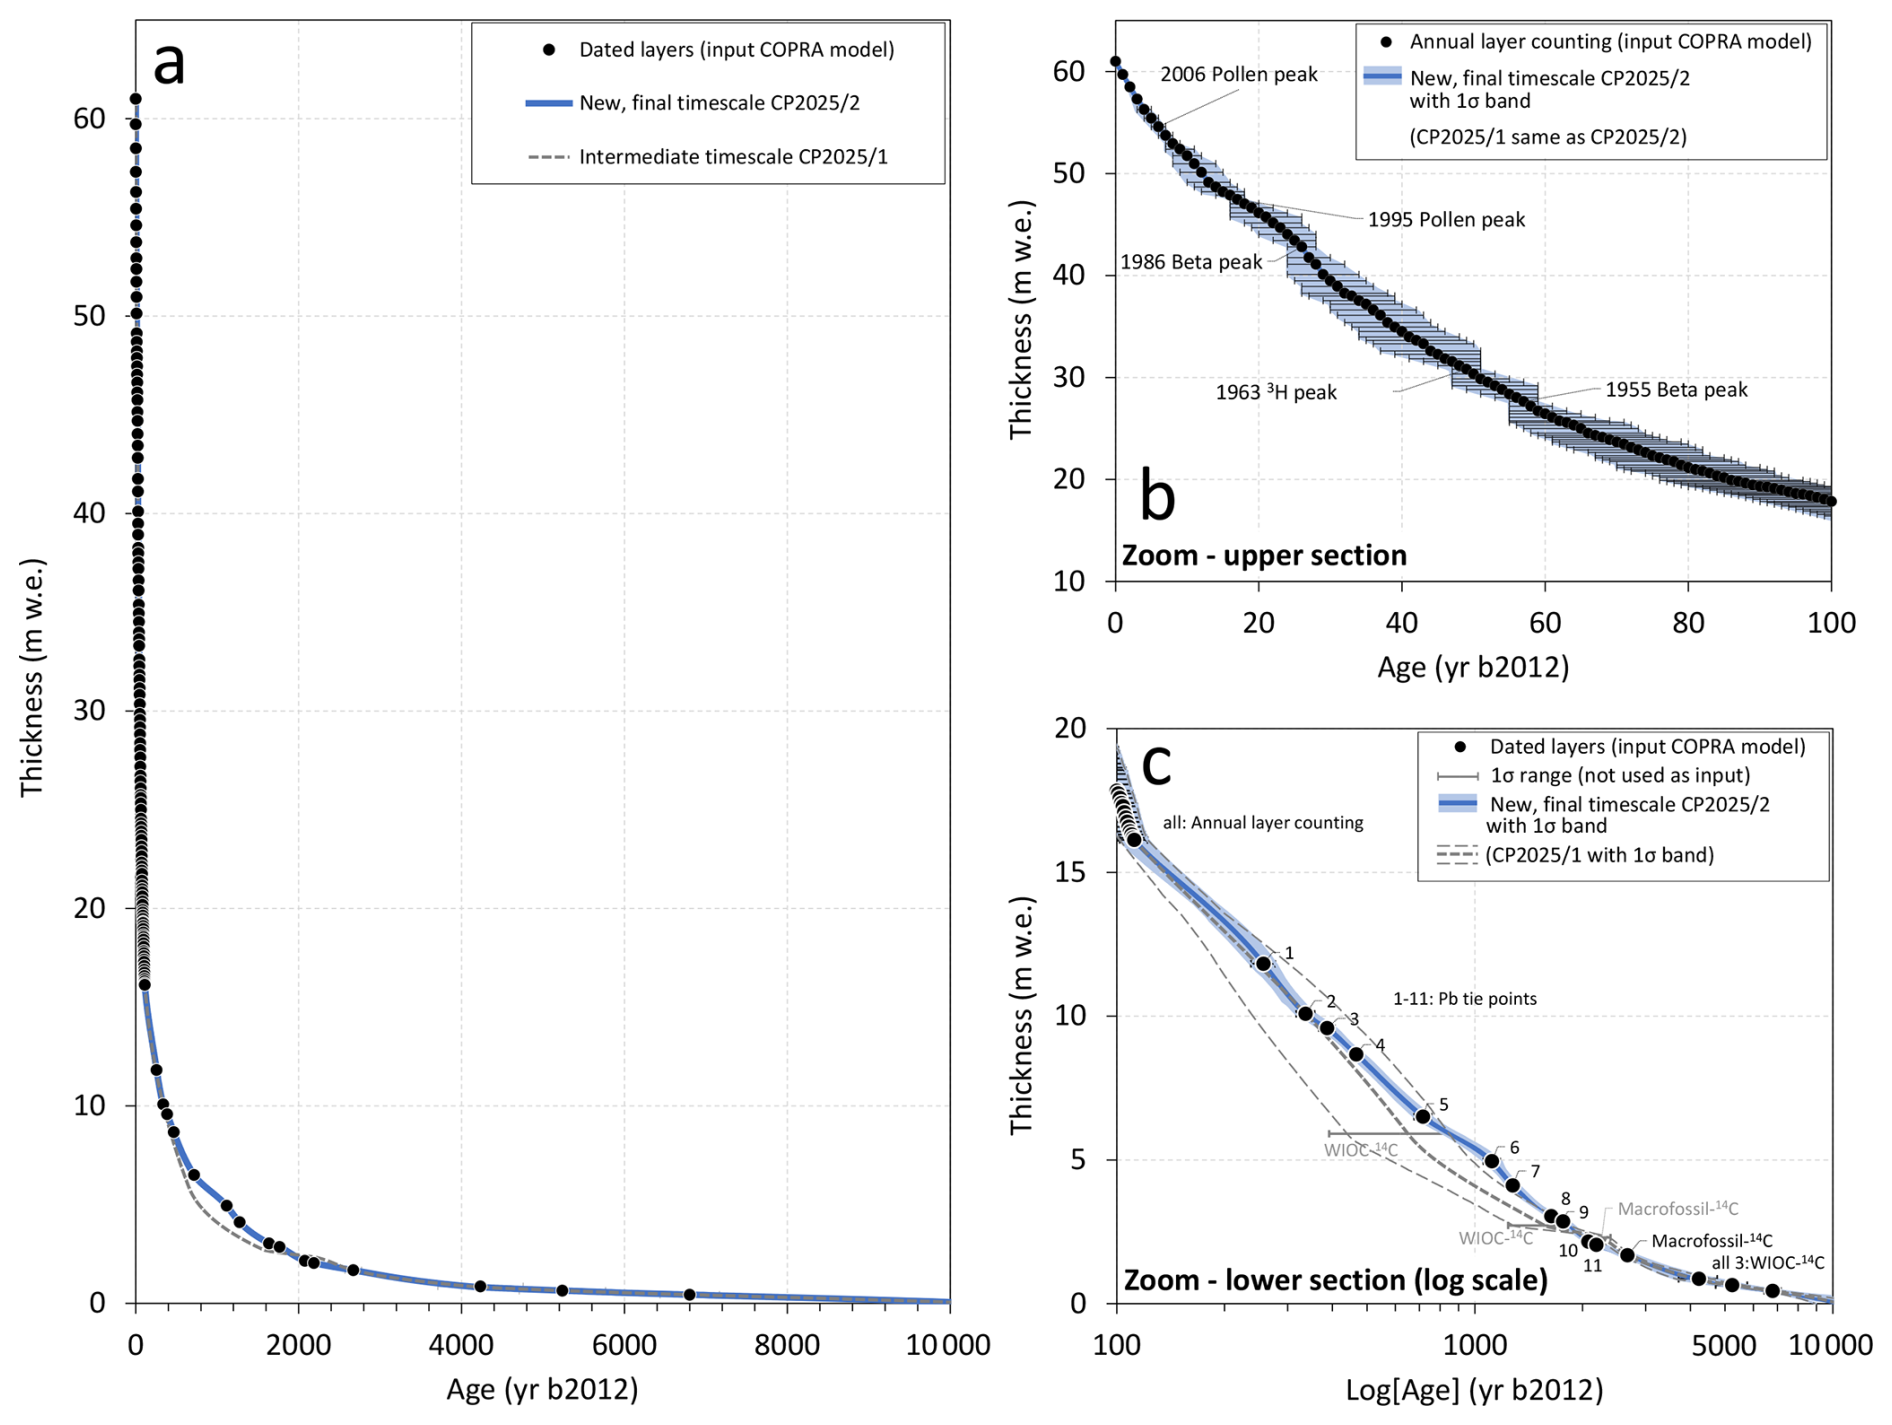
Figure 7Comparison of the intermediate (CP2025/1, before synchronisation) and the final Alto dell'Ortles (CP2025/2) timescales. The different time markers used for construction (listed in Table S3) are indicated by symbols with error bars illustrating their uncertainty by the linked dating methods (1σ range for 14C cal ages; see text for others). The three 14C data points that were not used for model input are indicated just by their 1σ range (grey bars). Shown in panel (a) for the entire length of the ice core from surface, indicated by the uppermost point, to bedrock covering the entire time period of the Alto dell'Ortles ice archive, in panel (b) for the last 100 years, and in panel (c) for the older part of the record (> 100 years) on a logarithmic age scale. The core #2 reference depth (Sect. 2) is here expressed as thickness, with the surface of depth zero corresponding to the total of 61.15 m w.e. (74.88 m).
Following the above methodology, 11 prominent features between 175 BCE and 1755 CE were selected for synchronizing (Fig. 6). For the selected tie-points, the shift in age (CP2025/1 – AN age) was ∼ 10–20 years or less back to 1600 CE; around 40 years back to 1550 CE, between 120 and 270 years from 1250 to 250 CE; and between −280 to −240 years between 0 and 200 BCE. Importantly, 7 out of the 11 tie points were within the 1σ uncertainty of the initial CP2025/1 timescale based on the absolute ages from 14C, with the other 4 being within the 2σ range (see Figs. 6 and 7). Further we note that: (a) the 14C age (659 ± 102 BCE) of the larch needle (Table 2) was not shifted in the revised timescale which remains unchanged before 175 BCE, and (b) the final Alto dell'Ortles timescales for the 20th century is fully independent, since no synchronization tie-points were selected for this most recent period where the ice was dated based on the annual layer counting and the time horizons described in Sect. 3 (showing already high correlation with AN as indicated by a Pearson's r of 0.61 for annual values, p < 0.001). A brief discussion of the industrial-period section of the ncPb record from the Alto dell'Ortles record – particularly regarding the absolute concentrations which are somewhat lower than expected for this period if compared to other records from the Alps (Eichler et al., 2023; Gabrieli et al., 2014; Preunkert et al., 2019) – is provided in the Supplement (Sect. S3). Additionally, an illustrative example of the applied tie-point selection used for synchronization is described and visualized in (Fig. S4). In Sect. 6, an assessment of the synchronisation using the final Alto dell'Ortles timescale is provided.
Finally, we emphasize that incorporating the applied constraints in the synchronization procedure was a crucial part to exclude subjective or arbitrary age shifts during wiggle matching. We therefore recommend adopting such a quantitatively controlled, absolute-dating-based approach as a standard for future synchronization (wiggle matching) of ice cores from high-altitude (mountain) glaciers, whether aimed at establishing chronologies or supporting the interpretation of paleo-records.
The 113 annual time markers provided from the counting of annual layers from 2012 to 1900 (Sect. 3.2), the 11 tie points obtained from the match of the Alto dell'Ortles core #3 with the AN Arctic Pb record (1755 CE–175 BCE; Sect. 5), and four 14C ages from the deepest part below (659 BCE back to ∼ 7000 years; Sect. 3.1) were finally used to develop the final Alto dell'Ortles time scale CP2025/2. Using these data points (with depths in m w.e. and the age as years before 2012; see summary in Table S3), the exact same methodology as applied to construct TC2016 and CP2025/1 was applied (Markov chain Monte Carlo simulation, 2000 simulation runs, using COPRA; Breitenbach et al., 2012). Again, fitting the time markers with their given 1σ uncertainty, allowed to propagate the dating uncertainty to any depth/age. The resulting final Alto dell'Ortles depth-age relationship, CP2025/2 with its linked uncertainty is shown in Fig. 7. Note that although the uncertainty of this revised chronology was substantially reduced compared with the initial chronology TC2016, the actual age shift is relatively small – on the order of only a few decades – and remains within the previous uncertainty estimates (see Fig. 5).
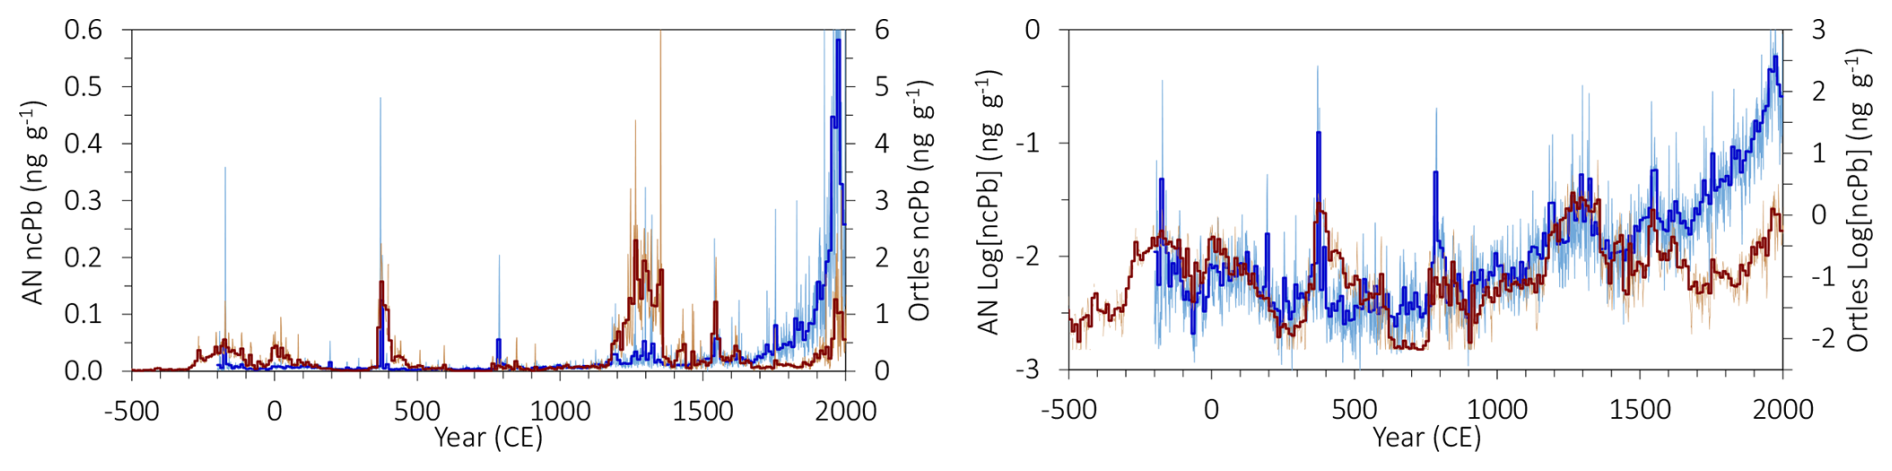
Figure 8Comparison of the ncPb from Alto dell'Ortles #3 (Ortles; dark red) after synchronization with Akademii Nauk (AN) used for age reference (McConnell et al., 2019) between 175 BCE and 1750 CE. Thin and thick lines show annual and 10-year averages, respectively. Same for both panels, except for ncPb concentrations being plotted on a logarithmic scale on the right panel.
With the final time scale at hand , the performed synchronisation with the AN ncPb record was assessed, comparing it to the Alto dell'Ortles record, now on the CP2025/2 timescale (Fig. 8). As a sort of reference, the independently dated, slightly shorter Pb record from Colle Gnifetti in the Western European Alps (CG03B, Switzerland;) was similarly compared to both the AN and Alto dell'Ortles record (see Sect. S3 in the Supplement and Figs. S2–S4). In general, the match between Alto dell'Ortles and AN is remarkable and provides additional evidence of the stratigraphic and temporal continuity of this ice core record (i.e., no evidence of age reversals or ice flow disturbance). By applying the synchronization, the correlation over the entire record increased from 0.26 to a significant value of 0.45 (r, p < 0.001), for the record before 1750 CE from 0.09 to 0.46 (r, p < 0.001). Also, the agreement between Alto dell'Ortles on CP2025/2 and the fully independently dated CG03B ice core is good back to ∼ 1500 CE until when the dating of CG03B is reasonably precise (r = 0.43, p < 0.001; Fig. S6). We also note that CG03B agrees well with AN back to at least 1500 CE (Fig. S7), confirming the underlying assumption of a contemporary pre-industrial atmospheric Pb signal in the Arctic and the Alps form common European emission sources (Sect. 5). However, the records of CG03B and AN start to diverge further back in time, which may not be too surprising considering the rapid increase in dating uncertainty of CG03B (from 7 years at 1763 CE to around 300 years at ∼ 0 CE/BCE; see Fig. S5).
Finally, we applied the Dansgaard-Johnsen (DJ) glaciological ice flow model (Dansgaard and Johnsen, 1969) to investigate the revised age-depth relationship CP2025/2 at the Alto dell'Ortles drilling site (see also Sect. S5 in the Supplement). The DJ model (one-dimension; 1D), uses an approximation of the ice flow to calculate the vertical strain rate (thinning of annual ice layers with depth). It results from assuming the horizontal velocity (vx) described by Glen's law to be constant from the glacier surface down to a given height above bedrock (h; shear zone thickness), where it decreases linearly with depth to zero at the bed (no-basal ice flow, i.e., ice frozen to bedrock; blue curve in Fig. 9). It should be noted that the term h is the result of the DJ model-approximation for vx and subsequent mathematical reformulations, rather than being descriptive of a distinct separation between two zones existing in reality.
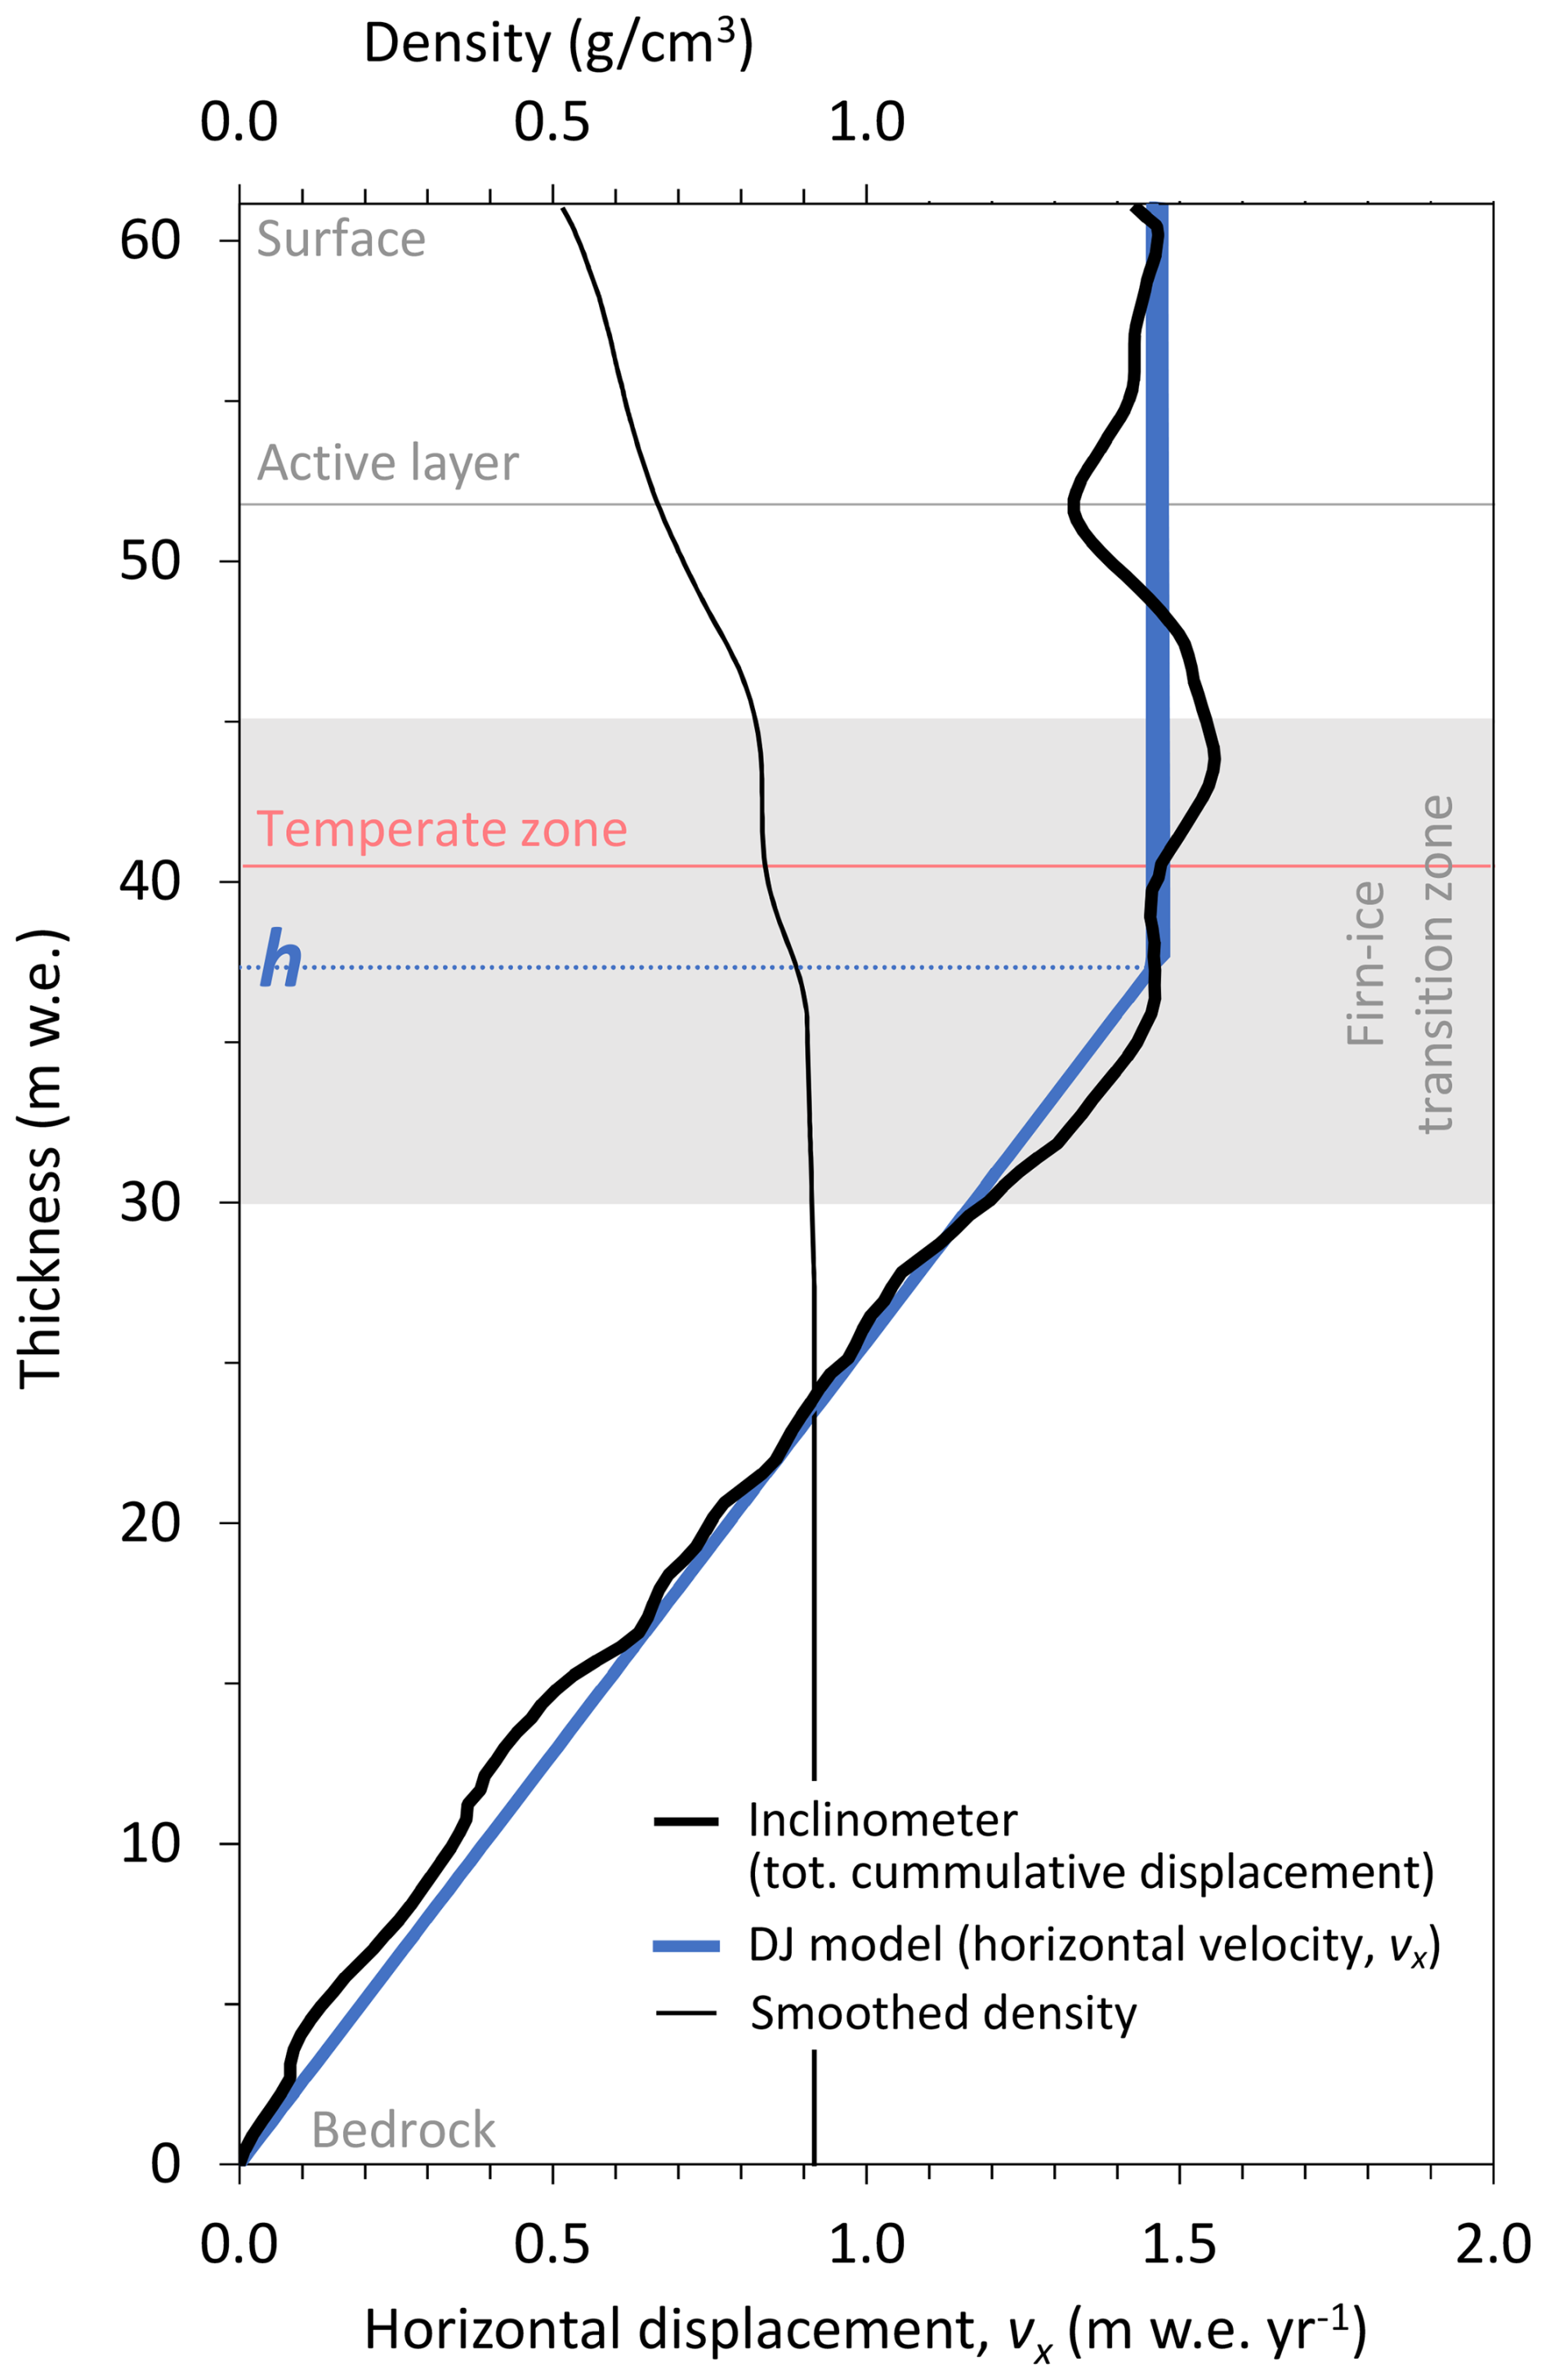
Figure 9Vertical profiles of density and annual horizontal displacement (i.e., vx) for the Alto dell'Ortles drilling site. Also indicated is the shear zone thickness h (DJ model parameter), which was here determined empirically based on the displacement measurements (see main text). The firn-ice transition zone, typically at a density between 0.830 to 0.917 g cm−3 (Cuffey and Paterson, 2006), is indicated by the grey shading while the grey and red lines mark the bottom of the active layer and temperate zone, respectively (see main text). The core #2 reference depth (Sect. 2) is here expressed as thickness, with the surface of depth zero corresponding to the total of 61.15 m w.e. (74.88 m).
A general limitation of modelling the age-depth relationship, independent on the complexity of the applied ice flow model, arises for the assumption of steady-state conditions. Unless additional glacier mass balance related information far into the past were available, this assumption is unavoidable. However, information about the age of a layer at a certain depth can provide invaluable constraints for model parameters that are not accessible otherwise (equally for models of lower or higher complexity). For reasonable and meaningful model output, the choice of parameter values is crucial. Here, we used two independent approaches (A1 and A2) for the determination of annual net accumulation rate (b) and h. A1 is based on present-day glaciological observations (Sect. 7.1), and A2 is based on the time information provided by the empirical dating described in this study (Sect. 7.2). We further used parameters from A1 in a mixed approach (B) with A2 (Sect. 7.3 and Table 4). In all cases steady-state conditions were assumed, which for the applied model (DJ) can be defined as: (i) constant glacier thickness (H), (ii) no-basal ice flow, (iii) constant annual net accumulation rates (b), and consequently, (iv) a constant shear zone thickness (h). For the glacier thickness H and the condition of non-basal flow, we relied on present-day observations. For H, we adopted the present value of 74.88 m (61.15 m w.e.) (Gabrielli et al., 2016), implying that the ice thickness had not changed significantly since glacier build-up at the drilling site ∼ 7 kyr BP. The “no-basal ice flow” assumption seems reasonable considering the ice temperature at bedrock of −2.8 °C in 2011 (Gabrielli et al., 2012), despite the recent warming.
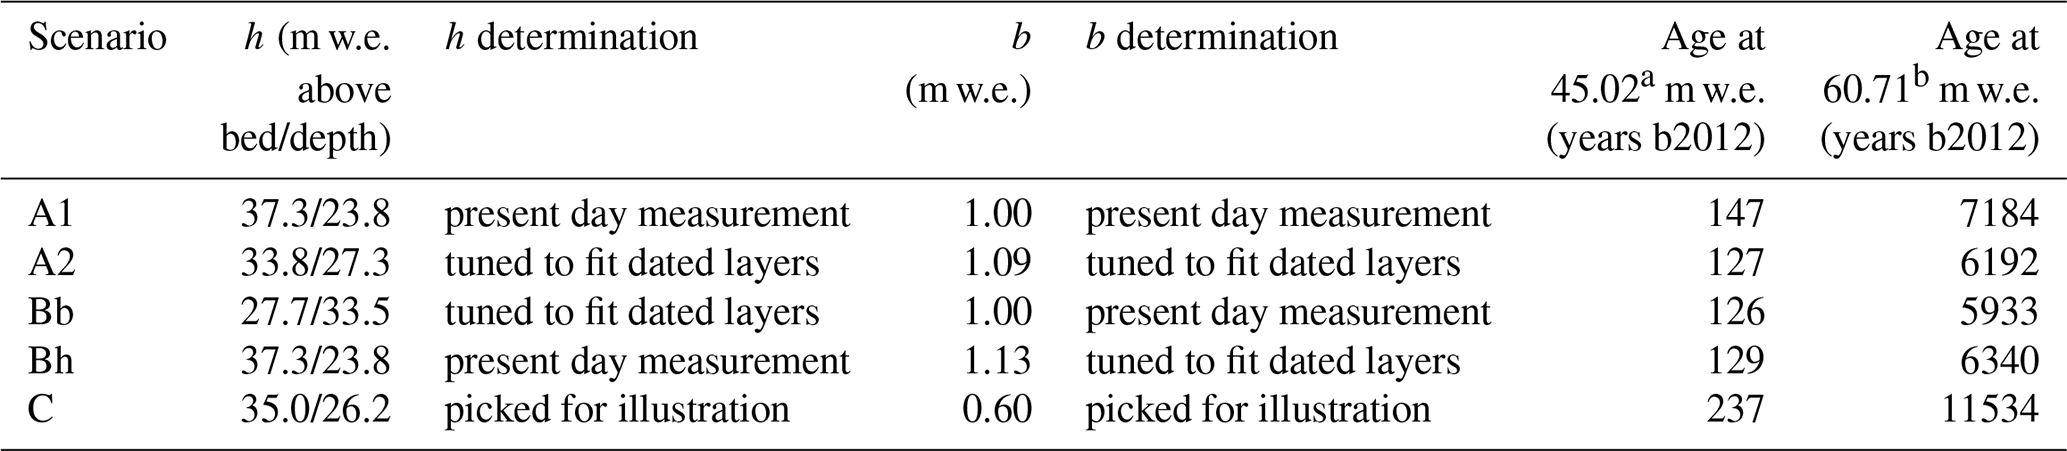
Table 4Summary of parameters and results for the different ice flow modelling scenarios. See main text, and Figs. 9 and 10 for additional details. The present-day determination for total thickness (H, 61.15 m w.e.) was used and kept constant across all scenarios.
a Depth to where annual layer counting could be performed, resulting with an age of 112 ± 10 years before 2012. b Mid-depth of the lowermost dated layer with a calibrated 1 sigma 14C age range of 6383–7227 years before 2012.
7.1 Approach A1: determination of b and h based on present-day glaciological observations
For b, the value of 1.0 m w.e. yr−1 as derived from field observations was considered as a best available estimate (Gabrielli et al., 2016; Festi et al., 2015). For the determination of h, we took advantage of the available data from englacial cumulative displacement measurements obtained with an inclinometer in fall 2011 (borehole #2; see Fig. 4 in Gabrielli et al., 2016). The vector sum of the measured displacement along the two spatial axis (x, y) yields a direct measure of vx for each depth (relative to the lowermost layer measured). The displacement was measured over a 43 d period (Gabrielli et al., 2016). We here assumed a constant velocity throughout the year for upscaling of the measured displacement to a full year, and, because the DJ model requires units to be in m w.e. (see Sect. S3 in the Supplement), transformation from m was performed using a smoothed profile of the measured density in the ice core (Gabrielli et al., 2016; see Fig. 9). The smoothing thereby accounts for spatial inhomogeneities in firnification. The profile indicates a clear imprint/variation related to the transition between the characteristic Alto dell'Ortles zones (Fig. 9): (i) the active layer, with a displacement signal observed elevation above the bedrock of ∼ 52 m w.e., which is in agreement with determination based on englacial temperature measurements (Roberto Seppi, personal communication, 2022), and (ii) the temperate zone, within 0.5 m of the depth previously reported (Gabrielli et al., 2016). Notably, the profile of horizontal displacement per year (i.e., vx) allows determination of a best estimate value for the shear zone height h of 37.3 m w.e. (obtained by the method of least residual sum of squares between measured and the DJ model approximation of vx). The degree of consistency between the measured and modelled vx vertical profile is remarkable (see Fig. 9). We consider this as a strong argument for the applicability of the DJ ice flow model for the Alto dell'Ortles drilling site and likely also for other alpine glacier settings characterized by strong layer thinning near bedrock.
7.2 Approach A2: determination of b and h based on time information provided by the empirical dating
In this case, both b and h were treated as free model parameters. The best set of values was then derived from minimization of the misfit between the DJ modelled ages and those of the empirically dated layers listed in Table S3 (least sum of time-weighted squares of residuals; Fahnenstock et al., 2001). This approach results in values of 1.09 m w.e. yr−1 and 33.8 m w.e. for b and h, respectively.
7.3 Approach B: combination of approaches A1 and A2
Either b or h was pre-set as derived in A1 while the other parameter was kept free, with its value then derived following the minimization methodology described for A2. By prescribing b=1.0 m w.e. yr−1, the value of h with the least misfit is 27.7 m w.e. (approach Bb). By prescribing h=37.3 m w.e., the resulting value for b is 1.13 m w.e. yr−1 (approach Bh).
7.4 Ice flow model results, interpretations and limitations
The model parameter values, either inferred from present-day observations (A1) or based on information related to time (ice core) (A2), lay within a relatively narrow range (1.0–1.13 m w.e. yr−1 and 27.7–37.3 m w.e. for b and h, respectively). This is remarkable considering that:
- i.
for A1, b is based on 8 years of observations while h presumably reflects flow conditions of a significantly longer time span due to delayed glacier response to changing conditions, see e.g. Cuffey and Paterson (2006).
- ii.
for A2, b and h reflect their corresponding averages for a time-period of ∼ 7000 years.
While parameters b and h determined in approach A1 are likely not directly related due to glacier response times, approach A2 demonstrates how empirically derived time markers enable consistent and realistic estimates of model parameters, even in the absence of recent glaciological observations. By constraining b and h with time information (approaches A2 and B), model results that fulfil the equation of continuity and respect mass conservation can be brought into agreement with empirical dating (see Sect. 7.1). This is illustrated by the time span between the lowermost layer dated by 14C and the surface (6383–7227 years b2012, 1σ uncertainty range), which agrees reasonably with the modelled results obtained using parameter sets from A2 (6192 years b2012) and B (5933 and 6340 years b2012 for Bb and Bh, respectively). Approach B further provides insights into the robustness and sensitivity of A2, showing that a change in the estimate of a single model input parameter necessitates adjustment of at least one of the other model parameters if the time span contained in the ice column is to remain fixed.
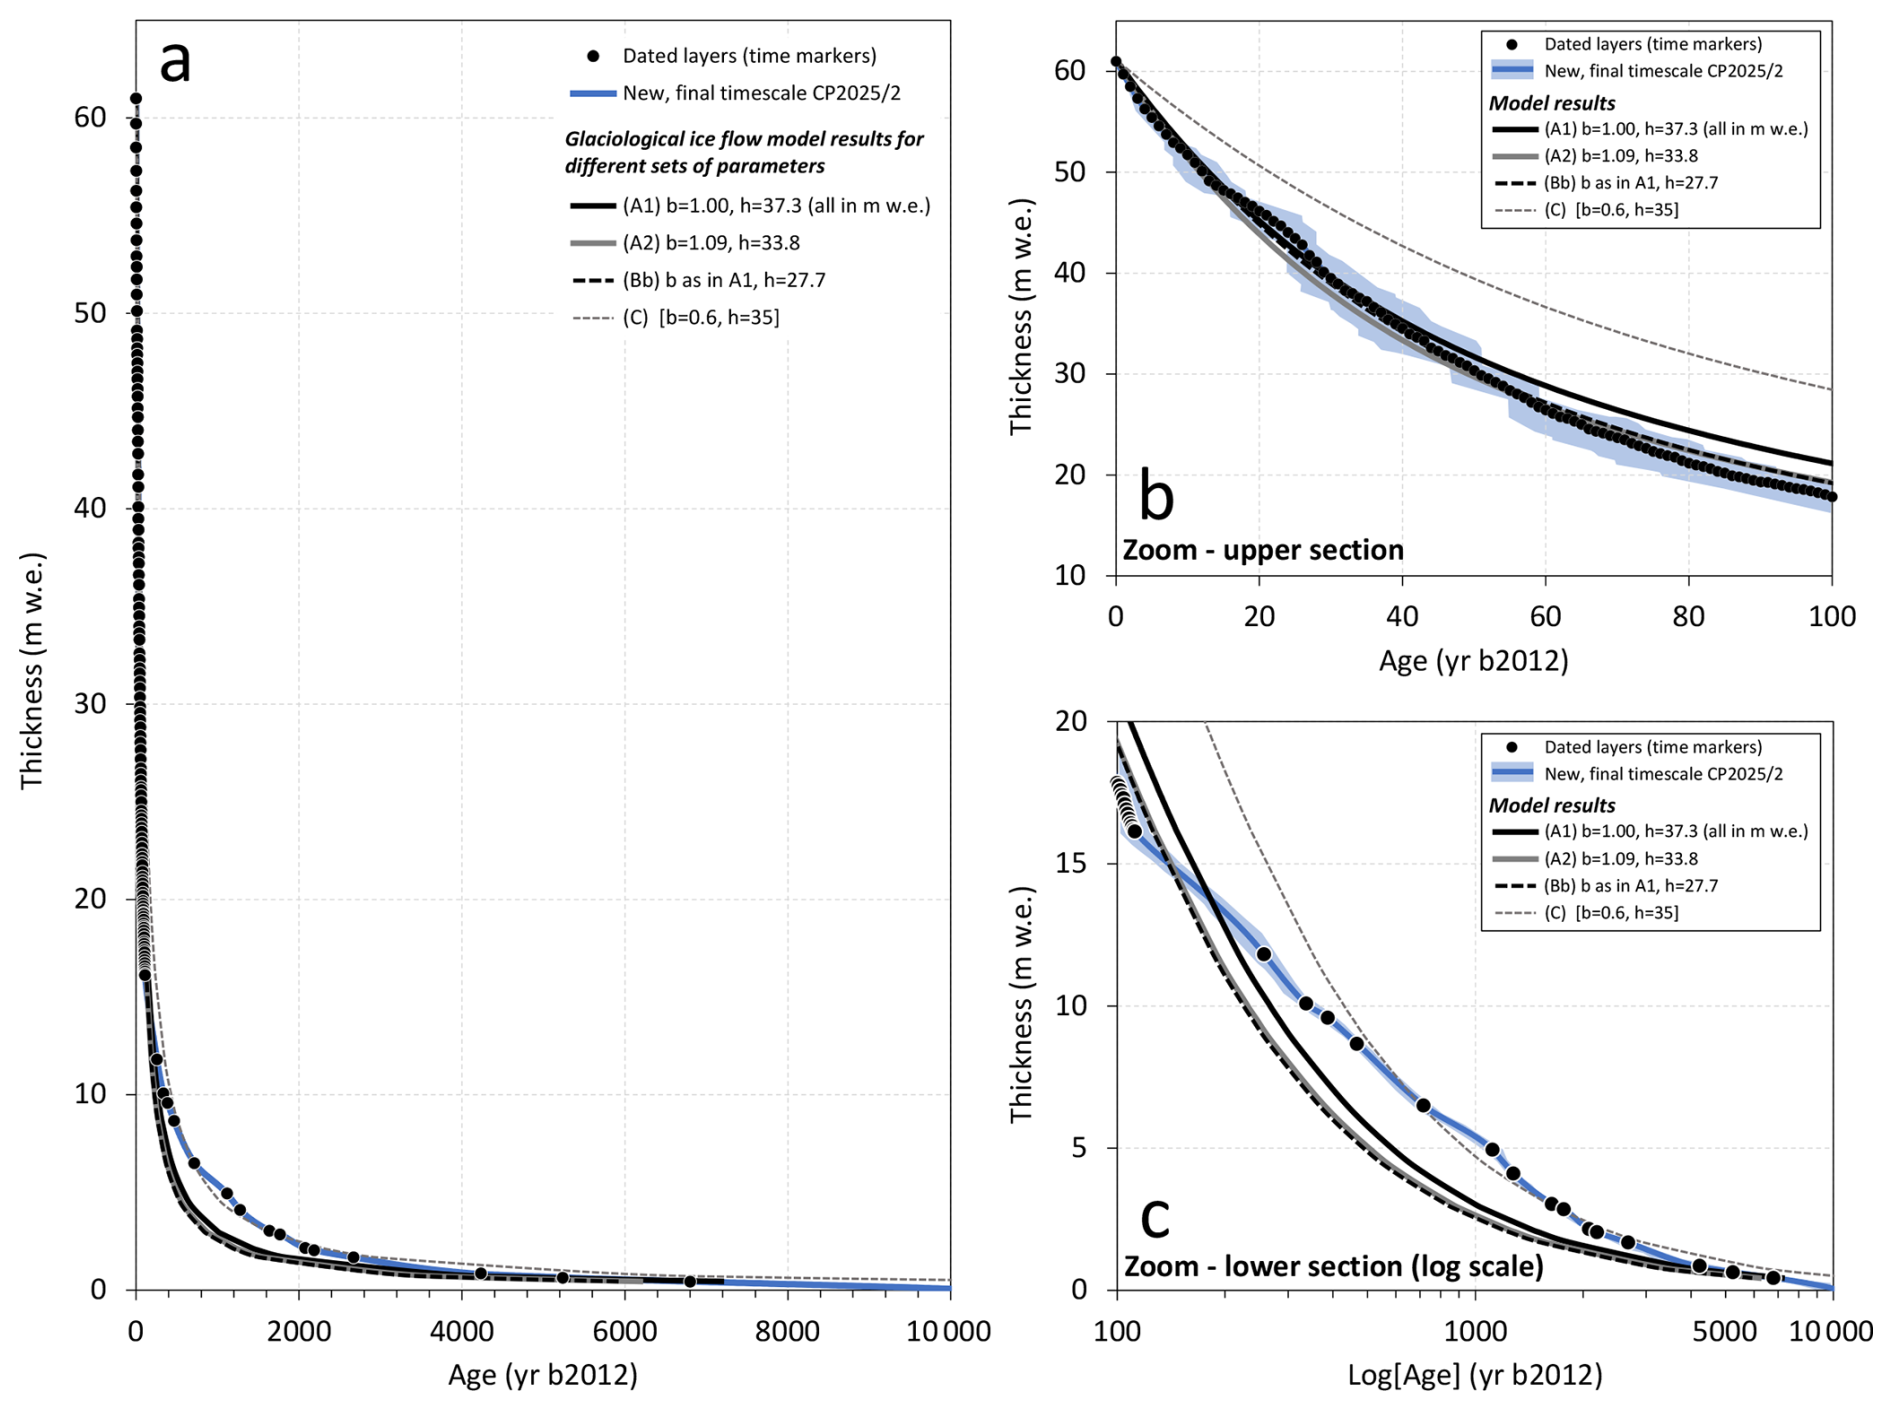
Figure 10Comparison of the revised, final empirical timescale for the Alto dell'Ortles ice cores (CP2025/2) with several runs of the Dansgaard-Johnsen glaciological ice flow model for the indicated sets of parameter values (see text for details). Shown in panel (a) for the entire length of the ice core from surface, indicated by the uppermost point, to bedrock covering the entire period covered by the Alto dell'Ortles ice archive, in panel (b) for the last 100 years, and in panel (c) for the older part of the record (> 100 years) on a logarithmic age scale. Depth, here expressed as thickness (with the surface corresponding to a total thickness of 74.88 or 61.15 m w.e., respectively), refers to the core #2 reference (Sect. 2).
The modelled timescales obtained with the different parameter sets are displayed in Fig. 10 (A1, A2 and Bb; Bh not shown as it is visually indistinguishable from A2 and Bb). The relatively narrow range of parameter values (b, h), and the agreement among the modelled timescales from A1, A2, and B, suggest that, over the entire period covered by the ice core, b (and consequently h) must on average have been close to their modern observed values. While for A1 the modelled total time span (7184 years) agrees well with the 14C-based absolute dating, this is not the case for the most recent 100 years (age determined by annual layer counting), where the model results from scenarios A2, Bb and Bh show better agreement (see Fig. 10b and Table 4).
Reasonably good agreement is obtained for all approaches between around 7000–4000 years b2012 (see Fig. 10). However, in the intermediate interval (4000–100 years b2012), none of the approaches reproduces the observations, underestimating the ice age by several decades to about one millennium in the upper and lower portions of this section, respectively (Fig. 10). This significant discrepancy suggests that conditions differed notably from the mid-Holocene until the end of the Little Ice Age (LIA; 1250–1850 CE) (PAGES 2k Consortium, 2013). The most plausible explanation is a period of reduced annual net accumulation during that time (see also below).
To test the hypothesis of changing net annual accumulations rates during that period, we used pre-set, hand-picked values for b (0.6 m w.e. yr−1) and h (35 m w.e.) as model input (approach C, Fig. 10, Table 4). With these values, the DJ model produces at least a partial match with the revised empirical CP2025/2 timescale for the intermediate section of the core (Fig. 10). Thus, while the steady-state assumption can be valuable for estimating the total time span of the ice archive (e.g. Lüthi and Funk, 2000), our results show that it is invalid (insufficient) to derive an accurate age-depth relationship, at least for the Alto dell'Ortles drill site. Here we note that the selected value of b=0.6 m w.e. yr−1 is unconstrained, and should therefore be considered qualitative, serving only to illustrate a possible change in net accumulation for the discussed period. To derive a quantitative estimate of b, a non-steady-state approach that explicitly considers the equation of continuity would be required (inverse modelling; see below).
Our ice flow modelling results suggest reduced snow accumulation during the central period of the Holocene (100–4000 years b2012), particularly during the LIA. A change in conditions for the depth interval corresponding the LIA, recorded just below ∼ 57 m depth (or ∼ 16 m w.e. above bedrock; Fig. 9), is consistent with intensification in visible ice layer thinning in the Alto dell'Ortles ice core cores (see Fig. 7b in Gabrielli et al., 2016) which is concomitant with a sudden increase in the frequency of the δ18O signal (Fig. 1). Although multiple paleoclimate archives indicate increased precipitation in the Alps during the LIA (Magny et al., 2011, and references therein), a lower snow accumulation on Alto dell'Ortles may be explained by a more efficient wind erosion of colder, low density surface snow due to lower air temperatures, particularly during the warm seasons from late spring through fall. If modern temperatures are indeed the highest since the Northern Hemisphere Climate Optimum, this mechanism could plausibly have operated from the onset of the mid-Holocene (∼ 4000 years ago) until the end of LIA (∼ 19th century).
The here suggested occurrence of variations in snow accumulation over time is not unprecedented and consistent with conclusions for high altitude glaciers. At a few low-latitude drilling sites it was possible to identify changes in past snow accumulation based on the dating by layer counting (Thompson et al., 2000; Winski et al., 2017) or 14C (Herren et al., 2013). The results of these studies implied non-steady-state conditions that impacted the timescale. While inverse modelling approaches that account for non-steady-state conditions and incorporate empirical time markers are well established for polar drilling sites (e.g. Buiron et al., 2011; Buchardt and Dahl-Jensen, 2008), similar efforts are clearly needed for glaciers from high altitude sites in mid- and low-latitude regions.
An intermediate revised chronology (CP2025/1) was obtained for the Alto dell'Ortles ice cores by an improved depth realignment of cores #1, #2, #3, incorporating an absolute time marker from a newly discovered 14C dated macro-organic fragment (232 ± 126 BCE); and new data points from counting annual layers (from pollen, dust and δ18O records) visually and by means of an automatic algorithm (StratiCounter) between 1900 and 2011. To derive CP2025/1, all the time markers were combined and fitted for a continuous depth-age scale by Markov chain Monte Carlo simulation. For the youngest section of the core, this already resulted in an improved and more accurate chronology when compared to the previously published version (TC2016), which only relayed on absolute dates from 210Pb in the youngest part (1900–2012 CE). The intermediate age scale was then used as the basis for subsequent synchronization of a new, highly-resolved ncPb concentration record from the Alto dell'Ortles Pb ice core with a well-dated polar ice core record from Akademii Nauk (AN, Russian Arctic) used as the age reference from 1755 CE back to 175 BCE. 11 additional tie points for model input were selected, thereby applying constraining criteria based on age and associated uncertainty of absolute 14C dates. By finally combining all available time markers (only tie-points for the synchronized range), the subsequent age model output yielded the final revised and fine-tuned new Alto dell'Ortles chronology CP2025/2. The absolute-dating-based and thus quantitatively controlled synchronization procedure described is recommended as a standard for future applications to ice cores from high-altitude (mountain) glaciers, whether aimed at establishing chronologies or supporting the interpretation of paleo-records. The new 14C age (232 BCE; stratigraphically consistent with the previous 14C dates), and the correlation between the ncPb CP2025/2 and AN records confirmed previous findings that stratigraphic disruption caused by disturbance in ice flow can be ruled out, at least for age inversions exceeding the current dating uncertainty and the resolvable spatial sampling resolution.
Finally, an ice flow model investigation of CP2025/2 was performed by adopting a simple 1D Dansgaard-Johnsen model, the results of which suggest that non-steady state conditions (e.g. changes in snow accumulation rate over time) need to be considered to explain the resulting CP2025/2 age-depth relationship. This particularly concerns the Little Ice Age (1250–1850 CE) when a decrease in snow accumulation rate was inferred, perhaps because of an increase of wind erosion efficiency. Clearly, non-steady state approaches that are currently used in polar regions should be considered and applied to model the ice flow at high altitude-low latitude ice core drilling sites.
In conclusion, this revised more accurate time scale (CP2025/2) will allow to provide additional detailed climatic environmental histories of Central Europe during the second half of the Holocene. In addition, CP2025/2 has the potential to become an important high-altitude term of comparison for multiple paleoclimate archives extracted at lower elevation in Central Europe.
The data presented in this work are archived at Zenodo: Calculated data sets including the time scale CP2025/2 (https://doi.org/10.5281/zenodo.19543480, Gabrielli et al., 2026), stable isotopes (https://doi.org/10.5281/zenodo.18339907, Dreossi, 2026); pollen (https://doi.org/10.5281/zenodo.18384389, Festi et al., 2026a; https://doi.org/10.5281/zenodo.18384281, Festi et al., 2026b; https://doi.org/10.5281/zenodo.18384151, Festi et al., 2026c) and lead (Pb) concentrations (https://doi.org/10.5281/zenodo.19026035, Bertò et al., 2026). Please contact the corresponding authors for access to data sets archived on Zenodo.
The supplement related to this article is available online at https://doi.org/10.5194/cp-22-1037-2026-supplement.
PG and TJ designed the structure of the revised chronology and wrote the paper; MB, PG and CB performed the continuous flow and discrete analyses of Pb; DF, WK and KO performed the pollen analyses and their interpretation; MW and DF adopted the StratiCounter algorithm to count annual layers; GD and BS studied the stable isotopes data set; PG, TJ and MB performed the matching of the ice core records; TJ designed/run the ice flow model experiments with initial input from MW and evaluated the results with PG and MS. All the authors discussed and reviewed the manuscript.
At least one of the (co-)authors is a member of the editorial board of Climate of the Past. The peer-review process was guided by an independent editor, and the authors also have no other competing interests to declare.
Publisher's note: Copernicus Publications remains neutral with regard to jurisdictional claims made in the text, published maps, institutional affiliations, or any other geographical representation in this paper. The authors bear the ultimate responsibility for providing appropriate place names. Views expressed in the text are those of the authors and do not necessarily reflect the views of the publisher.
This work is a contribution to the Ortles project, a program supported by the Fire Protection and Civil Division; Südtirol, Abteilung Bildungsförderung, Universität und Forschung of the Autonomous Province of Bolzano – Südtirol in collaboration with the Forest Division of the Autonomous Province of Bolzano – Südtirol and the National Park of Stelvio. We are grateful to: Giuliano Bertagna and Ping Nan Lin for performing Pb and δ18O analyses at OSU; and John Bolzan, Ian Howat, Luca Carturan and Roberto Seppi for useful discussions linked to the modelling section. We are also thankful to Joe McConnell and two anonymous reviewers for providing constructive suggestions that allowed to improve an earlier version of our manuscript. This is Ortles project publication 10.
This research has been supported by the National Science Foundation (grant nos. 1060115 and 1461422).
This paper was edited by Christo Buizert and reviewed by three anonymous referees.
Bertò, M., Barbante, C., and Gabrielli, P.: Pb concentrations in the Alto dell'Ortles ice cores, Zenodo [data set], https://doi.org/10.5281/zenodo.19026035, 2026.
Bohleber, P., Schwikowski, M., Stocker-Waldhuber, M., Fang, L., and Fischer, A.: New glacier evidence for ice-free summits during the life of the Tyrolean Iceman, Sci. Rep., 10, 20513, https://doi.org/10.1038/s41598-020-77518-9, 2020.
Bortenschlager, S. and Bortenschlager, I.: Änderung des Pollenflugs durch die Klimaerwärmung – Vergleichende Untersuchung Innsbruck/Obergurgl über den Zeitraum 1980–2001, Ber. nat.-med. Ver. Innsbruck, 90, 41–61, 2003.
Breitenbach, S. F. M., Rehfeld, K., Goswami, B., Baldini, J. U. L., Ridley, H. E., Kennett, D. J., Prufer, K. M., Aquino, V. V., Asmerom, Y., Polyak, V. J., Cheng, H., Kurths, J., and Marwan, N.: COnstructing Proxy Records from Age models (COPRA), Clim. Past, 8, 1765–1779, https://doi.org/10.5194/cp-8-1765-2012, 2012.
Bronk Ramsey, C.: Bayesian Analysis of Radiocarbon Dates, Radiocarbon, 51, 337–360, https://doi.org/10.1017/S0033822200033865, 2009.
Buchardt, S. L. and Dahl-Jensen, D.: At what depth is the Eemian layer expected to be found at NEEM?, Ann. Glaciol., 48, 100–102, https://doi.org/10.3189/172756408784700617, 2008.
Buiron, D., Chappellaz, J., Stenni, B., Frezzotti, M., Baumgartner, M., Capron, E., Landais, A., Lemieux-Dudon, B., Masson-Delmotte, V., Montagnat, M., Parrenin, F., and Schilt, A.: TALDICE-1 age scale of the Talos Dome deep ice core, East Antarctica, Clim. Past, 7, 1–16, https://doi.org/10.5194/cp-7-1-2011, 2011.
Cuffey, K. and Paterson, W. S. B.: The Physics of Glaciers, 4th Academic Press, Amsterdam, ISBN 978-0-12-369461-4, 2006.
Dansgaard, W. and Johnsen, S. J.: A Flow Model and a Time Scale for the Ice Core from Camp Century, Greenland, J. Glaciol., 8, 215–223, https://doi.org/10.3189/S0022143000031208, 1969.
Dreossi, G.: Oxygen isotope data from the Alto dell'Ortles ice cores (South Tyrol, Italy), Zenodo [data set], https://doi.org/10.5281/zenodo.18339907, 2026.
Eichler, A., Legrand, M., Jenk, T. M., Preunkert, S., Andersson, C., Eckhardt, S., Engardt, M., Plach, A., and Schwikowski, M.: Consistent histories of anthropogenic western European air pollution preserved in different Alpine ice cores, The Cryosphere, 17, 2119–2137, https://doi.org/10.5194/tc-17-2119-2023, 2023.
Fahnestock, M., Abdalati, W., Luo, S., and Gogineni, S.: Internal layer tracing and age-depth-accumulation relationships for the northern Greenland ice sheet, J. Geophys. Res., 106, 33789–33797, https://doi.org/10.1029/2001JD900200, 2001.
Festi, D., Kofler, W., Bucher, E., Mair, V., Gabrielli, P., Carturan, L., and Oeggl, K.: A novel pollen-based method to detect seasonality in ice cores: a case study from the Ortles Glacier, South Tyrol, Italy, J. Glaciol., 61, 815–824, 2015.
Festi, D., Carturan, L., Kofler, W., dalla Fontana, G., de Blasi, F., Cazorzi, F., Bucher, E., Mair, V., Gabrielli, P., and Oeggl, K.: Linking pollen deposition and snow accumulation on the Alto dell'Ortles glacier (South Tyrol, Italy) for sub-seasonal dating of a firn temperate core, The Cryosphere, 11, 937–948, https://doi.org/10.5194/tc-11-937-2017, 2017.
Festi, D., Kofler, W., and Oeggl, K.: Pollen occurrence in the Alto dell'Ortles ice core #1, Zenodo [data set], https://doi.org/10.5281/zenodo.18384389, 2026a.
Festi, D., Kofler, W., and Oeggl, K.: Pollen counts of the Alto dell'Ortles ice core #1, Zenodo [data set], https://doi.org/10.5281/zenodo.18384281, 2026b.
Festi, D., Kofler, W., and Oeggl, K.: DOY32, DOY46 and DOY match record pollen data from the Alto dell'Ortles glacier ice core #1 from the surface to a depth of 45.023 m w.e., Zenodo [data set], https://doi.org/10.5281/zenodo.18384151, 2026c.
Gabrieli, J.: Trace elements and Polycyclic Aromatic Hydrocarbons (PAHs) in snow and ice sampled at Colle Gnifetti, Monte Rosa (4450 m), during the last 10 000 years: environmental and climatic implication, PhD thesis, Department of Environmental Science, University of Venice, Venice, 178 pp., 2008.
Gabrieli, J. and Barbante, C.: The Alps in the age of the Anthropocene: the impact of human activities on the cryosphere recorded in the Colle Gnifetti glacier, Rend. Fis. Acc. Lincei, 25, 71–83, https://doi.org/10.1007/s12210-014-0292-2, 2014.
Gabrieli, J., Cozzi, G., Vallelonga, P., Schwikowski, M., Sigl, M., Eickenberg, J., Wacker, L., Boutron, C., Gäggeler, H., Cescon, P., and Barbante, C.: Contamination of Alpine snow and ice at Colle Gnifetti, Swiss/Italian Alps, from nuclear weapons tests, Atmos. Environ., 45, 587–593, https://doi.org/10.1016/j.atmosenv.2010.10.039, 2011.
Gabrielli, P., Carturan, L., Gabrieli, J., Dinale, R., Krainer, K., Hausmann, H., Davis, M., Zagorodnov, V. S., Seppi, R., Barbante, C., Dalla Fontana, G., and Thompson, L. G.: Atmospheric warming threatens the untapped glacial archive of Ortles mountain, South Tyrol, J. Glaciol., 56, 843–853, https://doi.org/10.4461/GFDQ.2012.35.10, 2010.
Gabrielli, P., Barbante, C., Carturan, L., Cozzi, G., Dalla Fontana, G., Dinale, R., Draga, G., Gabrieli, J., Kehrwald, N., Mair, V., Mikhalenko, V. N., Piffer, G., Rinaldi, M., Seppi, R., Spolaor, A., Thompson, L. G., and Tonidandel, D.: Discovery of cold ice in a new drilling site in the Eastern European Alps, Geogr. Fis. Dinam. Quat., 35, 101–105, 2012.
Gabrielli, P., Barbante, C., Bertagna, G., Bertó, M., Binder, D., Carton, A., Carturan, L., Cazorzi, F., Cozzi, G., Dalla Fontana, G., Davis, M., De Blasi, F., Dinale, R., Dragà, G., Dreossi, G., Festi, D., Frezzotti, M., Gabrieli, J., Galos, S. P., Ginot, P., Heidenwolf, P., Jenk, T. M., Kehrwald, N., Kenny, D., Magand, O., Mair, V., Mikhalenko, V., Lin, P. N., Oeggl, K., Piffer, G., Rinaldi, M., Schotterer, U., Schwikowski, M., Seppi, R., Spolaor, A., Stenni, B., Tonidandel, D., Uglietti, C., Zagorodnov, V., Zanoner, T., and Zennaro, P.: Age of the Mt. Ortles ice cores, the Tyrolean Iceman and glaciation of the highest summit of South Tyrol since the Northern Hemisphere Climatic Optimum, The Cryosphere, 10, 2779–2797, https://doi.org/10.5194/tc-10-2779-2016, 2016.
Gabrielli, P., Jenk, T., and Barbante, C.: Calculated data sets from Gabrielli et al., Climate of the Past, 2026, in: Climate of the Past, Zenodo [data set], https://doi.org/10.5281/zenodo.19543480, 2026.
Gäggeler, H. W., Tobler, L., Schwikowski, M., and Jenk, T. M.: Application of the radionuclide 210Pb in glaciology – an overview, J. Glaciol., 66, 447–456, https://doi.org/10.1017/jog.2020.19, 2020.
Herren, P.-A., Eichler, A., Machguth, H., Papina, T., Tobler, L., Zapf, A., and Schwikowski, M.: The onset of Neoglaciation 6000 years ago in western Mongolia revealed by an ice core from the Tsambagarav mountain range, Quat. Sci. Rev., 69, 59–68, https://doi.org/10.1016/j.quascirev.2013.02.025, 2013.
Hoffmann, H., Preunkert, S., Legrand, M., Leinfelder, D., Bohleber, P., Friedrich, R., and Wagenbach, D.: A New Sample Preparation System for Micro-14C Dating of Glacier Ice with a First Application to a High Alpine Ice Core from Colle Gnifetti (Switzerland), Radiocarbon, 60, 517–533, https://doi.org/10.1017/RDC.2017.99, 2018.
Jenk, T. M., Szidat, S., Bolius, D., Sigl, M., Gäggeler, H. W., Wacker, L., Ruff, M., Barbante, C., Boutron, C. F., and Schwikowski, M.: A novel radiocarbon dating technique applied to an ice core from the Alps indicating late Pleistocene ages, J. Geophys. Res. Atmos., 114, https://doi.org/10.1029/2009JD011860, 2009.
Legrand, M., McConnell, J. R., Preunkert, S., Wachs, D., Chellman, N. J., Rehfeld, K., Bergametti, G., Wensman, S. M., Oberthaler, M. K., and Friedrich, N.: Alpine ice core record of large changes in dust, sea-salt, and biogenic aerosol over Europe during deglaciation, PNAS Nexus, 4, 186, https://doi.org/10.1093/pnasnexus/pgaf186, 2025.
Lüthi, M. and Funk, M.: Dating ice cores from a high Alpine glacier with a flow model for cold firn, Ann. Glaciol., 31, 69–79, https://doi.org/10.3189/172756400781820381, 2000.
Magny, M., Peyron, O., Gauthier, E., Vannière, B., Millet, L., and Vermot-Desroches, B.: Quantitative estimates of temperature and precipitation changes over the last millennium from pollen and lake-level data at Lake Joux, Swiss Jura Mountains, Quat. Res., 75, 45–54, https://doi.org/10.1016/j.yqres.2010.11.001, 2011.
McConnell, J. R., Chellman, N. J., Wilson, A. I., Stohl, A., Arienzo, M. M., Eckhardt, S., Fritzsche, D., Kipfstuhl, S., Opel, T., Place Philip, F., and Steffensen Jørgen, P.: Pervasive Arctic lead pollution suggests substantial growth in medieval silver production modulated by plague, climate, and conflict, Proc. Natl. Acad. Sci., 116, 14910–14915, https://doi.org/10.1073/pnas.1904515116, 2019.
McConnell, J. R., Chellman, N. J., Plach, A., Wensman, S. M,. Plunkett, G., Stohl, A., Smith, N., Møllesøe Vinther, B., Dahl-Jensen, D., Steffensen, J. P., Fritzsche, D., Camara-Brugger, S. O., McDonald, B. T., and Wilson, A. I.: Pan-European atmospheric lead pollution, enhanced blood lead levels, and cognitive decline from Roman-era mining and smelting, Proc. Natl. Acad. Sci. USA, 122, e2419630121, https://doi.org/10.1073/pnas.2419630121, 2025.
Osman, M. B., Smith, B. E., Trusel, L. D., Das, S. B., McConnell, J. R., Chellman, N., Arienzo, M., and Sodemann, H.: Abrupt Common Era hydroclimate shifts drive west Greenland ice cap change, Nat. Geo., 14, 756–761, https://doi.org/10.1038/s41561-021-00818-w, 2021.
PAGES 2k Consortium: Continental-scale temperature variability during the past two millennia, Nat. Geosci., 6, 339–346, https://doi.org/10.1038/ngeo1797, 2013.
Paillard, D., Labeyrie, L., and Yiou, P.: Macintosh Program performs time-series analysis, Eos, Transactions American Geophysical Union, 77, 379–379, https://doi.org/10.1029/96EO00259, 1996.
Parrenin, F., Barnola, J.-M., Beer, J., Blunier, T., Castellano, E., Chappellaz, J., Dreyfus, G., Fischer, H., Fujita, S., Jouzel, J., Kawamura, K., Lemieux-Dudon, B., Loulergue, L., Masson-Delmotte, V., Narcisi, B., Petit, J.-R., Raisbeck, G., Raynaud, D., Ruth, U., Schwander, J., Severi, M., Spahni, R., Steffensen, J. P., Svensson, A., Udisti, R., Waelbroeck, C., and Wolff, E.: The EDC3 chronology for the EPICA Dome C ice core, Clim. Past, 3, 485–497, https://doi.org/10.5194/cp-3-485-2007, 2007.
Preunkert, S., McConnell, J. R., Hoffmann, H., Legrand, M., Wilson, A. I., Eckhardt, S., Stohl, A., Chellman, N. J., Arienzo, M. M., and Friedrich, R.: Lead and Antimony in Basal Ice From Col du Dome (French Alps) Dated With Radiocarbon: A Record of Pollution During Antiquity, Geoph. Res. Let., 46, 4953–4961, https://doi.org/10.1029/2019GL082641, 2019.
Ramsey, C. B.: OxCal 4.4.4 calibration program, https://c14.arch.ox.ac.uk/oxcal/OxCal.html (last access: March 2026), 2021.
Reimer, P. J., Austin, W. E. N., Bard, E., Bayliss, A., Blackwell, P. G., Bronk Ramsey, C., Butzin, M., Cheng, H., Edwards, R. L., Friedrich, M., Grootes, P. M., Guilderson, T. P., Hajdas, I., Heaton, T. J., Hogg, A. G., Hughen, K. A., Kromer, B., Manning, S. W., Muscheler, R., Palmer, J. G., Pearson, C., van der Plicht, J., Reimer, R. W., Richards, D. A., Scott, E. M., Southon, J. R., Turney, C. S. M., Wacker, L., Adolphi, F., Büntgen, U., Capano, M., Fahrni, S. M., Fogtmann-Schulz, A., Friedrich, R., Köhler, P., Kudsk, S., Miyake, F., Olsen, J., Reinig, F., Sakamoto, M., Sookdeo, A., and Talamo, S.: The IntCal20 Northern Hemisphere Radiocarbon Age Calibration Curve (0–55 cal kBP), Radiocarbon, 62, 725–757, https://doi.org/10.1017/RDC.2020.41, 2020.
Schwikowski, M., Eichler, A., Jenk, T. M., and Mariani, I.: Annually resolved climate signals in high-alpine ice cores, PAGES Mag., 22, 28–29, 2014.
Svensson, A., Dahl-Jensen, D., Steffensen, J. P., Blunier, T., Rasmussen, S. O., Vinther, B. M., Vallelonga, P., Capron, E., Gkinis, V., Cook, E., Kjær, H. A., Muscheler, R., Kipfstuhl, S., Wilhelms, F., Stocker, T. F., Fischer, H., Adolphi, F., Erhardt, T., Sigl, M., Landais, A., Parrenin, F., Buizert, C., McConnell, J. R., Severi, M., Mulvaney, R., and Bigler, M.: Bipolar volcanic synchronization of abrupt climate change in Greenland and Antarctic ice cores during the last glacial period, Clim. Past, 16, 1565–1580, https://doi.org/10.5194/cp-16-1565-2020, 2020.
Szidat, S., Salazar, G. A., Vogel, E., Battaglia, M., Wacker, L., Synal, H.-A., and Türler, A.: 14C Analysis and Sample Preparation at the New Bern Laboratory for the Analysis of Radiocarbon with AMS (LARA), Radiocarbon, 56, 561–566, https://doi.org/10.2458/56.17457, 2014.
Thompson, L. G., Yao, T., Mosley-Thompson, E., Davis, M., Henderson, K. A., and Lin, P. N.: A high-resolution millennial record of the South Asian Monsoon from Himalayan ice cores, Science, 289, 1916–1919, https://doi.org/10.1126/science.289.5486.1916, 2000.
Uglietti, C., Zapf, A., Jenk, T. M., Sigl, M., Szidat, S., Salazar, G., and Schwikowski, M.: Radiocarbon dating of glacier ice: overview, optimisation, validation and potential, The Cryosphere, 10, 3091–3105, https://doi.org/10.5194/tc-10-3091-2016, 2016.
Wedepohl, K. H.: The composition of the continental crust, Geochim. Cosmochim. Acta, 59, 1217–1232, 1995.
Winski, D., Osterberg, E., Ferris, D., Kreutz, K., Wake, C., Campbell, S., Hawley, R., Roy, S., Birkel, S., Introne, D., and Handley, M.: Industrial-age doubling of snow accumulation in the Alaska Range linked to tropical ocean warming, Sci. Rep., 7, 17869, https://doi.org/10.1038/s41598-017-18022-5, 2017.
Winstrup, M.: A Hidden Markov Model Approach to Infer Timescales for High-Resolution Climate Archives, 30th AAAI Conference on Artificial Intelligence and the 28th Innovative Applications of Artificial Intelligence Conference, Palo Alto, California, Phoenix, Arizona, USA, 4053, 2016, https://doi.org/10.1609/aaai.v30i2.19084, 2016.
Winstrup, M., Svensson, A. M., Rasmussen, S. O., Winther, O., Steig, E. J., and Axelrod, A. E.: An automated approach for annual layer counting in ice cores, Clim. Past, 8, 1881–1895, https://doi.org/10.5194/cp-8-1881-2012, 2012.
- Abstract
- Introduction
- Alto dell'Ortles ice cores: re-alignment of depth scales
- Time markers
- Construction of an intermediate timescale (CP2025/1) from the dating horizons
- Improving the intermediate timescale (CP2025/1) by synchronization with an Arctic Pb record
- Revised, final Alto dell'Ortles Age Scale CP2025/2
- Investigation of the empirical timescale CP2025/2 by glaciological ice flow modelling
- Conclusions
- Data availability
- Author contributions
- Competing interests
- Disclaimer
- Acknowledgements
- Financial support
- Review statement
- References
- Supplement