the Creative Commons Attribution 4.0 License.
the Creative Commons Attribution 4.0 License.
Sustainability of regional Antarctic ice sheets under late Eocene seasonal atmospheric conditions
Dennis H. A. Vermeulen
Michiel L. J. Baatsen
Anna S. von der Heydt
The Eocene–Oligocene transition (EOT) is marked by a sudden δ18O excursion occurring in two distinct phases approximately 500 kyr apart. These phases signal a shift from the warm middle to late Eocene greenhouse climate to cooler conditions, with global surface air temperatures decreasing by 3–5 °C and the emergence of the first continent-wide Antarctic ice sheet (AIS). While ice sheet modelling suggests that ice sheet growth can be triggered by declining pCO2, it remains unclear how this transition was initiated, particularly the first growth phase that appears to be related to oceanic and atmospheric cooling rather than ice sheet growth. Recent climate model simulations of the late Eocene show improved accuracy but depict climatic conditions that are not conducive to the survival of incipient ice sheets throughout the summer season. This study therefore examines whether it is plausible to develop ice sheets of sufficient scale to trigger the feedback mechanisms required to disrupt the atmospheric regime above the Antarctic continent during warm and moist late Eocene summers and establish more favourable conditions for ice expansion. We aim to assess the sustainability of an incipient AIS under varying radiative, orbital and cryospheric forcing. To do so, we evaluate Community Earth System Model 1.0.5 simulations, using a 38 Ma geographical and topographical reconstruction, considering different radiative and orbital forcings. The climatic conditions prevailing during (and leading up to) the EOT can be characterised as extremely seasonal and monsoon-like, featuring a short yet intense summer period and contrasting cold winters. A narrow convergence zone with moist convection around the region with high sub-cloud equivalent potential temperature exhibits a ring-like structure, advecting moist surface air from the Southern Ocean in both summer and winter. This advection leads to high values of moist static energy and subsequent precipitation in coastal regions. Paradoxically, this atmospheric regime – particularly its coastal precipitation in winter – appears to be necessary for the sustenance of the moderately sized regional ice sheets we imposed on the continent, contrary to our assumption that these ice sheets would disrupt the atmospheric regime. This underscores a hysteresis effect for regional ice sheets on the Antarctic continent, suggesting the potential for a significant volume of ice on the continent without imminent full glaciation prior to the EOT.
- Article
(13588 KB) - Full-text XML
- BibTeX
- EndNote
1.1 The Eocene–Oligocene transition and the inception of the Antarctic ice sheet
After the pinnacle of extreme warmth during the Early Eocene Climatic Optimum (EECO; 53–51 Ma) greenhouse world, temperatures globally decreased towards the end of the Eocene (EO) (Anagnostou et al., 2016). The subsequent Eocene–Oligocene transition (EOT; 34.44–33.65 Ma) shows a sudden oxygen isotope (δ18O) excursion in deep-sea benthic foraminifera (Hutchinson et al., 2021; Premoli Silva and Graham Jenkins, 1993). This excursion occurred in two distinct phases, separated by approximately 500 kyr: during the first phase (precursor event; 34.15 ± 0.04 Ma) δ18O increased with ∼ 0.5 ‰, indicating a widespread cooling is evident without large-scale ice build-up (Scher et al., 2011; Katz et al., 2008). During during the second phase (Earliest Oligocene Oxygen Isotope Step (EOIS): 33.65 ± 0.04 Ma) δ18O increased by ∼ 1.0 ‰, which is commonly interpreted as the occurrence of major glaciation without extensive cooling (Hutchinson et al., 2021). Moreover, the EOT is commonly interpreted as the onset of the first continent-wide Antarctic ice sheet (AIS) (Lauretano et al., 2021; Carter et al., 2017; Scher et al., 2014). This sudden ice sheet growth on Antarctica led the planet to its present-day icehouse state (Pandey et al., 2021) and is – apart from this δ18O excursion – commonly implied by (1) the deposition of ice-rafted debris around the Antarctic continental margins (Scher et al., 2011; Zachos et al., 1992) and glacial diamictites on the West Antarctic Peninsula (Ivany et al., 2006); (2) the documentation of an extensive sea level rise (fall) in Antarctic coastal (far-field) sediments, collectively indicating large-scale ice growth on the continent (Stocchi et al., 2013; Katz et al., 2008); and (3) the shift from a chemical to physical weathering regime on Antarctica (Robert and Kennett, 1997), evident in mineralogical (Passchier et al., 2013) and geochemical (Houben et al., 2013) changes.
During the lead-up to the EOT two major changes have occurred, both of which have been hypothesised as potential causes for the onset of Antarctic glaciation. The first involves continental reconfiguration, which led to the opening of both Drake Passage (DP) between Antarctica and South America and the Tasmanian Gateway (TG) between Antarctica and Australia. The resulting gateway hypothesis suggests that the opening of these passages led to a comprehensive reorganisation of ocean currents around Antarctica, the establishment of the Antarctic Circumpolar Current (ACC) and eventual cooling of the Antarctic region. Although this hypothesis finds support in deep marine proxies (Bijl et al., 2013) and early numerical modelling (e.g. Kennett, 1977), it has faced criticism because of three primary reasons: the process of gateway opening occurs over longer timescales (millions of years) compared to the abrupt onset of the first AIS (Coxall et al., 2005), the timing of the opening of these gateways is poorly established and does not seem to align with the timing of the glaciation (Wellner and Anderson, 2013), and modelling studies indicate that the opening of DP and TG has minimal to no impact on the formation of a continental Antarctic ice sheet (Pollard and DeConto, 2005; DeConto and Pollard, 2003).
Marine proxies such as boron isotope measurements (Pearson et al., 2009) and Mg/Ca ratios in benthic foraminifera (Katz et al., 2008) reveal a downward trend in atmospheric pCO2 levels throughout the Cenozoic era, decreasing from 1600 ± 200 ppm during the EECO to 850 ± 150 ppm during the EOT (Hönisch et al., 2023). This reduction forms the basis of the second hypothesis explaining the emergence of the AIS, as lower pCO2 levels could create favourable conditions for ice growth. This viewpoint is further substantiated by data derived from terrestrial proxies and pollen analysis from regions proximal to Antarctica, e.g. by examining bacterial lipids in southern Australia (Lauretano et al., 2021) and analysing δD in Patagonian volcanic glass (Colwyn and Hren, 2019). However, this hypothesis is also considered to have limitations, especially because the threshold of model-derived pCO2 required to trigger glaciation seems to be heavily dependent on the specific model used and is often significantly lower than what is indicated by proxy data (Goldner et al., 2014).
To reconstruct the growth pattern of the AIS, however, we require proxy data regarding EOT conditions of the Antarctic continent itself. Consequently, other methodologies to investigate landscape formation are crucial, such as seismic reflection (Gulick et al., 2017), radar imagery (Rose et al., 2013; Bo et al., 2009) or digital elevation models (Barr et al., 2022). These methods reveal that ice sheet expansion likely commenced with the emergence of small, high-elevation mountain glaciers within the interior mountain ranges of the continent (Rose et al., 2013; Wilson et al., 2013). These mountain glaciers contributed to the development of larger valley glaciers during a subsequent second phase, which then extended towards the continental margins (Bo et al., 2009), encompassing Sabrina Coast, Prydz Bay and the Weddell Sea (Gulick et al., 2017). The precise timing of these phases, however, remains unclear, and there are recent indications that high-elevation glaciers may have existed well before the EOT due to the occurrence of not just one but multiple EOT precursor events (Barr et al., 2022; Pandey et al., 2021). Subsequently, a period marked by numerous glaciation events persisted until approximately 32.8 Ma, when a stable AIS had definitively formed, encompassing 70 %–110 % of its present-day size and volume (Hutchinson et al., 2021).
1.2 Climate and ice sheet modelling across the EOT
When considering the pCO2 drawdown hypothesis and the timing of glaciation phases, the question remains regarding the degree to which declining pCO2 influenced the onset of Antarctic glaciation. In this context, general circulation models (GCMs) are utilised alongside offline ice sheet models (ISMs). In recent years, these GCMs have exhibited a growing ability to simulate snapshot climatic conditions that increasingly align with available proxy data. The primary contribution of these model studies lies in establishing a pCO2 threshold that functions as tipping point, beyond which continent-wide glaciation becomes inevitable (Tigchelaar et al., 2011). While this threshold has been previously set at 2.7 ± 0.7 PIC (pre-industrial carbon, where 1 PIC comprises 280 ppm pCO2 and 671 ppb pCH4) (Gasson et al., 2014; Ladant et al., 2014; DeConto et al., 2008), it appears to be significantly dependent on the model, and more recent studies struggle to establish a consensus on a universal value (Kennedy-Asser et al., 2020, 2019; Hutchinson et al., 2018). This variability can be attributed to – apart from the GCM and/or ISM used – differences in initial and boundary conditions, primarily concerning the prescribed Antarctic topography and geography along with the resultant atmospheric lapse rate, the absence or presence of an AIS, and pCO2. Insolation, driven by alterations in orbital parameters, seems to exert a secondary influence by determining the timing of glaciation, specifically in relation to cool(er) Southern Hemisphere summers; however, this effect is contingent upon pCO2 surpassing the threshold (DeConto et al., 2008). Once continental glaciation takes hold, height–mass balance and ice–albedo feedbacks establish a hysteresis effect, rendering the AIS resistant to warmer climatic periods driven by less favourable orbital parameters (Van Breedam et al., 2022; DeConto and Pollard, 2003).
A limitation of older low-resolution model studies lies in their depictions of an unrealistic middle to late Eocene climate that fall short in reconstructing the appropriate relative warmth. Recent simulations, however, have shown improved accuracy (Lunt et al., 2021, 2017), which are attributed to improved model physics (Zhu et al., 2019). Nevertheless, striving to align these late Eocene simulations more closely with proxy data, a paradox emerges: these simulations depict climatic conditions above the Antarctic continent that are not conducive to the survival of incipient ice sheets throughout the summer season but that reasonably align with available proxies (Baatsen et al., 2024). This study will therefore examine whether – within the constrained potential for limited ice growth in the late Eocene Antarctic climate – it is plausible to develop ice sheets of sufficient scale to trigger feedback mechanisms required to disrupt the atmospheric regime above the Antarctic continent during the warm late Eocene and establish more favourable conditions for ice expansion. To do so, we describe the simulations and the tools used to analyse both the sustainability of these ice sheets and the atmospheric regime under which they develop in Sect. 2. In Sect. 3 we present the climatic characteristics of the different model scenarios considered and describe the specific consequences of this highly seasonal regime on the sustainability of incipient ice sheets. We discuss our results regarding atmospheric regimes and conditions for sustainability of moderately sized ice sheets in Sect. 4. Finally, we will present our main conclusions in Sect. 5.
2.1 Model set-up and simulation scenarios
All model simulations were executed using the Community Earth System Model (CESM), version 1.0.5, developed at the American National Center for Atmospheric Research. This GCM comprises four distinct components: Community Atmosphere Model 4 (Neale et al., 2013), configured with a horizontal resolution of 2.5° × 1.9° and encompassing 26 vertical hybrid-sigma levels extending up to 2 hPa; Parallel Ocean Program 2 (Smith et al., 2010), configured with a horizontal resolution of 1.25° × 0.9° and encompassing 60 vertical layers ranging in thickness from 10 to 250 m; Community Land Model 4 (Lawrence et al., 2011), in which all anthropogenic influences have been eliminated, employed in a static configuration; and Community Ice Code 4 (Hunke et al., 2015), constrained to generate sea ice only when ocean water temperature falls below −1.8 °C.
Three of four model simulations (Table 1) discussed here were conducted by Baatsen et al. (2020), all using 38 Ma boundary conditions: (1) incorporating 4-PIC (4.69 pre-industrial (PI) pCO2 equivalent) pCO2 forcing to simulate the warm middle Eocene climate (4PIC); (2) incorporating 2-PIC (2.15 PI pCO2 equivalent) pCO2 forcing to replicate a cooling trend towards the EOT during the late Eocene (2PIC/s); and (3) incorporating 2-PIC pCO2 levels plus orbital parameters that induce minimal summer insolation at southern high latitudes (2PIC/l) to prompt favourable conditions for ice growth. For more information about specific model parameters and initialisation, see Baatsen et al. (2020). The final 100 years of each model run are used in this study to generate a representative climatology, distinguishing four different Antarctic regions (Fig. 1). For clarity, greenhouse gas forcings will be indicated as radiative forcing in the text below, whereas insolation forcings will be indicated as orbital forcing.
Table 1Model parameters for the four distinct scenarios modelled by Baatsen et al. (2020). Here, e represents eccentricity, ε obliquity, precession and Fs the solar constant.
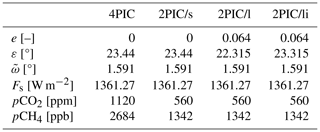
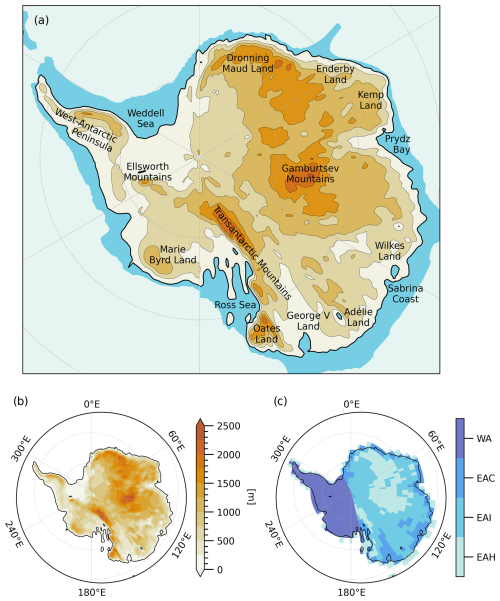
Figure 1Points of interest are shown in panel (a), model topography is shown in panel (b) and regional differentiation of the Antarctic continent is shown in panel (c). West Antarctica (WA) includes all area between 166 and 330° E, East Antarctica coast (EAC) encompasses all other area below 500 m, East Antarctica interior (EAI) covers all other area between 500 and 1300 m, and East Antarctica highlands (EAH) comprises all area above these elevation values.
Moreover, we used 2PIC/s to initialise ice sheet model IMAUICE (Berends et al., 2022), an ISM that employs the shallow-ice approximation (SIA) and incorporates a modified topography from Wilson et al. (2012), projected onto an Antarctic Polar Stereographic grid with a horizontal resolution of 40 × 40 km. IMAUICE was run until equilibrium was achieved after 30 kyr. The model output was regridded to align with the CESM grid using the GPlates software package (Boyden et al., 2011) and a set of reconstructed plate trajectories (van Hinsbergen et al., 2015; Seton et al., 2012). Surface mass balances (SMBs) were computed using the insolation–temperature method (de Boer et al., 2014). Various ISM simulations were conducted with different lapse rates and orbital, melt and stress parameters; however, no combination resulted in large-scale ice growth. Nevertheless, inducing a cooling of mean summer (DJF) Ts by 5 °C did trigger ice sheet growth (w1m05; Fig. 2), leading to the development of moderately sized, stable ice sheets in Dronning Maud Land, Oates Land and the West Antarctic Peninsula.
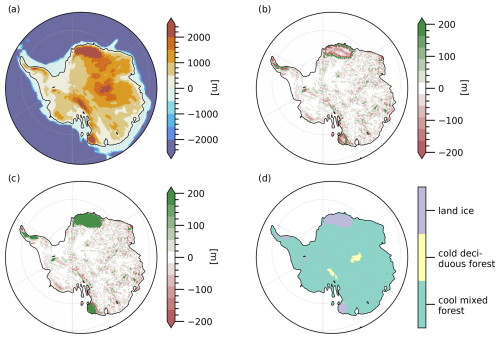
Figure 2Ice grid transformed into a vegetation mask for input to CESM1.0.5. Panel (a) displays Antarctic surface topography with w1m05 ice sheets, smoothed using a 3 × 3 kernel. Panel (b) shows the difference between the effect of the grid smoothing, i.e. the difference between the unsmoothed Antarctic surface topography with w1m05 ice sheets and the smoothed topography. Panel (c) illustrates the difference between the original ice-free input for 2PIC/l and the smoothed topography. Panel (d) depicts the resulting vegetation mask.
In an effort to explore the potential for the development of an incipient ice sheet under the most favourable climatic conditions, for this study we initiated an additional CESM simulation to the above-mentioned three that branched off of the end of 2PIC/l. This simulation, 2PIC/li, is conducted over a 400-year period and incorporates a vegetation/land mask that accounts for land ice (Fig. 2). Since the resulting ice sheets in the IMAUICE simulation are stable in form, whereas the reduction in summer Ts between 2PIC/s and 2PIC/l due to favourable orbital forcing is also ∼ 5 °C, the ice sheet topography in this land mask is based on w1m05. Since our primary interest lies in atmospheric output and the only alteration in 2PIC/li is the sudden imposition of several moderately sized regional ice sheets, stable outcomes were achieved within a relatively short simulation time of ∼ 75 years with no spin-up necessary (not shown here). Nevertheless, to avoid any potential complications, we adopted 100-year climatologies from the interval between 300–400 years of simulation time.
2.2 Atmospheric metrics
We differentiate three variables to compare the atmospheric regime above the Antarctic continent between the different scenarios mentioned above, focusing on the examination of moisture and energetic characteristics of the atmosphere:
with Qnet [W m−2] being the net radiation balance (see Boos and Storelvmo, 2016), where SW represents shortwave radiation, LW represents longwave radiation, LHF represents latent heat flux, SHF represents sensible heat flux, s represents the surface, and ToA represents the top of the atmosphere;
where θeb [K] is ∼ 980 hPa sub-cloud equivalent potential temperature (see Hurley and Boos, 2013), where ps represents surface pressure and pd dry-air pressure at the level of T, Rd represents the gas constant for dry air and Rv for water vapour, cd represents specific heat at constant pressure for dry air and cl for liquid water, H represents relative humidity, and q represents specific humidity;
where MSE is vertically integrated (from the surface to the tropopause at 200 hPa) moist static energy [GJ m−2] (see Smyth and Ming, 2020, and Hill et al., 2017), where Lv represents latent heat of vaporisation, cp represents specific heat at constant pressure for water vapour, and z represents the air parcel's height.
Qnet aids in analysing the atmosphere's radiative state. Employing a convective quasi-equilibrium framework, θeb in turn offers a simplified depiction of the vertical tropospheric structure as a single near-surface variable. Although this simplification undoubtedly overlooks complexities, it facilitates the analysis of the atmosphere's convective state. A similar rationale applies to MSE, which remains conserved during adiabatic ascent and helps analysing the atmosphere's energetic state.
2.3 Ice sheet sustainability
In order to evaluate the potential sustainability of regional ice sheets under 2PIC/li climatic conditions, we use four different methods to calculate surface mass balance (all in units of m yr−1). The first method is based on the surface energy balance (see van den Broeke et al., 2011; SMB1). The three other methods are based on the amount of positive degree days (PDDs). PDDs serve as proxy for the available melt energy on days with a positive Ts (Braithwaite, 1984). Assuming that all annual precipitation falls as snow, this melt can be calculated in different ways: employing a fixed melt rate with PDD calculated as the annual sum of Ts exceeding 0 °C (see Heyman et al., 2013; SMB2), employing a fixed melt rate with PDD calculated using a semi-empirical linear relationship that incorporates a Ts variability term to account for missing information about synoptic variability and the diurnal cycle (see Bauer and Ganopolski, 2017; SMB3), and employing the aforementioned semi-empirical linear relationship but introducing separate melt rates for snow and ice melt (ice melt occurs when all annual precipitation – in the form of snow – is melted away and the ice sheet base becomes exposed) and considering a refreezing factor for the nocturnal refreezing of snow (see Bauer and Ganopolski, 2017; SMB4).
The equations governing these four methods are as follows:
with
and with
where ci=333.55 kJ kg−1 represents the latent heat of fusion of water; α=4 mm °C−1 d−1 represents a fixed melt rate, represents the annual sum of Ts above 0 °C, and αi=8 mm °C−1 d−1 represents the ice melt rate. Regarding PDD, Δt=1 year represents the time step, while σ=5 °C represents a fixed standard deviation of Ts that is representative for present-day ice sheets (see Bauer and Ganopolski, 2017), and since no specific information is available about empirical relationships for Ts in the Eocene, we apply it in this context as well, with erfc(x) representing the complementary error function. Finally, regarding Q, αs=3 mm °C−1 d−1 represents the snow melt rate and rs=0.3 the refreezing factor. Furthermore, SMBs are calculated in such a way that ice melt only occurs over ice sheets, and all SMBs are defined positively for accumulation.
3.1 Climatologies
Figure 3 presents a climatology of 2 m surface temperature (Ts) and monthly precipitation (P) for all four model scenarios, distinguishing between the above-mentioned regions. P displays the most variation in 4PIC, with high levels in December and January, followed by a sharp decrease in February, a substantial increase in autumn (MAM), and gradual drying from June to October. This variability is less pronounced in the other three scenarios, although DJ and MAM retain their relatively wet periods. Among the EO scenarios, EAI emerges as the warmest region and also the driest region. EAC and EAH are the coldest areas, with EAC experiencing significant P in autumn and winter, while EAH is notably wet during summer only. Due to the rapid decrease in Ts between January and February, we define summer for the remainder of this study as DJ (i.e. not DJF).
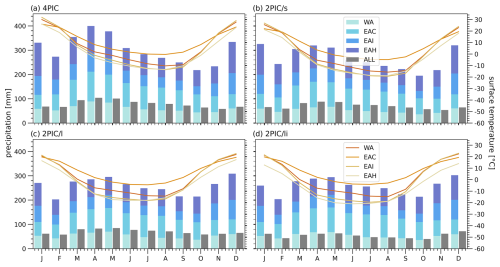
Figure 3A 100-year climatology for different Antarctic regions. All four EO scenarios are depicted. Lines represent Ts, while bars represent monthly P. Different colours indicate the different regions. The grey bars represent continent-averaged (i.e. not summed) monthly P.
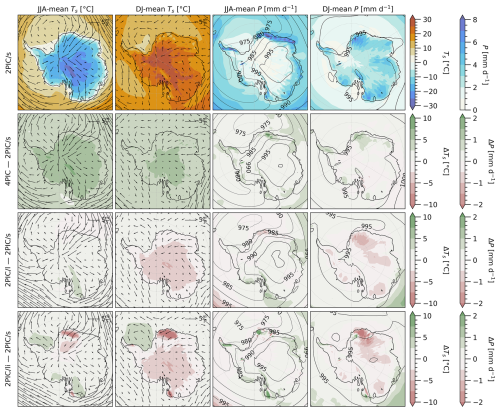
Figure 4DJ and JJA means for 2PIC/s, and DJ- and JJA-mean Ts and P anomalies for the other three scenarios. Maps display Ts (shading in columns 1 and 3), P (shading in columns 2 and 4), u850 (vectors in columns 1 and 3) and ps (contour lines in columns 2 and 4). The anomaly rows for Ts and P show u850 and ps means rather than anomalies.
Figure 4 illustrates JJA and DJ means and JJA-mean and DJ-mean anomalies of Ts, P, 850 hPa wind (u850) and mean sea level pressure (ps). Additionally, Table A1 provides the regional mean and spatial standard deviation of these variables. Summers are notably warm (reaching up to 35 °C), particularly in EAI, whereas winters are cold (ranging between −15 and −20 °C). Among all scenarios, EAC displays the weakest seasonality, characterised by cool summers and mild winters, while EAH shows the most pronounced contrast between the seasons. The seasonal variation in P is also evident. In EAH, summer (∼ 3 mm d−1) is wetter than winter (∼ 1.5 mm d−1). In EAC, winters receive substantial precipitation (up to 8 mm d−1), particularly along the coastal regions of Dronning Maud Land and the more eastward areas. Seasonality slightly decreases when radiative and orbital forcing are reduced.
Apart from the effects of heat and moisture, we observe ascending air above the centre of the continent during summer. This results in weak 10 m winds that move from the 50–100° E sector towards the South Pole and from the pole either towards ∼ 0° E or the 180–250° E sector (see Fig. 1 for the longitude grid). However, u850 remains low (1–2 m s−1) and decreases somewhat when radiative forcing and summer insolation decrease. In winter, the situation is different: a high-pressure area with strongly descending air forms above the Antarctic interior, causing the meridional ps gradient to intensify. This results in a flow coming from the 0–70° E sector over the South Pole towards the 180–230° E sector. When taking orographic effects into account, this circulation leads to wet conditions on the coast of Dronning Maud Land and the eastern part of the West Antarctic Peninsula. This circulation pattern persists throughout all four scenarios.
Decreasing radiative and orbital forcing predominantly affects Ts: average P remains relatively stable (∼ 2.2 mm d−1), while Ts undergoes a significant reduction from ∼ 28 to ∼ 20 °C (Fig. 5). Only EAH shows a different regime, demonstrating a significant correlation between Ts and P with r=0.67. For ALL, EAI and EAC, correlations are significant but weak, with r=0.22, r=0.13 and , respectively. WA does not show any significant correlation. Furthermore, we observe that the imposition of ice sheets only significantly influences Ts and P in EAH (becoming colder and drier, although mainly over the imposed ice sheets themselves), whereas EAI and WA appear to become slightly warmer.
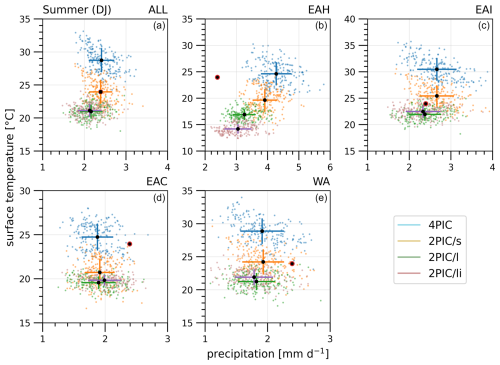
Figure 5Ts yearly variation plotted against their corresponding P data point, categorised into an Antarctica-wide average and the four regions. The mean is depicted by a black marker, and the coloured lines indicate 1 (spatial) standard deviation. The x and y axes are not consistent across the panels. Therefore, a black dot with a red edge is plotted in every panel to mark the 2.5 mm d−1/25 °C point.
3.2 Atmospheric regime
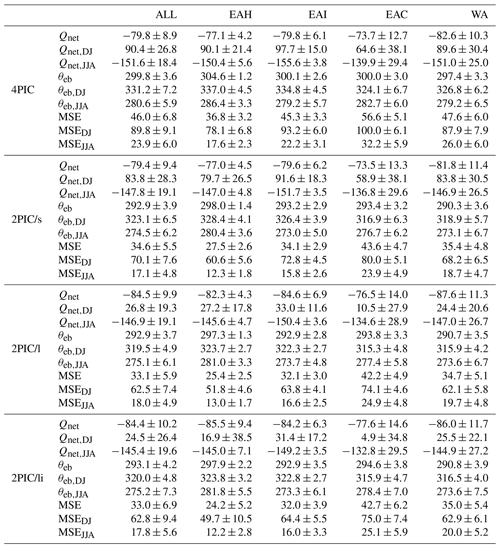
Heating of the EO Antarctic atmosphere initiates convection and subsequent precipitation, driven by a net radiation surplus. The influence of a low-insolation orbital configuration becomes evident when comparing Qnet between 2PIC/s and 2PIC/l, revealing a Qnet reduction of ∼ 70 % (Fig. 6 and Table A2). Among regions, WA and EAH receive the continent-average amount of summer radiation in all scenarios, while EAI receives more and EAC receives less. However, there is significant spatial variability within these regions, given the large standard deviation in average Qnet. Large amounts of radiation lead to elevated θeb in all scenarios, but the substantial difference in orbital forcing between 2PIC/s and 2PIC/l does not yield a similar difference for θeb. EAC consistently exhibits lower θeb in summer compared to EAH and EAI.
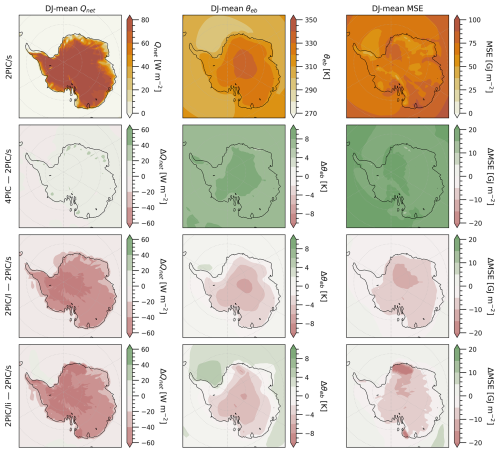
Figure 6DJ mean for 2PIC/s and DJ-mean Qnet (left panels), θeb (middle panels) and MSE (right panels) anomalies for the other three scenarios. The contours have different scales for each variable; however, they are normalised to effectively display the range of possible values.
The attraction of moisture from the surrounding Southern Ocean yields high values for MSE across the southwest of Dronning Maud Land and over Oates Land and Adélie Land (Fig. 6). Moisture tends to be most abundant in coastal regions and progressively diminishes further inland in EAI and EAH. The topography thus leads to convection of moist air, which inevitably results in precipitation. We discussed P above, revealing the wettest conditions over Dronning Maud Land, Oates Land, Adélie Land and George V Land, which are all elevated areas relatively close to the Antarctic coast. Dronning Maud Land in particular experiences substantial P during summer. Notably, while Oates Land and Adélie Land maintain relatively high MSE with decreasing pCO2 and insolation, even in 2PIC/l, MSE decreases over Dronning Maud Land in 2PIC/l by approximately 30 %.
3.3 Effects of imposed ice sheets
The introduction of moderately sized regional ice sheets on the Antarctic continent under favourable orbital forcing leads to a slightly drier climate that is accompanied by temperatures comparable to those in 2PIC/l (Fig. 3). Throughout the year, ps remains marginally higher in 2PIC/li compared to 2PIC/l. The EAH region displays the most significant reduction in Ts and P due to the inclusion of ice sheet areas within its bounds, whereas EAC shows minimal differences (Fig. 4). The continent-wide Ts mean for 2PIC/l and 2PIC/li exhibits nearly equivalent values, whereas the largest standard deviations are observed for Ts,JJA, implying more pronounced regional anomalies during winter than during summer (Table A1).
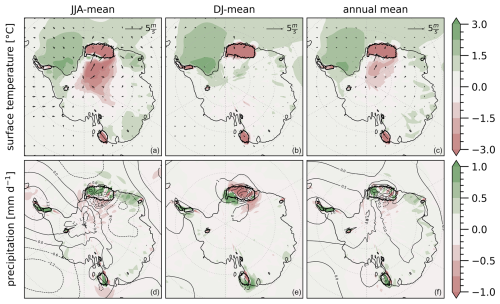
Figure 7DJ- and JJA-mean anomalies between 2PIC/li and 2PIC/l climatologies. Maps display Ts (a–c), P (d–f), u850 (vectors in panels (a)–(c)) and ps (contours in panels (d)–(f)) anomalies.
Regions with imposed ice sheets consistently exhibit lower temperatures in both summer and winter (Fig. 7). Over the ice sheet areas, conditions become drier in summer and wetter in winter. Conversely, surrounding areas (situated south of the Dronning Maud Land ice sheet and west of the ice sheets on Oates Land and the West Antarctic Peninsula) experience increased wetness in summer and reduced wetness in winter. Regarding surface temperature, the Weddell Sea and Enderby Land demonstrate higher Ts,JJA, but EAH and EAI experience substantial cooling during winter. The decline in Ts to the south of Dronning Maud Land in winter appears to be linked to a significant shift in wind patterns, marked by a reduced onshore component of the wind. This change is associated with a slight increase in ps over WA and a slight decrease over EAI and EAC, yielding a weakened airflow across the continent from Dronning Maud Land to Marie Byrd Land. During summer, ps significantly increases over the Dronning Maud Land ice sheet, and there is a slight increase over the rest of the continent.
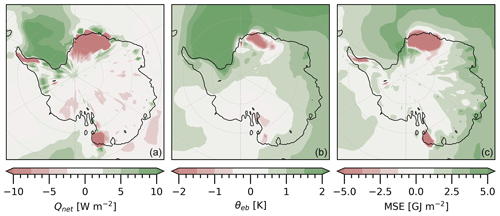
Figure 8DJ-mean Qnet, θeb and MSE anomalies between 2PIC/li and 2PIC/l. The contours have different scales for each variable but are normalised to effectively display the range of possible values.
The warm and moist atmospheric circulation during Antarctic summer remains largely unchanged when regional ice sheets are imposed (Fig. 8). However, notable regional anomalies emerge over and near the ice sheets. The high albedo of the ice sheets leads to reduced Qnet, resulting in lower θeb values within the ice sheet centres. Moreover, the presence of ice sheets leads to decreased moisture content and MSE. A distinct feature is observed in the Weddell Sea area, where higher values of Qnet and θeb along with slightly higher MSE levels are noted. Additionally, EAC exhibits slightly higher θeb and increased MSE values. Note that Qnet slightly decreases over much of the continent, while both θeb and MSE seem to slightly increase.
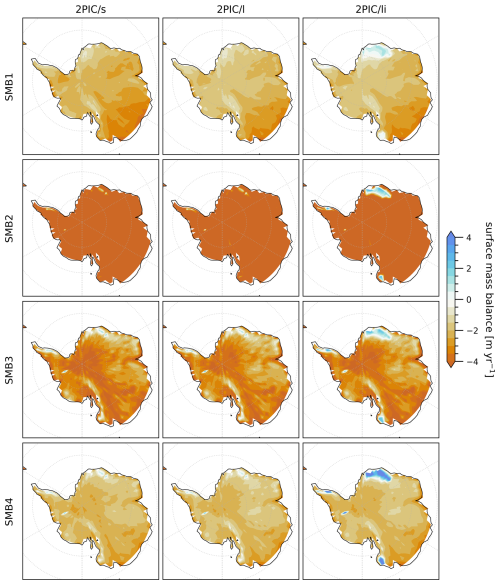
Figure 9Surface mass balances of imposed regional ice sheets for 2PIC/li (right panels) calculated using four different methods: (1) one based on the surface energy balance (SMB1); (2) a simple PDD method (SMB2); (3) a PDD method including a variability term (SMB3); and (4) a PDD method including a variability term, a refreezing factor, and separate melt rates for snow and ice (SMB4). All four methods are also used to consider SMBs for 2PIC/s and 2PIC/l (left and middle panels).
All methods yield a (strongly) positive SMB over the ice sheet areas in 2PIC/li, although SMB2 only shows positive values over the higher central parts of the ice sheets (Fig. 9, right panels). SMB1 shows less strong positive values, but it covers a larger area where SMB is positive. Incorporating a variability term for Ts in calculating PDD (i.e. comparing SMB2 and SMB3) results in a slightly larger area with positive SMB. Differentiating between different melt factors for snow and ice (SMB4) yields an even larger area with positive SMB. This last method also indicates positive SMBs in the high areas of the Transantarctic Mountains and the Gamburtsev Mountain Range and towards the coastal areas of Enderby Land and Kemp Land. When comparing SMB1 and SMB4 for the 2PIC/s and 2PIC/l scenarios (Fig. 9, left and middle panels), the same areas for ice sheet expansion become evident albeit with significantly less positive values for SMB.
4.1 Climatologies
In the previous section, we described the consistently highly seasonal climate of the late Eocene Antarctic under various radiative and orbital forcing scenarios featuring very warm summers and cold winters. Inland seasonality is especially large, whereas the coastal regions experience milder summers and winters. These areas also receive more winter than summer precipitation, whereas the opposite holds for the higher interior regions. In the latter, we also find higher θeb values. Moreover, these EO simulations reveal a robust meridional flow that facilitates significant moisture transport towards Antarctica. This flow emerges due to the absence of a weak meridional temperature gradient in summer and due to a cyclonic polar vortex situated over the Weddell Sea accompanied by an anticyclone positioned above EAI and EAH in winter. This seems to be a crucial part of the late Eocene Antarctic climate, as the circulation pattern basically redirects the storm track (which is already close to the continent) inland, resulting in very high winter precipitation over Dronning Maud Land and West Antarctica. In summer, a persistent cyclone forms, characterised by relatively weak winds over EAI and EAH. Ascending air is observed within this cyclonic system, providing conducive conditions for the initiation of convection.
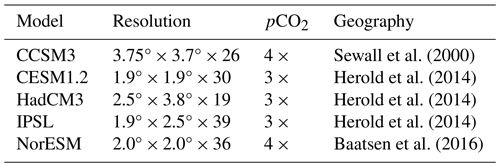
Qualitatively, it is reasonable to expect that during JJA a thermal high-pressure area forms over the (eastern) Antarctic continent, while a thermal low-pressure area develops over the Weddell Sea, with this dipole pattern being a consistent feature across all scenarios. This pattern could, however, be dependent on the model, and thus we have compared the results discussed above with findings from five other GCMs (figures not shown here) evaluated within the context of the Eocene Model Intercomparison Project (EoMIP; Lunt et al., 2012) and the Deep-Time Model Intercomparison Project (DeepMIP; Lunt et al., 2021, 2017). While the time period under investigation in both projects is focused on the EECO (∼ 50 Ma) rather than the late Eocene, the boundary conditions are akin to those employed in this paper (Table A3). We see that CESM1.0.5, the model utilised throughout this study, compares well with other high-resolution models, showing EAI Ts within the range of 25–30 °C, with cooler temperatures (15–20 °C) in EAC. Strikingly, CESM1.2 – the successor of CESM1.0.5 – displays a distinct pattern, portraying less warm Ts and cold air over the Gamburtsev Mountain Range. Regarding ps, high pressure dominates over the continent in all models, although magnitudes vary across the models. CESM1.0.5 in the 4PIC scenario is very wet for DJ: only IPSL comes up with a similar P pattern over Dronning Maud Land, but its magnitude is smaller than for 4PIC, whereas CCSM3 and HadCM3 only show a moderate signal in EAI. CESM1.2 and NorESM show barely any signal at all. Notably, all models except CCSM3 project relatively moist conditions during summer over Dronning Maud Land, Wilkes Land, Oates Land and the West Antarctic Peninsula, but other seasons demonstrate even higher levels of P. Based on this small comparison, we thus conclude that the large seasonality observed in CESM1.0.5 is a robust feature that is also evident in other models.
4.2 Atmospheric regime
Very high Qnet,DJ values for 4PIC and 2PIC/s are evident, primarily due to the continuous austral summer sun (Table A2). The influence of orbital parameters is also apparent, with low-insolation parameters in 2PIC/l leading to a large reduction in Qnet. This surplus of available energy initiates a range of interconnected processes, beginning with an increase in tropospheric T. Relatively high θeb, especially over EAI and EAH (e.g. centred above the Gamburtsev Mountain Range), yields unstable air columns. Given that maxima in θeb align with maxima in upper-tropospheric temperature Tu (Nie et al., 2010), we anticipate the occurrence of vigorous moist convection within a (narrow) convergence zone around the θeb maximum. The remaining region consists of (broad) areas characterised by descending air, thus completing the overturning circulation. Convection is then observed in regions around the edges of a high-pressure system that encompasses the entire interior of the Antarctic continent, characterised by high θeb (Fig. 6). Likely because this area has a ring-like structure around the pole, surface air is advected from all around the continent (see also DJ-mean u850 in Fig. 4). The incoming air, originating from the Southern Ocean, carries moisture, resulting in high MSE in these areas. In order to reach the central part of the continent, air must ascend in almost every region, eventually leading to precipitation. The inflow of maritime air also moderates Ts in these areas, especially when contrasted with the lower-lying interior of the continent that extends through the valley between the Transantarctic Mountains and the Gamburtsev Mountain Range towards George V Land.
Peak rainfall often coincides with peak surface MSE in monsoonal configurations due to the fact that cooler and drier air predominantly results in shallow convection (Biasutti et al., 2018). MSE exhibits higher surface values during summer compared to winter, and this pattern is similarly observed for 4PIC in contrast to 2PIC/s and 2PIC/l (Fig. 6). However, this trend is not as clearly visible when considering column-integrated MSE (not shown here). Given that the spatial distribution of MSE is primarily influenced by the spatial arrangement of qe and that regions characterised by high qe are regions where precipitation does not rain out significantly, the linkage between MSE and peak rainfall is not evident. Furthermore, very wet regions (Dronning Maud Land, Oates Land, George V Land, and the area spanning Prydz Bay to the Gamburtsev Mountain Range) do not necessarily correspond to very warm areas, which is likely attributed to the influx of colder air originating from the Southern Ocean. Only the interior of Dronning Maud Land receives over 60 % of its annual precipitation during summer, while Oates Land, Adélie Land, George V Land, and a narrow coastal strip of Dronning Maud Land also witness significant rainfall during winter.
In these scenarios, we therefore find a monsoon-like atmospheric regime, albeit at completely different latitudes from where such climates are typically observed today. Our use of various atmospheric metrics broadens this monsoon-like classification compared to the monsoon index recently employed by Baatsen et al. (2024). Additionally, Jacques et al. (2014) identified proxies for significant seasonality in precipitation in EO Antarctica, with summer precipitation rates up to 3 mm d−1 and a summer-to-winter precipitation ratio of more than 55 %, both of which are comparable to our findings. They attribute the discrepancy between their findings and model outcomes (which generally predict cold and dry conditions) to the underestimation of Ts in model simulations and hypothesise that high- and low-pressure systems alternate more strongly from summer to winter than model simulations suggest. This alternation would result in a seasonal sea-breeze-like circulation, with the advection of moist air towards the continent in summer and dry offshore winds in winter. What we add to their findings is a more nuanced view: the inland regions are very dry and cold in winter and moist and very warm in summer, while the EAC region experiences surface temperatures below freezing in winter but with an excessive amount of precipitation due to the constant onshore transport of moist air towards the continent's interior.
4.3 Effects of imposed ice sheets
The height and likely also the size of the imposed regional ice sheets (for reference, the Dronning Maud Land ice sheet in 2PIC/li reaches a maximum elevation of approximately 4.5 km) appear to influence the atmospheric circulation. However, the effects remain regional and do not extend across the entire continent. The interior of the continent, along with the coastal areas of East Antarctica that are unglaciated, seem to experience little to no influence from the ice sheets on Dronning Maud Land, Oates Land and the West Antarctic Peninsula (Fig. 7). However, areas of EAH and EAI around ice sheets, on average, become slightly colder and drier. In contrast, areas over the ice sheets are greatly influenced: they become drier in summer, wetter in winter and colder year-round. Under these conditions, these ice sheets appear to demonstrate capacity for self-sustenance: despite the still relatively warm summer conditions, SMBs remain nearly positive to strongly positive across the entire ice sheet area (Fig. 9). Since ice sheets were imposed based on lowered annual surface temperatures, this result is not trivial; importantly, it suggests that there is potential space – particularly in Dronning Maud Land and Oates Land – for expansion in the surrounding vicinity, which is also evident in Kemp Land and the high regions of the Gamburtsev Mountain Range and the Transantarctic Mountains.
Other significant changes occur over the Weddell Sea region, where Ts is notably higher during both summer and winter (Fig. 7). During summer, increased incoming Qnet contributes to higher Ts, enhanced evaporation, and subsequently higher qe and MSE (Fig. 8). The anti-clockwise and positive pressure anomaly over the Weddell Sea yields airflow from Coats Land encountering the Dronning Maud Land ice sheet, after which air converges and ascends, resulting in positive P anomalies in that area. In winter, the airflow pattern is somewhat similar to the pattern in 2PIC/l, crossing the continent from Dronning Maud Land towards the 180–230° E sector. Although less powerful, air still cools as it moves over and primarily along the Dronning Maud Land ice sheet towards the South Pole and the interior of the continent. The Weddell Sea thus exhibits large positive Ts anomalies, but its impact on the atmospheric circulation over the continent itself appears to be limited. Nevertheless, a warmer Weddell Sea could be a potential source for increased precipitation in Dronning Maud Land and the West Antarctic Peninsula, which would in winter lead to increased snow and ice build-up.
Comparing our model results with available proxies is challenging, as most of these proxies are representative only for marine environments. Terrestrial proxies from South America and Australia suggest a global Ts decrease of approximately 3–5 °C during the EOT (Colwyn and Hren, 2019; Pound and Salzmann, 2017), while other proxies indicate a smaller Ts decrease (Lauretano et al., 2021). Methods for subglacial examination of glacial cirques suggest that the AIS likely expanded from high-elevation mountain ranges or interior massifs toward coastal areas (Rose et al., 2013; Bo et al., 2009), a process that might have occurred well before the EOT (Barr et al., 2022; Gulick et al., 2017). Furthermore, evidence from Antarctic glaciation, based on δ18O excursion events, suggests that this glaciation likely occurred within a relatively short time frame of ∼ 500 kyr (Hutchinson et al., 2018). The decrease in Ts indicated by these proxies is comparable to the Ts decrease observed between the 2PIC/s and 2PIC/l scenarios (Table A1), which suggests that such a cooling trend could be caused by favourable orbital conditions. The regional ice sheets that could develop in response to this change in orbital forcing are of such a size that they could sustain themselves; however, these ice sheets do not appear to grow from high interior mountain ranges but seem to initiate in areas closer to the coast. The Dronning Maud Land ice sheet particularly shows promise for expansion toward the continent's interior, contrary to the traditional assumption that has it growing radially outward towards the Southern Ocean.
To assess the influence of the different components of the calculated SMBs, we conducted an additional analysis in which we set the various contributing elements in Eqs. (4)–(7) (i.e. SWs, LWs, LHF, SHF, , Ts and Pann) to zero (Ts at 0 K, not 0 °C) for 2PIC/li one at a time (see Gasson et al., 2014; Fig. 10). When examining SMB1, the sensible heat flux appears to have minimal impact (only slightly above ice sheet areas, where less heat being absorbed from the atmosphere into the ice means a positive effect on the SMB), while the latent heat flux exerts a (slightly) negative influence (less evaporation leads to less energy loss and therefore a negative effect on the SMB). Longwave radiation seems crucial in maintaining the SMB at its current level, as its absence results in a significantly more negative SMB across all areas. Conversely, shortwave radiation acts as a constraint on a high SMB, with its absence leading to a marked increase, resulting in a more “classical” radiation balance.
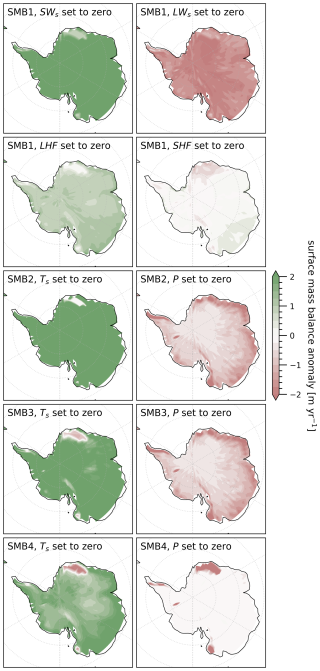
Figure 10Surface mass balance anomalies for 2PIC/li. For SMB1, we set one component of Eq. (4) to zero for each term in this balance (SWs, LWs, LHF and SHF, respectively). For SMB2, SMB3 and SMB4, we set the contribution of either T or P in Eqs. (5)–(7) to zero (, Ts and Pann, respectively). Anomalies are shown with positive values showing an SMB increase.
In the context of SMB2, SMB3 and SMB4, the regions where ice sheets have formed in IMAUICE as described in Sect. 2 seem to be areas where precipitation is the dominant factor. In these areas, SMB becomes less positive in the absence of precipitation, whereas other parts of the interior seem more sensitive to temperature, as the SMB increases when Ts is set to zero. Some high-elevation areas also exhibit reduced sensitivity to temperature, suggesting they should be classified within this precipitation regime. Notably, these effects are most pronounced in SMB4, the most nuanced calculation. In SMB2 and SMB3, EAC is sensitive to precipitation as well, while EAI and EAH also show sensitivity to temperature. These precipitation-dominated and temperature-dominated regimes are important in the context of potential formation sites for new ice nuclei: in regions where we have imposed regional ice sheets, precipitation is sufficient to maintain these ice sheets despite relatively unfavourable temperatures. Additional sites of interest, where increased precipitation could lead to similar outcomes, then include the high areas of the Gamburtsev Mountain Range and the Transantarctic Mountains. An imposed ice sheet in these regions would likely behave similarly to those we have placed on Dronning Maud Land, Oates Land and the West Antarctic Peninsula, although more precipitation may be necessary for its sustained existence. Ice sheets in other areas would not benefit from this effect and would likely melt away.
We observe SMBs in the range of 1–2 m yr−1, potentially enabling the development of substantial ice sheets over a few thousand years. In terms of surface mass balance, a δ18O excursion period of ∼ 500 kyr then seems plausible to envision the growth of a continent-wide ice sheet, especially when accounting for positive feedback mechanisms that amplify ice sheet expansion. However, the type of insolation minimum we modelled here is mostly based on precession and therefore only lasts 5–10 kyr. SMB would then have to remain substantially high under a much wider range of orbital parameters to yield this long excursion period of 500 kyr. The limited climatic differences between the 2PIC/s and 2PIC/l scenario would nonetheless suggest that this could indeed be the case.
This study presented an analysis of Antarctic climate simulations at 38 Ma, representing the late Eocene and the EOT, as conducted by Baatsen et al. (2020). The primary focus was to assess the sustainability of an incipient AIS under varying radiative, orbital and cryospheric forcing. The central hypothesis presented above was that an incipient AIS, comprising various regional ice sheets, could induce sufficient changes in the atmospheric circulation to moderate or even disrupt the warm and moist summer climate. We aimed to shed light on the question of how the AIS emerged within a relatively short time frame of around 500 kyr, given that summer temperatures on Antarctica could easily reach 30 °C during immediately preceding periods.
The climatic conditions prevailing during (the lead-up to) the EOT can be characterised as extremely seasonal, featuring a short yet intense summer period and contrasting cold winters. Precipitation patterns exhibit distinctly regional characteristics, with coastal areas being most wet during winter, while Dronning Maud Land, Oates Land, Adélie Land and George V Land experience the largest P during summer. The interannual variability within this climate is limited and aligns with results from other GCM simulations, although it is challenging to make a direct comparison between outcomes due to the distinct boundary conditions utilised across various models. Nonetheless, it is evident that the climatic conditions prevailing at 38 Ma would have been highly inhospitable to ice sheet growth for most of the continent, as limited snow accumulation is expected to survive the summer season.
This is also reflected in our characterisation of the monsoon-like nature of the atmospheric circulation, which is characterised by a warm, moist and persistent summer climate driven by continuous incoming solar radiation, as reflected in Qnet. Furthermore, we observed a narrow convergence zone with moist convection around the region where θeb is high. This area exhibits a ring-like structure, with moist surface air being advected from the Southern Ocean in both summer and winter. This advection leads to high MSE values and subsequent precipitation in these coastal regions. Paradoxically, this atmospheric regime – particularly its coastal precipitation in winter under favourable orbital and moderate radiative conditions – appears to be necessary for the sustenance of the moderately sized regional ice sheets we have imposed on the continent, which runs contrary to our assumption that these ice sheets would disrupt the atmospheric regime over the Antarctic continent. Our findings emphasise a significant hysteresis effect for regional ice sheets on the Antarctic continent, suggesting that these may have been present for a substantial amount of time prior to the EOT without necessarily implying continent-wide glaciation. Instead, they may have functioned as a transitional link between the warm and moist climate of the late Eocene and the onset of full Antarctic glaciation during the EOT.
Table A1Annual, DJ, and JJA mean and (spatial) standard deviation for Ts [°C] and P [mm d−1]. The values are provided for Antarctica as a whole and specifically for EAH, EAI, EAC and WA. Values encompass all four scenarios.
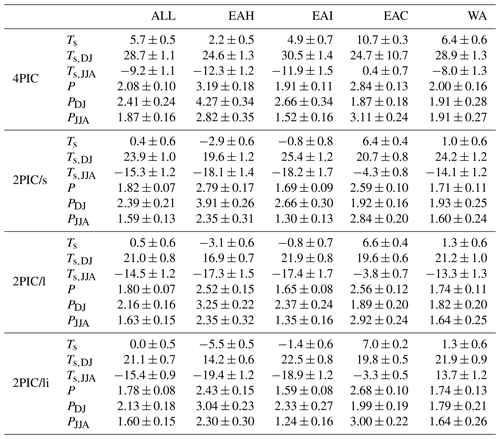
Table A2Annual, DJ, and JJA mean and (spatial) standard deviation for Qnet [W m−2], θeb [K] and MSE [GJ m−2]. The values are provided for Antarctica as a whole and specifically for EAH, EAI, EAC and WA. Values encompass all four scenarios.
All model output is post-processed using Python 3.12. A selection of the model data used to generate the main figures in this paper and the necessary grids and software code is publicly available on the Utrecht University Yoda platform via https://doi.org/10.24416/UU01-YDFULA (Vermeulen, 2024). The above data are post-processed to be more accessible and only contain the variables considered in this specific work. The full data from the respective model simulations are available upon reasonable request from the authors.
DHAV conceived the idea for this study, after which DHAV, ASvdH and MLJB contributed to the conceptualisation of the narrative and analyses needed. MLJB and ASvdH designed the 4PIC, 2PIC/s and 2PIC/l model simulations. DHAV and MLJB designed the 2PIC/li model simulation. DHAV post-processed the data, conducted the analyses and constructed the figures. DHAV set up a first draft of the manuscript. MLJB and ASvdH provided revisions to the manuscript, after which DHAV wrote its final version.
The contact author has declared that none of the authors has any competing interests.
Publisher's note: Copernicus Publications remains neutral with regard to jurisdictional claims made in the text, published maps, institutional affiliations, or any other geographical representation in this paper. While Copernicus Publications makes every effort to include appropriate place names, the final responsibility lies with the authors.
The authors would like to thank Heiko Goelzer for providing assistance with the ISM simulation and Michael Kliphuis for providing support with all model simulations and the management of output data. This work was conducted as part of the Netherlands Earth System Science Centre (NESSC) programme, financially supported by the Ministry of Education, Culture and Science (OCW, grant 024.002.001). Simulations were performed at the SURFsara Dutch national computing facilities, sponsored by the NWO-ENW (Dutch Research Council, Exact and Nature Sciences) under project nos. 17189 and 2020.022. The work of Anna S. von der Heydt was additionally funded by the NWO through the Vici project “Interacting Climate Tipping Elements: When Does Tipping Cause Tipping?” (project VI.C.202.081). Finally, the authors would like to thank the two anonymous reviewers, whose contributions significantly improved this manuscript, and Alberto Reyes for his kind guidance throughout the publication process.
This research has been supported by the Dutch Research Council (grant nos. VI.C.202.081, 17189 and 2020.022) and the Dutch Ministry of Education, Culture and Science (grant no. 024.002.001).
This paper was edited by Alberto Reyes and reviewed by two anonymous referees.
Anagnostou, E., John, E. H., Edgar, K. M., Foster, G. L., Ridgwell, A., Inglis, G. N., Pancost, R. D., Lunt, D. J., and Pearson, P. N.: Changing atmospheric CO2 concentration was the primary driver of early Cenozoic climate, Nature, 533, 380–384, https://doi.org/10.1038/nature17423, 2016. a
Baatsen, M., van Hinsbergen, D. J. J., von der Heydt, A. S., Dijkstra, H. A., Sluijs, A., Abels, H. A., and Bijl, P. K.: Reconstructing geographical boundary conditions for palaeoclimate modelling during the Cenozoic, Clim. Past, 12, 1635–1644, https://doi.org/10.5194/cp-12-1635-2016, 2016. a
Baatsen, M., von der Heydt, A. S., Huber, M., Kliphuis, M. A., Bijl, P. K., Sluijs, A., and Dijkstra, H. A.: The middle to late Eocene greenhouse climate modelled using the CESM 1.0.5, Clim. Past, 16, 2573–2597, https://doi.org/10.5194/cp-16-2573-2020, 2020. a, b, c, d
Baatsen, M., Bijl, P., von der Heydt, A., Sluijs, A., and Dijkstra, H.: Resilient Antarctic monsoonal climate prevented ice growth during the Eocene, Clim. Past, 20, 77–90, https://doi.org/10.5194/cp-20-77-2024, 2024. a, b
Barr, I. D., Spagnolo, M., Rea, B. R., Bingham, R. G., Oien, R. P., Adamson, K., Ely, J. C., Mullan, D. J., Pellitero, R., and Tomkins, M. D.: 60 million years of glaciation in the Transantarctic Mountains, Nat. Commun., 13, 5526, https://doi.org/10.1038/s41467-022-33310-z, 2022. a, b, c
Bauer, E. and Ganopolski, A.: Comparison of surface mass balance of ice sheets simulated by positive-degree-day method and energy balance approach, Clim. Past, 13, 819–832, https://doi.org/10.5194/cp-13-819-2017, 2017. a, b, c
Berends, C. J., Goelzer, H., Reerink, T. J., Stap, L. B., and van de Wal, R. S. W.: Benchmarking the vertically integrated ice-sheet model IMAU-ICE (version 2.0), Geosci. Model Dev., 15, 5667–5688, https://doi.org/10.5194/gmd-15-5667-2022, 2022. a
Biasutti, M., Voigt, A., Boos, W. R., Braconnot, P., Hargreaves, J. C., Harrison, S. P., Kang, S. M., Mapes, B. E., Scheff, J., Schumacher, C., Sobel, A. H., and Xie, S.-P.: Global energetics and local physics as drivers of past, present and future monsoons, Nat. Geosci., 11, 392–400, https://doi.org/10.1038/s41561-018-0137-1, 2018. a
Bijl, P. K., Bendle, J. A., Bohaty, S. M., Pross, J., Schouten, S., Tauxe, L., Stickley, C. E., McKay, R. M., Röhl, U., Olney, M., Sluijs, A., Escutia, C., Brinkhuis, H., Expedition 318 Scientists, Klaus, A., Fehr, A., Williams, T., Carr, S. A., Dunbar, R. B., Gonzàlez, J. J., Hayden, T. G., Iwai, M., Jimenez-Espejo, F. J., Katsuki, K., Kong, G. S., Nakai, M., Passchier, S., Pekar, S. F., Riesselman, C., Sakai, T., Shrivastava, P. K., Sugisaki, S., Tuo, S., Van De Flierdt, T., Welsh, K., and Yamane, M.: Eocene cooling linked to early flow across the Tasmanian Gateway, P. Natl. Acad. Sci. USA, 110, 9645–9650, https://doi.org/10.1073/pnas.1220872110, 2013. a
Bo, S., Siegert, M. J., Mudd, S. M., Sugden, D., Fujita, S., Xiangbin, C., Yunyun, J., Xueyuan, T., and Yuansheng, L.: The Gamburtsev mountains and the origin and early evolution of the Antarctic Ice Sheet, Nature, 459, 690–693, https://doi.org/10.1038/nature08024, 2009. a, b, c
Boos, W. R. and Storelvmo, T.: Near-linear response of mean monsoon strength to a broad range of radiative forcings, P. Natl. Acad. Sci. USA, 113, 1510–1515, https://doi.org/10.1073/pnas.1517143113, 2016. a
Boyden, J. A., Muller, R. D., Gurnis, M., Torsvik, T. H., Clark, J. A., Turner, M., Ivey-La, H., and Cannon, J. S.: Next-generation plate-tectonic reconsttuctions using GPlates, in: Geoinformatics: Cyberinfrastructure for the solid earth sciences, Cambridge University Press, Cambridge, UK, 95–114, ISBN 9781108446587, 2011. a
Braithwaite, R. J.: Calculation of degree-days for glacier-climate research, Gletscherkunde und Glazialgeologie, 20, 1–8, 1984. a
Carter, A., Riley, T. R., Hillenbrand, C.-D., and Rittner, M.: Widespread Antarctic glaciation during the Late Eocene, Earth Planet. Sc. Lett., 458, 49–57, https://doi.org/10.1016/j.epsl.2016.10.045, 2017. a
Colwyn, D. A. and Hren, M. T.: An abrupt decrease in Southern Hemisphere terrestrial temperature during the Eocene–Oligocene transition, Earth Planet. Sc. Lett., 512, 227–235, https://doi.org/10.1016/j.epsl.2019.01.052, 2019. a, b
Coxall, H. K., Wilson, P. A., Pälike, H., Lear, C. H., and Backman, J.: Rapid stepwise onset of Antarctic glaciation and deeper calcite compensation in the Pacific Ocean, Nature, 433, 53–57, https://doi.org/10.1038/nature03135, 2005. a
de Boer, B., Stocchi, P., and van de Wal, R. S. W.: A fully coupled 3-D ice-sheet–sea-level model: algorithm and applications, Geosci. Model Dev., 7, 2141–2156, https://doi.org/10.5194/gmd-7-2141-2014, 2014. a
DeConto, R. M. and Pollard, D.: Rapid Cenozoic glaciation of Antarctica induced by declining atmospheric CO2, Nature, 421, 245–249, https://doi.org/10.1038/nature01290, 2003. a, b
DeConto, R. M., Pollard, D., Wilson, P. A., Pälike, H., Lear, C. H., and Pagani, M.: Thresholds for Cenozoic bipolar glaciation, Nature, 455, 652–656, https://doi.org/10.1038/nature07337, 2008. a, b
Gasson, E., Lunt, D. J., DeConto, R., Goldner, A., Heinemann, M., Huber, M., LeGrande, A. N., Pollard, D., Sagoo, N., Siddall, M., Winguth, A., and Valdes, P. J.: Uncertainties in the modelled CO2 threshold for Antarctic glaciation, Clim. Past, 10, 451–466, https://doi.org/10.5194/cp-10-451-2014, 2014. a, b
Goldner, A., Herold, N., and Huber, M.: Antarctic glaciation caused ocean circulation changes at the Eocene–Oligocene transition, Nature, 511, 574–577, https://doi.org/10.1038/nature13597, 2014. a
Gulick, S. P. S., Shevenell, A. E., Montelli, A., Fernandez, R., Smith, C., Warny, S., Bohaty, S. M., Sjunneskog, C., Leventer, A., Frederick, B., and Blankenship, D. D.: Initiation and long-term instability of the East Antarctic Ice Sheet, Nature, 552, 225–229, https://doi.org/10.1038/nature25026, 2017. a, b, c
Herold, N., Buzan, J., Seton, M., Goldner, A., Green, J. A. M., Müller, R. D., Markwick, P., and Huber, M.: A suite of early Eocene (∼ 55 Ma) climate model boundary conditions, Geosci. Model Dev., 7, 2077–2090, https://doi.org/10.5194/gmd-7-2077-2014, 2014. a, b, c
Heyman, B. M., Heyman, J., Fickert, T., and Harbor, J. M.: Paleo-climate of the central European uplands during the last glacial maximum based on glacier mass-balance modeling, Quaternary Res., 79, 49–54, https://doi.org/10.1016/j.yqres.2012.09.005, 2013. a
Hill, S. A., Ming, Y., Held, I. M., and Zhao, M.: A Moist Static Energy Budget–Based Analysis of the Sahel Rainfall Response to Uniform Oceanic Warming, J. Climate, 30, 5637–5660, https://doi.org/10.1175/JCLI-D-16-0785.1, 2017. a
Hönisch, B., Royer, D. L., Breecker, D. O., Polissar, P. J., Bowen, G. J., Henehan, M. J., Cui, Y., Steinthorsdottir, M., McElwain, J. C., Kohn, M. J., Pearson, A., Phelps, S. R., Uno, K. T., Ridgwell, A., Anagnostou, E., Austermann, J., Badger, M. P. S., Barclay, R. S., Bijl, P. K., Chalk, T. B., Scotese, C. R., de la Vega, E., DeConto, R. M., Dyez, K. A., Ferrini, V., Franks, P. J., Giulivi, C. F., Gutjahr, M., Harper, D. T., Haynes, L. L., Huber, M., Snell, K. E., Keisling, B. A., Konrad, W., Lowenstein, T. K., Malinverno, A., Guillermic, M., Mejía, L. M., Milligan, J. N., Morton, J. J., Nordt, L., Whiteford, R., Roth-Nebelsick, A., Rugenstein, J. K. C., Schaller, M. F., Sheldon, N. D., Sosdian, S., Wilkes, E. B., Witkowski, C. R., Zhang, Y. G., Anderson, L., Beerling, D. J., Bolton, C., Cerling, T. E., Cotton, J. M., Da, J., Ekart, D. D., Foster, G. L., Greenwood, D. R., Hyland, E. G., Jagniecki, E. A., Jasper, J. P., Kowalczyk, J. B., Kunzmann, L., Kürschner, W. M., Lawrence, C. E., Lear, C. H., Martínez-Botí, M. A., Maxbauer, D. P., Montagna, P., Naafs, B. D. A., Rae, J. W. B., Raitzsch, M., Retallack, G. J., Ring, S. J., Seki, O., Sepúlveda, J., Sinha, A., Tesfamichael, T. F., Tripati, A., van der Burgh, J., Yu, J., Zachos, J. C., and Zhang, L.: Toward a Cenozoic history of atmospheric CO2, Science, 382, eadi5177, https://doi.org/10.1126/science.adi5177, 2023. a
Houben, A. J. P., Bijl, P. K., Pross, J., Bohaty, S. M., Passchier, S., Stickley, C. E., Röhl, U., Sugisaki, S., Tauxe, L., van de Flierdt, T., Olney, M., Sangiorgi, F., Sluijs, A., Escutia, C., Brinkhuis, H., and and the Expedition 318 Scientists: Reorganization of Southern Ocean Plankton Ecosystem at the Onset of Antarctic Glaciation, Science, 340, 341–344, https://doi.org/10.1126/science.1223646, 2013. a
Hunke, E. C., Lipscomb, W. H., Turner, A. K., Jeffery, N., and Elliott, S.: CICE: the Los Alamos Sea Ice Model Documentation and Software User's Manual Version 5, Tech. Rep. LA-CC-06-012, 2015. a
Hurley, J. V. and Boos, W. R.: Interannual Variability of Monsoon Precipitation and Local Subcloud Equivalent Potential Temperature, J. Climate, 26, 9507–9527, https://doi.org/10.1175/JCLI-D-12-00229.1, 2013. a
Hutchinson, D. K., de Boer, A. M., Coxall, H. K., Caballero, R., Nilsson, J., and Baatsen, M.: Climate sensitivity and meridional overturning circulation in the late Eocene using GFDL CM2.1, Clim. Past, 14, 789–810, https://doi.org/10.5194/cp-14-789-2018, 2018. a, b
Hutchinson, D. K., Coxall, H. K., Lunt, D. J., Steinthorsdottir, M., de Boer, A. M., Baatsen, M., von der Heydt, A., Huber, M., Kennedy-Asser, A. T., Kunzmann, L., Ladant, J.-B., Lear, C. H., Moraweck, K., Pearson, P. N., Piga, E., Pound, M. J., Salzmann, U., Scher, H. D., Sijp, W. P., Śliwińska, K. K., Wilson, P. A., and Zhang, Z.: The Eocene–Oligocene transition: a review of marine and terrestrial proxy data, models and model–data comparisons, Clim. Past, 17, 269–315, https://doi.org/10.5194/cp-17-269-2021, 2021. a, b, c
Ivany, L. C., Simaeys, S. V., Domack, E. W., and Samson, S. D.: Evidence for an earliest Oligocene ice sheet on the Antarctic Peninsula, Geology, 34, 377–380, https://doi.org/10.1130/G22383.1, 2006. a
Jacques, F. M., Shi, G., Li, H., and Wang, W.: An early–middle Eocene Antarctic summer monsoon: Evidence of “fossil climates”, Gondwana Res., 25, 1422–1428, https://doi.org/10.1016/j.gr.2012.08.007, 2014. a
Katz, M. E., Miller, K. G., Wright, J. D., Wade, B. S., Browning, J. V., Cramer, B. S., and Rosenthal, Y.: Stepwise transition from the Eocene greenhouse to the Oligocene icehouse, Nat. Geosci., 1, 329–334, https://doi.org/10.1038/ngeo179, 2008. a, b, c
Kennedy-Asser, A., Lunt, D., Farnsworth, A., and Valdes, P.: Assessing Mechanisms and Uncertainty in Modeled Climatic Change at the Eocene-Oligocene Transition, Paleoceanography and Paleoclimatology, 34, 16–34, https://doi.org/10.1029/2018PA003380, 2019. a
Kennedy-Asser, A. T., Lunt, D. J., Valdes, P. J., Ladant, J.-B., Frieling, J., and Lauretano, V.: Changes in the high-latitude Southern Hemisphere through the Eocene–Oligocene transition: a model–data comparison, Clim. Past, 16, 555–573, https://doi.org/10.5194/cp-16-555-2020, 2020. a
Kennett, J. P.: Cenozoic evolution of Antarctic glaciation, the circum-Antarctic Ocean, and their impact on global paleoceanography, J. Geophys. Res., 82, 3843–3860, https://doi.org/10.1029/JC082i027p03843, 1977. a
Ladant, J.-B., Donnadieu, Y., Lefebvre, V., and Dumas, C.: The respective role of atmospheric carbon dioxide and orbital parameters on ice sheet evolution at the Eocene-Oligocene transition: Ice sheet evolution at the EOT, Paleoceanography, 29, 810–823, https://doi.org/10.1002/2013PA002593, 2014. a
Lauretano, V., Kennedy-Asser, A. T., Korasidis, V. A., Wallace, M. W., Valdes, P. J., Lunt, D. J., Pancost, R. D., and Naafs, B. D. A.: Eocene to Oligocene terrestrial Southern Hemisphere cooling caused by declining pCO2, Nat. Geosci., 14, 659–664, https://doi.org/10.1038/s41561-021-00788-z, 2021. a, b, c
Lawrence, D. M., Oleson, K. W., Flanner, M. G., Thornton, P. E., Swenson, S. C., Lawrence, P. J., Zeng, X., Yang, Z.-L., Levis, S., Sakaguchi, K., Bonan, G. B., and Slater, A. G.: Parameterization improvements and functional and structural advances in Version 4 of the Community Land Model, J. Adv. Model. Earth Syst., 3, M03001, https://doi.org/10.1029/2011MS00045, 2011. a
Lunt, D. J., Dunkley Jones, T., Heinemann, M., Huber, M., LeGrande, A., Winguth, A., Loptson, C., Marotzke, J., Roberts, C. D., Tindall, J., Valdes, P., and Winguth, C.: A model–data comparison for a multi-model ensemble of early Eocene atmosphere–ocean simulations: EoMIP, Clim. Past, 8, 1717–1736, https://doi.org/10.5194/cp-8-1717-2012, 2012. a
Lunt, D. J., Huber, M., Anagnostou, E., Baatsen, M. L. J., Caballero, R., DeConto, R., Dijkstra, H. A., Donnadieu, Y., Evans, D., Feng, R., Foster, G. L., Gasson, E., von der Heydt, A. S., Hollis, C. J., Inglis, G. N., Jones, S. M., Kiehl, J., Kirtland Turner, S., Korty, R. L., Kozdon, R., Krishnan, S., Ladant, J.-B., Langebroek, P., Lear, C. H., LeGrande, A. N., Littler, K., Markwick, P., Otto-Bliesner, B., Pearson, P., Poulsen, C. J., Salzmann, U., Shields, C., Snell, K., Stärz, M., Super, J., Tabor, C., Tierney, J. E., Tourte, G. J. L., Tripati, A., Upchurch, G. R., Wade, B. S., Wing, S. L., Winguth, A. M. E., Wright, N. M., Zachos, J. C., and Zeebe, R. E.: The DeepMIP contribution to PMIP4: experimental design for model simulations of the EECO, PETM, and pre-PETM (version 1.0), Geosci. Model Dev., 10, 889–901, https://doi.org/10.5194/gmd-10-889-2017, 2017. a, b
Lunt, D. J., Bragg, F., Chan, W.-L., Hutchinson, D. K., Ladant, J.-B., Morozova, P., Niezgodzki, I., Steinig, S., Zhang, Z., Zhu, J., Abe-Ouchi, A., Anagnostou, E., de Boer, A. M., Coxall, H. K., Donnadieu, Y., Foster, G., Inglis, G. N., Knorr, G., Langebroek, P. M., Lear, C. H., Lohmann, G., Poulsen, C. J., Sepulchre, P., Tierney, J. E., Valdes, P. J., Volodin, E. M., Dunkley Jones, T., Hollis, C. J., Huber, M., and Otto-Bliesner, B. L.: DeepMIP: model intercomparison of early Eocene climatic optimum (EECO) large-scale climate features and comparison with proxy data, Clim. Past, 17, 203–227, https://doi.org/10.5194/cp-17-203-2021, 2021. a, b
Neale, R. B., Richter, J., Park, S., Lauritzen, P. H., Vavrus, S. J., Rasch, P. J., and Zhang, M.: The Mean Climate of the Community Atmosphere Model (CAM4) in Forced SST and Fully Coupled Experiments, J. Climate, 26, 5150–5168, https://doi.org/10.1175/JCLI-D-12-00236.1, 2013. a
Nie, J., Boos, W. R., and Kuang, Z.: Observational Evaluation of a Convective Quasi-Equilibrium View of Monsoons, J. Climate, 23, 4416–4428, https://doi.org/10.1175/2010JCLI3505.1, 2010. a
Pandey, M., Pant, N. C., Arora, D., and Gupta, R.: A review of Antarctic ice sheet fluctuations records during Cenozoic and its cause and effect relation with the climatic conditions, Polar Sci., 30, 100720, https://doi.org/10.1016/j.polar.2021.100720, 2021. a, b
Passchier, S., Bohaty, S., Jiménez-Espejo, F., Pross, J., Röhl, U., van de Flierdt, T., Escutia, C., and Brinkhuis, H.: Early Eocene to middle Miocene cooling and aridification of East Antarctica: Eocene-Miocene Paleoclimate Antarctica, Geochem. Geophy. Geosy., 14, 1399–1410, https://doi.org/10.1002/ggge.20106, 2013. a
Pearson, P. N., Foster, G. L., and Wade, B. S.: Atmospheric carbon dioxide through the Eocene-Oligocene climate transition, Nature, 461, 1110–1113, https://doi.org/10.1038/nature08447, 2009. a
Pollard, D. and DeConto, R. M.: Hysteresis in Cenozoic Antarctic ice-sheet variations, Global Planet. Change, 45, 9–21, https://doi.org/10.1016/j.gloplacha.2004.09.011, 2005. a
Pound, M. J. and Salzmann, U.: Heterogeneity in global vegetation and terrestrial climate change during the late Eocene to early Oligocene transition, Sci. Rep., 7, 1–12, https://doi.org/10.1038/srep43386, 2017. a
Premoli Silva, I. and Graham Jenkins, D.: Decision on the Eocene-Oligocene boundary stratotype, Episodes Journal of International Geoscience, 16, 379–382, https://doi.org/10.18814/epiiugs/1993/v16i3/002, 1993. a
Robert, C. and Kennett, J. P.: Antarctic continental weathering changes during Eocene-Oligocene cryosphere expansion: Clay mineral and oxygen isotope evidence, Geology, 25, 587–590, https://doi.org/10.1130/0091-7613(1997)025<0587:ACWCDE>2.3.CO;2, 1997. a
Rose, K. C., Ferraccioli, F., Jamieson, S. S., Bell, R. E., Corr, H., Creyts, T. T., Braaten, D., Jordan, T. A., Fretwell, P. T., and Damaske, D.: Early East Antarctic Ice Sheet growth recorded in the landscape of the Gamburtsev Subglacial Mountains, Earth Planet. Sc. Lett., 375, 1–12, https://doi.org/10.1016/j.epsl.2013.03.053, 2013. a, b, c
Scher, H. D., Bohaty, S. M., Zachos, J. C., and Delaney, M. L.: Two-stepping into the icehouse: East Antarctic weathering during progressive ice-sheet expansion at the Eocene–Oligocene transition, Geology, 39, 383–386, https://doi.org/10.1130/G31726.1, 2011. a, b
Scher, H. D., Bohaty, S. M., Smith, B. W., and Munn, G. H.: Isotopic interrogation of a suspected late Eocene glaciation: hidden glaciation revealed in the Eocene, Paleoceanography, 29, 628–644, https://doi.org/10.1002/2014PA002648, 2014. a
Seton, M., Müller, R., Zahirovic, S., Gaina, C., Torsvik, T., Shephard, G., Talsma, A., Gurnis, M., Turner, M., Maus, S., and Chandler, M.: Global continental and ocean basin reconstructions since 200 Ma, Earth-Sci. Rev., 113, 212–270, https://doi.org/10.1016/j.earscirev.2012.03.002, 2012. a
Sewall, J. O., Sloan, L. C., Huber, M., and Wing, S.: Climate sensitivity to changes in land surface characteristics, Global Planet. Change, 26, 445–465, https://doi.org/10.1016/S0921-8181(00)00056-4, 2000. a
Smith, R., Jones, P., Briegleb, B., Bryan, F., Danabasoglu, G., Dennis, J., Dukowicz, J., Eden, C., Fox-Kemper, B., Gent, P., Hecht, M., Jayne, S., Jochum, M., Large, W., Lindsay, K., Maltrud, M., Norton, N., Peacock, S., Vertenstein, M., and Yeager, S.: The Parallel Ocean Program (POP) Reference Manual, Los Alamos National Laboratory, Tech. Rep. LAUR-10-01853, 141, 1–141, 2010. a
Smyth, J. E. and Ming, Y.: Characterizing Drying in the South American Monsoon Onset Season with the Moist Static Energy Budget, J. Climate, 33, 9735–9748, https://doi.org/10.1175/JCLI-D-20-0217.1, 2020. a
Stocchi, P., Escutia, C., Houben, A. J., Vermeersen, B. L., Bijl, P. K., Brinkhuis, H., DeConto, R. M., Galeotti, S., Passchier, S., Pollard, D., Brinkhuis, H., Escutia, C., Klaus, A., Fehr, A., Williams, T., Bendle, J. A., Bijl, P. K., Bohaty, S. M., Carr, S. A., Dunbar, R. B., Flores, J. A., Gonzàlez, J. J., Hayden, T. G., Iwai, M., Jimenez-Espejo, F. J., Katsuki, K., Kong, G. S., McKay, R. M., Nakai, M., Olney, M. P., Passchier, S., Pekar, S. F., Pross, J., Riesselman, C., Röhl, U., Sakai, T., Shrivastava, P. K., Stickley, C. E., Sugisaki, S., Tauxe, L., Tuo, S., van de Flierdt, T., Welsh, K., and Yamane, M.: Relative sea-level rise around East Antarctica during Oligocene glaciation, Nat. Geosci., 6, 380–384, https://doi.org/10.1038/ngeo1783, 2013. a
Tigchelaar, M., von der Heydt, A. S., and Dijkstra, H. A.: A new mechanism for the two-step δ18O signal at the Eocene-Oligocene boundary, Clim. Past, 7, 235–247, https://doi.org/10.5194/cp-7-235-2011, 2011. a
Van Breedam, J., Huybrechts, P., and Crucifix, M.: Modelling evidence for late Eocene Antarctic glaciations, Earth Planet. Sc. Lett., 586, 117532, https://doi.org/10.1016/j.epsl.2022.117532, 2022. a
van den Broeke, M. R., Smeets, C. J. P. P., and van de Wal, R. S. W.: The seasonal cycle and interannual variability of surface energy balance and melt in the ablation zone of the west Greenland ice sheet, The Cryosphere, 5, 377–390, https://doi.org/10.5194/tc-5-377-2011, 2011. a
van Hinsbergen, D. J. J., De Groot, L. V., Van Schaik, S. J., Spakman, W., Bijl, P. K., Sluijs, A., Langereis, C. G., and Brinkhuis, H.: A Paleolatitude Calculator for Paleoclimate Studies, PLOS ONE, 10, e0126946, https://doi.org/10.1371/journal.pone.0126946, 2015. a
Vermeulen, D.: Supporting datasets for Response of Late-Eocene warmth to incipient glaciation on Antarctica by Dennis Vermeulen et al., Utrecht University, Yoda [data set], https://doi.org/10.24416/UU01-YDFULA, 2024. a
Wellner, J. S. and Anderson, J. B.: Tectonic, climatic, and cryospheric evolution of the Antarctic Peninsula, John Wiley & Sons, ISBN 9781118671672, 2013. a
Wilson, D. S., Jamieson, S. S., Barrett, P. J., Leitchenkov, G., Gohl, K., and Larter, R. D.: Antarctic topography at the Eocene–Oligocene boundary, Palaeogeogr. Palaeocl., 335–336, 24–34, https://doi.org/10.1016/j.palaeo.2011.05.028, 2012. a
Wilson, D. S., Pollard, D., DeConto, R. M., Jamieson, S. S., and Luyendyk, B. P.: Initiation of the West Antarctic Ice Sheet and estimates of total Antarctic ice volume in the earliest Oligocene: earliest Oligocene antarctic ice models, Geophys. Res. Lett., 40, 4305–4309, https://doi.org/10.1002/grl.50797, 2013. a
Zachos, J. C., Breza, J. R., and Wise, S. W.: Early Oligocene ice-sheet expansion on Antarctica: Stable isotope and sedimentological evidence from Kerguelen Plateau, southern Indian Ocean, Geology, 20, 569–573, https://doi.org/10.1130/0091-7613(1992)020<0569:EOISEO>2.3.CO;2, 1992. a
Zhu, J., Poulsen, C. J., and Tierney, J.: Simulation of Eocene extreme warmth and high climate sensitivity through cloud feedbacks, Sci. Adv., 5, eaax1874, https://doi.org/10.1126/sciadv.aax1874, 2019. a


