the Creative Commons Attribution 4.0 License.
the Creative Commons Attribution 4.0 License.
 | 16 May 2025
Evaluating the 20th Century Reanalysis Version 3 with synoptic typing and an East Antarctic ice core accumulation record
Danielle G. Udy
Tessa R. Vance
Weather systems in the southern Indian Ocean influence East Antarctic precipitation variability and surface mass balance. However, the long-term variability in synoptic-scale weather systems in this region is not well understood due to short instrumental records that are mostly limited to the satellite era (post-1979). Ice core records from coastal East Antarctica suggest significant decadal variability in snowfall accumulation, indicating that data from the satellite era alone are not enough to characterise climate variability in the high southern latitudes. It is therefore challenging to contextualise recent precipitation trends and extremes in relation to climate change in this area. We use synoptic typing of daily 500 hPa geopotential height anomalies and the Law Dome ice core (East Antarctica) annual snowfall accumulation record to investigate whether the 20th Century Reanalysis (20CR) project can represent the synoptic conditions associated with precipitation variability at Law Dome prior to the satellite era. We identify 12 synoptic types using self-organising maps (SOMs) based on their dominant pressure anomaly patterns over the southern Indian Ocean, with 4 types associated with above-average daily precipitation at Law Dome. Our results show the 20th Century Reanalysis project represents the meridional synoptic conditions associated with precipitation variability at Law Dome more reliably from 1948, aligning with the increased availability and thus assimilation of consistent surface pressure data from weather stations in the southern Indian Ocean from the late 1940s. This extends the time period available to contextualise recent trends and extremes in precipitation and synoptic weather conditions by up to 3 decades beyond the satellite era. Furthermore, we find a linear combination of the annual frequency in select synoptic types explains a significant amount of the variability in Law Dome snowfall accumulation compared to any individual synoptic type alone. These results will help future research on contextualising East Antarctic surface mass balance variability prior to the satellite era, with implications for improved understanding of the largest source of potential sea level rise, and the atmospheric conditions leading to decadal precipitation variability.
- Article
(9600 KB) - Full-text XML
- BibTeX
- EndNote


Understanding the long-term variability in Antarctic surface mass balance is important to the global climate because the Antarctic ice sheet is the largest source of potential sea level rise (Fretwell et al., 2013). Precipitation is the dominant source of surface mass balance variability (Lenaerts et al., 2019); however, the seasonal and interannual variability in precipitation is less well understood, especially in East Antarctica (Wille et al., 2021). Weather systems in the southern Indian Ocean, such as extratropical cyclones, fronts, and anticyclonic blocks, influence precipitation variability in coastal East Antarctica (Catto et al., 2015; Uotila et al., 2011). The occurrence of these weather systems has changed in frequency over the satellite era in relation to modes of climate variability, such as the Southern Annular Mode (SAM) (Udy et al., 2021). However, the high latitudes of the Southern Hemisphere (in particular, the Indian Ocean sector) have only sparse and discontinuous long-term observational records. It is therefore challenging to contextualise recent precipitation trends and extremes in relation to climate change in this region, such as the recent extreme atmospheric river and heatwave event in March 2022 (Jones et al., 2016; Wille et al., 2021, 2024a, b).
Climate reanalyses that span the 20th century can be used to help bridge this gap in understanding of past variability prior to the satellite era. The most recent reanalysis products include the 20th Century Reanalysis (20CR; Slivinski et al., 2019; Compo et al., 2011), the European Centre for Medium-Range Weather Forecasts (ECMWF) 20th Century Reanalysis (ERA-20C; Poli et al., 2016), and the Coupled ECMWF Reanalysis of the 20th Century (CERA-20C; Laloyaux et al., 2018). All three reanalysis products assimilate surface pressure observations, while ERA-20C and CERA-20C also assimilate marine surface wind observations and CERA-20C additionally assimilates ocean temperature and salinity. These reanalyses are generally considered to perform poorly in the Southern Ocean and Antarctic regions early in the 20th century, due to the lack of observations (Schneider and Fogt, 2018; Wang et al., 2020; Zhang et al., 2018). It has therefore been recommended to evaluate reanalysis model outputs, such as daily precipitation against independent datasets, including ice core records of annual snowfall accumulation, to verify their performance (Schneider and Fogt, 2018; Wang et al., 2017, 2020).
Synoptic typing of atmospheric pressure patterns may also provide additional insights that are not possible by simply comparing reanalysis precipitation to ice core snowfall accumulation records, by providing an indication of the atmospheric dynamics that are associated with the surface weather that drives precipitation variability. It has been demonstrated that synoptic typing methods, using both self-organising maps (SOMs) and k-means clustering, can be used to investigate weather and climate variability in the southern Indian Ocean (Pohl et al., 2021; Udy et al., 2021). SOMs use a neural network algorithm with unsupervised learning to determine generalised patterns in large datasets (Kohonen, 1990), for example, atmospheric pressure (Udy et al., 2021; Gibson et al., 2017). SOMs have been shown to be a useful tool in analysing synoptic weather conditions in the Southern Hemisphere (Gibson et al., 2017; Hope et al., 2006; Hosking et al., 2017; Verdon-Kidd and Kiem, 2009; Udy et al., 2021; Reusch et al., 2005).
In this study, we use 20CR to extend a prior synoptic typing dataset (Udy et al., 2021) to explore the representation of synoptic conditions that are associated with snowfall variability in East Antarctica prior to the satellite era. We chose 20CR for this study because it only assimilates surface pressure observations; therefore it is less vulnerable to the inhomogeneities that can arise when new data are added or observing systems change (Slivinski et al., 2021; Compo et al., 2011). Although ERA-20C often outperforms 20CR in more well observed regions, 20CR may have an advantage in more data-sparse regions such as the mid- and high-latitudes of the Southern Hemisphere, due to different data assimilation schemes and different kinds of assimilated observations (Hamill and Snyder, 2000; Gillespie et al., 2021).
In this study, we compare the annual frequency in the synoptic types to annual 20CR precipitation and the Law Dome ice core snowfall accumulation record (Roberts et al., 2015; Jong et al., 2022) to quantify the potential use of 20CR in the southern Indian Ocean prior to the satellite era. The study area (30–75° S, 40–180° E) represents a region within which synoptic weather patterns are known to influence the coastal regions of the East Antarctic Ice Sheet, as defined in a prior study of the satellite era (Udy et al., 2021). Using this same region allows comparison between the previous study and this temporally extended study, and it underpins current and future ice core studies investigating decadal changes to the synoptic- to seasonal-scale variability in snowfall accumulation in Antarctica.
2.1 Data used
2.1.1 20th Century Reanalysis version 3
The 20th Century Reanalysis version 3 (20CRv3; Slivinski et al., 2019) was developed and is maintained by the National Oceanographic and Atmospheric Administration, the University of Colorado Boulder's Cooperative Institute for Research in Environmental Sciences, and the US Department of Energy (NOAA-CIRES-DOE). It assimilates surface pressure observations from the International Surface Pressure Databank version 4.7 (ISPDv4.7; Cram et al., 2015; Compo et al., 2019) using an ensemble Kalman data assimilation system into an 80-member ensemble model. It covers 1806–2015 and has a horizontal resolution of 1° × 1° and a temporal resolution of 3 h. All 20CRv3 data used here are the ensemble mean. The 500 hPa geopotential height (z500) daily anomalies from 20CRv3 over the period 1900–2015 were calculated from the 1900–2015 climatological mean (Fig. 1) and were used as the input for the SOM algorithm (see Sect. 2.2.1).
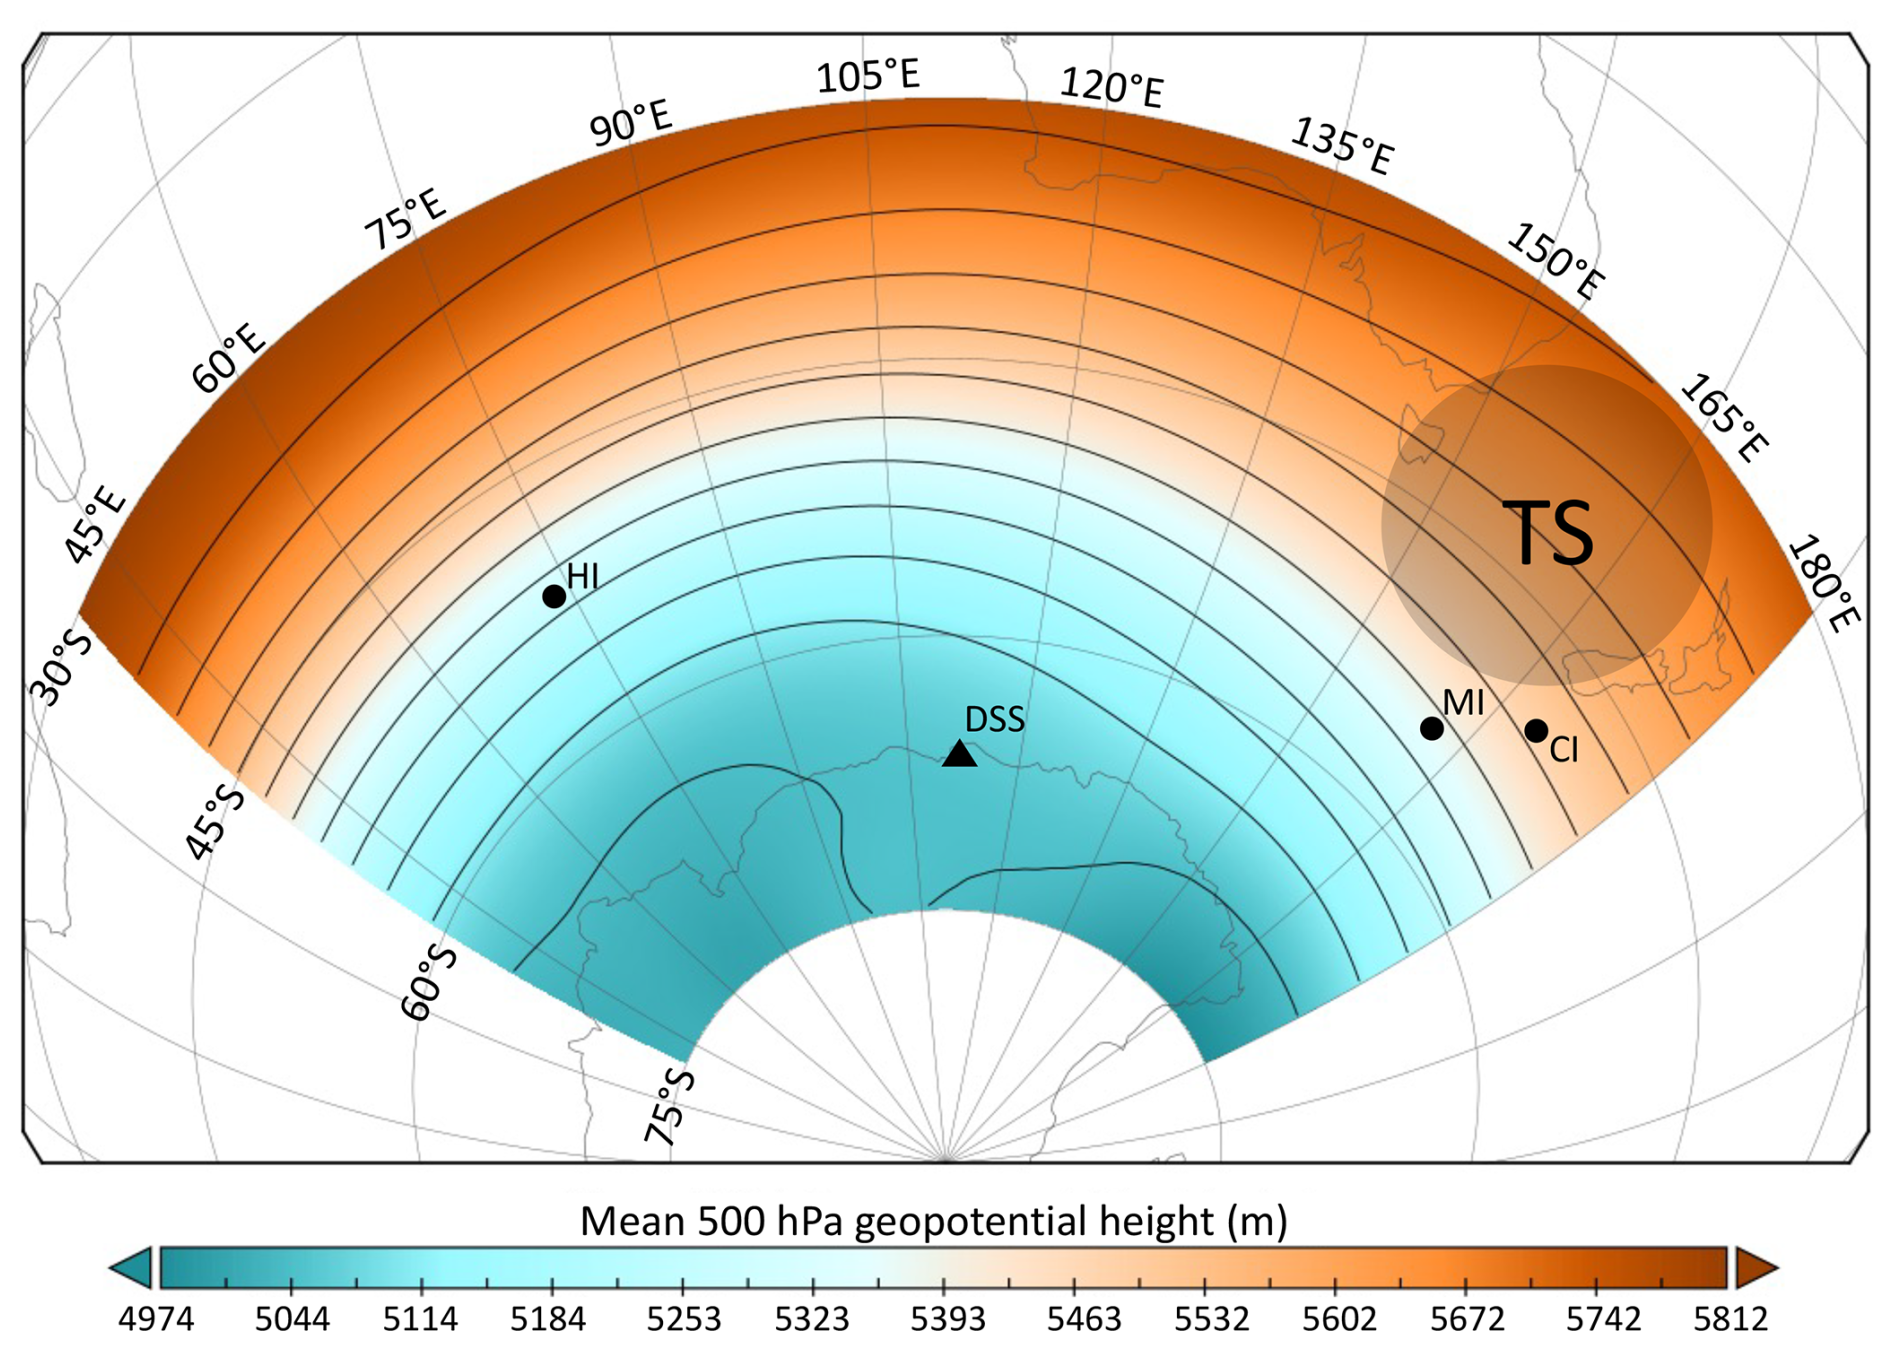
Figure 1The study area (30–75° S, 40–180° E) showing the 500 hPa geopotential height climatological mean (1900–2015). The locations of the Dome Summit South (DSS) ice core site at Law Dome, Heard Island (HI), Macquarie Island (MI), Campbell Island (CI), and the Tasman Sea region (TS) are indicated. Map produced in Panoply with 20CRv3 data.
The daily mean 3-hourly precipitation rate at 67° S, 113° E was used to represent the 20CRv3 precipitation at the Dome Summit South (DSS) drill site at Law Dome (66.77° S, 112.81° E, 1370 m elevation). The 20CRv3 grid size at this latitude is approximately 111 × 43 km2. The precipitation rate was converted from its original units (kg m−2 s−1) into mean daily precipitation (mm d−1). It is worth noting that Law Dome is a semi-independent ice cap which exhibits a strong orographically driven precipitation signal from east (high precipitation) to west (low precipitation) across the Dome (Pedro et al., 2011); thus the 20CRv3 grid cell is a relatively coarse approximation of DSS precipitation.
2.1.2 Annual snowfall accumulation record from the Law Dome (DSS) ice core
In this study, we used the annual snowfall accumulation record from the Law Dome DSS ice core site, which has been progressively developed over the past 2 decades (e.g. Jong et al., 2022; Roberts et al., 2015; van Ommen and Morgan, 2010; and references therein). The DSS site is situated in a coastal and predominantly wet deposition zone, and the ice core record has been regularly updated with short surface cores since the original deep drilling campaign was completed in the 1990s. Given its relatively high elevation (1370 m above sea level), DSS receives precipitation predominantly in the form of snowfall with an insignificant contribution from clear-sky precipitation (diamond dust). We are not aware of any evidence of significant melt or rainfall events at DSS, despite rainfall being possible during extreme warm events along the East Antarctic coastline (Wille et al., 2024b, a). Any rainfall or melt events would appear as clear stratigraphic boundaries in the ice core record, and these have not been observed (van Ommen and Morgan, 1997; Zhang et al., 2023).
DSS receives relatively high annual snowfall compared to much of coastal East Antarctica, due to the interaction between frequent cyclonic incursions and the topography of the Dome (Mcmorrow et al., 2004). This high annual snowfall means seasonally varying trace impurity concentrations (e.g. sea salts, sulfate) and water stable isotope ratios (δ18O and δD) can be relatively easily discerned. In combination, these seasonal variations allow the identification of annual horizons with a nominal date of 10 January, allowing dating via annual layer counting (van Ommen and Morgan, 1997; McMorrow et al., 2001; Mcmorrow et al., 2004; Plummer et al., 2012; Jong et al., 2022). Additional dating accuracy is achieved via the identification of volcanic sulfate peaks, which are then cross-referenced to the dates of known global eruptions and compared to other East Antarctic and global ice core volcanic records (Plummer et al., 2012). Key eruptions observed in the DSS record over the time period of interest to this study include Pinatubo (1991), Agung (1965), Krakatoa (1885), and Tambora (1816). The DSS layer counted record exhibits no dating error with the sulfate signatures of these well-documented eruptions (see Table 3 in Vance et al., 2024).
The DSS annually resolved dataset (including annual accumulation) spans −11 to 2017 CE, which corresponds to around 800 m deep to the surface at time of drilling in austral summer 2018 (see Jong et al., 2022, for details and data access). The full DSS ice core reaches a depth of approximately 1200 m to bedrock (van Ommen and Morgan, 1997). Understanding of DSS site firn compaction and layer thinning has been progressively refined over the past 2 decades using firn core density estimates (calculated from core volume/weight measurements). Assuming steady state for depth profiles of both density (Sorge's law) and the vertical strain rate, Roberts et al. (2015) converted year boundary depths to ice equivalent depths to account for firn compaction and then used a power-law vertical strain rate method to estimate annual snowfall accumulation rates. See Roberts et al. (2015) for a detailed explanation of the development of the DSS annual snowfall accumulation record and Jong et al. (2022) for the updated record used here. This study focuses on the most recent 120 years of this record. The mean annual snowfall accumulation rate derived using the above information at DSS is 0.69 m ice equivalent (Crockart et al., 2021; Roberts et al., 2015).
2.1.3 International Surface Pressure Databank
Counts of assimilated observations in ISPDv4.7 for the 1900–2015 period south of 50° S in the study area (i.e. 50–75° S, 40–180° E) were compared to 20CRv3 outputs over time. This area was selected because it excludes observations from Australia and New Zealand to focus on the observations from Antarctica and small islands in the southern Indian Ocean (see Fig. 1).
2.2 Methods
2.2.1 Self-organising map inputs and evaluation
The SOM algorithm, from the Kohonen R package (Wehrens and Kruisselbrink, 2018), was used to identify regional synoptic patterns in the southern Indian Ocean from 1900 to 2015 using 20CRv3 daily 500 hPa geopotential height anomalies in the study area (30–75° S, 40–180° E). The code used in this study was adapted from Udy et al. (2021). The following grid parameters were selected: rectangular topology, Gaussian neighbourhood function, and Euclidean distance measurement. Training was carried out over 1000 iterations (improvement plateaued around 800 iterations), with the learning rate decreasing linearly from 0.05 to 0. The neighbourhood radius parameter was consistent with Udy et al. (2021), who used a hybrid SOM-clustering approach (75 % of training period SOM, 25 % of training period k-means clustering) to improve the Euclidean distance and Pearson pattern correlation scores. SOMs are similar to k-means clustering. The main difference between the two methods is that, in the training stage for SOMs, the winning node and its surrounding nodes are updated at each iteration, while, in k-means clustering, only the winning node is updated. The SOM method is equivalent to k-means clustering when the radius parameter equals exactly 1 (Bação et al., 2005). Further detailed descriptions of the SOM algorithm, and how it has been used for weather and climate applications, can be found in other studies (Hewitson and Crane, 2002; Sheridan and Lee, 2011; Verdon-Kidd and Kiem, 2009; Udy et al., 2021).
An important but subjective aspect of SOM analysis is choosing the number of nodes. When there are fewer nodes, the SOM output is more generalised. As the number of nodes increases, the nodes become more specific and a broader range of patterns can be discerned, but interpretability decreases. The ideal number of nodes will depend on the aims of a study. Here, we ultimately chose the configuration of 4 × 3 (12) nodes after testing the sensitivity of results to multiple node configurations, including 3 × 3 (9), 4 × 3 (12), 3 × 5 (15), and 4 × 4 (16). The configuration of 4 × 3 (12) was chosen, as it best represents the range of zonal and meridional synoptic types known to occur in the region (Udy et al., 2021; Pohl et al., 2021).
To evaluate how well the SOM output represents the actual daily synoptic patterns, the Pearson pattern correlation between each winning node and the corresponding z500 anomaly for each day was calculated. Note that Udy et al. (2021) calculated the Pearson pattern correlation between the winning nodes and the observed z500 field, rather than the z500 anomaly, which is less sensitive to small differences in the exact location of high/low anomalies. Therefore, the correlation scores here can be expected to be lower than in Udy et al. (2021).
2.2.2 20CRv3 daily precipitation at Law Dome and synoptic types
To determine which synoptic types (i.e. SOM nodes) are associated with precipitation variability at Law Dome, we calculated the median daily 20CRv3 precipitation for each synoptic type at the grid point closest to the Law Dome summit (67° S, 113° E) for 1900–2015. To test the null hypothesis that the median precipitation associated with each synoptic type is equal, a Kruskal–Wallis rank-sum test was performed. A pairwise comparison using a Wilcoxon rank-sum test was then used to test which pairs of synoptic types had significantly different median precipitation.
2.2.3 Classification of precipitation events
To differentiate between amounts of daily precipitation, we then calculated the 90th and 99th percentiles of 20CRv3 daily precipitation at Law Dome, based on the 1900–2015 time period. Each day was classified as either “zero” (no precipitation), “normal” (< 90th percentile), “high” (< 99th but > 90th percentile), or “extreme” (> 99th percentile). These statistics were used to evaluate the proportions of total annual precipitation that could be attributed to high- and extreme-precipitation days. This analysis was for the 20CRv3 precipitation only and not for the synoptic types. We note that the terminology used for defining precipitation-type days and percentile thresholds in this study is different to other studies (Jackson et al., 2023; Turner et al., 2019). For example, Turner et al. (2019) defined an extreme precipitation event as the top 10 % of daily precipitation at a location, which is in contrast to our study, which further defines the upper 10 % of precipitation days as either high or extreme.
2.2.4 Division of time period and correlation between annual precipitation and accumulation
The 1900–2015 time period was split into sub-periods based on changes in the number of observations assimilated into 20CRv3, based on the ISPDv4.7 dataset. This enabled the investigation of how correlations might change over time, with the goal of extending the utility of 20CRv3 beyond the satellite era. The three sub-periods are as follows:
-
1979–2015 (modern satellite era, to allow comparison with satellite-era reanalyses),
-
1957–2015 (assimilation of new data from the International Geophysical Year, 1957–1958),
-
1948–2015 (assimilation of observations from Macquarie Island (see Fig. 1) and other locations into ISPDv4.7; Compo et al., 2019).
There were clear temporal trends in many variables, so linear detrending was performed. The dataset was split into sub-periods first, then each sub-period was detrended. Following this, Pearson correlations were calculated between the 20CRv3 annual precipitation for the Law Dome grid cell and the DSS ice core annual accumulation record to determine if 20CRv3 precipitation could accurately represent annual accumulation rates in the Law Dome region. Then, the Spearman correlation between the annual frequency in each synoptic type, the 20CRv3 total annual precipitation at Law Dome, and the DSS ice core annual snowfall accumulation was calculated to evaluate whether the annual frequency in synoptic types correlated with annual snowfall accumulation at DSS (represented by 20CRv3 and/or the ice core dataset).
2.2.5 Regression analysis of snowfall accumulation using synoptic types
Linear models were generated to assess whether a linear combination of the annual frequency in the synoptic types could explain variability in the DSS ice core annual snowfall accumulation record. The variables were selected using the stepAIC function from the Modern Applied Statistics with S (MASS; Venables and Ripley, 2002) package in R. The variables were not detrended for this analysis. Models were generated for different time periods (see above). Plots showing the predicted DSS ice core annual accumulation were created using the predict function, with a 95 % confidence interval around each point. All statistical analysis was carried out using RStudio Version 2023.03.0+386.
3.1 Annual ice core accumulation compared to 20CRv3 precipitation
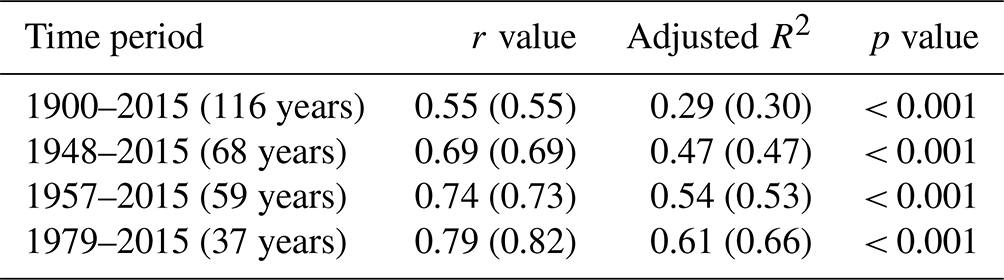
The 20CRv3 annual precipitation at the grid square containing Law Dome (67° S, 113° E) and the DSS ice core annual snowfall accumulation are significantly correlated over the full period examined in this study, 1900–2015 (Fig. 2 and Table 1). The correlation is strongest over the 1979–2015 period (r = 0.79, p < 0.001). The 20CRv3 annual precipitation at Law Dome has a positive trend over the 1900–2015 period (0.88 mm yr−1, 95 % CI = [0.31, 1.45]) and in the 1900–1978 period (1.82 mm yr−1, 95 % CI = [1.14, 2.50]) and a negative trend in the 1979–2015 period (−4.71 mm yr−1, 95 % CI = [−9.08, −0.33]). The DSS ice core annual snowfall accumulation record has no significant trend over the 1900–2015 period but does have a negative trend over the 1979–2015 period (−4.91 mm yr−1, 95 % CI = [−9.42, −0.41]).
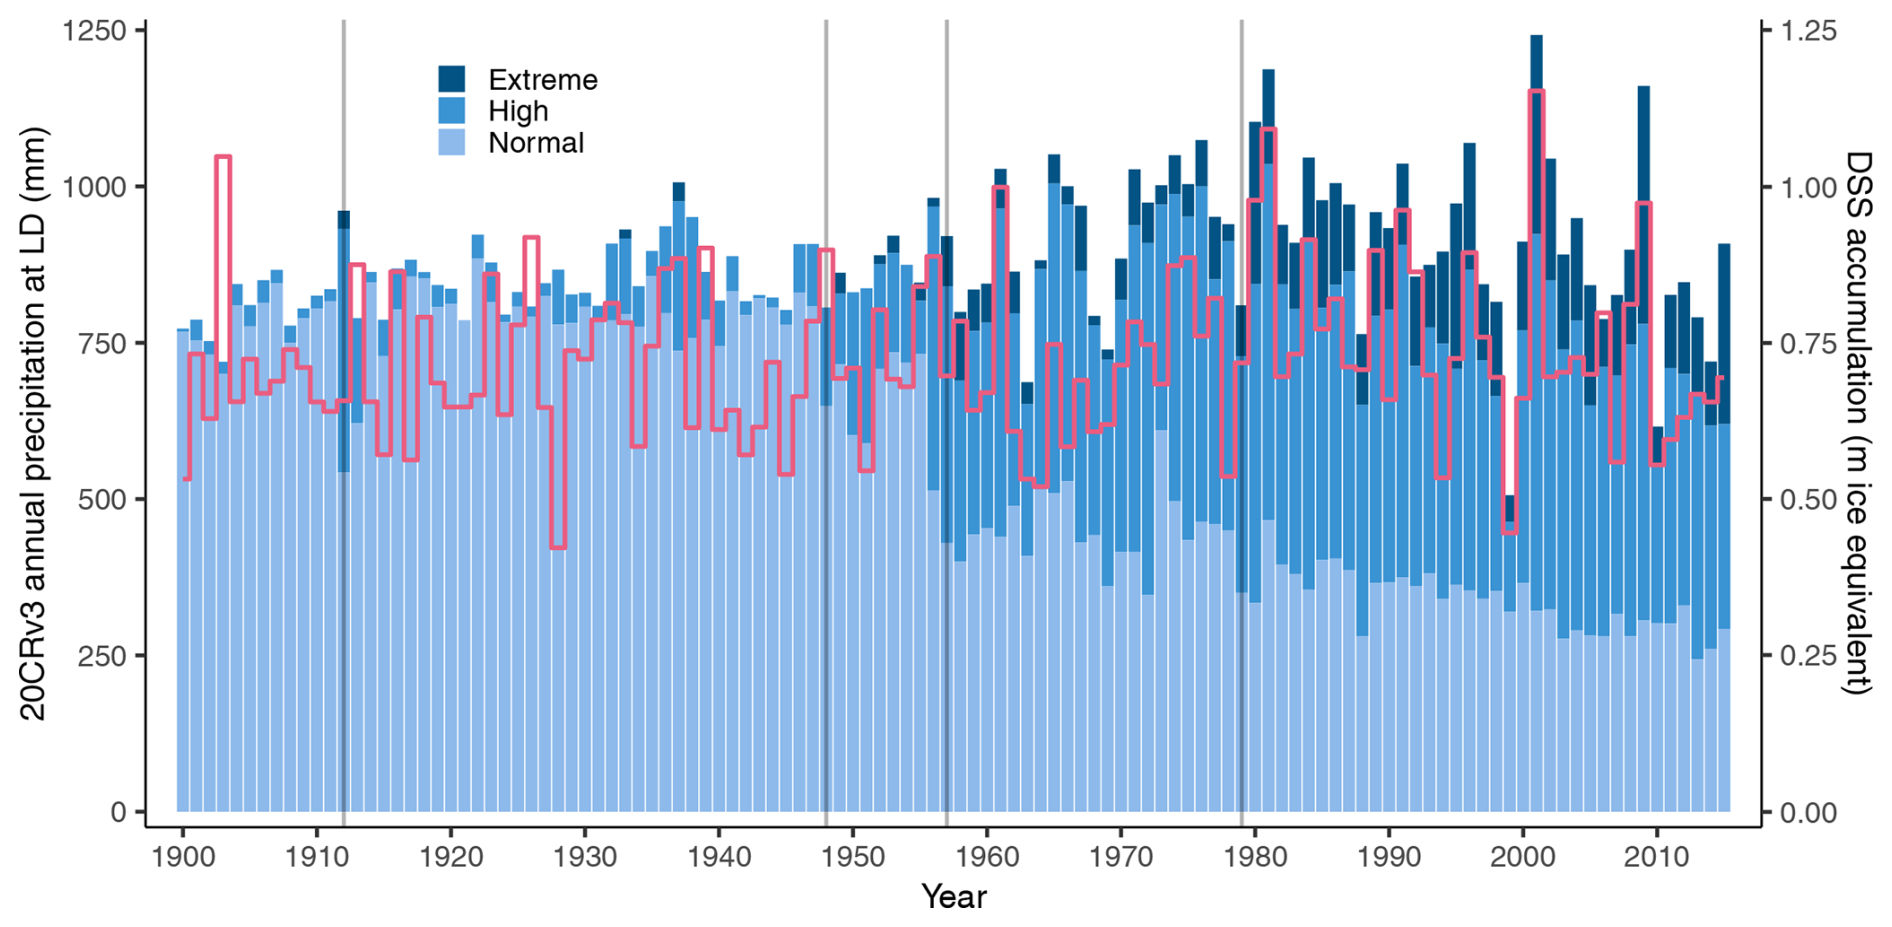
Figure 2Annual precipitation variability comparison between 20CRv3 total annual precipitation (mm) at Law Dome (blue bars; shading indicates percentiles) and annual snowfall accumulation (m ice equivalent) from the DSS ice core record (red line) over 1900–2015. The 20CRv3 total annual precipitation is split into “types” based on percentiles: normal (< 90th percentile, light blue), high (90–99th percentile, medium blue), and extreme (> 99th percentile, dark blue) precipitation days. Vertical lines indicate the years 1912, 1948, 1957, and 1979 (see Sect. 4.1).
Table 1Pearson correlation coefficient (r), adjusted R2, and p value (two-sided Student's t test) for various time periods, showing correlation between 20CRv3 annual precipitation at Law Dome and DSS ice core annual accumulation. The detrended values are shown first, with the non-detrended values shown in brackets. Note that the R2 values are adjusted by accounting for the sample size.
3.2 Contribution of high and extreme precipitation
The 90th percentile of 20CRv3 daily precipitation at Law Dome is 5.05 mm d−1, and the 99th percentile is 13.4 mm d−1, based on the 1900–2015 period for consistency across the study period. The 90th-percentile threshold from 20CRv3 over 1900–2015 is similar to the 90th percentile threshold calculated over 1979–2016 using RACMO2 (4.23 mm d−1) (Turner et al., 2019). Total annual precipitation from high precipitation days (90–99th percentile) increases from the late 1940s, with a further increase from the mid-late 1950s (Fig. 2). Precipitation that can be attributed to extreme precipitation days (over 99th percentile) increases from the mid-late 1950s, and there is a further increase from around 1980. Between 1900 and 1956, 9.4 % of total precipitation came from high precipitation days and 0.4 % from extreme, and, for 1957–2015, 45.7 % of total precipitation came from high precipitation days and 12.9 % from extreme.
3.3 SOM output and evaluation
For initial testing, the SOM algorithm was performed on the 20CRv3 dataset for 1979–2015 with 3 × 3 (9) nodes (Fig. A1). These nodes have the same broad patterns as the nine SOM nodes from ERA-Interim (1979–2018) in Udy et al. (2021). This confirms that consistent results are achieved between the two reanalysis products for the common period of 1979–2015.
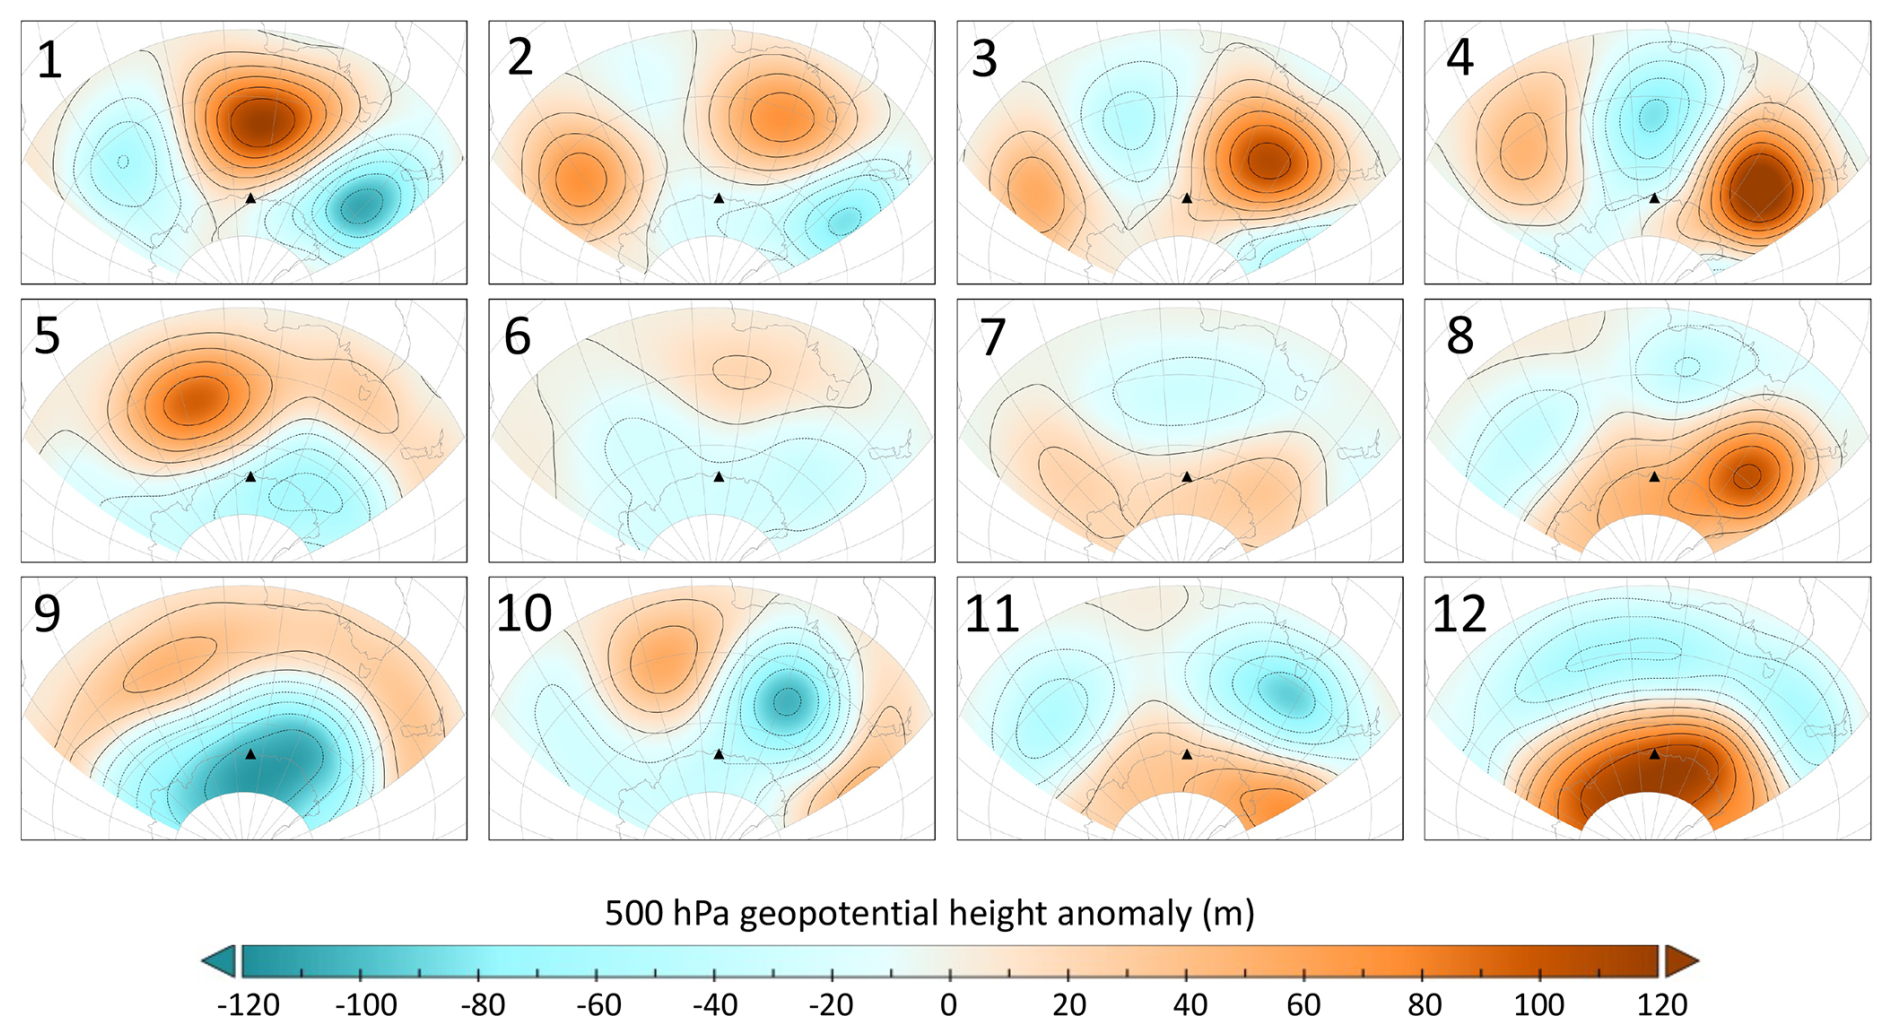
Figure 3Self-organising map (SOM) output of 500 hPa geopotential height anomaly for each of the 12 SOM nodes (synoptic types). Positive height anomalies are shown in orange with solid contours, and negative height anomalies are shown in teal with dotted contours. The location of the Dome Summit South ice core site at Law Dome is indicated with a triangle. Maps produced in Panoply.
The final configuration of 12 nodes was chosen for this study based on their ability to represent the synoptic conditions that result in snowfall variability at Law Dome. We determined that reducing the node number to 9 would not sufficiently capture the range of possible weather patterns over the 116-year period. Using 15 and 16 nodes did show a broader range of synoptic patterns; however, the increase in the number of nodes from 12 did not substantially add information to help understand synoptic variability in snowfall in the Law Dome region. The 12 nodes (synoptic types) are shown in Fig. 3.
Positive geopotential height anomalies are associated with high-pressure ridges that extend poleward, while negative height anomalies are associated with low-pressure systems, such as extratropical cyclones and cold fronts. The structure and locations of the anomaly patterns in the 12 synoptic types are similar to those of Udy et al. (2021) and other studies in overlapping regions that use a combination of synoptic typing methods (Hope et al., 2006; Jiang et al., 2012; Pohl et al., 2021; Verdon-Kidd and Kiem, 2009)
The accuracy of the SOM output was quantified by calculating the Pearson pattern correlation (r) score between each winning node and the 20CRv3 z500 anomaly at each daily time step and then analysing the distribution of the correlations (Fig. A2). The median r score across all nodes is 0.57, and 67 % of the daily time steps have r > 0.5. The performance metrics of most nodes display a normal distribution with a slight negative skew, except for nodes 6 and 7. These nodes are the least frequent and displayed poor correlation scores, indicating that they represent a range of low-frequency, but highly variable, synoptic conditions.
3.4 Synoptic-type descriptions
The 12 synoptic types are described in Table 2 and are grouped by their overall synoptic pattern. Similarly to Udy et al. (2021), these broad groupings are defined as meridional (types 1, 3, and 4, which display strong differences in anomalies east–west and are favourable for meridional transport of moisture to East Antarctica), zonal (types 9 and 12, which display strong differences in anomalies north–south similar to the SAM structure), mixed (types 2, 5, 8, 10, and 11, which display a mixture of east–west and north–south differences in anomalies), and transitional (types 6 and 7, which represent transitional states between other types).
Table 2Structural groupings, anomaly descriptions and relative frequencies, and median r score of the 12 southern Indian Ocean synoptic types derived in this study. The frequency is over the entire study period (1900–2015). The median r score refers to the Pearson pattern correlation scores between the composite node and z500 daily anomaly maps used to evaluate the performance of the SOM algorithm.
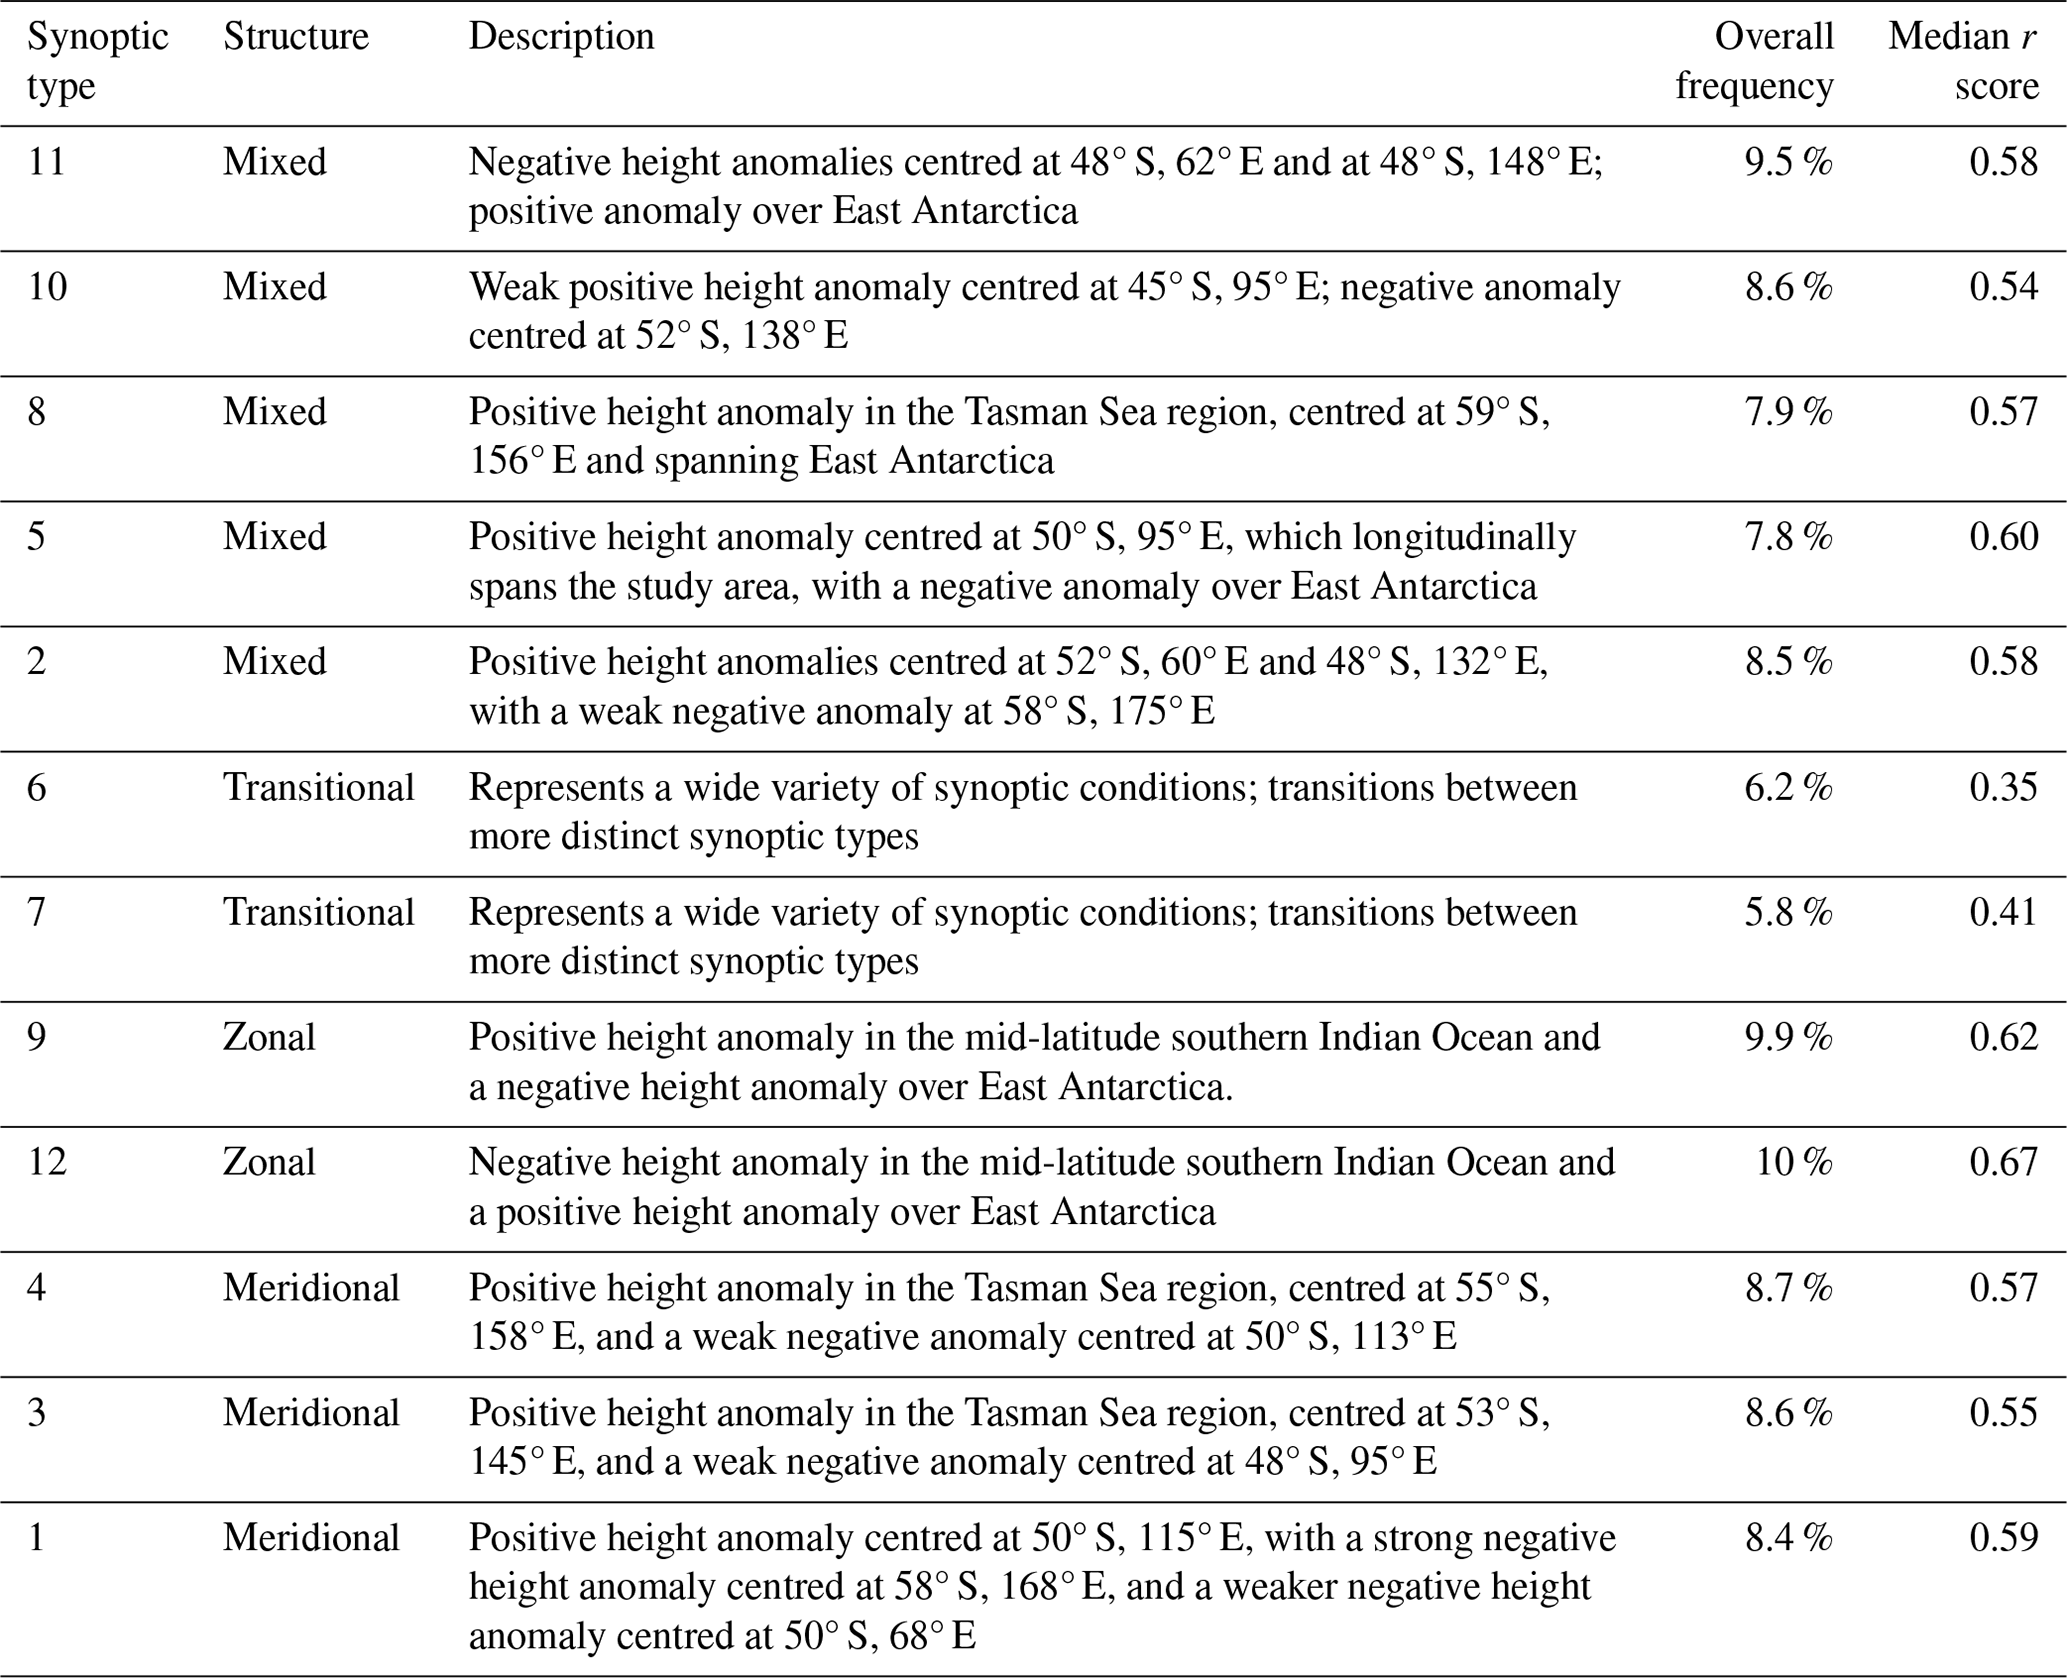
3.5 Synoptic-type interannual frequency and precipitation
The overall frequency in each synoptic type ranges from 5.8 % to 10 % (Table 2, Fig. 4c). The non-transitional synoptic types display frequencies between 7.8 % and 10 %, with the transitional synoptic types having slightly lower frequencies of 5.8 % (type 7) and 6.2 % (type 6). The zonal synoptic types display the highest interannual variation, with type 9 varying between 0 % and 39 % and type 12 varying between 0.5 % and 37 %. The annual frequency in other types varies between 0.3 % and 24 %. The frequency in type 9 increased significantly over 1900–2015 (0.64 d yr−1, 95 % CI = [0.52, 0.76]). There is no significant trend in the frequency in type 12 for 1900–2015, but there is a negative trend for 1957–2015 (−0.46 d yr−1, 95 % CI = [−0.72, 0.20]). The frequency in the transitional and mixed types decreases over time, especially types 6, 7, and 11, while the frequency in meridional types increases, especially types 1 and 4 (see Table B1 for trends in all variables). The transitions between synoptic types are summarised in Fig. A3.
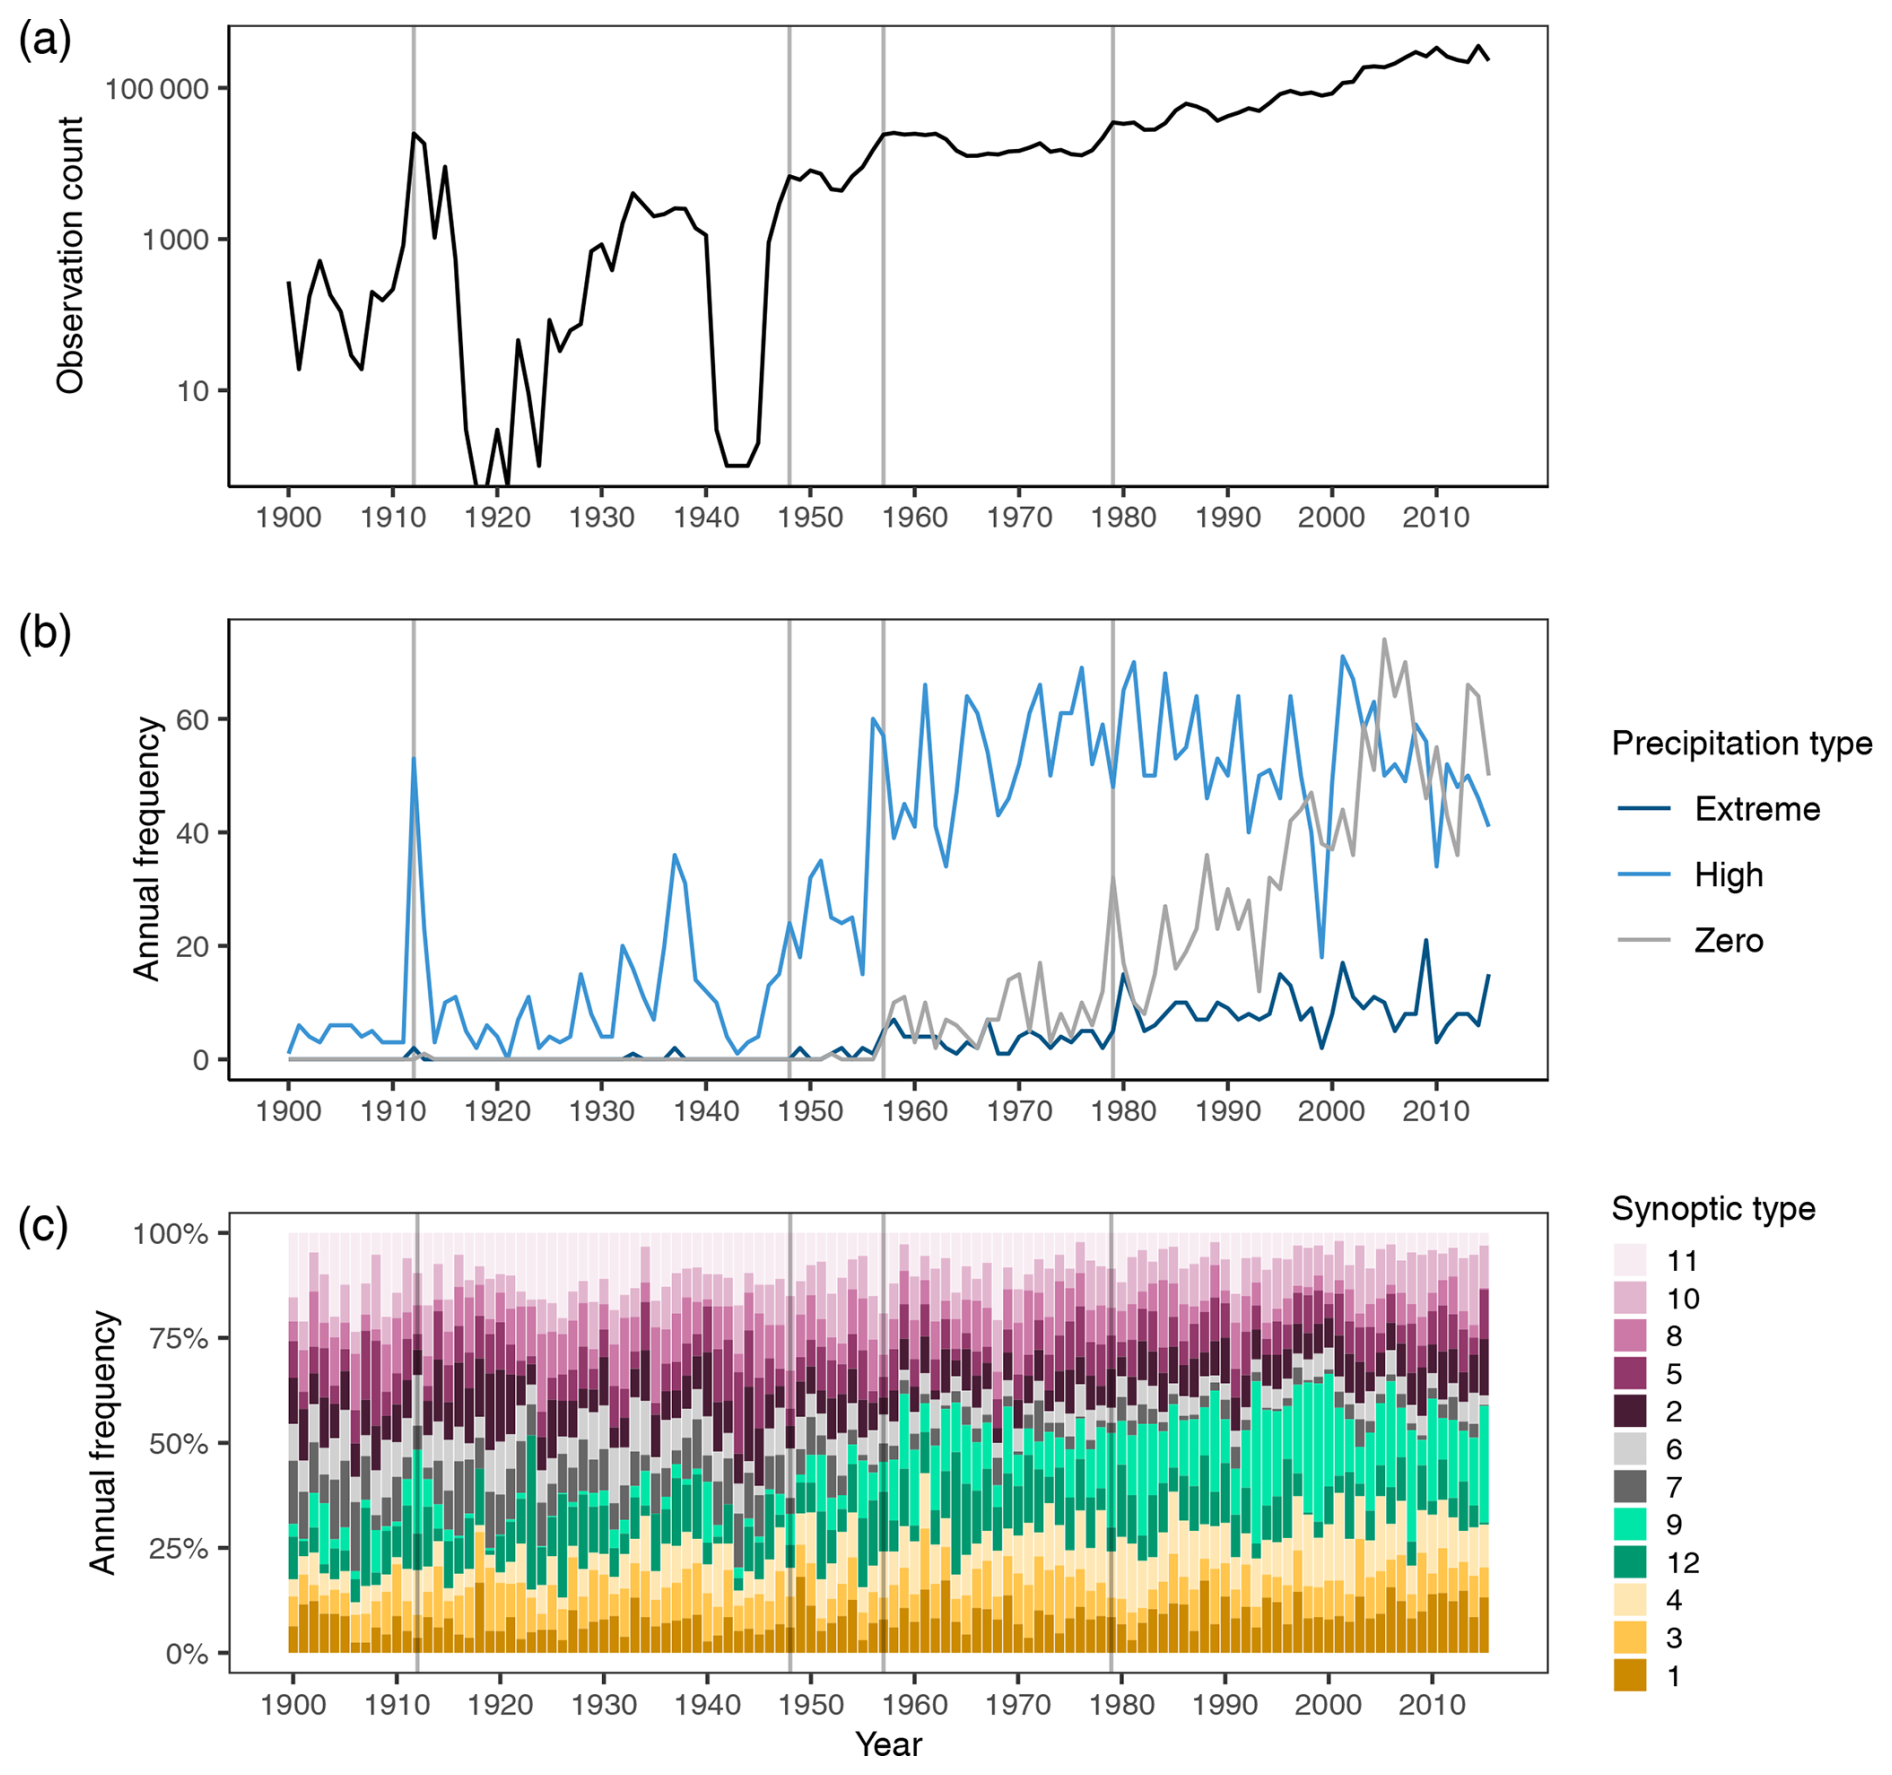
Figure 4Comparison between the number of observations, the count of precipitation-type days, and the annual frequency in synoptic types over 1900–2015. (a) The number of assimilated observations per year into ISPDv4.7, south of 50° S in the study area (50–75° S, 40–180° E). Note the log scale. (b) The number of zero, high (90–99th percentile), and extreme (> 99th percentile) precipitation days each year. (c) Annual frequency in synoptic types, grouped by structure: mixed (pinks), transitional (greys), zonal (greens), and meridional (yellows). Note the increasing frequency in type 9 (light green) and type 4 (light yellow) from around 1975 and the short periods of increased frequency in type 4 in around 1912 and the 1930s. Vertical lines indicate the years 1912, 1948, 1957, and 1979 (see Sect. 4.1).
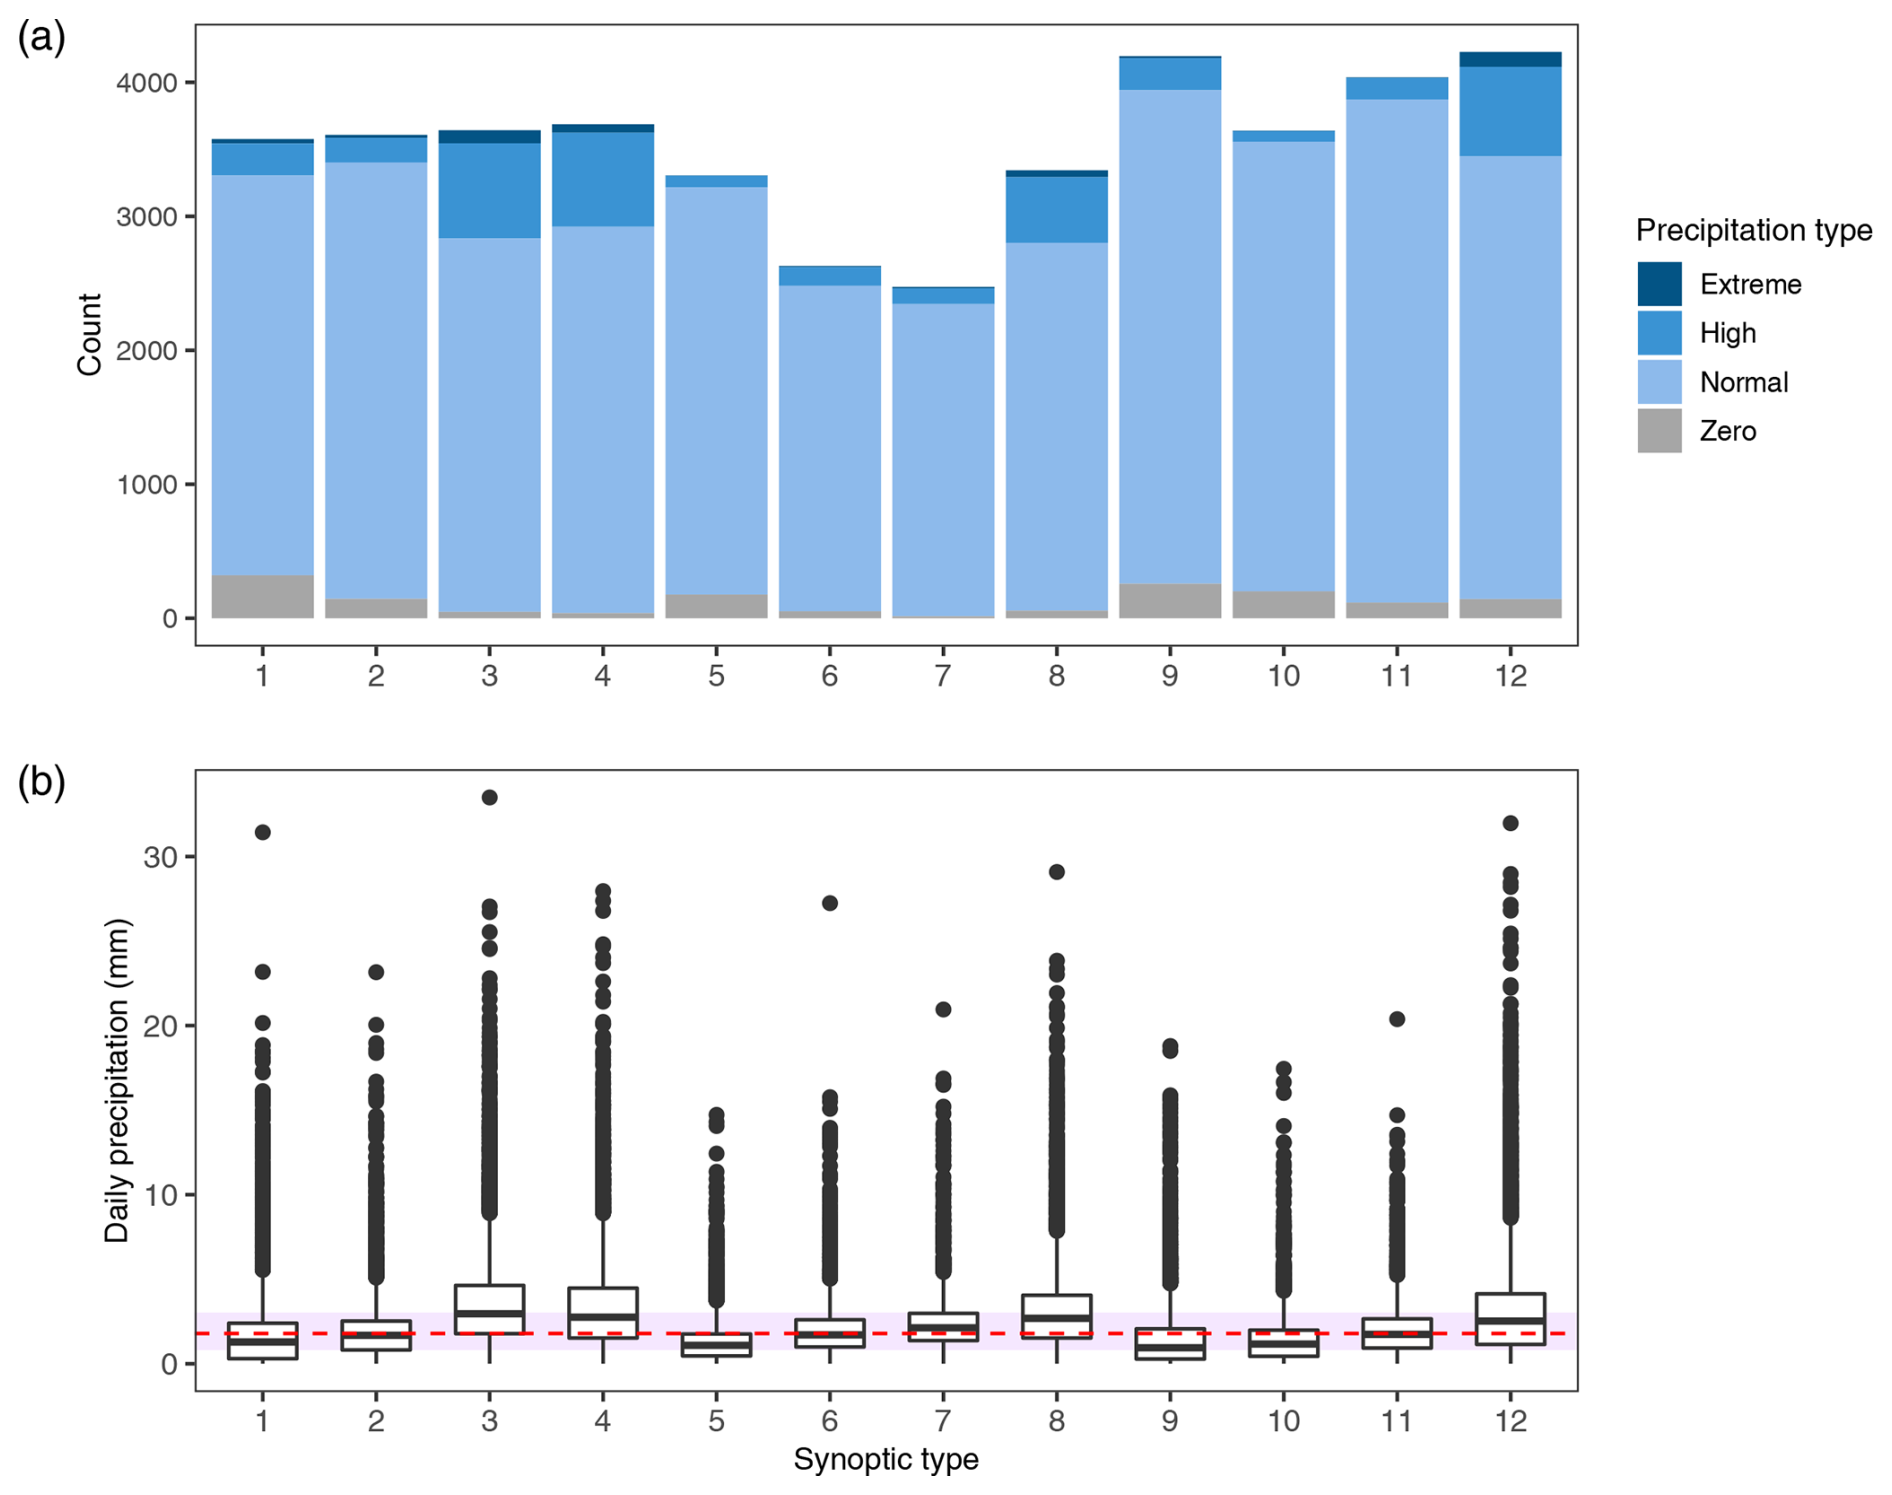
Figure 5The 20CRv3 daily precipitation associated with each synoptic type at Law Dome (67° S, 113° E) for 1900–2015. (a) Count of precipitation condition days per synoptic type: zero (grey), normal (< 90th percentile, light blue), high (90–99th percentile, medium blue), and extreme (> 99th percentile, dark blue) precipitation days. Types 3, 4, 8, and 12 have a higher proportion of high and extreme precipitation days, while types 1 and 9 have a higher proportion of zero days. (b) Box and whisker plots of daily precipitation (mm) by each synoptic type. The overall median daily precipitation (1.79 mm d−1) is indicated by the dashed red line, and the purple bar indicates the interquartile range (0.80, 3.03 mm d−1). Synoptic types 3, 4, 8, and 12 have higher median daily precipitation than the overall median.
Testing showed that at least one of the synoptic types has a median daily precipitation significantly different to the others (Kruskal–Wallis χ2 = 6098, df = 11, p < 0.0001). Furthermore, a Wilcoxon rank-sum test indicated that, of the 66 synoptic-type pairings, 59 have significantly different medians (Bonferroni adjustment, p < 0.05). Synoptic types 3, 4, 8, and 12 are associated with above-average precipitation at Law Dome (Fig. 5a, b). Synoptic types 3, 4, and 8 display strong positive geopotential height anomalies in the Tasman Sea region (Fig. 3), which represent anticyclonic blocking patterns that are known to increase precipitation in East Antarctica (Scarchilli et al., 2011; Servettaz et al., 2020; Udy et al., 2021, 2022) and are often associated with atmospheric rivers (Pohl et al., 2021; Wille et al., 2021). Synoptic type 12, which is associated with high and extreme precipitation days (Fig. 5b), has a zonal negative height anomaly in the mid-latitudes, consistent with a negative SAM (SAM−) pattern. Previous studies have found that SAM− is associated with increased precipitation in the Law Dome region (Marshall et al., 2017). Type 12 in this study is comparable to SOM3 in Udy et al. (2021), which showed enhanced strength of polar easterlies and positive precipitation anomaly in the Law Dome region (Udy et al., 2022). This suggests that the precipitation associated with type 12 is predominantly orographic in nature, from moist air uplifted across Law Dome (Udy et al., 2021, 2022).
Table 3Linearly detrended Spearman correlation (r scores) and statistical significance (two-sided Student's t test) between the annual frequency in each synoptic type, the annual 20CRv3 precipitation at Law Dome, and the annual snow accumulation rate at DSS (ice core) for the four different time periods. Correlation significance is indicated as follows: > 99 % bold type, > 95 % normal type, < 95 % italic type.
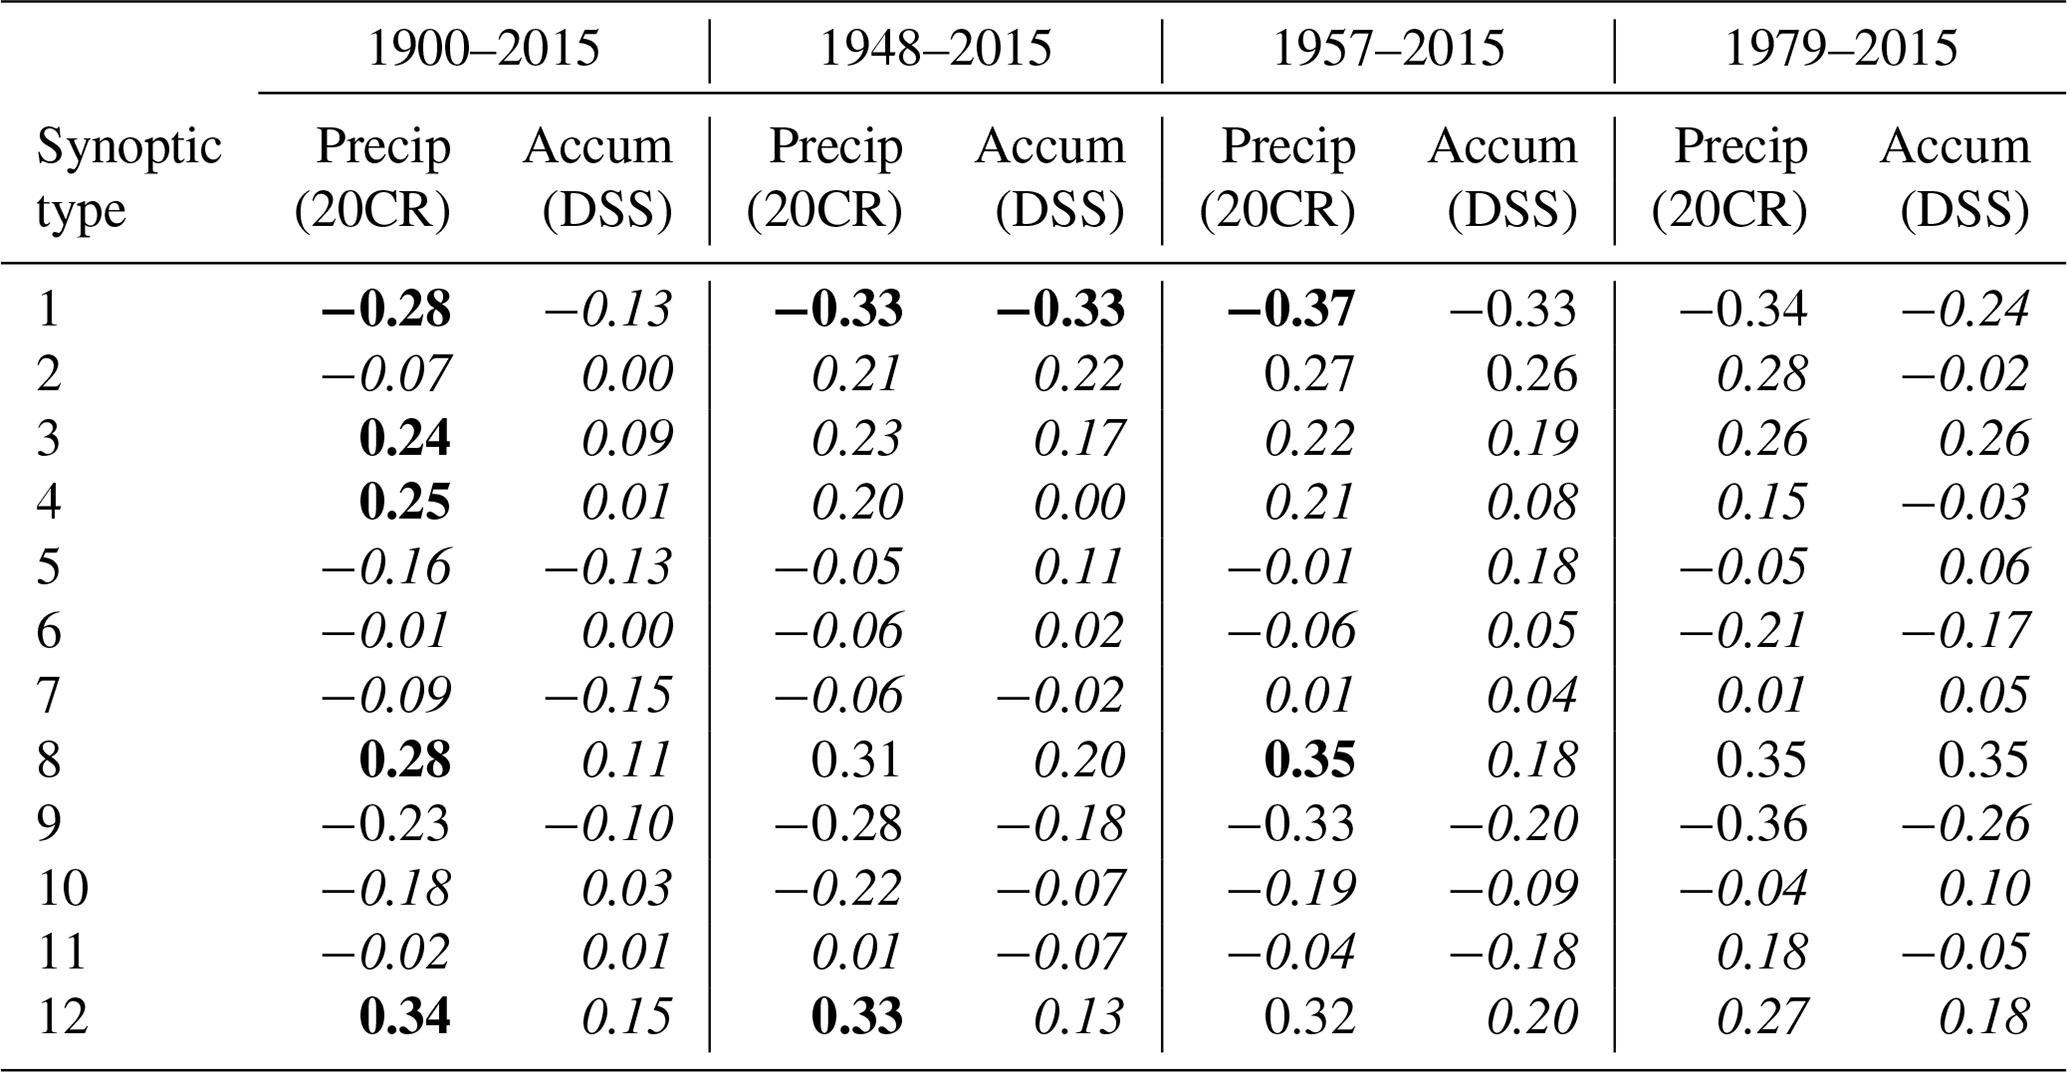
The annual frequency in each synoptic type was compared to the annual Law Dome precipitation from 20CRv3 and to the annual snowfall accumulation rates from the DSS ice core record for different time periods (Table 3). Only a few significant correlations exist between the annual frequency in individual synoptic types and the DSS ice core annual accumulation record. The annual frequency in synoptic type 1, which is a low/zero precipitation type (Fig. 5), is the most consistent type to correlate with both 20CRv3 annual precipitation and the DSS ice core annual accumulation over the time periods tested. The annual frequency in synoptic type 8 is significantly (p < 0.05) positively correlated over the time periods tested with 20CRv3 annual precipitation but is not significantly correlated with the DSS ice core annual accumulation, with the exception of the 1979–2015 period. Despite synoptic type 3 having the highest median daily precipitation (2.96 mm d−1 compared to the overall median of 1.79 mm d−1), the annual frequency in synoptic type 3 is not significantly correlated with the DSS ice core annual accumulation in any of the time periods tested. However, synoptic type 3 is significantly correlated with 20CRv3 annual precipitation for only the 1900–2015 period.
Since 1979, high/extreme precipitation days have been known to account for more than 40 % of the total annual precipitation across East Antarctica (Turner et al., 2019). In contrast, only 7 % of total annual 20CRv3 precipitation at Law Dome came from high/extreme precipitation (> 90th) events for 1900–1947, compared to 24 % between 1948–1956 and 59 % between 1957–2015. Note that the high/extreme percentiles are calculated based on the 1900–2015 time period for consistency across the study period. While the threshold values increase when calculated over more recent time periods (1950–2015 and 1979–2015), the periods of increased frequency in high/extreme precipitation days around 1912, the 1930s, and post-1948 remain consistent. Additionally, the 1900–2015 percentile threshold is a similar magnitude to the threshold calculated over the satellite era using RACMO2 (Turner et al., 2019).
The number of zero, high, and extreme precipitation days increases over time, along with the number of assimilated observations into ISPDv4.7 in the region 50–75° S, 40–180° E (Fig. 4a, b). We find that 20CRv3 displays a reduced ability to generate high precipitation days before the late 1940s and zero and extreme precipitation days before the late 1950s. The number of days with zero precipitation increases from the late 1950s, with a continued positive trend until the 2000s. Prior to 1957, only 2 d are classified as zero precipitation days (1 each in 1913 and 1952) and 13 d as extreme precipitation. The increase in observed zero, high, and extreme precipitation days are supported by an increase in the synoptic types associated with low (synoptic type 1 and 9) and high (synoptic type 4) precipitation days over the analysis period (Table B1).
3.6 Linear model estimates of ice core annual accumulation from synoptic typing
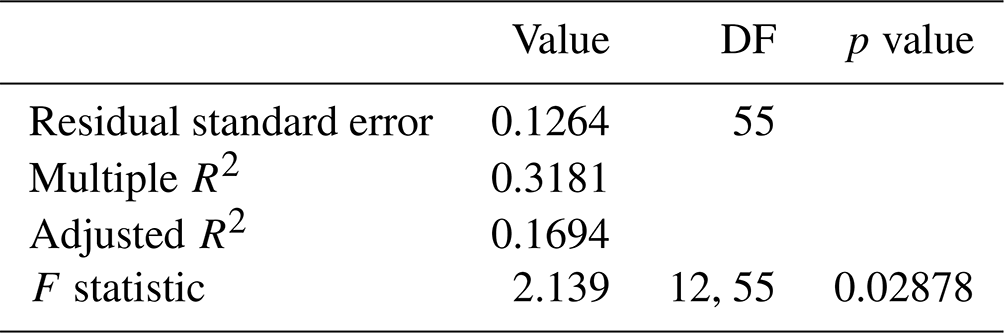
Multiple linear regression models were generated to estimate the variability in DSS ice core snowfall accumulation explained by a linear combination of the annual frequency in synoptic types (Fig. 6). The models explain 31 % of the variability in DSS accumulation for the 1979–2015 period (Fig. 6a), 24 % for the 1957–2015 period (Fig. 6b), and 17 % for the 1948–2015 period (Fig. 6c). Perhaps not surprisingly, over 1900–2015, the variability explained is not significant (p > 0.05), and it is not shown. Summaries of the linear model outputs can be found in Appendix C. The models capture the mean variability in DSS accumulation but fail to represent the larger extremes (e.g. 1961, 1978, 1981, 1999, 2001). These results indicate that 20CRv3, using a linear combination of synoptic types, can represent the combination of synoptic conditions that are associated with precipitation variability at Law Dome after 1948 but struggles to capture anomalously high or low ice core accumulation years, even in the early 2000s.
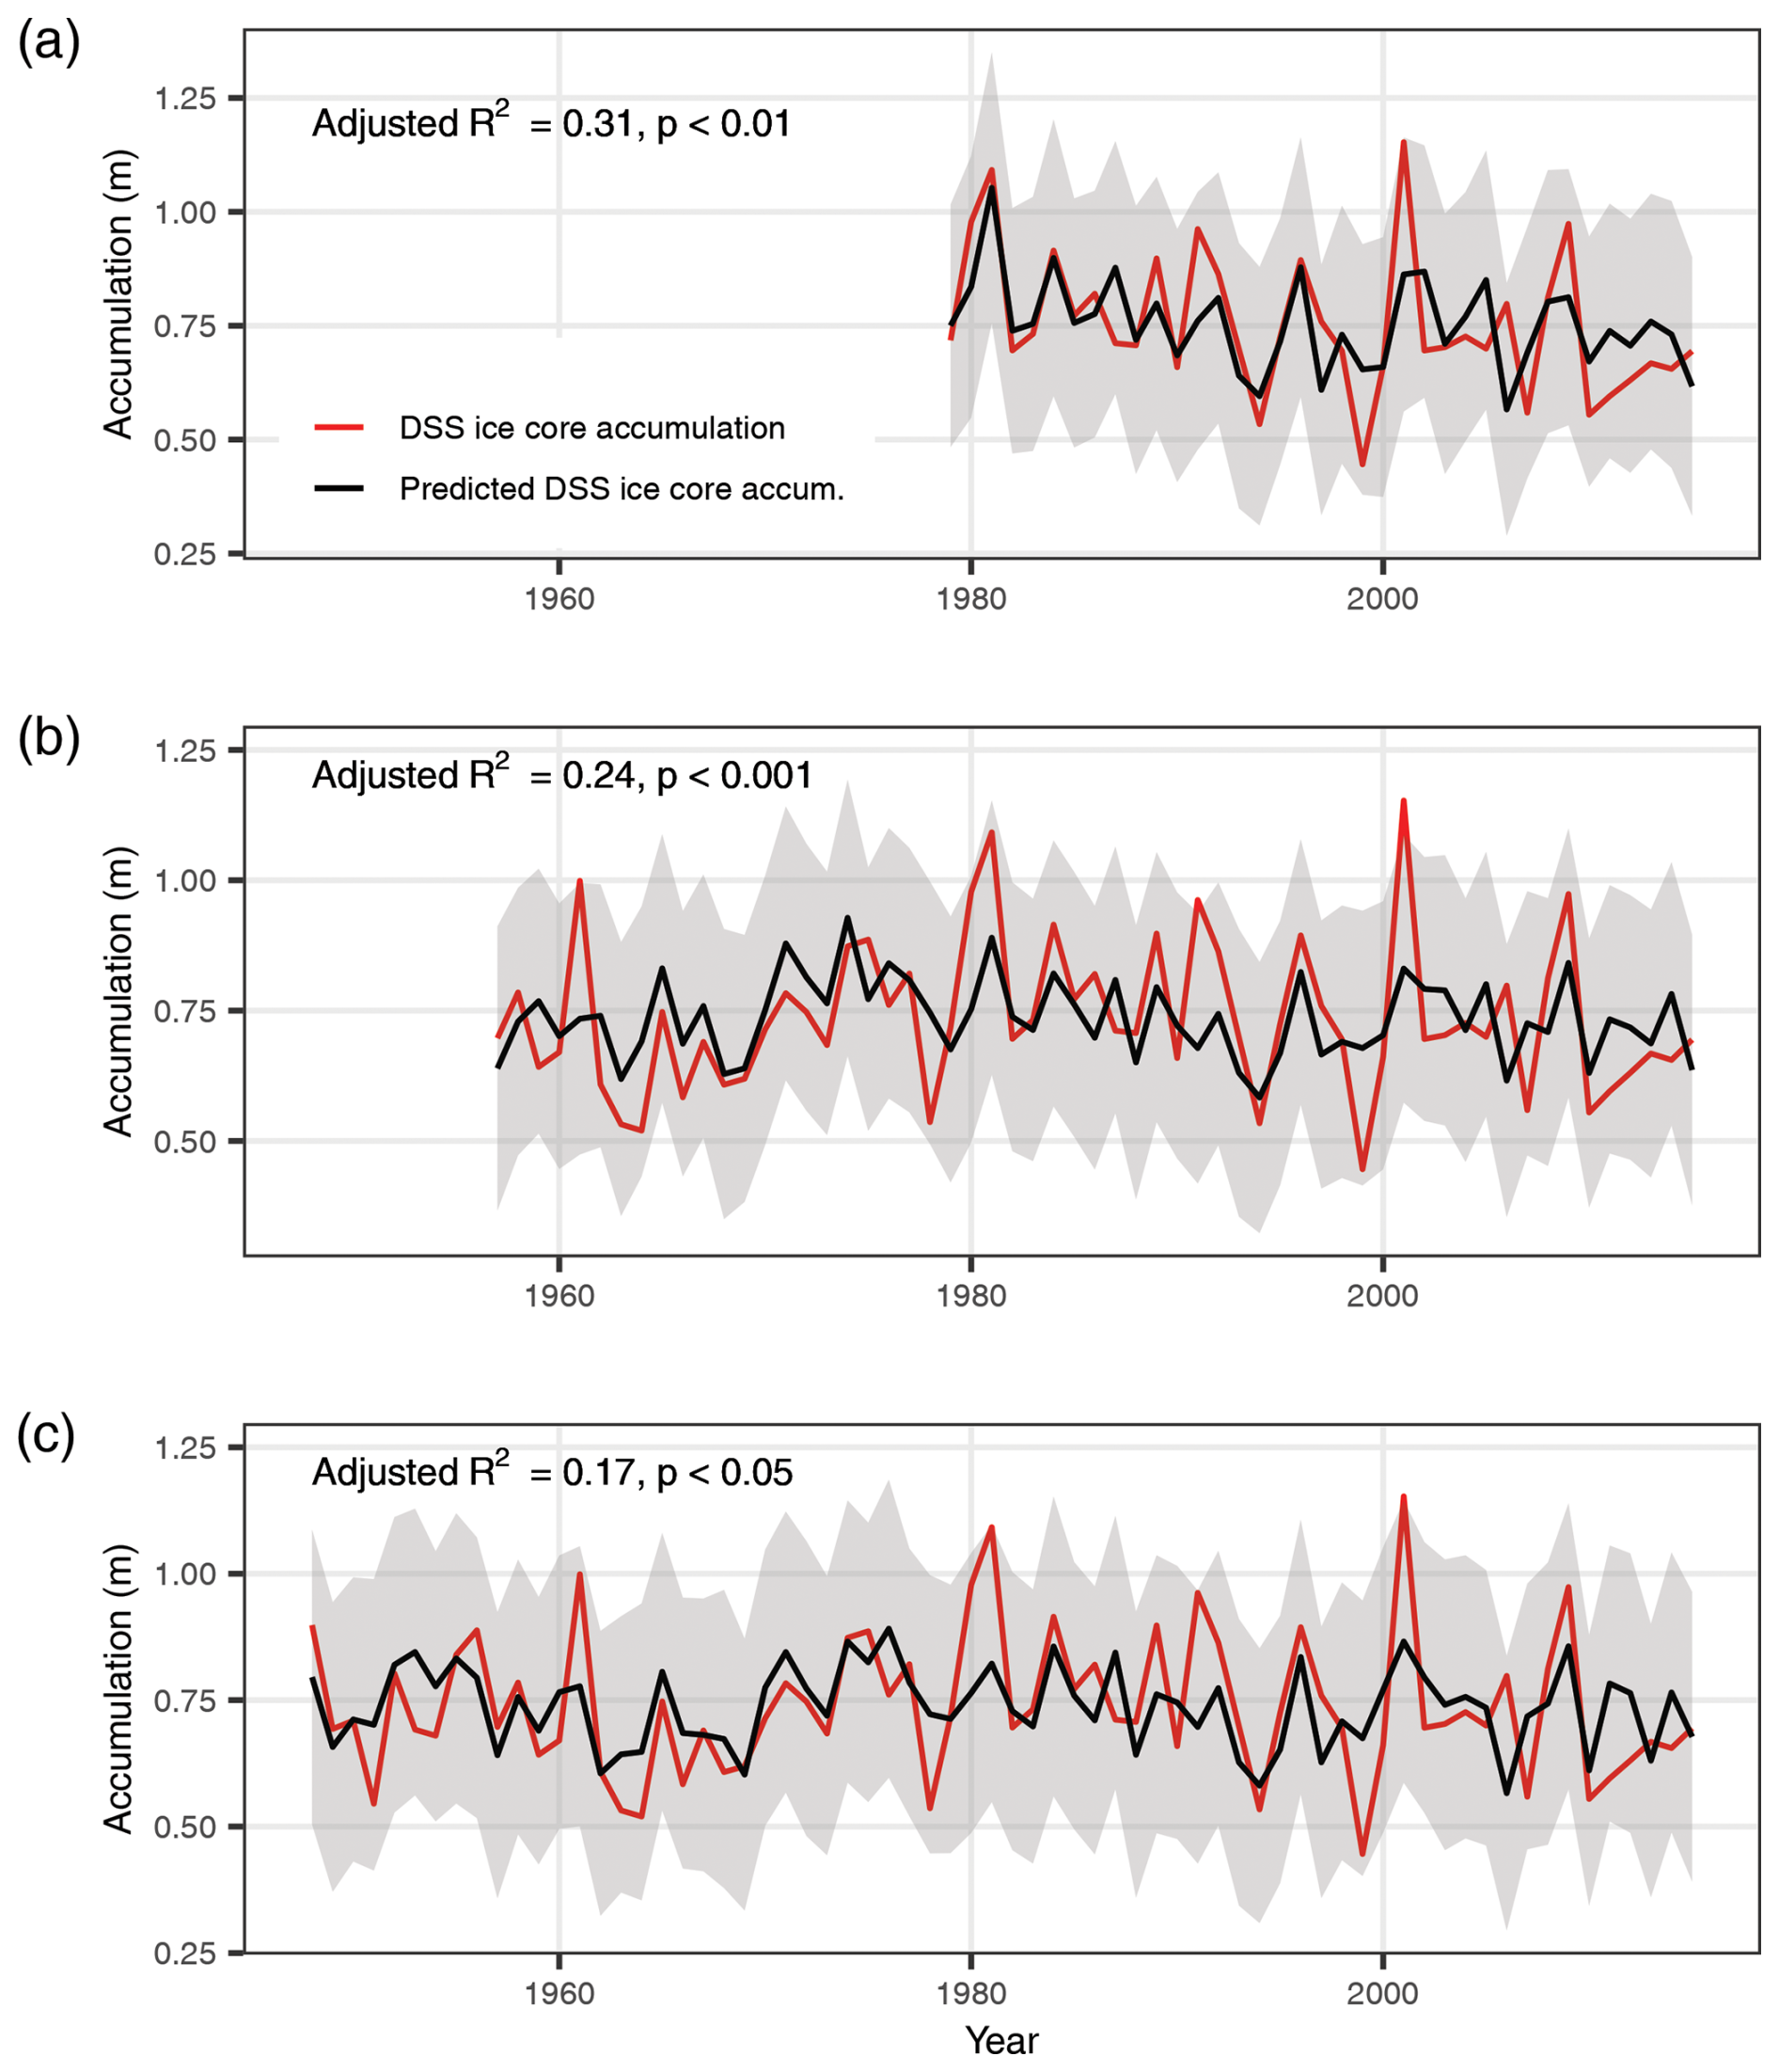
Figure 6The DSS ice core annual snowfall accumulation (red line) and the predicted DSS accumulation based on selected synoptic types (black line), with 95 % confidence interval around each point (grey shading), for (a) 1979–2015, (b) 1957–2015, and (c) 1948–2015. The accumulation is predicted using the annual frequency in different combinations of synoptic types; for example, the 1957–2015 model uses only the annual frequencies of types 1, 9, and 11. Refer to Appendix C for more details on the combination of synoptic types and linear model output.
Our results indicate the 20CRv3 ensemble can represent the meridional synoptic conditions in the southern Indian Ocean that are required for high precipitation (90–99th percentile) at Law Dome back to 1948 and extreme (> 99th percentile) and zero precipitation back to 1957 (Fig. 4b). This extends the period available to contextualise recent trends and extremes in precipitation and synoptic weather patterns by 2–3 decades prior to the satellite era.
4.1 Key observations improve precipitation and synoptic-type variability in 20CRv3
Improvements in the ability of 20CRv3 to reflect meridional weather patterns (Fig. 3) in the southern Indian Ocean and to reproduce both zero and high and extreme precipitation days at Law Dome (Fig. 4b) relies on the commencement of atmospheric pressure observations from weather stations and ships in key locations across the southern Indian Ocean. In the study area, the number of assimilated observations in ISPDv4.7 increased from the late 1940s (Compo et al., 2019). Some of the key locations that led to this increase in assimilated observations are described here. Observations from ships in the southern Indian Ocean increased from 1946 coinciding with the end of the Second World War. The Australian National Antarctic Research Expeditions (ANARE) also established bases on Heard Island in 1947 and Macquarie Island in 1948 (Dodd, 2023). Observations from stations on the New Zealand mainland and Campbell Island (52.54° S, 169.14° E) commenced from 1949 (Compo et al., 2019). The International Geophysical Year (July 1957–December 1958) also saw a large increase in meteorological observations in East Antarctica and on other parts of the continent (Wexler, 1956).
Prior to these key observations, variability in annual precipitation derived from 20CRv3 is low compared to the later period and does not align with variability in the Law Dome DSS ice core annual snowfall accumulation record (Fig. 2, Table 1). The increase in the number of high/extreme precipitation days explains the apparent positive trend in the 20CRv3 annual precipitation over the period 1900–2015 (Table B1). This positive trend is likely an artefact of increased observations in ISPDv4.7, as the Law Dome DSS annual snowfall accumulation record does not indicate any trends over this time period (Table B1). This spurious trend in the 20CRv3 precipitation cautions the use of trend analysis alone to examine variability over the 20th century. Our results support previous studies that have related spurious trends in reanalysis products to observation density (e.g. Bromwich and Fogt, 2004; Huai et al., 2019; Marshall and Harangozo, 2000; Thorne and Vose, 2010; Wang et al., 2016). It has been shown that reanalyses that span the 20th century undergo a change in/around 1950 in the high latitudes of the Southern Hemisphere, including a reduction in standard error, a spurious drop in surface pressure (Schneider and Fogt, 2018), and a jump in 20CR precipitation–evaporation (P–E) over the East Antarctic Ice Sheet (Wang et al., 2020). However, evaporation is considered to be a minor contributor to variability at the Law Dome site and so is unlikely to have a major effect on this study (Roberts et al., 2015).
Short periods of increased observations in 1912 and during the 1930s (Fig. 4a) align with increased frequencies of high precipitation days in 20CRv3 model output (Fig. 4b) and increased frequency in synoptic type 4, one of the four synoptic types associated with high/extreme precipitation at Law Dome (Fig. 5b). Sir Douglas Mawson's 1911–1914 Australasian Antarctic Expedition recorded a large number of surface pressure observations from Macquarie Island. There were also observations in this period from coastal East Antarctica, attributed to the expeditions of Mawson and Scott (Mawson, 1914; Hesselberg, 1922). The increase in observations in the 1930s (Fig. 4a) is more difficult to assign to specific weather stations or expeditions.
Atmospheric pressure data from Macquarie Island (54.62° S, 158.86° E) are particularly important for distinguishing high/extreme precipitation at Law Dome, as they are sensitive to the strength and position of anticyclonic blocking in the Tasman Sea region. Anticyclonic blocking in the SW Pacific, particularly in the Tasman Sea, is a key atmospheric driver of episodic high precipitation events across East Antarctica (Scarchilli et al., 2011; Udy et al., 2022; Pohl et al., 2021). Synoptic types 3, 4, and 8 reflect Tasman Sea anticyclonic blocking and increased precipitation at Law Dome (Figs. 3, 5a, b). The frequency in type 4 also increases over the analysis period (Table B1), suggesting improvement in the ability of 20CRv3 to simulate meridional weather patterns as the number of atmospheric pressure observations increases (Fig. 4).
4.2 Synoptic typing and the Southern Annular Mode
The zonal geopotential height anomaly patterns in synoptic types 9 and 12 are consistent with the zonal symmetry expected with the Southern Annular Mode (SAM) (Rogers and Loon, 1982). Synoptic type 9 has a positive anomaly in the mid-latitudes, consistent with positive SAM (SAM+), while synoptic type 12 has a negative anomaly in the mid-latitudes, consistent with a negative SAM (SAM−) pattern (Fogt and Marshall, 2020). Aligning with the positive trend in SAM over the 20th century (Abram et al., 2014; Arblaster and Meehl, 2006; Jones et al., 2016), the annual frequency in synoptic type 9 (SAM+) increased over 1900–2015, while the frequency in synoptic type 12 (SAM−) decreased from around 1960 (Fig. 4c). Understanding SAM variability and the associated synoptic-scale weather conditions prior to the satellite era is important, given the relationship between SAM, ozone depletion/recovery, and rising greenhouse gases (King et al., 2023; Arblaster et al., 2011). SAM variability is also known to influence the mid-latitude climate variability in the Southern Hemisphere (Fogt and Marshall, 2020), including fire weather in southeastern Australia (Abram et al., 2021; Udy et al., 2024).
4.3 Relationships between the annual frequency in synoptic types and DSS ice core accumulation
Synoptic type 3 has high median 20CRv3 daily precipitation but showed no significant correlation with the DSS ice core annual accumulation record in any of the time periods tested (Table 3). One explanation for the lack of significant correlation is that only a subset of surface weather conditions represented by synoptic type 3 is associated with high precipitation at Law Dome. That is, the positive height anomaly in the Tasman Sea region in synoptic type 3 could represent a blocking anticyclone ridge that brings snowfall to Law Dome on some days, but, on other days, where the anticyclonic ridge is slightly offset to the west or east, the associated precipitation instead falls to the west or east of Law Dome. It is also possible that snowfall is blown away by wind and therefore would not appear in the ice core record. Wind erosion is less of an issue at Law Dome compared to other sites due to an absence of frequent high winds, but there is evidence of snowfall events missing from the net accumulation record (McMorrow et al., 2001; Zhang et al., 2023).
A linear combination of multiple synoptic types explains more variability in the DSS ice core annual accumulation record than any single synoptic type (Fig. 6, Table 3). The inclusion of synoptic type 1 in all of the multiple linear regression models (refer to Appendix C) suggests that synoptic conditions associated with low/zero precipitation days are important for reflecting annual snowfall variability. This underlines the significance of understanding the episodic nature of precipitation across East Antarctica that results from frequent transitions between zonal and meridional synoptic patterns. In addition, this study will greatly contribute to our ability to develop and understand proxies of seasonal and episodic accumulation in ice core records (e.g. see Zhang et al., 2023).
The variability explained by the linear models suggests that the assimilated observations after 1948, while limited, incorporate enough spatial observations to force the reanalysis model toward a representation of real synoptic variability, rather than simply the climatological mean. This means that longer-term reanalyses could be used in future synoptic-scale studies in the southern Indian Ocean back to 1948, vastly increasing the ability of reanalyses to investigate a diverse range of topics such as decadal changes in surface mass balance and ice core climate proxy stability and long-term variability in low- to high-latitude teleconnections. Udy et al. (2021) found links between synoptic weather patterns in the southern Indian Ocean and modes of climate variability, including SAM, the El Niño–Southern Oscillation, and the Indian Ocean Dipole, over the satellite era. These links to modes of variability have also been independently detected in East Antarctic ice cores (Vance et al., 2013, 2015, 2022; Crockart et al., 2021). The extension of the relatively reliable reanalysis period by 3 decades when using 20CRv3 will greatly assist in developing and evaluating the skill of reconstructions of climate variability and their representation in climate models. In addition, the ability to test the stability of synoptically driven changes in accumulation regimes over multiple decades will be invaluable to understanding decadal-scale changes in surface mass balance.
Our results indicate that 20CRv3 can reliably represent synoptic conditions associated with precipitation variability at Law Dome from the late 1940s and that this variability can be at least partially explained using a linear combination of the annual frequency in synoptic types. The incorporation of atmospheric pressure data from the Tasman Sea region (e.g Macquarie Island in the mid-20th century) is particularly important for the ability of 20CRv3 to reflect meridional synoptic patterns in the southern Indian Ocean and realistically represent annual precipitation variability at Law Dome. The ability of 20CRv3 to simulate high precipitation days begins to consistently improve after 1948, before stabilising after 1957. This shift in the ability to simulate high precipitation beyond 1948 leads to a spurious positive trend in 20CRv3 annual precipitation over 1900–2015 that is not supported by the DSS ice core accumulation record but should be considered if using 20CRv3 precipitation in palaeoclimate or climate change studies.
Further improvements and extension to the reliable period of 20CRv3 could be realised if additional observations from ongoing data rescue efforts are included, which would greatly bolster investigations of long-term climate variability and changes to surface mass balance in East Antarctica. Initiatives like the Atmospheric Circulation Reconstructions over the Earth (ACRE) digitisation of historical weather data (e.g. logbooks, journals, and land data from expeditions) (Allan et al., 2011; Brönnimann, 2022; Brönnimann et al., 2018) are critical to this endeavour. Our results highlight how valuable even small amounts of atmospheric pressure data can be to shift the reanalysis geopotential height patterns from climatology to the more realistic meridional patterns associated with precipitation variability.
This study will enable the analysis of precipitation variability in East Antarctica over longer timescales than is usually considered reliable, especially in combination with high-resolution ice core archives such as Law Dome and others in development, such as the Mount Brown South ice core (Jackson et al., 2023; Vance et al., 2024). In addition, investigators will also be able to test both the underlying climate dynamics and stationarity/stability of East Antarctic ice core proxy records (e.g. van Ommen and Morgan, 2010; Vance et al., 2013; Armstrong et al., 2020; Vance et al., 2022; Udy et al., 2024) of relevance to SW Pacific and Australian climate.
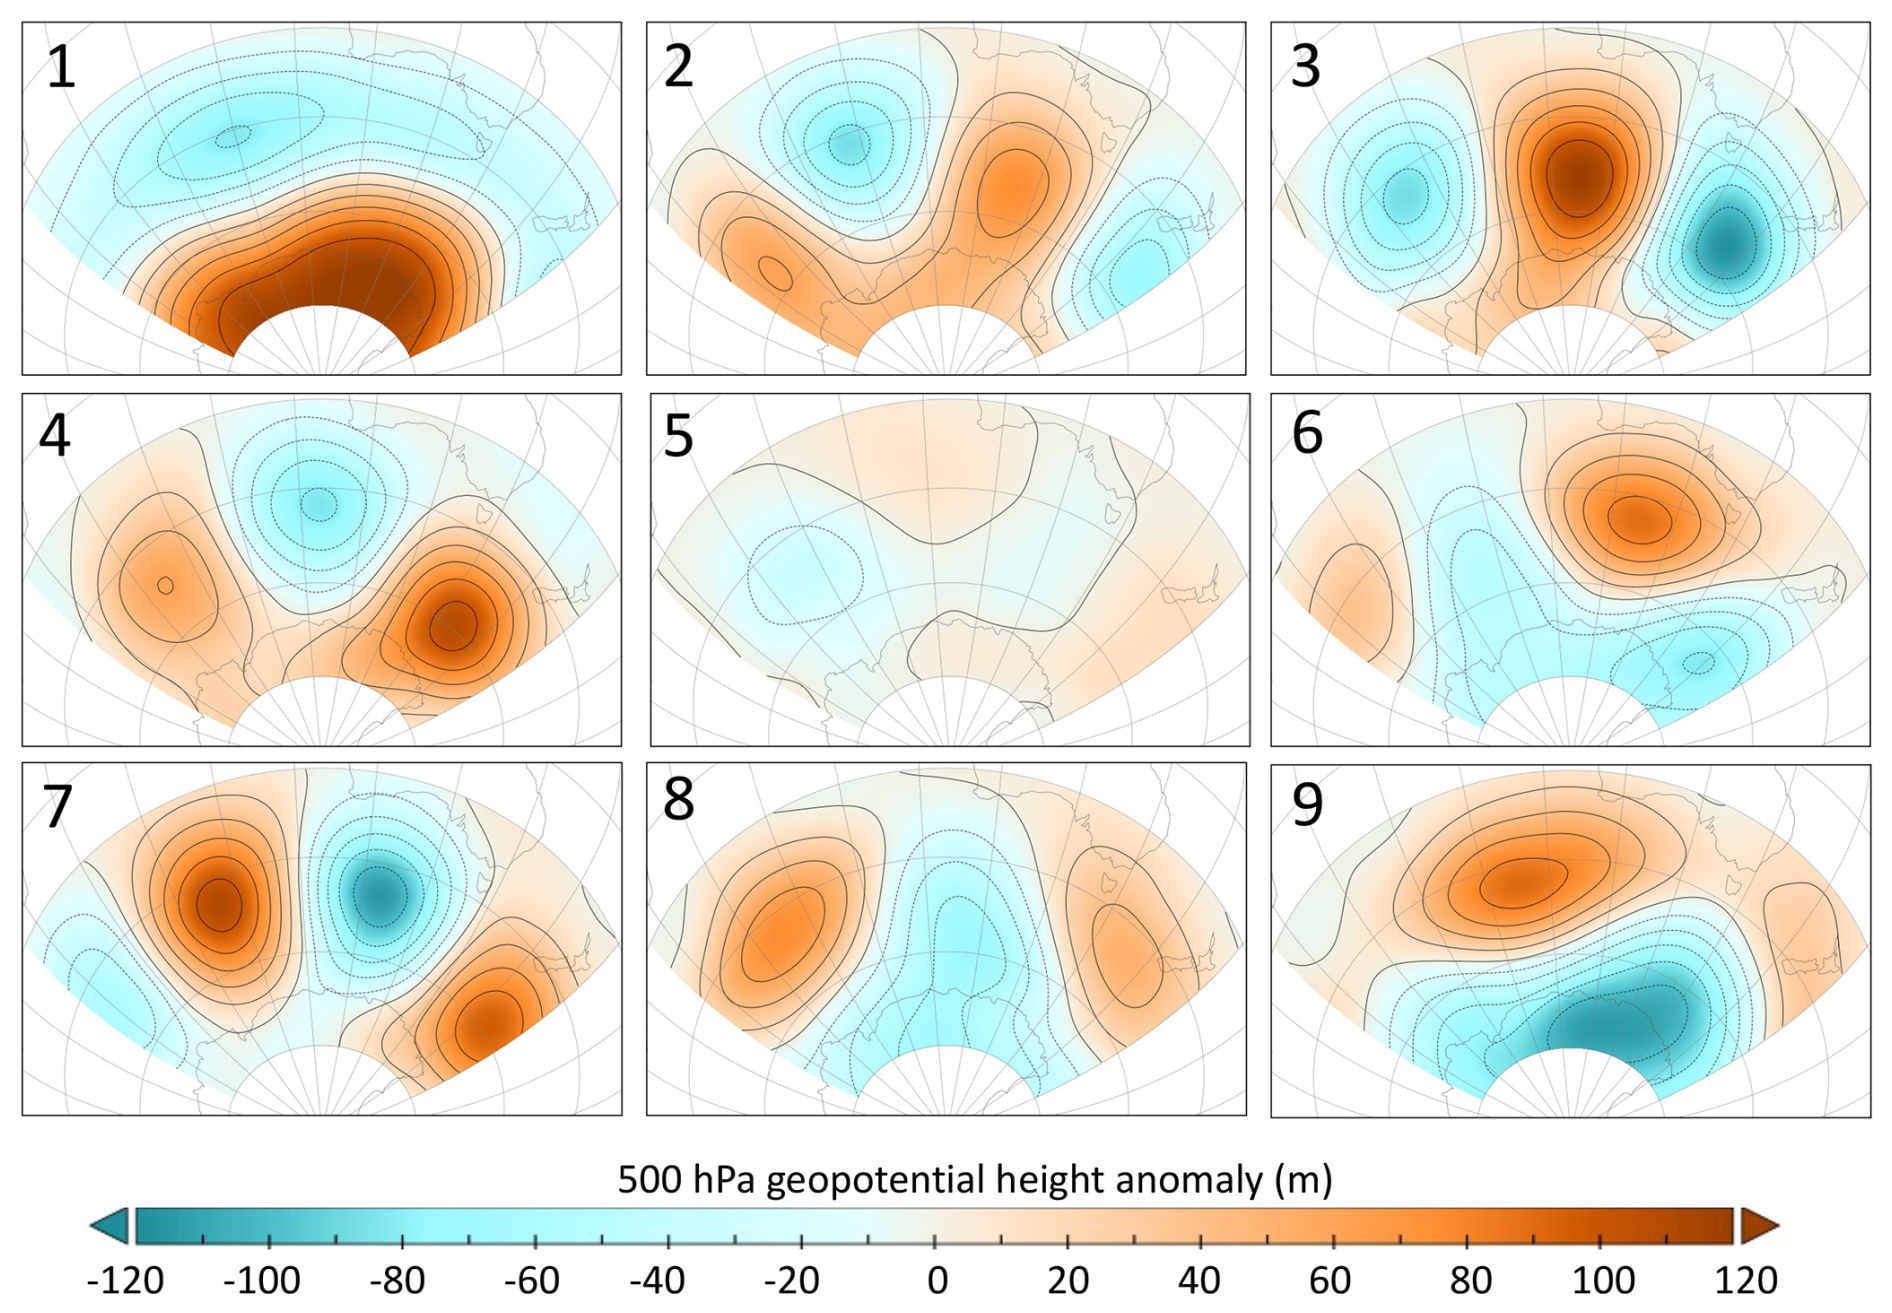
Figure A1Self-organising map (SOM) output of 500 hPa geopotential height anomaly for each of the nine SOM nodes. These were generated from daily anomalies from 20CRv3, 1979–2015. The nodes here display very similar patterns to the nodes in Udy et al. (2021), but they occur in a different order. For example, synoptic node 1 (this study) is equivalent to UdySOM3, and synoptic node 6 (this study) is equivalent to UdySOM4.
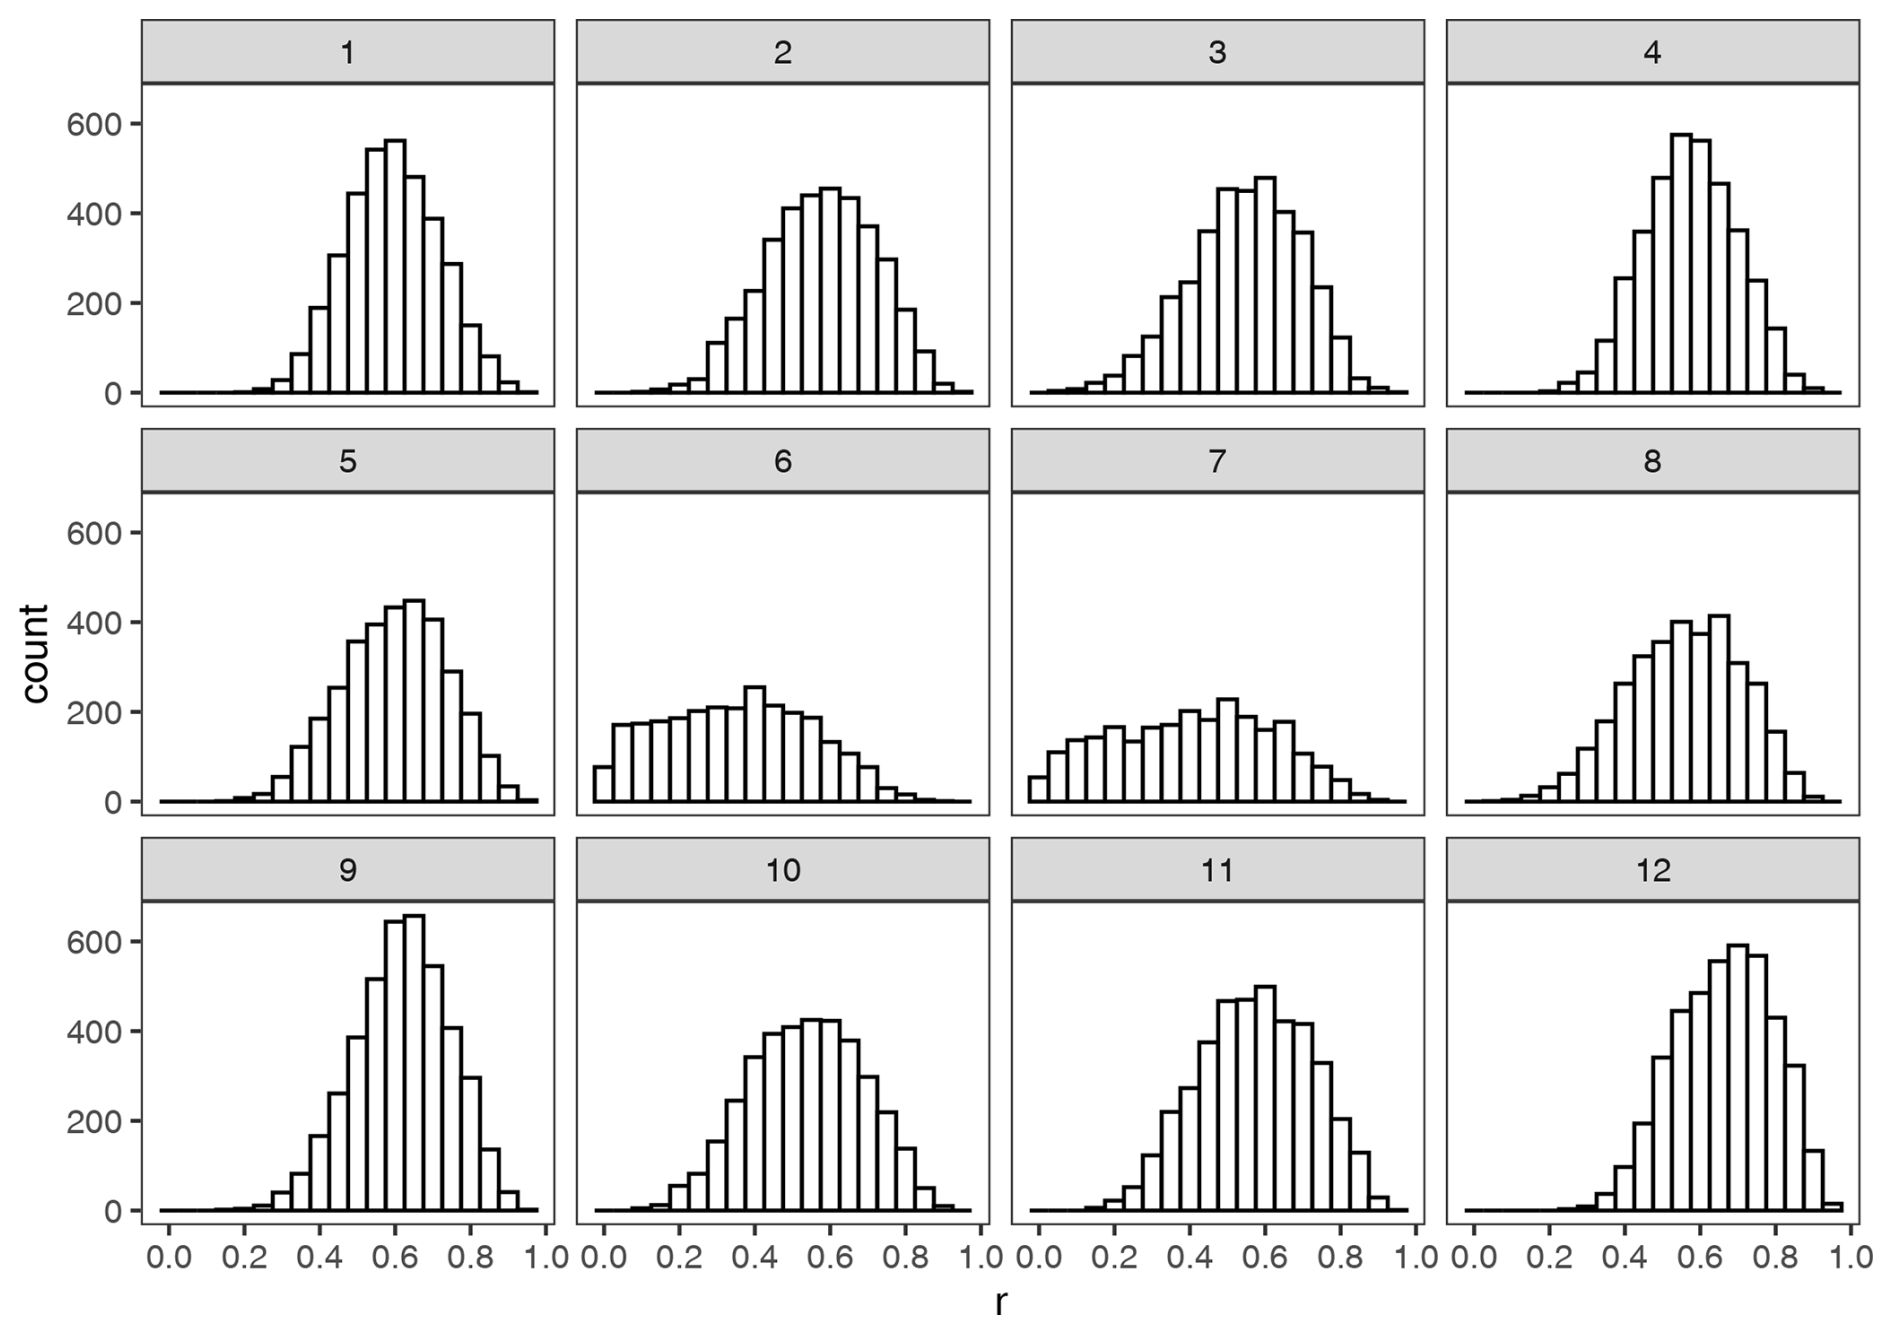
Figure A2Histograms of Pearson pattern correlation (r) score between the winning SOM node composite and the z500 anomaly of each daily time step assigned to that node.
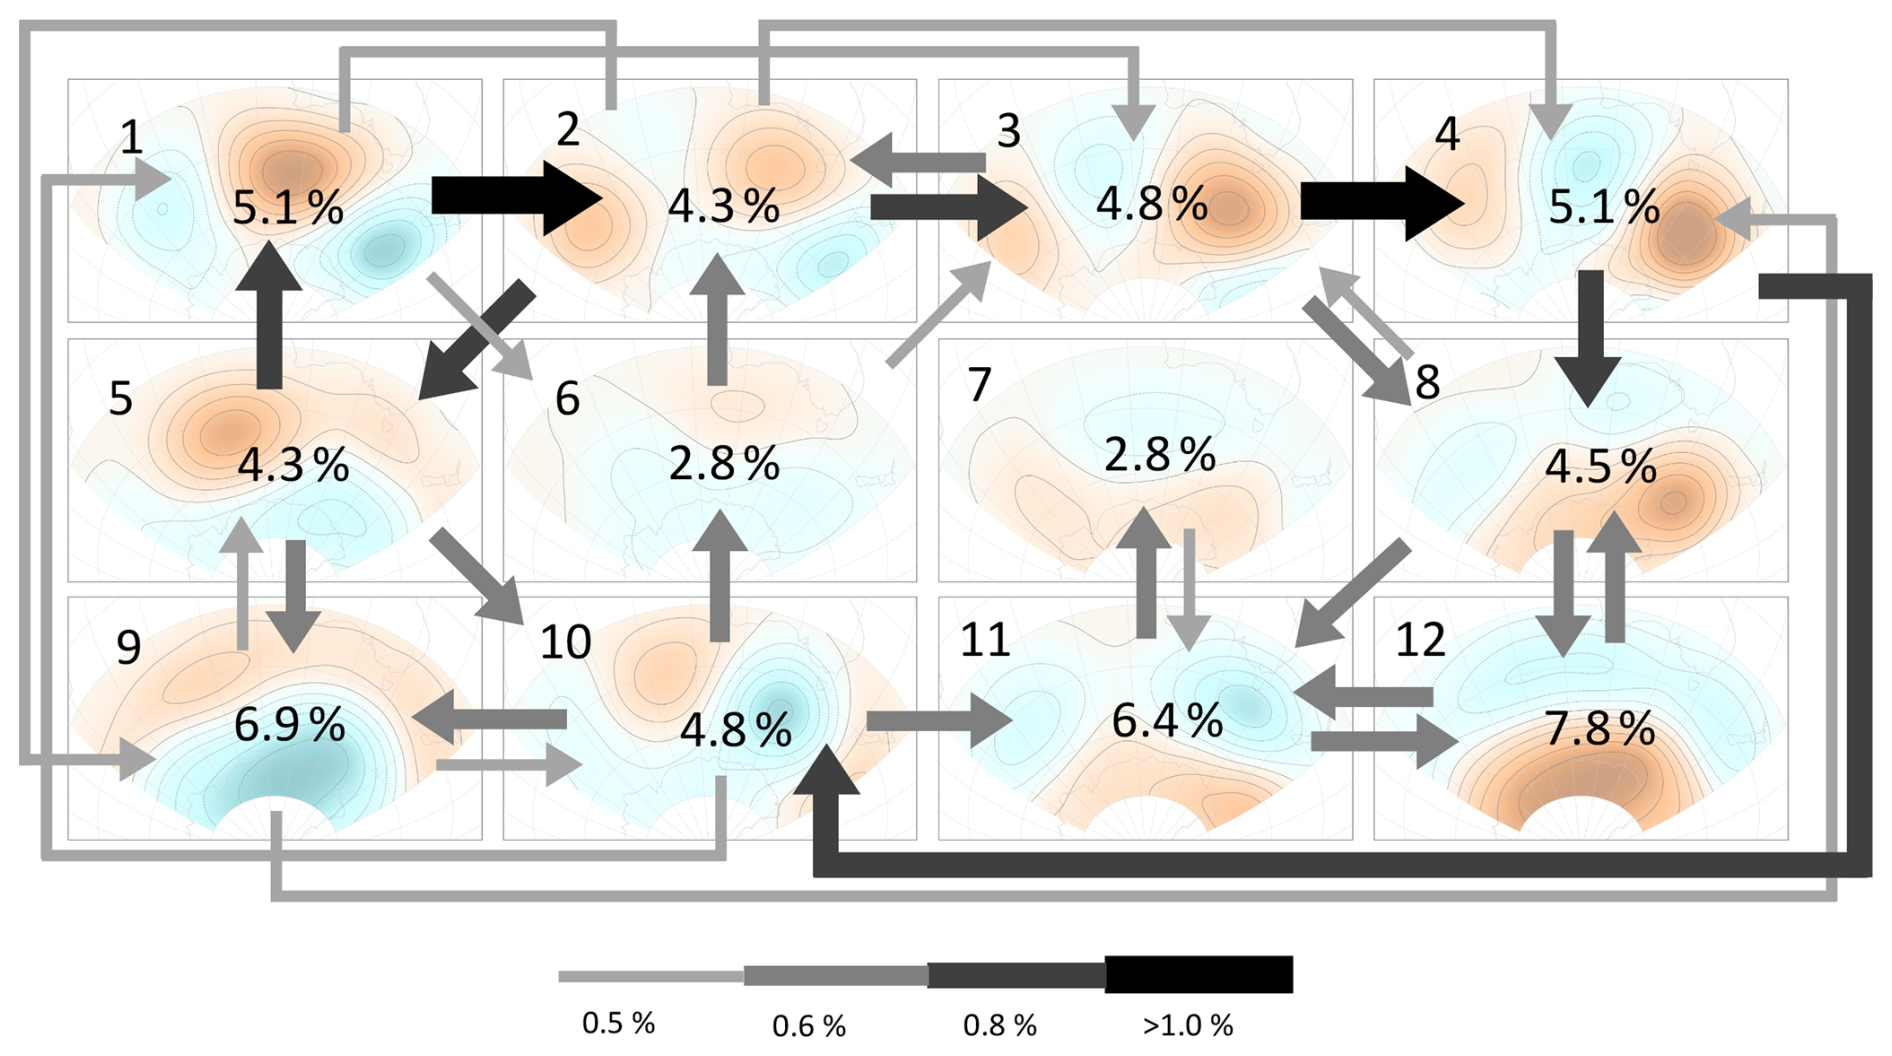
Figure A3Frequency in daily persistent patterns and daily transitions between synoptic types over the study period. The percentage value shown on the composite map of each synoptic type represents the proportion of the study period where the same type persisted for 2 or more days. Daily persistence across all types accounted for 60 % of the study period. Daily transitions greater than 0.5 % of the study period (210 d) are shown, with thicker and darker arrows for higher percentages. The more frequent transitions are indicative of the expected eastward progression of weather systems in the study area (Udy et al., 2021). We show 32 transitions, which make up 22 % of the study period. Most types transitioned into every other type at least once, except for types 5, 9, and 10, which never transitioned into type 12, and types 11 and 12, which never transitioned into type 9.
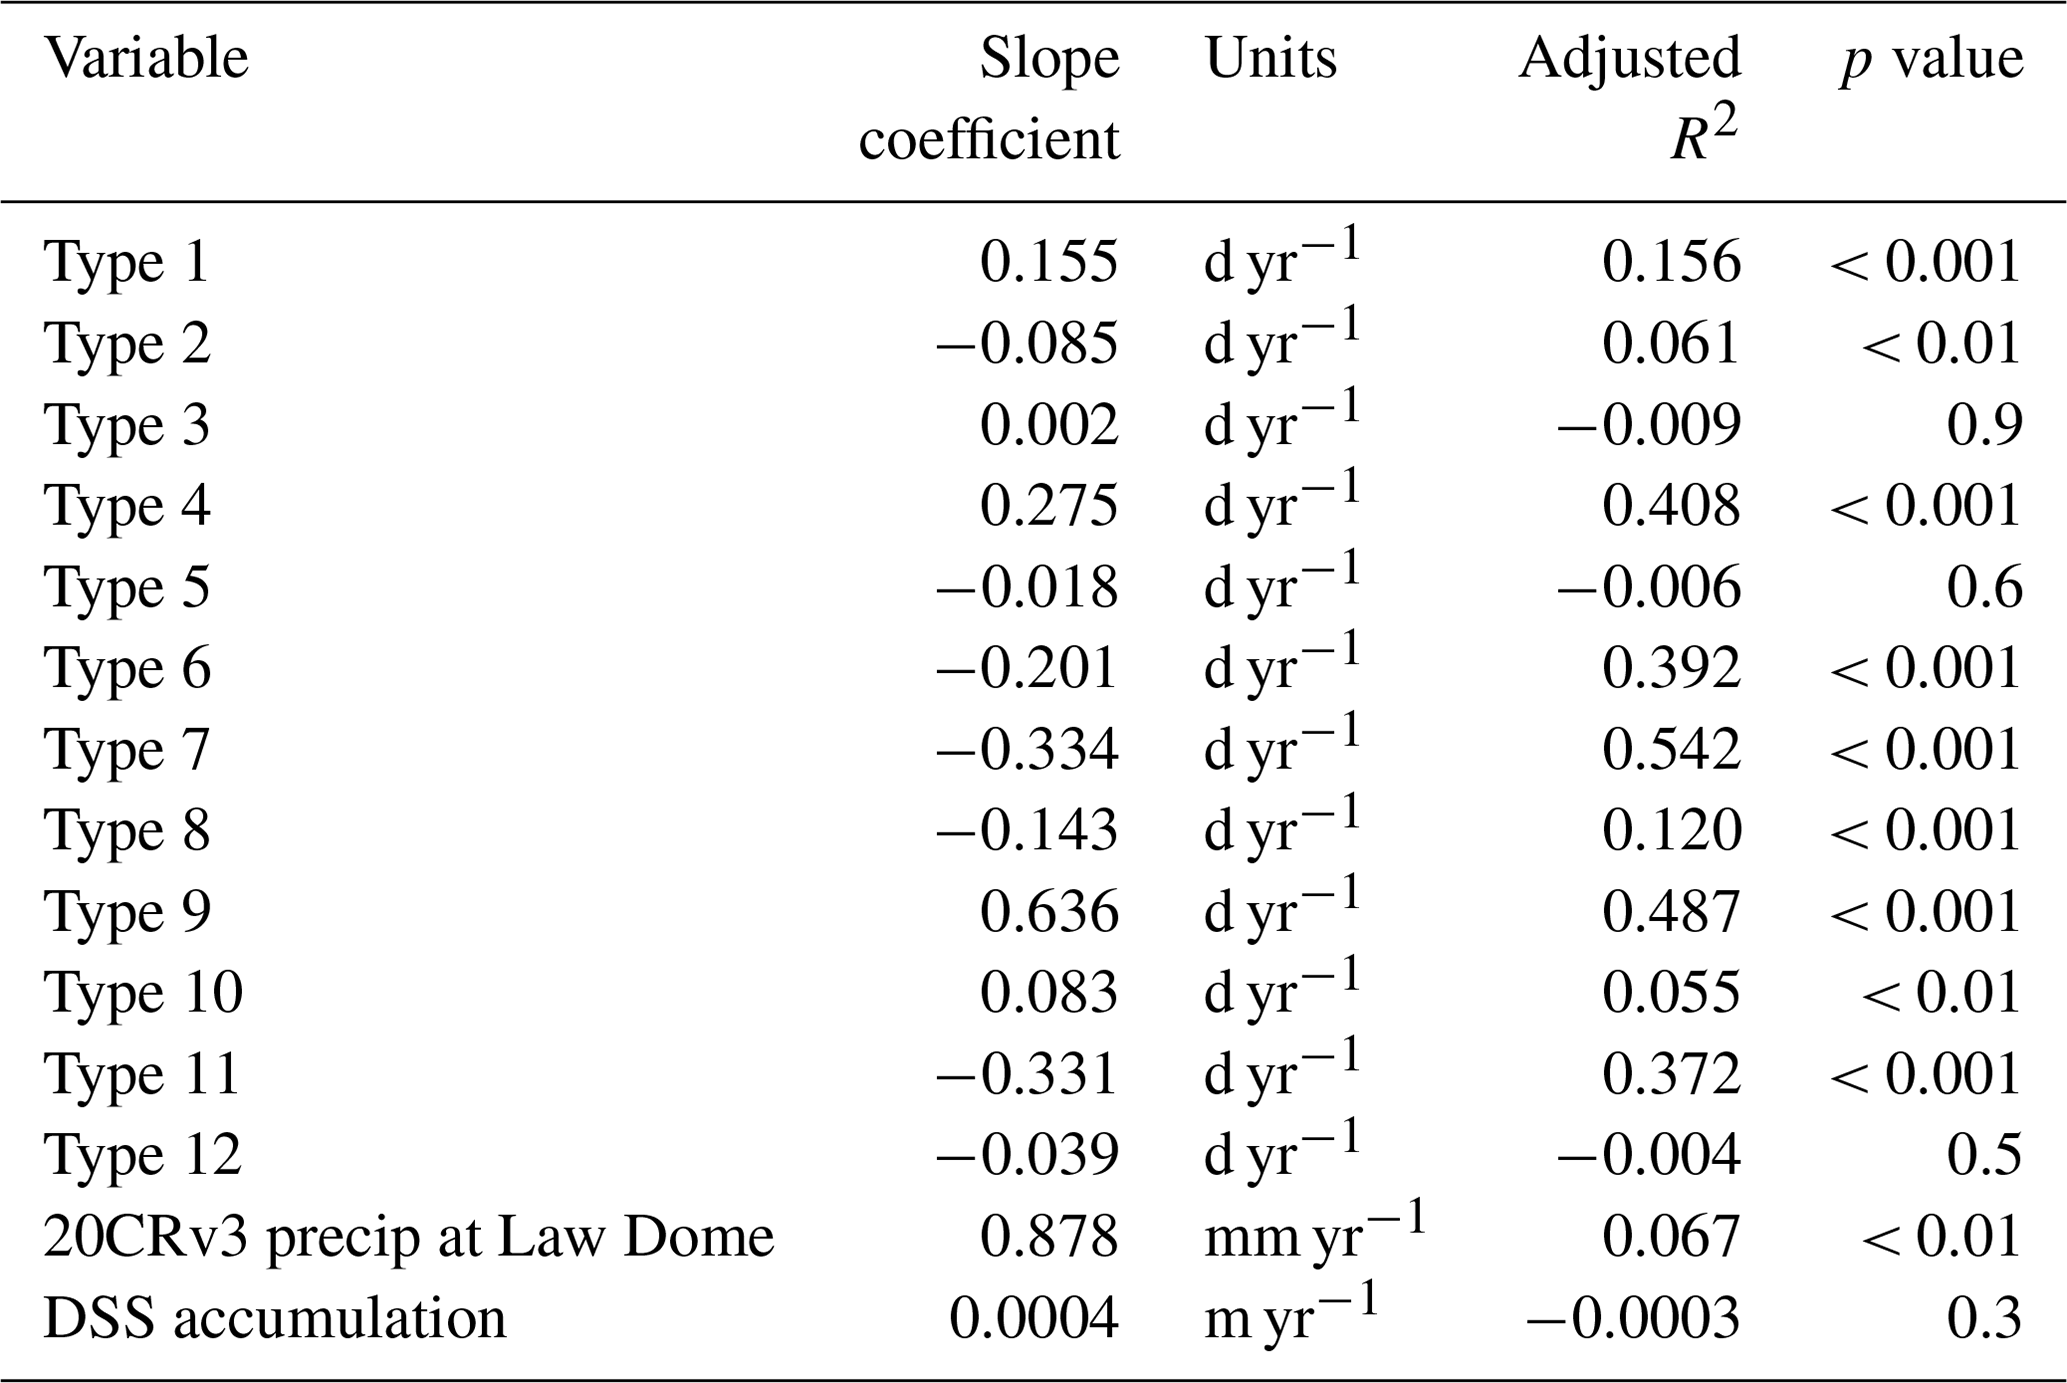
Table B1Temporal trends in the 12 synoptic types, 20CRv3 annual precipitation at Law Dome, and DSS annual snow accumulation for the 1900–2015 period. Note the weak but significant positive trend in 20CRv3 precipitation, with no trend in DSS accumulation.
The summaries of the coefficients and model fit statistics for the linear models for 1979–2015 (Tables C1, C2), 1957–2015 (Tables C3, C4), and 1948–2015 (Tables C5, C6) are shown here. The linear models use the annual frequency in selected synoptic types to estimate DSS ice core annual accumulation. Note that the synoptic types used in each model were selected using stepwise model selection by AIC (stepAIC function in R).
Table C1Coefficients of linear model for 1979–2015.
Significance codes: 0 “” 0.001 “” 0.01 “∗” 0.05 “.” 0.1 “ ” 1.
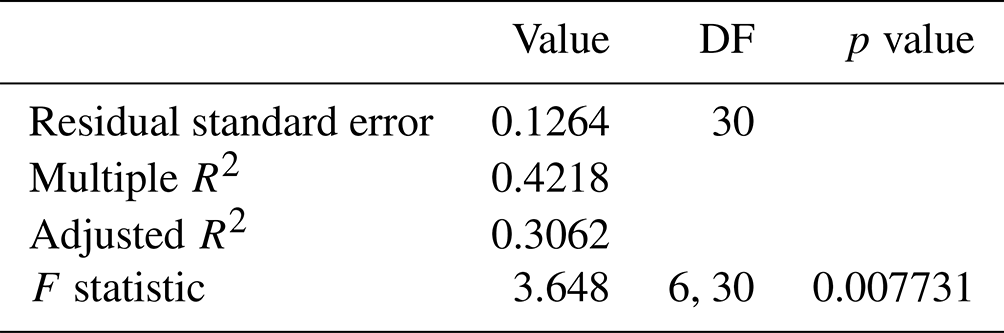
Table C3Coefficients of linear model for 1957–2015.
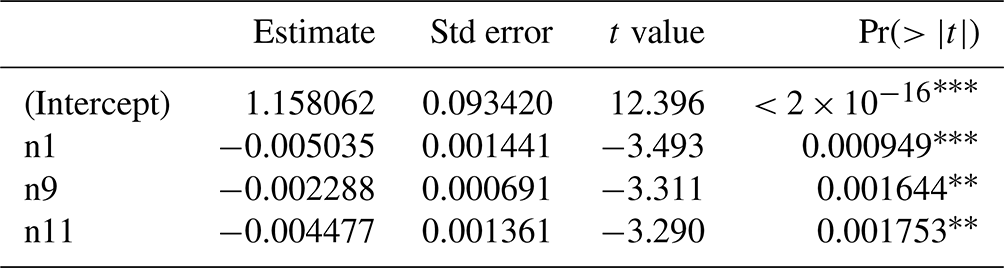
Significance codes: 0 “” 0.001 “” 0.01 “∗” 0.05 “.” 0.1 “ ” 1.
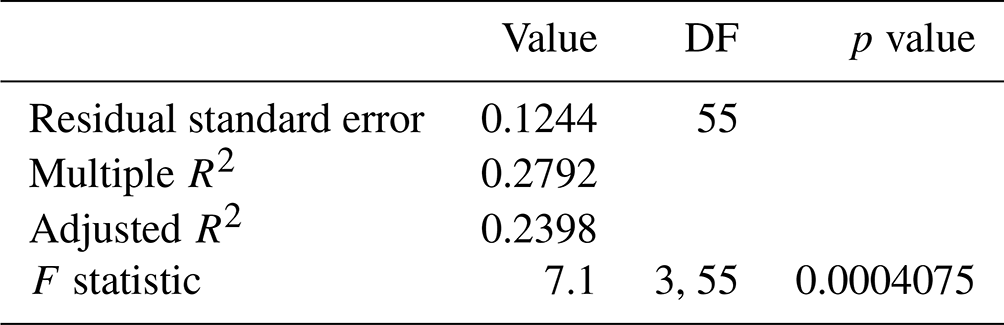
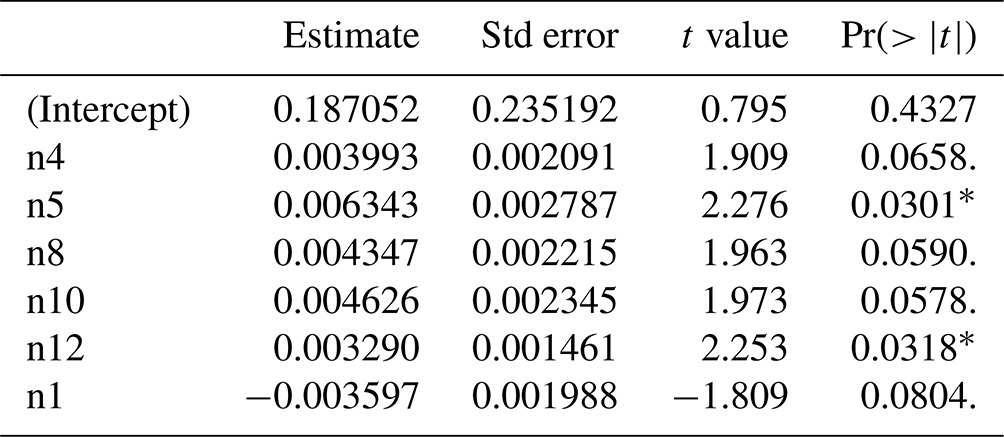
Table C5Coefficients of linear model for 1948–2015.
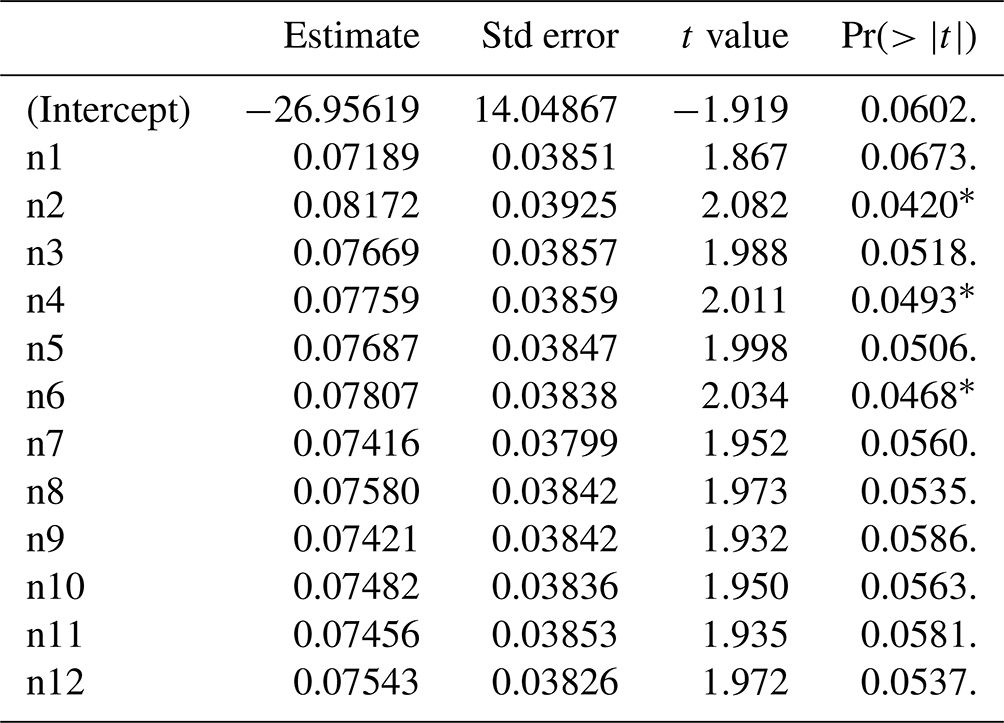
Significance codes: 0 “” 0.001 “” 0.01 “∗” 0.05 “.” 0.1 “ ” 1.
The synoptic typing dataset developed using 20CRv3 over 1900–2015 and the R code for SOM and precipitation analysis are available at https://doi.org/10.5281/zenodo.14635919 (Nilssen, 2025).
The base SOM code is available at https://github.com/dgudy91/Self-organizing-maps (last access: 10 January 2025; https://doi.org/10.5281/zenodo.12730195, (Udy, 2024)).
Other datasets used in this study are available online in the following locations:
-
20CRv3 at https://psl.noaa.gov/data/gridded/data.20thC_ReanV3.html (Slivinski et al., 2019),
-
DSS ice core accumulation at https://doi.org/10.26179/5zm0-v192 (Curran et al., 2021),
-
ISPDv4.7 observation counts at https://psl.noaa.gov/data/20CRv3_ISPD_obscounts/ (Cram et al., 2015; https://doi.org/10.5065/9EYR-TY90, Compo et al., 2019).
This study was based on a University of Tasmania Bachelor of Marine and Antarctic Science Honours research project undertaken by MTN and conceived by DGU and TRV. MTN led the study and performed the data analyses. DGU provided the code for the SOM algorithm, which was adapted by MTN. Interpretation of results and writing of the article were led by MTN with substantial contributions from DGU and TRV.
The contact author has declared that none of the authors has any competing interests.
Publisher's note: Copernicus Publications remains neutral with regard to jurisdictional claims made in the text, published maps, institutional affiliations, or any other geographical representation in this paper. While Copernicus Publications makes every effort to include appropriate place names, the final responsibility lies with the authors.
This study was supported by the Australian Government's Antarctic Science Collaboration Initiative (grant no. ASCI000002) through funding to the Australian Antarctic Program Partnership. This study contributes to an Australian Research Council (ARC) Discovery Project (grant no. DP220100606) to Tessa R. Vance. Danielle G. Udy was supported by the ARC Special Research Initiative Australian Centre of Excellence in Antarctic Science (grant no. SR200100008), the ARC Discovery Project (grant no. DP220100606), and the ARC Centre of Excellence for Climate Extremes (grant no. CE170100023).
Support for the 20th Century Reanalysis Project version 3 dataset is provided by the US Department of Energy, Office of Science Biological and Environmental Research (BER); by the National Oceanic and Atmospheric Administration Climate Program Office; and by the NOAA Earth System Research Laboratory Physical Sciences Laboratory. This research was undertaken with the assistance of resources from the National Computational Infrastructure (NCI Australia), an NCRIS-enabled capability supported by the Australian Government.
This research has been supported by the Australian Research Council (grant nos. DP220100606, SR200100008, and CE170100023) and the Antarctic Science Collaboration Initiative program (grant no. ASCI000002).
This paper was edited by Christo Buizert and reviewed by Jesper Sjolte and one anonymous referee.
Abram, N. J., Mulvaney, R., Vimeux, F., Phipps, S. J., Turner, J., and England, M. H.: Evolution of the Southern Annular Mode during the past millennium, Nat. Clim. Change, 4, 564–569, https://doi.org/10.1038/nclimate2235, 2014. a
Abram, N. J., Henley, B. J., Sen Gupta, A., Lippmann, T. J. R., Clarke, H., Dowdy, A. J., Sharples, J. J., Nolan, R. H., Zhang, T., Wooster, M. J., Wurtzel, J. B., Meissner, K. J., Pitman, A. J., Ukkola, A. M., Murphy, B. P., Tapper, N. J., and Boer, M. M.: Connections of climate change and variability to large and extreme forest fires in southeast Australia, Communications Earth & Environment, 2, 1–17, https://doi.org/10.1038/s43247-020-00065-8, 2021. a
Allan, R., Brohan, P., Compo, G. P., Stone, R., Luterbacher, J., and Brönnimann, S.: The International Atmospheric Circulation Reconstructions over the Earth (ACRE) Initiative, B. Am. Meteorol. Soc., 92, 1421–1425, https://doi.org/10.1175/2011BAMS3218.1, 2011. a
Arblaster, J. M. and Meehl, G. A.: Contributions of External Forcings to Southern Annular Mode Trends, J. Climate, 19, 2896–2905, https://doi.org/10.1175/JCLI3774.1, 2006. a
Arblaster, J. M., Meehl, G. A., and Karoly, D. J.: Future climate change in the Southern Hemisphere: Competing effects of ozone and greenhouse gases, Geophys. Res. Lett., 38, L02701, https://doi.org/10.1029/2010GL045384, 2011. a
Armstrong, M. S., Kiem, A. S., and Vance, T. R.: Comparing instrumental, palaeoclimate, and projected rainfall data: Implications for water resources management and hydrological modelling, Journal of Hydrology: Regional Studies, 31, 100728, https://doi.org/10.1016/j.ejrh.2020.100728, 2020. a
Bação, F., Lobo, V., and Painho, M.: Self-organizing Maps as Substitutes for K-Means Clustering, in: Computational Science – ICCS 2005, edited by: Sunderam, V. S., van Albada, G. D., Sloot, P. M. A., and Dongarra, J., Springer, Berlin, Heidelberg, ISBN 978-3-540-32118-7, 476–483, https://doi.org/10.1007/11428862_65, 2005. a
Bromwich, D. H. and Fogt, R. L.: Strong Trends in the Skill of the ERA-40 and NCEP–NCAR Reanalyses in the High and Midlatitudes of the Southern Hemisphere, 1958–2001, J. Climate, 17, 4603–4619, https://doi.org/10.1175/3241.1, 2004. a
Brönnimann, S.: Historical Observations for Improving Reanalyses, Front. Clim., 4, 880473, https://doi.org/10.3389/fclim.2022.880473, 2022. a
Brönnimann, S., Brugnara, Y., Allan, R. J., Brunet, M., Compo, G. P., Crouthamel, R. I., Jones, P. D., Jourdain, S., Luterbacher, J., Siegmund, P., Valente, M. A., and Wilkinson, C. W.: A roadmap to climate data rescue services, Geosci. Data J., 5, 28–39, https://doi.org/10.1002/gdj3.56, 2018. a
Catto, J. L., Madonna, E., Joos, H., Rudeva, I., and Simmonds, I.: Global Relationship between Fronts and Warm Conveyor Belts and the Impact on Extreme Precipitation, J. Climate, 28, 8411–8429, https://www.jstor.org/stable/26195700 (last access: 1 May 2024), 2015. a
Compo, G. P., Whitaker, J. S., Sardeshmukh, P. D., Matsui, N., Allan, R. J., Yin, X., Gleason, B. E., Vose, R. S., Rutledge, G., Bessemoulin, P., Brönnimann, S., Brunet, M., Crouthamel, R. I., Grant, A. N., Groisman, P. Y., Jones, P. D., Kruk, M. C., Kruger, A. C., Marshall, G. J., Maugeri, M., Mok, H. Y., Nordli, Ø., Ross, T. F., Trigo, R. M., Wang, X. L., Woodruff, S. D., and Worley, S. J.: The Twentieth Century Reanalysis Project, Q. J. Roy. Meteor. Soc., 137, 1–28, https://doi.org/10.1002/qj.776, 2011. a, b
Compo, G. P., Slivinski, L. C., Whitaker, J. S., Sardeshmukh, P. D., McColl, C., Brohan, P., Allan, R., Yin, X., Vose, R., Spencer, L. J., Ashcroft, L., Bronnimann, S., Brunet, M., Camuffo, D., Cornes, R., Cram, T. A., Crouthamel, R., Dominguez-Castro, F., Freeman, J. E., Gergis, J., Giese, B. S., Hawkins, E., Jones, P. D., Jourdain, S., Kaplan, A., Kennedy, J., Kubota, H., Blancq, F. L., Lee, T., Lorrey, A., Luterbacher, J., Maugeri, M., Mock, C. J., Moore, K., Przybylak, R., Pudmenzky, C., Reason, C., Slonosky, V. C., Tinz, B., Titchner, H., Trewin, B., Valente, M. A., Wang, X. L., Wilkinson, C., Wood, K., and Wyszynski, P.: The International Surface Pressure Databank version 4, Research Data Archive at the National Center for Atmospheric Research, Computational and Information Systems Laboratory [data set], https://doi.org/10.5065/9EYR-TY90, 2019. a, b, c, d, e
Cram, T. A., Compo, G. P., Yin, X., Allan, R. J., McColl, C., Vose, R. S., Whitaker, J. S., Matsui, N., Ashcroft, L., Auchmann, R., Bessemoulin, P., Brandsma, T., Brohan, P., Brunet, M., Comeaux, J., Crouthamel, R., Gleason Jr, B. E., Groisman, P. Y., Hersbach, H., Jones, P. D., Jónsson, T., Jourdain, S., Kelly, G., Knapp, K. R., Kruger, A., Kubota, H., Lentini, G., Lorrey, A., Lott, N., Lubker, S. J., Luterbacher, J., Marshall, G. J., Maugeri, M., Mock, C. J., Mok, H. Y., Nordli, Ø., Rodwell, M. J., Ross, T. F., Schuster, D., Srnec, L., Valente, M. A., Vizi, Z., Wang, X. L., Westcott, N., Woollen, J. S., and Worley, S. J.: The International Surface Pressure Databank version 2, Geosci. Data J., 2, 31–46, https://doi.org/10.1002/gdj3.25, 2015 (data available at: https://psl.noaa.gov/data/20CRv3_ISPD_obscounts/, last access: 24 April 2023). a, b
Crockart, C. K., Vance, T. R., Fraser, A. D., Abram, N. J., Criscitiello, A. S., Curran, M. A. J., Favier, V., Gallant, A. J. E., Kittel, C., Kjær, H. A., Klekociuk, A. R., Jong, L. M., Moy, A. D., Plummer, C. T., Vallelonga, P. T., Wille, J., and Zhang, L.: El Niño–Southern Oscillation signal in a new East Antarctic ice core, Mount Brown South, Clim. Past, 17, 1795–1818, https://doi.org/10.5194/cp-17-1795-2021, 2021. a, b
Curran, M., Jong, L., Moy, A., Plummer, C., Roberts, J. L., Van Ommen, T., and Vance, T. R.: The Law Dome ice core 2000 year dataset collection, Ver. 1, Australian Antarctic Data Centre [data set], https://doi.org/10.26179/5zm0-v192, 2021. a
Dodd, D.: Remembering the first year of The Establishment of the Macquarie Island Station 75 Years ago during 7–25 March 1948, Australian National Research Expeditions (ANARE), 42, 12–14, https://search.informit.org/doi/10.3316/informit.885358594275288 (last access: 13 January 2025), 2023. a
Fogt, R. L. and Marshall, G. J.: The Southern Annular Mode: Variability, trends, and climate impacts across the Southern Hemisphere, WIREs Climate Change, 11, e652, https://doi.org/10.1002/wcc.652, 2020. a, b
Fretwell, P., Pritchard, H. D., Vaughan, D. G., Bamber, J. L., Barrand, N. E., Bell, R., Bianchi, C., Bingham, R. G., Blankenship, D. D., Casassa, G., Catania, G., Callens, D., Conway, H., Cook, A. J., Corr, H. F. J., Damaske, D., Damm, V., Ferraccioli, F., Forsberg, R., Fujita, S., Gim, Y., Gogineni, P., Griggs, J. A., Hindmarsh, R. C. A., Holmlund, P., Holt, J. W., Jacobel, R. W., Jenkins, A., Jokat, W., Jordan, T., King, E. C., Kohler, J., Krabill, W., Riger-Kusk, M., Langley, K. A., Leitchenkov, G., Leuschen, C., Luyendyk, B. P., Matsuoka, K., Mouginot, J., Nitsche, F. O., Nogi, Y., Nost, O. A., Popov, S. V., Rignot, E., Rippin, D. M., Rivera, A., Roberts, J., Ross, N., Siegert, M. J., Smith, A. M., Steinhage, D., Studinger, M., Sun, B., Tinto, B. K., Welch, B. C., Wilson, D., Young, D. A., Xiangbin, C., and Zirizzotti, A.: Bedmap2: improved ice bed, surface and thickness datasets for Antarctica, The Cryosphere, 7, 375–393, https://doi.org/10.5194/tc-7-375-2013, 2013. a
Gibson, P. B., Perkins-Kirkpatrick, S. E., Uotila, P., Pepler, A. S., and Alexander, L. V.: On the use of self-organizing maps for studying climate extremes, J. Geophys. Res.-Atmos., 122, 3891–3903, https://doi.org/10.1002/2016JD026256, 2017. a, b
Gillespie, I. M., Haimberger, L., Compo, G. P., and Thorne, P. W.: Assessing potential of sparse-input reanalyses for centennial-scale land surface air temperature homogenisation, Int. J. Climatol., 41, E3000–E3020, https://doi.org/10.1002/joc.6898, 2021. a
Hamill, T. M. and Snyder, C.: A Hybrid Ensemble Kalman Filter–3D Variational Analysis Scheme, Mon. Weather Rev., 128, 2905–2919, https://doi.org/10.1175/1520-0493(2000)128<2905:AHEKFV>2.0.CO;2, 2000. a
Hesselberg, T.: The Meteorology of the British Antarctic Expedition, 1910–1913, Geogr. Ann., 4, 77–98, https://doi.org/10.2307/519736, 1922. a
Hewitson, B. C. and Crane, R. G.: Self-organizing maps: applications to synoptic climatology, Clim. Res., 22, 13–26, https://doi.org/10.3354/cr022013, 2002. a
Hope, P. K., Drosdowsky, W., and Nicholls, N.: Shifts in the synoptic systems influencing southwest Western Australia, Clim. Dynam., 26, 751–764, https://doi.org/10.1007/s00382-006-0115-y, 2006. a, b
Hosking, J. S., Fogt, R., Thomas, E. R., Moosavi, V., Phillips, T., Coggins, J., and Reusch, D.: Accumulation in coastal West Antarctic ice core records and the role of cyclone activity, Geophys. Res. Lett., 44, 9084–9092, https://doi.org/10.1002/2017GL074722, 2017. a
Huai, B., Wang, Y., Ding, M., Zhang, J., and Dong, X.: An assessment of recent global atmospheric reanalyses for Antarctic near surface air temperature, Atmos. Res., 226, 181–191, https://doi.org/10.1016/j.atmosres.2019.04.029, 2019. a
Jackson, S. L., Vance, T. R., Crockart, C., Moy, A., Plummer, C., and Abram, N. J.: Climatology of the Mount Brown South ice core site in East Antarctica: implications for the interpretation of a water isotope record, Clim. Past, 19, 1653–1675, https://doi.org/10.5194/cp-19-1653-2023, 2023. a, b
Jiang, N., Cheung, K., Luo, K., Beggs, P. J., and Zhou, W.: On two different objective procedures for classifying synoptic weather types over east Australia, Int. J. Climatol., 32, 1475–1494, https://doi.org/10.1002/joc.2373, 2012. a
Jones, J. M., Gille, S. T., Goosse, H., Abram, N. J., Canziani, P. O., Charman, D. J., Clem, K. R., Crosta, X., de Lavergne, C., Eisenman, I., England, M. H., Fogt, R. L., Frankcombe, L. M., Marshall, G. J., Masson-Delmotte, V., Morrison, A. K., Orsi, A. J., Raphael, M. N., Renwick, J. A., Schneider, D. P., Simpkins, G. R., Steig, E. J., Stenni, B., Swingedouw, D., and Vance, T. R.: Assessing recent trends in high-latitude Southern Hemisphere surface climate, Nat. Clim. Change, 6, 917–926, https://doi.org/10.1038/nclimate3103, 2016. a, b
Jong, L. M., Plummer, C. T., Roberts, J. L., Moy, A. D., Curran, M. A. J., Vance, T. R., Pedro, J. B., Long, C. A., Nation, M., Mayewski, P. A., and van Ommen, T. D.: 2000 years of annual ice core data from Law Dome, East Antarctica, Earth Syst. Sci. Data, 14, 3313–3328, https://doi.org/10.5194/essd-14-3313-2022, 2022. a, b, c, d, e
King, J., Anchukaitis, K. J., Allen, K., Vance, T., and Hessl, A.: Trends and variability in the Southern Annular Mode over the Common Era, Nat. Commun., 14, 2324, https://doi.org/10.1038/s41467-023-37643-1, 2023. a
Kohonen, T.: The self-organizing map, P. IEEE, 78, 1464–1480, https://doi.org/10.1109/5.58325, 1990. a
Laloyaux, P., de Boisseson, E., Balmaseda, M., Bidlot, J.-R., Broennimann, S., Buizza, R., Dalhgren, P., Dee, D., Haimberger, L., Hersbach, H., Kosaka, Y., Martin, M., Poli, P., Rayner, N., Rustemeier, E., and Schepers, D.: CERA-20C: A Coupled Reanalysis of the Twentieth Century, J. Adv. Model. Earth Sy., 10, 1172–1195, https://doi.org/10.1029/2018MS001273, 2018. a
Lenaerts, J. T. M., Medley, B., van den Broeke, M. R., and Wouters, B.: Observing and Modeling Ice Sheet Surface Mass Balance, Rev. Geophys., 57, 376–420, https://doi.org/10.1029/2018RG000622, 2019. a
Marshall, G. J. and Harangozo, S. A.: An appraisal of NCEP/NCAR reanalysis MSLP data viability for climate studies in the South Pacific, Geophys. Res. Lett., 27, 3057–3060, https://doi.org/10.1029/2000GL011363, 2000. a
Marshall, G. J., Thompson, D. W. J., and van den Broeke, M. R.: The Signature of Southern Hemisphere Atmospheric Circulation Patterns in Antarctic Precipitation, Geophys. Res. Lett., 44, 11580–11589, https://doi.org/10.1002/2017GL075998, 2017. a
Mawson, D.: Australasian Antarctic Expedition, 1911–1914, Geogr. J., 44, 257–284, https://doi.org/10.2307/1778688, 1914. a
Mcmorrow, A., Ommen, T. D. V., Morgan, V., and Curran, M. A. J.: Ultra-high-resolution seasonality of trace-ion species and oxygen isotope ratios in Antarctic firn over four annual cycles, Ann. Glaciol., 39, 34–40, https://doi.org/10.3189/172756404781814609, 2004. a, b
McMorrow, A. J., Curran, M. A. J., Ommen, T. D. V., Morgan, V., Pook, M. J., and Allison, I.: Intercomparison of firn core and meteorological data, Antarct. Sci., 13, 329–337, https://doi.org/10.1017/S0954102001000463, 2001. a, b
Nilssen, M.: Evaluating the Twentieth Century Reanalysis Version 3 with synoptic typing and an East Antarctic ice core accumulation record: code and data, Zenodo [data set and code], https://doi.org/10.5281/zenodo.14635919, 2025. a
Pedro, J. B., Smith, A. M., Simon, K. J., van Ommen, T. D., and Curran, M. A. J.: High-resolution records of the beryllium-10 solar activity proxy in ice from Law Dome, East Antarctica: measurement, reproducibility and principal trends, Clim. Past, 7, 707–721, https://doi.org/10.5194/cp-7-707-2011, 2011. a
Plummer, C. T., Curran, M. A. J., van Ommen, T. D., Rasmussen, S. O., Moy, A. D., Vance, T. R., Clausen, H. B., Vinther, B. M., and Mayewski, P. A.: An independently dated 2000-yr volcanic record from Law Dome, East Antarctica, including a new perspective on the dating of the 1450s CE eruption of Kuwae, Vanuatu, Clim. Past, 8, 1929–1940, https://doi.org/10.5194/cp-8-1929-2012, 2012. a, b
Pohl, B., Favier, V., Wille, J., Udy, D. G., Vance, T. R., Pergaud, J., Dutrievoz, N., Blanchet, J., Kittel, C., Amory, C., Krinner, G., and Codron, F.: Relationship Between Weather Regimes and Atmospheric Rivers in East Antarctica, J. Geophys. Res.-Atmos., 126, e2021JD035294, https://doi.org/10.1029/2021JD035294, 2021. a, b, c, d, e
Poli, P., Hersbach, H., Dee, D. P., Berrisford, P., Simmons, A. J., Vitart, F., Laloyaux, P., Tan, D. G. H., Peubey, C., Thépaut, J.-N., Trémolet, Y., Hólm, E. V., Bonavita, M., Isaksen, L., and Fisher, M.: ERA-20C: An Atmospheric Reanalysis of the Twentieth Century, J. Climate, 29, 4083–4097, https://doi.org/10.1175/JCLI-D-15-0556.1, 2016. a
Reusch, D. B., Hewitson, B. C., and Alley, R. B.: Towards ice-core-based synoptic reconstructions of west antarctic climate with artificial neural networks, Int. J. Climatol., 25, 581–610, https://doi.org/10.1002/joc.1143, 2005. a
Roberts, J., Plummer, C., Vance, T., van Ommen, T., Moy, A., Poynter, S., Treverrow, A., Curran, M., and George, S.: A 2000-year annual record of snow accumulation rates for Law Dome, East Antarctica, Clim. Past, 11, 697–707, https://doi.org/10.5194/cp-11-697-2015, 2015. a, b, c, d, e, f
Rogers, J. C. and Loon, H. v.: Spatial Variability of Sea Level Pressure and 500 mb Height Anomalies over the Southern Hemisphere, Mon. Weather Rev., 110, 1375–1392, https://doi.org/10.1175/1520-0493(1982)110<1375:SVOSLP>2.0.CO;2, 1982. a
Scarchilli, C., Frezzotti, M., and Ruti, P. M.: Snow precipitation at four ice core sites in East Antarctica: provenance, seasonality and blocking factors, Clim. Dynam., 37, 2107–2125, https://doi.org/10.1007/s00382-010-0946-4, 2011. a, b
Schneider, D. P. and Fogt, R. L.: Artifacts in Century-Length Atmospheric and Coupled Reanalyses Over Antarctica Due To Historical Data Availability, Geophys. Res. Lett., 45, 964–973, https://doi.org/10.1002/2017GL076226, 2018. a, b, c
Servettaz, A. P. M., Orsi, A. J., Curran, M. A. J., Moy, A. D., Landais, A., Agosta, C., Winton, V. H. L., Touzeau, A., McConnell, J. R., Werner, M., and Baroni, M.: Snowfall and Water Stable Isotope Variability in East Antarctica Controlled by Warm Synoptic Events, J. Geophys. Res.-Atmos., 125, e2020JD032863, https://doi.org/10.1029/2020JD032863, 2020. a
Sheridan, S. C. and Lee, C. C.: The self-organizing map in synoptic climatological research, Prog. Phys. Geog., 35, 109–119, https://doi.org/10.1177/0309133310397582, 2011. a
Slivinski, L. C., Compo, G. P., Whitaker, J. S., Sardeshmukh, P. D., Giese, B. S., McColl, C., Allan, R., Yin, X., Vose, R., Titchner, H., Kennedy, J., Spencer, L. J., Ashcroft, L., Brönnimann, S., Brunet, M., Camuffo, D., Cornes, R., Cram, T. A., Crouthamel, R., Domínguez-Castro, F., Freeman, J. E., Gergis, J., Hawkins, E., Jones, P. D., Jourdain, S., Kaplan, A., Kubota, H., Blancq, F. L., Lee, T.-C., Lorrey, A., Luterbacher, J., Maugeri, M., Mock, C. J., Moore, G. K., Przybylak, R., Pudmenzky, C., Reason, C., Slonosky, V. C., Smith, C. A., Tinz, B., Trewin, B., Valente, M. A., Wang, X. L., Wilkinson, C., Wood, K., and Wyszyński, P.: Towards a more reliable historical reanalysis: Improvements for version 3 of the Twentieth Century Reanalysis system, Q. J. Roy. Meteor. Soc., 145, 2876–2908, https://doi.org/10.1002/qj.3598, 2019 (data available at: https://psl.noaa.gov/data/gridded/data.20thC_ReanV3.html, last access: 14 May 2024). a, b, c
Slivinski, L. C., Compo, G. P., Sardeshmukh, P. D., Whitaker, J. S., McColl, C., Allan, R. J., Brohan, P., Yin, X., Smith, C. A., Spencer, L. J., Vose, R. S., Rohrer, M., Conroy, R. P., Schuster, D. C., Kennedy, J. J., Ashcroft, L., Brönnimann, S., Brunet, M., Camuffo, D., Cornes, R., Cram, T. A., Domínguez-Castro, F., Freeman, J. E., Gergis, J., Hawkins, E., Jones, P. D., Kubota, H., Lee, T. C., Lorrey, A. M., Luterbacher, J., Mock, C. J., Przybylak, R. K., Pudmenzky, C., Slonosky, V. C., Tinz, B., Trewin, B., Wang, X. L., Wilkinson, C., Wood, K., and Wyszyński, P.: An Evaluation of the Performance of the Twentieth Century Reanalysis Version 3, J. Climate, 34, 1417–1438, https://doi.org/10.1175/JCLI-D-20-0505.1, 2021. a
Thorne, P. W. and Vose, R. S.: Reanalyses Suitable for Characterizing Long-Term Trends, B. Am. Meteorol. Soc., 91, 353–362, https://doi.org/10.1175/2009BAMS2858.1, 2010. a
Turner, J., Phillips, T., Thamban, M., Rahaman, W., Marshall, G. J., Wille, J. D., Favier, V., Winton, V. H. L., Thomas, E., Wang, Z., van den Broeke, M., Hosking, J. S., and Lachlan-Cope, T.: The Dominant Role of Extreme Precipitation Events in Antarctic Snowfall Variability, Geophys. Res. Lett., 46, 3502–3511, https://doi.org/10.1029/2018GL081517, 2019. a, b, c, d, e
Udy, D.: Self organizing map Rcode for Udy et al 2021, Zenodo [code], https://doi.org/10.5281/zenodo.12730195, 2024. a
Udy, D. G., Vance, T. R., Kiem, A. S., Holbrook, N. J., and Curran, M. A. J.: Links between Large-Scale Modes of Climate Variability and Synoptic Weather Patterns in the Southern Indian Ocean, J. Climate, 34, 883–899, https://doi.org/10.1175/JCLI-D-20-0297.1, 2021. a, b, c, d, e, f, g, h, i, j, k, l, m, n, o, p, q, r, s, t, u
Udy, D. G., Vance, T. R., Kiem, A. S., and Holbrook, N. J.: A synoptic bridge linking sea salt aerosol concentrations in East Antarctic snowfall to Australian rainfall, Communications Earth & Environment, 3, 1–11, https://doi.org/10.1038/s43247-022-00502-w, 2022. a, b, c, d
Udy, D. G., Vance, T. R., Kiem, A. S., Holbrook, N. J., and Abram, N.: Australia's 2019/20 Black Summer fire weather exceptionally rare over the last 2000 years, Communications Earth & Environment, 5, 1–13, https://doi.org/10.1038/s43247-024-01470-z, 2024. a, b
Uotila, P., Vihma, T., Pezza, A. B., Simmonds, I., Keay, K., and Lynch, A. H.: Relationships between Antarctic cyclones and surface conditions as derived from high-resolution numerical weather prediction data, J. Geophys. Res.-Atmos., 116, D07109, https://doi.org/10.1029/2010JD015358, 2011. a
Vance, T. R., Ommen, T. D. v., Curran, M. A. J., Plummer, C. T., and Moy, A. D.: A Millennial Proxy Record of ENSO and Eastern Australian Rainfall from the Law Dome Ice Core, East Antarctica, J. Climate, 26, 710–725, https://doi.org/10.1175/JCLI-D-12-00003.1, 2013. a, b
Vance, T. R., Roberts, J. L., Plummer, C. T., Kiem, A. S., and van Ommen, T. D.: Interdecadal Pacific variability and eastern Australian megadroughts over the last millennium, Geophys. Res. Lett., 42, 129–137, https://doi.org/10.1002/2014GL062447, 2015. a
Vance, T. R., Kiem, A. S., Jong, L. M., Roberts, J. L., Plummer, C. T., Moy, A. D., Curran, M. A. J., and van Ommen, T. D.: Pacific decadal variability over the last 2000 years and implications for climatic risk, Communications Earth & Environment, 3, 1–9, https://doi.org/10.1038/s43247-022-00359-z, 2022. a, b
Vance, T. R., Abram, N. J., Criscitiello, A. S., Crockart, C. K., DeCampo, A., Favier, V., Gkinis, V., Harlan, M., Jackson, S. L., Kjær, H. A., Long, C. A., Nation, M. K., Plummer, C. T., Segato, D., Spolaor, A., and Vallelonga, P. T.: An annually resolved chronology for the Mount Brown South ice cores, East Antarctica, Clim. Past, 20, 969–990, https://doi.org/10.5194/cp-20-969-2024, 2024. a, b
van Ommen, T. D. and Morgan, V.: Calibrating the ice core paleothermometer using seasonality, J. Geophys. Res.-Atmos., 102, 9351–9357, https://doi.org/10.1029/96JD04014, 1997. a, b, c
van Ommen, T. D. and Morgan, V.: Snowfall increase in coastal East Antarctica linked with southwest Western Australian drought, Nat. Geosci., 3, 267–272, https://doi.org/10.1038/ngeo761, 2010. a, b
Venables, W. N. and Ripley, B. D.: Modern Applied Statistics with S, Statistics and Computing, Springer, New York, NY, ISBN 978-1-4419-3008-8, https://doi.org/10.1007/978-0-387-21706-2, 2002. a
Verdon-Kidd, D. C. and Kiem, A. S.: On the relationship between large-scale climate modes and regional synoptic patterns that drive Victorian rainfall, Hydrol. Earth Syst. Sci., 13, 467–479, https://doi.org/10.5194/hess-13-467-2009, 2009. a, b, c
Wang, Y., Zhou, D., Bunde, A., and Havlin, S.: Testing reanalysis data sets in Antarctica: Trends, persistence properties, and trend significance, J. Geophys. Res.-Atmos., 121, 12839–12855, https://doi.org/10.1002/2016JD024864, 2016. a
Wang, Y., Thomas, E. R., Hou, S., Huai, B., Wu, S., Sun, W., Qi, S., Ding, M., and Zhang, Y.: Snow Accumulation Variability Over the West Antarctic Ice Sheet Since 1900: A Comparison of Ice Core Records With ERA-20C Reanalysis, Geophys. Res. Lett., 44, 11482–11490, https://doi.org/10.1002/2017GL075135, 2017. a
Wang, Y., Hou, S., Ding, M., and Sun, W.: On the performance of twentieth century reanalysis products for Antarctic snow accumulation, Clim. Dynam., 54, 435–455, https://doi.org/10.1007/s00382-019-05008-4, 2020. a, b, c
Wehrens, R. and Kruisselbrink, J.: Flexible Self-Organizing Maps in kohonen 3.0, J. Stat. Softw., 87, 1–18, https://doi.org/10.18637/jss.v087.i07, 2018. a
Wexler, H.: Antarctic Research During the International Geophysical Year, in: Antarctica in the International Geophysical Year: Based on a Symposium on the Antarctic, American Geophysical Union (AGU), ISBN 978-1-118-66920-4, 7–12, https://doi.org/10.1029/GM001p0007, 1956. a
Wille, J. D., Favier, V., Gorodetskaya, I. V., Agosta, C., Kittel, C., Beeman, J. C., Jourdain, N. C., Lenaerts, J. T. M., and Codron, F.: Antarctic Atmospheric River Climatology and Precipitation Impacts, J. Geophys. Res.-Atmos., 126, e2020JD033788, https://doi.org/10.1029/2020JD033788, 2021. a, b, c
Wille, J. D., Alexander, S. P., Amory, C., Baiman, R., Barthélemy, L., Bergstrom, D. M., Berne, A., Binder, H., Blanchet, J., Bozkurt, D., Bracegirdle, T. J., Casado, M., Choi, T., Clem, K. R., Codron, F., Datta, R., Battista, S. D., Favier, V., Francis, D., Fraser, A. D., Fourré, E., Garreaud, R. D., Genthon, C., Gorodetskaya, I. V., González-Herrero, S., Heinrich, V. J., Hubert, G., Joos, H., Kim, S.-J., King, J. C., Kittel, C., Landais, A., Lazzara, M., Leonard, G. H., Lieser, J. L., Maclennan, M., Mikolajczyk, D., Neff, P., Ollivier, I., Picard, G., Pohl, B., Ralph, F. M., Rowe, P., Schlosser, E., Shields, C. A., Smith, I. J., Sprenger, M., Trusel, L., Udy, D., Vance, T., Vignon, E., Walker, C., Wever, N., and Zou, X.: The Extraordinary March 2022 East Antarctica “Heat” Wave. Part II: Impacts on the Antarctic Ice Sheet, J. Climate, 37, 779–799, https://doi.org/10.1175/JCLI-D-23-0176.1, 2024a. a, b
Wille, J. D., Alexander, S. P., Amory, C., Baiman, R., Barthélemy, L., Bergstrom, D. M., Berne, A., Binder, H., Blanchet, J., Bozkurt, D., Bracegirdle, T. J., Casado, M., Choi, T., Clem, K. R., Codron, F., Datta, R., Battista, S. D., Favier, V., Francis, D., Fraser, A. D., Fourré, E., Garreaud, R. D., Genthon, C., Gorodetskaya, I. V., González-Herrero, S., Heinrich, V. J., Hubert, G., Joos, H., Kim, S.-J., King, J. C., Kittel, C., Landais, A., Lazzara, M., Leonard, G. H., Lieser, J. L., Maclennan, M., Mikolajczyk, D., Neff, P., Ollivier, I., Picard, G., Pohl, B., Ralph, F. M., Rowe, P., Schlosser, E., Shields, C. A., Smith, I. J., Sprenger, M., Trusel, L., Udy, D., Vance, T., Vignon, E., Walker, C., Wever, N., and Zou, X.: The Extraordinary March 2022 East Antarctica “Heat” Wave. Part I: Observations and Meteorological Drivers, J. Climate, 37, 757–778, https://doi.org/10.1175/JCLI-D-23-0175.1, 2024b. a, b
Zhang, L., Vance, T. R., Fraser, A. D., Jong, L. M., Thompson, S. S., Criscitiello, A. S., and Abram, N. J.: Identifying atmospheric processes favouring the formation of bubble-free layers in the Law Dome ice core, East Antarctica, The Cryosphere, 17, 5155–5173, https://doi.org/10.5194/tc-17-5155-2023, 2023. a, b, c
Zhang, Y., Wang, Y., Huai, B., Ding, M., and Sun, W.: Skill of the two 20th century reanalyses in representing Antarctic near-surface air temperature, Int. J. Climatol., 38, 4225–4238, https://doi.org/10.1002/joc.5563, 2018. a
- Abstract
- Introduction
- Data and methods
- Results
- Discussion
- Conclusions
- Appendix A: Self-organising maps
- Appendix B: Trends
- Appendix C: Multiple linear regression models
- Code and data availability
- Author contributions
- Competing interests
- Disclaimer
- Acknowledgements
- Financial support
- Review statement
- References