the Creative Commons Attribution 4.0 License.
the Creative Commons Attribution 4.0 License.
 | 25 Nov 2025
Continental shelf glaciations off Northeast Greenland since the Late Miocene
Monica Winsborrow
Tove Nielsen
Jan Sverre Laberg
Andreia Plaza-Faverola
Christoph Böttner
Adrián López-Quirós
Sverre Planke
Benjamin Bellwald
Amplified Arctic warming is triggering dramatic changes to the Greenland Ice Sheet (GrIS). Studying past warm periods can provide process insights valuable to predictions of future ice sheet response. Miocene (23.03–5.33 Ma) and Pliocene (5.33–2.58 Ma) global climatic records include periods of warmer than present temperatures thought to represent analogues to near-future scenarios. Despite this, the details of the long-term glacial history of the eastern and northeastern sectors of Greenland are still largely unresolved. Here, we use seismic reflection and borehole data to describe the late Cenozoic glacial architectural development of the Northeast Greenland continental margin and thereby reconstruct long-term ice sheet evolution. We identify three key unconformable seismic surfaces that define three mega units of predominantly glacial origin. Two of the surfaces are for the first time correlated across the entire outer Northeast Greenland margin and tied to both Ocean Drilling Program Site 909 and Site 913. We show that the Late Miocene onset of shelf progradation occurs around 6.4 Ma, marking the first recorded advance of grounded ice masses across the NE Greenland shelf, forming depocentres (trough mouth fans) beyond the palaeo-shelf edge. Subsequently during the Late Miocene and Early Pliocene, the GrIS expands multiple times across the shelf, extending the continental shelf seawards. Based on the development of more extensive and thicker depocentres along the entire outer shelf and upper slope, we suggest an intensification of shelf glaciations sometime after ∼ 4.1 Ma, possibly coinciding with the intensification of the Northern Hemisphere glaciations (3.6–2.7 Ma).
- Article
(12618 KB) - Full-text XML
-
Supplement
(1398 KB) - BibTeX
- EndNote


Greenland currently hosts the largest ice sheet in the Northern Hemisphere, which if melted completely would raise global sea level by 7 m (Shepherd et al., 2020; and references therein). Over the Cenozoic, the thickness and extent of the Greenland Ice Sheet (GrIS) has varied, at times extending beyond the coastline and across the continental shelf (e.g., Funder et al., 2011; Laberg et al., 2013; Laberg et al., 2018; Knutz et al., 2019). The widest continental shelf in Greenland is in the northeast, and the inland ice sheet sector is currently drained by the Northeast Greenland Ice Stream (NEGIS; Fig. 1a), which drains 16 % of the total area of the entire GrIS (Hvidberg et al., 2020). Despite the large size of the NE Greenland shelf and the importance of the NEGIS to present-day ice dynamics and stability in this ice sheet sector, little is known about the long-term glacial history of the area, including the timing and evolution of continental shelf glaciations. Such knowledge is needed to assess ice sheet-climate interactions beyond observational timescales and to reliably represent the GrIS in historical global sea-level budgets (Miller et al., 2020).
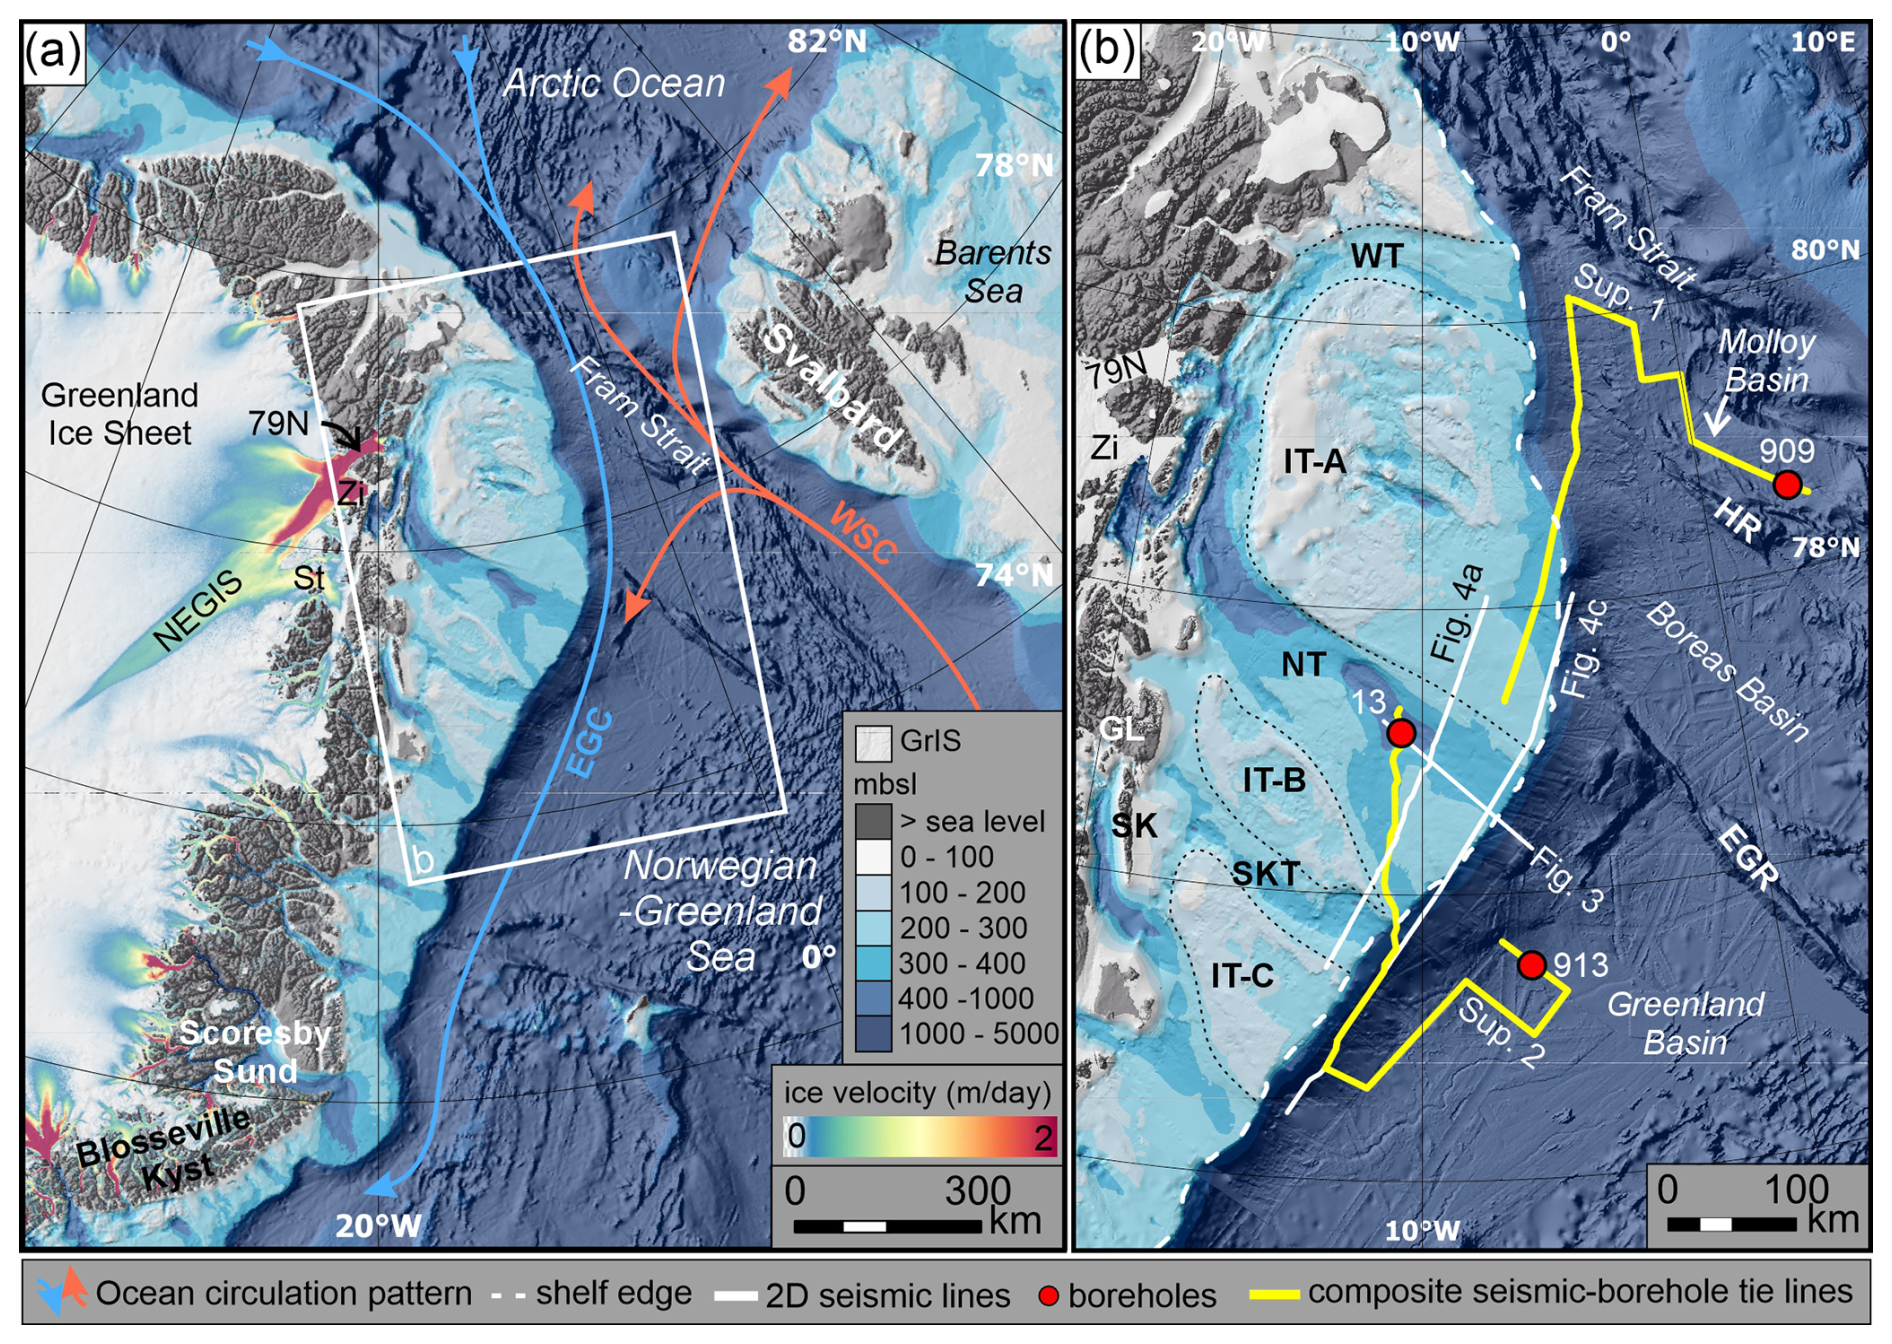
Figure 1(a) Arctic and northern North Atlantic region with modern ocean circulation pattern indicated. EGC: East Greenland Current (cold). WSC: West Spitsbergen Current (warm). Ice velocity map of the Greenland Ice Sheet (GrIS) show the major Northeast Greenland Ice Stream (NEGIS) and its outlet glaciers; 79N: Nioghalvfjerdsbræ. Zi: Zachariae Isstrøm. St: Storstrømmen. Topography and bathymetry compiled from IBCAO 5.0 (Jakobsson et al., 2024) and Arndt et al. (2015). mbsl: meters below sea level. (b) Northeast Greenland margin with locations of key seismic profiles and cored boreholes shown in this paper. 909 and 913 refers to ODP Sites while 13 refers to Kanumas Site. Banks and troughs on the present-day shelf are annotated. WT: Westwind Trough. IT (A, B, C): Inter Trough area (A, B, C). NT: Norske Trough. SKT: Store Koldewey Trough. GL: Germania Land. SK: Store Koldewey. HR: Hovgaard Ridge. EGR: East Greenland Ridge.
Ice streams are relatively narrow corridors within ice sheets that have a faster flow rate than adjacent areas, thus despite covering a relatively small surface area, they account for the majority of the total ice drainage and discharge from an ice sheet's interior to its margins (Dowdeswell and Elverhøi, 2002; Dowdeswell et al., 2006). As a result, ice streams efficiently erode and transport sediments towards its terminus, shaping the landscape underneath them. Marine terminating ice streams often operate within over-deepened cross-shelf troughs, carved out by this erosive force. During long-lived glaciations, this erosive action creates large depocentres on the upper slope beyond the ice stream terminus, termed trough mouth fans (TMFs) (Vorren and Laberg, 1997; Batchelor and Dowdeswell, 2014). TMFs thus serve as valuable geological archives that can be used to reconstruct former ice stream positions and dynamics and thus the extent and evolution of former ice sheets.
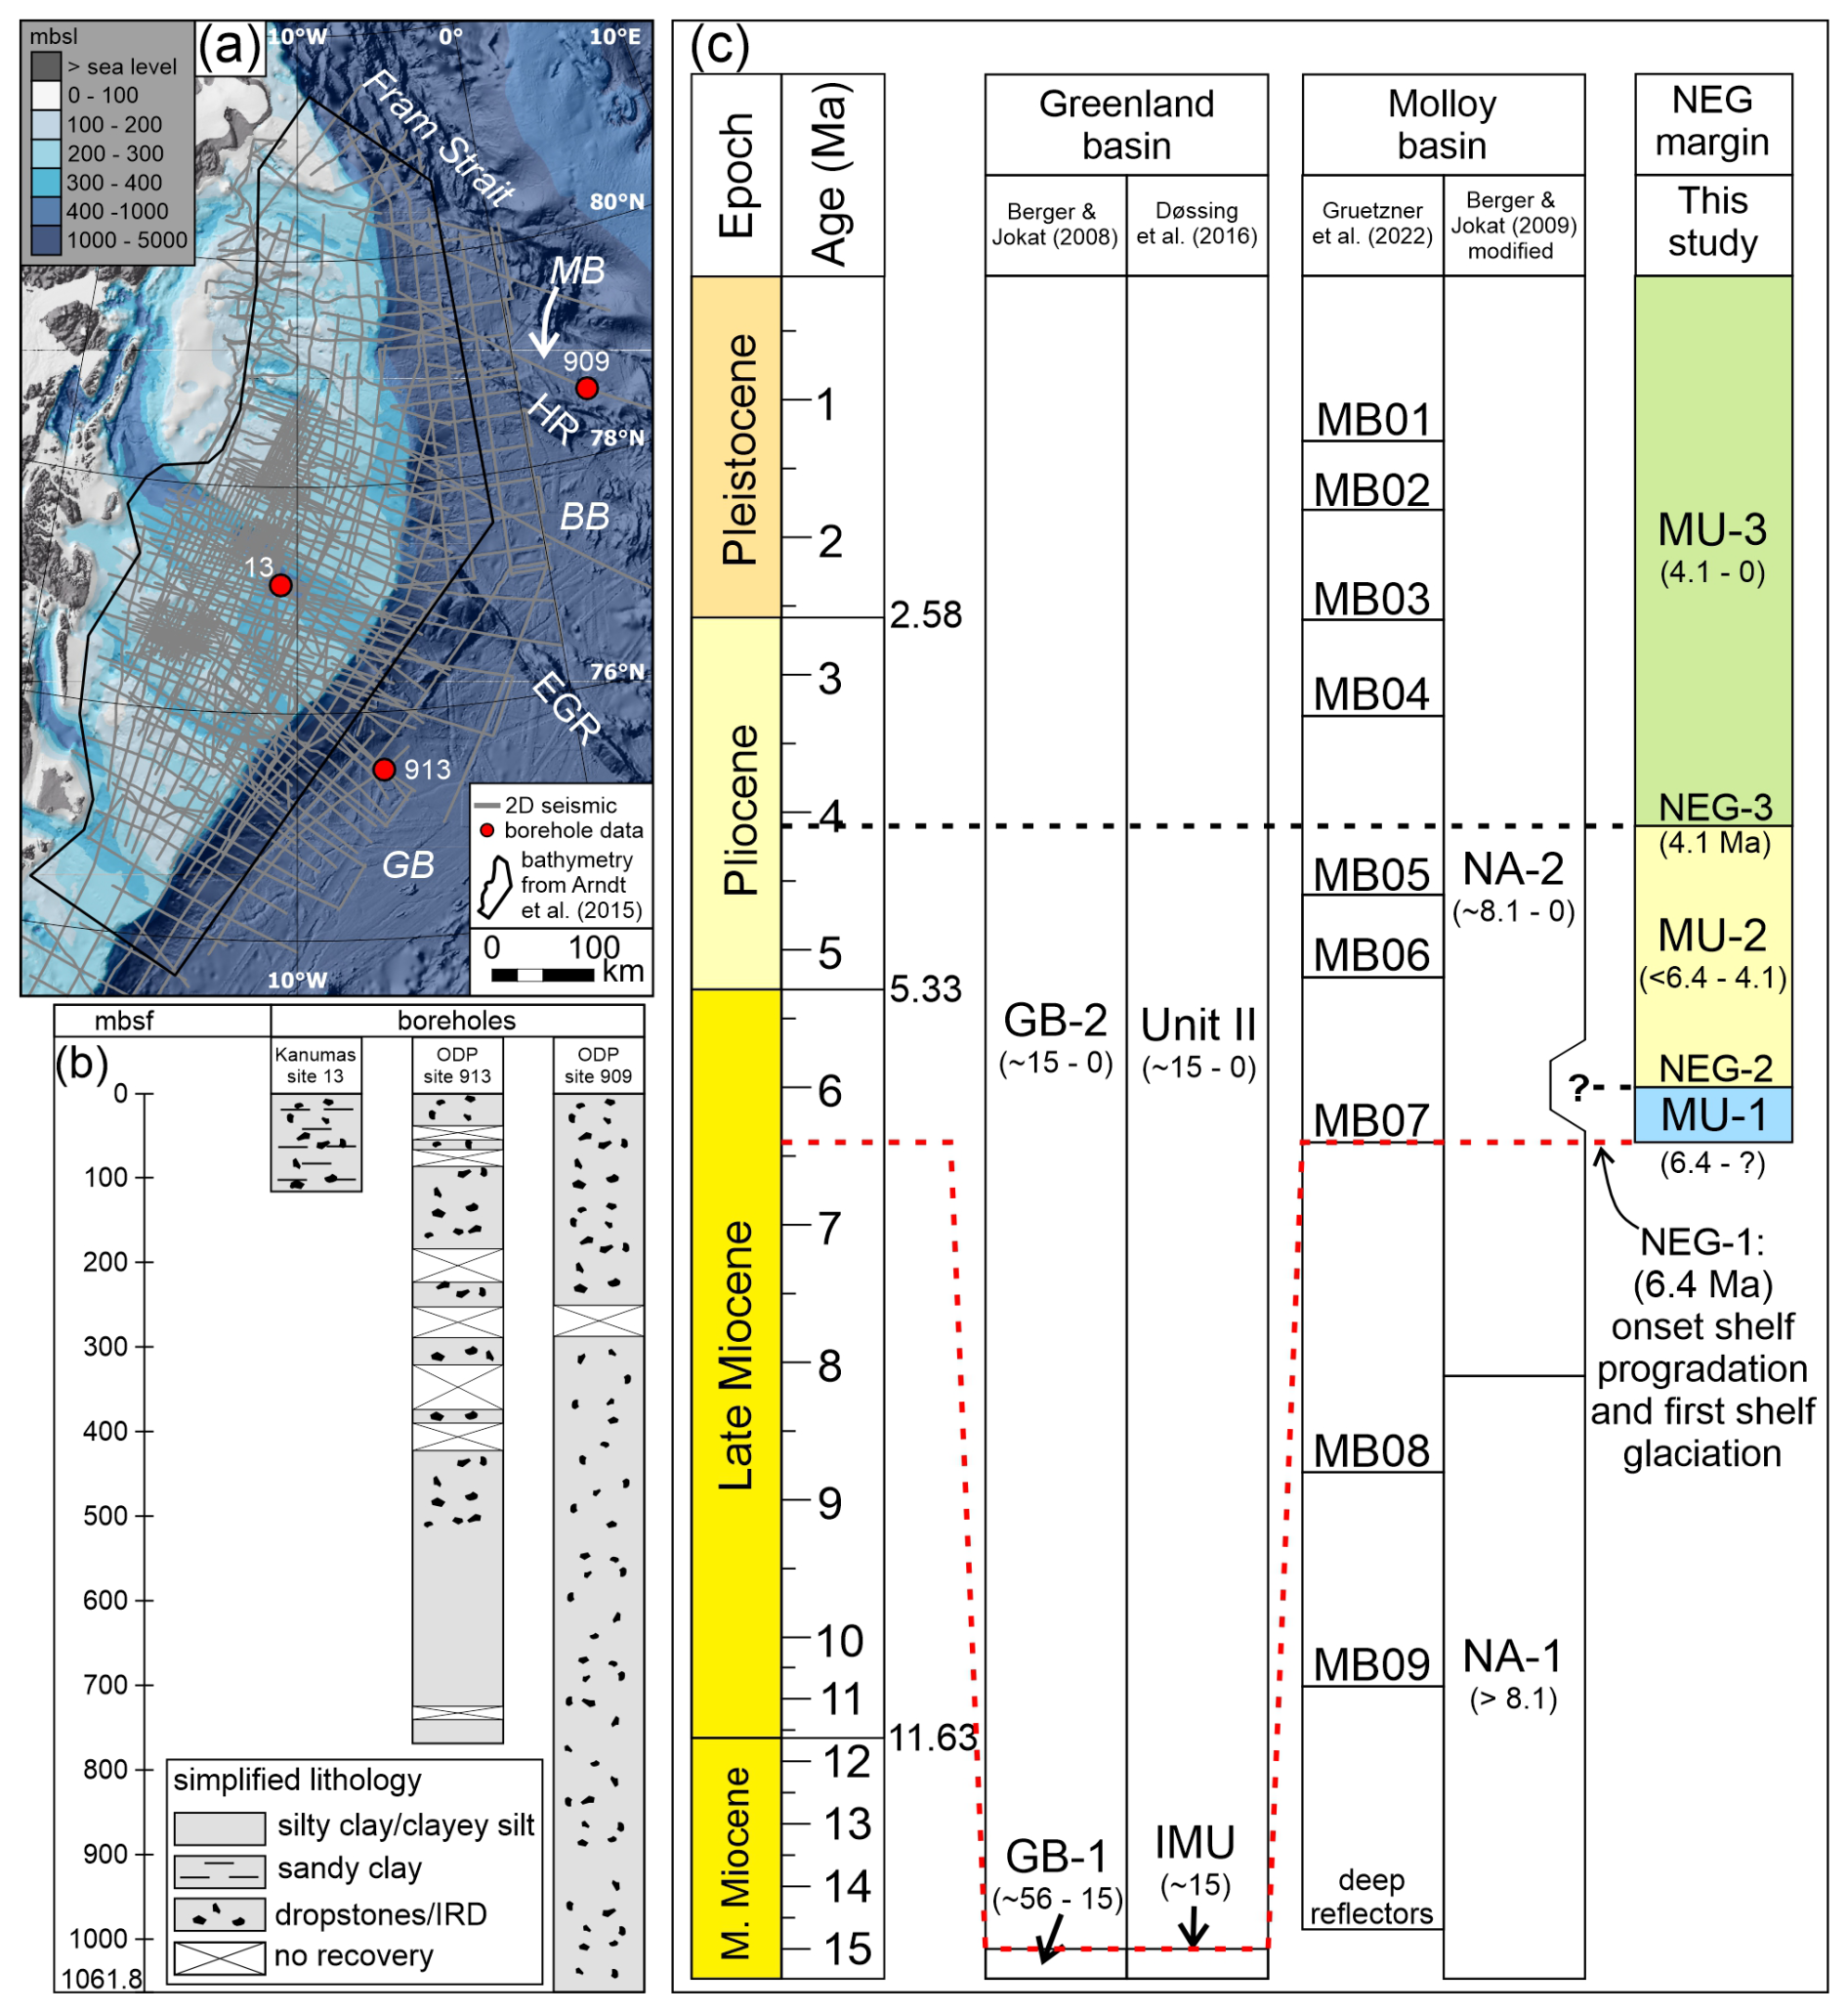
Figure 2(a) Coverage of bathymetry, borehole data and seismic data used in this study. 909 and 913 refers to ODP Sites while 13 refers to Kanumas Site. MB: Molloy Basin. BB: Boreas Basin. GB: Greenland Basin. HR: Hovgaard Ridge. EGR: East Greenland Ridge. (b) Simplified lithological description of the cores used in this study compiled and modified from Myhre et al. (1995) and StatoilHydro (2008). mbsf = meters below seafloor. (c) Chronostratigraphic overview of the outer Greenland margin, focusing on the presently established chronology in Greenland Basin (Berger and Jokat, 2008; Døssing et al., 2016), Molloy Basin (Berger and Jokat, 2009; Gruetzner et al., 2022) and their correlation to this study (dashed lines). The age of the boundaries from Berger and Jokat (2009) have been adjusted using the new age model from Gruetzner et al. (2022). NEG: Northeast Greenland. IMU: intra-Miocene unconformity. Seismic data made available for this study courtesy of AWI, TGS, GEUS and GNPDR.
This study uses a regional 2D seismic database that enables us to correlate the late Cenozoic strata across the entire outer NE Greenland margin (Fig. 2). Here, we describe the large-scale architecture of the outer shelf and upper slope and present the regional long-term glacial history and evolution based on geophysical mapping of TMFs buried in the geological record. We tie our improved stratigraphic framework to three borehole sites which allow us to chronologically constrain the onset of shelf glaciation across the NE Greenland shelf and major changes in ice sheet configuration.
2.1 Study area
The Northeast Greenland margin between 75–81° N is characterized by a 700 km long continental shelf that extends up to 300 km east of the coastline. The shelf in our study area is characterized by three over-deepened cross shelf troughs that terminate at the shelf edge; Westwind Trough, Norske Trough and Store Koldewey Trough, separated by intermediate shallow banks. We adopt the nomenclature from Arndt et al. (2015) when addressing the shallow bank areas (IT-A, B, C; Fig. 1). Westwind Trough and Norske Trough are 300–430 km long, 40–200 km wide, and 200–500 m deep. The two troughs merge by the coast at the outlet of the contemporary NEGIS (Fig. 1a), forming a horse-shoe shaped trough encircling the large inter-trough area IT-A; a complex of shallow banks and smaller depressions (water depths 2–400 m; Fig. 1). The hummocky seafloor of IT-A has been attributed to salt tectonics causing folding and doming of overlying strata and locally the salt diapirs sub-crop the seafloor (Hamann et al., 2005; Arndt et al., 2015; Fyhn et al., 2021). Store Koldewey Trough is 250–400 m deep, 200 km long and 30–50 km wide, located between the shallow IT-B bank (150–250 m deep) and IT-C bank (50–150 m deep) to the north and south, respectively. Store Koldewey Trough does not presently have any direct landward fjord or ice stream connection, but instead abruptly initiates just off the coast of Germania Land and Store Koldewey Island (Fig. 1). However, Olsen et al. (2020) suggested that Storstrømmen glacier (St), a branch of NEGIS presently terminating about 100 km west of Store Koldewey, drained towards Store Koldewey Trough during the last glaciation (Fig. 1).
The shelf edge is located between 100–300 km from the coast and marks the boundary between the continental shelf and a relatively steep continental slope lacking any large-scale sliding, leading to the adjacent deep ocean Molloy Basin, Boreas Basin and Greenland Basin, reaching to approximately 2500, 3000 and 3500 m water depths, respectively. The deep ocean basins are themselves separated by fracture zones and structural highs at the Hovgaard Ridge and East Greenland Ridge (Fig. 1) which complicates direct seismic correlation between them (Hamann et al., 2005; Berger and Jokat, 2009; Døssing et al., 2016).
2.2 Tectonic and oceanographic setting
The NE Greenland continental margin had been dominated by intense rifting since the onset of the late Paleozoic orogenic collapse, leading to formation of structural highs and deep rift basins now filled in by km-thick sedimentary sequences of late Paleozoic to early Cenozoic age (Hamann et al., 2005; Fyhn et al., 2021). The rifting culminated with the onset of seafloor spreading in the Norwegian–Greenland Sea during Early Eocene, coinciding with tectonic compression (53–47 Ma), transpression (47–34 Ma) and finally rifting (34 Ma–recent) between northeastern Greenland and Svalbard (Piepjohn et al., 2016; Peron-Pinvidic and Osmundsen, 2018; and references therein). The Arctic Ocean was isolated or connected through a shallow-water seaway prior to opening of the Fram Strait (Iakovleva et al., 2001; Jakobsson et al., 2007). A narrow and possibly shallow oceanic gateway between the North Atlantic and the Arctic Ocean was established by Early Miocene (around 21 Ma) as seafloor spreading initiated in the Fram Strait (Jokat et al., 2016). Ventilation of the Arctic Ocean and thus, possibly the onset of deep-water circulation through Fram Strait, was initiated by the latest Early Miocene (ca. 17 Ma) (Jakobsson et al., 2007; Ehlers and Jokat, 2013). However, a modern-like circulation pattern through the gateway may have been limited by terrigenous sediments or by an subaerially exposed Hovgård Ridge until the Late Miocene (Engen et al., 2008; Knies et al., 2014). Seafloor spreading in the Fram Strait coincides with two phases of tectonic uplift of the East Greenland margin in Late Miocene (∼ 10 Ma) and Early Pliocene (∼ 5 Ma) (Japsen et al., 2014; Døssing et al., 2016; Bonow and Japsen, 2021; and references therein), leaving eastward tilted and truncated inner shelf sedimentary successions that sub-crop the seafloor (Hamann et al., 2005; Fyhn et al., 2021).
2.3 Glacial history
The most recent (Late Weichselian) glaciation of the Northeast Greenland shelf reached its maximum extent during the Last Glacial Maximum (LGM) about (about 24–16 Ka) (e.g., Funder et al., 2011), however the geometry, dynamics and extent of the GrIS across the shelf are still debated. Branches of the NEGIS are suggested to have extended all the way to the shelf edge within the present-day Westwind Trough, Norske Trough and Store Koldewey Trough, as indicated by mapping of glacial landforms on the seafloor (Evans et al., 2009; Winkelmann et al., 2010; Arndt et al., 2017; Laberg et al., 2017; Olsen et al., 2020; Ó Cofaigh et al., 2025). Whilst preserved mega-scale glacial lineations situated between recessional moraines and grounding zone wedges in the troughs have been suggested to indicate a rapid but episodic retreat pattern of the GrIS across the shelf during the last deglaciation (López-Quirós et al., 2024). The LGM extent of the GrIS and retreat dynamics across the bank is less certain, with suggestions that the outer shelf on the IT-A bank remained ice free through the last glaciation (Rasmussen et al., 2022).
Far less is known about the long-term glacial history of the Northeast Greenland shelf. Evidence of circum-Arctic glacial ice is found in Middle to Late Miocene marine sediment records from the northern North Atlantic and the Norwegian–Greenland Sea. These findings show more or less continuous occurrences of ice rafted debris (IRD) since 12.6–10.8 Ma, consistent with circum-North Atlantic ice masses, including Greenland, reaching the coastlines frequently this time (Fronval and Jansen, 1996; Helland and Holmes, 1997; Knies and Gaina, 2008; Thiede et al., 2011; Gruetzner et al., 2022). Moreover, Southeast and central East Greenland has been pointed out as a source area for IRDs found in the Greenland Basin dated back to Eocene and Oligocene time, showing that ephemeral ice sheets or glaciers reaching sea level have existed in Greenland prior to the Miocene (Eldrett et al., 2007; Tripati et al., 2008).
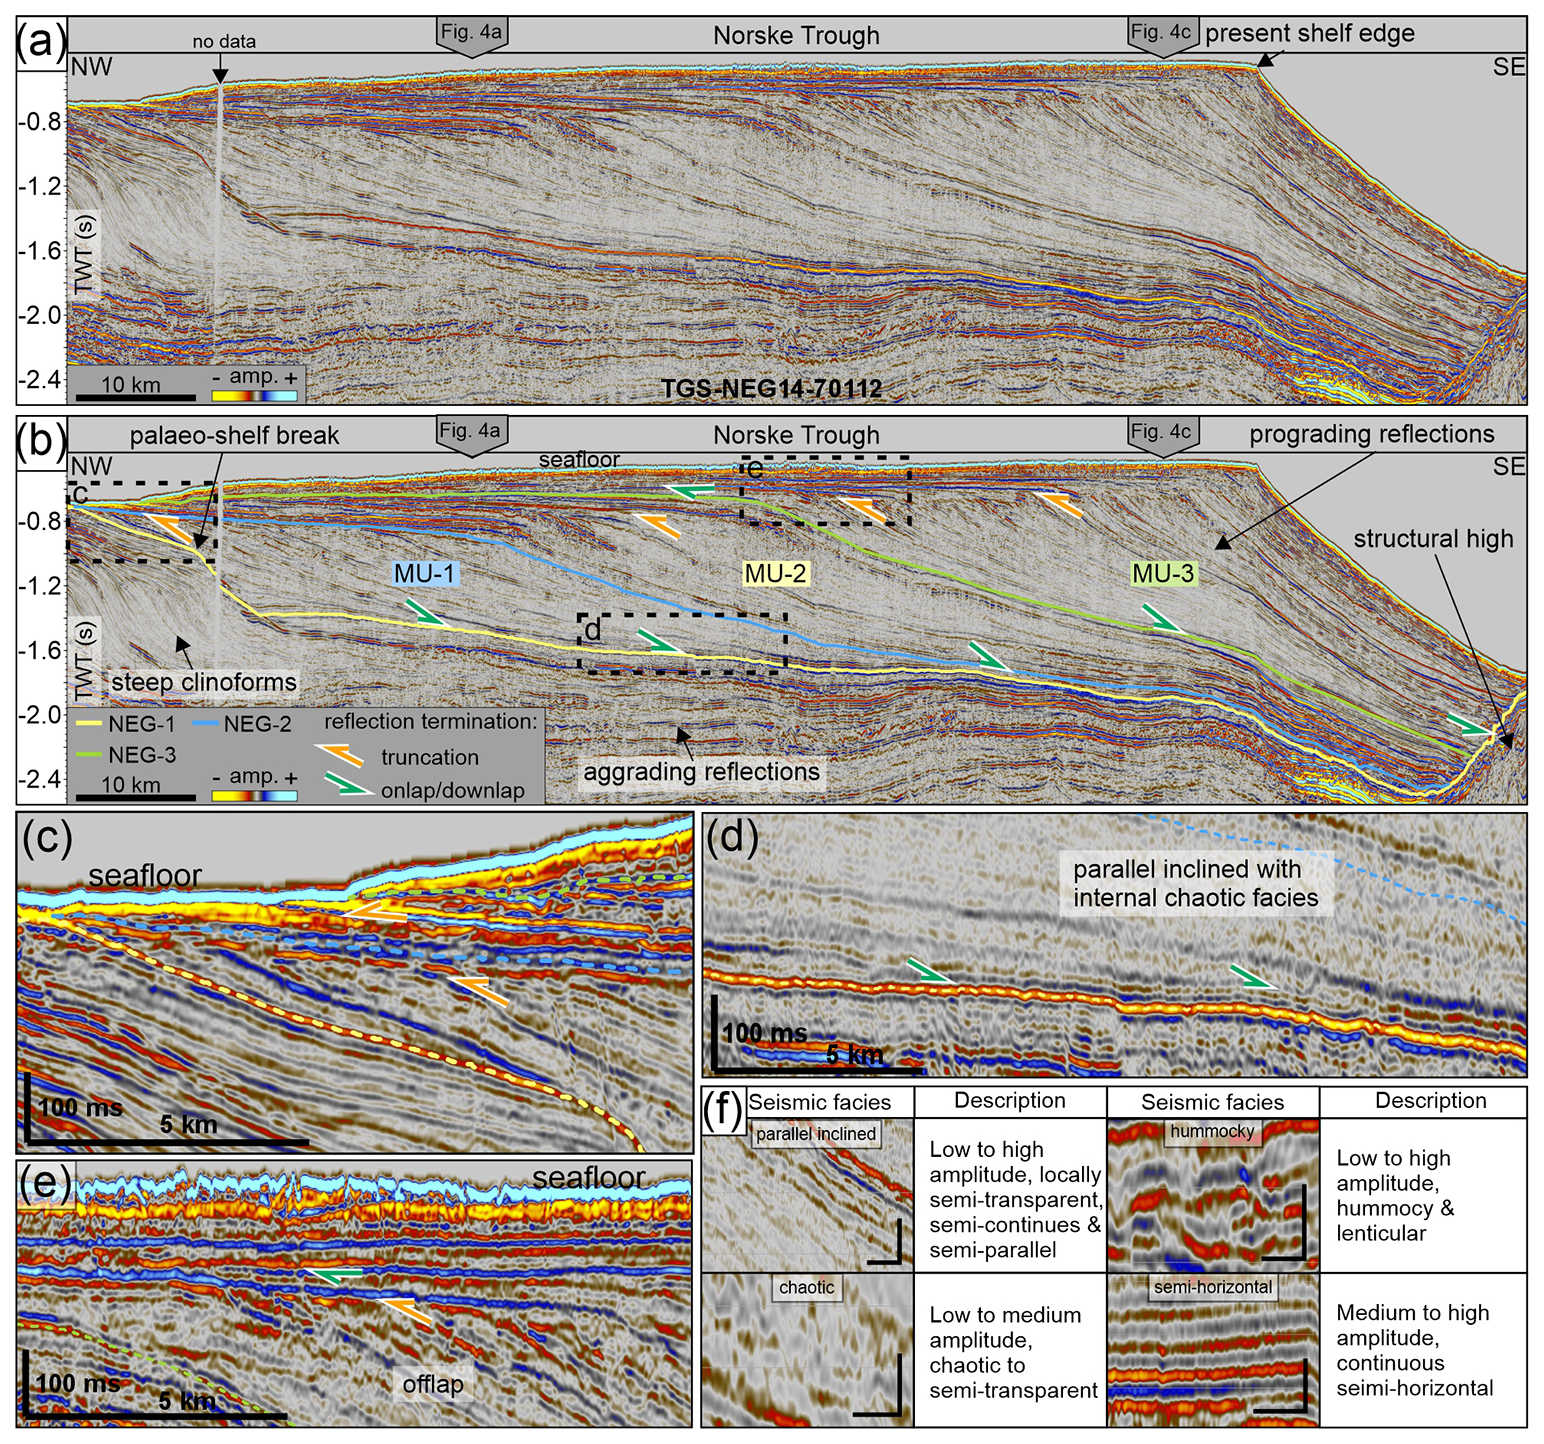
Figure 3Cross-shelf oriented seismic profile from Norske Trough (see Fig. 1 for location). (a) Uninterpreted seismic profile. Grey wide arrows locate the cross-seismic lines in Fig. 4 for reference. TWT = two-way travel time. (b) Key regional reflections and internal reflection termination pattern. MU = Mega Unit (-1, 2, 3). (c) Zoomed in view on the palaeo-shelf break and onset of shelf progradation. (d) Reflection termination pattern at the base of the prograding units. (e) Truncated foresets and onlapping topsets. (f) Examples and descriptions of key seismic facies described in this study. Scalebar: Vertical axis 50 ms (TWT). Horizontal axis 1 km. Seismic courtesy of TGS.
Seismic investigations offshore NE Greenland has identified massive prograding and gently inclined seismic sequences of late Cenozoic age within the shallowest stratigraphic interval on the outer shelf (Hamann et al., 2005; Berger and Jokat, 2008, 2009; Døssing et al., 2016). These prograding sequences rests on top of steeply inclined clinoforms and aggrading strata interpreted to represent deltaic sequences and submarine fans of assumed Eocene to Miocene age (Fig. 3) (Petersen, 2021). The prograding sequences are thought to represent increased sediment supply and offshore sedimentation rates caused by localized glaciers onshore NE Greenland starting around 15 Ma (Berger and Jokat, 2008, 2009). However, age control here is based on seismic-borehole correlation to ODP Site 913, which is poorly constrained for that time period (Myhre et al., 1995; Hull et al., 1996). Berger and Jokat (2009) divided the shelf sequences into three seismic units, where the second stratigraphic unit was suggested to indicate the onset of shelf glaciations coinciding in time with that of SE Greenland around 7 Ma based on comparison of seismic units along eastern Greenland margin. Conversely, Petersen (2021) attributes the same prograding sequences to changes in sea level stands driven by uplift, subaerial erosion and subsequent fluvial and marine deposition along the outer palaeo-shelf, and speculates that the onset for shelf glaciation occurred during the Plio–Pleistocene transition (ca. 2.7 Ma). Hence, the precise timing and extent of grounded ice on the NE Greenland continental shelf remain unresolved, and the driving force behind significant shelf progradation is still debated.
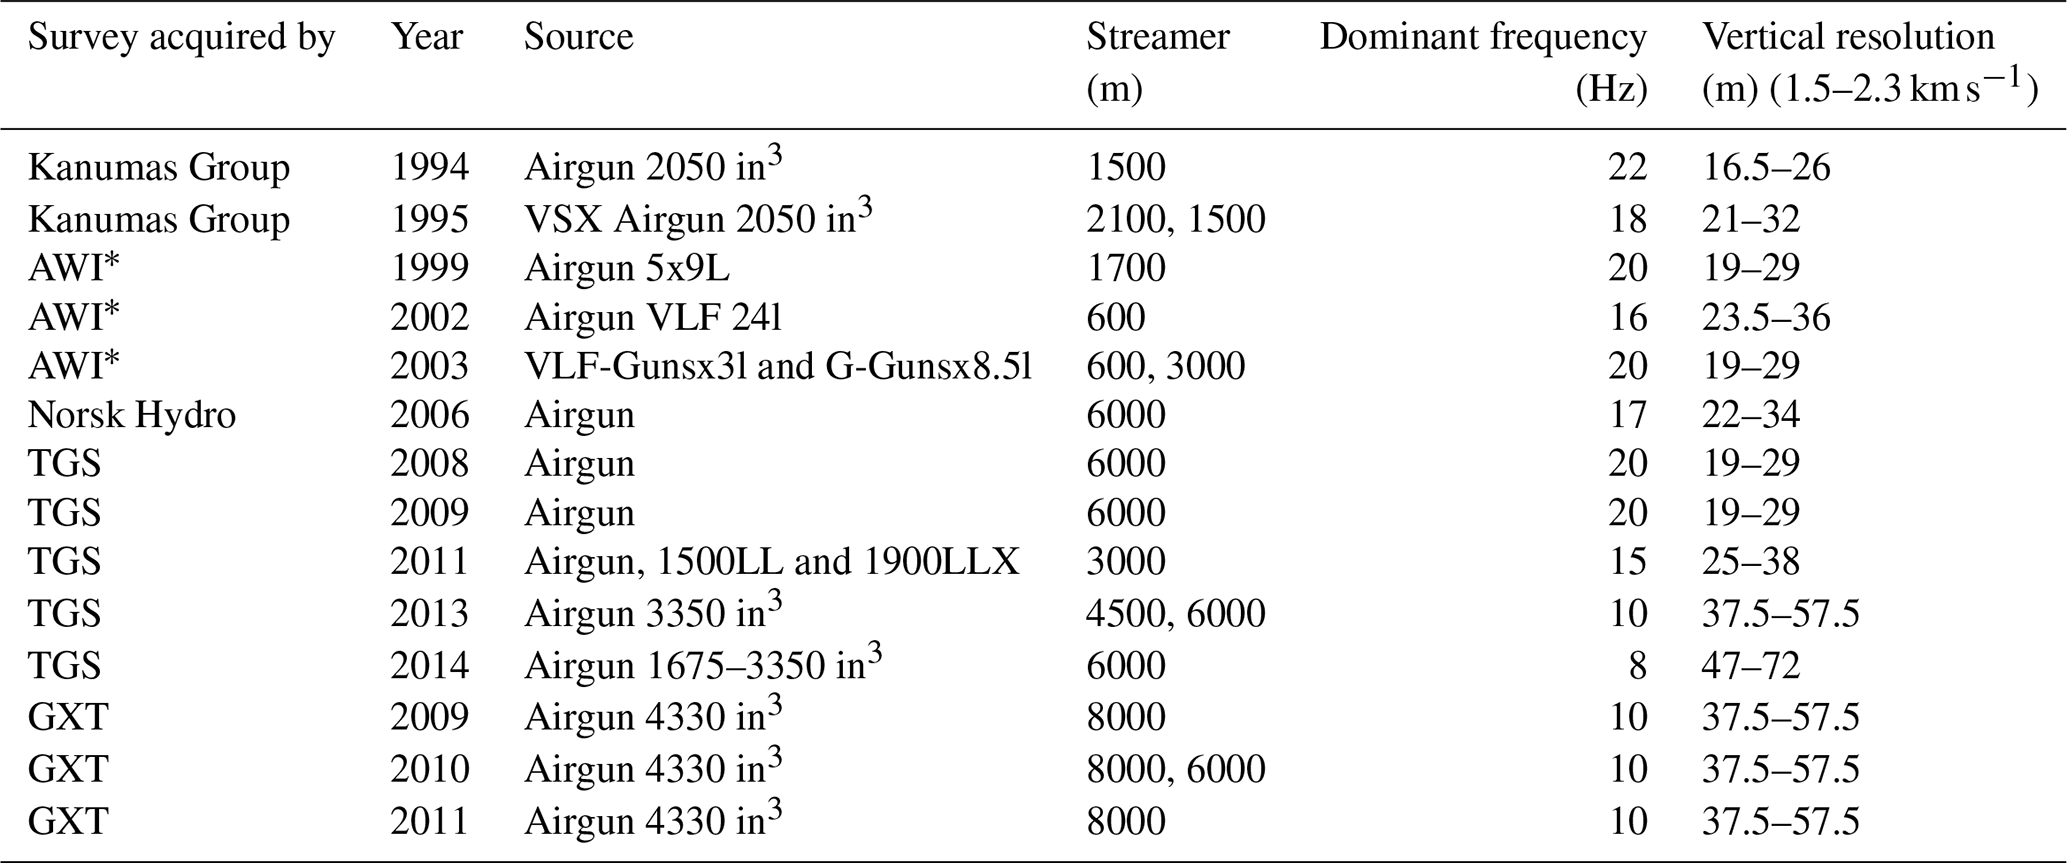
Table 1An overview of seismic surveys used in this study and their vertical resolution in glacial shelf sediments. Wavelengths (λ) are calculated using velocity constraints from the area (1.5–2.3 km s−1; Berger and Jokat, 2008) and dominant frequencies. Vertical resolutions are estimated as . ∗ The AWI surveys used here were reprocessed by TGS in 2010.
During the last decades, the coverage of seismic datasets from this vast shelf area has increased, offering a new opportunity to study its glacial history. In this study we use these datasets to characterise the nature and thickness of the glacial sediment packages and constrain their age through ties to the few available boreholes, providing new information on the onset and evolution of shelf-edge glaciations along the NE Greenland continental margin.
This study uses a large 2D seismic dataset to improve the regional seismic stratigraphic framework, integrated with published data from drilled sediment cores to chronologically constrain the glacial evolution of the NE Greenland margin (Fig. 2). The topographic and bathymetric background data used in this study are a composite of the IBCAO 5.0 (Jakobsson et al., 2024) and interpolated bathymetry from Arndt et al. (2015) (Fig. 2a). The extent of the present-day GrIS is derived from BedMachine v5, which is an updated version of v3 by (Morlighem et al., 2017), and ice velocity map acquired through the Cryoportal (Nagler et al., 2015).
3.1 Seismic data
This study uses 46 000 km of 2D reflection seismic data covering most of the NE Greenland margin, an area of more than 200 000 km2 (Fig. 2). The data consists of multiple surveys acquired by both industry (Kanumas Group, TGS-NOPEC Geophysical Company ASA (TGS), GX Technology (GXT) and NorskHydro) and academia (Alfred Wegener Institute, AWI) between 1994–2014, with considerable variations in acquisition parameters and equipment used (Table 1). The dominant frequency of each survey has been determined using the spectral analysis tool in Petrel (Table 1). Velocity constraints of 1.5 and 2.3 km s−1 from the seafloor down to 2 km on the shelf (Berger and Jokat, 2008) are used to calculate the expected maximum and minimum range of vertical resolution within our datasets, calculated as a quarter of the wavelength () (Table 1). These velocity ranges are comparable to seismic studies in similar settings (Geissler et al., 2011; Knutz et al., 2019; López-Quirós et al., 2024).
3.2 Borehole data
Published data of cored boreholes from Ocean Drilling Program (ODP) Leg 151 Site 909 and Site 913 (Myhre et al., 1995) are used to provide sedimentological and chronological constraints on the regional seismic stratigraphic units from this study. We apply the revised chronology by Gruetzner et al. (2022) for Site 909, and use the chronology by Hull et al. (1996) at Site 913. The summary report from the NE Greenland Stratigraphic Coring project 2008 (Statoilhydro, 2008) is used to provide sedimentological information from Kanumas Site 13, located on the NE Greenland shelf.
3.2.1 ODP Site 909
ODP Site 909 is located at 2519 m water depth in the Molloy Basin, central Fram Strait (Fig. 2) (Myhre et al., 1995). The site penetrated a total of 1061.8 m of sediments, corresponding to a true vertical depth of 1023 m below seafloor () after correcting for deviation of the drill pipe (Myhre et al., 1995). We apply the newest age model for this site by Gruetzner et al. (2022), providing an upper Middle Miocene age (13.8–11.6 Ma) at the base of Site 909 (Fig. 2c). The core mainly contained clay and silty clay sediments with common occurrences of large dropstones in the upper 240 (Fig. 2b) (Myhre et al., 1995). IRD was described from the whole core, spanning from upper Middle Miocene to Late Pleistocene (Fig. 2b) (Wolf-Welling et al., 1996; Winkler et al., 2002; Knies and Gaina, 2008; Thiede et al., 2011; Gruetzner et al., 2022).
3.2.2 ODP Site 913
ODP Site 913 is located at 3318 m water depth in the Greenland Basin ca. 100 km east of the NE Greenland shelf (Fig. 2a). We use the age model from Hull et al. (1996). Site 913 reached a total depth of 770.3 , retrieving Early Eocene to Late Pleistocene sediments. However, the upper 423 m of the core, corresponding to the Miocene to present stratigraphic interval, was sparsely cored due to time constraints, limiting the age constraints for this period (Fig. 2b) (Myhre et al., 1995). The core has generally been described as clayey silt to silty clay with up to cobble-size dropstones in the upper ca. 380 m. The deepest IRDs has been described down to a depth of ca. 550 , corresponding to Eocene-Oligocene deposits (Eldrett et al., 2007; Tripati et al., 2008).
3.2.3 Kanumas Site 13
The NE Greenland Stratigraphic Coring Project was a commercial coring project carried out in 2008 by the Kanumas Group (Lundin, 2013), targeting shallow sub-cropping seismic stratigraphic intervals of commercial interest. Kanumas Site 13 is located on the shelf within Norske Trough at 509 m water depth, about 100 km from the shelf edge (Fig. 2a). The description given here is based on the summary report which provided lithological descriptions and photographs of the whole core (Statoilhydro, 2008). The borehole reached a total depth of 114.9 , recovering a total of 91.9 m of sediments (82 % recovery). The entire core was generally described as sandy clay with dropstones of varying size, shape and composition, only interrupted by short (≤1 m) laminated intervals (Figs. 2b and S1 in the Supplement). No age information for this core is presently available.
3.3 Methods
3.3.1 Seismic interpretation
The 2D seismic data presented in this study have been compiled, interpreted and tied to borehole data in commercial software (Petrel). The TGS surveys were used as reference when adjusting for vertical offset between seismic surveys. Acquisition artefacts such as multiples and multiple attenuation through processing occur in some seismic data which can be problematic on the shelf areas, especially when interpreting horizontal reflections. Time shifted seafloor reflections (×2, ×3, ×4) are used to aid the interpretation in these areas.
This study focus on interpreting reflections that represent regional unconformities in the seismic record, marking the boundaries for large scale changes in depositional pattern. We have adopted the reflection terminology of Mitchum et al. (1977) to describe the seismic facies and termination pattern of individual reflections. Specific horizons have been tracked manually and in places with continuous horizons (e.g. seafloor) by using supervised 2D-assisted tracking. A grid size of 1 km has been used to create surfaces of the two-way travel time horizons. The isochron thickness of seismic units are calculated by subtracting the lower surface from the upper one for each unit and are given in two-way travel time (TWT) and in metres assuming an average acoustic velocity of 2 km s−1 in consolidated sediments, based on similar glaciated margins (Berger and Jokat, 2008; Geissler et al., 2011; Knutz et al., 2019). The resulting surfaces and thickness maps were further analysed and visualized using ArcGIS Pro.
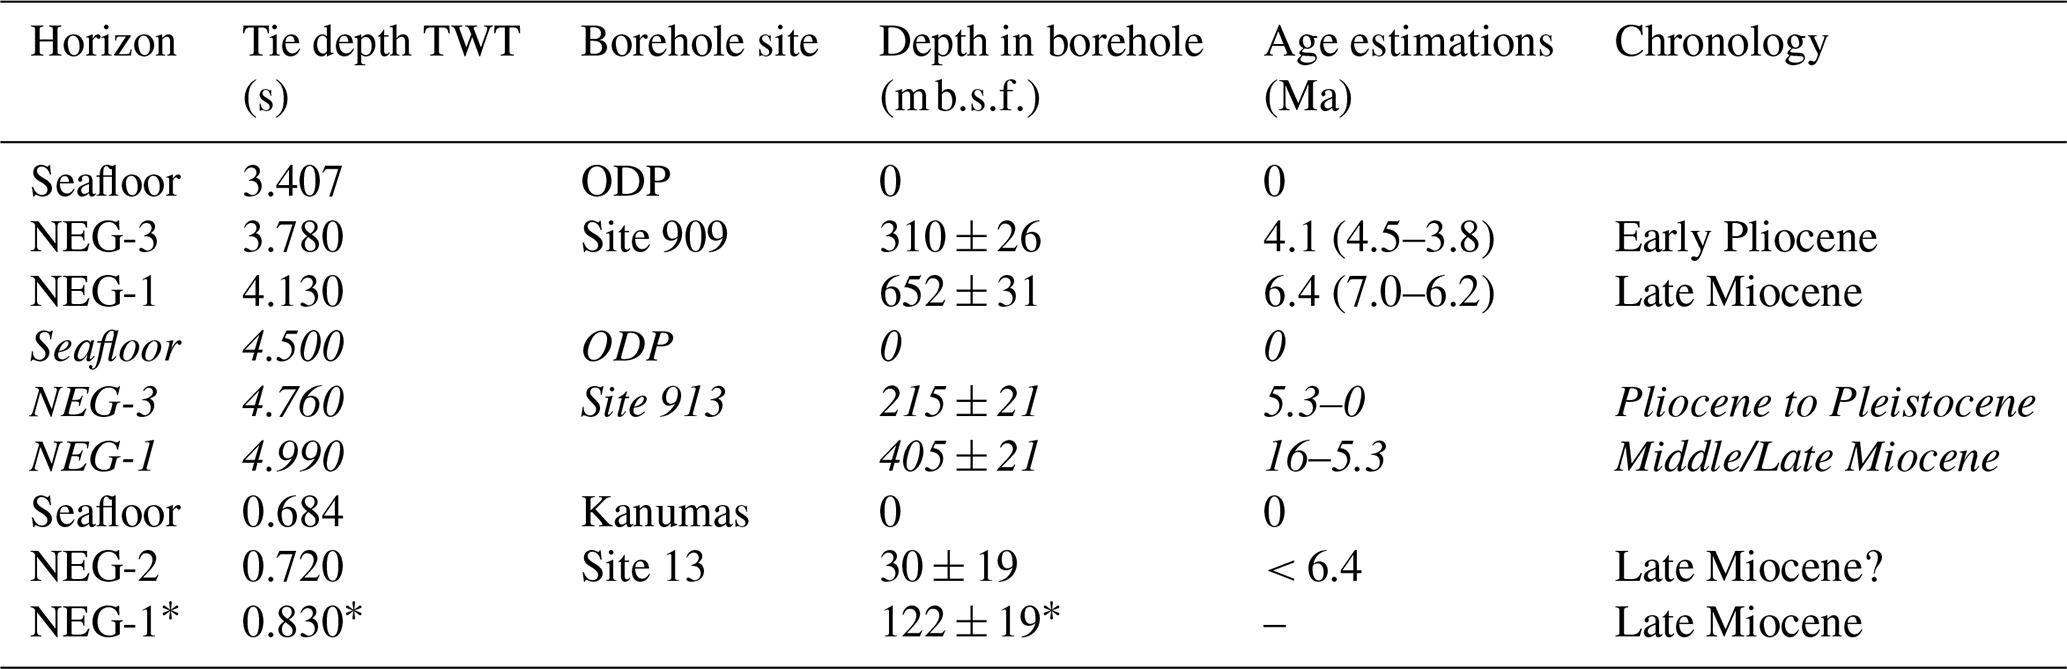
Table 2Seismic-borehole tie-depths for the key reflections from this study. Vertical tie-depth is given in meters below seafloor () with an uncertainty equal to the vertical resolution of the seismic tie-line (Table 1). Age estimates from ODP Site 909 and Site 913 are based on the age models by Gruetzner et al. (2022) and Hull et al. (1996), respectively. Age range in brackets are based on the tie depth uncertainty (vertical resolution at tie depth). Normal/italic fonts separates the respective borehole sites. ∗ Estimated depth below Kanumas Site. TWT = two-way travel time in seconds.
3.3.2 Seismic-borehole tie
Available velocity profiles from ODP Site 909 (Gruetzner et al., 2022), Site 913 (Myhre et al., 1995), and a velocity data from the NE Greenland shelf (Berger and Jokat, 2008) have been used to tie the boreholes to the seismic data and to match the interpreted seismic horizons. The velocity profile of Site 909 from Gruetzner et al. (2022) yields an average velocity of 1.66 km s−1 for the interval ca. 0–350 , and 1.98 km s−1 for the interval 350–650 . Here, we implement the average velocities for each interval to convert the borehole depth () to two-way travel time (TWT) and to calculate the vertical resolution at the tie points in order to estimate uncertainties of the tie-depth (Table 2). The average velocity at Site 913 was reported by Myhre et al. (1995) to be varying between 1.48–1.82 km s−1, with the exceptions of carbonate concretions and the very deepest part which exceeded 2.0 km s−1. Here, we use 1.66 km s−1 as an average velocity when converting Site 913 borehole depth to TWT. Likewise, seismic velocity analysis by Berger and Jokat (2008) suggests a velocity of 1.5 to 1.7 km s−1 for the upper few hundred metres on the shelf, thus, we use an average subsurface velocity of 1.66 km s−1 (similar to Site 913) to convert Kanumas Site 13, located on the shelf, from borehole depth to TWT (Fig. 1b). The age range of correlated horizons are estimated using the vertical resolution of the respective seismic tie line to make up for possible horizon merging and mismatches in the seismic-borehole tie (Table 2).
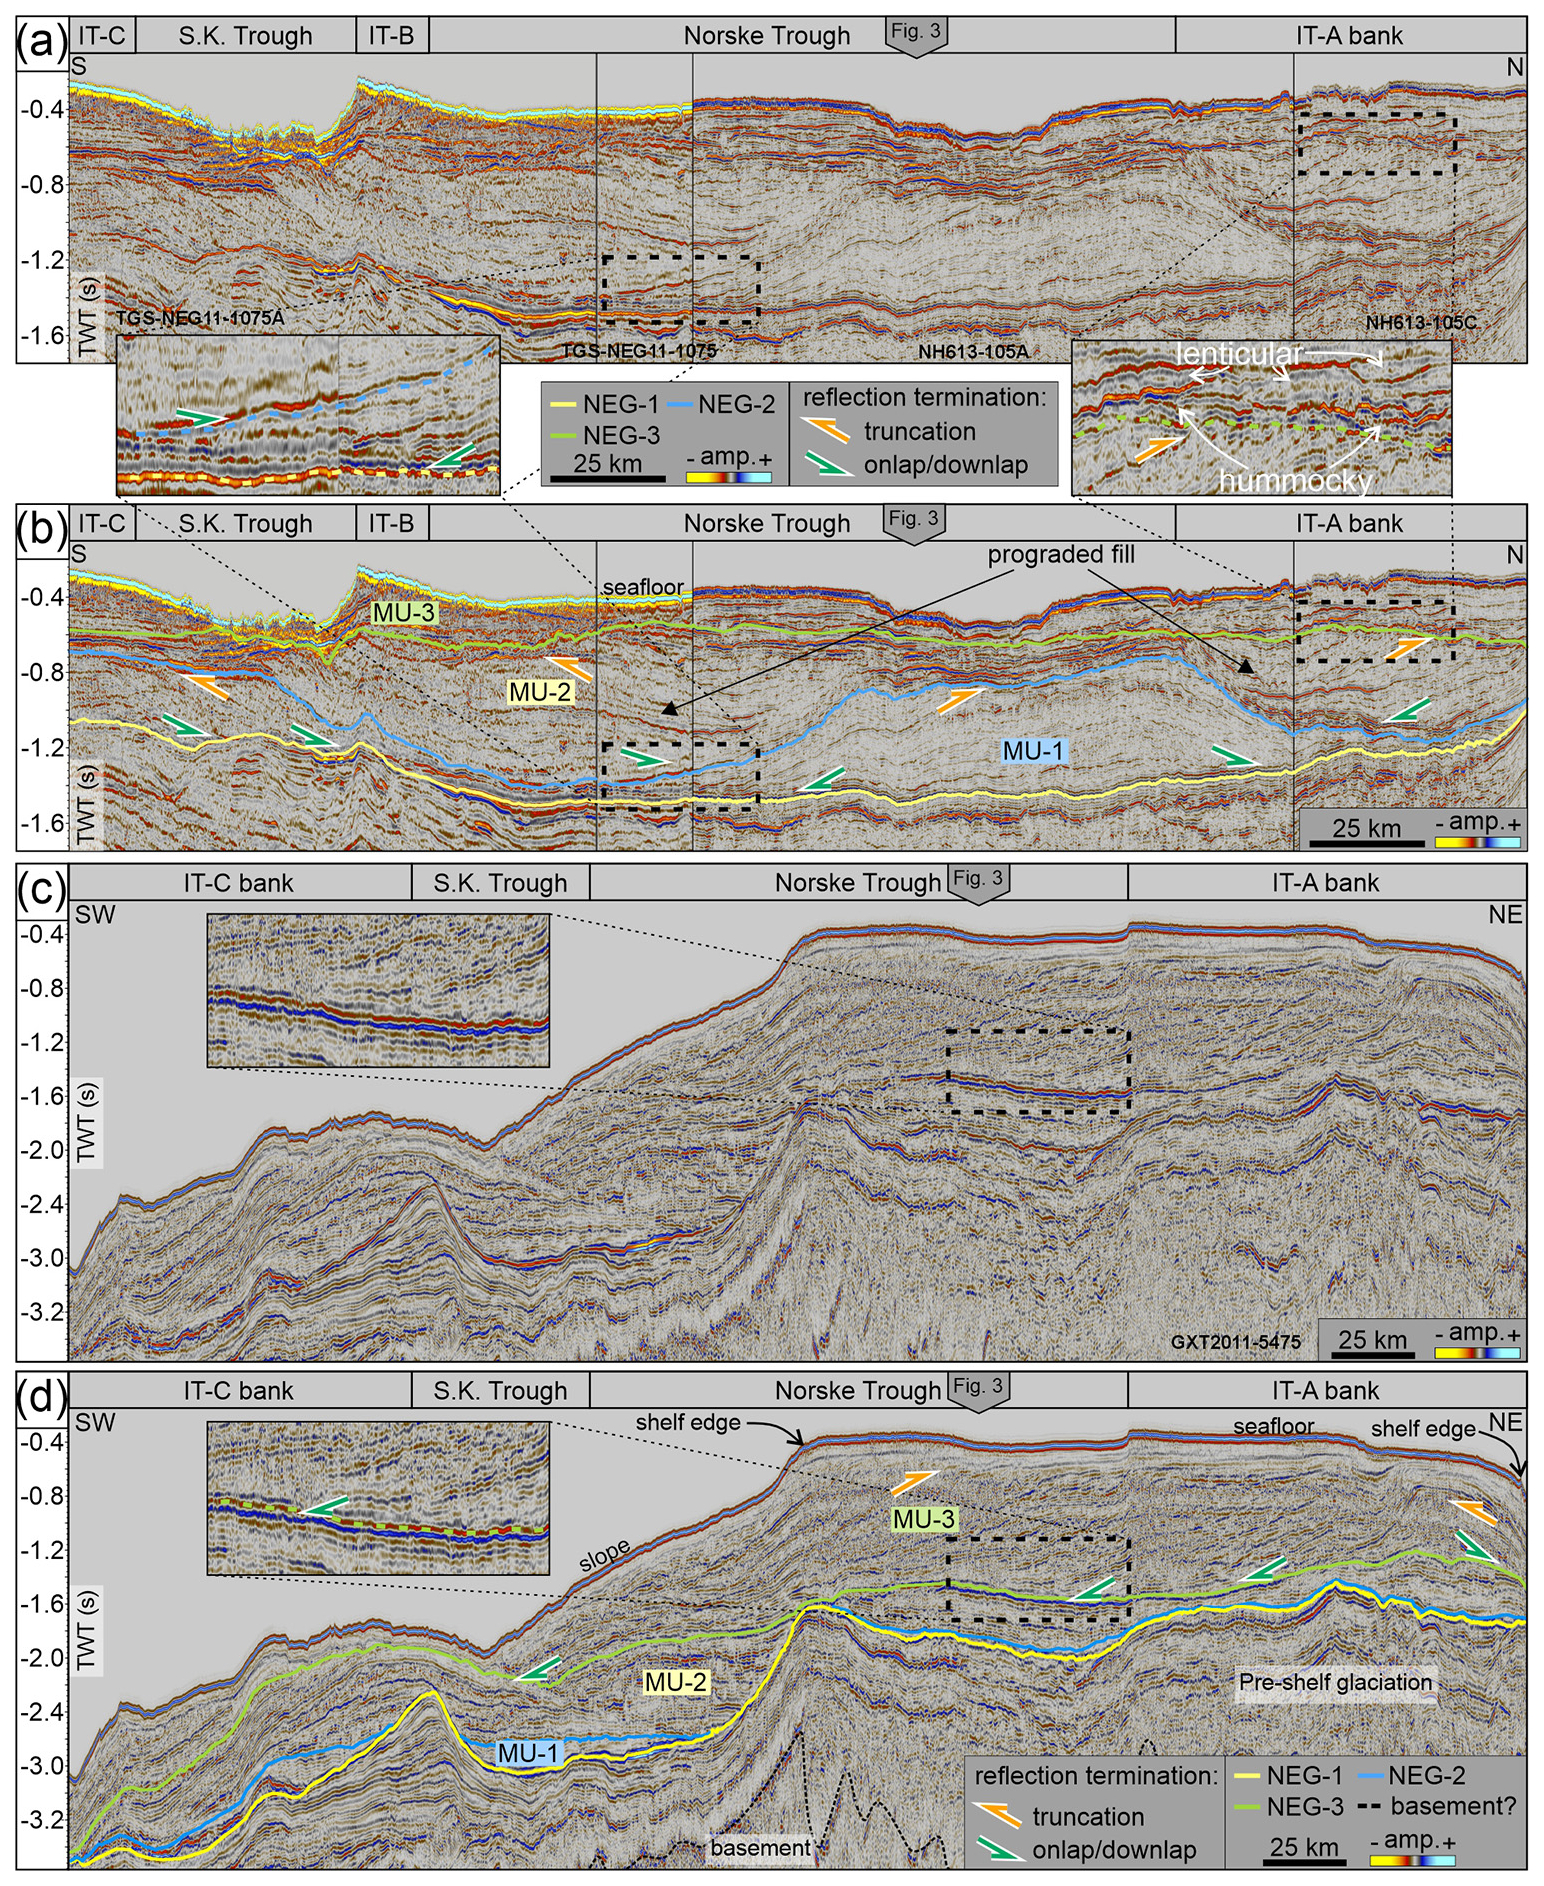
Figure 4Along-shelf oriented seismic profiles from the central shelf (a, b) and outer shelf/upper slope (c, d; see Fig. 1 for locations), with present-day shelf-corresponding troughs and banks annotated for reference. Grey wide arrows locate the cross-seismic line in Fig. 3 for reference. (a) Uninterpreted composite seismic profile. Insert figures show examples of seismic facies and reflection terminations as described in the results. (b) Interpretation of composite seismic line in panel (a). Note the indicated prograding fill pattern north and south of MU-1 in Norske Trough. (c) Uninterpreted seismic profile with insert figure to show general reflection termination pattern at this interval. (d) Interpretation of seismic line in panel (c). MU = Mega Unit (-1, 2, 3). S.K. Trough = Store Koldewey Trough. Seismic courtesy of GEUS and GNPDR.
We identify three major reflections that represent regionally unconformable boundaries that can be correlated across the Northeast Greenland (NEG) margin (Figs. 3 and 4). From bottom to top, these boundaries are named NEG-1, NEG-2 and NEG-3 and divide chronological intervals between the Late Miocene to Early Pliocene. Furthermore, the reflections define three seismic mega units (MUs) to be described below.
4.1 Regional Unconformities
4.1.1 Regional Unconformity 1 (Late Miocene: 6.4 Ma)
The Northeast Greenland Regional Unconformity-1 (NEG-1) is regionally recognized as a reflection of high amplitude and reverse polarity compared to the seafloor (Figs. 3 and 4). The reflection marks a regionally unconformable boundary that can be traced across the entire study area. On the outer shelf it separates underlying (generally conformable) aggrading strata from the overlying prograding strata that (unconformably) terminate by downlap onto NEG-1. Landwards, on the central and inner shelf, NEG-1 truncates underlying tilted aggrading strata, whereas it is conformable to overlying semi-horizonal to hummocky reflections (landward component of the prograding reflections).
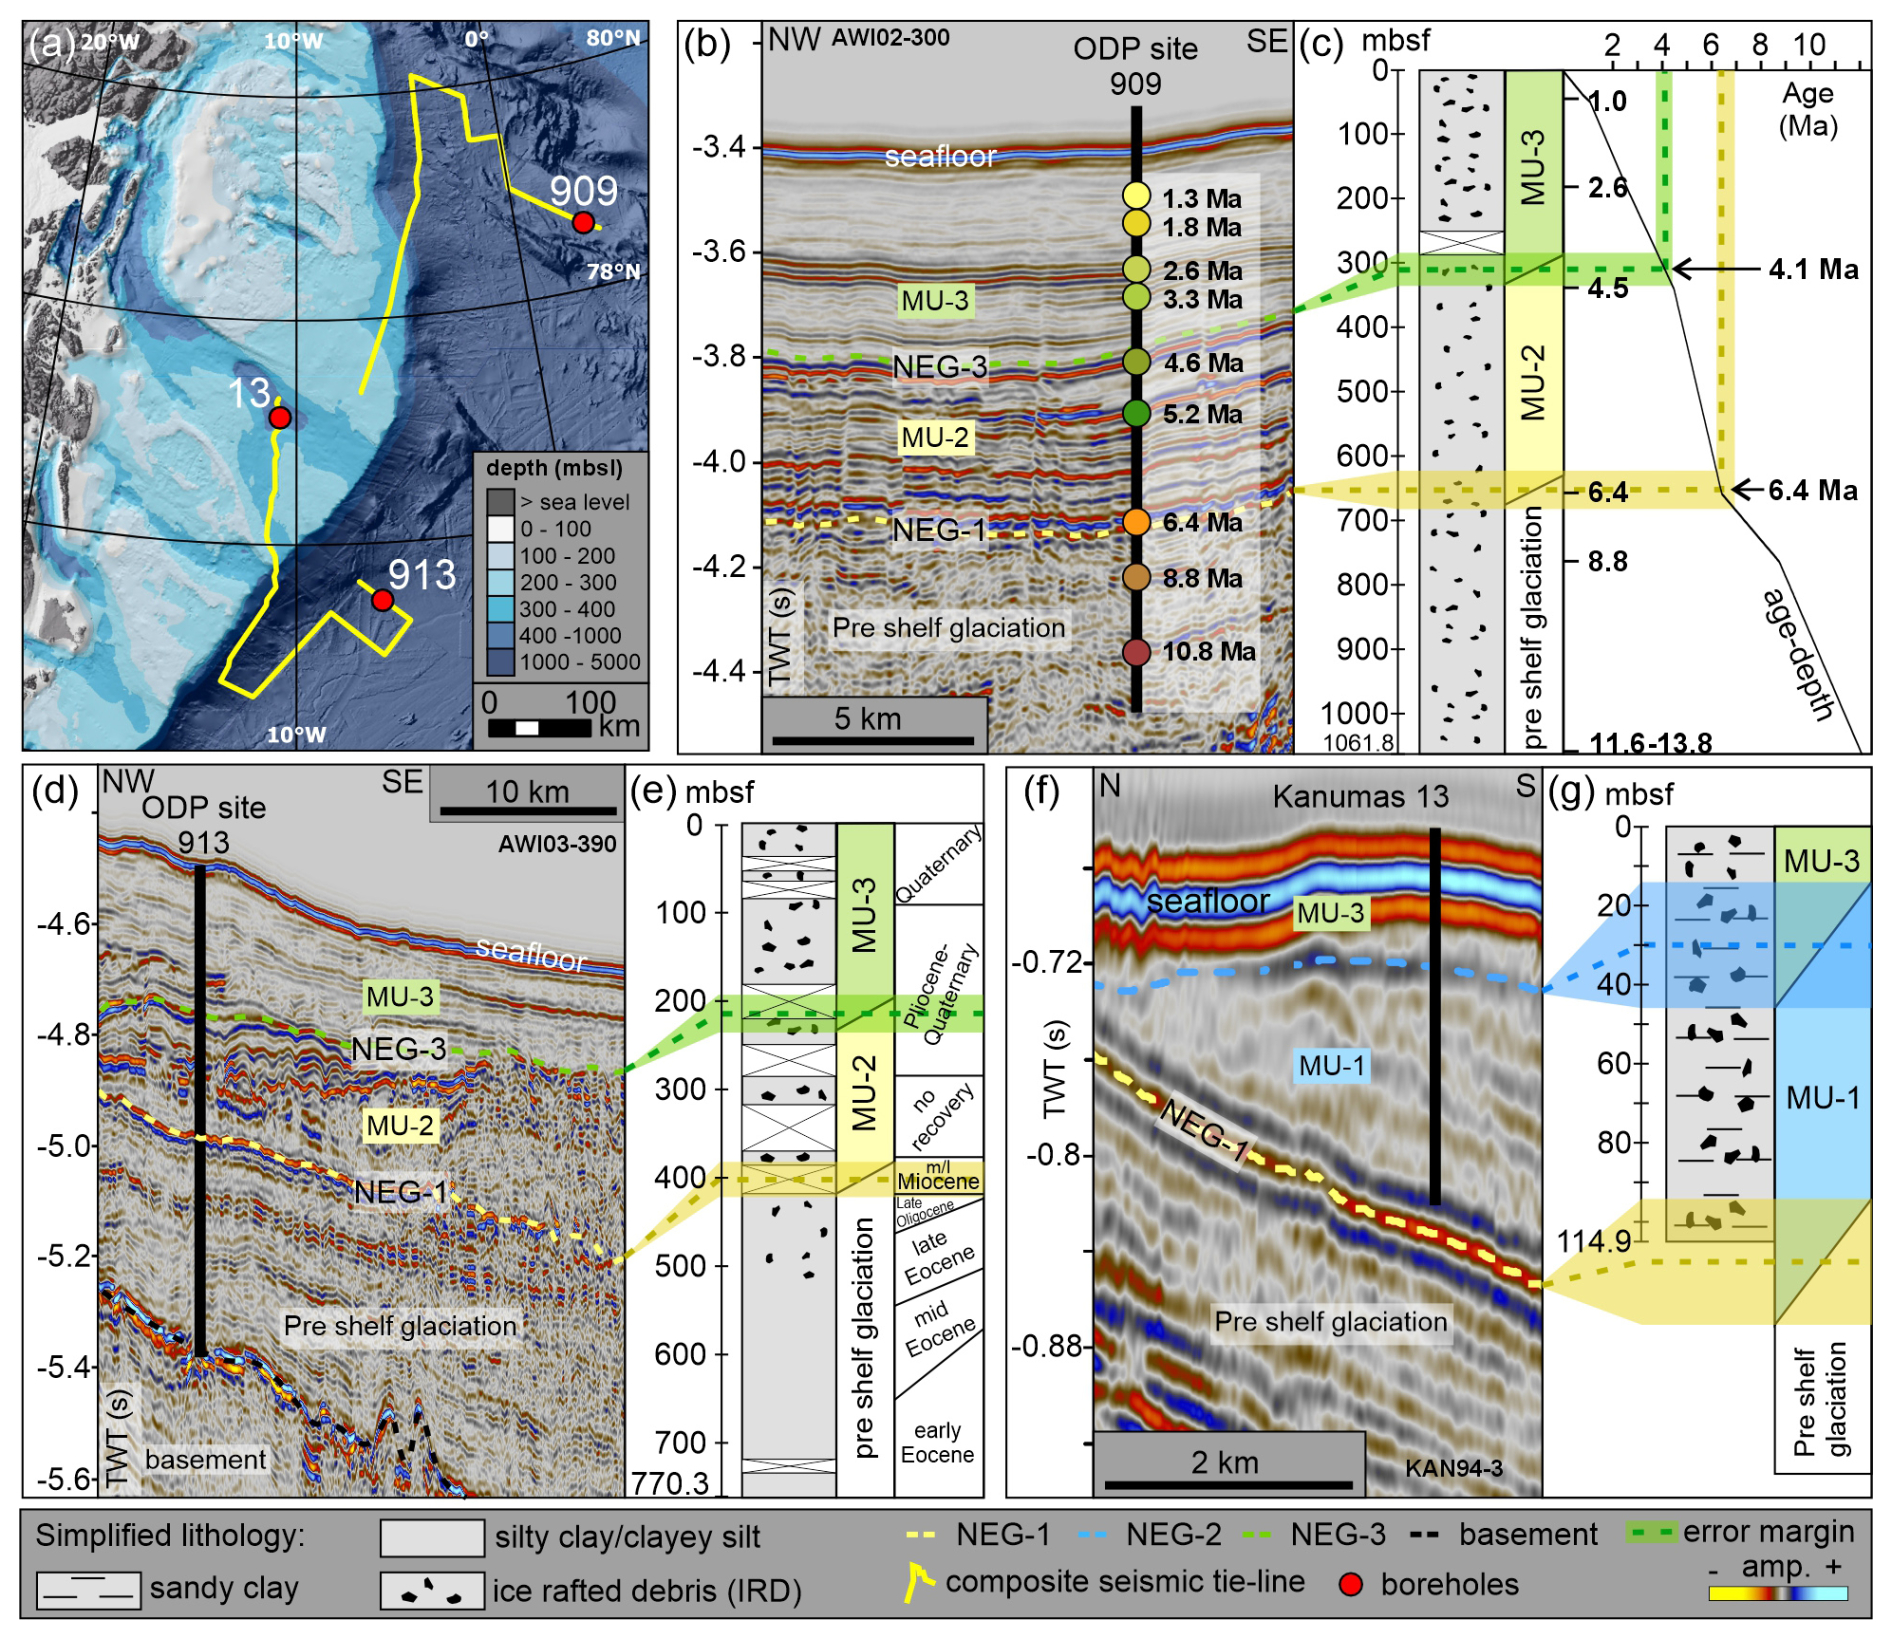
Figure 5Seismic-borehole ties from this study shown by coloured dashed lines with transparent background (error margins). Legends are shared with all figures. Horizontal transparent error margins represented by seismic vertical resolution (m) (note scale differences in borehole logs; see Table 1). (a) Location of composite seismic tie-lines (yellow lines) used to regionally correlate reflections from the shelf towards the deeper basins and the boreholes (red circles). 909 and 913 refers to ODP Sites while 13 refers to Kanumas Site. (b) Seismic-borehole tie at ODP Site 909 with annotated assigned ages for major seismic reflections modified from Gruetzner et al. (2022). (c) Simplified lithological description of ODP Site 909 and depth-correlation of regional seismic reflections (dashed lines) and mega units (MU). To the right: age-depth model for Site 909 with age fix points (Ma) on vertical axis from Gruetzner et al. (2022). Vertical transparent error margin represents the age uncertainty for each tie-depth. (d) Seismic-borehole tie at ODP Site 913. (e) Simplified lithological description of ODP Site 913 and depth-correlation of our seismic reflections and mega units. Age model for Site 913 by Hull et al. (1996). (f) Seismic-borehole tie at Kanumas Site 13. Note that the borehole did not reach the NEG-1 reflection boundary. (g) Simplified lithological description of Kanumas Site 13 and depth-correlation of our seismic reflections and mega units. Seismic courtesy of AWI, TGS, GEUS and GNPDR.
Correlation of NEG-1 into the Molloy Basin and ODP Site 909 shows that it ties with Site 909 at about 652 , corresponding to a Late Miocene age of 6.4 Ma according to the revised age model by Gruetzner et al. (2022), ranging between 7.0–6.2 Ma using a tie-depth uncertainty of ± 31 m (Table 2, Figs. 5a–c and S2 in the Supplement). This age is supported by our correlation to Site 913 in the Greenland Basin where NEG-1 ties at 405 which is estimated to be of Middle to Late Miocene age (Myhre et al., 1995; Hull et al., 1996) (Table 2, Figs. 5d, e and S3 in the Supplement).
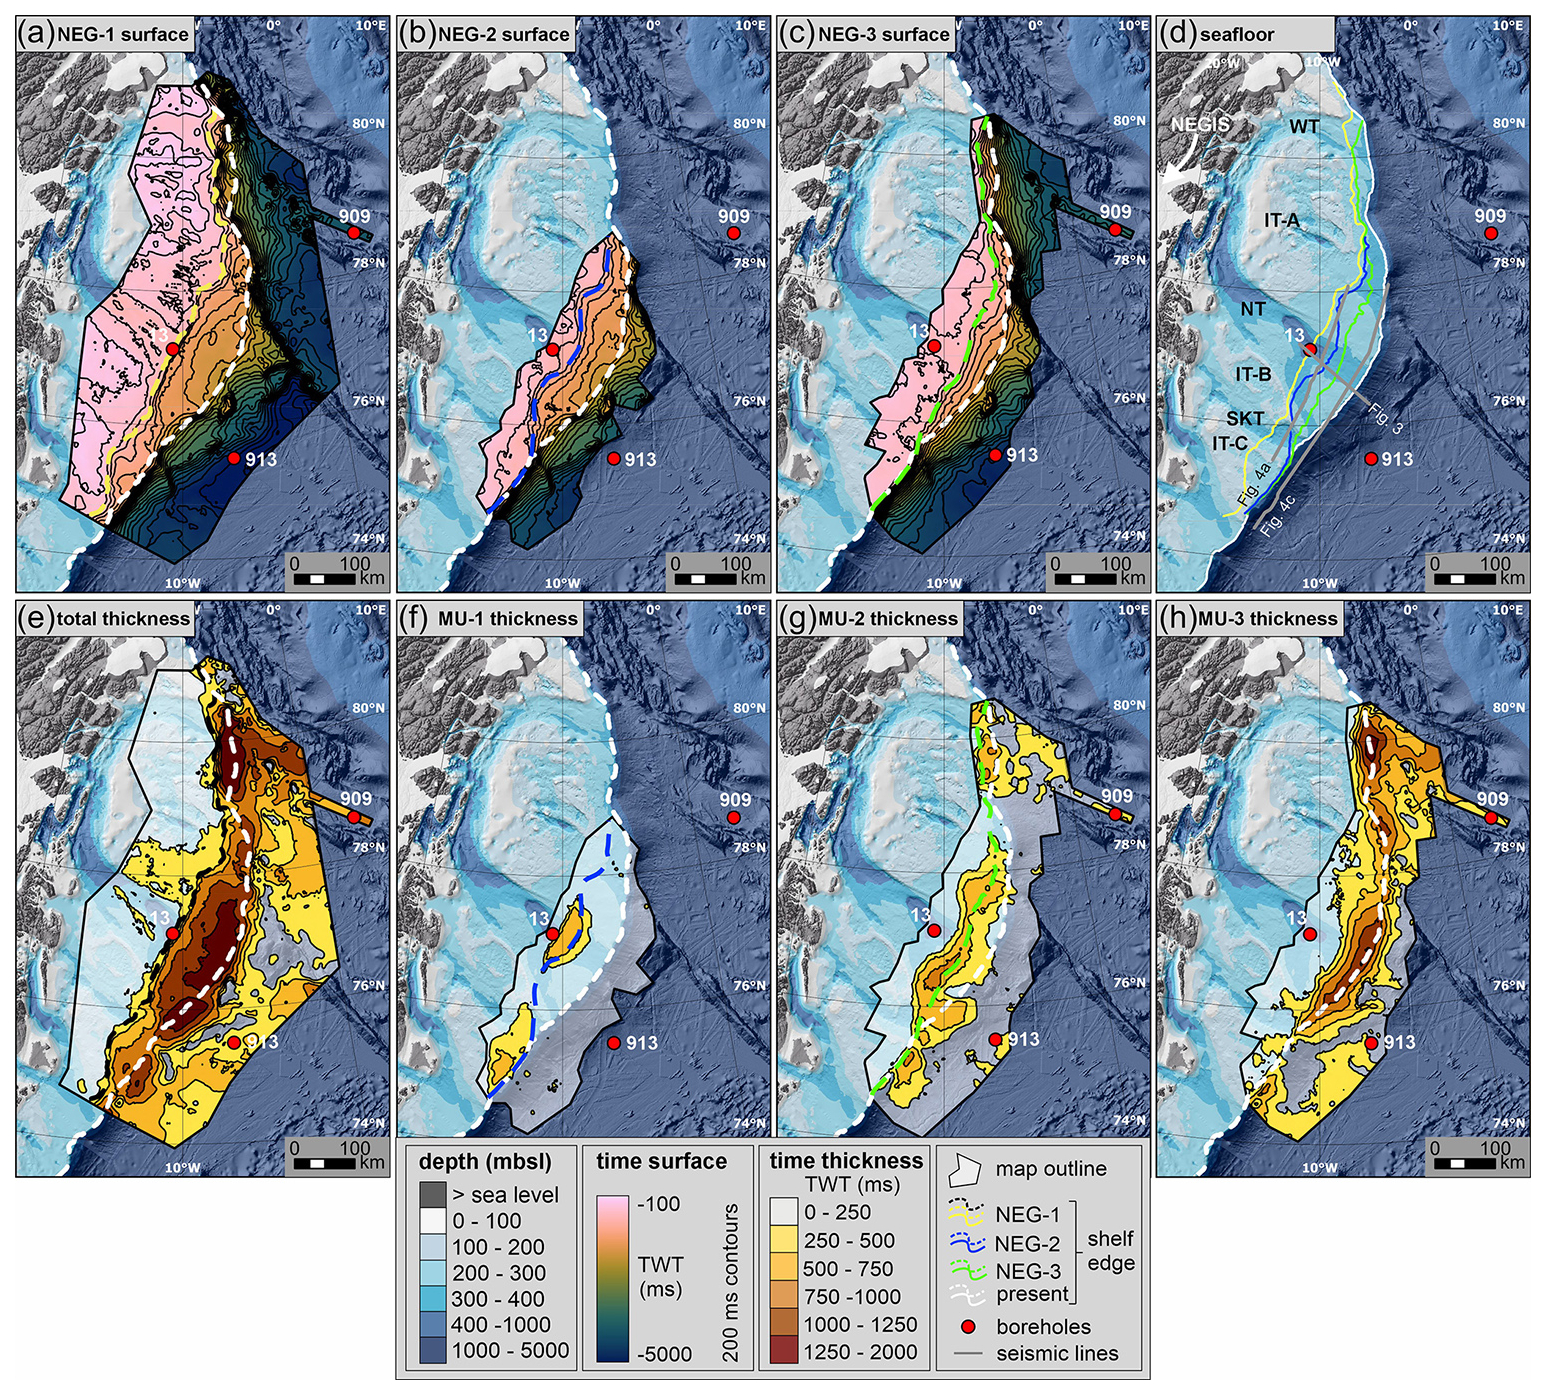
Figure 6Interpolated surfaces and isochron thickness maps shown in two-way travel time (TWT; units in thickness maps are roughly equal to metres assuming an average subsurface velocity of 2 km s−1). Palaeo-shelf edge positions for each respective surface/map are shown by coloured dashed lines. Present-day shelf edge shown in white dashed line. Shared legends for all maps located above. (a) Interpolated surface of NEG-1 and its interpreted extent. (b) Interpolated surface of NEG-2 and its interpreted extent. (c) Interpolated surface of NEG-3 and its interpreted extent. (d) present-day seafloor with indicated palaeo-shelf edge positions for all three reflections. (e) Total thickness map measured from NEG-1 to the seafloor reflection. (f) Thickness map of MU-1, measured from NEG-1 to NEG-2. (g) Thickness map of MU-2, measured from NEG-1 + NEG-2 to NEG-3. (h) Thickness map of MU-3, measured from NEG-3 to the seafloor reflection. MU = Mega Unit (-1, 2, 3). NEG = Northeast Greenland unconformity (-1, 2, 3).
NEG-1 has been correlated across most of the NE Greenland margin, for about 800 km from Westwind Trough and Molloy Basin in the north to the IT-C bank and the Greenland Basin in the south, and up to 400 km from the inner continental shelf in the west to the deep ocean basins in the east (Fig. 6a). The interpolated time-surface of NEG-1 expresses a palaeo-shelf with a sharp offlap marking the palaeo-shelf break position up to 100 km west of the present-day shelf edge within Norske Trough and Store Koldewey Trough (Fig. 6a and d). Further north along the outer IT-A bank and Westwind Trough, the palaeo-shelf position is about 10–40 km west of the contemporary shelf edge. Three slightly over-deepened cross-shelf troughs can be recognised on the palaeo-shelf, located below the contemporary troughs. Westwind Trough has a similar width to its contemporary part whereas Norske Trough and Store Koldewey Trough both seem to be wider on the outer palaeo-shelf, compared to the present-day troughs. East of the NEG-1 palaeo-shelf edge, a buried submarine plateau is located below the outer Norske Trough and Store Koldewey Trough, between the palaeo-shelf edge and the present-day shelf edge. Ridges and structural highs are visible east and southeast of the present-day shelf edge, as the time-surface deepens towards the basins.
4.1.2 Regional Unconformity 2 (Late Miocene?)
The reflection termed NEG-2 is stratigraphically situated above NEG-1 and marks a surface that truncates underlying prograding reflections (Figs. 3 and 4a, b). NEG-2 is characterized by a medium amplitude and continuous reflection that towards the east terminates by downlap onto NEG-1. Its western extent is limited to the palaeo-shelf edge of the NEG-1 surface where it either onlaps onto NEG-1, is truncated by overlying reflections or becomes too thin to be resolved by the seismic data (Fig. 3). NEG-2 ties at 30 with the Kanumas borehole at Site 13 located on the shelf (Table 2, Figs. 5f, g and S1). However, the Kanumas Site 13 does not provide any age constraints and NEG-2 has not been possible to correlate to any of the ODP sites.
The NEG-2 surface stretches between 79–75° N and 15–5° W, extending about 500 km across the entire outer Norske and Store Koldewey troughs and the adjacent bank areas (Fig. 6b). It extends 200 km from the palaeo-shelf edge in the west to the lower slope and rise in the east. The NEG-2 surface shows shelf progradation beyond that of NEG-1 at two distinct locations. The most pronounced shelf development is a ca. 100 km wide area at the central-northern Norske Trough where the shelf break propagates about 40 km towards the southeast in a fan-like shape, forming a bulge in the palaeo-surface (Fig. 6b). The top of the fan is flattened with a low relief SE-NW oriented trough central to it. The second distinct shelf break progradation of up to 60 km towards SE occurs within a ca. 150 km wide area on the outer IT-C bank and Store Koldewey Trough, where parts of it correspond to the present-day shelf edge position (Fig. 6b).
4.1.3 Regional Unconformity 3 (Early Pliocene: 4.1 Ma)
The NEG-3 reflection is stratigraphically situated between the NEG-2 reflection and the present-day seafloor. It is characterized by a strong continuous reflection with an opposite polarity to that of the seafloor (Figs. 3 and 4). The reflection marks a distinct unconformable boundary at the outer Norske Trough and adjacent upper slope where overlying prograding reflections terminate by downlap onto NEG-3, whereas underlying reflections has a conformable relation to it (Fig. 4c and d).
NEG-3 is correlated to ODP Site 909 in the Molloy Basin. The reflection ties with Site 909 at about 310 , corresponding to an Early Pliocene age of 4.1 Ma when plotted against the age model by Gruetzner et al. (2022), ranging between 4.5–3.8 Ma using a tie-depth uncertainty of ± 26 m (Table 2, Figs. 5b, c and S2). This is in agreement with our correlation into the Greenland Basin and ODP Site 913 where NEG-3 ties at 215 corresponding to a cored interval suggested to be of Pliocene to Pleistocene age (Myhre et al., 1995; Hull et al., 1996) (Table 2, Figs. 5d, e and S3).
NEG-3 is here correlated along most of the outer shelf and slope for about 750 km from Westwind Trough to IT-C bank and for 200 to 300 km across from the palaeo-shelf edge (NEG-1) into Molloy and Greenland basins (Fig. 6c). The NEG-3 surface shows that shelf progradation occurs along ca. 300 km of the palaeo-shelf, with a maximum shelf progradation of up to 50 km towards SE in Norske Trough and the IT-A bank, forming a straightened NE-SW oriented palaeo-shelf break (Fig. 6c and d). Consequently, NEG-3 completely buries the submarine plateau of low inclination as seen on the surface of NEG-1 and now forms a relatively even slope angle of higher inclination towards the Greenland Basin. NEG-3 also show expansion along ca. 150 km of the shelf further north on the northern part of IT-A bank and at the outer Westwind Trough, although to a lesser degree than that of Norske Trough.
4.2 Seismic Mega Units (MUs)
The regional reflections described above divide the base and top of three seismic mega units (MU-1 to MU-3). From bottom to top, these mega units correlate with time intervals from Late Miocene to recent as determined by regional correlation of the reflections. In a total thickness map where all mega units are combined, these three mega units form a massive deposit along the entire outer shelf with a maximum thickness of about 0.8 and 2.0 km (800–2000 ms TWT) below the present-day shelf edge, assuming an average velocity of 2.0 km s−1 in consolidated sediments (Figs. 6e and S4a in the Supplement).
4.2.1 Mega Unit-1 (Late Miocene)
The lowermost seismic mega unit (MU-1) is bounded by NEG-1 and NEG-2 at its base and top, respectively (Fig. 6f). It is characterized by seaward progradation of parallel reflections separating intervals of chaotic to transparent seismic facies (Figs. 3 and 4). The reflections taper out towards the east and terminate by downlap onto NEG-1, whereas the tops of the prograding reflections are clearly truncated by NEG-2. Two depocentres can be recognized from the isochron thickness map of MU-1 (Figs. 6f and S4b), corresponding to the distinct seaward buildout of the shelf as seen in the NEG-2 surface map (Fig. 6b). Both depocentres has a thickness of about 750 m (750 ms TWT) and are located on the outer part of Norske Trough and Store Koldewey Trough/IT-C, just seaward of the palaeo-shelf break of NEG-1. The rest of MU-1 is composed of ≤ 250 m (≤ 250 ms) thick eastward thinning sequences.
The cored interval between 30–114.9 at Kanumas Site 13 corresponds to the lowermost part and the onset of MU-1 (Figs. 5f, g and S3). This interval is dominated by a silt-borne diamictite interbedded with short intervals (< 1 m) of laminated silt-dominated sediments (Statoilhydro, 2008).
4.2.2 Mega Unit-2 (Late Miocene – Early Pliocene)
The middle seismic unit (MU-2) is defined by NEG-3 as its upper boundary which restricts its lateral extent, whereas the lower boundary is defined by NEG-2 in the outer part of Norske and Store Koldewey Trough and adjacent bank areas and defined by NEG-1 outside the interpreted extent of NEG-2 (Fig. 6a–d and g). MU-2 is characterized by both seaward prograding slope sequences and semi-horizontal to hummocky and lenticular top sequences. The prograding sequences are generally characterized by alternating parallel and chaotic to transparent seismic facies, similar to that of MU-1 (Figs. 3 and 4). The lower part of MU-2 forms a prograded fill pattern in the accommodation space above MU-1 and downlap onto NEG-2 on the inner part of the shelf (Fig. 4a and b). Eastward, the lower part of MU-2 downlap onto NEG-1 whereas the upper parts thin towards east and becomes dominated by semi-parallel reflection with a sheeted geometry (Figs. S1 and S2).
The isochron thickness map of MU-2 reveal two distinct depocentres (Figs. 6g and S4c) located at the: (1) outer Norske Trough and Store Koldewey Trough and adjacent bank areas from the southern IT-A bank to the outer IT-C bank. It measures up to 850 m (850 ms TWT) at its thickest at the southern part of Norske Trough, forming a prograding fill deposit in the accommodation space between the two depocentres earlier described from MU-1. (2) A partly divided depocentre is located on the outer Westwind Trough and northern IT-A bank with a maximum isochron thickness up to 900 m (900 ms TWT). Parts of this depocentre extends towards the Molloy Basin.
If we combine the total shelf progradation of MU-1 and MU-2, which show a maximum of 68 km shelf progradation towards southeast, we can assert a maximum shelf progradation rate of about 29 km Ma−1 in the period between 6.4 and 4.1 Ma.
4.2.3 Mega Unit-3 (Early Pliocene – Recent)
Seismic unit MU-3 is the uppermost unit defined between NEG-3 and the seafloor reflections at its base and top, respectively, and corresponds to an Early Pliocene (∼ 4.1 Ma) to recent age (Figs. 3–5). The internal seismic characteristics of MU-3 are similar to that of MU-2 and MU-1, generally consisting of seaward prograding slope sequences and semi-horizontal to hummocky and lenticular top sequences. The characteristics of the prograding sequence alternate between a parallel and chaotic to transparent signature. Analysis of internal reflections within this unit reveals that it represents a subtle shift in the prograding trajectory from southeast for MU-1 and MU-2 to south-southeast for MU-3. This is evident in along-shelf profiles as downlap-termination by internal reflections onto NEG-3 and in cross-shelf profiles by a reduced spacing between individual reflections (Figs. 3 and 4).
The isochron thickness map (Figs. 6h and S4d) show that this unit is a coherent, thick deposit stretching along the entire studied outer shelf, with its thickest parts positioned underneath the present-day shelf edge. Four distinct depocentres can be recognized: (1) The unit is at its thickest at the outer Westwind Trough and northernmost IT-A bank, measuring up to 1.4 km (1400 ms TWT). The depocentre is slightly elongated oriented along shelf, with a tail of increased thickness stretching into the Molloy Basin. (2) A slightly elongated fan-shaped depocentre oriented parallel to the shelf edge is located on the central outer IT-A bank, measuring up to 1.0 km (1000 ms TWT) thickness. (3) A particularly elongated depocentre oriented along shelf in the outer Norske Trough and surrounding areas (IT-A and IT-B), measures up to 1.3 km (1300 ms TWT) thickness. (4) The southernmost depocentre located on the slope outside of IT-C and Store Koldewey Trough, measures up to 1.1 km (1100 ms TWT) thickness. The full size and lateral distribution of this depocentre is not clear as this area suffers from poor data coverage, in addition to strong seafloor multiples on the shelf, making the lateral correlation of shallow reflections uncertain. The shelf deposits on the IT-C bank are dominated by aggrading reflections.
MU-3 has a maximum shelf progradation of about 61 km within outer Norske Trough, providing a maximum shelf progradation rate of about 15 km Ma−1 for the period 4.1 Ma to recent.
4.3 Interpretation: glaciogenic deposits
This study has mapped out three regional seismic mega units (MU-1 to MU-3) which are dominated by shelf progradation. The mega units are bounded by key unconformable reflections (NEG-1 to NEG-3). NEG-1 is interpreted as a regional unconformity that marks a shift from predominantly aggrading units below to major shelf progradation above. In Norske Trough and towards the Greenland Basin, NEG-1 generally corresponds to a strong unconformity, also interpreted by previous studies (Hamann et al., 2005; Berger and Jokat, 2008, 2009; Petersen, 2021; López-Quirós et al., 2024), termed the Intra Miocene-Unconformity (IMU) by Døssing et al. (2016) (Fig. 2). In Molloy Basin the NEG-1 reflection corresponds to MB07 identified by Gruetzner et al. (2022) (Figs. 2c and 5).
Kanumas Site 13 penetrates the lower part of seismic MU-1, documenting that this interval of inclined semi-parallel and semi-continuous seismic facies is dominated by matrix-supported diamictite (Figs. 5f g and S1), consistent with an ice-proximal depositional environment (Laberg and Vorren, 1995; Dowdeswell and Elverhøi, 2002). We interpret the chaotic to semi-transparent seismic faces found within the prograding foresets as glaciogenic debris flow deposits, indicating periods when grounded glacial ice extended all the way to the palaeo-shelf edge during glacial maxima conditions (Laberg and Vorren, 1995; Vorren and Laberg, 1997; Dahlgren et al., 2002; Dahlgren et al., 2005). In line with this, we interpret MU-1 to be of glacial origin, based on the fan-shaped geometry of the depocentres, their location within cross-shelf troughs or in vicinity to troughs and internal seismic facies of inclined parallel to chaotic character which core data indicates to be an ice-proximal sedimentary deposit. Altogether, seismic units MU-1, MU-2 and MU-3 forms a prograding wedge of glaciogenic sediments following the definition of Dahlgren et al. (2005). Similar characteristics of shelf prograding seismic units have been interpreted to indicate historical shelf glaciations from both hemispheres (Cooper et al., 1991; Nielsen et al., 2005; Tripsanas and Piper, 2008; Ottesen et al., 2009). NEG-2 is interpreted as an unconformable boundary that separates MU-1 from the overlying seismic mega units. On the palaeo-shelf, NEG-2 represents an erosional surface.
The aggrading medium to high amplitude topsets of hummocky/lenticular to semi-horizontal seismic character observed in MU-2 and MU-3 are interpreted as alternating deformation till deposited during glaciations and marine/glacimarine sediments deposited during interglacials and/or glaciations that did not reach the shelf edge. Preserved aggrading topsets from other formerly glaciated shelves have been suggested to indicate syn-depositional subsidence of the outer margin due to sediment loading (Dahlgren et al., 2002; Dahlgren et al., 2005), a similar process may have facilitated preservation of aggrading topsets on the NE Greenland shelf. The prograding foresets of MU-2 and MU-3 share characteristics to that of the underlying MU-1, and the thickness maps of both units show that the main depocentres are elongated along-slope, have a fan shaped geometry and most are located within cross-shelf troughs. We therefore interpret both MU-2 and MU-3 to be predominantly deposited during shelf glaciations. NEG-3 is interpreted as a regional unconformity traced along the outer shelf to the adjacent basins and does not correspond to any previously interpreted horizons in the study area. On the shelf, NEG-3 is locally interpreted as an erosional surface.
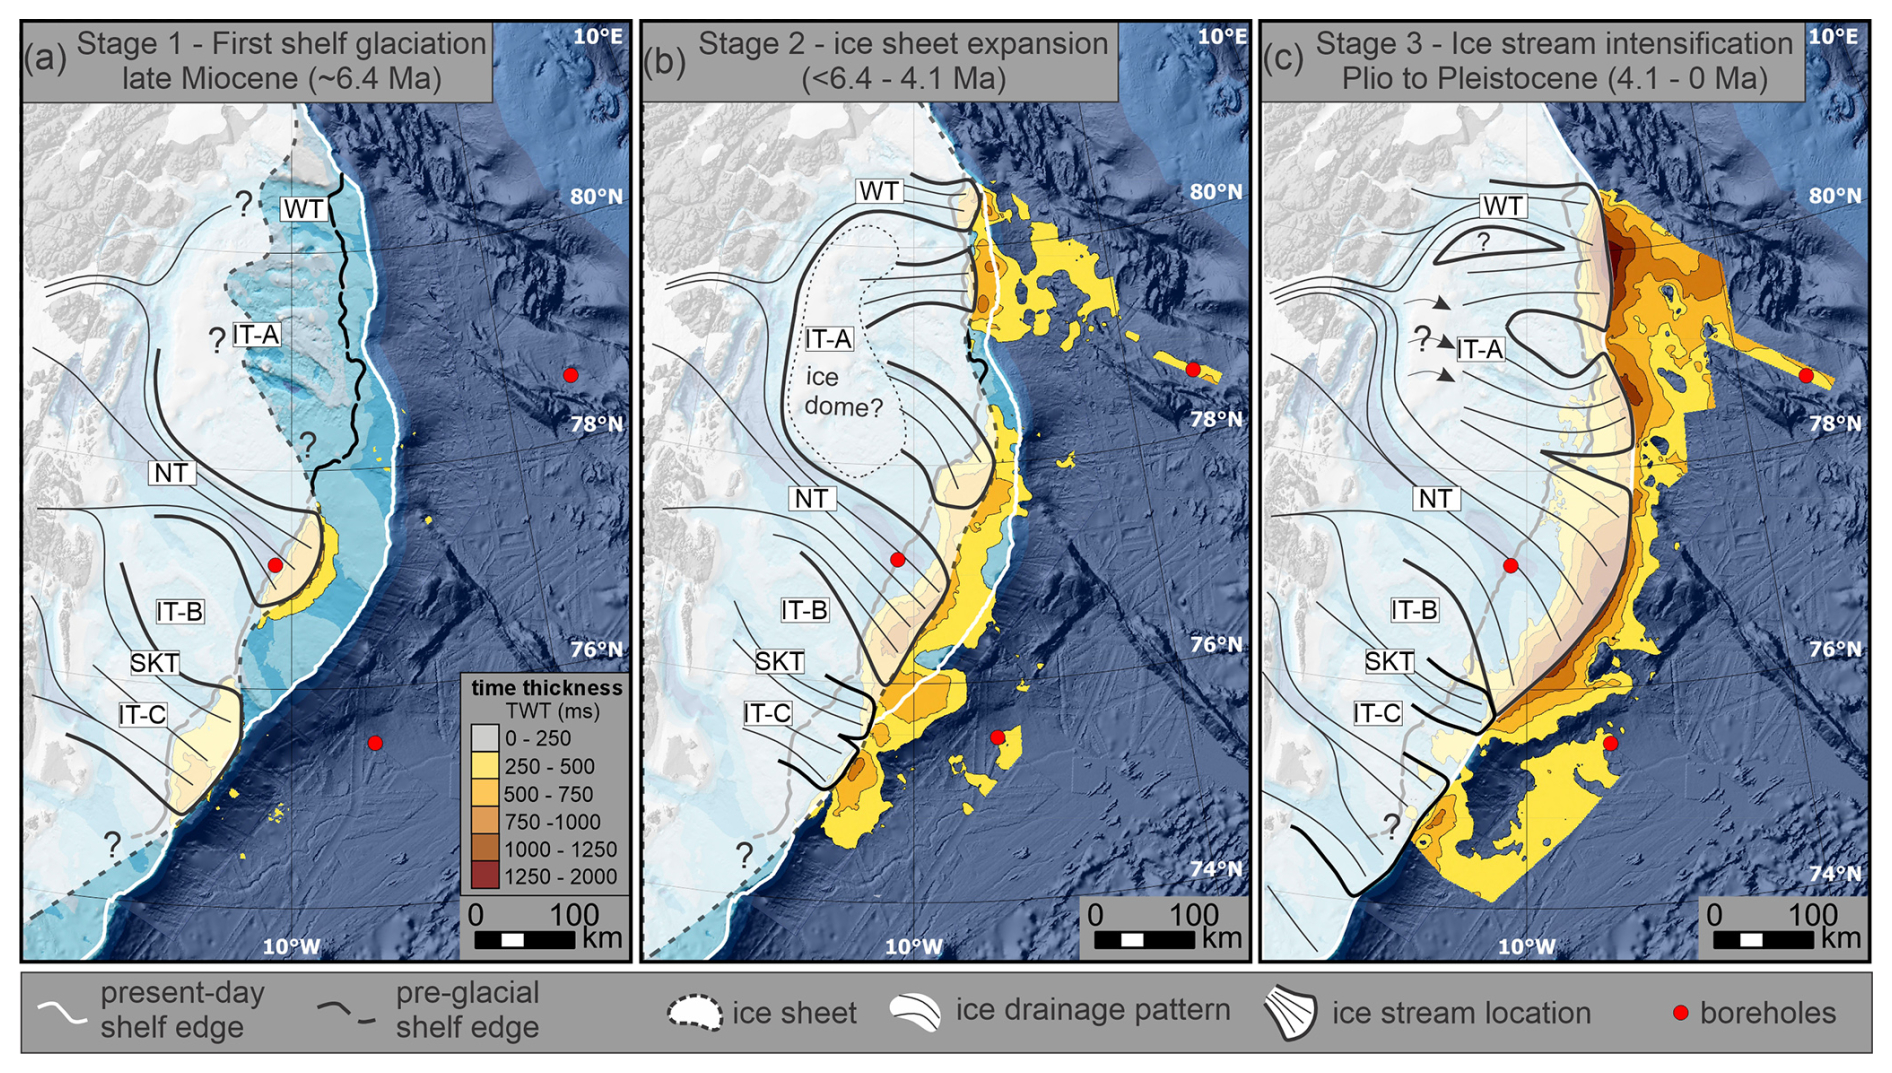
Figure 7Three stage conceptual sketch of the ice sheet configuration and drainage pattern on the NE Greenland shelf from Late Miocene to Plio–Pleistocene. The ice sheet and respective ice streams are overlain on the time-thickness maps from this study. (a) Stage 1 – the first shelf glaciation reaching the palaeo-shelf edge that can be observed in the seismic stratigraphic record, occurring around 6.4 Ma. (b) Stage 2 – Between Late Miocene to Early Pliocene the ice sheet advanced multiple times across the shelf, with an expanded ice margin towards north and east compared to Stage 1. (c) Stage 3 – Intensified ice streaming starts sometime after 4.1 Ma, indicated by major changes in ice sheet configuration and frequent shelf glaciations of the Greenland Ice Sheet.
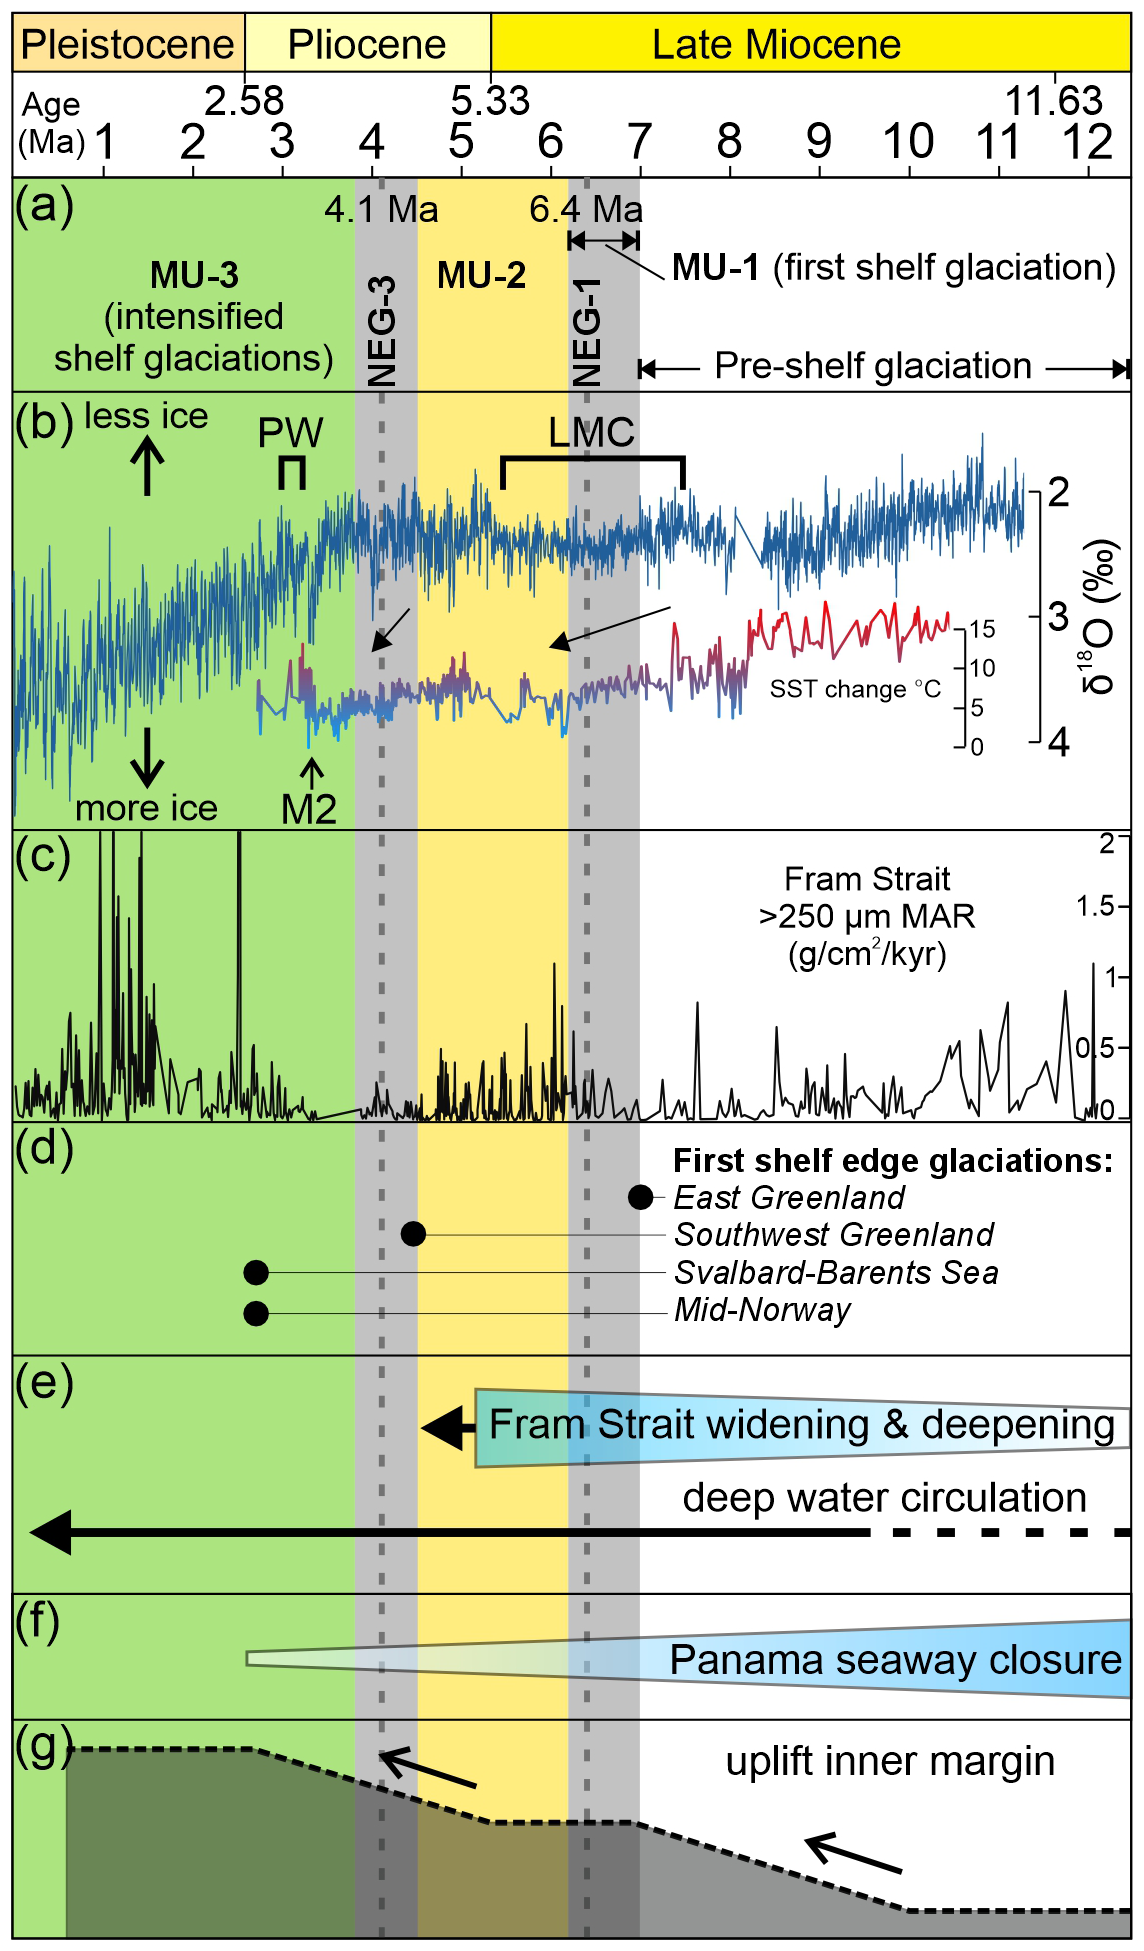
Figure 8Chronological correlation of climatic, glacial and tectonic events to the major stratigraphical changes we describe in this study. (a) Seismic mega units (MU) mapped in this study with their respective bounding horizons (dashed line) and estimated error margin (gray background). (b) PW: mid-Piacenzian warmth (ca. 3.3–3.0 Ma). LMC: Late Miocene cooling (ca. 7.5–5.5 Ma). M2: Marine isotope stage M2 (ca. 3.3 Ma). Pacific benthic foraminiferal δ18O spanning 0–11.5 Ma modified from Miller et al. (2020). SST change: sea surface temperature changes from the Norwegian Sea spanning 10.5–2.86 Ma modified from Herbert et al. (2016). Arrows highlights trends of δ18O and SST at the intervals corresponding to our key reflections. (c) IRD mass accumulation rates (MAR) from ODP Site 909 in the Fram Strait modified from Wolf-Welling et al. (1996). (d) Black circles mark the oldest known records of shelf edge glaciations off Blosseville Kyst, East Greenland at ca. 7 Ma (Pérez et al., 2018), Southwest Greenland at ca. 4.6 Ma (Nielsen and Kuijpers, 2013), Svalbard–Barents Sea (Knies et al., 2009) and Norwegian margin at 2.7 Ma (Eidvin et al., 1993). (e) Oceanographic setting in the Fram Strait, eventually allowing deep water circulation after around 9.8 Ma (Engen et al., 2008). (f) Closure of the Panama Seaway 13–2.6 Ma (Lunt et al., 2008). (g) Late Miocene and Early Pliocene tectonic uplift of the inner NE Greenland margin (Døssing et al., 2016; Bonow and Japsen, 2021).
5.1 NE Greenland Ice sheet development since the Late Miocene
Based on the regional correlation of key seismic reflections across the NE Greenland margin we have identified three seismic mega units that we interpret to reflect large scale ice sheet development on the NE Greenland shelf since the Late Miocene. The ice sheet development is characterized by changes in ice stream configuration across the shelf, represented by distinct depocentres and shelf progradation, marking the maximum extent of the GrIS within each interval, and are presented in our three-stage conceptual model (Fig. 7). In the following, we elaborate on our interpretations of each stage and discuss potential climatic and tectonic factors that have played a role in driving ice sheet changes since the Late Miocene. We ultimately compare our reconstruction of the long-time GrIS evolution with other ice sheets during this time period (Fig. 8).
5.1.1 Stage 1 – First shelf-edge glaciation (6.4 Ma)
Here we interpret MU-1 to mark the first recorded advance of grounded ice masses across the NE Greenland shelf (Fig. 7a). The sedimentological descriptions, internal seismic facies and fan-shaped morphology of the MU-1 depocentres are all characteristic of TMFs, formed at the terminus of former ice streams reaching the shelf edge. These ice streams deposit vast amounts of glaciogenic sediments at their margin which are subsequently reworked downslope, eventually forcing progradation of the shelf over time and are seen on other formerly glaciated shelves (Laberg and Vorren, 1995, 1996; Vorren and Laberg, 1997; Dahlgren et al., 2005; Nielsen et al., 2005; Nygård et al., 2005; Lien et al., 2022). The base of MU-1 is constrained to 6.4 Ma (ranging between 7.0–6.2 Ma) by NEG-1 and corresponds to generally decreasing sea surface temperatures (SSTs) in the North Atlantic (Herbert et al., 2016) and increasing occurrences of IRD in the Fram Strait (Fig. 8a–c) (Wolf-Welling et al., 1996; Gruetzner et al., 2022). The complete timeframe of MU-1 is uncertain as there are no upper age constraints for this unit. However, we suggest it was deposited during an interval, and not a single event. We favour a Late Miocene age for MU-1, likely corresponding to the interval of increased occurrences of IRD in the Fram Strait and the last half of the Late Miocene cooling (LMC; ca. 7.5–5.5 Ma).
The two TMFs of MU-1 are laterally constrained to the central-northern part of Norske Trough and to the southern part of Store Koldewey Trough and outer IT-C bank (Fig. 6b and f). This suggests that the location of active ice streaming was relatively stable during deposition of MU-1, possibly constrained by the pre-glacial topography. The thickness map of MU-1 indicates that the ice streams operating in Norske Trough and Store Koldewey Trough, feeding these TMFs, may have been up to 100–150 km wide. Given their similarity to other large TMFs described around the Greenland and Barents Sea margins (Vorren and Laberg, 1997; Batchelor and Dowdeswell, 2014), this suggests a similar dimension of ice streaming during Late Miocene as to that of Plio–Pleistocene ice streams. Between the two TMFs there is a thin but continuous deposit with minor shelf progradation along the palaeo-shelf edge. This is here interpreted to indicate a coherent ice margin reaching the shelf edge at the IT-B bank, between the two ice streams, although, possibly dominated by stagnant, cold based ice that prevented active ice streaming (Figs. 7 and S4b). No shelf progradation is evident north of Norske Trough within MU-1, possibly indicating that the ice sheet did not reach the palaeo-shelf edge at the IT-A bank or that the ice was cold based and did not transport any significant amount of sediments to its margin.
5.1.2 Stage 2 - Late Miocene ice sheet expansion (< 6.4–4.1 Ma)
The lateral distribution of MU-2 is much greater than MU-1, with depocentres located outside both Norske Trough (and surrounding areas) and Westwind Trough that are interpreted as TMFs. MU-2 is thus interpreted to represent a northward and eastward expansion of the former GrIS, occurring between the Late Miocene to Early Pliocene (< 6.4–4.1 Ma) (Figs. 7b and 8). MU-2 must be somewhat younger than MU-1. Hence, the base of MU-2 may correspond to a peak in IRD occurrences in the Fram Strait around 6.0 Ma (Fig. 8a–c) (Wolf-Welling et al., 1996; Gruetzner et al., 2022). The IRD occurrence gradual decrease during the last half of the LMC, interrupted by several IRD peaks of decreasing amplitude. The period between ca. 4.7–4.0 is characterized by low amplitude IRD pulses in the Fram Strait, although with an increasing trend towards the end of this period (Gruetzner et al., 2022). IRD pulses are also described in sediment records from the Norwegian Sea dated to the end of the same period (4.35–4.0 Ma) (Bachem et al., 2017).
Outside Westwind Trough and northern IT-A bank, the thickness map of MU-2 shows two barely connected depocentres, possibly indicating two ice streams operating in this area during the deposition of this unit: one draining through the Westwind Trough, and another draining ice from the northern IT-A bank (Fig. 7b). The suggested ice streams contributed to minimal shelf progradation, perhaps due to the steeply inclined palaeo-surface off Westwind Trough and northern IT-A bank (Fig. 6a and c). The largest depocentre of MU-2 stretches across the entire width of Norske and Store Koldewey troughs and onto the adjacent bank areas. The thickest part of this depocentre indicates that the greatest sediment deposition and possibly most intense ice streaming, was located on the southern part of Norske Trough, between the two depocentres of MU-1 (Fig. 7a and b), therefore indicating a slight switching of ice streaming position between deposition of MU-1 and MU-2. The broadening of the depocentre on the southern IT-A bank, seismically characterized by prograded fill sourced from the NW (Fig. 4a and b), indicates ice streams draining from the IT-A bank towards the SE, depositing sediments in the accommodation space north of Norske Trough. The ice stream operating in Store Koldewey Trough and IT-C bank during deposition of MU-1 seems to have been slightly reduced or reorganized during deposition of MU-2 (Fig. 7a and b). The low sediment thickness on the palaeo-slope outside of the central IT-A bank may indicate that the ice sheet did not reach the shelf edge at this location or that ice reaching the shelf edge was cold based, with little sediment transportation towards the shelf edge during this period. We expect that any glacial sediments deposited on the bank would have been removed by successive glaciations.
Altogether, MU-2 tells a story of a laterally expanding GrIS towards the north and east that covered large parts of the shelf, with active ice streaming in the two northernmost troughs and on the banks. Whether the ice streams on the IT-A bank were sourced by a local ice dome on the inner, shallowest part of the shelf or by overflowing ice from the continental GrIS is unknown. Abundant salt diapirs subcrop the seafloor on the central and inner part of the IT-A bank (Fyhn et al., 2021), and it is possible that doming of the bank by protruding salt may have facilitated the formation of a local ice dome. Arndt et al. (2015) speculated that such an ice dome could have been supported by low sea level stands during glaciations. We do not know whether the ice streams we propose on the IT-A bank were active simultaneously. However, our findings show that dynamic grounded ice was established both in the troughs and on the IT-A bank already during the Late Miocene and continued into the Early Pliocene.
5.1.3 Stage 3 - Major change in ice sheet configuration (4.1–0 Ma)
Following the deposition of MU-2 we see a change in the depositional pattern on the outer shelf and slope marked by a Pliocene unconformity, NEG-3 (4.1 Ma). MU-3 is comprised of thick, coherent sedimentary deposits, representing intense shelf progradation and deposition of multiple TMFs from after 4.1 Ma to recent time (Figs. 6h and 7c). The shelf trajectory off Norske Trough slightly differs from the previous MU-1 and MU-2, creating the unconformity seen in the seismic data (Figs. 3 and 4c, d). Thus, we speculate that NEG-3 represents a depositional hiatus or a condensed section of lower sedimentation rates of an unknown duration, possibly representing warm interglacial environment, supported by lower benthic foraminifera oxygen isotope values and elevated SSTs bracketing the colder 4.0–4.3 Ma interval (Fig. 8b) (De Schepper et al., 2015; Herbert et al., 2016; Bachem et al., 2017). The boundary between MU-2 and MU-3 corresponds to a small IRD peak in the Fram Strait at around 4.1 Ma (Fig. 8c) (Wolf-Welling et al., 1996; Gruetzner et al., 2022) and coincides with low SSTs in the Nordic Seas (Fig. 8b) (De Schepper et al., 2014; De Schepper et al., 2015; Herbert et al., 2016). This event may coincide with the first glacial episode recorded in MU-3 or the termination of the last glaciation recorded in MU-2. The IRD flux through the Fram Strait between 3.9–3.4 Ma is uncertain, but records from the Norwegian Sea show low IRD counts for this interval (Bachem et al., 2017). IRDs in the Fram Strait is again reported to increase from ca. 3.3 Ma, with the first major peak at the Plio–Pleistocene boundary and high IRD flux throughout most of Pleistocene (Fig. 8c) (Wolf-Welling et al., 1996; Gruetzner et al., 2022).
The thickest parts of MU-3 indicate the locations that have been dominated by ice streams during deposition, with the most intense ice streaming occurring across the whole width of the present-day Norske Trough and Westwind Trough (Figs. 6 and 7c). In contrast to MU-2, the MU-3 depocentre outside Westwind Trough forms a single continuously thick deposit that stretches the whole width of Westwind Trough and parts of the northern IT-A bank. This may indicate that ice streams operating in both Westwind Trough and on the IT-A bank during this period terminated in close proximity to each other or alternatively, if they operated contemporaneously, merged close to the shelf edge forming a single TMF. A shallower area on both the present day and palaeo-seafloor central on the northern IT-A bank may have acted as a barrier, dividing the two ice streams operating in Westwind Trough and on IT-A bank further in on the shelf (Fig. 7c). However, based on our current dataset we cannot distinguish whether this TMF was deposited during synchronous ice streaming in both areas and if they were active during different time periods.
The operation of ice streams on the bank is confirmed by the depocentre located central on outer IT-A bank. This depocentre indicates that ice streams have drained eastwards from central IT-A bank, turning slightly towards the NE close to its terminus at the shelf edge, where it formed a TMF, seen as a bulge in the present-day shelf at this location (Figs. 6d, h and 7c). The depocentre on outer Norske Trough and southern IT-A bank is testament to widespread and probably reoccurring ice streaming within the trough, through many glacial cycles, forming a massive and coherent TMF.
Interestingly, at this scale, Store Koldewey Trough does not stand out with its own separate depocentre within MU-3, instead, the elongated depocentre from Norske Trough stretches south and covers most of the outer Store Koldewey Trough (Fig. 7b). Thus, any deposits originating from an ice stream operating in Store Koldewey Trough may have extended the depocentre of Norske Trough towards the south. Additionally, this may indicate that the role of the contemporary Store Koldewey Trough as an ice stream conduit during the Late Pliocene and the whole of the Pleistocene was relatively small. A possible explanation for this is that the Store Koldewey Trough as seen today formed relatively recently, possibly during the last few glaciations. This is supported by our observations that the main sediment delivery, and therefore ice streaming, across the shelf in this area actually seems to have occurred across the IT-C bank (MU-1 and MU-2), just south of Store Koldewey Trough, and not within the present-day trough itself (Fig. 7a–c).
The southernmost depocentre mapped in this study is located on the upper slope off IT-C bank. Our results suggest that the main sediment contribution came from ice streams on the IT-C bank, or possibly further south (Fig. 7c). Alternatively, it can be a drift deposit, deposited by southward flowing bottom currents which might have remobilized the smaller grain size fractions from glaciogenic deposits further north. The shelf deposits on IT-C are dominated by aggrading semi-horizontal strata, possibly indicating that the ice streaming across IT-C bank had ceased by deposition of MU-3.
5.2 Greenland ice sheet history in a global context
5.2.1 Late Miocene (11.63–5.33 Ma)
Deep-marine sedimentary records of sporadic IRDs from the Norwegian–Greenland Sea indicate ephemeral glacial ice in Greenland already during Eocene and Oligocene times (Eldrett et al., 2007; Tripati et al., 2008). After 12–11 Ma, sediment records from this region indicates more or less continuous IRD in the deep marine environment (Fig. 8c) (Fronval and Jansen, 1996; Thiede et al., 2011; Gruetzner et al., 2022). This suggests that parts of the benthic δ18O enrichments and sea level falls following this period (Fig. 8b) (Miller et al., 2020) can be attributed to Late Miocene Northern Hemisphere ice sheet growth, a time when global SSTs were declining (Herbert et al., 2016). Lithological analysis of the IRD has suggested Greenland as the main source area for northern North Atlantic IRD (Bierman et al., 2016), but also Svalbard and the northern Barents Sea have been suggested to have contributed with ice rafting through the Fram Strait from around 11 Ma (Knies and Gaina, 2008; Gruetzner et al., 2022). This indicates ice sheet growth or local coastal glaciers on both sides of the Fram Strait large enough to reach sea level.
Seismostratigraphic studies on the Southeast and East Greenland margin have shown that massive shelf progradation initiated around 7 Ma (Larsen et al., 1994; Pérez et al., 2018), simultaneously with increased accumulation of IRD in the adjacent deep ocean basins (St John and Krissek, 2002). These records provide indirect evidence of an ice sheet or coastal glaciers terminating at sea level, but no further constraints on ice sheet extent. As a result of these observations, SE Greenland was initially suggested as a nucleation site for the early growth of the GrIS and marine terminating coastal glaciers (Larsen et al., 1994; St John and Krissek, 2002), causing higher sedimentation rates on the shelf and iceberg production carrying IRDs towards the deep ocean basins. The onset of shelf progradation in NE Greenland has previously been estimated to be of Middle to Late Miocene age (∼ 15 Ma) (Berger and Jokat, 2008), and the onset of shelf glaciations was proposed to occur later, around 7 Ma (Berger and Jokat, 2009), based on comparison of seismic units along the eastern Greenland margin and the age model proposed by Larsen et al. (1994). However, this study shows that the timing of shelf progradation and the first shelf glaciations coincides on the NE Greenland shelf and occurred around 6.4 Ma (age uncertainty ranging between 7.0–6.2 Ma), closely aligned with that of Southeast and East Greenland (Larsen et al., 1994; Pérez et al., 2018). Moreover, compared to our results, the horizon which Berger and Jokat (2009) used to define the onset of shelf glaciations (R2; suggested to 7 Ma) is stratigraphically situated above NEG-3 (4.1 Ma, ranging between 4.5–3.8 Ma), and should therefore correspond to a Plio–Pleistocene age, rather than a Late Miocene age. Thus, our findings improve the age estimation of the onset of shelf progradation and add new and rare information on the extent and dynamics of the Late Miocene GrIS and confirm that Late Miocene ice sheet grew large enough to cross the shelf also in NE Greenland. This has implications for modelling of the Late Miocene GrIS ice budget and its effect on the global sea level budget which has not yet been constrained for this period and is probably much higher than anticipated (Miller et al., 2020). Furthermore, based on the currently available research discussed here and our new observations from NE Greenland, we may hypothesise that the entire eastern margin led the onset of shelf glaciation on Greenland by about 2 million years and led the rest of the Northern Hemisphere by almost 4 million years prior to the Plio–Pleistocene intensification at 2.7 Ma.
5.2.2 Pliocene (5.33–2.58 Ma)
The Miocene–Pliocene transition is generally characterized by decreasing benthic δ18O values and rising sea levels, indicating warmer climate and reduced global ice volume in the Pliocene, accompanied by higher pCO2 concentrations in the atmosphere (Fig. 8b) (Miller et al., 2020). However, despite the relative Early Pliocene warmth, the presence of a GrIS is evident by continuous records of IRDs in the northern North Atlantic and Norwegian–Greenland Sea throughout the Pliocene (Fronval and Jansen, 1996; Bierman et al., 2016; Bachem et al., 2017; Gruetzner et al., 2022). Moreover, debris flow deposits from a marine sediment core (ODP Site 987) off the Scoresby Sund fan were interpreted to indicate glacial advance across the shelf at around 5 Ma (Butt et al., 2001), whilst similar deposits offshore SW Greenland are suggested to mark first glacial advance across this shelf sector around 4.5 Ma (Fig. 8d) (Nielsen and Kuijpers, 2013). Consistent with our results, these observations support the notion that the GrIS reached the shelf across NE, E and SW Greenland during the Early Pliocene, corresponding to our seismic mega unit MU-2 (Fig. 8).
De Schepper et al. (2014) synthesized terrestrial and marine evidence of Pliocene glaciations in the Northern and Southern Hemispheres and concluded that four major glacial expansions occurred globally around 4.9–4.8, 4.0, 3.6 and 3.3 Ma, falling within the timeframe of our seismic units MU-2 and MU-3 (Fig. 8). At 4.9–4.8 Ma the Greenland and Scandinavian ice sheets were main contributors to northern North Atlantic IRD, with additional inputs from North America and the Svalbard–Barents Sea region by 4.0 Ma (De Schepper et al., 2014) indicating conditions that increasingly favour ice sheet growth in the Northern Hemisphere, despite the relatively warm Pliocene climate. This is consistent with our findings that indicate multiple advances of the GrIS across the NE Greenland shelf through the Pliocene and a change in the ice sheet configuration and intensification of ice streaming across the shelf, here suggested after 4.1 Ma (ranging between 4.5–3.8 Ma). However, the Pliocene unconformity (NEG-3) identified in this study only provides a maximum age of MU-3, thus the exact timing of intensification across the shelf is not fully known, as we cannot rule out that NEG-3 marks a hiatus or a period of low sedimentation rates.
From 3.6 Ma and onwards, the global ice volume increased, culminating at ca. 3.3 Ma during marine isotope stage M2, recognized as the first major marine isotope enrichment during the Late Pliocene (Fig. 8b) (Lisiecki and Raymo, 2005; De Schepper et al., 2014; Miller et al., 2020), corresponding to low SSTs in the Nordic Seas (De Schepper et al., 2015; Herbert et al., 2016; Bachem et al., 2017). This period marks a transitional phase before the onset of the intensification of the Northern Hemisphere glaciations (iNHG) at 2.7 Ma (De Schepper et al., 2014). Thus, a possible minimum age of MU-3 may be of Late Pliocene age (3.6–2.7 Ma), coinciding with the onset of the iNHG and the initiation of shelf glaciations on e.g. the Svalbard–Barents Sea (Knies et al., 2009; Mattingsdal et al., 2014; Alexandropoulou et al., 2021) and Norwegian margin (Fig. 8d) (Eidvin et al., 1993; Ottesen et al., 2009). Remnants of spruce and thuja and relatively temperate marine biomarkers of Late Pliocene age are described from raised marine sediments on Île de France, an island located in NE Greenland (Bennike et al., 2002). These indicate periodically higher-than-present air temperatures and an ice-free coastline during the Late Pliocene, corroborating that MU-3 was not deposited by continuous shelf glaciations since 4.1 Ma, but rather episodic and intense advances of the GrIS. This is consistent with the stratigraphy of the Kap København Formation in Northern Greenland, where shallow marine successions are situated between till beds, indicating warmer interglacial periods in Late Pliocene and Early Pleistocene (Funder et al., 2001). However, the seismic correlations are limited without further drilling.
5.3 External forcings on Greenland Ice Sheet growth
The response of ice sheets to external forcings is extremely complex, but key to understand past and future scenarios to a changing climate. The warmer climate during the Pliocene seems contradictory to ice sheet growth in general and to shelf-wide, marine terminating ice sheets especially. Yet, persistent circum-arctic glaciers reaching the coast through much of the Late Miocene and the whole of the Pliocene is indicated by consistent IRD records in northern North Atlantic marine sediment cores (Knies and Gaina, 2008; Bierman et al., 2016; Gruetzner et al., 2022; Lucchi et al., in press 2026). This study has improved our age constraints for the onset of shelf glaciations and for the first time shown detailed evidence of the ice sheet extent and dynamics across the NE Greenland continental shelf since the Late Miocene. Following is an overview of key external forcings that possibly facilitated ice sheet growth in Greenland during the Late Miocene and Pliocene (Fig. 8).
Oceanographic factors play a key role in regulating regional temperatures and precipitation, potentially affecting regional and global ice budgets, thus the Fram Strait is a key oceanic gateway with respect to the NE Greenland and Svalbard margins (Fig. 1). Opening of the Fram Strait commenced in the Early Miocene (Jokat et al., 2016) and deep water exchange was established by latest Early Miocene (17 Ma) (Jakobsson et al., 2007; Ehlers and Jokat, 2013; Jokat et al., 2016) or possibly Late Miocene (9.8 Ma) (Engen et al., 2008), when it became wide and deep enough to allow deep water circulation (Fig. 8e). Eventually, the opening of the Fram Strait allowed transportation of warm water and moist air northwards along the West Spitsbergen Current, while the cold East Greenland Current flowed southwards and provided a cold-water barrier along eastern Greenland, potentially stabilizing ice sheets during the Late Miocene. The closure of the Panama seaway ∼ 13–2.6 Ma led to strengthening of the Atlantic thermohaline circulation and increased temperatures and precipitation in the Northern Hemisphere (Fig. 8f) (Lunt et al., 2008). The Middle and Late Miocene was a time of general global cooling in the wake of the Miocene Climatic Optimum (ca. 17–15 Ma). Reconstructions of global alkenone SSTs during the last 12 million years have shown that the SST cooling at mid to high-latitudes accelerated synchronous in both hemispheres in the latest Miocene (ca. 7.5–5.5 Ma) (Herbert et al., 2016). During that period, the SSTs decreased about 8 °C and were close to present-day temperatures (Fig. 8b), suggested to be driven by declining atmospheric pCO2 (Herbert et al., 2016). This period, referred to as the LMC, coincides with the onset of early shelf glaciations represented by MU-1 in this study. Knies and Gaina (2008) argued that the opening of the Fram Strait resulted in increased precipitation, coupled with general global cooling in the Late Miocene facilitated ice sheet growth in the northern Barents Sea and Svalbard at the time, and a similar coupling is likely for NE Greenland. Enhanced snowfall driven by sea ice loss during warm periods has recently been suggested as a mechanism to promote ice sheet growth and advance in Arctic settings (Auer et al., 2025). Sediment records from the central Arctic Ocean provided evidence for ice-free summers in the Late Miocene (Stein et al., 2016), hence a similar feedback mechanism may have played a crucial role on NE Greenland.
Moreover, circum-Arctic tectonic uplift has been proposed as a controlling factor for ice sheet growth and stability (Solgaard et al., 2013; De Schepper et al., 2014; Japsen et al., 2014; Knies et al., 2014). Indeed, Greenland experienced two kilometre-scale Neogene uplift events during the Late Miocene (∼ 10 Ma), and Early Pliocene (∼ 5 Ma) (Japsen et al., 2006; Japsen et al., 2014; Bonow and Japsen, 2021). Both events led to significant uplift of the eastern and NE Greenland inner margin (Fig. 8g) (Døssing et al., 2016; Bonow and Japsen, 2021). Solgaard et al. (2013) modelled the effect of Neogene tectonic uplift on ice sheet growth on Greenland, showing that increased precipitation together with decreased temperatures following higher elevation strongly promoted continental ice sheet growth along most of eastern Greenland. With present-day SSTs as input, the modelled GrIS quickly grew to cover large parts of the northern and eastern Greenland after the first Late Miocene uplifting event but struggled to cover the central and western parts of Greenland due to Föhn effect and a precipitation shadow in central and western Greenland. Subsequently, the model predicted that a GrIS could cover the whole of Greenland following the second uplift event in the Early Pliocene. The eastern extent of the modelled ice sheet is limited to the coast, but any uplift and potential subaerial exposure of the present-day shelf was not included in the model. Whether or not parts of the shelf in our study area ever were subaerial exposed is unknown, but not unthinkable, considering the very shallow depths on the inner parts of the IT-A bank (Fig. 1).
Considering that most of the modelled available precipitation is located along the east coast, and assuming that the elevated topography limited ice sheet drainage towards west, an eastward expansion of the GrIS across an uplifted shelf seems very likely and is in line with our newly presented observations of Late Miocene onset for shelf glaciation on NE Greenland. Thus, we argue that tectonic uplift coupled with changing oceanographic settings after opening of the Fram Strait and general global cooling during the LMC facilitated ice sheet growth along the entire eastern Greenland margin during the Late Miocene, culminating in the first advance of the GrIS across the NE Greenland shelf at around 6.4 Ma.
This study has defined three regional seismic mega units (MU-1, MU-2 and MU-3) on the Northeast Greenland margin, bounded by major unconformable horizons termed NEG-1, NEG-2 and NEG-3. The interpreted unconformable reflection NEG-1 correlates with the intra-Miocene Unconformity (IMU) interpreted by previous studies in the Greenland Basin. We have extended this horizon to the Molloy Basin and tied it to ODP Site 909 which yield an age of 6.4 Ma (ranging between 7.0–6.2 Ma).
MU-1 marks the onset of widespread shelf progradation during the Late Miocene around 6.4 Ma, driven by the first advance of grounded ice streams to the shelf edge, forming large TMFs on the upper palaeo-slope. The first ice streams to reach the shelf edge were located within Norske Trough and on the IT-C bank and southern part of Store Koldewey Trough, probably constrained by pre-glacial topography. The onset of shelf glaciation coincides with increased flux of IRD into the northern seas during the LMC, uplift of the inner margin, and increasing deep water circulation through the Fram Strait enabling northwards transport of moisture and cold water masses descending from the Arctic, promoting a stable ice sheet along eastern Greenland.
Our analysis reveal that ice streams continued to cross the shelf in Norske Trough multiple times during the Late Miocene and Early Pliocene (ca. 6.4–4.1 Ma), with additional ice streams operating in Westwind Trough and on the IT-A bank, indicating a dynamic Greenland Ice Sheet during this period with increased potential to expand across the shelf, possibly driven by the external forcings mentioned above.
A major change in ice sheet configuration post-dates the Pliocene unconformity here correlated to 4.1 Ma (ranging between 4.5–3.8 Ma). Whereas previous Greenland Ice Sheet expansions may have been more ephemeral and not covered the entire shelf, we now see evidence of a fully developed ice sheet that expands across the entire NE Greenland shelf, with widespread ice streaming documented on the banks and troughs. We hypothesise that the Pliocene unconformity (NEG-3) may represent a depositional hiatus or a condensed section deposited during an interglacial period with a possible minimum age of ∼ 3.6 to ∼ 2.7 Ma. Subsequently, the onset of intensified ice streaming across the NE Greenland shelf and deposition of MU-3 may coincide with the intensification of the Northern Hemisphere glaciations between ∼ 3.6 to ∼ 2.7 Ma.
Open access seismic data can be requested through the GNPDR portal or through the GEUS data archive. For permission to access the confidential industrial seismic data please contact TGS. Requests to access the AWI data should be directed to the Alfred Wegener Institute.
The supplement related to this article is available online at https://doi.org/10.5194/cp-21-2441-2025-supplement.
FWJ, MW, JSL, APF, ALQ and TN participated in the conceptualization of this study. FWJ carried out the investigation and prepared the manuscript with critical contributions from all co-authors. TN, CB, BB and SP contributed with data curation. MW, JSL and APF contributed with supervision.
The contact author has declared that none of the authors has any competing interests.
Publisher's note: Copernicus Publications remains neutral with regard to jurisdictional claims made in the text, published maps, institutional affiliations, or any other geographical representation in this paper. While Copernicus Publications makes every effort to include appropriate place names, the final responsibility lies with the authors. Views expressed in the text are those of the authors and do not necessarily reflect the views of the publisher.
We are grateful to AWI, TGS and GEUS for making seismic data available to this study. Partners at GEUS provided GXT surveys from 2010 and 2011 and helped to fix navigation issues with the Kanumas surveys. The AWI surveys used here were reprocessed by TGS in 2010. The remaining open access data are available through the GNPDR portal or through the GEUS data archive. Scientific colour maps courtesy of Crameri et al. (2020).
The work by FWJ, MW and APF forms a part of iC3: Centre for ice, Cryosphere, Carbon and Climate and were supported by the Research Council of Norway through the Centres of Excellence funding scheme, project number 332635. The work of CB has been funded by the European Union under Horizon Europe grant agreement no. 101060851 (GreenFlux). JSL acknowledge support from the Research Council of Norway through the DYPOLE project (grant no. 325984).
This paper was edited by Antje Voelker and reviewed by Renata Giulia Lucchi and Wolfram Geissler.
Alexandropoulou, N., Winsborrow, M., Andreassen, K., Plaza-Faverola, A., Dessandier, P.-A., Mattingsdal, R., Baeten, N., and Knies, J.: A continuous seismostratigraphic framework for the western Svalbard-Barents Sea margin over the last 2.7 Ma: implications for the late Cenozoic glacial history of the Svalbard-Barents Sea ice sheet, Front. Earth Sc.-Switz., 9, 656732, https://doi.org/10.3389/feart.2021.656732, 2021.
Arndt, J. E., Jokat, W., Dorschel, B., Myklebust, R., Dowdeswell, J. A., and Evans, J.: A new bathymetry of the Northeast Greenland continental shelf: Constraints on glacial and other processes, Geochem. Geophy. Geosy., 16, 3733–3753, https://doi.org/10.1002/2015gc005931, 2015.
Arndt, J. E., Jokat, W., and Dorschel, B.: The last glaciation and deglaciation of the Northeast Greenland continental shelf revealed by hydro-acoustic data, Quaternary Sci. Rev., 160, 45–56, https://doi.org/10.1016/j.quascirev.2017.01.018, 2017.
Auer, A. G., van der Bilt, W. G. M., Schomacker, A., Bakke, J., Storen, E. W. N., Buckby, J. M., Cederstrom, J. M., and van der Plas, S.: Hydroclimate intensification likely aided glacier survival on Svalbard in the Early Holocene, Commun. Earth Environ., 6, https://doi.org/10.1038/s43247-025-02064-z, 2025.
Bachem, P. E., Risebrobakken, B., De Schepper, S., and McClymont, E. L.: Highly variable Pliocene sea surface conditions in the Norwegian Sea, Clim. Past, 13, 1153–1168, https://doi.org/10.5194/cp-13-1153-2017, 2017.
Batchelor, C. L. and Dowdeswell, J. A.: The physiography of High Arctic cross-shelf troughs, Quaternary Sci. Rev., 92, 68–96, https://doi.org/10.1016/j.quascirev.2013.05.025, 2014.
Bennike, O., Abrahamsen, N., Bak, M., Israelson, C., Konradi, P., Matthiessen, J., and Witkowski, A.: A multi-proxy study of Pliocene sediments from Ile de France, North-East Greenland, Palaeogeogr. Palaeocl., 186, 1–23, https://doi.org/10.1016/S0031-0182(02)00439-X, 2002.
Berger, D. and Jokat, W.: A seismic study along the East Greenland margin from 72° N to 77° N, Geophys. J. Int., 174, 733–748, https://doi.org/10.1111/j.1365-246X.2008.03794.x, 2008.
Berger, D. and Jokat, W.: Sediment deposition in the northern basins of the North Atlantic and characteristic variations in shelf sedimentation along the East Greenland margin, Mar. Petrol. Geol., 26, 1321–1337, https://doi.org/10.1016/j.marpetgeo.2009.04.005, 2009.
Bierman, P. R., Shakun, J. D., Corbett, L. B., Zimmerman, S. R., and Rood, D. H.: A persistent and dynamic East Greenland Ice Sheet over the past 7.5 million years, Nature, 540, 256–260, https://doi.org/10.1038/nature20147, 2016.
Bonow, J. M. and Japsen, P.: Peneplains and tectonics in North-East Greenland after opening of the North-East Atlantic, GEUS B., 45, https://doi.org/10.34194/geusb.v45.5297, 2021.
Butt, F. A., Elverhoi, A., Forsberg, C. F., and Solheim, A.: Evolution of the Scoresby Sund Fan, central East Greenland – evidence from ODP Site 987, Norsk Geol. Tidsskr., 81, 3–15, 2001.
Cooper, A. K., Barrett, P. J., Hinz, K., Traube, V., Leitchenkov, G., and Stagg, H. M. J.: Cenozoic Prograding Sequences of the Antarctic Continental-Margin – a Record of Glacioeustatic and Tectonic Events, Mar. Geol., 102, 175–213, https://doi.org/10.1016/0025-3227(91)90008-R, 1991.
Crameri, F., Shephard, G. E., and Heron, P. J.: The misuse of colour in science communication, Nat. Commun., 11, https://doi.org/10.1038/s41467-020-19160-7, 2020.
Dahlgren, K. I. T., Vorren, T. O., and Laberg, J. S.: Late Quaternary glacial development of the mid-Norwegian margin—65 to 68° N, Mar. Petrol. Geol., 19, 1089–1113, https://doi.org/10.1016/S0264-8172(03)00004-7, 2002.
Dahlgren, K. I. T., Vorren, T. O., Stoker, M. S., Nielsen, T., Nygård, A., and Sejrup, H. P.: Late Cenozoic prograding wedges on the NW European continental margin:: their formation and relationship to tectonics and climate, Mar. Petrol. Geol., 22, 1089–1110, https://doi.org/10.1016/j.marpetgeo.2004.12.008, 2005.
De Schepper, S., Gibbard, P. L., Salzmann, U., and Ehlers, J.: A global synthesis of the marine and terrestrial evidence for glaciation during the Pliocene Epoch, Earth-Sci. Rev., 135, 83–102, https://doi.org/10.1016/j.earscirev.2014.04.003, 2014.
De Schepper, S., Schreck, M., Beck, K. M., Matthiessen, J., Fahl, K., and Mangerud, G.: Early Pliocene onset of modern Nordic Seas circulation related to ocean gateway changes, Nat. Commun., 6, https://doi.org/10.1038/ncomms9659, 2015.
Dowdeswell, J. A. and Elverhøi, A.: The timing of initiation of fast-flowing ice streams during a glacial cycle inferred from glacimarine sedimentation, Mar. Geol., 188, 3–14, https://doi.org/10.1016/S0025-3227(02)00272-4, 2002.
Dowdeswell, J. A., Ottesen, D., and Rise, L.: Flow switching and large-scale deposition by ice streams draining former ice sheets, Geology, 34, 313–316, https://doi.org/10.1130/G22253.1, 2006.
Døssing, A., Japsen, P., Watts, A. B., Nielsen, T., Jokat, W., Thybo, H., and Dahl-Jensen, T.: Miocene uplift of the NE Greenland margin linked to plate tectonics: Seismic evidence from the Greenland Fracture Zone, NE Atlantic, Tectonics, 35, 257–282, https://doi.org/10.1002/2015tc004079, 2016.
Ehlers, B. M. and Jokat, W.: Paleo-bathymetry of the northern North Atlantic and consequences for the opening of the Fram Strait, Mar. Geophys. Res., 34, 25–43, https://doi.org/10.1007/s11001-013-9165-9, 2013.
Eidvin, T., Jansen, E., and Riis, F.: Chronology of Tertiary fan deposits off the western Barents Sea: Implications for the uplift and erosion history of the Barents Shelf, Mar. Geol., 112, 109–131, 1993.
Eldrett, J. S., Harding, I. C., Wilson, P. A., Butler, E., and Roberts, A. P.: Continental ice in Greenland during the Eocene and Oligocene, Nature, 446, 176–179, https://doi.org/10.1038/nature05591, 2007.
Engen, O., Faleide, J. I., and Dyreng, T. K.: Opening of the Fram Strait gateway: A review of plate tectonic constraints, Tectonophysics, 450, 51–69, https://doi.org/10.1016/j.tecto.2008.01.002, 2008.
Evans, J., Cofaigh, C. O., Dowdeswell, J. A., and Wadhams, P.: Marine geophysical evidence for former expansion and flow of the Greenland Ice Sheet across the north-east Greenland continental shelf, J. Quaternary Sci., 24, 279–293, https://doi.org/10.1002/jqs.1231, 2009.
Fronval, T. and Jansen, E.: Late Neogene pateoclimates and paleoceanography in the Iceland-Norwegian Sea: evidence from the Iceland and Vøring Plateaus, Proceedings-Ocean Drilling Program Scientific Results, 151, 455–468, 1996.
Funder, S., Bennike, O., Böcher, J., Israelson, C., Petersen, K. S., and Símonarson, L. A.: Late Pliocene Greenland – The Kap Kobenhavn Formation in North Greenland, B. Geol. Soc. Denmark, 48, 117–134, 2001.
Funder, S., Kjeldsen, K. K., Kjær, K. H., and Cofaigh, C. Ó.: The Greenland Ice Sheet during the past 300,000 years: A review, Developments in Quaternary Sciences, 15, 699–713, https://doi.org/10.1016/B978-0-444-53447-7.00050-7, 2011.
Fyhn, M. B. W., Hopper, J. R., Sandrin, A., Lauridsen, B. W., Heincke, B. H., Nohr-Hansen, H., Andersen, M. S., Alsen, P., and Nielsen, T.: Three-phased latest Jurassic-Eocene rifting and mild mid-Cenozoic compression offshore NE Greenland, Tectonophysics, 815, https://doi.org/10.1016/j.tecto.2021.228990, 2021.
Geissler, W. H., Jokat, W., and Brekke, H.: The Yermak Plateau in the Arctic Ocean in the light of reflection seismic data-implication for its tectonic and sedimentary evolution, Geophys. J. Int., 187, 1334–1362, https://doi.org/10.1111/j.1365-246X.2011.05197.x, 2011.
Gruetzner, J., Matthiessen, J., Geissler, W. H., Gebhardt, A. C., and Schreck, M.: A revised core-seismic integration in the Molloy Basin (ODP Site 909): Implications for the history of ice rafting and ocean circulation in the Atlantic-Arctic gateway, Global Planet. Change, 215, https://doi.org/10.1016/j.gloplacha.2022.103876, 2022.
Hamann, N. E., Whittaker, R. C., and Stemmerik, L.: Geological development of the Northeast Greenland Shelf, in: Petroleum Geology: North-West Europe and Global Perspectives – Proceedings of the 6th Petroleum Geology Conference, edited by: Doré, A. G. and Vining, B. A., Geological Society of London, 6, https://doi.org/10.1144/0060887, 2005.
Helland, P. E. and Holmes, M. A.: Surface textural analysis of quartz sand grains from ODP Site 918 off the southeast coast of Greenland suggests glaciation of southern Greenland at 11 Ma, Palaeogeogr. Palaeocl., 135, 109–121, https://doi.org/10.1016/S0031-0182(97)00025-4, 1997.
Herbert, T. D., Lawrence, K. T., Tzanova, A., Peterson, L. C., Caballero-Gill, R., and Kelly, C. S.: Late Miocene global cooling and the rise of modern ecosystems, Nat. Geosci., 9, 843–847, https://doi.org/10.1038/Ngeo2813, 2016.
Hull, D. M., Osterman, L. E., and Thiede, J.: Biostratigraphic Synthesis of Leg 151, North Atlantic-Arctic Gateways, in: Proceedings of the Ocean Drilling Program, Scientific Results 151, edited by: Thiede, J., Myhre, A. M., Firth, J. V., Johnson, G. L., and Ruddiman, W. F., Texas A & M University, Ocean Drilling Program, College Station, TX, United States, 627–644, https://doi.org/10.2973/odp.proc.sr.151.146.1996, 1996.
Hvidberg, C. S., Grinsted, A., Dahl-Jensen, D., Khan, S. A., Kusk, A., Andersen, J. K., Neckel, N., Solgaard, A., Karlsson, N. B., Kjær, H. A., and Vallelonga, P.: Surface velocity of the Northeast Greenland Ice Stream (NEGIS): assessment of interior velocities derived from satellite data by GPS, The Cryosphere, 14, 3487–3502, https://doi.org/10.5194/tc-14-3487-2020, 2020.
Iakovleva, A. I., Brinkhuis, H., and Cavagnetto, C.: Late Palaeocene-Early Eocene dinoflagellate cysts from the Turgay Strait, Kazakhstan; correlations across ancient seaways, Palaeogeogr. Palaeocl., 172, 243–268, Doi https://doi.org/10.1016/S0031-0182(01)00300-5, 2001.
Jakobsson, M., Backman, J., Rudels, B., Nycander, J., Frank, M., Mayer, L., Jokat, W., Sangiorgi, F., O'Regan, M., Brinkhuis, H., King, J., and Moran, K.: The early Miocene onset of a ventilated circulation regime in the Arctic Ocean, Nature, 447, 986–990, https://doi.org/10.1038/nature05924, 2007.
Jakobsson, M., Mohammad, R., Karlsson, M., Salas-Romero, S., Vacek, F., Heinze, F., Bringensparr, C., Castro, C. F., Johnson, P., Kinney, J., Cardigos, S., Bogonko, M., Accettella, D., Amblas, D., An, L., Bohan, A., Brandt, A., Buenz, S., Canals, M., Casamor, J. L., Coakley, B., Cornish, N., Danielson, S., Demarte, M., Di Franco, D., Dickson, M. L., Dorschel, B., Dowdeswell, J. A., Dreutter, S., Fremand, A. C., Hall, J. K., Hally, B., Holland, D., Hong, J. K., Ivaldi, R., Knutz, P. C., Krawczyk, D. W., Kristofferson, Y., Lastras, G., Leck, C., Lucchi, R. G., Masetti, G., Morlighem, M., Muchowski, J., Nielsen, T., Noormets, R., Plaza-Faverola, A., Prescott, M. M., Purser, A., Rasmussen, T. L., Rebesco, M., Rignot, E., Rysgaard, S., Silyakova, A., Snoeijs-Leijonmalm, P., Sorensen, A., Straneo, F., Sutherland, D. A., Tate, A. J., Travaglini, P., Trenholm, N., van Wijk, E., Wallace, L., Willis, J. K., Wood, M., Zimmermann, M., Zinglersen, K. B., and Mayer, L.: The International Bathymetric Chart of the Arctic Ocean Version 5.0, Sci. Data, 11, https://doi.org/10.1038/s41597-024-04278-w, 2024.
Japsen, P., Bonow, J. M., Green, P. F., Chalmers, J. A., and Lidmar-Bergström, K.: Elevated, passive continental margins: Long-term highs or neogene uplifts? New evidence from West Greenland, Earth Planet. Sc. Lett., 248, 330–339, https://doi.org/10.1016/j.epsl.2006.05.036, 2006.
Japsen, P., Green, P. F., Bonow, J. M., Nielsen, T. F. D., and Chalmers, J. A.: From volcanic plains to glaciated peaks: Burial, uplift and exhumation history of southern East Greenland after opening of the NE Atlantic, Global Planet. Change, 116, 91–114, https://doi.org/10.1016/j.gloplacha.2014.01.012, 2014.
Jokat, W., Lehmann, P., Damaske, D., and Nelson, J. B.: Magnetic signature of North-East Greenland, the Morris Jesup Rise, the Yermak Plateau, the central Fram Strait: Constraints for the rift/drift history between Greenland and Svalbard since the Eocene, Tectonophysics, 691, 98–109, https://doi.org/10.1016/j.tecto.2015.12.002, 2016.
Knies, J. and Gaina, C.: Middle Miocene ice sheet expansion in the Arctic: Views from the Barents Sea, Geochem. Geophy. Geosy., 9, https://doi.org/10.1029/2007GC001824, 2008.
Knies, J., Matthiessen, J., Vogt, C., Laberg, J. S., Hjelstuen, B. O., Smelror, M., Larsen, E., Andreassen, K., Eidvin, T., and Vorren, T. O.: The Plio-Pleistocene glaciation of the Barents Sea-Svalbard region: a new model based on revised chronostratigraphy, Quaternary Sci. Rev., 28, 812–829, https://doi.org/10.1016/j.quascirev.2008.12.002, 2009.
Knies, J., Mattingsdal, R., Fabian, K., Grosfjeld, K., Baranwal, S., Husum, K., De Schepper, S., Vogt, C., Andersen, N., Matthiessen, J., Andreassen, K., Jokat, W., Nam, S. I., and Gaina, C.: Effect of early Pliocene uplift on late Pliocene cooling in the Arctic-Atlantic gateway, Earth Planet. Sc. Lett., 387, 132–144, https://doi.org/10.1016/j.epsl.2013.11.007, 2014.
Knutz, P. C., Newton, A. M. W., Hopper, J. R., Huuse, M., Gregersen, U., Sheldon, E., and Dybkjær, K.: Eleven phases of Greenland Ice Sheet shelf-edge advance over the past 2.7 million years, Nat. Geosci., 12, 361–368, https://doi.org/10.1038/s41561-019-0340-8, 2019.
Laberg, J. S. and Vorren, T. O.: Late Weichselian Submarine Debris Flow Deposits on the Bear-Island-Trough-Mouth-Fan, Mar. Geol., 127, 45–72, https://doi.org/10.1016/0025-3227(95)00055-4, 1995.
Laberg, J. S. and Vorren, T. O.: The Middle and Late Pleistocene evolution of the Bear Island Trough Mouth Fan, Global Planet. Change, 12, 309–330, https://doi.org/10.1016/0921-8181(95)00026-7, 1996.
Laberg, J. S., Forwick, M., Husum, K., and Nielsen, T.: A re-evaluation of the Pleistocene behavior of the Scoresby Sund sector of the Greenland Ice Sheet, Geology, 41, 1231–1234, https://doi.org/10.1130/G34784.1, 2013.
Laberg, J. S., Forwick, M., and Husum, K.: New geophysical evidence for a revised maximum position of part of the NE sector of the Greenland ice sheet during the last glacial maximum, arktos, 3, 1–9, https://doi.org/10.1007/s41063-017-0029-4, 2017.
Laberg, J. S., Rydningen, T. A., Forwick, M., and Husum, K.: Depositional processes on the distal Scoresby Trough Mouth Fan (ODP Site 987): Implications for the Pleistocene evolution of the Scoresby Sund Sector of the Greenland Ice Sheet, Mar. Geol., 402, 51–59, https://doi.org/10.1016/j.margeo.2017.11.018, 2018.
Larsen, H. C., Saunders, A. D., Clift, P. D., Beget, J., Wei, W., Spezzaferri, S., Ali, J., Cambray, H., Demant, A., Fitton, G., Fram, M. S., Fukuma, K., Gieskes, J., Holmes, M. A., Hunt, J., Lacasse, C., Larsen, L. M., Lykkeanderson, H., Meltser, A., Morrison, M. L., Nemoto, N., Okay, N., Saito, S., Sinton, C., Stax, R., Vallier, T. L., Vandamme, D., Werner, R., and Cliff, P. D.: 7-Million Years of Glaciation in Greenland, Science, 264, 952–955, https://doi.org/10.1126/science.264.5161.952, 1994.
Lien, O. F., Hjelstuen, B. O., Zhang, X., and Sejrup, H. P.: Late Plio-Pleistocene evolution of the Eurasian Ice Sheets inferred from sediment input along the northeastern Atlantic continental margin, Quaternary Sci. Rev., 282, https://doi.org/10.1016/j.quascirev.2022.107433, 2022.
Lisiecki, L. E. and Raymo, M. E.: A Pliocene-Pleistocene stack of 57 globally distributed benthic δ18O records, Paleoceanography, 20, https://doi.org/10.1029/2004pa001071, 2005.
López-Quirós, A., Junna, T., Davies, J., Andresen, K. J., Nielsen, T., Haghipour, N., Wacker, L., Alstrup, A. K. O., Munk, O. L., Rasmussen, T. L., Pearce, C., and Seidenkrantz, M. S.: Retreat patterns and dynamics of the former Norske Trough ice stream (NE Greenland): An integrated geomorphological and sedimentological approach, Quaternary Sci. Rev., 325, https://doi.org/10.1016/j.quascirev.2023.108477, 2024.
Lucchi, R. G., St. John, K. E. K., Ronge, T., and and the Expedition 403 Scientists: Initial Report: Eastern Fram Strait Palaeo-Archive, Proceedings of the International Ocean Discovery Program, in press, 2026.
Lundin, E.: NE Greenland Stratigraphic Coring Project 2008, Abstract, 3P Arctic, Polar Petroleum Potential Conference & Exhibition, Stavanger, Norway, 15–18 October 2013, https://www.researchgate.net/publication/287197107_NE_Greenland_Stratigraphic_Coring_Project_2008 (last access: 19 November 2025), 2013.
Lunt, D. J., Valdes, P. J., Haywood, A., and Rutt, I. C.: Closure of the Panama Seaway during the Pliocene: implications for climate and Northern Hemisphere glaciation, Clim. Dynam., 30, 1–18, https://doi.org/10.1007/s00382-007-0265-6, 2008.
Mattingsdal, R., Knies, J., Andreassen, K., Fabian, K., Husum, K., Grosfjeld, K., and De Schepper, S.: A new 6 Myr stratigraphic framework for the Atlantic-Arctic Gateway, Quaternary Sci. Rev., 92, 170–178, https://doi.org/10.1016/j.quascirev.2013.08.022, 2014.
Miller, K. G., Browning, J. V., Schmelz, W. J., Kopp, R. E., Mountain, G. S., and Wright, J. D.: Cenozoic sea-level and cryospheric evolution from deep-sea geochemical and continental margin records, Sci. Adv., 6, https://doi.org/10.1126/sciadv.aaz1346, 2020.
Mitchum, R. M., Vail, P. R., and Sangree, J. B.: Seismic stratigraphy and global changes of sea level: Part 6. Stratigraphic interpretation of seismic reflection patterns in depositional sequences: Section 2. Application of seismic reflection configuration to stratigraphic interpretation, American Association of Petroleum Geologists, Vol. 26, 117–133, 1977.
Morlighem, M., Williams, C. N., Rignot, E., An, L., Arndt, J. E., Bamber, J. L., Catania, G., Chauché, N., Dowdeswell, J. A., Dorschel, B., Fenty, I., Hogan, K., Howat, I., Hubbard, A., Jakobsson, M., Jordan, T. M., Kjeldsen, K. K., Millan, R., Mayer, L., Mouginot, J., Noël, B. P. Y., O'Cofaigh, C., Palmer, S., Rysgaard, S., Seroussi, H., Siegert, M. J., Slabon, P., Straneo, F., van den Broeke, M. R., Weinrebe, W., Wood, M., and Zinglersen, K. B.: BedMachine v3: Complete Bed Topography and Ocean Bathymetry Mapping of Greenland From Multibeam Echo Sounding Combined With Mass Conservation, Geophys. Res. Lett., 44, 11051–11061, https://doi.org/10.1002/2017gl074954, 2017.
Myhre, A., Thiede, J., and Firth, J.: Proceedings Ocean Drilling Program initial reports, Ocean Drilling Program, College Station, TX, 151, 1–926, 1995.
Nagler, T., Rott, H., Hetzenecker, M., Wuite, J., and Potin, P.: The Sentinel-1 Mission: New Opportunities for Ice Sheet Observations, Remote Sens.-Basel, 7, 9371–9389, https://doi.org/10.3390/rs70709371, 2015.
Nielsen, T. and Kuijpers, A.: Only 5 southern Greenland shelf edge glaciations since the early Pliocene, Sci. Rep.-UK, 3, https://doi.org/10.1038/srep01875, 2013.
Nielsen, T., De Santis, L., Dahgren, K. I. T., Kuijpers, A., Laberg, J. S., Nygård, A., Praeg, D., and Stoker, M. S.: A comparison of the NW European glaciated margin with other glaciated margins, Mar. Petrol. Geol., 22, 1149–1183, https://doi.org/10.1016/j.marpetgeo.2004.12.007, 2005.
Nygård, A., Sejrup, H. P., Haflidason, H., and Bryn, P.: The glacial North Sea Fan, southern Norwegian Margin:: architecture and evolution from the upper continental slope to the deep-sea basin, Mar. Petrol. Geol., 22, 71–84, https://doi.org/10.1016/j.marpetgeo.2004.12.001, 2005.
Olsen, I. L., Rydningen, T. A., Forwick, M., Laberg, J. S., and Husum, K.: Last glacial ice sheet dynamics offshore NE Greenland – a case study from Store Koldewey Trough, The Cryosphere, 14, 4475–4494, https://doi.org/10.5194/tc-14-4475-2020, 2020.
Ottesen, D., Rise, L., Andersen, E. S., Bugge, T., and Eidvin, T.: Geological evolution of the Norwegian continental shelf between 61° N and 68° N during the last 3 million years, Norw. J. Geol., 89, 251–265, 2009.
Ó Cofaigh, C., Lloyd, J. M., Callard, S. L., Gebhardt, C., Streuff, K. T., Dorschel, B., Smith, J. A., Lane, T. P., Jamieson, S. S., and Kanzow, T.: Shelf-edge glaciation offshore of northeast Greenland during the last glacial maximum and timing of initial ice-sheet retreat, Quaternary Sci. Rev., 359, 109326, https://doi.org/10.1016/j.quascirev.2025.109326, 2025.
Pérez, L. F., Nielsen, T., Knutz, P. C., Kuijpers, A., and Damm, V.: Large-scale evolution of the central-east Greenland margin: New insights to the North Atlantic glaciation history, Global Planet. Change, 163, 141–157, https://doi.org/10.1016/j.gloplacha.2017.12.010, 2018.
Peron-Pinvidic, G. and Osmundsen, P. T.: The Mid Norwegian – NE Greenland conjugate margins: Rifting evolution, margin segmentation, and breakup, Mar. Petrol. Geol., 98, 162–184, https://doi.org/10.1016/j.marpetgeo.2018.08.011, 2018.
Petersen, T. G.: New sequence stratigraphic framework on a 'passive' margin: implications for the post-break-up depositional environment and onset of glaciomarine conditions in NE Greenland, J. Geol. Soc. London, 178, https://doi.org/10.1144/jgs2020-128, 2021.
Piepjohn, K., von Gosen, W., and Tessensohn, F.: The Eurekan deformation in the Arctic: an outline, J. Geol. Soc. London, 173, 1007–1024, https://doi.org/10.1144/jgs2016-081, 2016.
Rasmussen, T. L., Pearce, C., Andresen, K. J., Nielsen, T., and Seidenkrantz, M. S.: Northeast Greenland: ice-free shelf edge at 79.4° N around the Last Glacial Maximum 25.5–17.5 ka, Boreas, 51, 759–775, https://doi.org/10.1111/bor.12593, 2022.
Shepherd, A., Ivins, E., Rignot, E., Smith, B., van den Broeke, M., Velicogna, I., Whitehouse, P., Briggs, K., Joughin, I., Krinner, G., Nowicki, S., Payne, T., Scambos, T., Schlegel, N., A, G., Agosta, C., Ahlstrom, A., Babonis, G., Barletta, V. R., Bjork, A. A., Blazquez, A., Bonin, J., Colgan, W., Csatho, B., Cullather, R., Engdahl, M. E., Felikson, D., Fettweis, X., Forsberg, R., Hogg, A. E., Gallee, H., Gardner, A., Gilbert, L., Gourmelen, N., Groh, A., Gunter, B., Hanna, E., Harig, C., Helm, V., Horvath, A., Horwath, M., Khan, S., Kjeldsen, K. K., Konrad, H., Langen, P. L., Lecavalier, B., Loomis, B., Luthcke, S., McMillan, M., Melini, D., Mernild, S., Mohajerani, Y., Moore, P., Mottram, R., Mouginot, J., Moyano, G., Muir, A., Nagler, T., Nield, G., Nilsson, J., Noël, B., Otosaka, I., Pattle, M. E., Peltier, W. R., Pie, N., Rietbroek, R., Rott, H., Sorensen, L. S., Sasgen, I., Save, H., Scheuchl, B., Schrama, E., Schröder, L., Seo, K. W., Simonsen, S. B., Slater, T., Spada, G., Sutterley, T., Talpe, M., Tarasov, L., van de Berg, W. J., van der Walt, W., van Wessem, M., Vishwakarma, B. D., Wiese, D., Wilton, D., Wagner, T., Wouters, B., Wuite, J., and Team, I.: Mass balance of the Greenland Ice Sheet from 1992 to 2018, Nature, 579, 233–239, https://doi.org/10.1038/s41586-019-1855-2, 2020.
Solgaard, A. M., Bonow, J. M., Langen, P. L., Japsen, P., and Hvidberg, C. S.: Mountain building and the initiation of the Greenland Ice Sheet, Palaeogeogr. Palaeocl., 392, 161–176, https://doi.org/10.1016/j.palaeo.2013.09.019, 2013.
St John, K. E. K. and Krissek, L. A.: The late Miocene to Pleistocene ice-rafting history of southeast Greenland, Boreas, 31, 28–35, https://doi.org/10.1111/j.1502-3885.2002.tb01053.x, 2002.
StatoilHydro: NE Greenland Coring Project 2008 – Summary Report, StatoilHydro, Stavanger, 356, 2008.
Stein, R., Fahl, K., Schreck, M., Knorr, G., Niessen, F., Forwick, M., Gebhardt, C., Jensen, L., Kaminski, M., Kopf, A., Matthiessen, J., Jokat, W., and Lohmann, G.: Evidence for ice-free summers in the late Miocene central Arctic Ocean, Nat. Commun., 7, 11148, https://doi.org/10.1038/ncomms11148, 2016.
Thiede, J., Jessen, C., Knutz, P., Kuijpers, A., Mikkelsen, N., Nørgaard-Pedersen, N., and Spielhagen, R. F.: Millions of years of Greenland Ice Sheet history recorded in ocean sediments, Polarforschung, 80, 141–159, 2011.
Tripati, A. K., Eagle, R. A., Morton, A., Dowdeswell, J. A., Atkinson, K. L., Bahe, Y., Dawber, C. F., Khadun, E., Shaw, R. M. H., Shorttle, O., and Thanabalasundaram, L.: Evidence for glaciation in the Northern Hemisphere back to 44 Ma from ice-rafted debris in the Greenland Sea, Earth Planet. Sc. Lett., 265, 112–122, https://doi.org/10.1016/j.epsl.2007.09.045, 2008.
Tripsanas, E. K. and Piper, D. M.: Glaciogenic Debris-Flow Deposits of Orphan Basin, Offshore Eastern Canada: Sedimentological and Rheological Properties, Origin, and Relationship to Meltwater Discharge, J. Sediment. Res., 78, 724–744, https://doi.org/10.2110/jsr.2008.082, 2008.
Vorren, T. O. and Laberg, J. S.: Trough mouth fans – Palaeoclimate and ice-sheet monitors, Quaternary Sci. Rev., 16, 865–881, https://doi.org/10.1016/S0277-3791(97)00003-6, 1997.
Winkelmann, D., Jokat, W., Jensen, L., and Schenke, H. W.: Submarine end moraines on the continental shelf off NE Greenland – Implications for Lateglacial dynamics, Quaternary Sci. Rev., 29, 1069–1077, https://doi.org/10.1016/j.quascirev.2010.02.002, 2010.
Winkler, A., Wolf-Welling, T. C. W., Stattegger, K., and Thiede, J.: Clay mineral sedimentation in high northern latitude deep-sea basins since the Middle Miocene (ODP Leg 151, NAAG), Int. J. Earth Sci., 91, 133–148, https://doi.org/10.1007/s005310100199, 2002.
Wolf-Welling, T. C. W., Cremer, M., O'Connell, S., Winkler, A., and Thiede, J.: Cenozoic Arctic gateway paleoclimate variability; indications from changes in coarse-fraction composition, in: Proceedings of the Ocean Drilling Program, Scientific Results 151, edited by: Thiede, J., Myhre, A. M., Firth, J. V., Johnson, G. L., and Ruddiman, W., Texas A & M University, Ocean Drilling Program, College Station, TX, United States, 515–567, https://doi.org/10.2973/odp.proc.sr.151.139.1996, 1996.