the Creative Commons Attribution 4.0 License.
the Creative Commons Attribution 4.0 License.
 | 25 Nov 2025
High-resolution paleo-storm reconstructions from Eastern Canada align with late Holocene northwestern Atlantic hurricane records
Antoine Lachance
Matthew C. Peros
Jeannine-Marie St-Jacques
Pierre Francus
Nicole K. Sanderson
Atlantic Canada experiences frequent major storms, particularly tropical cyclones transitioning into post-tropical storms. Events such as Hurricane Fiona (2022), Dorian (2019), and Juan (2003) have caused significant damage, loss of life, and coastal erosion, exacerbated by sea level rise and warming waters. Despite this, centennial- to millennial-scale storm records in the region remain scarce. Existing studies in North America focus primarily on marine and coastal overwash records, with limited use of aeolian mineral inputs in ombrotrophic peatlands as storm proxies. Here, we address these gaps by analysing grain-size and geochemical data from two peatlands in Quebec, Canada's Magdalen Islands.
Our 4000-year peat-based storm reconstructions reveal consistent storm signals with three key intervals of increased activity: 800–550 BCE, 500–750 CE, and 1300–1700 CE. These records align with marine overwash archives from eastern Canada, the US, and the Bahamas, supporting reduced storminess during the Medieval Climate Anomaly and heightened activity during the Little Ice Age. This regional coherence suggests storm variability at higher latitudes is strongly influenced by local climatic drivers, such as sea surface temperature gradients and storm intensification mechanisms, rather than tropical cyclone formation alone.
Despite broad similarities, notable discrepancies in geochemical and mineralogical profiles between our two peatlands highlight the influence of site-specific factors, including proximity to sediment sources, bog size, and local geomorphology, on sediment deposition and storm signal strength. These findings underscore the importance of site selection and local context when interpreting peat-based storm records. Furthermore, challenges remain in calibrating peat proxies to historical storm events, limiting direct event attribution over the past 150 years.
Our study demonstrates the complementary value of peatland archives alongside marine overwash records in reconstructing paleo-storm activity, enriching understanding of storm dynamics and expanding potential reconstruction sites, particularly in mid-latitude coastal regions. Continued research is needed to refine calibration methods and clarify climatic mechanisms driving storm variability, which is essential for projecting future storm impacts in Atlantic Canada.
- Article
(13809 KB) - Full-text XML
- BibTeX
- EndNote


Atlantic Canada is frequently impacted by major storms, which have resulted in considerable damage and occasional death, especially from storms of tropical origins that have transitioned into powerful post-tropical cyclones (Baker et al., 2021; Public Safety Canada, 2024). Most recently, in September 2022, Hurricane Fiona made landfall in Nova Scotia with winds as strong as a category 2 event before tracking northwards through the Gulf of St. Lawrence and striking southwestern Newfoundland, becoming the costliest extreme event in Atlantic Canada on record (Insurance Bureau of Canada, 2022; Pasch et al., 2023). In September 2019, Hurricane Dorian passed over central Nova Scotia, eastern Prince Edward Island, and the Magdalen Islands, and resulted in large-scale wind-induced damage to trees and infrastructure and severe storm surges up to 1.5 m above normal levels (Avila et al., 2020). In September 2003, Hurricane Juan made landfall east of Halifax, Nova Scotia, as a category 1 event, causing eight deaths (Avila, 2003). Such events, coupled with ongoing sea level rise, are also contributing to coastal erosion in areas of the Gulf of St. Lawrence such as the Magdalen Islands and Prince Edward Island, while the waters surrounding these islands are warming at a rate faster than almost any other region in the world (Barnett et al., 2017; Rémillard et al., 2017; Barnett et al., 2019; Wu et al., 2022). Consequently, how the frequency and intensity of high magnitude storm events will change in the future are important questions to consider, especially given record-setting sea surface temperatures in the North Atlantic during the past several years (Lapointe et al., 2020; Kuhlbrodt et al., 2024).
A long-term perspective can help answer these questions, but there has been very little research examining centennial- to millennial-scale storm records in Atlantic Canada. One exception is a study from Robinson Lake, Nova Scotia, which used sediment grain-size and geochemistry to infer a period of enhanced impacts interpreted as being caused by storms of tropical origin during the Little Ice Age (LIA) (Oliva et al., 2017), the results of which are comparable to similar studies from New England (van de Plassche et al., 2006; Besonen et al., 2008; Boldt et al., 2010; Donnelly et al., 2015). In New Brunswick, an inland lake record revealed a high concentration of storm impacts during the early LIA (before ca. 1650 CE) and from 1895 CE to the present (Patterson et al., 2022). Moreover, evidence for a powerful (possibly category 4) post-tropical cyclone strike on Cape Breton Island, Nova Scotia, was also found to have occurred during the period from 1756–1763 (Dickie and Wach, 2024). In southern Newfoundland, sedimentary records from several coastal lagoons have been used to infer a series of marine flood events occurring over the last several hundred years, which were attributed to both storms and tsunamis (Pleskot et al., 2023). Finally, a 6.5 ka record of storms was developed from a marine core collected from the Scotian Shelf, offshore Nova Scotia, using sand content and elemental ratios such as and (Yang et al., 2020). The results show that storm frequency was sometimes synchronized between low and middle latitudes, particularly during 4.5–2.5 ka and since 0.5 ka, while at other times it was asynchronous.
Throughout the western North Atlantic, paleo-storm reconstructions have largely relied on marine overwash signals in nearshore or littoral sedimentary basins, which have provided considerable insights into late Holocene storm dynamics and driving mechanisms (Liu and Fearn, 1993, 2000; Lane et al., 2011; Braun et al., 2017; Bregy et al., 2018; Oliva et al., 2018; Wallace et al., 2021b; Wang et al., 2024). At many locations in the Bahamian Archipelago, coastal karst basins, including blue holes, have provided high-resolution, decadal to centennial sedimentary records of intense tropical cyclone strikes, revealing periods of enhanced activity, particularly during the Little Ice Age (van Hengstum et al., 2014; Wallace et al., 2019, 2021b; Winkler et al., 2023). Similarly, in the Gulf of Mexico, sedimentary records from lagoons, coastal lakes, and karst basins across western Florida, Texas, and Belize have provided comparable high-resolution, decadal to centennial scale data (Lane et al., 2011; Brandon et al., 2013; Denommee et al., 2014; Rodysill et al., 2020; Monica et al., 2024; Wang et al., 2024). However, these records indicate a reduction in tropical cyclone activity during the Little Ice Age. As records of marine incursions, such studies provide information largely about storm surges, and the degree to which these correlate with storm size is unclear (Irish et al., 2008). Moreover, marine incursions can also occasionally be confused with tsunami strikes, although such events are relatively rare in eastern North America (ten Brink et al., 2014).
In contrast, paleo-storm studies in the European context have often focused on the use of allochthonous mineral input into ombrotrophic coastal peatlands located nearby beaches or dunes (Björck and Clemmensen, 2004; Goslin et al., 2019; Vandel et al., 2019; Kylander et al., 2020; Sjöström et al., 2024). The premise is that storm events transport fine sand to such peatlands, whose mineral input is predominately dependent on atmospheric input (Shotyk, 1988; Weiss et al., 2002). Such data, measured using grain-size and geochemical indicators, provide a record of aeolian sediment influx, and ultimately storm wind activity, which has been argued to reflect “storminess” – the frequency and intensity of storms over a given period (Björck and Clemmensen, 2004; Vandel et al., 2019). For example, a recent study from Sweden used mid-infrared (MIR) spectral data from a large coastal ombrotrophic bog and showed a series of six periods of enhanced activity over the last 5000 years (Kylander et al., 2023). Moreover, at a site in Denmark, mineral grain size was used to infer wind intensity, which was seen to be high during negative North Atlantic Oscillation (NAO) phases (Goslin et al., 2019). In addition to yielding information on wind characteristics, peatlands also often have long-term morphometric stability, limited bioturbation, and abundant macrofossils for radiometric dating, facilitating the interpretation of such records. A critical question remains whether aeolian paleo-storm reconstructions can be directly compared with marine and overwash-based paleo-storm records from nearby coastal sites.
We are unaware of any published research on paleo-storms in eastern North America using aeolian mineral input into ombrotrophic peatlands. The purpose of our paper is thus threefold: (1) to add new, long-term data on the frequency of storm events from an understudied region, namely Atlantic Canada; (2) to develop wind-based paleo-storm reconstructions from North American peatlands; and (3) to explore whether findings from these reconstructions align with coastal records from the North American eastern seaboard. We focus on two previously unstudied ombrotrophic peatlands located on the Magdalen Islands, Quebec, Canada. Our detection of storms is based on a combination of sediment grain-size and high-resolution micro-XRF core scanning elemental data from both sites.
2.1 Geological setting and sea-level history
The Magdalen Islands (47°26′54′′ N, 61°45′08′′ W) are an archipelago of eight rocky islands situated on the shallow (< 100 m) Magdalen Shelf in the Gulf of the St. Lawrence (Fig. 1a) (Owens and McCann, 1980). Six of these islands are connected by a system of barrier beaches, tombolos, and lagoons (Bernatchez et al., 2012b). The islands are organized around basaltic hills surrounded by karstic foothills and sandstone platforms (Brisebois, 1981; Rémillard et al., 2013; Hétu et al., 2020). Previous work on the Late Quaternary history of the archipelago has provided insights into the pre- and post-glacial coastal environments of the area (Prest et al., 1976; Dredge et al., 1992). Deglaciation occurred approximately 20 ka before present (BP), leaving the islands largely submerged until about 15 ka BP. Subsequent glacial isostatic rebound caused the islands to emerge, resulting in a relative sea level (RSL) low-stand at 9–10 ka BP (Rémillard et al., 2016). This was followed by eustatic sea-level rise, which brought RSL up to about 20 m below present 6 ka BP. Since then, RSL has risen at a decelerating rate, eventually reaching modern levels (Vacchi et al., 2018; Barnett et al., 2019). Foraminifera, testate amoeba, and plant macrofossils from a salt marsh at Havre-Aubert Island show that RSL has risen at a rate of 1.3–2.0 mm yr−1 for the last two millennia, a rate substantially slower than the > 4.0 mm yr−1 observed during the 20th century (Barnett et al., 2017). This Late Holocene sea-level stabilization provided conditions favourable for the development of modern coastal landforms, including dunes, tombolos, spits, and beaches.
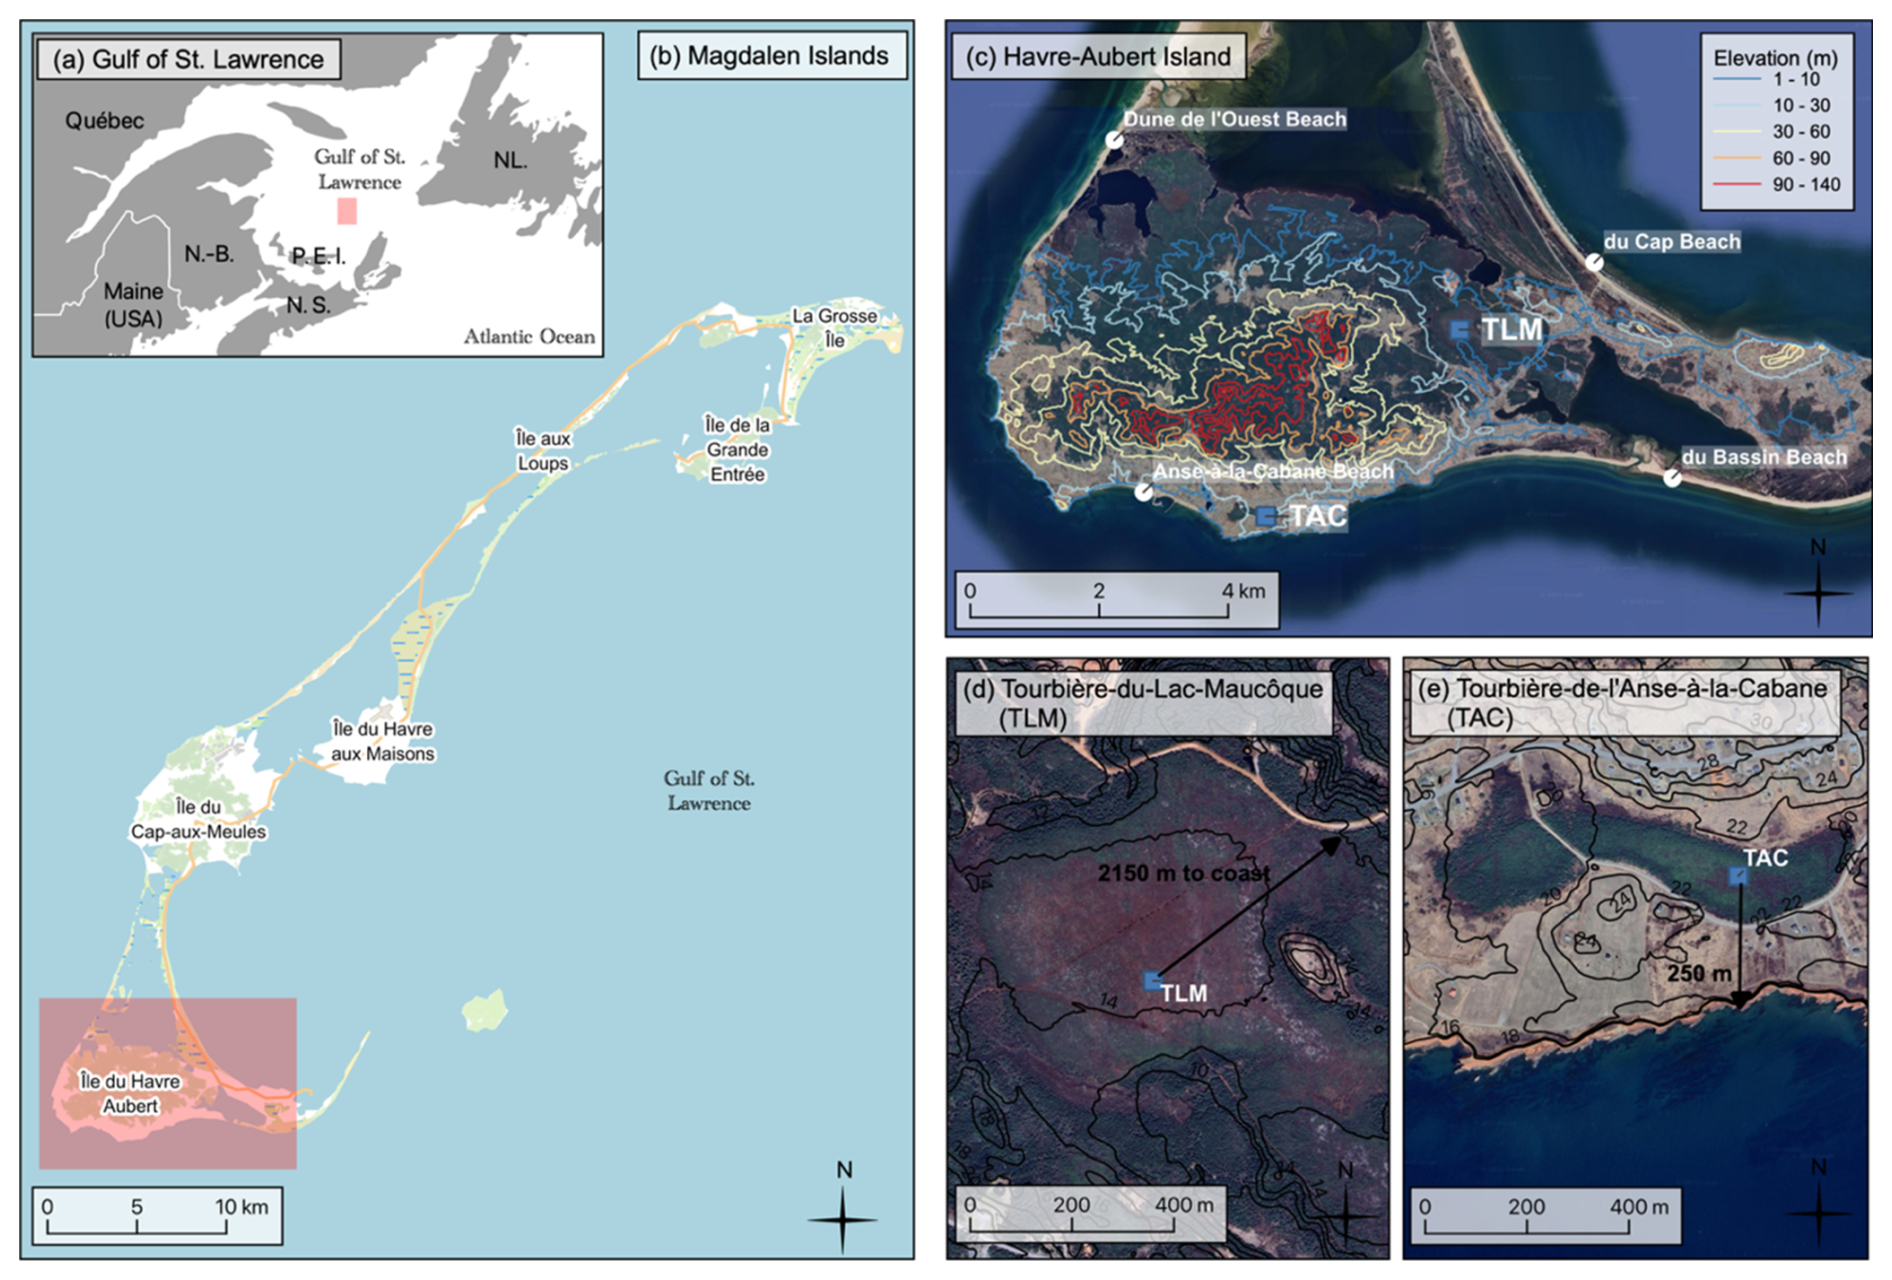
Figure 1Map and context of the study area. (a) The Magdalen Islands, located in the Gulf of St. Lawrence between Newfoundland and Prince Edward Island, in Atlantic Canada. The extent of map (b) is indicated by the red rectangle. (b) The study site is on Havre-Aubert Island, the southernmost island of the archipelago. The extent of map (c) is indicated by the red rectangle. (c) The two coring sites, Tourbière-du-Lac-Maucôque (TLM) and Tourbière-de-l'Anse-à-la-Cabane (TAC), are marked by blue squares, surrounded by multiple beaches, indicated by white circles. (d, e) The TLM core site is 2150 m from the nearest beach (du Cap Beach), while the TAC core site is 250 m from south-facing sandstone cliffs. Imagery panel (b): © OpenStreetMap contributors, licensed under ODbL. Imagery panel (c–e): © Google Earth Pro 7.3.6.9796 (2024), Magdalen Islands, Quebec, Canada. Image date 22 April 2023, © 2025 Airbus. Elevation contour line data from Forêt Ouverte v. 16.14.1.
2.2 Coastal geomorphology
The coastal geomorphology of the Magdalen Islands reflects the combined influence of marine transgression and coastal erosion. Today, approximately 28 % of the coastline consists of rocky cliffs (Bernatchez et al., 2012b). In the southern islands, including Havre-Aubert Island where our research sites are located, these cliffs are composed mainly of relic coastal sands, loose unconsolidated sediments (colluvium), and a thick, porous, and highly erodible layer of red sandstone, known as the Drift des Demoiselles, all of which are predominantly composed of quartz (Brisebois, 1981; Dredge et al., 1992; Rémillard et al., 2013). Due to the friable nature of these materials, cliff retreat occurs at an average rate of 0.3 m yr−1, supplying a steady stream of sediment to adjacent depositional systems (Bernatchez et al., 2012b). These sediments are redistributed alongshore by prevailing currents through longshore drift, contributing material to the intertidal zone and beaches (Morin, 2001). This sediment supply supports a dynamic coastal dune system, whose morphology varies with accumulation rates. In areas of high sand supply, dunes evolved into large-scale coastal features such as tombolos and sand spits, some of which have continued to prograde despite ongoing sea level rise (Rémillard et al., 2015). This has led to the formation of extensive beach ridge systems, highlighting the sustained and abundant sediment inputs from the surrounding cliffs. In contrast, most beaches are bordered by a single foredune that remains less stable due to more limited sand availability (Morin, 2001). These foredunes are frequently eroded by storm waves, forming dune scarps that expose sand to wind transport. Aeolian processes often carry this sand inland, where it accumulates in back-dune environments, sometimes resulting in landward dune migration.
The beach ridges located landward of tombolos and spits provide valuable insights into Late Holocene shoreline dynamics. Optically stimulated luminescence (OLS) dating indicates that many of these features developed over the last 2000–3000 years (Rémillard et al., 2015). The oldest known beach ridge system, located on the Havre-aux-Maisons Island, was dated to at least 2600 years ago. On Havre-Aubert Island, near our study area, a beach ridge complex in the north of the island formed between approximately 550 and 400 years ago.
2.3 Local climate
The region is characterized by a strongly maritime climate, with cool summers and mild winters (Hétu et al., 2020). Daily maximum temperature is highest in July, reaching 21 °C for the period 1981–2010, and is lowest in February at 4.3 °C for the same period (Environment and Climate Change Canada, 2024). Monthly precipitation is relatively stable throughout the year, although it is highest in November at 109 mm and lowest in late winter (February, March, April) and July at around 75 mm (Environment and Climate Change Canada, 2024). Sea ice cover in the Gulf of St. Lawrence normally begins in December and extends until April each winter (Canadian Ice Service, 2022), although over the past two decades sea ice around the Magdalen Islands has been diminishing (Derksen et al., 2019).
Prevailing winds in the Gulf of St. Lawrence and around the Magdalen Islands are predominantly westerlies, with a distinct seasonality. Winds are primarily from the south southwest in spring and summer (40–50 km h−1 for 15 % of the time), and from the northwest in the fall and winter, which are occasionally much stronger (70–132 km h−1 for 15 % of the time) (Fig. A1). These westerlies contribute to more pronounced coastal erosion and narrower beaches on the islands' western shores (narrower beaches), while the eastern coasts remain relatively sediment-rich (Morin, 2001; Forbes et al., 2004).
2.4 Study sites
We studied two peatbogs, Tourbière-du-Lac-Maucôque (TLM) (47°14′30.9′′ N, 61°55′24.7′′ W, ∼ 14 m a.s.l.) and Tourbière-de-l`Anse-à-la-Cabane (TAC) (47°12′54.0′′ N, 61°57′48.4′′ W, ∼ 20 m a.s.l.), located on Havre-Aubert Island, the southernmost island of the Magdalen Islands archipelago (Fig. 1a–c). TLM, a circular peatland with an area of 40.2 ha and an elevation 14 m a.m.s.l., is situated approximately 2 km from coastal beaches on the south and northeast side of Havre-Aubert Island (Fig. 1d) (Ministère de l'Environnement, de la Lutte contre les changements climatiques, de la Faune et des Parcs, 2021b). TAC lies parallel to the coast, covers 9.0 ha, has an elevation 20–22 m above mean sea level, and has its centre 250 m from the nearest south-facing red sandstone cliffs (Fig. 1d) (Ministère de l'Environnement, de la Lutte contre les changements climatiques, de la Faune et des Parcs, 2021a). Both sites are designated as protected areas by the Gouvernement du Québec due to their endangered populations of northern dwarf huckleberry (Gaylussacia bigeloviana [Fernald] Sorrie and Weakley), a small coastal shrub present at both locations. The dominant vegetation in the peatlands is Sphagnum spp. moss (Lindb.) and shrubs from the Ericaceae family, with black spruce (Picea mariana [Mill.] Britton, Sterns & Poggenburg) growing around the perimeter.
3.1 Core sampling
In August 2020, two peat cores were collected from each of TLM and TAC using a Russian peat corer in 50 cm × 5 cm drives, near the centre of each peat dome to target the deepest and oldest peat (Fig. 1d–e). Coring was conducted until dense bottom layers were reached that no longer permitted penetration of the corer. The two sequences at each site were less than 1 m apart and vertically offset by 25 cm. Due to the low peat density at the surface, the top 0–50 cm consisting of monoliths were extracted using a shovel. Cores and monoliths were stored at 4 °C at the Climate and Environmental Change Laboratory at Bishop's University. Continuous composite cores for each site were assembled by integrating core sequences with the surface monoliths (details in Appendix B).
3.2 Chronological controls
Twenty-five radiocarbon (14C) dates (9 for TLM and 16 for TAC) were obtained from the A.E. Lalonde AMS Laboratory at the University of Ottawa, following the method described in Crann et al. (2017), and calibrated with the IntCal20 curve (Reimer et al., 2020). Most samples submitted for AMS dating were terrestrial macrofossils, with some bulk peat samples included. In addition, total lead-210 (210Pb) activity was measured from 15 samples each taken at regular intervals from the surface monoliths of TLM and TAC at the GEOTOP Radiochronology Laboratory at the Université du Québec à Montréal (UQAM), using an acid-digestion sequence and alpha spectrometry, adapted from De Vleeschouwer et al. (2010).
Age-depth models were constructed using the Bayesian Plum algorithm from the rplum package version 0.5.1 in R (Aquino-López et al., 2018; Blaauw et al., 2024), which integrates 14C and 210Pb data. While the 210Pb profile from TAC reached the supported level, the profile for TLM did not extend deep enough to clearly identify it. However, because Plum uses prior information to estimate supported 210Pb activity, we applied the supported level measured in TAC (supported mean = 17.5 Bq kg−1) as a prior for TLM (Aquino-López et al., 2018; Chartrand et al., 2023; Cwanek et al., 2025). This approach is appropriate given the similar sedimentary and environmental conditions at the two nearby sites and allowed us to derive a reliable 210Pb-based chronology for TLM despite the data limitation.
3.3 Peat identification
Peat type was identified using the Troels-Smith method (Troels-Smith, 1955). Samples of 1 cm3 were extracted every 8 cm (TLM) and 4 cm (TAC) and examined under a stereoscopic microscope (at 4–40× magnification) to estimate the relative abundance of each peat type. Four main peat types were identified: bryophytic peat (dominated by Sphagnum spp. moss remains), herbaceous peat (dominated by sedge remains), ligneous peat (dominated by twigs and bark fragments), and humous peat (highly degraded peat with indistinguishable components). Mineral-rich layers and some macrofossils (seeds, leaves, needles) were also noted using the Continental Paleoecology Laboratory collection from GEOTOP at UQAM as reference (Garneau, 1995).
3.4 Loss-on-ignition
Organic and mineral content in TLM and TAC were measured using loss-on-ignition (LOI) (Dean, 1974; Bengtsson and Enell, 1986; Heiri et al., 2001). Wet sediment samples (5 cm3) were extracted every 2 cm (TLM) and every 1 cm (TAC), dried during 15 to 17 h at 105 °C (dry weight, DW105) to calculate dry bulk density, then combusted at 550 °C (LOI550) in crucibles with lids, with weights recorded at each step. Mineral content (%) was calculated as the ratio of LOI550 to DW105.
3.5 Aeolian Sand Influx
The Aeolian Sand Influx (ASI) index was used to estimate inputs of coarse minerals transported by wind into the peatlands. ASI represents the mass accumulation rate of the sand-sized mineral fraction (g m−2 yr−1) and has been used as a storm proxy in several peat-based paleoclimate studies (Björck and Clemmensen, 2004; Orme et al., 2016a; Kylander et al., 2020; Vaasma et al., 2025). To isolate this fraction, subsamples previously analysed for LOI550 were treated with 10 % hydrochloric acid (HCl) to remove carbonate and recalcitrant organic matter, and 10 % potassium hydroxide (KOH) to deflocculate sediments (Vaasma, 2008). Samples from TLM were then wet-sieved through a 63 µm sieve, and from TAC through a 125 µm sieve. Sediments retained on the 63 and 125 µm sieves correspond to the sand-silt boundary and fine/very fine sand boundary, respectively, based on the Wentworth (1922) classification. Grain-size thresholds were selected based on established aeolian transport theory and the geomorphological context. The initiation of sand transport by wind depends on grain size, surface moisture, vegetation, and local topography (Pye and Tsoar, 2008; Goslin et al., 2019). At TAC, the > 125 µm fraction would require minimum wind speeds of ∼ 22.5 m s−1 (∼ 80 km h−1) for entrainment and transport in saltation or suspension, while the > 63 µm fraction used at TLM has a lower transport threshold. Although the TLM site is farther from the coastline, justifying our choice of a lower mineral threshold, both peatlands are adjacent to unconsolidated sediment sources (e.g., sandstone cliffs, beaches), and the sparse vegetation likely facilitates aeolian input under storm conditions. ASI was calculated by multiplying the dry bulk density of the sieved sand fraction (g cm−3) by the peat accumulation rate (cm yr−1), yielding a sand mass accumulation rate (g cm−2 yr−1), which was then converted from cm2 to m2 to give the final unit g m−2 yr−1.
3.6 Micro X-ray fluorescence (µ-XRF) core scanning
We measured the inorganic geochemical compositions of TLM and TAC using an ITRAX Core Scanner (ITRAX–CS) from the Laboratoire de géochimie, imagerie et radiographie des sediments (GIRAS) at the Institut national de recherche scientifique (INRS) in Quebec City. Typically applied to marine and lacustrine sediments (Longman et al., 2019), the use of µ-XRF has recently been expanded to peat cores (Kylander et al., 2011; Orme et al., 2016b; Kern et al., 2019). Scans were acquired at 2 mm (TLM) and 1 mm (TAC) intervals using a Cr tube set to 40 kV, 10 mA and an acquisition time of 20 s. Prior to scanning, the core surfaces were smoothed to minimize surface roughness and reduce measurement variability. We applied quality control procedures on the resulting dataset based on count rate (CPS) and mean squared error (MSE) to exclude outliers affected by poor data quality. For each element, measurements with CPS values exceeding ±3 standard deviations from that element's mean, or exhibiting anomalously high MSE, were removed prior to analysis (Bishops, 2025). Our analysis used a subset of well-measured elements linked to terrigenous mineral inputs: K, Ti, Si, Fe, Mn, Ca, and S. Downcore variations are expressed as the proportion of each element relative to the total of these lithogenic elements (e.g., Ti (%) = 100 ⋅ Ti/[Ti + K + Si + Fe + Mn + Ca + S]). This normalization reduces the influence of variations in sample density, water content, and organic matter on geochemical trends (Jansen et al., 1998; Bertrand et al., 2023).
3.7 Multivariate statistical analysis
3.7.1 Data processing
The LOI and µ-XRF datasets are compositional data, which require log-ratio transformations for multivariate analyses (Aitchison, 1982; Van den Boogaart and Tolosana-Delgado, 2013; Bertrand et al., 2023). Raw µ-XRF data were first aggregated to 1 cm resolution by averaging raw counts within each depth interval to ensure consistency with the lower resolution LOI dataset. For µ-XRF elemental intensities, we computed centred-log-ratios (CLR) using the clr function in the compositions R package version 2.0-8 (Van den Boogaart and Tolosana-Delgado, 2008; Van den Boogaart et al., 2024). Any zero counts were replaced using a centred 10-point moving average. For LOI variables, which contain fewer than five components and do not meet CLR assumptions, we applied a log-ratio transformation of each component relative to the remainder (e.g., (Bertrand et al., 2023). The ASI was log-transformed to meet the assumption of normality.
3.7.2 Statistical methods
Core zonation of TLM and TAC was determined using stratigraphically constrained cluster analysis (CONISS) from the rioja package version 1.0-7 in R (Juggins, 2024) on LOI and µ-XRF variables. Correlation analyses were performed using Pearson's correlation coefficient to evaluate relationships among mineral content from LOI and µ-XRF variables within each zone identified by CONISS. Principal Components Analysis (PCA) was conducted on our subset of seven CLR-transformed elements (K, Ti, Si, Fe, Mn, Ca, S), with mineral content included as a passive variable. This analysis, performed with the factoMineR package version 2.11 in R (Husson et al., 2024), used z-score-transformed variables and a correlation matrix to compute the eigenvalues. Measurements from TLM and TAC's basal sand layers were excluded from all statistical analyses.
3.8 Paleo-storm identification
Two independent paleo-storm reconstructions were performed, one for each of TLM and TAC. Storm reconstructions were based on the ombrotrophic portions of the peat cores, excluding the early developmental stages and sections where ombrotrophic conditions could not be confidently established. These zones likely reflect mixed sedimentary processes, including fluvial or groundwater transport, rather than purely aeolian input (Sjöström et al., 2020). We selected a paleo-storm proxy by identifying µ-XRF elemental signals that co-varied with ASI in ombrotrophic peat. To do this, we conducted a PCA on the ombrotrophic sections of the TLM and TAC cores using the subset of seven elements, with ASI included as a passive variable.
While µ-XRF data were CLR-transformed prior to performing the PCA, the paleo-storm identification method employed a µ-XRF storm proxy normalized to the sum of terrigenous elements, or Proxynormalized= Proxy/[Ti + K + Si + Fe + Mn + Ca + S]. This approach mitigates matrix effects while preserving the natural variability and peak values essential for detecting extreme storm events, features that CLR transformation tends to smooth out.
To identify intervals where the µ-XRF storm proxy exceeded background levels, we used an approach adapted from Donnelly et al. (2015) and Lane et al. (2011). First, to account for variations attributed to long-term lithogenic changes, we detrended the storm proxy using a running average:
where RAproxy(z,w) is the running average of the storm proxy normalized at depth z, calculated over a window length w of 30 years. The threshold for identifying outlier proxy values was defined with the Tukey Rule of outlier detection (Tukey, 1977), following Winkler et al. (2022):
where Q0.75(Proxydetrended>0) is the third quartile of detrended storm proxy values above zero, and is the interquartile range of detrended storm proxy values above zero, multiplied by a factor x of 0.75 for TLM and 1.5 for TAC, respectively, to account for differences in proxy values between the two cores. Detrended proxy values exceeding the threshold were considered storm events. To avoid overestimating the number of events due to consecutive storm proxy measurements associated with a single storm proxy peak, consecutive measurements were grouped together, and only the maximum value within each group was retained in the final paleo-storm record. Finally, the number of events per century was calculated using a 100-year running-sum.
4.1 Core description
4.1.1 Chronostratigraphy
The TLM composite core measured 700 cm, with a basal sand layer between 693–700 cm. The TAC composite core was 325 cm long, with a basal sand layer between 317–325 cm (see Appendix C for core photographs). The age-depth models indicated that organic accumulation began above the basal sand layers around 2960 BCE for TLM and 2900 BCE for TAC, giving an approximate chronology of 5000 years of peat accumulation for both cores (Fig. 2, Table 1). The average peat accumulation rate (PAR) was 0.17 cm yr−1 for TLM and 0.12 cm yr−1 for TAC. At TAC, a marked decline in PAR to 0.02 cm yr−1 occurred between 135–159 cm (870 CE–870 BCE), suggesting a possible hiatus in peat accumulation. This trend was not observed in TLM. In the upper 50 cm of both cores, which includes the acrotelm (the layer containing living plants) and was dated using 210Pb, and the PAR increased significantly to 0.77 cm yr−1 for TLM and 0.29 cm yr−1 for TAC. Further details about the chronostratigraphy can be found in Appendix D.
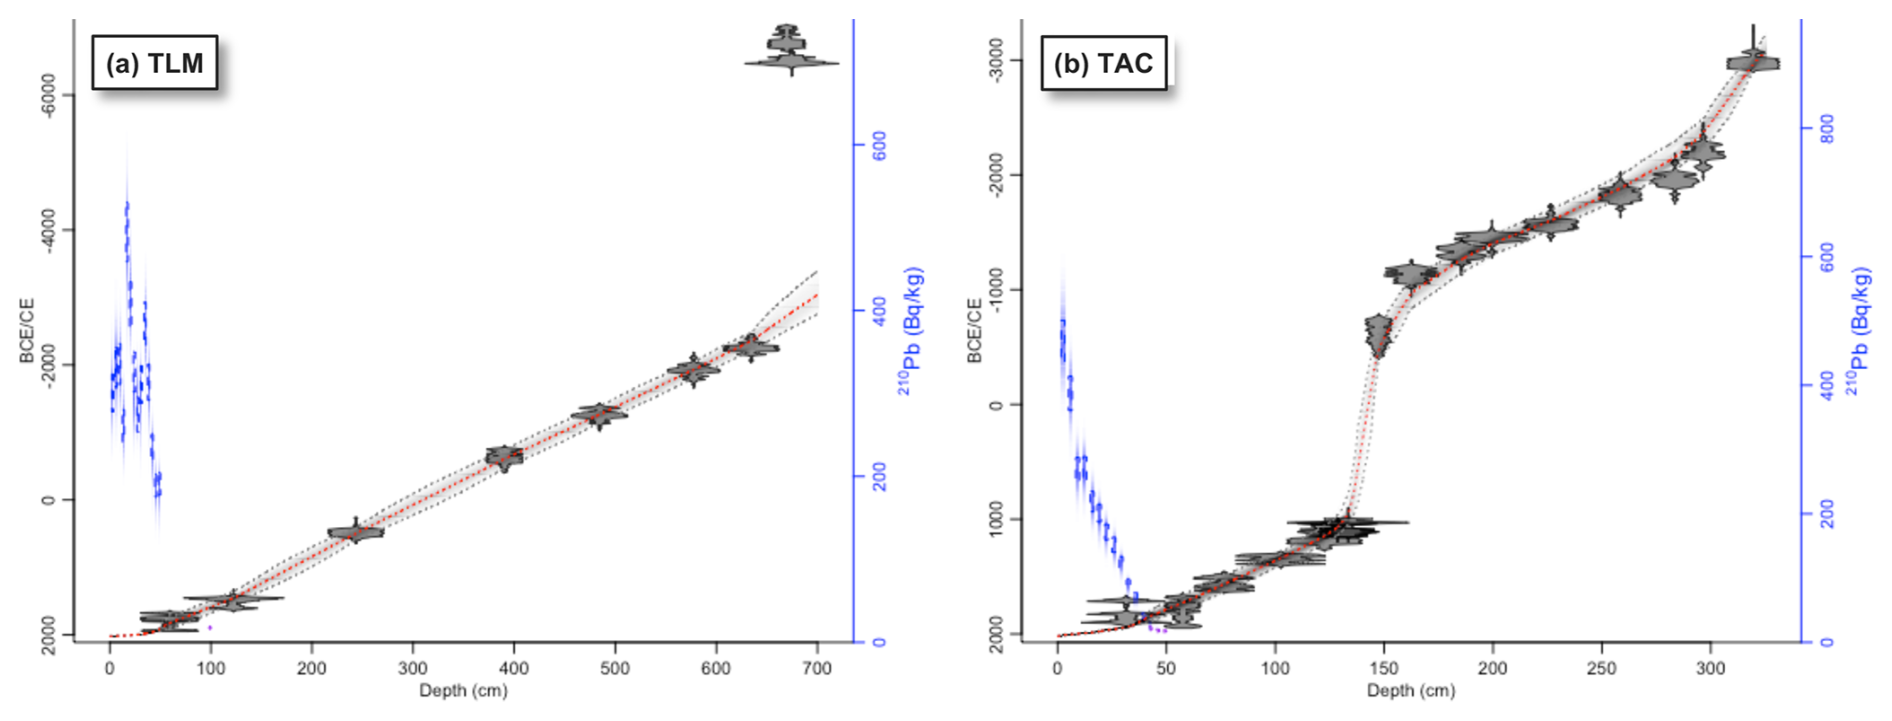
Figure 2Rplum-derived age-depth models for TLM (a) and TAC (b). Radiocarbon (14C) dates are shown in grey along the mean age model (dotted red). The rate of supported 210Pb (right axis) is indicated by blue boxes on the left side (the blue boxes are the measured 210Pb values, while the blue shadings represent the modelled 210Pb values). A complete version with the upper graphs and blown-up version of the 210Pb diagrams is available in Fig. C1.
Table 1Accelerator mass spectrometry (AMS) radiocarbon (14C) results for TLM and TAC. Dated material includes bulk peat sediment (bulk) and wood fragments (wood). Uncalibrated 14C dates are shown as years before 1950 (BP). The 14C dates were processed using the Bayesian rplum algorithm in R and calibrated with the IntCal20 curve. Calibrated dates are presented as both calibrated years before 1950 (cal. BP) and as Common Era/Before Common Era (CE/BCE).
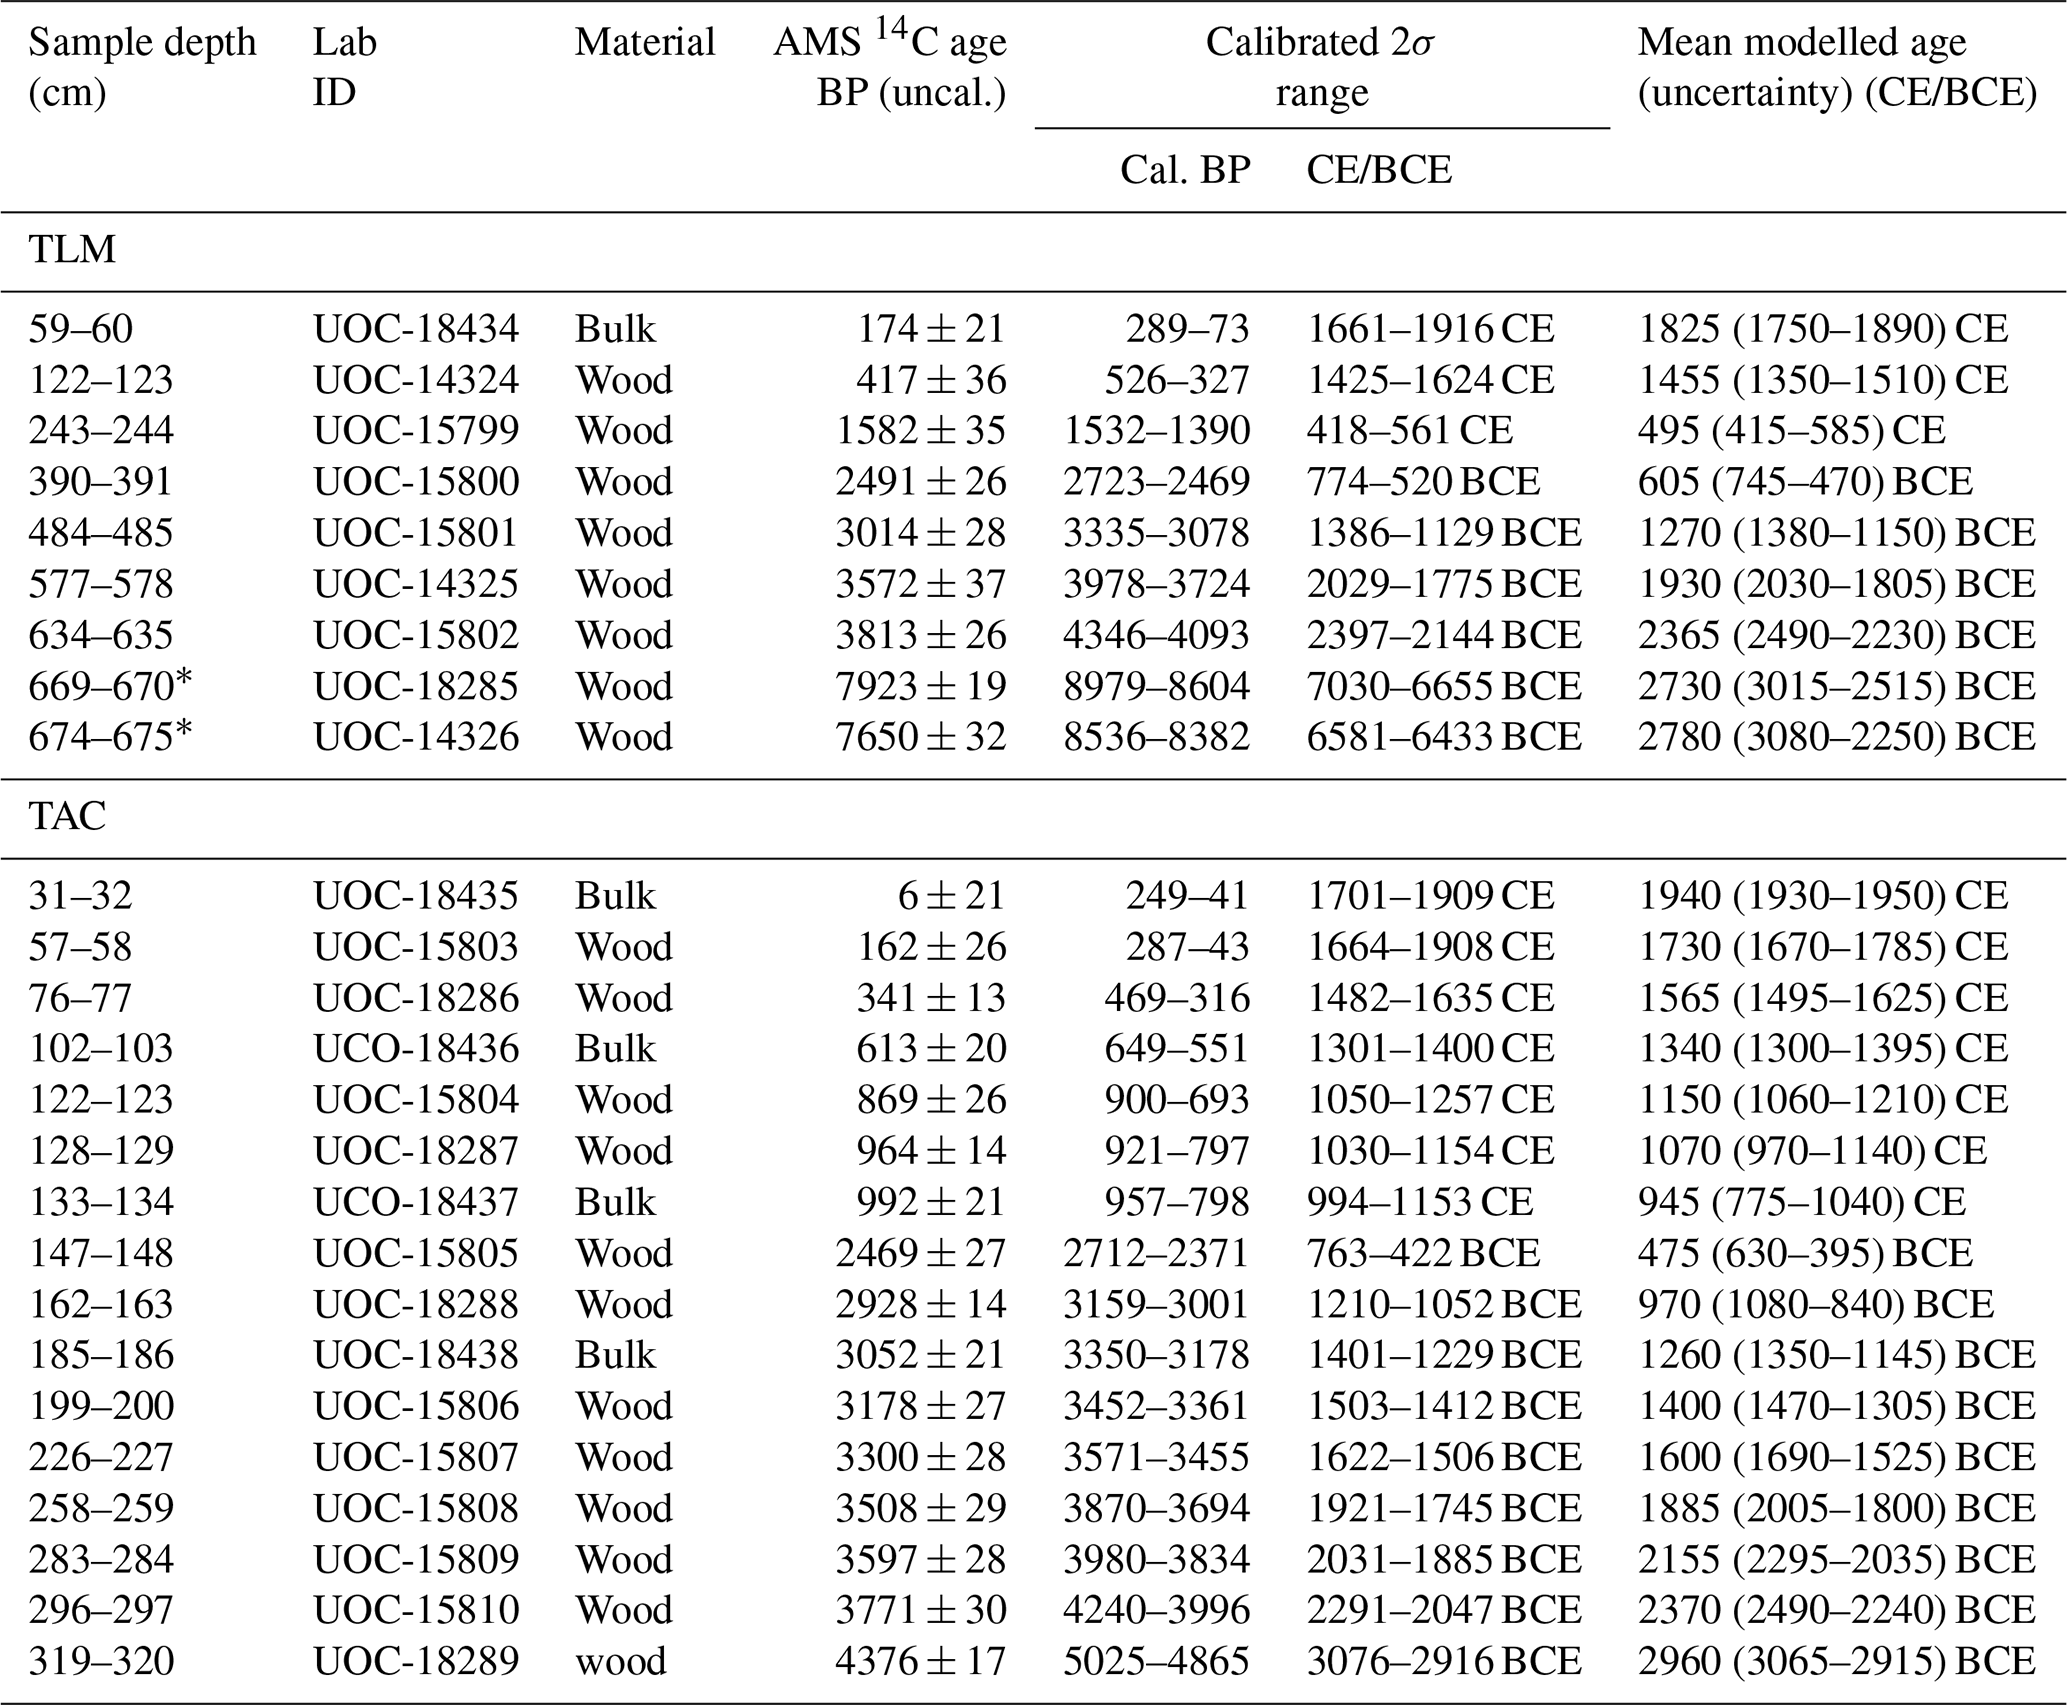
* The AMS 14C dates at these depths were inverted and were considered outliers by the rplum R algorithm. Therefore, the modelled mean dates associated with these depths do not reflect the AMS 14C date.
4.1.2 Downcore variations in lithology
The TLM core was divided into three zones (Fig. 3a). Zone 1 (692–565 cm, 2950–1840 BCE) consisted mainly of ligneous peat with a high mineral content of 13 %. This zone included seeds from Menyanthes trifoliata L. (bog bean). A detritus peat layer between 657–652 cm (2590–2535 BCE) contained a peak mineral content of 34 %. Zone 2 (565–452 cm, 1840–1035 BCE) transitioned from ligneous to herbaceous peat with a sharp decrease in mineral content to an average of 2.3 %. There was an abrupt transition to bryophytic peat at 486 cm (1280 BCE). Zone 3 (450–0 cm, 1035 BCE–2019 CE) showed clear ombrotrophic conditions (Fig. 3) and alternated between well-preserved and degraded bryophytic peat, with a low mineral content of 1.5 %. The upper 50 cm showed a higher mineral content (2.5 %).
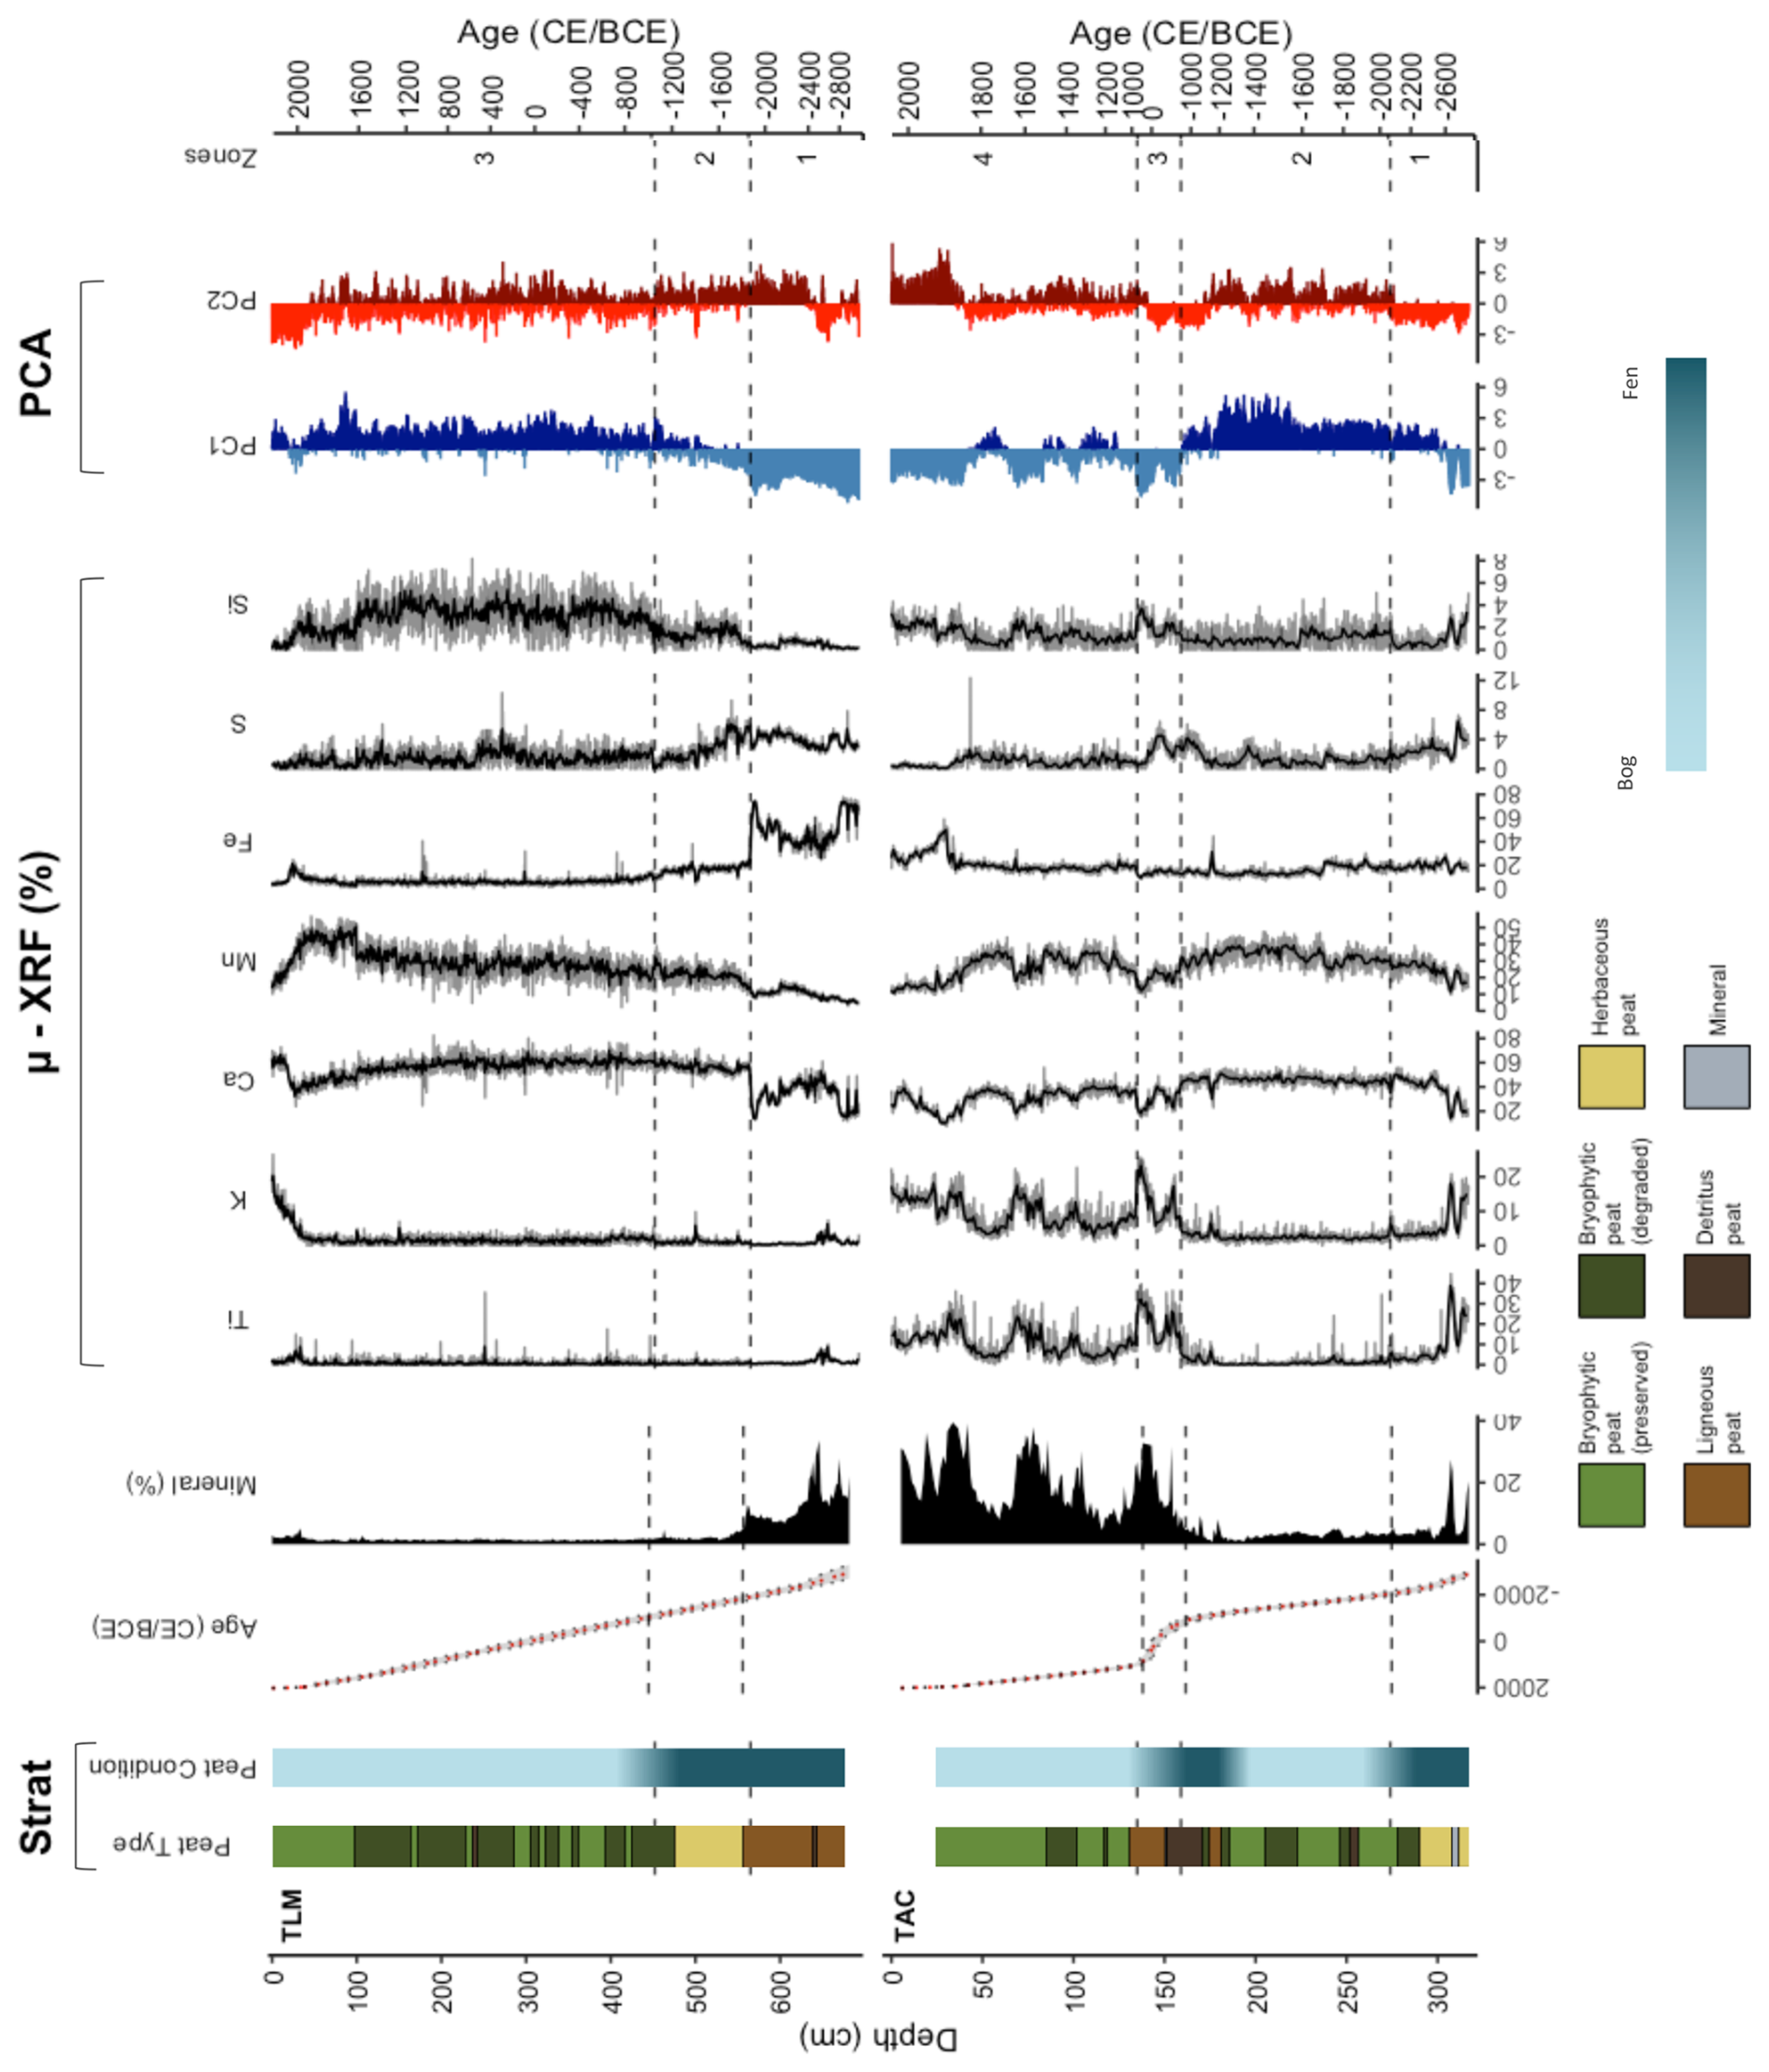
Figure 3Lithological and geochemical profiles of the TLM and TAC composite cores. The peat type (bryophytic, herbaceous, ligneous, detritus, mineral) is color-coded, along with peatland classification (bog versus fen). Micro–XRF variables are displayed as percent ratios over the total counts from the presented elements (%). Grey lines indicate the original µ-XRF resolution (2 mm for TLM and 1 mm for TAC), while the black lines represent values averaged to 1 cm intervals. Principal components (PC 1 and PC 2) derived from seven CLR-transformed µ-XRF elements are shown, illustrating broad geochemical trends across the stratigraphy. Dark blue/red indicate positive loadings; pale blue/red indicate negative scores.
The TAC core was divided into 4 zones (Fig. 3b). Zone 1 (316–274 cm, 2890–2050 BCE) consisted of herbaceous peat interspersed with small ligneous fragments. It had a moderate mineral content of 6 %. A sand-enriched layer (28 % mineral content) between 309–305 cm (2700–2590 BCE) coincided chronologically with a similar layer in TLM. Sphagnum macrofossils first appeared at 284 cm (∼ 2160 BCE). Zone 2 (274–159 cm, 2050–880 BCE) showed ombrotrophic conditions and alternated between well-preserved and degraded bryophytic peat, with the lowest mineral content (3 %). Zone 3 (159–135 cm, 880 BCE–870 CE) was a dense, mineral-rich zone (minerals content 27 %) dominated by detritus peat with ligneous layers. Two layers at 151 cm (∼ 600 BCE) and 136 cm (∼ 810 CE) had high mineral contents of 32 % and 55 %, respectively. This zone likely represents a hiatus in peat accumulation. The interruption appears to begin around 600 BCE, coinciding with the lower mineral layer at 151 cm, where the previously steady age–depth relationship begins to deviate. Peat accumulation resumes at a rate comparable to that of Zone 2 immediately above the upper mineral-rich layer at 136 cm. Due to a high degree of peat degradation, ombrotrophic conditions could not be confirmed for Zone 3. However, ombrotrophic conditions were re-established in Zone 4 (135–0 cm, 870–2019 CE), which consisted of well-preserved bryophytic peat with a mineral content of 21 %.
4.1.3 Principal component analysis and geochemical profiles
The first principal components (PC1), derived from the PCA of seven elements of interest (K, Ti, Si, Fe, Mn, Ca, S) and mineral content added as a passive variable, explained 49 % and 52 % of the total data variance at TLM and TAC, respectively (Fig. 3). At both sites, PC1 was strongly negatively correlated with mineral content (TLM: r= −0.94; TAC: r= −0.93), indicating that positive PC1 values corresponded to low mineral/high organic content, and negative PC1 values indicated high mineral/low organic content. At TLM, PC1 showed the strongest negative correlations with Fe (r = −0.84), S (r= −0.71), and Ti (r= −0.48), linking these elements to mineral content. In contrast, at TAC, PC1 was most strongly negatively correlated with Ti (r= −0.90) and K (r= −0.75), highlighting differences in the main geochemical composition between the two sites. However, PC1 at both locations was positively correlated with Mn and Ca, reflecting the consistent association of those elements with low mineral content. The second principal components (PC2) explained 21 % and 20 % of the variance in TLM and TAC, respectively, and showed no strong correlation with mineral content. At TLM, PC2 was positively correlated with S (r= 0.54), Ca (r= 0.45), and Fe (r= 0.29), and negatively correlated with Ti (r= −0.71) and K (r= −0.60). At TAC, PC2 was positively correlated with Si (r= 0.55), Fe (r= 0.52), and K (r= 0.35), and negatively correlated with S (r= −0.81). In both cases, PC2 likely reflected variations in the geochemical composition associated with changes in sources of mineral input.
Zone 1 of TLM (692–565 cm, 2950–1840 BCE) saw a shift in chemical composition indicated by PC2: Ti and K dominated the older (lower) part, while Fe, S, and Ca, commonly measured in higher proportion in fens (Shotyk, 1988), increased in the upper section. This shift corresponded to the detritus layer at 657–652 cm (2590–2535 BCE). In Zone 2 (565–452 cm, 1840–1035 BCE), PC2 remained positive, reflecting higher proportions of Fe and S, which are positively correlated with mineral content in that zone (Table E1). Zone 3 (450–0 cm, 1035 BCE–2019 CE) showed alternating PC2, indicating variable contributions from Ti, K, Fe, S, and Ca, though only Ti, K, and Fe were significantly positively associated to mineral content in this zone (Table E1). In the upper 50 cm, a negative shift in PC2 highlighted a dominance of Ti and K in modern sediment inputs.
At TAC, Zone 1 (316–274 cm, 2890–2050 BCE) saw a shift in chemical composition indicated by PC1, with Ti and K dominating the older (lower) part, while Fe, Mn and Ca became more prominent in the upper part. As with TLM, this shift was associated to a mineral-enriched layer. A negative PC2 indicated a high S content, though S showed no significant correlation with mineral content (Table E1). In Zone 2 (274–159 cm, 2050–880 BCE), only Ti showed a positive correlation with the mineral content (Table E1). Zone 3 (159–135 cm, 880 BCE–870 CE) contained fine-grained layers enriched in Ti, K, and Si, as indicated by strong positive correlations with mineral content, and a negative PC2 suggested the presence of S, though it was not associated to mineral content (Table E1). In Zone 4 (135–0 cm, 870–2019 CE), LOI variables were positively correlated with Ti, K, and Fe, while in the upper 50 cm, a positive PC2 reflected increased input of Fe and Si.
4.2 Paleo-storms
4.2.1 Ombrotrophic zones
The paleo-storm reconstruction for TLM is based on Zone 3 (1035 BCE–2019 CE), while the TAC analysis is based on Zone 2 (2050–880 BCE) and Zone 4 (870–2019 CE). Zones 1–2 of TLM and Zone 1 of TAC were excluded, as they represent early stages of peat development, when sediment delivery was dominated by non-aeolian processes and thus unsuitable for storm reconstruction (see Discussion). TAC Zone 3 was also excluded; this section likely includes a hiatus and may represent the time-integrated accumulation of up to 2000 years of mineral inputs and other processes. Moreover, the extremely low peat accumulation rate during this interval limits temporal resolution and makes it incompatible with our event detection methodology, which is based on a 30-year moving average.
4.2.2 Aeolian sand influx and geochemical proxies
While ASI was calculated across the full length of both TLM and TAC cores, the following analysis focuses on the identified ombrotrophic sections.
In TLM, Zone 3 (450–0 cm; 1035 BCE–2019 CE) has a mean ASI of 0.1 g m−2 yr−1(Fig. 5a). Log-transformed ASI values indicate a period of stability from 1035 BCE to around 1000 CE, with near-zero values interrupted by occasional small peaks. This is followed by a phase of increased variability between approximately 1000 and 1600 CE. The upper 50 cm of TLM shows notably higher ASI values at 0.6 g m−2 yr−1. In TAC, Zone 2 (274–159 cm; 2050–880 BCE) has a mean ASI of 0.08 g m−2 yr−1, whereas Zone 4 (135–0 cm; 870–2019 CE) exhibits a substantially higher mean ASI of 3.6 g m−2 yr−1 (Fig. 5b). As in TLM, the log-transformed ASI at TAC shows a period of variability in Zone 2 that matches similar trends in Ti.
A PCA was conducted on seven CLR-transformed elements, with ASI included as a passive variable, using data from the ombrotrophic sections only. The first principal component (PC1) shows strong loadings for ASI, Ti, and K in both TLM and TAC (Fig. 5). In TLM, ASI, Ti, and K negatively correlate with PC1 with r values of −0.78, −0.68, and −0.73, respectively; in TAC, these negative correlations are even stronger, at −0.93, −0.87, and −0.86. These results reflect a strong correspondence between downcore variations in ASI and those of Ti and K, particularly visible in the log-transformed ASI.
PCA results identifies both Ti and K as strong candidates for tracking ASI and storm-related inputs. However, Ti exhibits greater amplitude between background and peak levels, particularly in low-ASI sections, making it a more sensitive indicator of aeolian sand influx. Although K appears to track ASI more closely than Ti in the upper 50 cm of both the TLM and TAC cores, its interpretation is complicated by its biological role. As an essential plant nutrient, K can accumulate in living peat near the surface, potentially obscuring its signal as an aeolian proxy (Steinmann and Shotyk, 1997; Shotyk, 1988). In contrast, Ti is a conservative lithogenic element that resists biogenic alteration and post-depositional remobilization, making it a more reliable tracer of mineral input and paleo-storm activity (Croudace and Rothwell, 2015).
4.2.3 Paleo-storm reconstructions
We conducted separate paleo-storm reconstructions for TLM and TAC based on Ti measurements. These Ti-based event reconstructions are presented alongside the log-transformed ASI curves to emphasize their correspondence (Fig. 6).
At TLM, storm events were defined using a threshold set at 2.7 % above the Ti moving average. Since 1035 BCE, the detrended Ti record exceeded this threshold 65 times (Fig. 6a), corresponding to an average of 2.3 events per century. Three multi-centennial periods show above-average storm frequency, with a peak of 6 events per century: 865–535 BCE, 500–750 CE, and 1510–1785 CE, while the recent period from 1945–2019 CE also shows above average event per century.
At TAC, the event threshold was set at 7.3 % above the Ti moving average. Excluding the non-ombrotrophic interval, the detrended Ti record surpassed this threshold 64 times since 2050 BCE (Fig. 6b), yielding an average of 3.2 events per century. Two prominent periods exceed the long-term average: 1320–1715 and 1815–2019 CE, with a maximum of 14 events per century during the early 20th century.
5.1 Peat development
Age–depth models indicate that peat initiation began around 5000 years ago (Fig. 2). The basal sands in both cores are interpreted as marking the onset of peat accumulation and there is no evidence to suggest that the full organic sequences were not recovered. These layers likely formed in a marine-influenced environment during a period of submergence before ca. 10.7 ka PB (Rémillard et al., 2017), though further data would be needed to confirm the depositional setting. The overlying organic-rich sediments are characteristic of early peatland development. At TLM, the presence of Menyanthes trifoliata seeds within mineral-rich ligneous peat suggests that the site initially formed through the terrestrialization of a shallow water body (Hewett, 1964; Kuhry and Turunen, 2006). In contrast, the basal peat at TAC, composed of mostly herbaceous remains and lacking Menyanthes trifoliata seeds, suggests that the peatland formed directly on a mineral substrate in a well-drained environment, likely through primary paludification – a direct shift from bare land to peatland, without an intermediary wetland step (Kuhry and Turunen, 2006).
The fen-to-bog transition in TLM and TAC was characterized by the increasing dominance of Sphagnum mosses and a positive correlation between mineral content and lithogenic elements such as Ti and K. However, the timing of this transition differed substantially, with TAC transitioning around 2050 BCE and TLM following over a millennium later, around 1000 BCE. This temporal discrepancy may reflect differences in the initial conditions of peat formation at each site. Additionally, the smaller size of TAC, which currently extends over 9 ha compared to TLM's 40 ha, likely rendered it more sensitive to climate and hydrological changes, such as the sharp increase in mineral content around 2600 BCE, as has been found in a study from Sweden (Sjöström et al., 2020). This interpretation is supported by TAC's lower peat accumulation rate, shallower 210Pb profile, and lower 210Pb influx compared to TLM, suggesting that TAC is more exposed, has reduced snow accumulation, and, consequently, has more unstable hydrological conditions (Perrier et al., 2022).
A notable aspect of peat development at TAC are the two distinct mineral-rich layers in Zone 3, which are absent in the TLM record. The timing of these mineral intervals should nevertheless be interpreted with caution due to the very low resolution of the TAC age model in this zone. While the older mineral-rich layer is fairly well constrained by two radiocarbon dates spanning from 970–475 BCE, the younger layer is only constrained by one upper radiocarbon date at 945 CE (Table 1). Although their origin remains uncertain, they are unlikely to represent single depositional events. TAC is situated ∼ 20 m a.s.l. and, based on sea-level indicators, was even higher during the late Holocene (Rémillard et al., 2016; Barnett et al., 2017), making marine overwash an improbable explanation. Likewise, an aeolian origin seems unlikely, as it would presumably have left a similar signal at TLM, which is not observed.
Although these layers are not reflected in TLM's mineral content or ASI records, their timing coincides with increased Ti extremes in TLM's storm reconstruction (Fig. 6a), suggesting that mineral inputs at TAC and Ti extremes at TLM may be linked to broader climatic variability. Indeed, the onset of slow peat accumulation at TAC coincides with the 2.8 ka event, a centennial-scale period generally characterized by cool and often dry conditions in the circum-North Atlantic (van Geel et al., 1996) that was recorded in nearby peatlands from Prince Edward Island (Peros et al., 2016), Anticosti Island (Perrier et al., 2022), and the north shore of the Gulf of St. Lawrence (Magnan and Garnau, 2014; Primeau and Garneau, 2021). The more pronounced response at TAC compared to TLM may reflect greater sensitivity to climate-driven hydrological shifts at this site, potentially due to TAC's smaller size and orientation perpendicular to a downslope gradient, which may have made it more vulnerable to groundwater fluctuations.
5.2 Modern aeolian sediment sources
TLM and TAC exhibit distinct patterns of aeolian sediment input (Figs. 5–6), reflecting differences in sediment availability and local geomorphology. In the modern period (post–1851 CE), ASI values at TLM are an order of magnitude lower than those at TAC (Fig. 4), even after adjusting the grain-size threshold (63 µm for TLM vs. 125 µm for TAC). This disparity likely reflects TLM's greater distance from active sediment sources: TLM lies ∼ 2 km from the nearest beach, while TAC is situated only ∼ 210 m from eroding south-facing sandstone cliffs (Fig. 1d–e). Although the precise sources cannot be confirmed without sedimentological or geochemical fingerprinting, proximity strongly suggests that the closest sources contribute most of the aeolian material to each site.
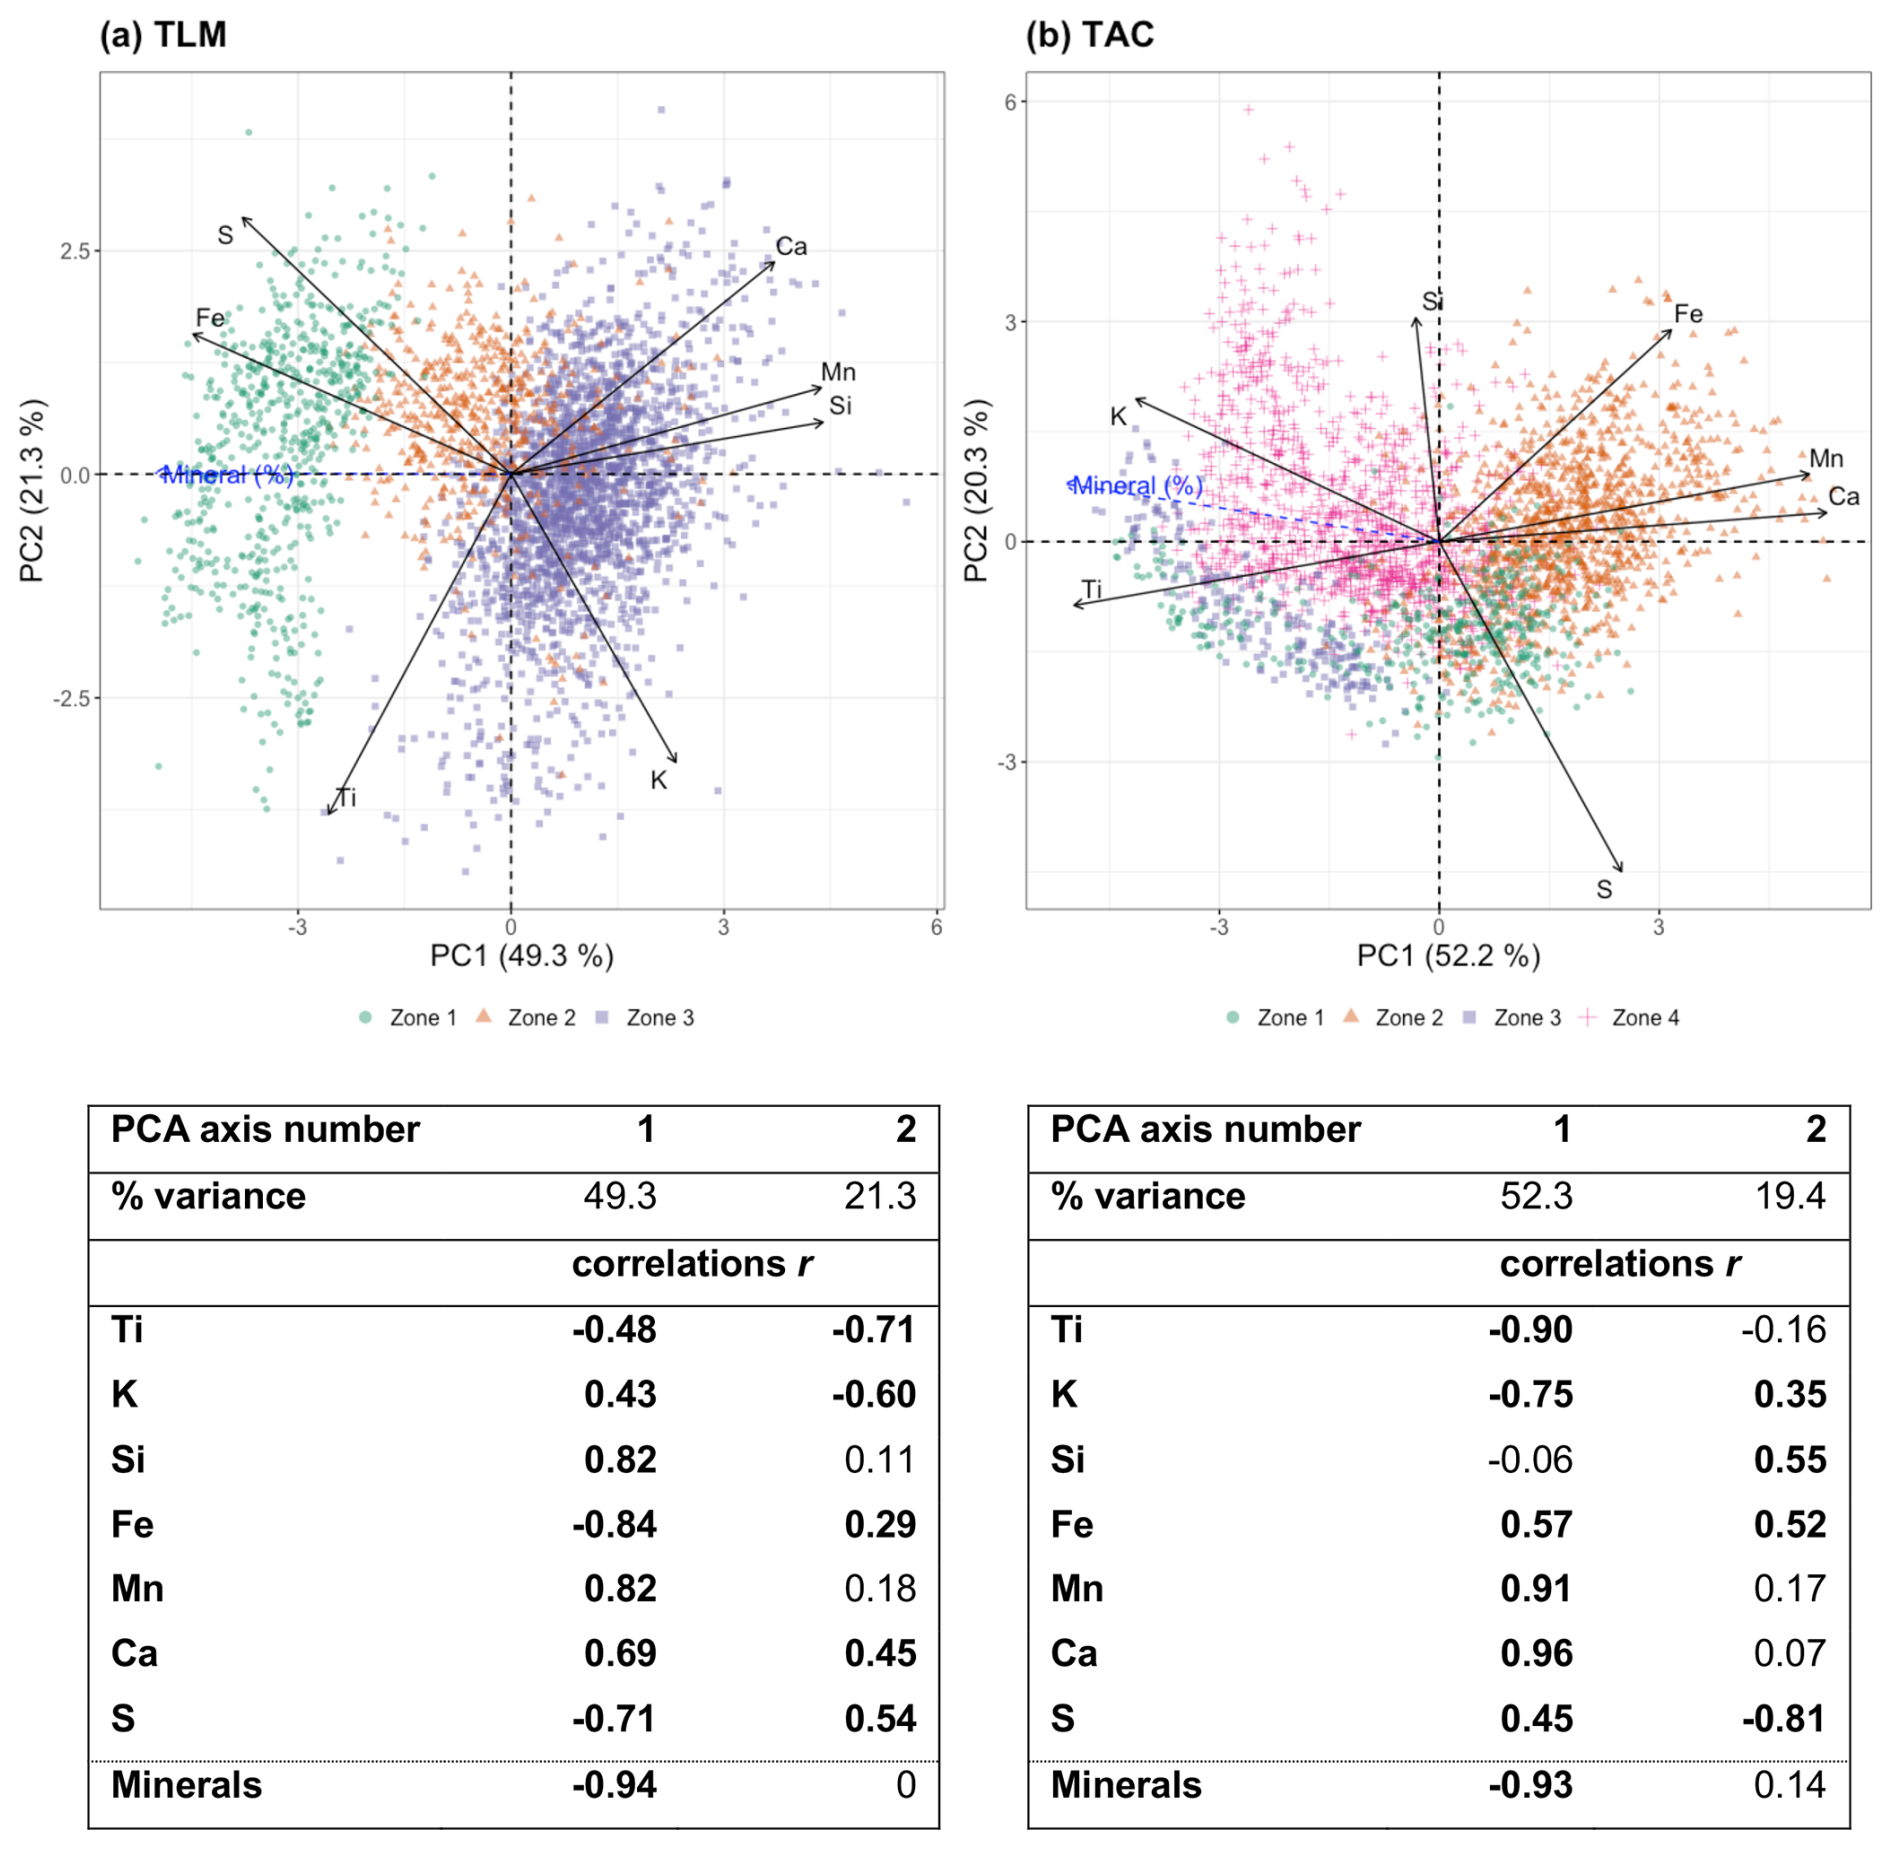
Figure 4Principal components analyses (PCA) of the seven µ-XRF elements for TLM (a) and TAC (b). Each CONISS zone is depicted with a distinct coloured symbol. Solid black arrows represent the µ-XRF variables used in the PCA, while dashed blue arrows represent the supplementary variable Minerals. The Pearson correlation coefficients r between the principal components and all variables are displayed below the respective biplots, with significant correlations r>0.2 highlighted in bold.
At TAC, the nearby sandstone cliffs contain a highly erodible unit known as the Drift des Demoiselles, a friable red sandstone rich in hematite (Fe2O3)-coated quartz (SiO2), K-feldspar (KAlSi3O8), and Ti-bearing minerals derived from underlying basaltic rocks (Brisebois, 1981; Dredge et al., 1992; Rémillard et al., 2013). These cliffs retreat at an average rate of 0.3 m yr−1 (Bernatchez et al., 2012b), supplying a steady stream of sediment to coastal systems, which is then redistributed by longshore drift to local beaches (Morin, 2001). Importantly, the hematite coatings are typically removed during beach transport, meaning that Fe-rich grains are more likely to represent relatively non-weathered, locally sourced sediment from cliffs rather than beach-derived material.
While both cores show a strong association among ASI, Ti and K (Fig. 5), elements common in sandstone and beach-derived sands, the geochemical signals diverge in the modern period, suggesting different sediment sources. At TAC, positive correlations among ASI, Si, and Fe (Table E1) support a dominant input from nearby sandstone cliffs. Silicon is enriched in coarser grain-size fractions (Liu et al., 2019), which are more likely to be transported over short distances during storm events. The Fe enrichment further points to the presence of hematite-coated grains, characteristic of cliff-derived sediment.
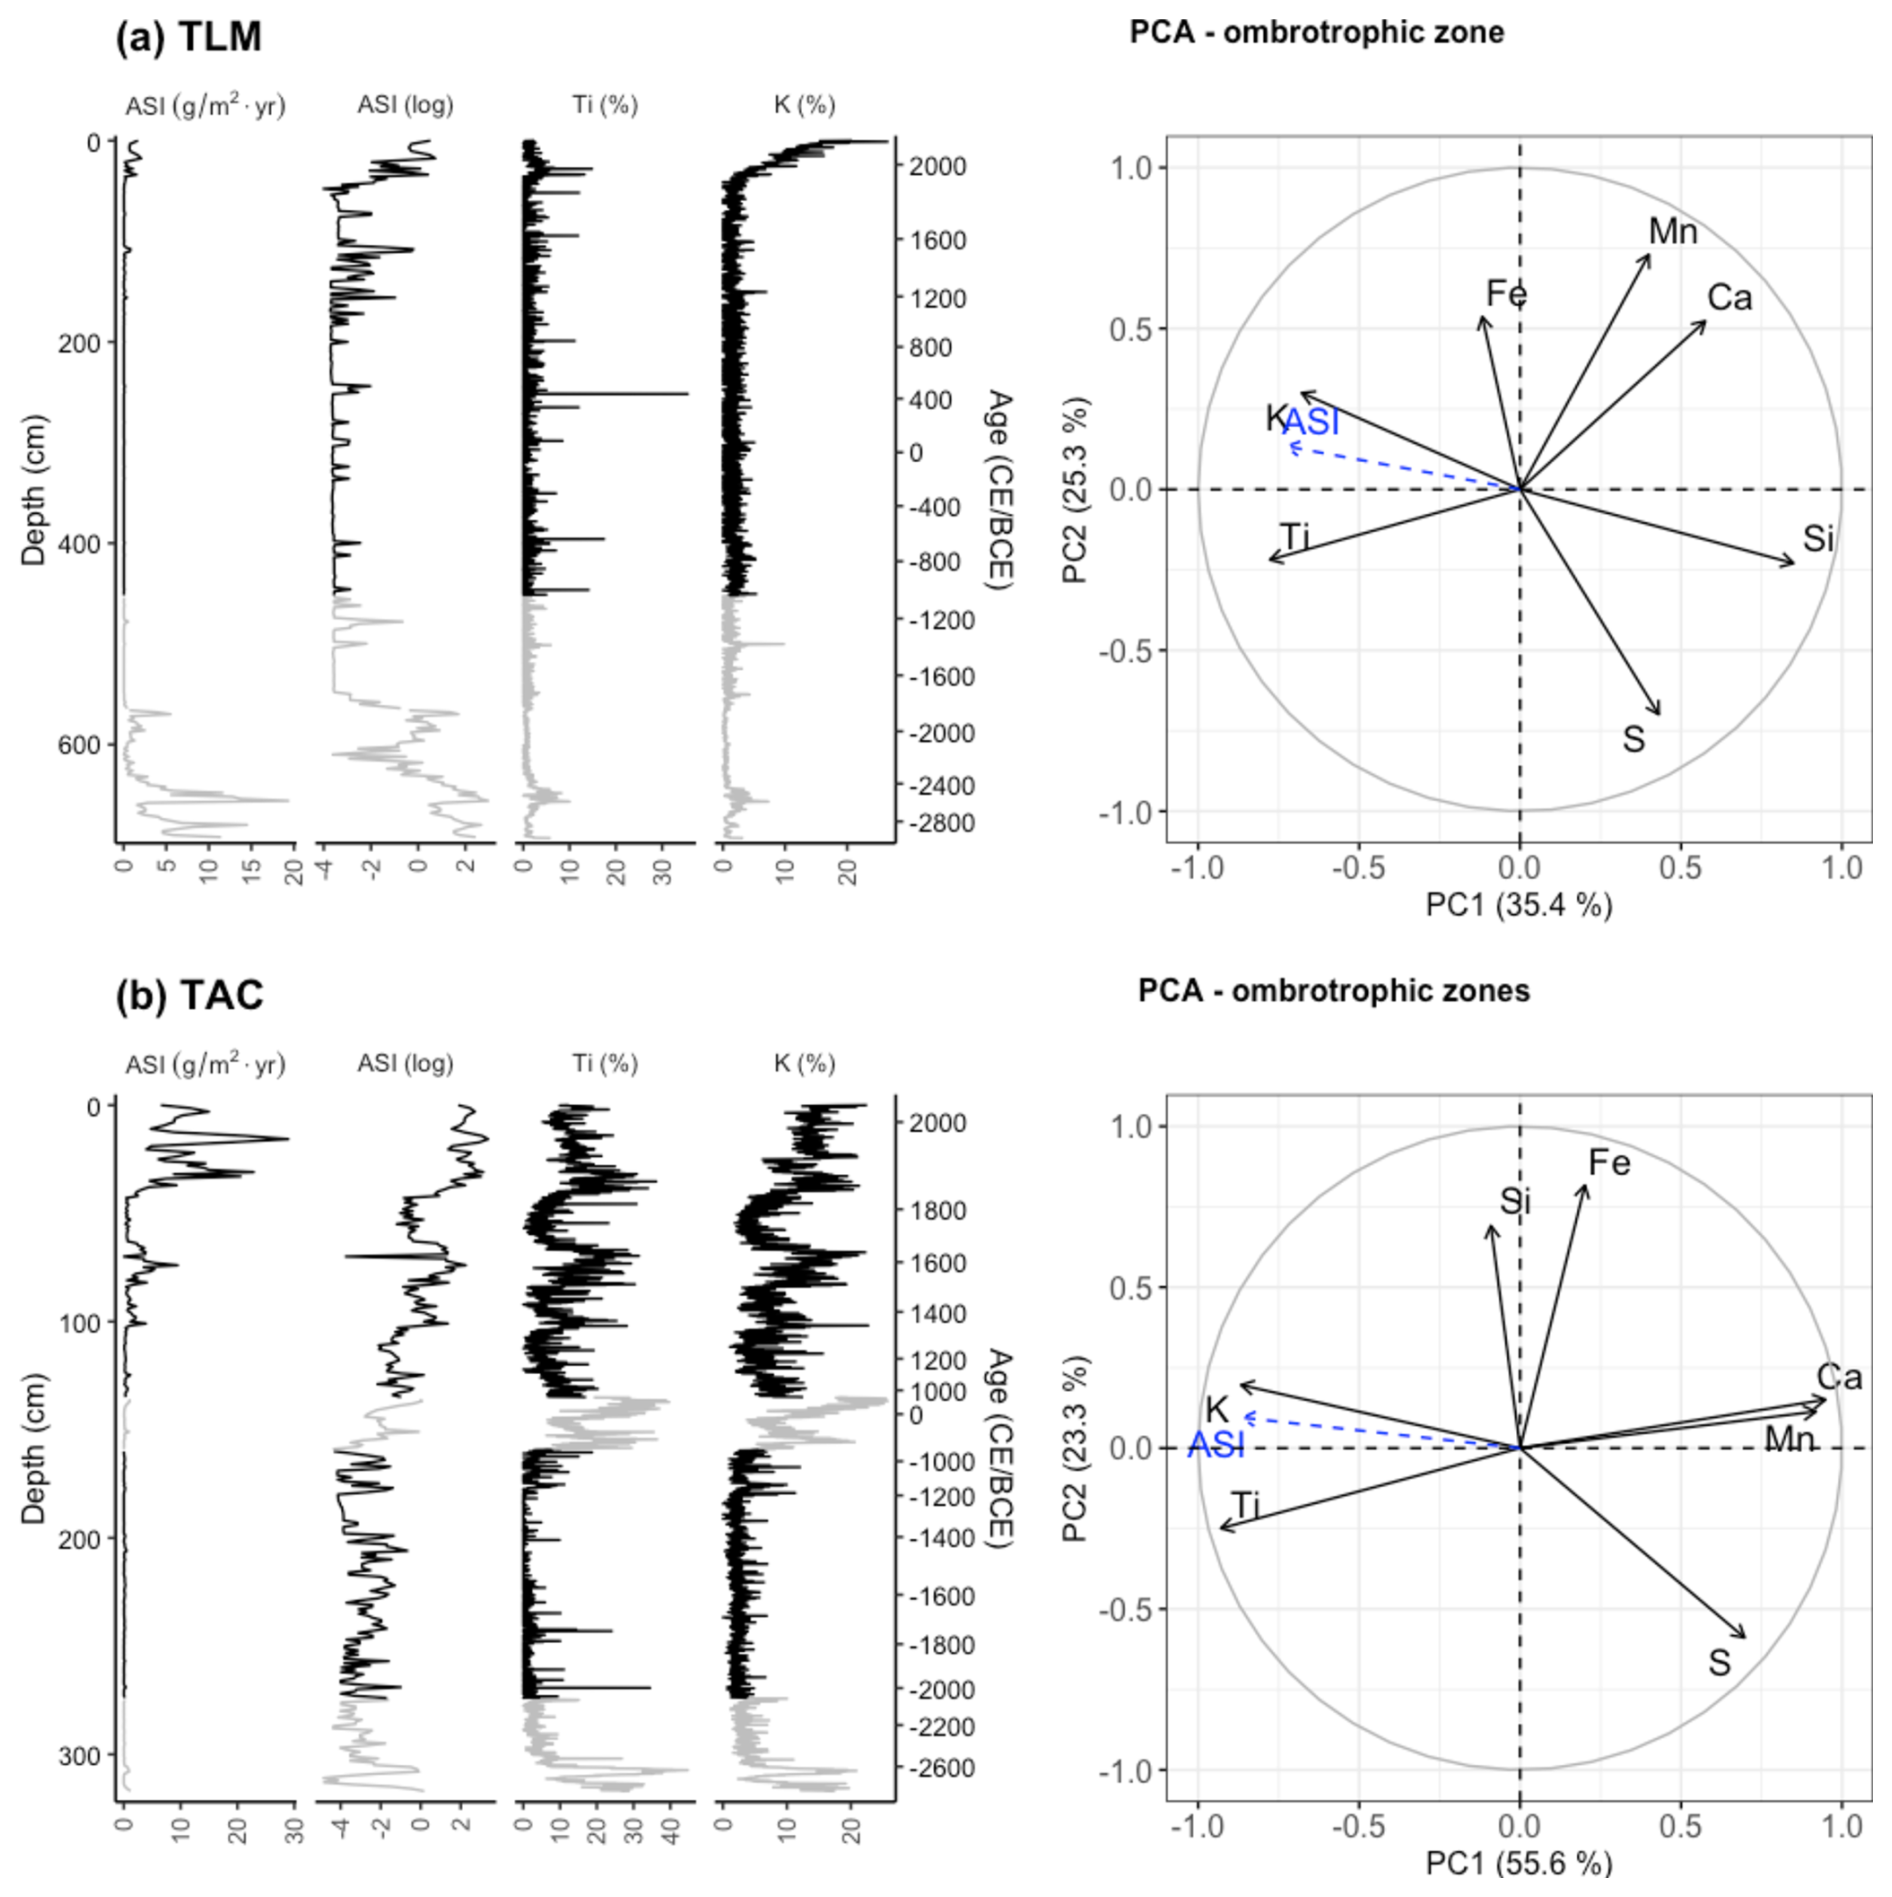
Figure 5Aeolian Sand Influx (ASI) and elemental proxy analysis for (a) TLM and (b) and TAC. Downcore profiles of ASI, log-transformed ASI, Ti, and K are shown by depth, with calibrated age provided as a secondary axis. Ombrotrophic intervals (Zone 3 for TLM; Zones 2 and 4 for TAC, see Fig. 3) are highlighted in black, while minerotrophic or uncertain intervals are shown in grey. Principal Component Analysis (PCA) was conducted on seven CLR-transformed elements, with ASI included as a passive variable, using only the ombrotrophic sections of each core.
In contrast, the TLM record suggests a primary source from local beaches, which are depleted in hematite due to longer transport pathways and reworking. This is consistent with TLM's greater distance from any major cliff exposures. However, beaches can still serve as significant aeolian sediment sources under storm conditions. Local observations show that under normal conditions, sand from exposed dune scarps is often transported inland and deposited in back-dune environments, contributing to landward dune migration (Morin, 2001). This supports the interpretation that, during storms, aeolian transport carries beach sand even farther inland and reaches the TLM bog, especially given its proximity to extensive beach ridge systems to the east (Fig. 1).
5.3 Ti and ASI as proxies for aeolian input and storms
5.3.1 2050 BCE–1851 CE
Our paleo-storm reconstructions integrate ASI variability but rely primarily on identifying Ti extremes as a high-resolution proxy for aeolian input (Fig. 6).
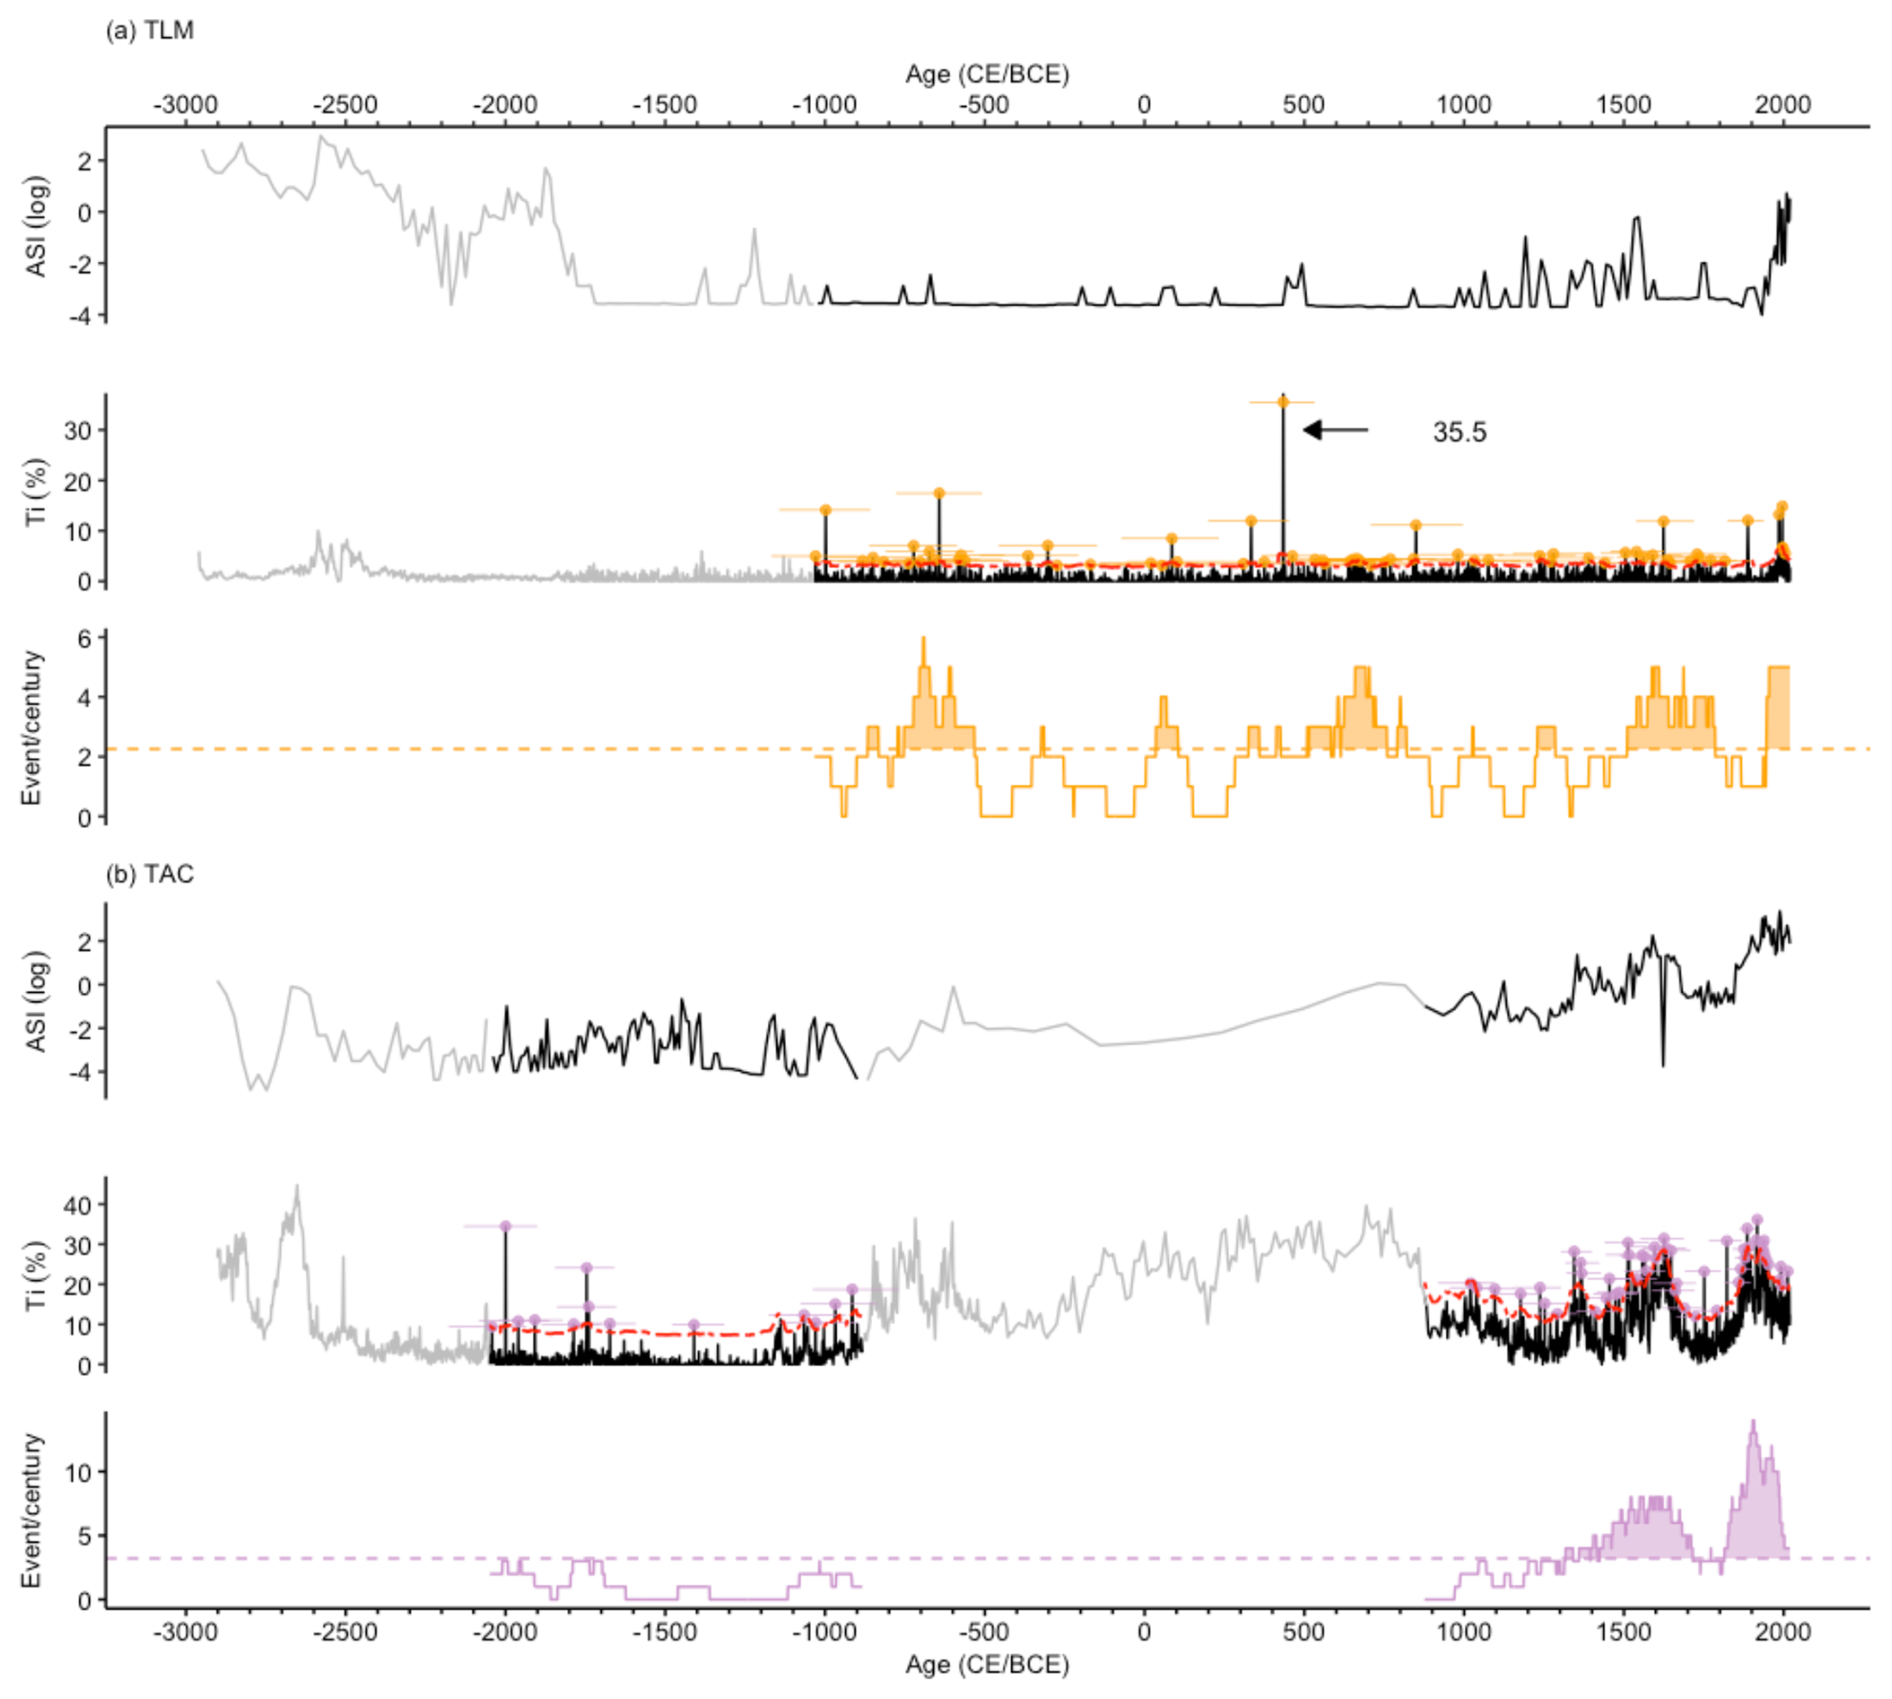
Figure 6ASI (log), Ti (%), and storm events per century for TLM (a; in orange) and TAC (b; in purple). Solid black lines in (a) and (b) show ASI and Ti measurments during the periods of storm reconstruction, corresponding to the ombrotrophic portions of the core. Grey lines indicate the non-ombrotrophic portions of the cores, excluded from the reconstruction. Dashed red lines indicate the moving thresholds of event detection, calculated using the Tukey rule over a moving average (see Methods for details). Events are marked by orange (TLM) and purple (TAC) dots, with horizontal bars representing age uncertainty. Event frequencies are shown as a 100-year moving sum, with the average number of events per century shown as horizontal dashed lines.
During the early ombrotrophic phase at TAC (ca. 2050–880 BCE), both ASI and Ti values remain low, suggesting limited or distant sediment supply (Fig. 6b). This interpretation aligns with the timing of beach ridge development on Havre-Aubert Island, which began around 550 years ago (Rémillard et al., 2015). Similarly, the cliffs south of TAC, now eroding at ∼ 0.3 m yr−1 (Bernatchez et al., 2012b), may have been located further seaward and thus would have been a less accessible sediment source at the time. The below-average storm frequency inferred for this period should therefore be interpreted with caution, as it may partly reflect limited sediment availability rather than reduced storm activity alone. Although our selection of different grain-size fractions at TLM and TAC was based on the modern geomorphological setting, a finer grain size may have been more suitable for detecting storm-related inputs in the older portion of the TAC sequence.
At TLM, ASI remained close to zero between 1035 BCE and 1000 CE (Fig. 6a), suggesting limited sediment availability. During this same interval, TAC shows similarly low ASI values. While other sedimentary processes may have influenced deposition at TAC during this period, the consistently low ASI at both sites suggests that local sediment sources were either inactive or insufficient. Nevertheless, the Ti record at TLM during this time shows numerous peaks, the largest of which correspond to ASI highs (Fig. 6a), but many smaller peaks are unmatched in the ASI records. This discrepancy may highlight a limitation of ASI: the grain-size threshold used to define aeolian input may be too coarse to capture the full range of storm-related sediment delivery. For examples, Vandel et al. (2019) found that ASI based on coarse sand with low overall grain content poorly reflected modern storm activity in Baltic bogs, while including finer grains improved the correlation. At TLM, ASI likely captures only the most intense aeolian events, whereas Ti reflects a broader range of storm-related inputs.
After ca. 1000 CE, both sites show a slight increase in ASI variability, with a marked rise after ca. 1200 CE (Fig. 6). This shift may reflect intensified storm activity, drier climatic conditions enhancing aeolian transport, and/or the activation of new sediment sources, such as the beach ridges and sand spits east of Havre-Aubert (Fig. 1). The continued retreat of the southern sandstone cliffs may also have increased sediment availability, particularly at TAC. While ASI and Ti trends remain well-aligned at TAC, they diverge at TLM between 1200 and 1500 CE, when several ASI peaks are not mirrored in the Ti record (Fig. 6a). Given the strong ASI–Ti correlation at TAC, and the overall consistency of Ti trends at both sites, we place confidence in the Ti signal at TLM during this interval.
ASI values decline between ca. 1600 CE and ca. 1750 CE at TAC, and until ca. 1880 CE at TLM, despite coinciding with the onset of beach ridge development in the region. Given the proximity of active sediment sources by this time, particularly beaches near TLM and eroding cliffs near TAC, this dip more likely reflects climatic controls, such as wetter conditions or reduced storm frequency, than sediment supply limitations. At TAC, Ti and ASI remain closely aligned, while at TLM, Ti suggests higher average storm frequency between 1510 and 1785 CE than ASI would indicate, reinforcing the idea that ASI may underestimate minerogenic input when absolute values are very low.
5.3.2 1851–2019 CE
From the late 18th century at TAC and post-1880 at TLM, ASI increases markedly (Fig. 6). While this may reflect continued storminess and increased sediment availability, it may also be influenced by human-driven landscape changes. Permanent settlement on the Magdalen Islands began in the mid-18th century and expanded after the mid-19th century (Fortin and Larocque, 2003), likely increasing sediment exposure through land clearance, grazing, and infrastructure development. For instance, the ASI between between 1915 and 1970 CE at TAC, not seen at TLM (Fig. 7a–b), may relate to 20th-century coastal gravel road construction near TAC (Fortin and Larocque, 2003).
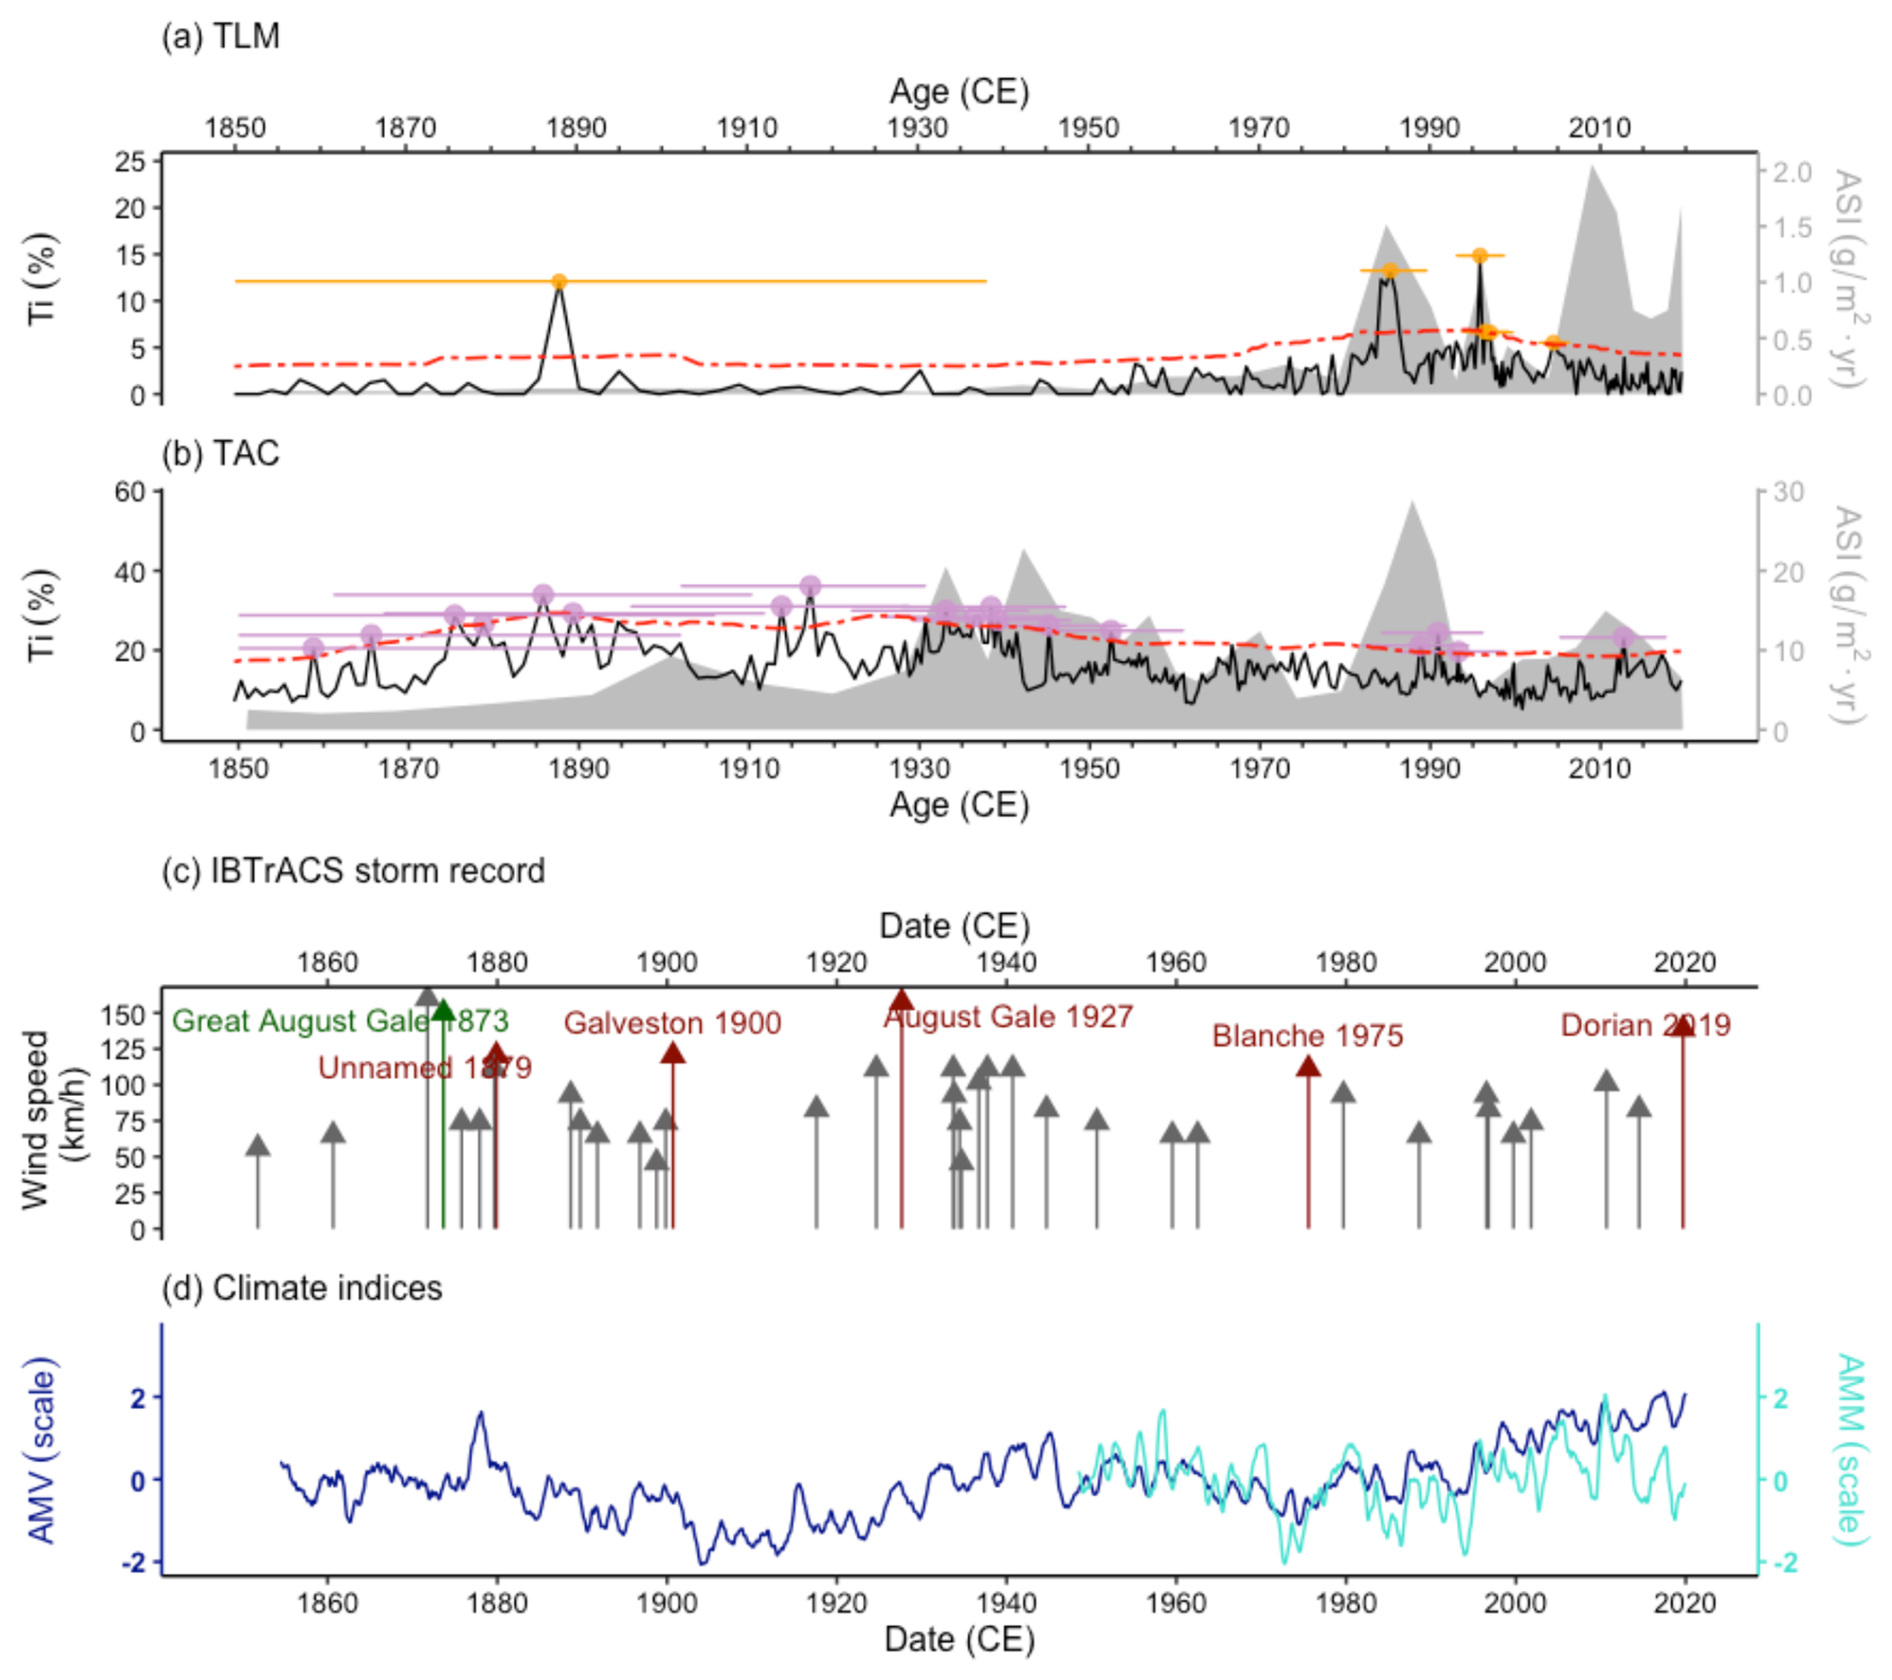
Figure 7(a–b) Modern (1851–2019 CE) storm proxies for TLM (a; in orange) and TAC (b; in purple): the Aeolian Sand Index (ASI; g m2 yr−1) (grey silhouettes) and Ti measurements (CPS) (black lines). Dot-dashed red lines indicate the moving thresholds of event detection, calculated using the Tukey rule (see Methods for details). Events are marked by orange (TLM) and purple (TAC) dots, with horizontal bars representing age uncertainty. The age in CE is based on our age-depth models. (c) Bar chart showing historical wind data from the IBTrACKS dataset (Knapp et al., 2010; Gahtan et al., 2024) showing storms passing within 100 km of the Magdalen Islands and their peak winds (km h−1). Storms with documented impacts in local newspapers and shipwreck records are highlighted in red. The Great August Gale of 1873, highlighted in green, was not in the IBTrACS dataset, but had known impacts on the Magdalen Islands. (d) Instrumental time-series of the Atlantic Meridional Mode (AMM; turquoise) from 1948–2023 (Chiang and Vimont, 2004) and of the Atlantic Multidecadal Variability (AMV; in dark blue) from 1854–2023 (Huang et al., 2017). The dates in CE are calendar dates.
From 1851 CE onward, ASI and Ti records can be compared with storm tracks and intensities from the International Best Track Archive for Climate Stewardship (IBTrACS) dataset (Knapp et al., 2010; Gahtan et al., 2024) (Figs. 7c and 8; Appendix F). Since 1851 CE, 38 tropical cyclones have passed within 100 km of the archipelago, with wind speeds often reaching 75–125 km h−1. These cluster around 1870–1900, 1920–1950, and ∼ 2000 CE. The ASI and Ti records at TAC broadly reflect these trends, with 17 events marked by Ti extremes (Fig. 7b). In contrast, TLM shows only five Ti extremes, with four occurring between ca. 1980 and 2005 CE (Fig. 7a). This suggests that storm signal strength depends heavily on sediment availability and proximity, as seen at TAC.
Attributing individual storms to specific peaks remains difficult. Six of the IBTrACS tropical cyclones had significant local impacts as reported in the newspaper and ship logs (Fig. 7c; Appendix F). For example, Hurricane Dorian (2019 CE), among the region's strongest recent storms (Jardine et al., 2021), is weakly expressed at TLM (possibly the surface ASI peak) and absent at TAC. Hurricane Blanche in 1975 CE (Public Safety Canada, 2024) is not detected at either site. A major Ti peak around 1888 CE at TAC and 1886 CE at TLM may reflect the August Gale of 1873 CE, one of the most destructive storms on record for the Magdalen Islands (Landry, 1989, 1994), although increasing chronological uncertainty before 1930 CE limits confident attribution. Additionally, some Ti peaks may reflect unlisted events in IBTrACS, such as strong nor'easters and winter storms. For instance, the Ti peak at TLM around 1995 CE may correspond to a nor'easter on 7 November 1994, while peaks in both ASI and Ti around 1990 CE could relate to winter storms on 4 December 1989 and 16 December 1990 (Bernatchez et al., 2012a).
Chronological uncertainty may arise from the downward movement of sand and mineral particles within the peat column due to bioturbation, water flow, or settling. For example, aeolian sands from Hurricane Dorian could have been displaced downward, potentially contributing to the prominent peak around 2010 CE. Such post-depositional movement could misdate an event or smear it across multiple depths. However, vertical migration appears limited in ombrotrophic peat. Although direct evidence is scarce, Allen et al. (2021) found that microplastic records in Pyrenean peat closely follow historical production, suggesting minimal post-depositional movement of similarly sized particles. Additionally, high modern accumulation rates at TLM (1.5–2 cm yr−1) and TAC (0.45 cm yr−1) reduce the likelihood of significant disturbance. As peat compacts with depth and becomes more isolated from surface processes, this risk further diminishes, though it cannot be entirely excluded.
5.4 Western North Atlantic Basin comparison
The TLM and TAC records together offer a 4000-year chronology of storm activity for the Magdalen Islands, adding critical insights to the limited records available from the northern extent of the North Atlantic hurricane track. Despite being aeolian reconstructions, the Magdalen Islands records show notable similarity with marine overwash records from lakes and blue holes spanning the past 2000 years from eastern Canada, the US, and the Bahamas (Fig. 9). This north-south transect across the western North Atlantic reflects modern storm tracks from the Magdalen Islands (Fig. 8a) and enables broader regional comparisons.
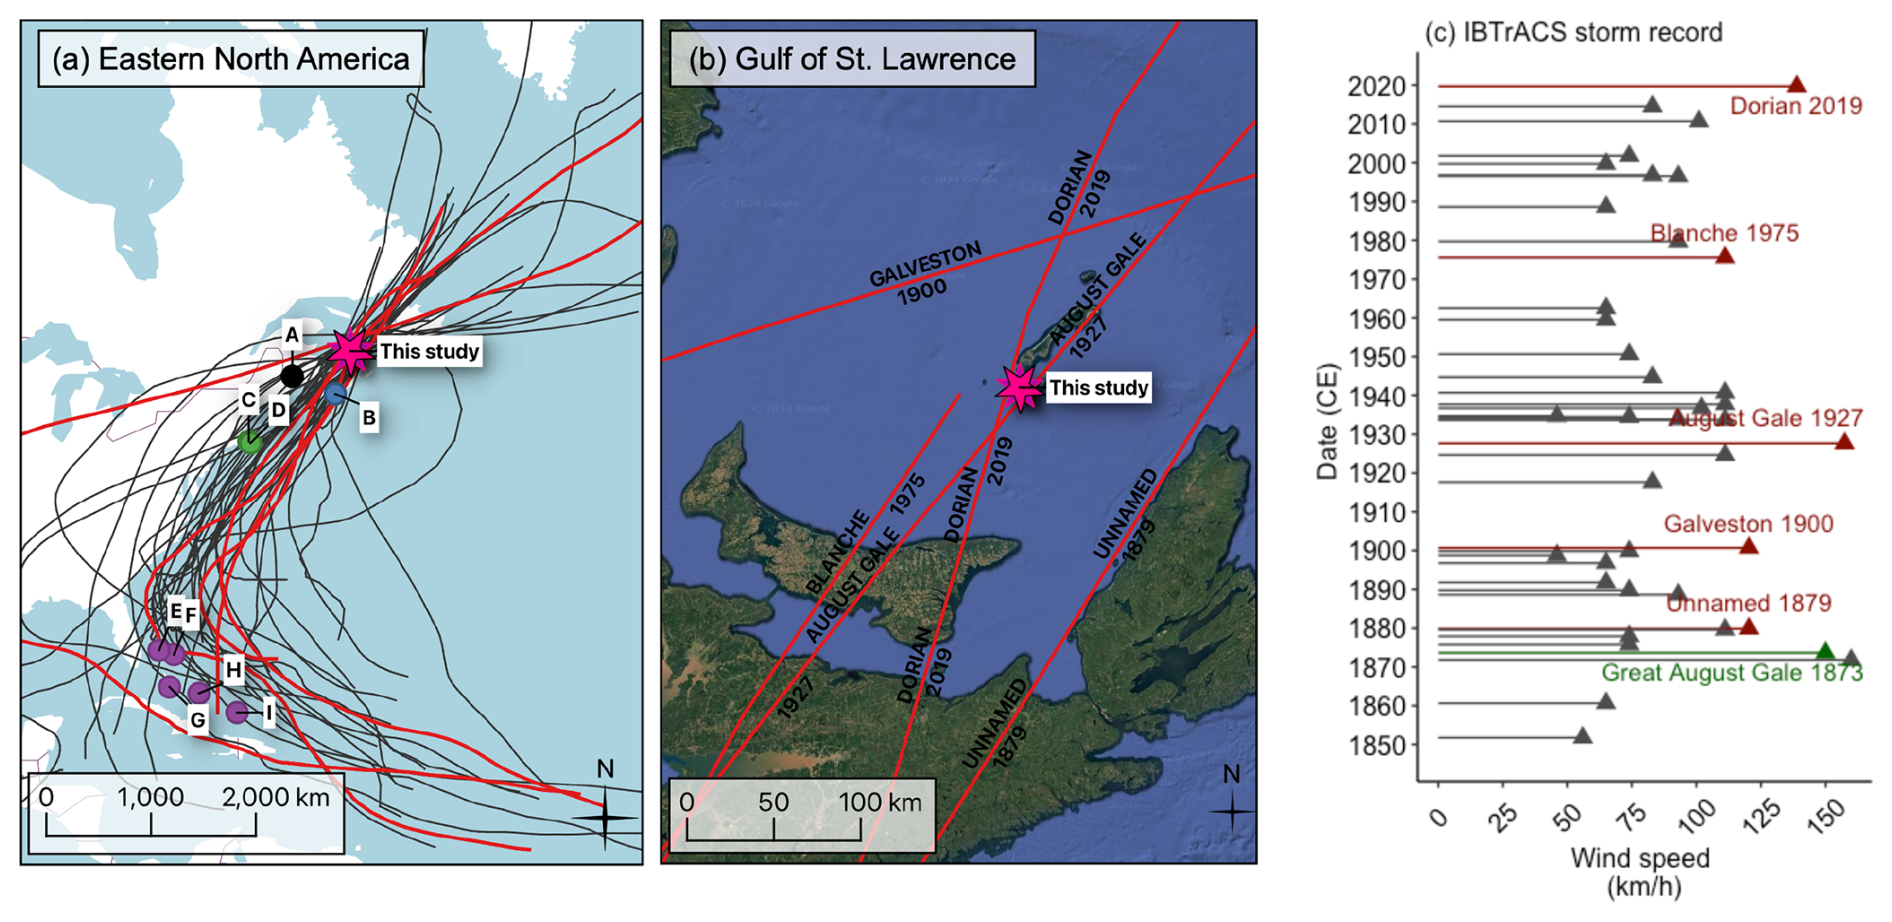
Figure 8(a) Map showing the location of the Magdalen Islands (pink star – this study) and tracks of storms passing within 100 km, based on the IBTrACKS dataset from 1851–2019 CE (Knapp et al., 2010; Gahtan et al., 2024). Storms known to have impacted the Magdalen Islands are highlighted in red. Some paleo-storm records referenced in this paper are marked on the map: A (black circle) – Harvey Lake, New Brunswick, Canada (Patterson et al., 2022); B (blue circle) – Robinson Lake, Nova Scotia, Canada (Oliva et al., 2017); C and D (green circle) – Mattapoisett Marsh (Boldt et al., 2010) and Salt Pond, Massachusetts (Donnelly et al., 2015); E–I (purple circles) – the studies compiled in the Bahamas compilation: Grand Bahamas (E) (Winkler et al., 2023), Thatchpoint Blue Hole (F), South Andros (G) (Wallace et al., 2019), Long Island (H) (Wallace et al., 2021b), and Middle Caicos (I) (Wallace et al., 2021a). (b) Enlarged view of the Magdalen Islands region, showing storm tracks with documented local impacts. (c) Bar chart showing peak winds (km h−1) of the storms indicated in panels (a) and (b) as they passed within 100 km of the Magdalen Islands. The Great August Gale of 1873, highlighted in green, was not in the IBTrACS dataset, but had known impacts on the Magdalen Islands. Imagery panel (b): © Google Earth Pro 7.3.6.9796 (2024), Gulf of St. Lawrence, Canada. Image date 31 December 2023, © Landsat/Copernicus.
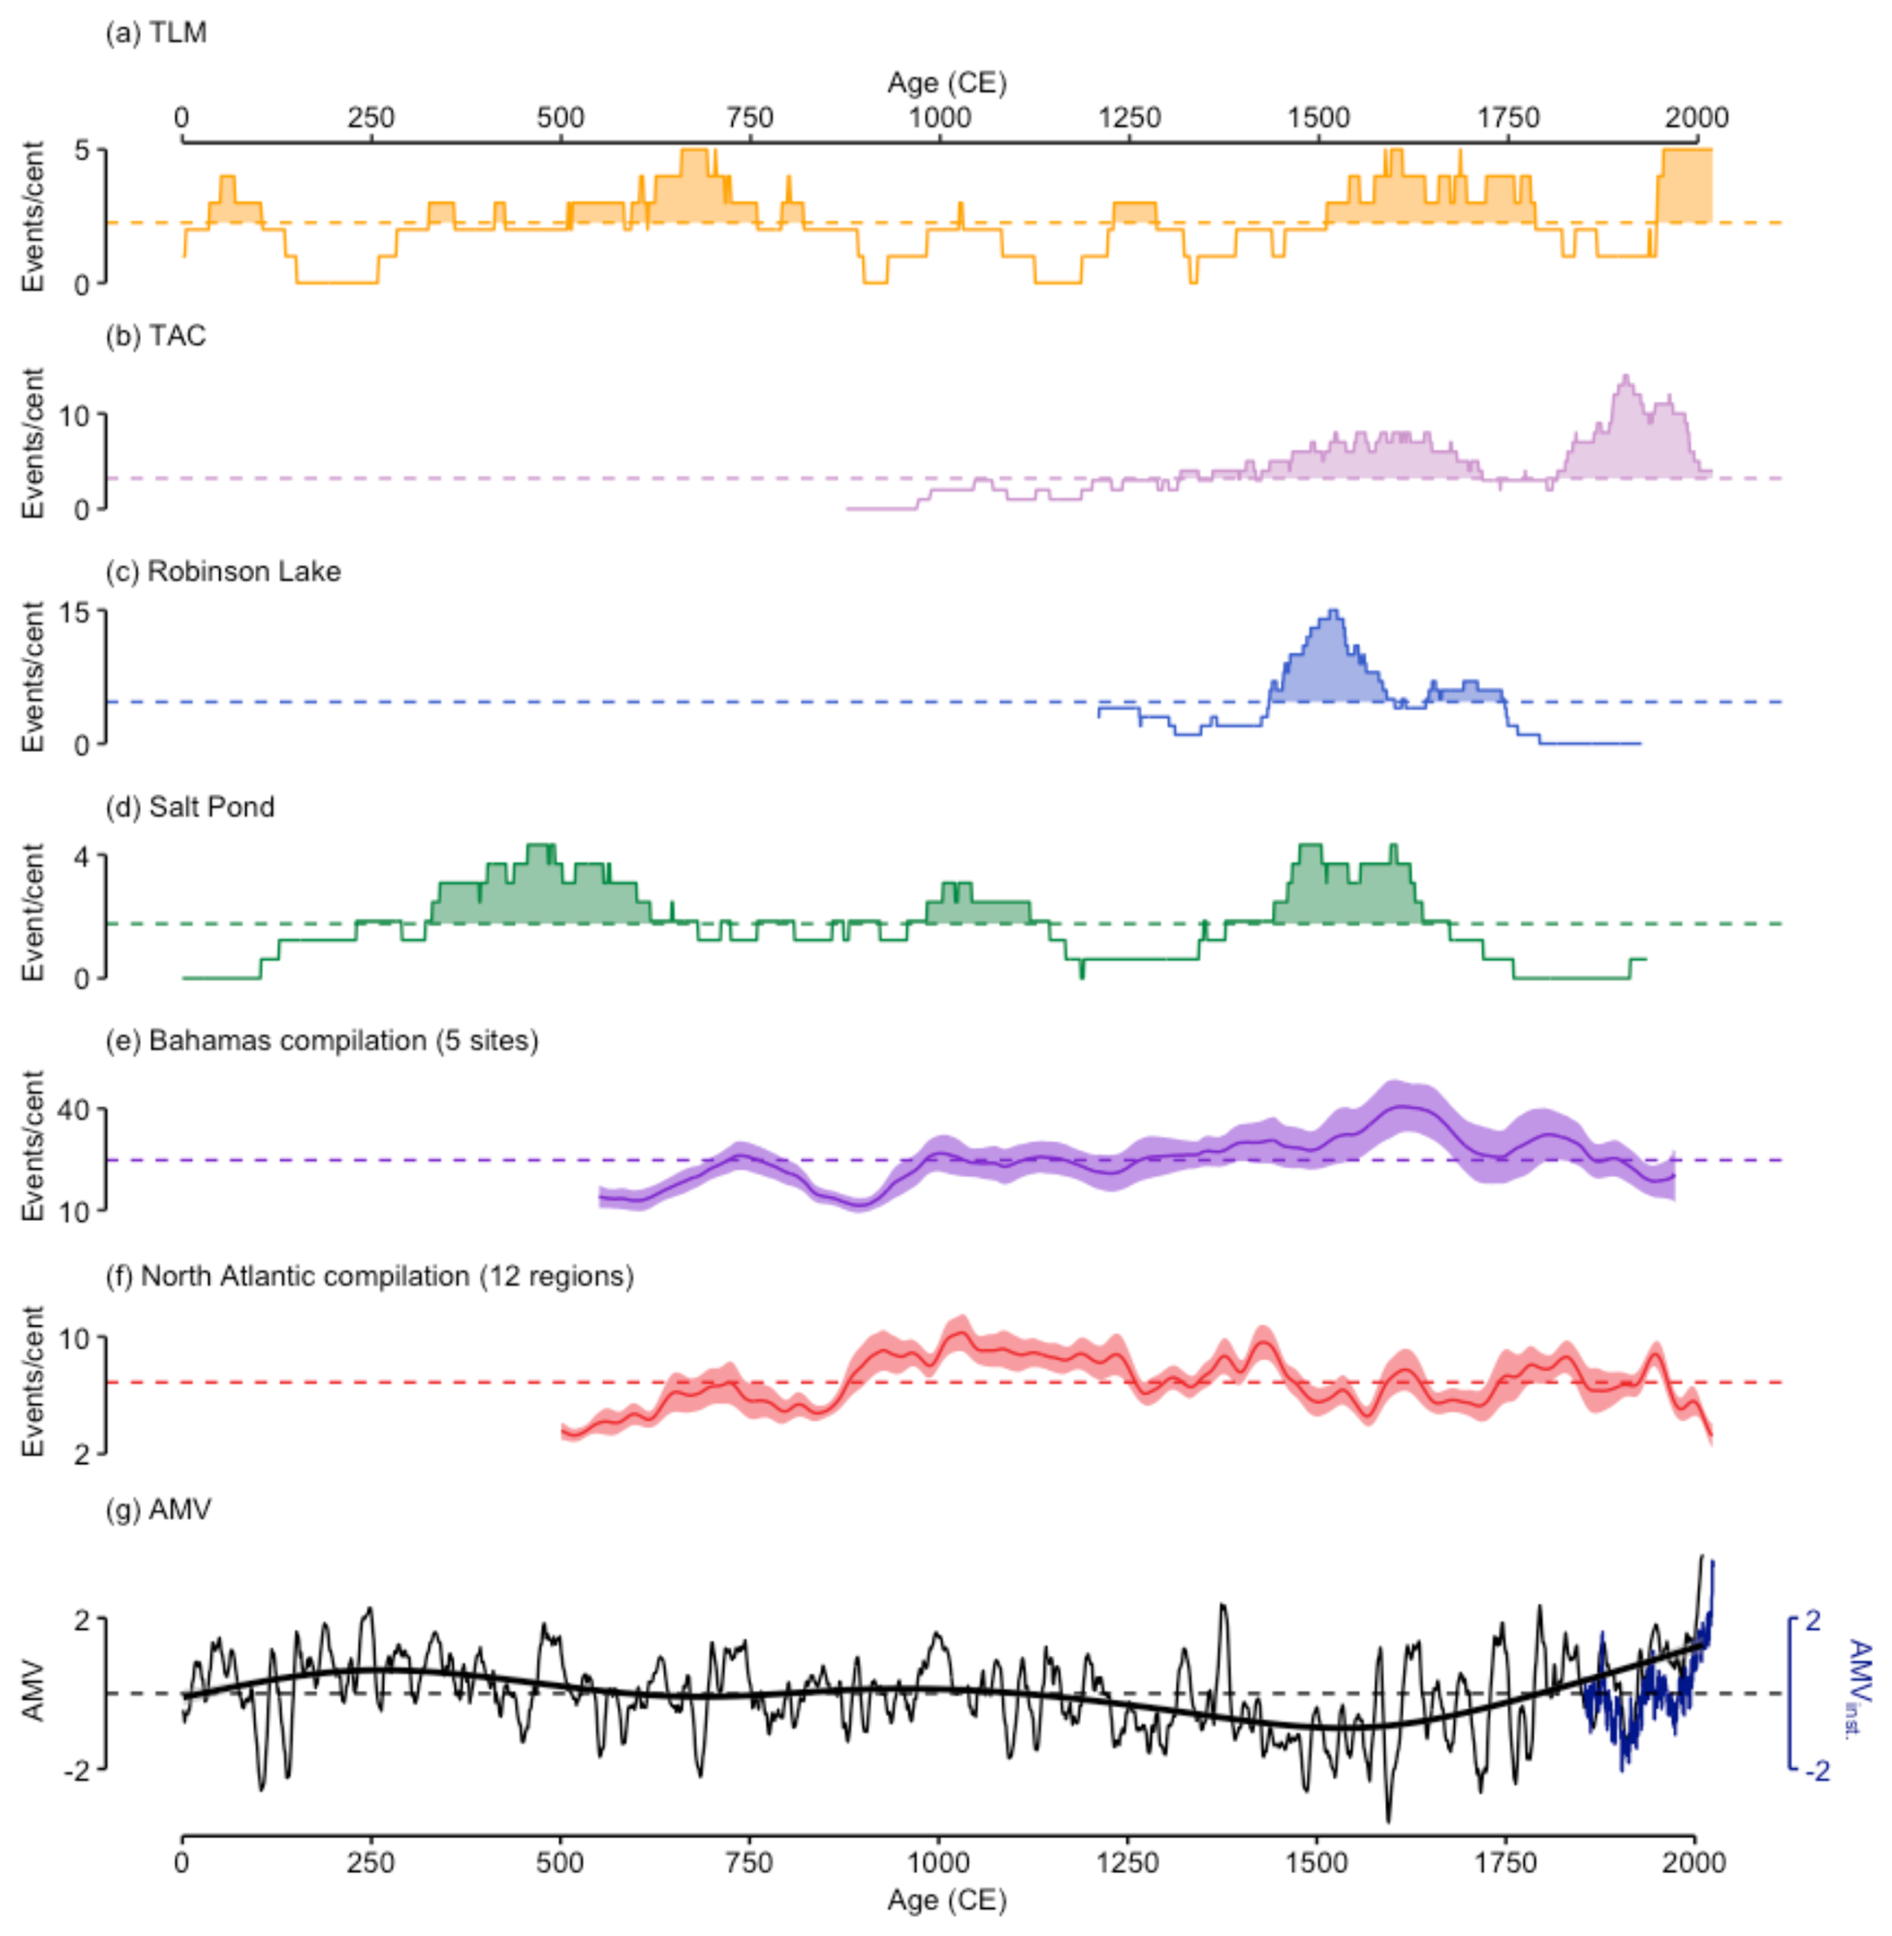
Figure 9Events per century (Event/cent) from the Magdalen Islands and nearby regions reconstructions. (a–b) 100-year moving sum of storm events at TLM (orange line) and TAC (purple line). (c–e) Comparisons with previously published paleo-storm reconstructions. (c) 100-year moving sum of storm overwash events from Robinson Lake, Nova Scotia, between 1210–1925 CE (Oliva et al., 2017). (d) 100-year moving sum of storm overwash events from Salt Pond, Massachusetts, spanning the past 2000 years (Donnelly et al., 2015). (e) A smoothed 1500-year compilation of storm records from five Bahamian blue hole records, with the shaded area representing the confidence interval (Wallace et al., 2019, 2021a, b; Winkler et al., 2020, 2023). The location of the studies in (a)–(e) is shown in Fig. 6a. (f) Smoothed 1500-year compilation of storm records from 12 regions spanning from Belize to New England from Yang et al. (2024). (g) The annually-resolved Atlantic Multidecadal Variability (AMV) reconstruction based on titanium measurements from a varved lake record from Ellesmere Island, in Arctic Canada. An instrumental AMV record (1854–2023) is shown in dark blue (Huang et al., 2017).
During the instrumental period (1851 CE–present), the storm records from the Bahamas to the Magdalen Islands show significant heterogeneity (Fig. 9). The only temporally overlapping record from eastern Canada, at Harvey Lake, New Brunswick, also indicates elevated storm activity after ∼ 1895 CE (Patterson et al., 2022). While the Harvey Lake study does not calculate events per century and is thus excluded from Fig. 9, it corroborates trends in TLM and TAC. In contrast, the record from Salt Pond, Massachusetts, does not show a comparable increase (Donnelly et al., 2015) (Fig. 9d), though a nearby record from Mattapoisett Marsh, just 18 km south of Salt Pond, documents numerous 20th century hurricanes strikes (Boldt et al., 2010). Donnelly et al. (2015) attribute this discrepancy to Salt Pond's avoidance of several modern hurricanes. Similarly, the Bahamian compilation, aggregating five blue hole storm records across the archipelago, shows a quiet 20th century (Fig. 9e). This trend reflects mostly inactivity at the southern sites (South Andros, Long Island, and Middle Caicos), while northern sites (Grand Bahamas and Abaco) exhibit increased storm activity (Wallace et al., 2021a; Winkler et al., 2023).
The Little Ice Age (LIA, ∼ 1300–1850 CE) (Magnan and Garneau, 2014) stands out as an active hurricane period across the western North Atlantic. At TLM, increased storm activity persisted between 1510–1785 CE (Fig. 9a). Similarly, TAC shows heightened activity 1320–1715 CE, with a calm period between 1400–1435 CE, and a peak between 1500–1600 CE (Fig. 9b). These trends align with Robinson Lake, Nova Scotia, which shows increased storm activity between 1475–1670 CE (Oliva et al., 2018) (Fig. 9c), and Harvey Lake, New Brunswick, where coarse silt beds were deposited between 1630–1640 CE (Patterson et al., 2022). Salt Pond also experienced elevated storm activity with 35 events between 1500–1600 CE (Donnelly et al., 2015) (Fig. 9d). In the Bahamas, storm activity peaked between 1570–1670 CE (Fig. 9e), matching patterns observed in the Magdalen Islands and nearby sites (Winkler et al., 2023). Notably, none of these records document storm activity during the early LIA (∼ 1200–1400 CE), as seen in the Magdalen Islands.
During the Medieval Climate Anomaly (MCA), which lasted between ∼ 900–1300 CE in the Gulf of St. Lawrence (Magnan and Garneau, 2014), storm activity decreased across the Magdalen Islands, consistent with calmer periods at Salt Pond and in the Bahamas (Fig. 9d–e). However, brief upticks between 1000–1100 CE at Salt Pond and 980–1030 CE in the Bahamas contrast with calm conditions in the Magdalen Islands. In the Bahamas, the increase is attributed to southern sites like Southern Andros (Wallace et al., 2019) and Middle Caicos (Wallace et al., 2021a), while northern sites, such as the Grand Bahamas, recorded a decrease in storm frequency from 550–1090 CE (Winkler et al., 2023) (see Fig. 8a for location). Between 500–750 CE, storm frequency at TLM aligns with increased storm activity in the Bahamas (720–820 CE), while Salt Pond documented an earlier active period between 300–600 CE, partly overlapping with the TLM record (Fig. 9c). During this period, sediment delivery at TAC was also elevated (Fig. 6b). Unfortunately, the lack of pre-LIA eastern Canadian records limits our understanding of storm dynamics earlier in the record, while the shorter duration of the Salt Pond and Bahamas reconstructions (< 2000 years) restricts longer-term comparison with the Magdalen Islands data. Overall, the similarities between our Magdalen Islands reconstruction and records from the eastern seaboard and the Bahamas lend additional confidence to our interpretations of ASI and Ti as storm proxies.
5.5 Regional insights into long-term drivers of storm activity
Storm records from the Magdalen Islands, eastern Canada, New England, and the Bahamas reveal consistent patterns suggesting that our Magdalen Islands records capture storms originating in the Main Development Region (MDR), located in the tropical Atlantic off West Africa. These storms typically track through the Bahamas before recurving towards the US east coast and eastern Canada (Kossin et al., 2010), a pattern consistent with the IBTrACS storm tracks observed in the Magdalen Islands since 1851 CE (Fig. 8a).
Hurricane activity in the MDR is strongly influenced by the Atlantic Meridional Mode (AMM), a coupled ocean-atmosphere system driven by variations in tropical Atlantic sea surface temperatures (SSTs) and vertical wind shear (VWS) (Kossin and Vimont, 2007; Vimont and Kossin, 2007; Klotzbach and Gray, 2008; Kossin, 2017; Ting et al., 2019). Positive AMM phases, characterized by elevated SSTs and reduced VWS, create favourable conditions for storm formation and intensification (Kossin, 2017). Although long-term AMM reconstructions are unavailable, the AMM is positively correlated with the Atlantic Multidecadal Variability (AMV) (Fig. 7d), and variations in the AMV are thought to indirectly modulate long-term hurricane activity by influencing AMM trends (Kossin and Vimont, 2007; Vimont and Kossin, 2007). The annually resolved AMV reconstruction from Lapointe et al. (2020) identifies a strong negative AMV during the LIA (not conducive to hurricane formation) and a more positive phase during the MCA (conducive to hurricane formation) (Fig. 9g). This trend is corroborated by other coarser-resolution AMV reconstructions (Mann et al., 2009b; Wang et al., 2017).
Nevertheless, storm records from eastern Canada (including that from the Magdalen Islands), New England, and the Bahamas show the opposite trend: increased storminess during the LIA and reduced activity during the MCA. For instance, Mann et al. (2009a), in a statistical reconstruction of paleo-hurricane frequency across the North Atlantic, estimated low hurricane counts during the LIA and higher counts during the MCA. A recent synthesis of proxy-based paleo-storm reconstructions spanning from Belize to New England (Yang et al., 2024) supports this, showing elevated storm frequency from 900–1200 CE, followed by a calm period from 1250–1700 CE, interrupted only by a peak in activity between 1375–1475 CE (Fig. 9f). This contrasts with widespread evidence from eastern Canada, New England, and the Bahamas showing frequent storms throughout the LIA. This persistent antiphase with the tropical Atlantic suggests that regional factors, such as storm track shifts or local intensification, may dominate at higher latitudes during periods of low tropical storm activity.
Several studies support this view. Patterson et al. (2022) and Oliva et al. (2018) proposed that elevated storm activity during the early LIA might reflect local warmer SSTs in the Gulf of Maine and the Sargasso Sea, despite cooler temperatures in the MDR. Dickie and Wach (2024) provide a concise summary of these mechanisms, highlighting that while the LIA experienced colder winter and lower annual mean temperatures, warmer summers may have been sufficient to fuel local storm intensification in mid-latitude North America. Ting et al. (2019) documented a dipole pattern over the past 150 years, where positive AMV conditions in the MDR coincide with unfavourable conditions along the US east coast – and vice versa – possibly shifting storm activity northward during negative AMV phases.
The Magdalen Islands records add significant value to western North Atlantic storm reconstructions. They extend evidence suggesting that mid- to high-latitude storm activity is governed less by conditions in the MDR and more by regional controls such as SST gradients, storm steering, and local intensification. As a long, uninterrupted record from a previously underrepresented region, our data help bridge the spatial gap between well-studied tropical sites and the North American coast, offering new insights into the climatic drivers of storm variability over centennial to millennial scales.
The Magdalen Islands, located near the centre of the Gulf of St. Lawrence in Atlantic Canada, have been impacted by post-tropical cyclones and other storm events over the last century. Our new 4000-year storm reconstruction, based on aeolian inputs in ombrotrophic peat, provides one of the longest and most northerly continuous paleo-storm records in the western North Atlantic, and in doing so offers critical insights into storm dynamics at the northern limit of the North Atlantic hurricane track.
Across the western North Atlantic basin, our records align with regional reconstructions from eastern Canada, New England, and the Bahamas, confirming increased storm activity during the Little Ice Age (1300–1850 CE) and reduced activity during the Medieval Climate Anomaly (∼ 900–1300 CE). Notably, these storm patterns show an antiphase relationship with tropical Atlantic variability, such as the AMM and the AMV, indicating that regional factors, including local sea surface temperature gradients, and storm intensification mechanisms, may play a dominant role in modulating storminess at higher latitudes, rather than tropical cyclone formation alone.
The similarity between our work and marine overwash records from eastern North America demonstrates the complementary value of aeolian and peatland archives. The latter records enrich the paleo-storm literature by providing additional perspectives on past storm activity, including information on wind strength and direction. Moreover, they expand the range of potential sites for paleo-storm reconstructions, particularly in mid-latitude regions where data remain scarce.
Our results also highlight important site-specific challenges in interpreting peat-based storm records. Despite their geographic proximity, the two study sites, TLM and TAC, exhibited critical differences in sediment input and signal strength. These differences stem largely from variations in bog size, proximity to sediment sources, and hydrological sensitivity. TAC, being smaller and closer to eroding sandstone cliffs, displayed a stronger and more variable storm signal sensitive to long-term environmental changes. In contrast, TLM's record showed a more muted but consistent signal over time, likely due to its greater distance from sediment sources. This underscores the need to carefully consider site selection and local geomorphological context in future research.
Future research should also focus on elucidating the climatic mechanisms driving the storm variability recorded here, which is vital for projecting future storm impacts in eastern Canada. Further work is also needed to better understand depositional processes of sand in peat environments and to develop improved modern calibration techniques. Despite these challenges, paleo-storm studies such as ours remain critical for extending the temporal scope of storm records and enhancing understanding of storm-climate interactions in sensitive coastal regions.
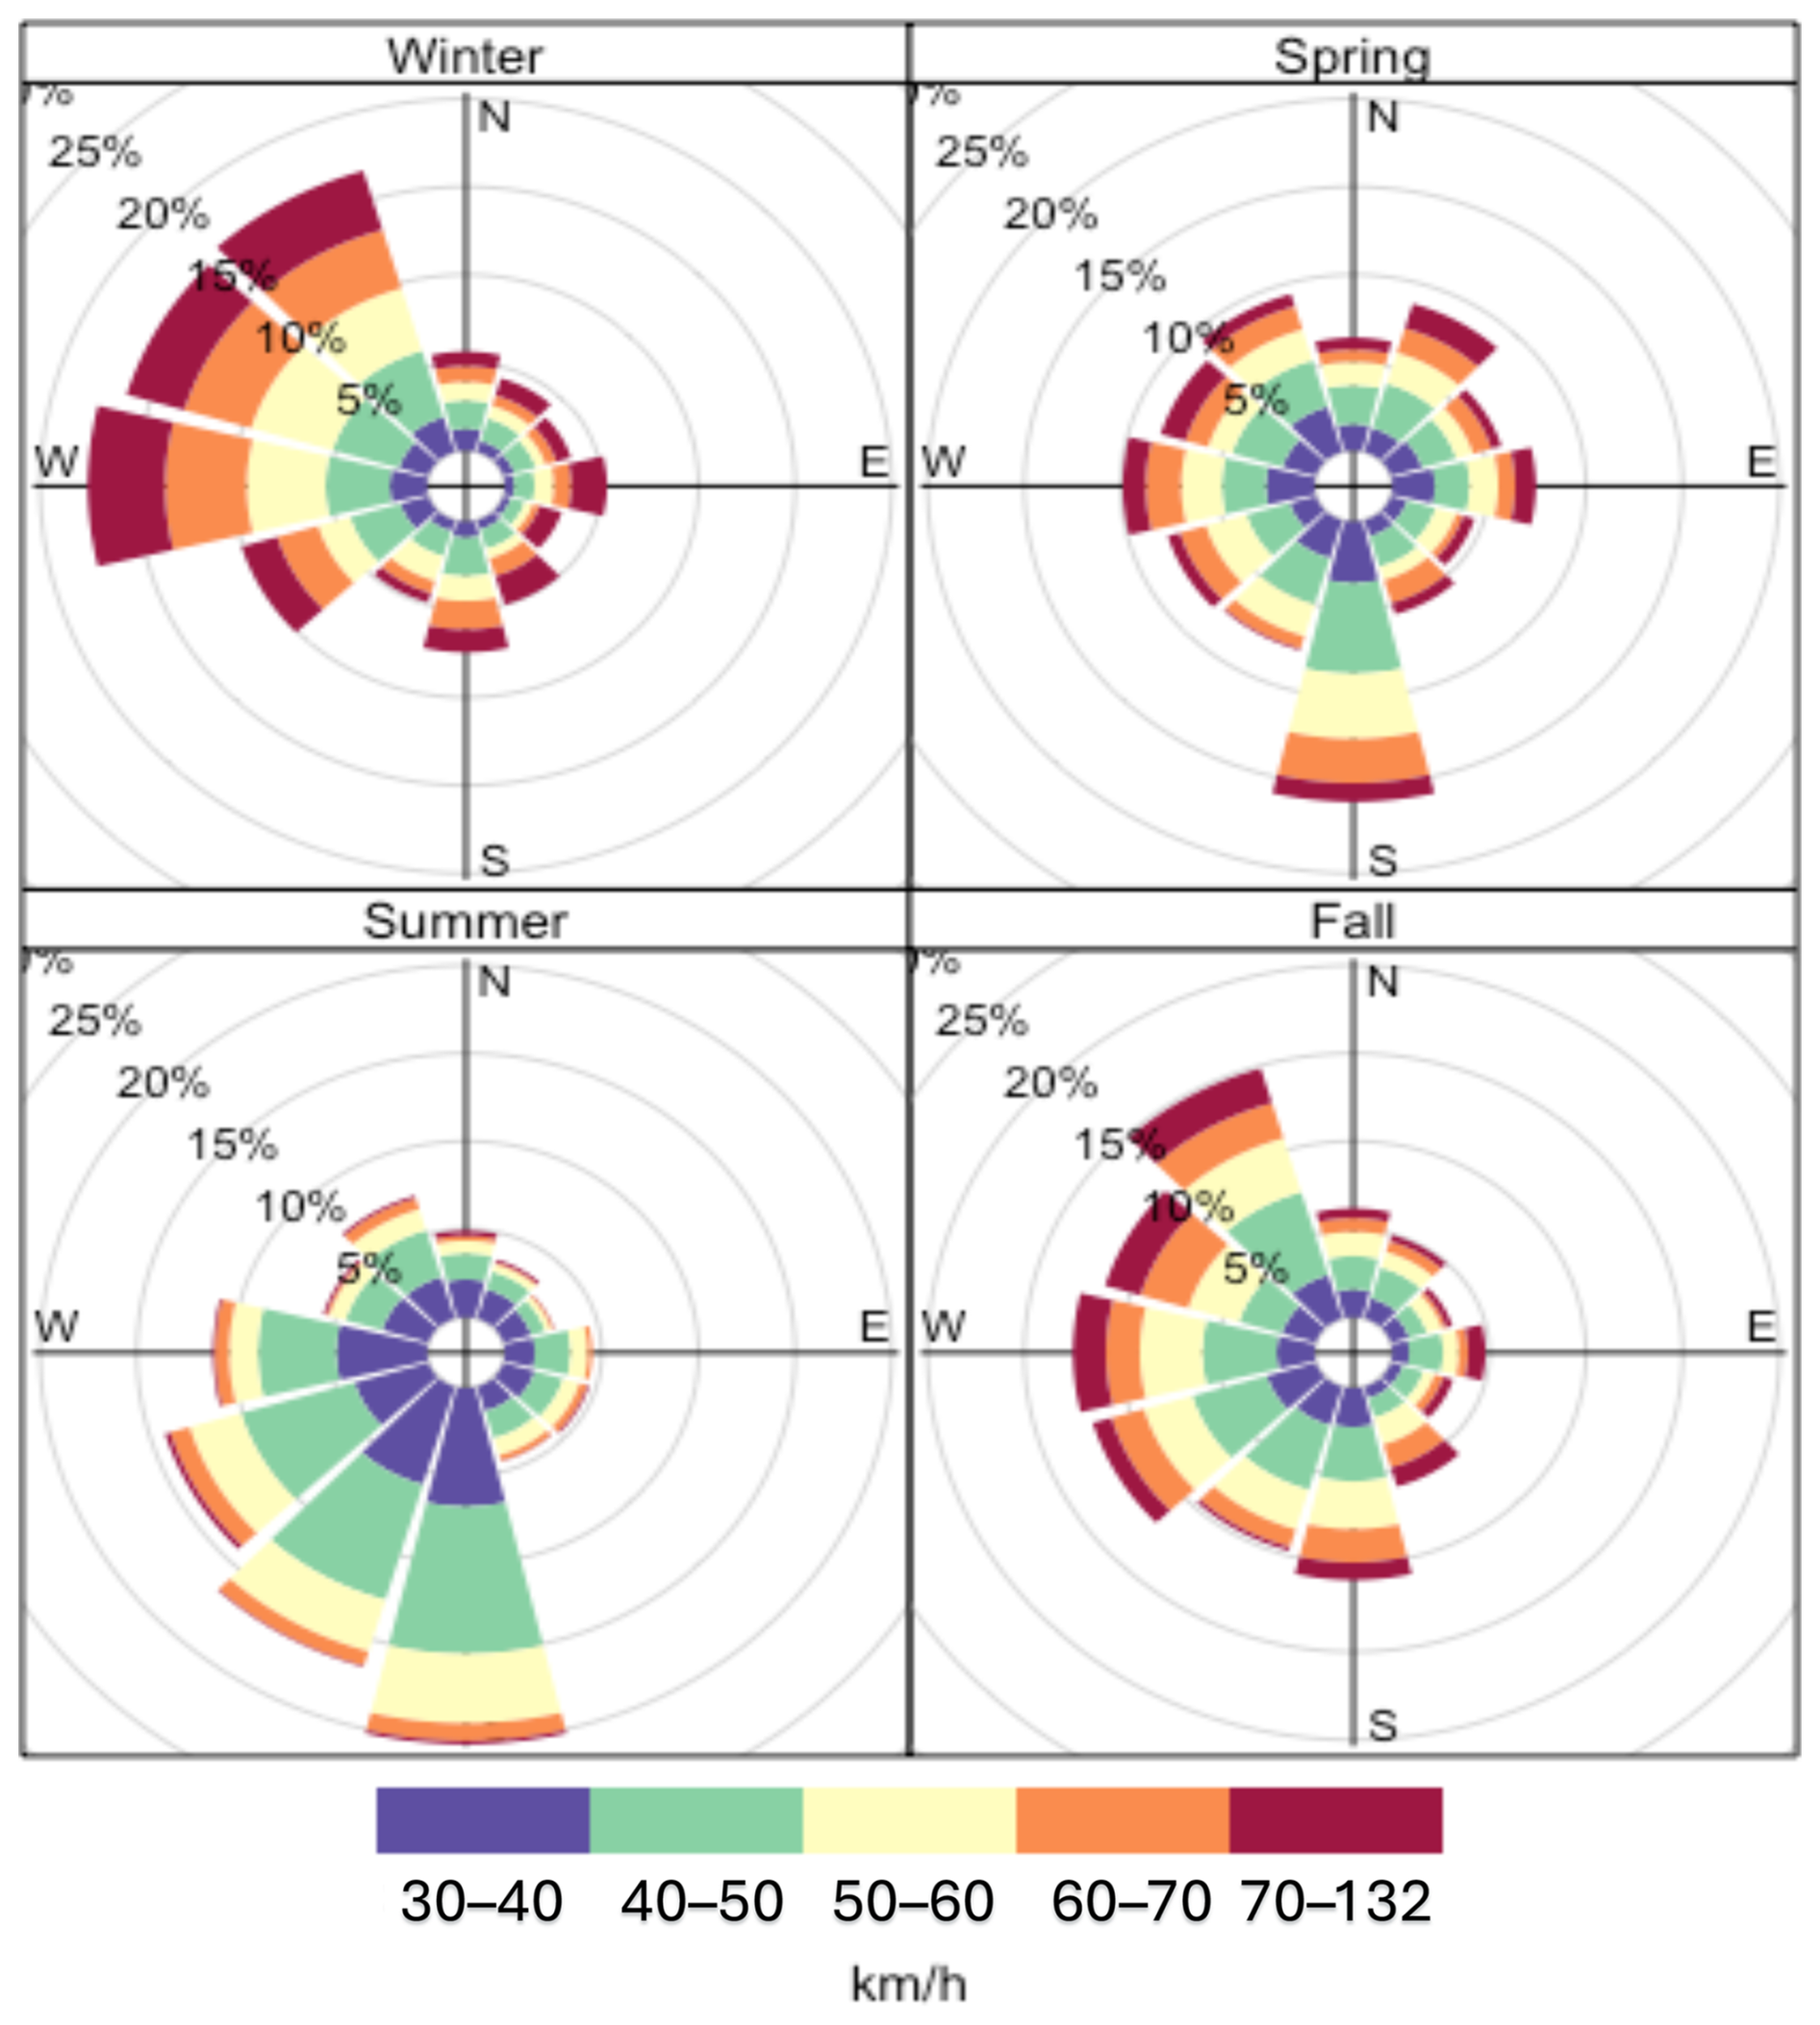
Figure A1Seasonal wind roses displaying the 12 directions of incoming winds based on daily peak wind gusts data from 1984 to 2018 on the Magdalen Islands. The number of days (expressed as %) for any category of speed of peak wind gusts (in km h−1) are indicated for each wind direction.
B1 Compression correction factors
The surface monoliths experienced compaction during transport and storage: the TLM monolith compressed from 50 to 28 cm, and the TAC monolith from 50 to 31 cm. To correct for this, a compression correction factor was calculated by dividing the original length (50 cm) by the compressed length at the time of analysis, resulting in factors of 1.79 (TLM) and 1.61 (TAC). Depths within each monolith were multiplied by the respective factor to restore their original, uncompressed position. These corrections were applied only to the surface monoliths, not the deeper cores.
B2 Construction of composite cores
Table B1Main core drives from the TLM and TAC sites. The TLM composite core consists of the first 25 cm of TLM-monolith (0–25 cm), the first 75 cm of TLM-2 (25–100 cm) and the entire TLM-1 drive (100–700 cm). The TAC composite core consists of the first 25 cm of TAC-monolith (0–25 cm), the entire TAC-2 drive (25–275 cm), and a 50 cm segment from TAC-3 (275–325 cm). The remaining portion of TLM-2 and the entire TAC-1 core were archived for possible future analyses.
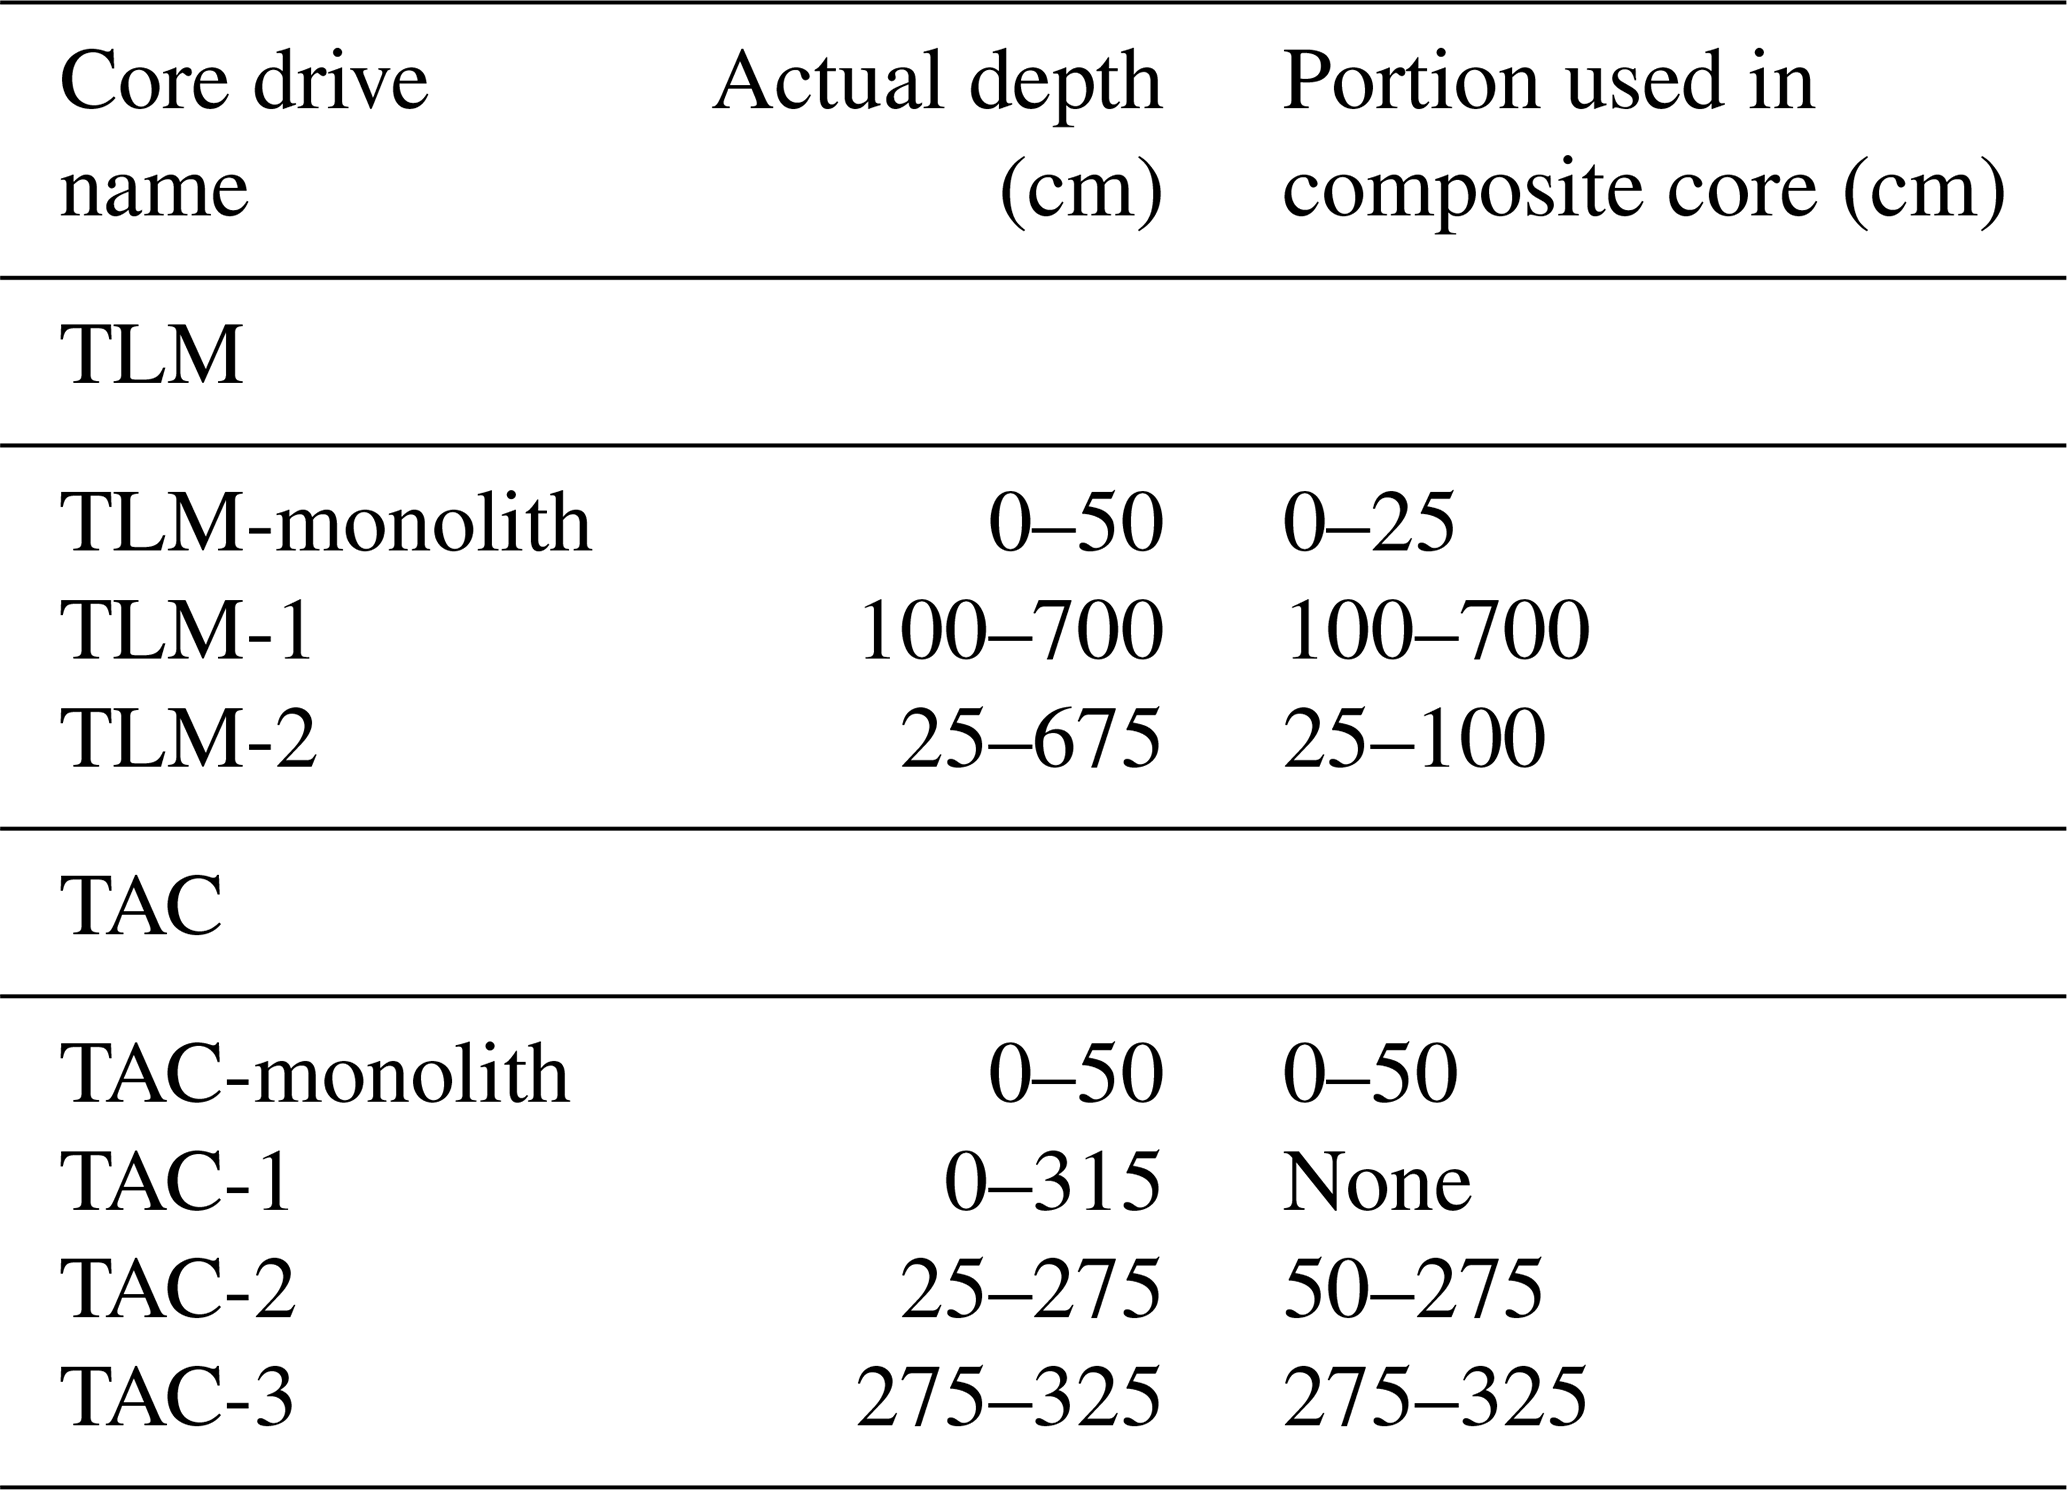
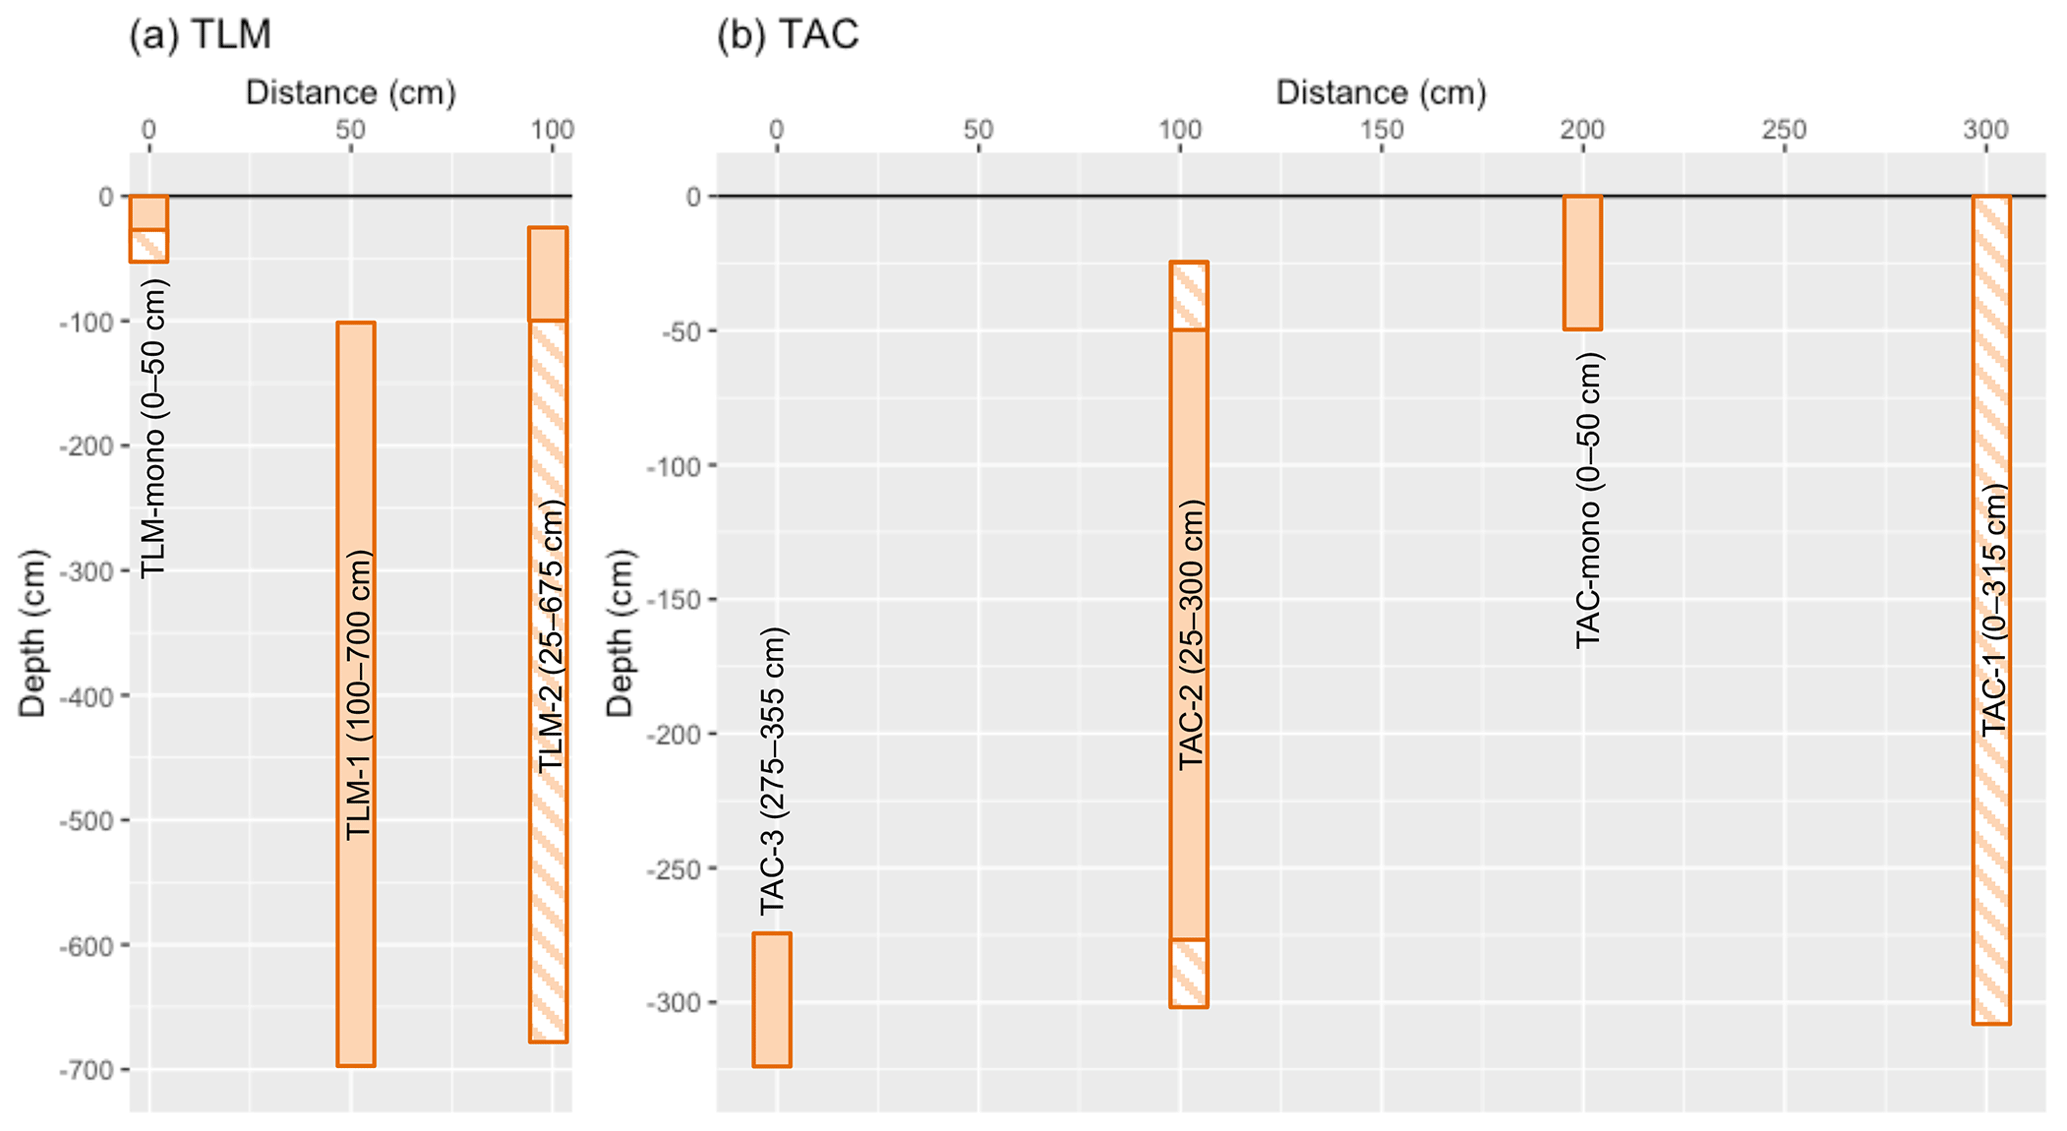
Figure B1Depth diagrams of core drives for TLM (a) and TAC (b). Note that the y axis scales differ between the two panels. Solid orange rectangles represent core drives and segments used to construct the composite cores. Hatched orange rectangles indicate core drives and segments reserved for preliminary analyses, other research, or reference purposes. (a) The TLM composite core includes: the segment from the surface to 25 cm (TLM-monolith); 25 to 100 cm (TLM-2); and the entire TLM-1 core. (b) The TAC composite core includes: the full 50 cm length of TAC-monolith; 50 cm to 275 cm (TAC-2); and the full 50 cm length of TAC-3.
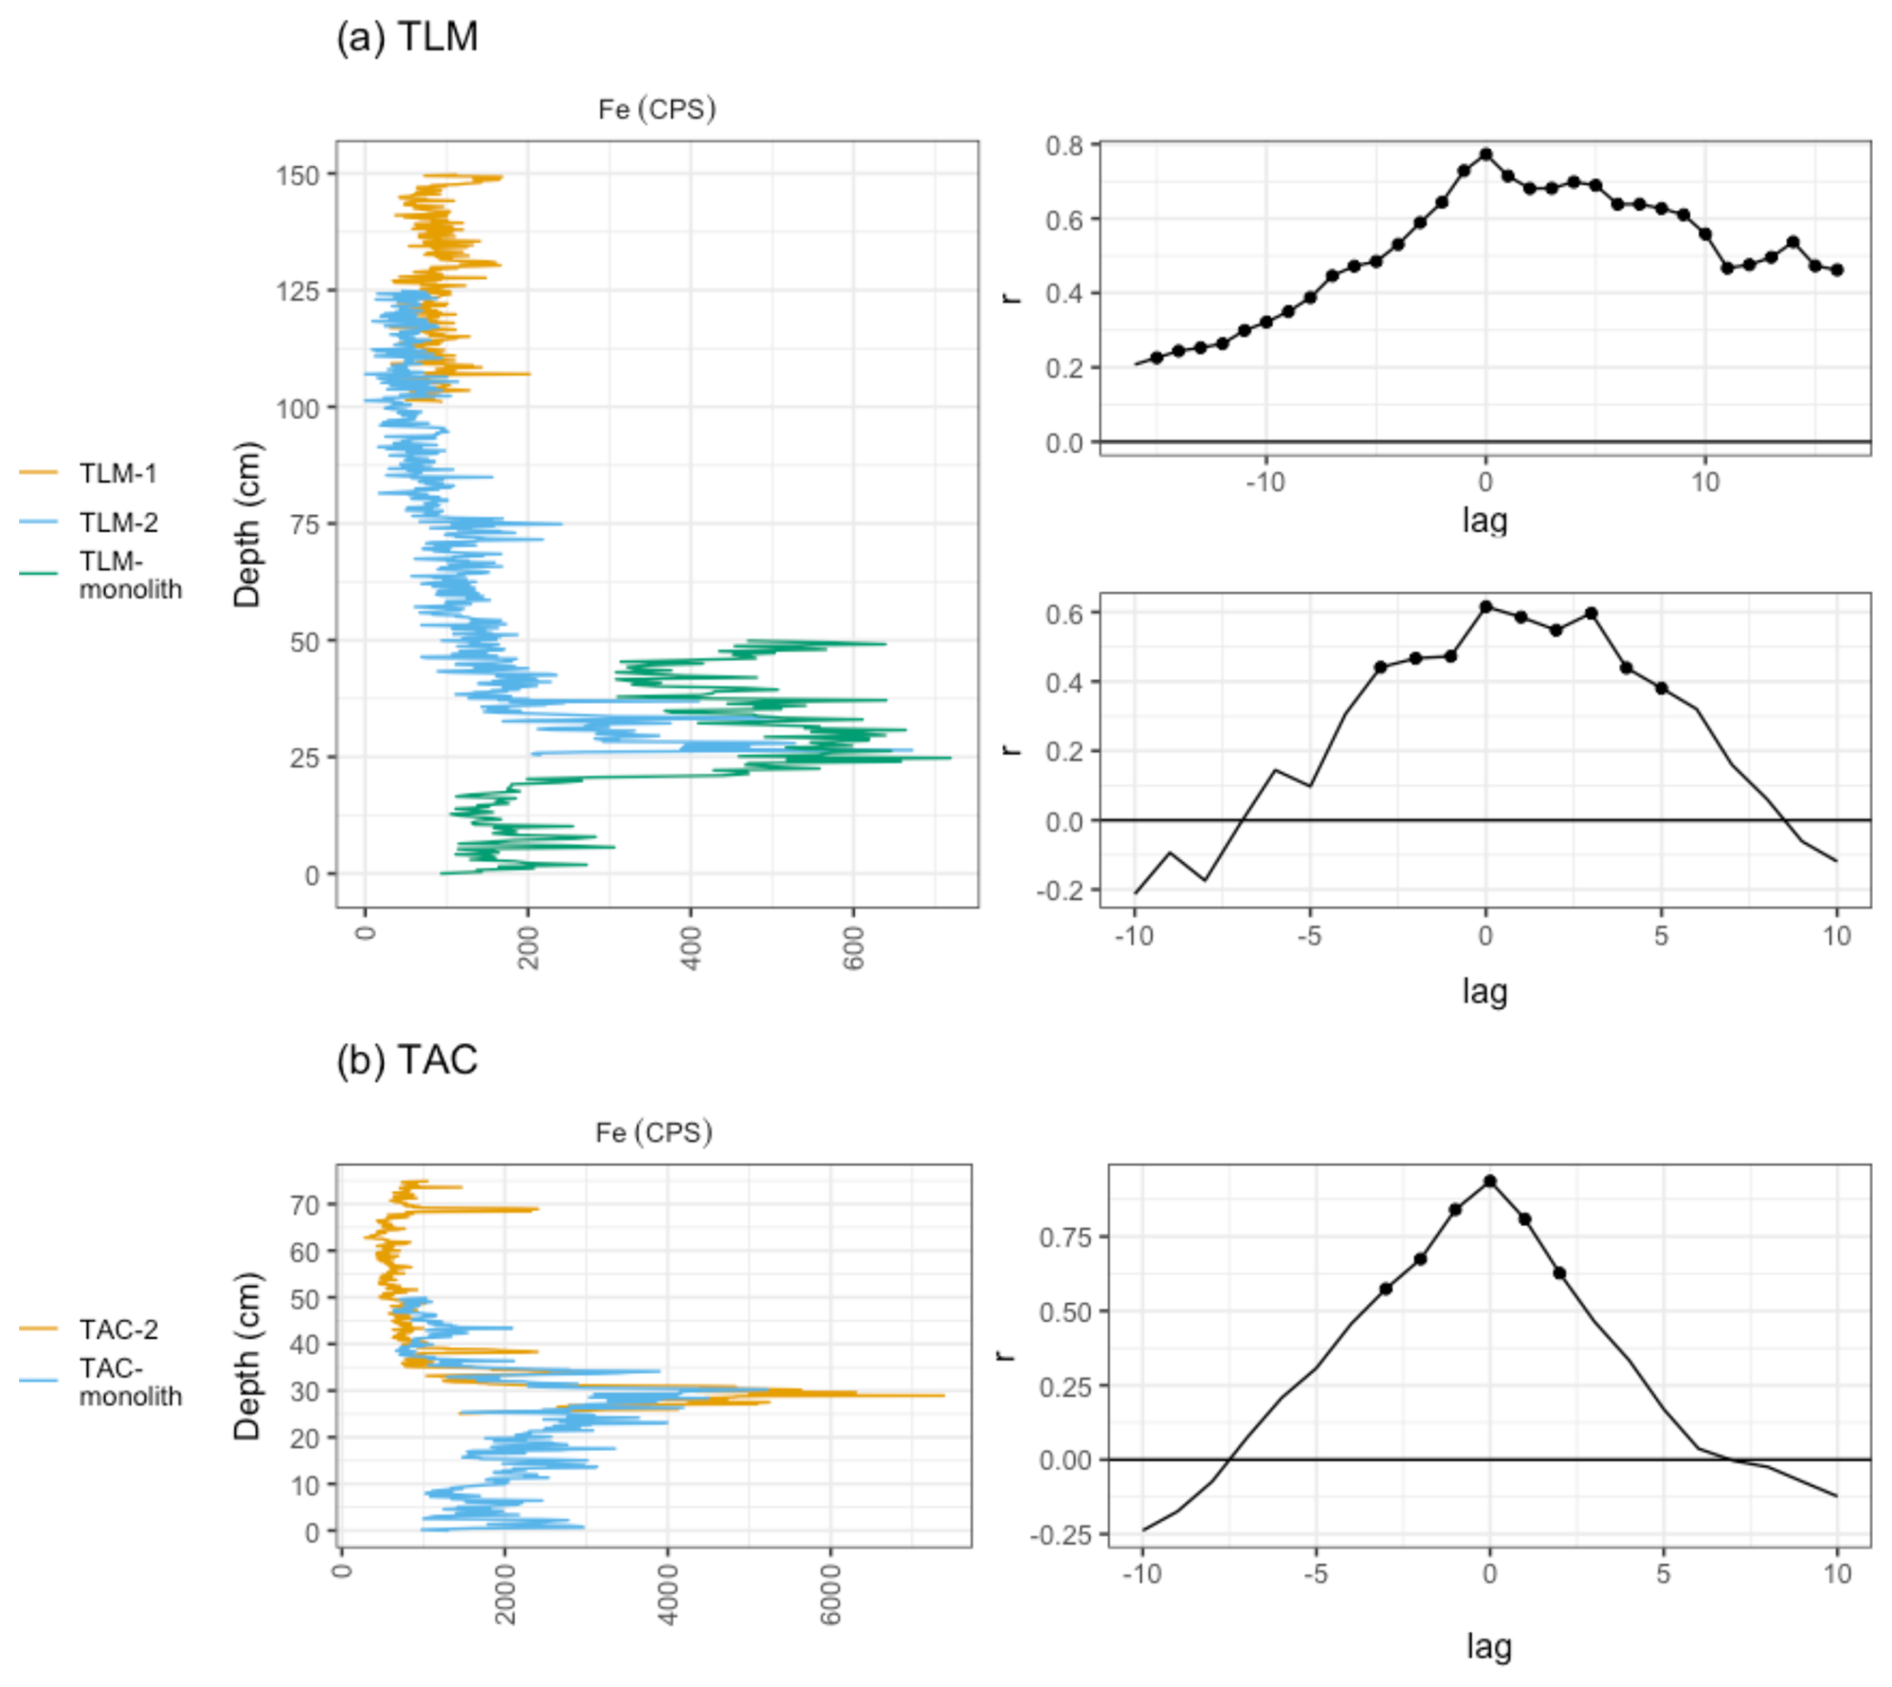
Figure B2Core drive alignment confirmed through cross-correlation analysis (CCA) of overlapping Fe µ-XRF measurements. Iron was used due to its abundance and consistent patterns across core drives. Black dots in the right-hand side CCA diagrams indicate significance (p<0.05). (a) In the TLM composite core, cross-correlations between TLM-1 and TLM-2 (100–125 cm) and between TLM-2 and TLM-monolith (25–49 cm) showed strong positive correlation coefficients (r= 0.8 and r= 0.6, p<0.05, at lag = 0), respectively, confirming alignment. (b) In the TAC composite core, TAC-2 and TAC-monolith's cross-correlation between 25–49 cm showed a strong positive correlation coefficient at lag = 0 (r= 0.9, p<0.05), confirming alignment.
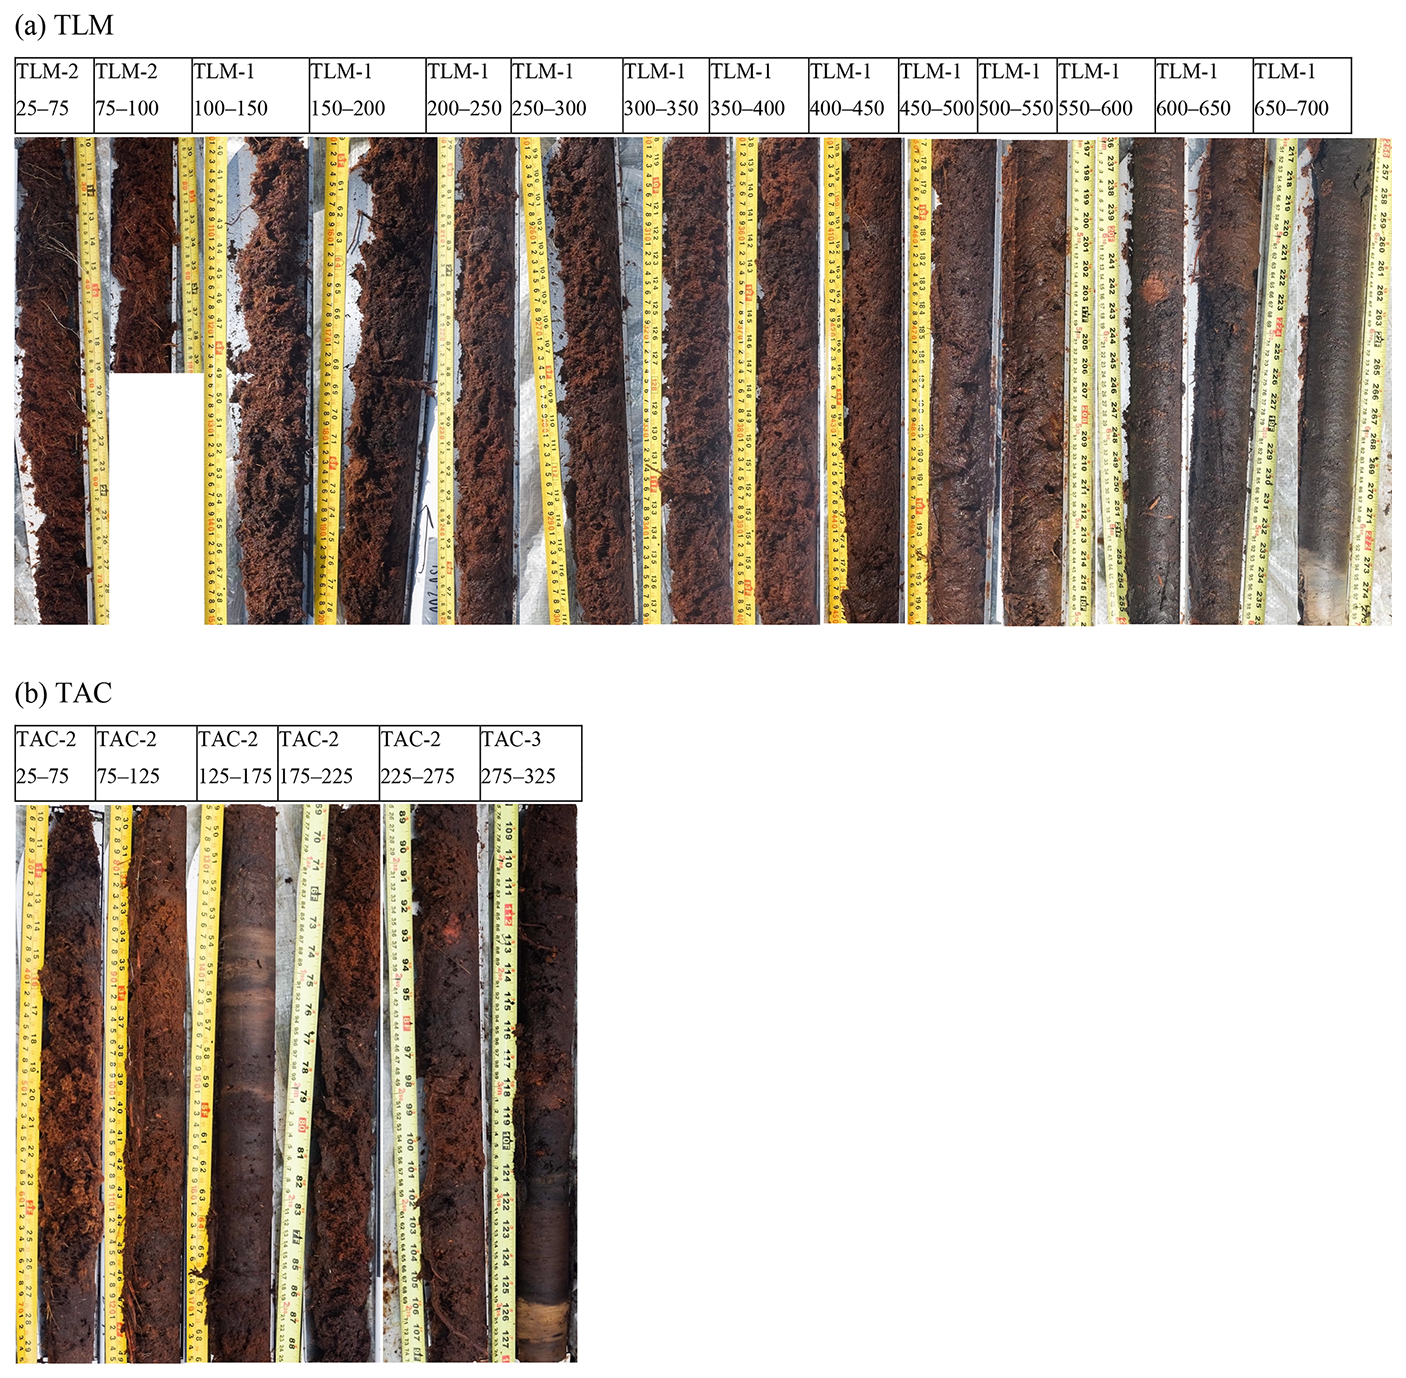
Figure C1Photographs of the core segments taken at the TLM (a) and TAC (b) sites after extraction from the peatlands with depth indicated in cm. Only sections included in the TLM and TAC composite core are shown, except for the surface monoliths. (a) The basal sand unit is visible in TLM-1 650–700 between 693–700 cm. (b) The basal sand unit is visible in TAC-3 275–325 cm between 317–325 cm.
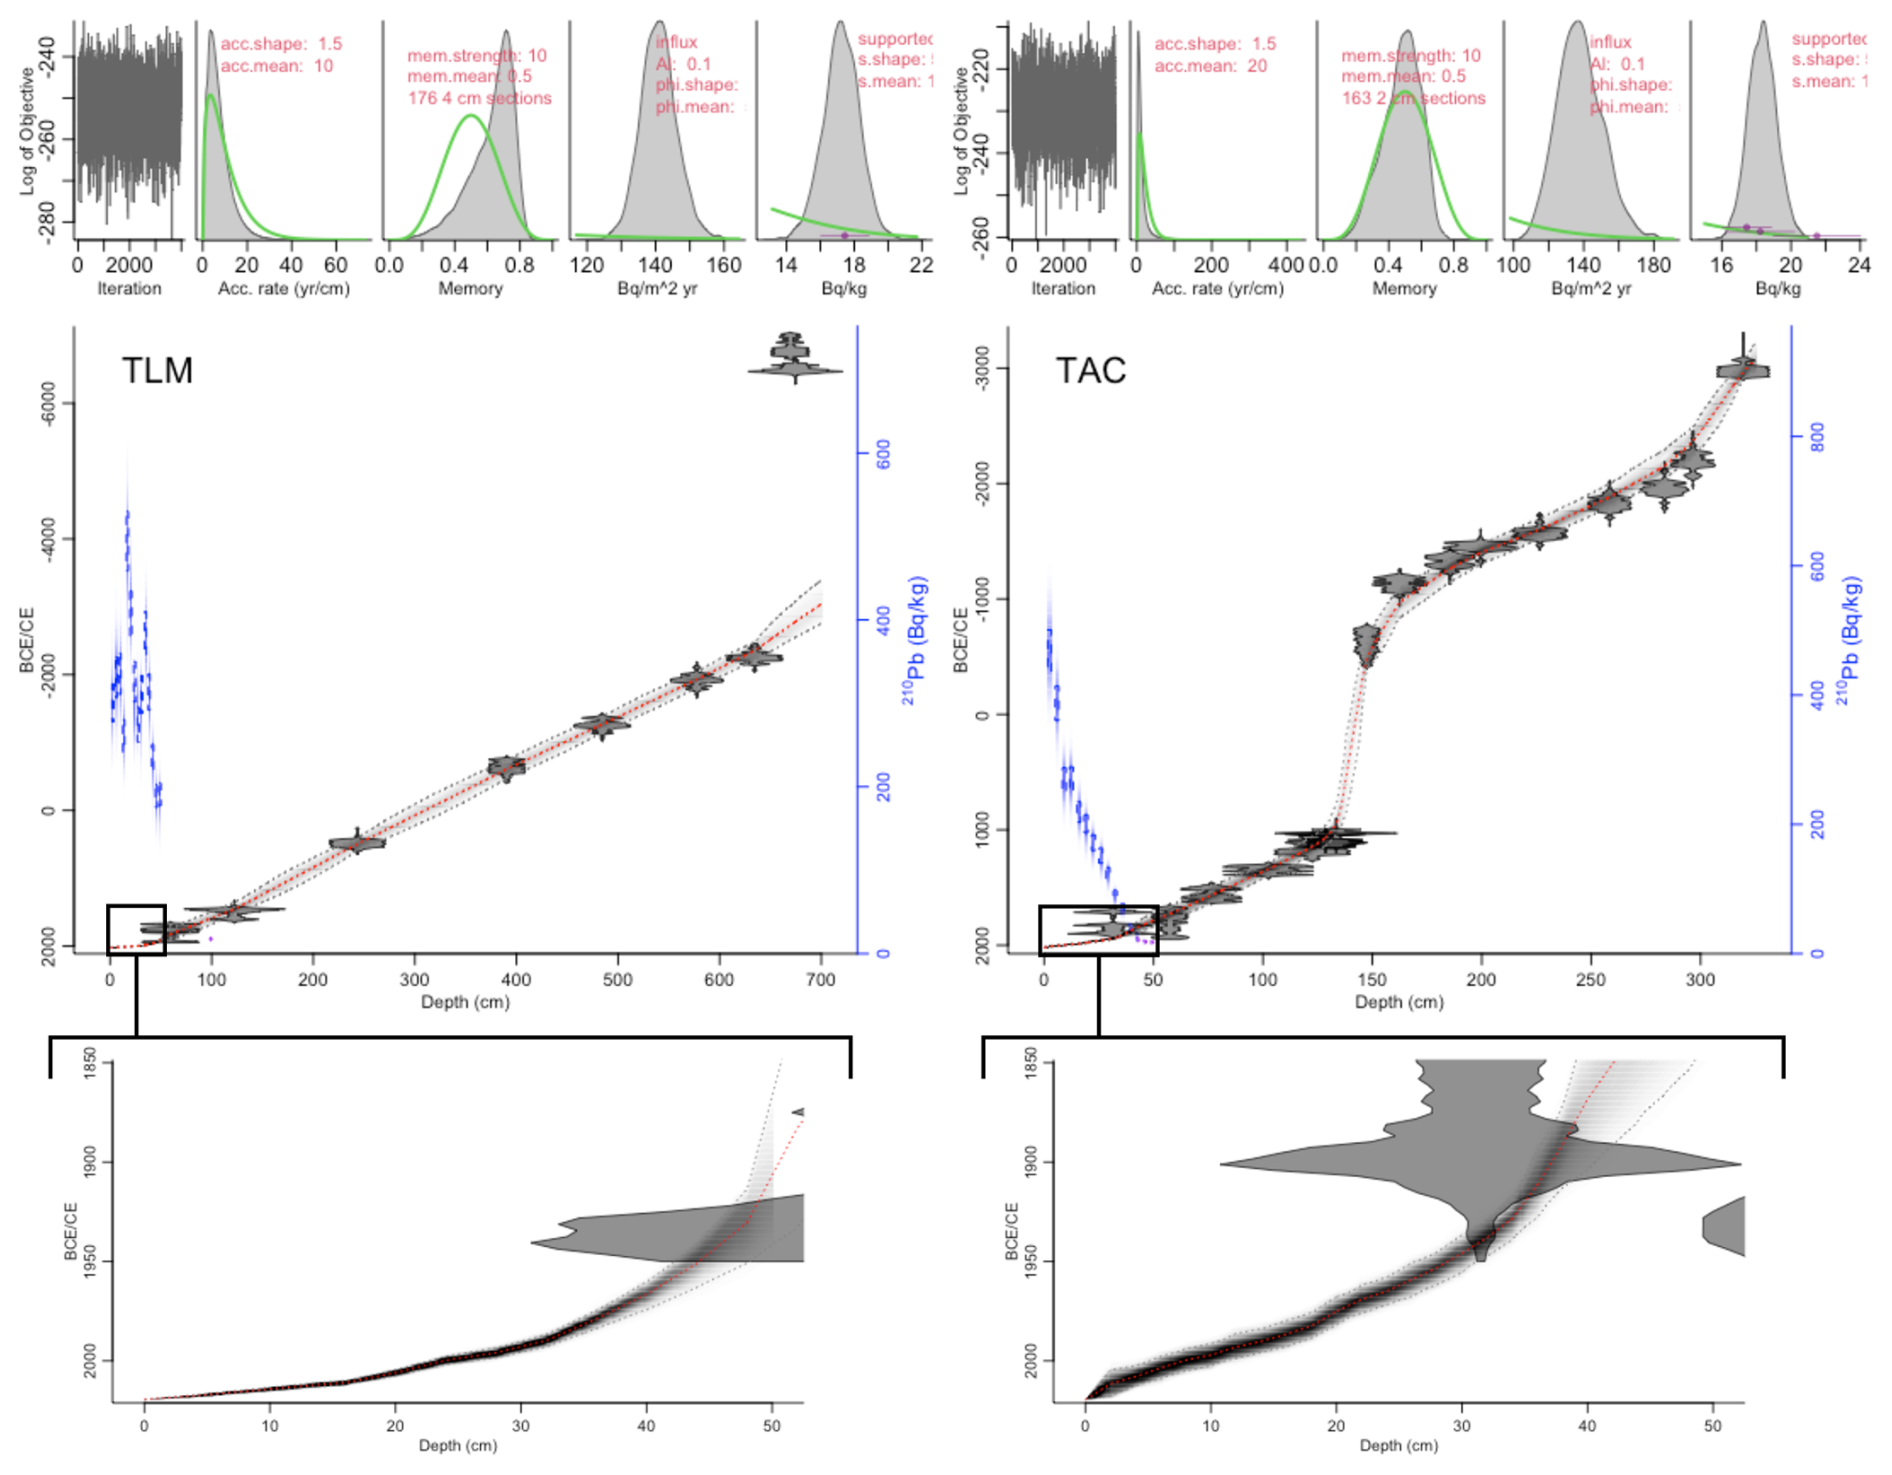
Figure D1rplum-derived age-depth models for TLM (left) and TAC (right). Radiocarbon (14C) dates are shown in grey along the mean age model (dotted red). The rate of supported 210Pb (right axis) is indicated by blue boxes on the left side (the blue boxes are the measured 210Pb values, while the blue shadings represent the modelled 210Pb values). For each core, the upper left panel shows the Markov Chain Monte Carlo (MCMC) iterations; followed by the prior (green curve) and posterior (grey histogram) distributions for the accumulation rate (second panel), memory (third panel), 210Pb influx in Bq m−2 yr−1 (fourth panel) and supported 210Pb in Bq kg−1 (fifth panel). A homing-in on the first 50 cm of the age-depth models is shown in the bottom panels.
Table D1Total 210Pb activity results for TLM and TAC measured at the GEOTOP Radiochronology Laboratory at the Université du Québec à Montréal (UQAM). The background 210Pb level for TLM was taken from the background 210Pb level at TAC (17.5 Bq kg−1).
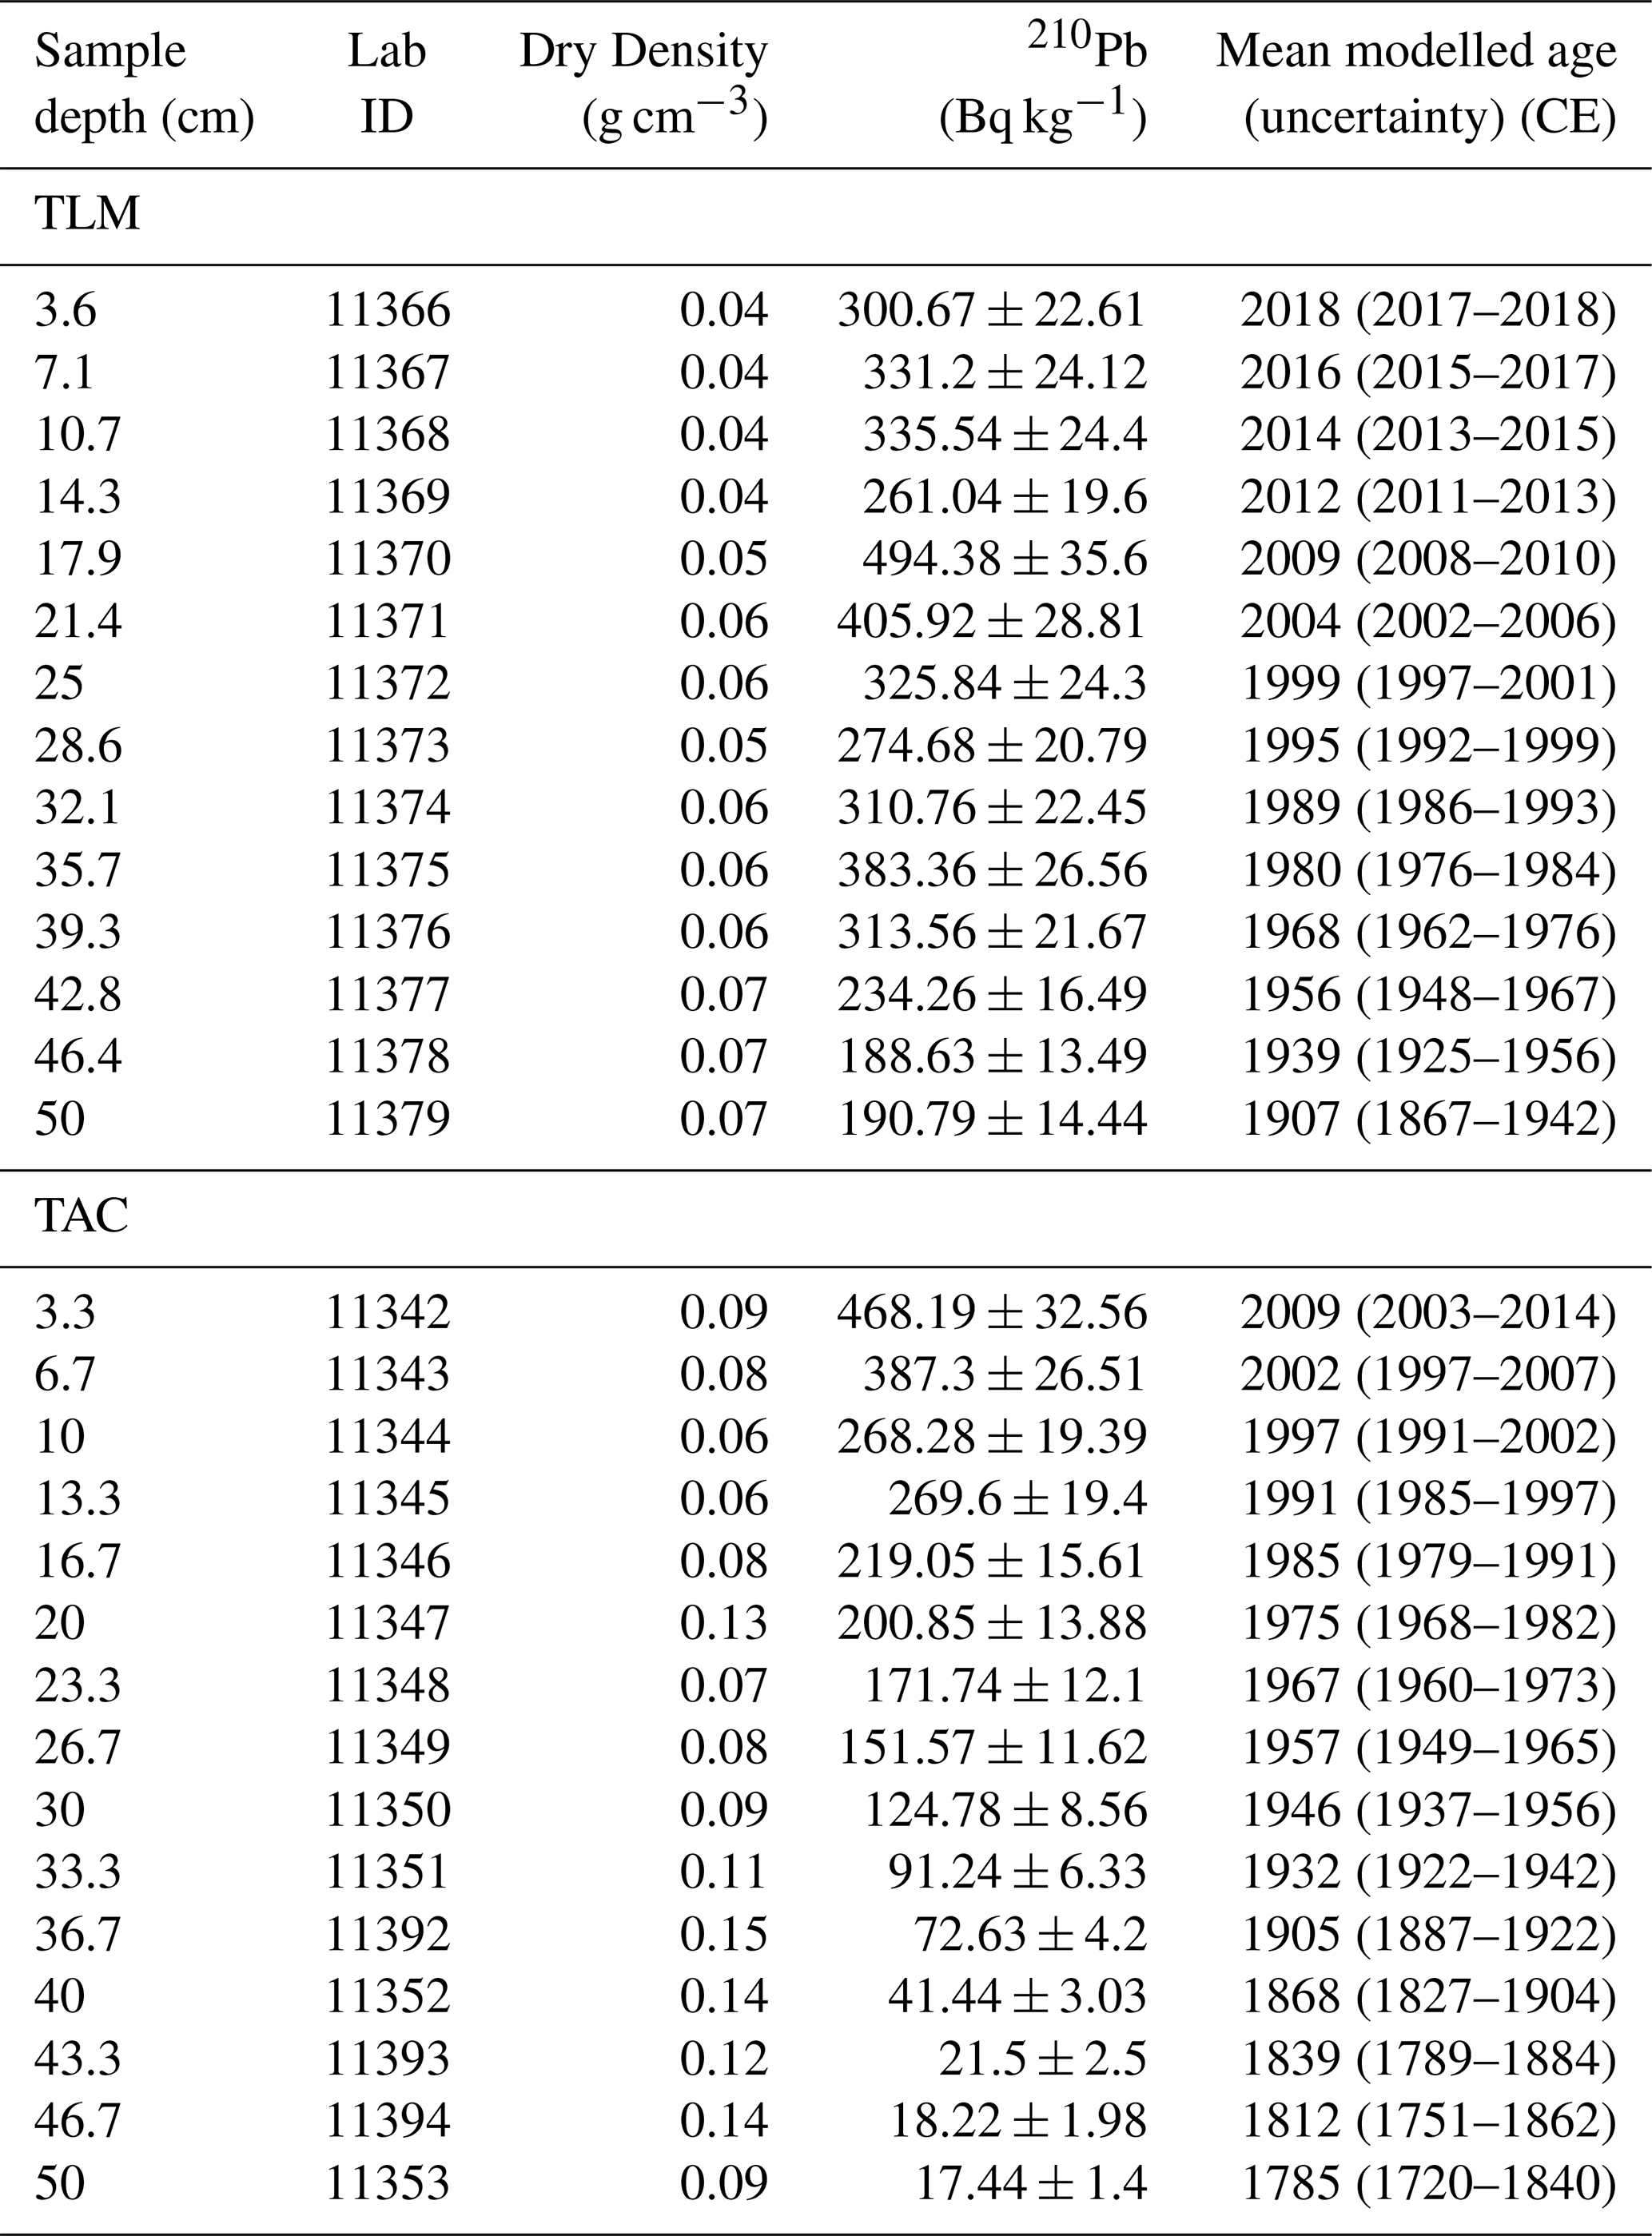
Table E1Pearson correlation coefficients among µ-XRF variables (CLR–transformed) and both ASI (log[ASI]) and mineral content (log[minerals]/100-minerals), presented for the core stratigraphic zones and upper 50 cm for TLM (a–d) and TAC (e–i). Micro-XRF variables were averaged at 1 cm intervals to match the mineral content and ASI resolution.
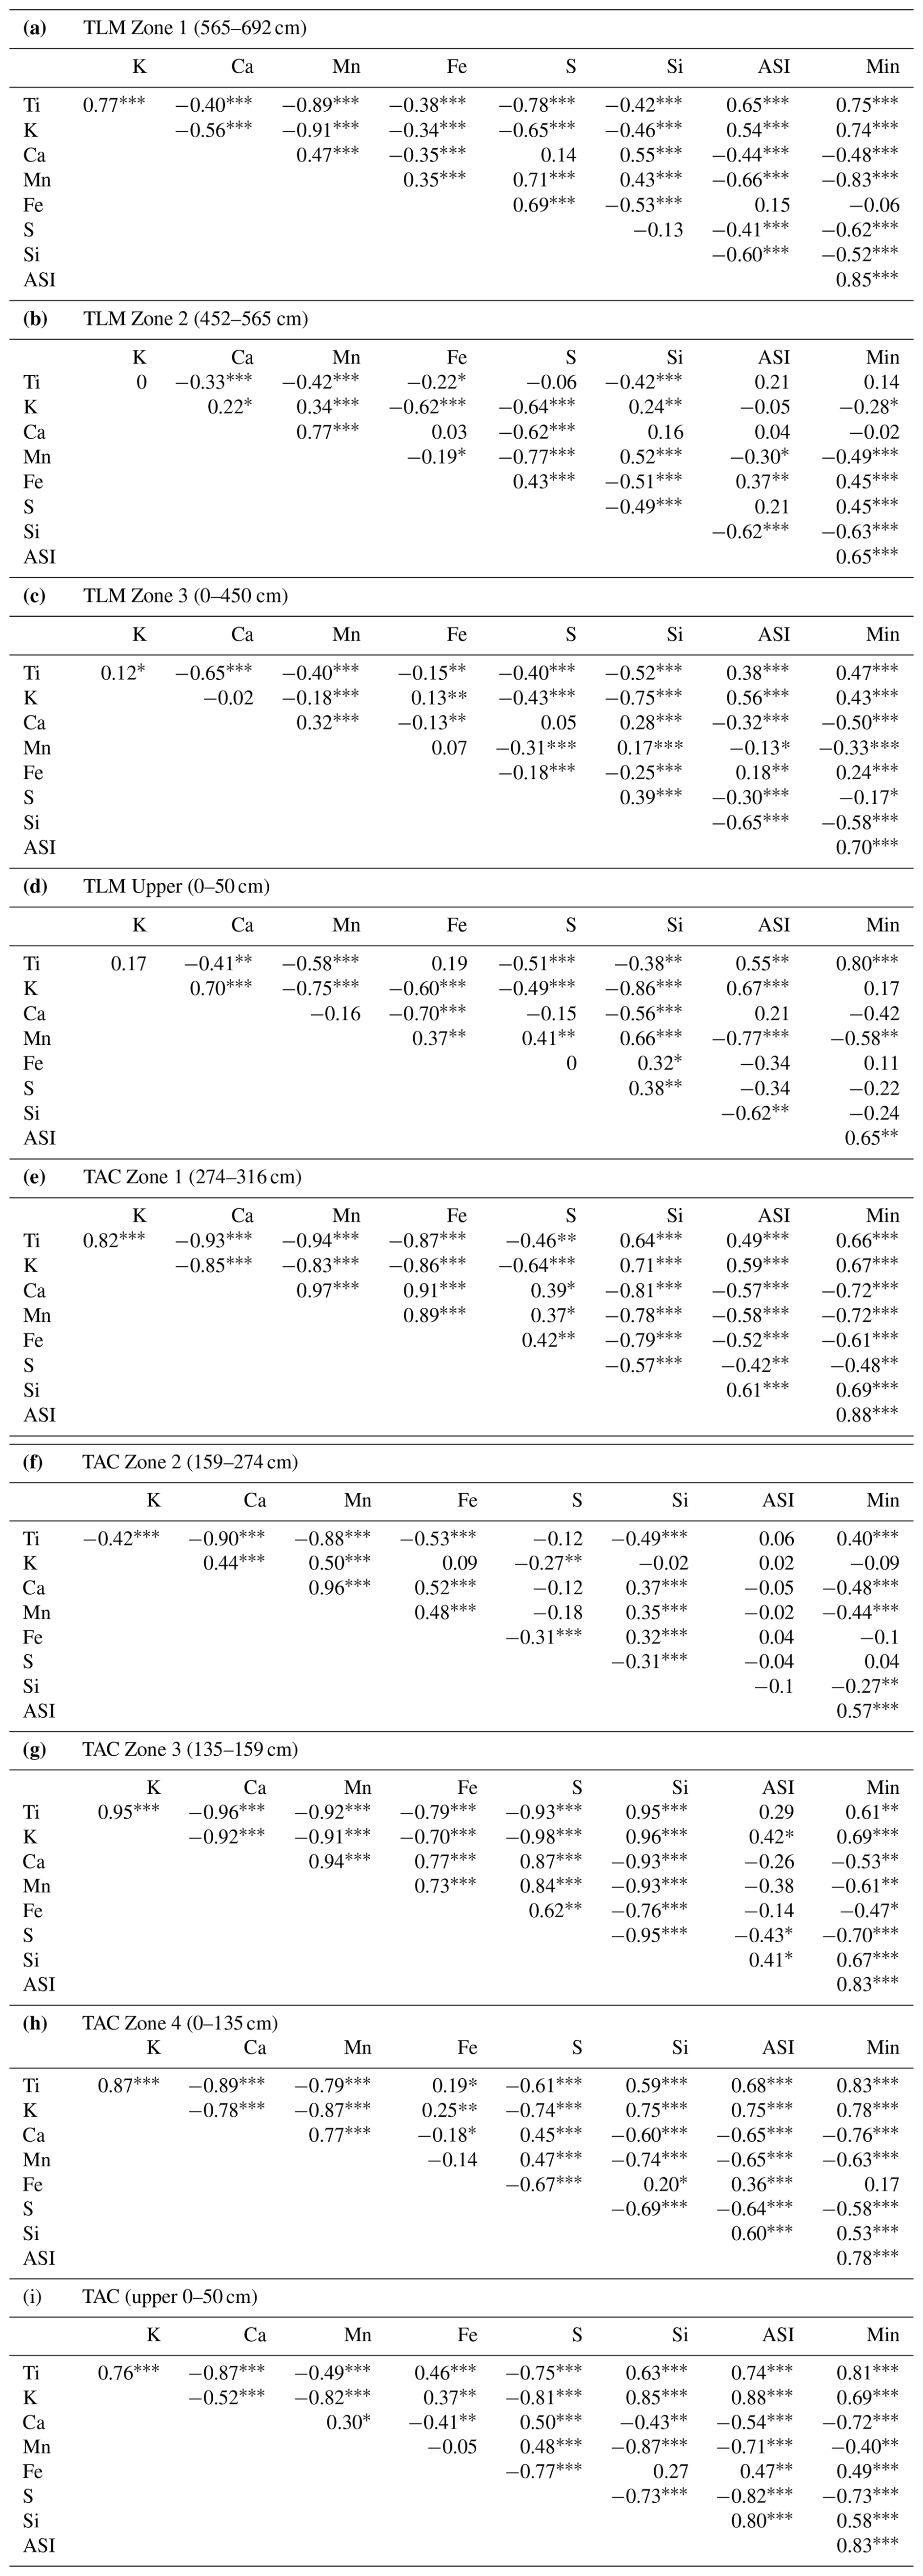
p < 0.001; p < 0.01; * p < 0.05.
Table F1List of hurricanes that passed within 100 km or closer to the Magdalen Islands, Québec, with recorded wind of the hurricane at that time and whether or not there were known impacts.
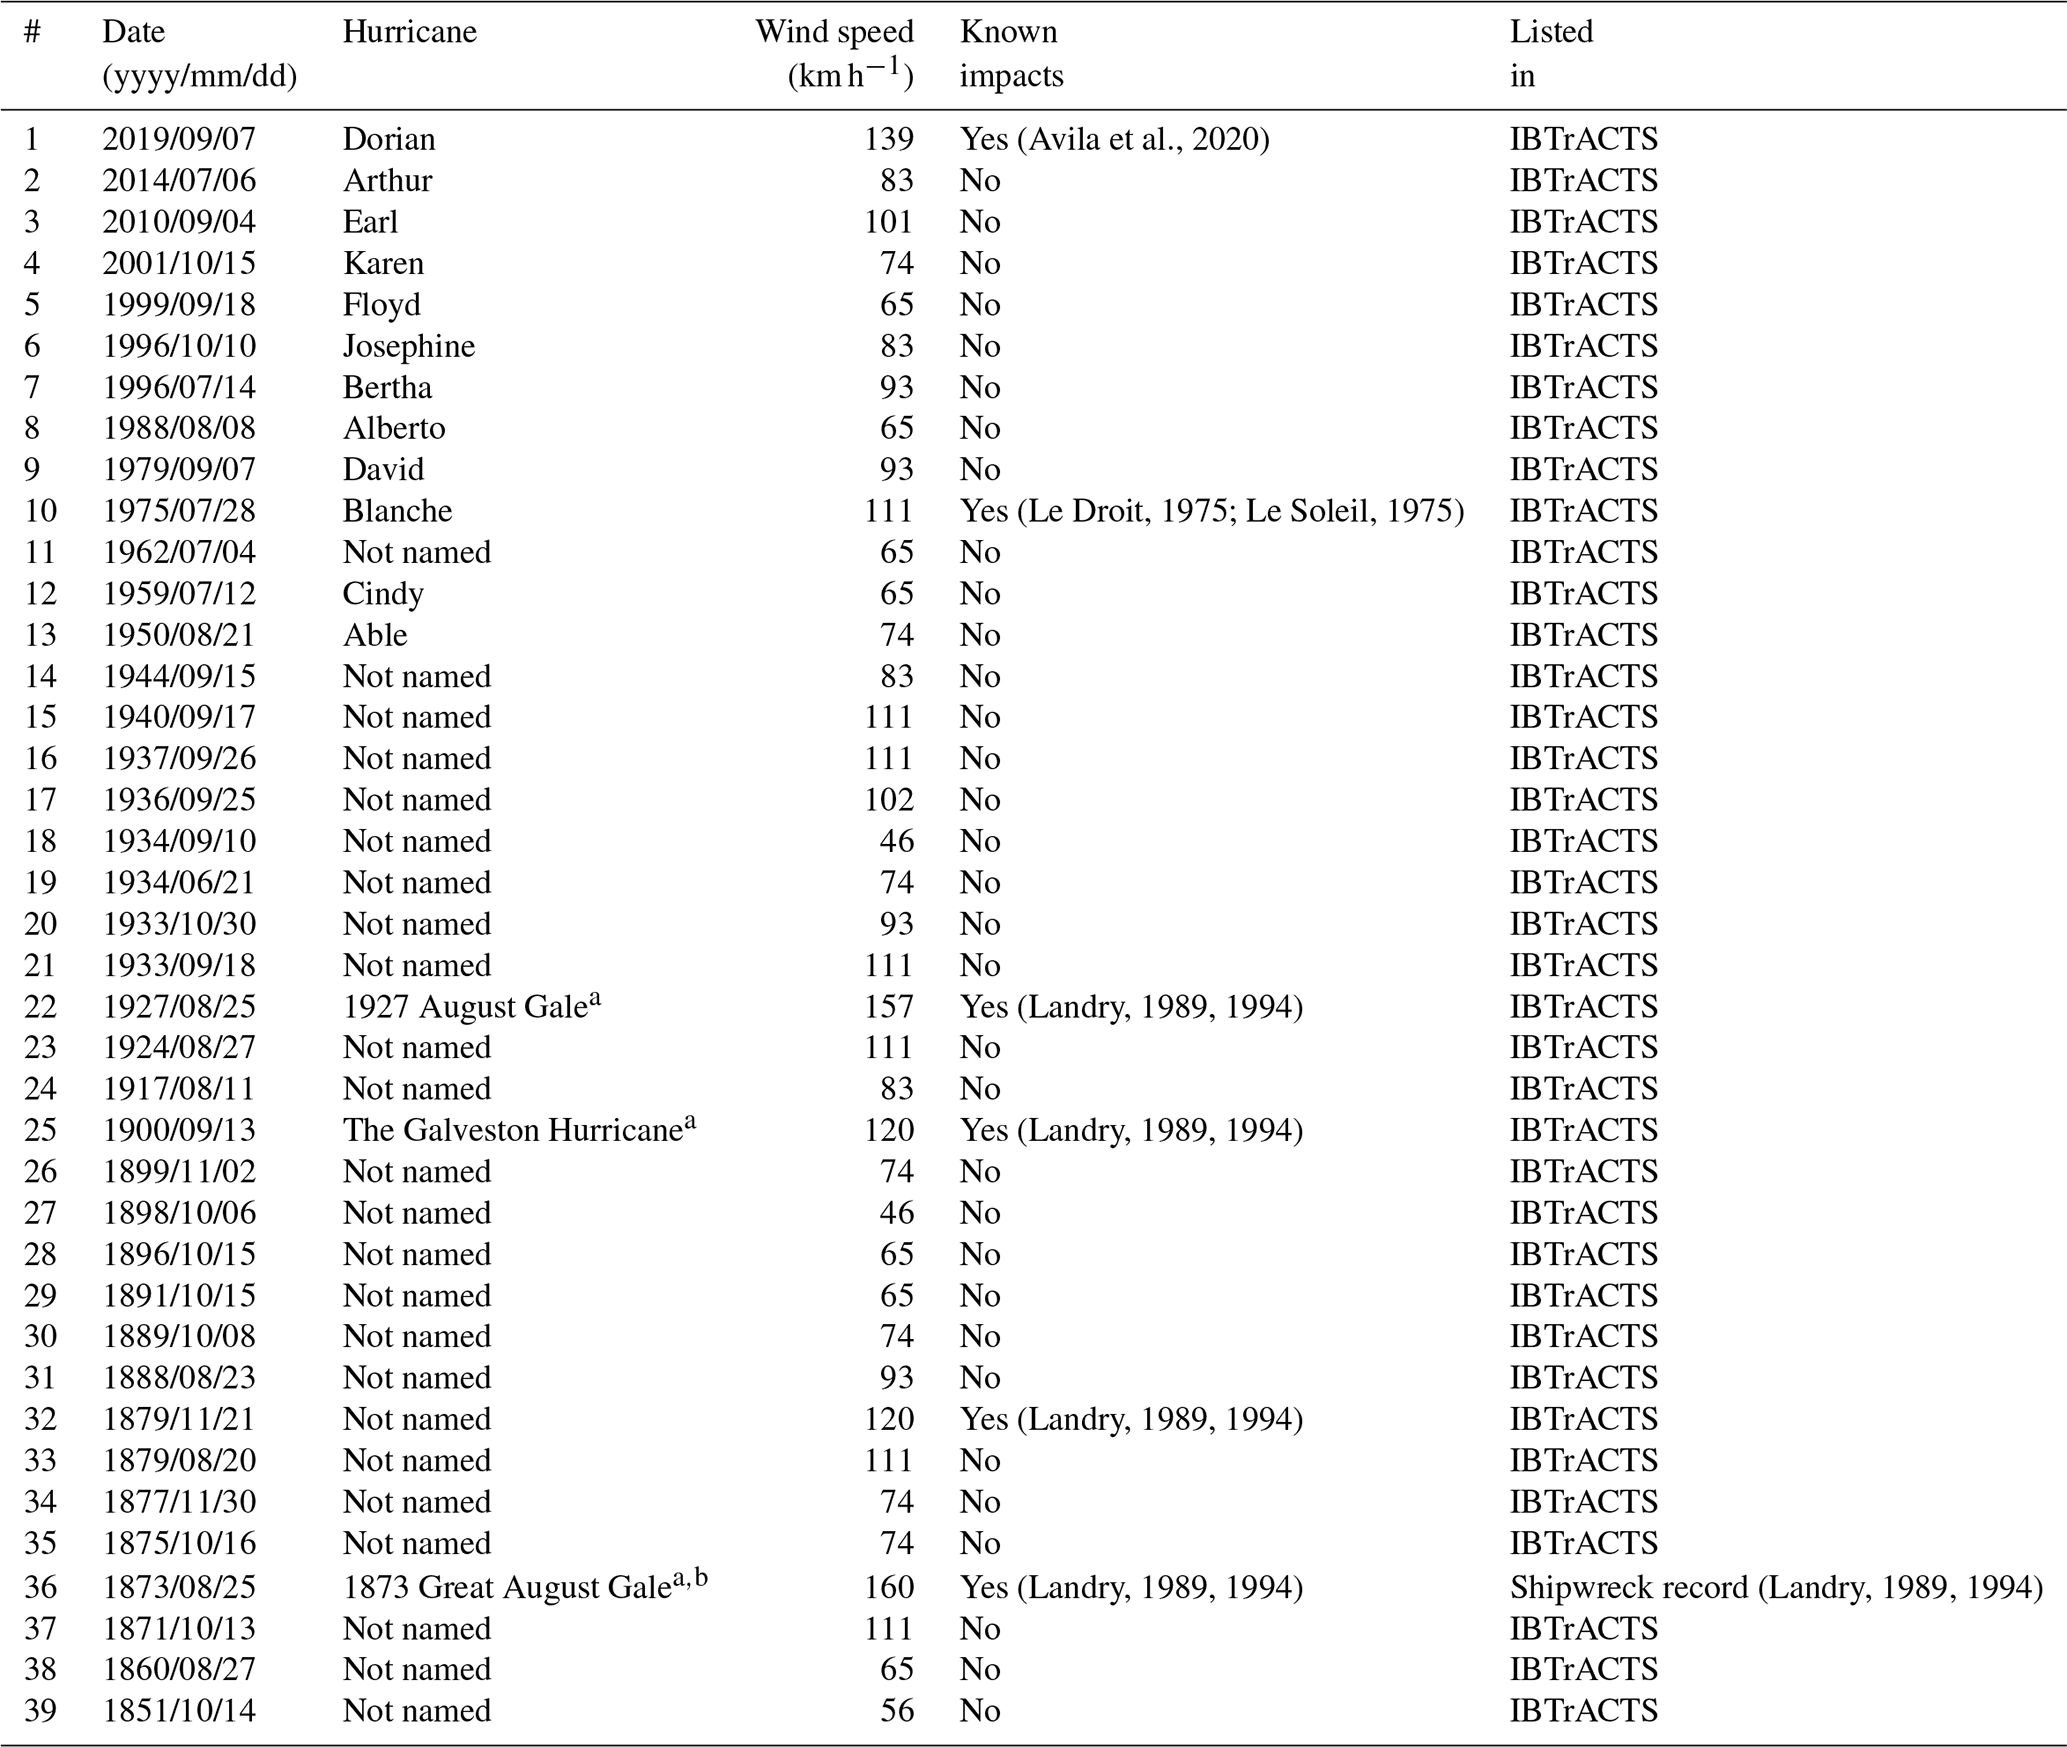
a Non-official but common names found in the literature to describe these events. b The 1873 Great August Gale passed approximately 500 km south of the Magdalen Islands, near Sable Island in the North Atlantic Ocean. Nevertheless, it still was one of the most destructive storms in the Magdalen Islands and is well-documented.
We used the International Best Track Archive for Climate Stewardship (IBTrACTS) dataset (Knapp et al., 2010; Gahtan et al., 2024) to determine the number of cyclones with a tropical origin passing within 100 km of the Magdalen Islands from 1851 to 2019 CE. To assess the impact of these storms on the Magdalen Islands, we cross-referenced the IBTrACTS data with historical shipwrecks records and local newspaper archives. We searched the online press database of the Bibliothèque et Archive National du Québec (Bibliothèque et Archive Nationale du Québec, 2025) using French keywords such as ouragan and Iles-de-la-Madeleine, and notes were taken on storm-related damage in the Magdalen Islands. Additionally, we manually reviewed shipwreck records from the vicinity of the Magdalen Islands (Landry, 1989, 1994) for incidents attributed to storms identified in the IBTrACTS dataset. Storms mentioned in the newspaper articles or shipwreck records that were not present in the IBTrACTS dataset, but that had significant impacts on the Magdalen Islands, were added to the final historical storm dataset.
All raw data can be provided by the corresponding author upon request. Paleo-storm reconstruction data are available on the Borealis data repository (https://doi.org/10.5683/SP3/JFVRCC, Lachance, 2025).
AL, MP, and JSJ planned the study fieldwork campaign and conceptualization. AL designed the methodology, conducted the investigation, analysed the data, and wrote and prepared the original draft (writing and visualization). PF supervised µ-XRF data acquisition and supported data analysis. NKS supervised 210Pb dating data acquisition and supported data analysis and age-depth modelling. AL, MP, JSJ, PF, and NKS reviewed and edited the draft. MP and JSJ supervised all steps of the research.
At least one of the (co-)authors is a member of the editorial board of Climate of the Past. The peer-review process was guided by an independent editor, and the authors also have no other competing interests to declare.
Publisher's note: Copernicus Publications remains neutral with regard to jurisdictional claims made in the text, published maps, institutional affiliations, or any other geographical representation in this paper. While Copernicus Publications makes every effort to include appropriate place names, the final responsibility lies with the authors. Views expressed in the text are those of the authors and do not necessarily reflect the views of the publisher.
We thank Sydney Moser and Tania O'Reilly for their assistance during the 2020 fieldwork campaign on the Magdalen Islands; Michelle Garneau and Leonie Perrier (GEOTOP – UQAM) for their valuable guidance in peat stratigraphy analysis; Arnaud De Coninck (INRS) for conducting the µ-XRF analysis and providing analytical support; and Steve Pratte (Zhejiang University) and Pascale Biron (Concordia University) for their insightful reviews of the master's thesis chapter upon which this paper is based. A special thank you to Luna for her quiet but constant support throughout the writing process.
This research has been supported by the Natural Sciences and Engineering Research Council of Canada (grant nos. Discovery Grant #RGPIN-2021-04057, Discovery Grant #RGPIN-2017-04795, Discovery Grant #RGPIN-2014-05810), and funds by Concordia University for field work in 2020.
This paper was edited by Hans Linderholm and reviewed by three anonymous referees.
Aitchison, J.: The statistical analysis of compositional data, J. Roy. Stat. Soc. B. Met., 44, 139–160, https://doi.org/10.1111/j.2517-6161.1982.tb01195.x, 1982.
Allen, D., Allen, S., Le Roux, G., Simonneau, A., Galop, D., and Phoenix, V. R.: Temporal Archive of Atmospheric Microplastic Deposition Presented in Ombrotrophic Peat, Environ. Sci. Technol. Lett., 8, 954–960, https://doi.org/10.1021/acs.estlett.1c00697, 2021.
Aquino-López, M. A., Blaauw, M., Christen, J. A., and Sanderson, N. K.: Bayesian Analysis of 210Pb Dating, J. Agric. Biol. Environ. Stat., 23, 317–333, 2018.
Avila, L.: National hurricane center tropical cyclone report – Hurricane Juan, NOAA National Hurricane Center, 11 pp., https://www.nhc.noaa.gov/data/tcr/AL152003_Juan.pdf (last access: 5 November 2025), 2003.
Avila, L., Stewart, S., Berg, R., and Hagen, A.: National hurricane center tropical cyclone report – Hurricane Dorian, NOAA National Hurricane Center, 74 pp., https://www.nhc.noaa.gov/data/tcr/AL052019_Dorian.pdf (last access: 5 November 2025), 2020.
Baker, A. J., Hodges, K. I., Schiemann, R. K., and Vidale, P. L.: Historical variability and lifecycles of North Atlantic midlatitude cyclones originating in the tropics, J. Geophys. Res.-Atmos., 126, e2020JD033924, https://doi.org/10.1029/2020JD033924, 2021.
Barnett, R., Bernatchez, P., Garneau, M., and Juneau, M. N.: Reconstructing late Holocene relative sea-level changes at the Magdalen Islands (Gulf of St. Lawrence, Canada) using multi-proxy analyses, J. Quaternary Sci., 32, 380–395, https://doi.org/10.1002/jqs.2931, 2017.
Barnett, R., Bernatchez, P., Garneau, M., Brain, M., Charman, D., Stephenson, D., Haley, S., and Sanderson, N.: Late Holocene sea-level changes in eastern Québec and potential drivers, Quaternary Sci. Rev., 203, 151–169, https://doi.org/10.1016/j.quascirev.2018.10.039, 2019.
Bengtsson, L. and Enell, M.: Chemical analysis, in: Handbook of Holocene Palaeoecology and Palaeohydrology, edited by: Berglund, B. E., Wiley Interscience, John Wiley & Sons Ltd., Chichester, https://doi.org/10.1002/jqs.3390010111, 1986.
Bernatchez, P., Boucher-Brossard, G., and Sigouin-Cantin, M.: Contribution des archives à l'étude des événements météorologiques et géomorphologiques causant des dommages aux côtes du Québec maritime et analyse des tendances, des fréquences et des temps de retour des conditions météo-marines extrêmes, Chaire de recherche en géoscience côtière, Laboratoire de dynamique et de gestion intégrée des zones côtières, Université du Québec à Rimouski, 140 pp., 2012a.
Bernatchez, P., Drejza, S., and Dugas, S.: Marges de sécurité en érosion côtière: évolution historique et future du littoral des îles de la Madeleine, Chaire de recherche en géoscience côtière, Laboratoire de dynamique et de gestion intégrée des zones côtières, Université du Québec à Rimouski, 51 pp., https://ldgizc.uqar.ca/Web/docs/default-source/default-document-library/marge_erosion_idlm_aout2012_uqar.pdf?sfvrsn=8b3f44bc_0 (last access: 5 November 2025), 2012b.
Bertrand, S., Tjallingii, R., Kylander, M. E., Wilhelm, B., Roberts, S. J., Arnaud, F., Brown, E., and Bindler, R.: Inorganic geochemistry of lake sediments: A review of analytical techniques and guidelines for data interpretation, Eart-Sci. Rev., 104639, https://doi.org/10.1016/j.earscirev.2023.104639, 2023.
Besonen, M. R., Bradley, R. S., Mudelsee, M., Abbott, M. B., and Francus, P.: A 1,000-year, annually-resolved record of hurricane activity from Boston, Massachusetts, Geophys. Res. Lett., 35, https://doi.org/10.1029/2008GL033950, 2008.
Bibliothèque et Archive Nationale du Québec: BAnQ archive numérique, https://numerique.banq.qc.ca/ (last access: 5 November 2025), 2025.
Bishops, T.: Using Itrax Data in R, https://tombishop1.github.io/itraxBook/, last access: 12 July 2025.
Björck, S. and Clemmensen, L. B.: Aeolian sediment in raised bog deposits, Halland, SW Sweden: a new proxy record of Holocene winter storminess variation in southern Scandinavia?, Holocene, 14, 677–688, https://doi.org/10.1191/0959683604hl746rp, 2004.
Blaauw, M., Christen, J., and Aquino-Lopez, M.: rplum: Bayesian Age-Depth Modelling of Cores Dated by Pb-210 (R package version 0.5.1), CRAN [code], https://doi.org/10.32614/CRAN.package.rplum, 2024.
Boldt, K. V., Lane, P., Woodruff, J. D., and Donnelly, J. P.: Calibrating a sedimentary record of overwash from Southeastern New England using modeled historic hurricane surges, Mar. Geol., 275, 127–139, https://doi.org/10.1016/j.margeo.2010.05.002, 2010.
Brandon, C. M., Woodruff, J. D., Lane, D. P., and Donnelly, J. P.: Tropical cyclone wind speed constraints from resultant storm surge deposition: A 2500 year reconstruction of hurricane activity from St. Marks, FL, Geochem. Geophy. Geosy., 14, 2993–3008, https://doi.org/10.1002/ggge.20217, 2013.
Braun, E., Meyer, B., Deocampo, D., and Kiage, L. M.: A 3000 yr paleostorm record from St. Catherines Island, Georgia, Estuar. Coast. Shelf S., 196, 360–372, https://doi.org/10.1016/j.ecss.2017.05.021, 2017.
Bregy, J. C., Wallace, D. J., Minzoni, R. T., and Cruz, V. J.: 2500-year paleotempestological record of intense storms for the northern Gulf of Mexico, United States, Mar. Geol., 396, 26–42, https://doi.org/10.1016/j.margeo.2017.09.009, 2018.
Brisebois, D.: Lithostratigraphie des strates permo-carboniferes, de l'archipel des Iles de la Madeleine, Direction générale des énergies conventionnelles, DPV-796, 48 pp., https://gq.mines.gouv.qc.ca/documents/examine/DPV796/DPV796.pdf (last access: 5 November 2025), 1981.
Canadian Ice Service: Seasonal Summary, Eastern Canada, Winter 2021–2022, Environment and Climate Change Canada, 29 pp., https://publications.gc.ca/collections/collection_2022/eccc/En55-2-2022-eng.pdf (last access: 5 November 2025), 2022.
Chartrand, P. G., Sonnentag, O., Sanderson, N. K., and Garneau, M.: Recent peat and carbon accumulation on changing permafrost landforms along the Mackenzie River valley, Northwest Territories, Canada, Environ. Res. Lett., 18, 095002, https://doi.org/10.1088/1748-9326/ace9ed, 2023.
Chiang, J. C. H. and Vimont, D. J.: Analogous Pacific and Atlantic Meridional Modes of Tropical Atmosphere–Ocean Variability, J. Climate, 17, 4143–4158, https://doi.org/10.1175/JCLI4953.1, 2004.
Crann, C. A., Murseli, S., St-Jean, G., Zhao, X., Clark, I. D., and Kieser, W. E.: First status report on radiocarbon sample preparation techniques at the AE Lalonde AMS Laboratory (Ottawa, Canada), Radiocarbon, 59, 695–704, https://doi.org/10.1017/RDC.2016.55, 2017.
Croudace, I. W. and Rothwell, R. G.: Micro-XRF Studies of Sediment Cores: Applications of a non-destructive tool for the environmental sciences, Developments in Paleoenvironmental Research, 17, Springer, Dordrecht, Netherlands, 656 pp., https://doi.org/10.1007/978-94-017-9849-5, 2015.
Cwanek, A., Aquino-Lopez, M. A., Kołaczek, P., Lamentowicz, M., Fiałkiewicz-Kozieł, B., Gał ka, M., Słowiński, M., Łuców, D., Marcisz, K., Obremska, M., Czerwiński, S., and Łokas, E.: Strengthening potential of recent peat dating, J. Environ. Radioact., 282, 107594, https://doi.org/10.1016/j.jenvrad.2024.107594, 2025.
De Vleeschouwer, F., Sikorski, J., and Fagel, N.: Development of lead-210 measurement in peat using polonium extraction. A procedural comparison, Geochronometria, 36, 1–8, https://doi.org/10.2478/v10003-010-0013-5, 2010.
Dean, W. E.: Determination of carbonate and organic matter in calcareous sediments and sedimentary rocks by loss on ignition; comparison with other methods, J. Sediment Res., 44, 242–248, https://doi.org/10.1306/74D729D2-2B21-11D7-8648000102C1865D, 1974.
Denommee, K., Bentley, S., and Droxler, A.: Climatic controls on hurricane patterns: a 1200-y near-annual record from Lighthouse Reef, Belize, Sci. Rep., 4, 3876, https://doi.org/10.1038/srep03876, 2014.
Derksen, C., Burgess, D., Duguay, C., Howell, S., Mudryk, L., Smith, S., Thackeray, C., and Kirchmeier-Young, M.: Changes in snow, ice, and permafrost across Canada, in: Canada's changing climate report, edited by: Bush, E. and Lemmen, D. S., Government of Canada, 194–260, https://doi.org/10.4095/308279, 2019.
Dickie, J. and Wach, G.: A major midlatitude hurricane in the Little Ice Age, Clim. Past, 20, 1141–1160, https://doi.org/10.5194/cp-20-1141-2024, 2024.
Donnelly, J. P., Hawkes, A. D., Lane, P., MacDonald, D., Shuman, B. N., Toomey, M. R., van Hengstum, P. J., and Woodruff, J. D.: Climate forcing of unprecedented intense-hurricane activity in the last 2000 years, Earth's Future, 3, 49–65, https://doi.org/10.1002/2014EF000274, 2015.
Dredge, L. A., Mott, R. J., and Grant, D. R.: Quaternary stratigraphy, paleoecology, and glacial geology, Îles de la Madeleine, Quebec, Can. J. Earth Sci., 29, 1981–1996, https://doi.org/10.1139/e92-154, 1992.
Environment and Climate Change Canada: Canadian Climate Normals 1981–2010 Station Data – ILES DE LA MADELEINE A, https://climate.weather.gc.ca/climate_normals/results_1981_2010_e.html?stnID=5748&autofwd=1, last access: 30 July 2024.
Forbes, D. L., Parkes, G. S., Manson, G. K., and Ketch, L. A.: Storms and shoreline retreat in the southern Gulf of St. Lawrence, Mar. Geol., 210, 169–204, https://doi.org/10.1016/j.margeo.2004.05.009, 2004.
Fortin, J.-C. and Larocque, P.: Histoire des Iles-de-la-Madeleine, Institut quebecois de recherche sur la culture, Les Éditions de l'IQRC et Les Presses de l'Université Laval, Sainte-Foy, 400 pp., https://doi.org/10.7202/014675ar, 2003.
Gahtan, J., K. R. Knapp, C. J. Schreck, H. J. Diamond, J. P. Kossin, and Kruk, M. C.: International Best Track Archive for Climate Stewardship (IBTrACS) Project (Version 4r01) [North Atlantic Ocean], NOAA National Centers for Environmental Information [data set], https://doi.org/10.25921/82ty-9e16, 2024.
Garneau, M.: Collection de référence de graines et autres macrofossiles végétaux de taxons provenant du Québec méridional et boréal et de l'arctique canadien, Geol. Surv. of Can., Ottawa, Ont., Dossier publique 3048, 38 pp., 1995.
Goslin, J., Gałka, M., Sander, L., Fruergaard, M., Mokenbusch, J., Thibault, N., and Clemmensen, L. B.: Decadal variability of north-eastern Atlantic storminess at the mid-Holocene: New inferences from a record of wind-blown sand, western Denmark, Global Planet. Change, 180, 16–32, https://doi.org/10.1016/j.gloplacha.2019.05.010, 2019.
Heiri, O., Lotter, A. F., and Lemcke, G.: Loss on ignition as a method for estimating organic and carbonate content in sediments: reproducibility and comparability of results, J. Paleolimnol, 25, 101–110, https://doi.org/10.1023/A:1008119611481, 2001.
Hétu, B., Rémillard, A. M., Bernatchez, P., and St-Onge, G.: Landforms and Landscapes of the Magdalen Islands: The Role of Geology and Climate, in: Landscapes and Landforms of Eastern Canada. World Geomorphological Landscapes, edited by: Slaymaker, O. and Catto, N., Springer, Cham, 431–451, https://doi.org/10.1007/978-3-030-35137-3_19, 2020.
Hewett, D.: Menyanthes trifoliata L, J. Ecol., 52, 723–735, https://doi.org/10.2307/2257858, 1964.
Huang, B., Thorne, P. W., Banzon, V. F., Boyer, T., Chepurin, G., Lawrimore, J. H., Menne, M. J., Smith, T. M., Vose, R. S., and Zhang, H.-M.: Extended Reconstructed Sea Surface Temperature, Version 5 (ERSSTv5): Upgrades, Validations, and Intercomparisons, J. Climate, 30, 8179–8205, https://doi.org/10.1175/JCLI-D-16-0836.1, 2017.
Husson, F., Josse, J., Le, S., and Mazet, J.: FactoMineR: Multivariate Exploratory Data Analysis and Data Mining (R package version 2.11), CRAN [code], https://doi.org/10.32614/CRAN.package.FactoMineR, 2024.
Insurance Bureau of Canada: Hurricane Fiona causes $660 million in insured damage, http://www.ibc.ca/ns/resources/media-centre/media-releases/hurricane-fiona-causes-660-million-in-insured-damage, last access: 31 October 2022.
Irish, J. L., Resio, D. T., and Ratcliff, J. J.: The influence of storm size on hurricane surge, J. Phys. Oceangraph., 38, 2003–2013, https://doi.org/10.1175/2008JPO3727.1, 2008.
Jansen, J. H. F., Van der Gaast, S. J., Koster, B., and Vaars, A. J.: CORTEX, a shipboard XRF-scanner for element analyses in split sediment cores, Mar. Geol., 151, 143–153, https://doi.org/10.1016/S0025-3227(98)00074-7, 1998.
Jardine, D. E., Wang, X., and Fenech, A. L.: Highwater mark collection after post tropical storm Dorian and implications for Prince Edward Island, Canada, Water, 13, 3201, https://doi.org/10.3390/w13223201, 2021.
Juggins, S.: rioja: Analyss of Quaternary Science Data (R package version 1.0-7), CRAN [code], https://doi.org/10.32614/CRAN.package.rioja, 2024.
Kern, O. A., Koutsodendris, A., Maechtle, B., Christanis, K., Schukraft, G., Scholz, C., Kotthoff, U., and Pross, J.: XRF core scanning yields reliable semiquantitative data on the elemental composition of highly organic-rich sediments: Evidence from the Füramoos peat bog (Southern Germany), Sci. Total Environ., 697, 134110, https://doi.org/10.1016/j.scitotenv.2019.134110, 2019.
Klotzbach, P. J. and Gray, W. M.: Multidecadal variability in North Atlantic tropical cyclone activity, J. Climate, 21, 3929–3935, https://doi.org/10.1175/2008JCLI2162.1, 2008.
Knapp, K. R., Kruk, M. C., Levinson, D. H., Diamond, H. J., and Neumann, C. J.: The international best track archive for climate stewardship (IBTrACS) unifying tropical cyclone data, B. Am. Meteorol. Soc., 91, 363–376, https://doi.org/10.1175/2009BAMS2755.1, 2010.
Kossin, J. P.: Hurricane intensification along United States coast suppressed during active hurricane periods, Nature, 541, 390–393, https://doi.org/10.1038/nature20783, 2017.
Kossin, J. P. and Vimont, D. J.: A more general framework for understanding Atlantic hurricane variability and trends, B. Am. Meteorol. Soc., 88, 1767–1782, https://doi.org/10.1175/BAMS-88-11-1767, 2007.
Kossin, J. P., Camargo, S. J., and Sitkowski, M.: Climate modulation of North Atlantic hurricane tracks, J. Climate, 23, 3057–3076, https://doi.org/10.1175/2010JCLI3497.1, 2010.
Kuhlbrodt, T., Swaminathan, R., Ceppi, P., and Wilder, T.: A Glimpse into the Future: The 2023 Ocean Temperature and Sea Ice Extremes in the Context of Longer-Term Climate Change, B. Am. Meteorol. Soc., 105, E474–E485, https://doi.org/10.1175/BAMS-D-23-0209.1, 2024.
Kuhry, P. and Turunen, J.: The postglacial development of boreal and subarctic peatlands, in: Boreal peatland ecosystems. Ecological Studies, vol. 188, edited by: Wieder, R. K. and Vitt, D. H., Springer, Berlin, Heidelberg, Germany, 25–46, https://doi.org/10.1007/978-3-540-31913-9_3, 2006.
Kylander, M. E., Ampel, L., Wohlfarth, B., and Veres, D.: High-resolution X-ray fluorescence core scanning analysis of Les Echets (France) sedimentary sequence: new insights from chemical proxies, J. Quat. Sci, 26, 109–117, 2011.
Kylander, M. E., Söderlindh, J., Schenk, F., Gyllencreutz, R., Rydberg, J., Bindler, R., Martínez Cortizas, A., and Skelton, A.: It's in your glass: a history of sea level and storminess from the Laphroaig bog, Islay (southwestern Scotland), Boreas, 49, 152–167, https://doi.org/10.1111/bor.12409, 2020.
Kylander, M. E., Martínez-Cortizas, A., Sjöström, J. K., Gåling, J., Gyllencreutz, R., Bindler, R., Alexanderson, H., Schenk, F., Reinardy, B. T., and Chandler, B. M.: Storm chasing: Tracking Holocene storminess in southern Sweden using mineral proxies from inland and coastal peat bogs, Quaternary Sci. Rev., 299, 107854, https://doi.org/10.1016/j.quascirev.2022.107854, 2023.
Lachance, A.: 4000 Year Paleo-Storm Proxy Reconstruction from the Magdalen Islands, QC, Canada (V1), Borealis [data set], https://doi.org/10.5683/SP3/JFVRCC, 2025. a
Landry, F.: Derniere Course: Aventures maritimes dans le Golfe du Saint-Laurent, La Boussole, Havre-Aubert, Ile-de-la-Madeleine, 1989.
Landry, F.: Piege de sable, La Boussole, Havre-Aubert, Iles-de-la-Madeleine, 1994.
Lane, P., Donnelly, J. P., Woodruff, J. D., and Hawkes, A. D.: A decadally-resolved paleohurricane record archived in the late Holocene sediments of a Florida sinkhole, Mar. Geol., 287, 14–30, https://doi.org/10.1016/j.margeo.2011.07.001, 2011.
Lapointe, F., Bradley, R. S., Francus, P., Balascio, N. L., Abbott, M. B., Stoner, J. S., St-Onge, G., De Coninck, A., and Labarre, T.: Annually resolved Atlantic sea surface temperature variability over the past 2,900 y, P. Natl. Acad. Sci. USA, 117, 27171–27178, https://doi.org/10.1073/pnas.2014166117, 2020.
Le Droit: Blanche a arraché de nombreux toits aux Iles-de-la-Madeleine, BaNQ, https://numerique.banq.qc.ca/patrimoine/details/52327/4345226?docsearchtext=ouragan ET "iles-de-la-madeleine" (last access: 5 November 2025), 1975.
Le Soleil: Blanche isole les Iles-de-la-Madeleine du continent, BaNQ, https://numerique.banq.qc.ca/patrimoine/details/52327/2714193?docsearchtext=ouragan ET "iles-de-la-madeleine" (last access: 5 November 2025), 29 July 1975.
Liu, D., Bertrand, S., and Weltje, G. J.: An empirical method to predict sediment grain size from inorganic geochemical measurements, Geochem. Geophy. Geosy., 20, 3690–3704, https://doi.org/10.1029/2018GC008154, 2019.
Liu, K.-B. and Fearn, M. L.: Lake-sediment record of late Holocene hurricane activities from coastal Alabama, Geology, 21, 793–796, https://doi.org/10.1130/0091-7613(1993)021<0793:LSROLH>2.3.CO;2, 1993.
Liu, K.-B. and Fearn, M. L.: Reconstruction of prehistoric landfall frequencies of catastrophic hurricanes in northwestern Florida from lake sediment records, Quaternary Res., 54, 238–245, https://doi.org/10.1006/qres.2000.2166, 2000.
Longman, J., Veres, D., and Wennrich, V.: Utilisation of XRF core scanning on peat and other highly organic sediments, Quatern. Int., 514, 85–96, https://doi.org/10.1016/j.quaint.2018.10.015, 2019.
Magnan, G. and Garneau, M.: Evaluating long-term regional climate variability in the maritime region of the St. Lawrence North Shore (eastern Canada) using a multi-site comparison of peat-based paleohydrological records, J. Quaternary Sci., 29, 209–220, https://doi.org/10.1002/jqs.2694, 2014.
Mann, M. E., Woodruff, J. D., Donnelly, J. P., and Zhang, Z.: Atlantic hurricanes and climate over the past 1,500 years, Nature, 460, 880–883, https://doi.org/10.1038/nature08219, 2009a.
Mann, M. E., Zhang, Z., Rutherford, S., Bradley, R. S., Hughes, M. K., Shindell, D., Ammann, C., Faluvegi, G., and Ni, F.: Global signatures and dynamical origins of the Little Ice Age and Medieval Climate Anomaly, Science, 326, 1256–1260, https://doi.org/10.1126/science.1177303, 2009b.
Ministère de l'Environnement, de la Lutte contre les changements climatiques, de la Faune et des Parcs: Habitat floristique de la Tourbière-du-Lac-Maucôque, https://www.environnement.gouv.qc.ca/biodiversite/habitats/tourbiere-lac-maucoque/index.htm, last access: 27 May 2021a.
Ministère de l'Environnement, de la Lutte contre les changements climatiques, de la Faune et des Parcs: Habitat floristique de la Tourbière-de-L'Anse-à-la-Cabane, https://www.environnement.gouv.qc.ca/biodiversite/habitats/tourbiere-anse-cabane/index.htm, last access: 27 May 2021b.
Monica, S. B., Wallace, D. J., Wallace, E. J., Du, X., Dee, S. G., and Anderson, J. B.: 4500-year paleohurricane record from the Western Gulf of Mexico, Coastal Central TX, USA, Mar. Geol., 473, 107303, https://doi.org/10.1016/j.margeo.2024.107303, 2024.
Morin, I.: Geomorphologie et evolution du systeme dunaire des iles de la Madeleine, Quebec, Departement de Géographie, Universite Laval, https://www.collectionscanada.gc.ca/obj/s4/f2/dsk2/ftp03/MQ49112.pdf (last access: 5 November 2025), 2001.
Oliva, F., Peros, M., and Viau, A.: A review of the spatial distribution of and analytical techniques used in paleotempestological studies in the western North Atlantic Basin, Prog. Phys. Geog., 41, 171–190, https://doi.org/10.1177/0309133316683899, 2017.
Oliva, F., Peros, M., Viau, A., Reinhardt, E., Nixon, F., and Morin, A.: A multi-proxy reconstruction of tropical cyclone variability during the past 800 years from Robinson Lake, Nova Scotia, Canada, Mar. Geol., 406, 84–97, https://doi.org/10.1016/j.margeo.2018.09.012, 2018.
Orme, L. C., Reinhardt, L., Jones, R. T., Charman, D. J., Barkwith, A., and Ellis, M. A.: Aeolian sediment reconstructions from the Scottish Outer Hebrides: Late Holocene storminess and the role of the North Atlantic Oscillation, Quat. Sci. Rev., 132, 15–25, https://doi.org/10.1016/j.quascirev.2015.10.045, 2016a.
Orme, L. C., Reinhardt, L., Jones, R. T., Charman, D. J., Croudace, I., Dawson, A., Ellis, M., and Barkwith, A.: Investigating the maximum resolution of µXRF core scanners: A 1800 year storminess reconstruction from the Outer Hebrides, Scotland, UK, Holocene, 26, 235–247, https://doi.org/10.1177/0959683615596819, 2016b.
Owens, E. and McCann, S.: The coastal geomorphology of the Magdalen Islands, Québec, 80–10, https://emrlibrary.gov.yk.ca/gsc/papers/80_10.pdf (last access: 5 November 2025), 1980.
Pasch, R. J., Penny, A. B., and Berg, R.: National hurricane center tropical cyclone report – Hurricane Fiona, NOAA National Hurricane Center, https://www.nhc.noaa.gov/data/tcr/AL072022_Fiona.pdf (last access: 5 November 2025), 2023.
Patterson, R. T., Nasser, N. A., Reinhardt, E. G., Patterson, C. W., Gregory, B. R., Mazzella, V., Roe, H. M., and Galloway, J. M.: End-Member Mixing Analysis as a Tool for the Detection of Major Storms in Lake Sediment Records, Paleoceanogr. Paleoclimatol., 37, e2022PA004510, https://doi.org/10.1029/2022PA004510, 2022.
Peros, M., Chan, K., Magnan, G., Ponsford, L., Carroll, J., and McCloskey, T.: A 9600-year record of water table depth, vegetation and fire inferred from a raised peat bog, Prince Edward Island, Canadian Maritimes, J. Quaternary Sci., 31, 512–525, https://doi.org/10.1002/jqs.2875, 2016.
Perrier, L., Garneau, M., Pratte, S., and Sanderson, N. K.: Climate-driven Holocene ecohydrological and carbon dynamics from maritime peatlands of the Gulf of St. Lawrence, eastern Canada, Holocene, 09596836221095978, https://doi.org/10.1177/09596836221095978, 2022.
Pleskot, K., Cwynar, L. C., Kowalczyk, C., Kokociński, M., and Szczuciński, W.: Refining the history of extreme coastal events in southern Newfoundland, NW Atlantic, with lake sediment archives, Quaternary Sci. Rev., 322, 108401, https://doi.org/10.1016/j.quascirev.2023.108401, 2023.
Prest, V. K., Terasme, J., Matthews Jr., J. V., and Lichti-Federovich, S.: Late-Quaternary History of Magdalen Islands, Quebec, Atlantic Geol., 12, 39–60, https://doi.org/10.4138/1835, 1976.
Primeau, G. and Garneau, M.: Carbon accumulation in peatlands along a boreal to subarctic transect in eastern Canada, Holocene, 31, 858–869, https://doi.org/10.1177/0959683620988031, 2021.
Public Safety Canada: Canadian Disaster Database, https://bdc.securitepublique.gc.ca/prnt-eng.aspx?cultureCode=en-Ca&eventTypes='HU'&normalizedCostYear=1, last access: 29 July 2024.
Pye, K. and Tsoar, H.: Aeolian Sand and Sand Dunes, Springer Berlin, Heidelberg, 458 pp., https://doi.org/10.1007/978-3-540-85910-9, 2008.
Reimer, P. J., Austin, W. E. N., Bard, E., Bayliss, A., Blackwell, P. G., Bronk Ramsey, C., Butzin, M., Cheng, H., Edwards, R. L., Friedrich, M., Grootes, P. M., Guilderson, T. P., Hajdas, I., Heaton, T. J., Hogg, A. G., Hughen, K. A., Kromer, B., Manning, S. W., Muscheler, R., Palmer, J. G., Pearson, C., van der Plicht, J., Reimer, R. W., Richards, D. A., Scott, E. M., Southon, J. R., Turney, C. S. M., Wacker, L., Adolphi, F., Büntgen, U., Capano, M., Fahrni, S. M., Fogtmann-Schulz, A., Friedrich, R., Köhler, P., Kudsk, S., Miyake, F., Olsen, J., Reinig, F., Sakamoto, M., Sookdeo, A., and Talamo, S.: The IntCal20 Northern Hemisphere Radiocarbon Age Calibration Curve (0–55 cal kBP), Radiocarbon, 62, 725–757, https://doi.org/10.1017/RDC.2020.41, 2020.
Rémillard, A. M., Hétu, B., Bernatchez, P., and Bertran, P.: The Drift des Demoiselles on the Magdalen Islands (Québec, Canada): sedimentological and micromorphological evidence of a Late Wisconsinan glacial diamict, Can. J. Earth Sci., 50, 545–563, https://doi.org/10.1139/cjes-2011-0115, 2013.
Rémillard, A. M., Buylaert, J.-P., Murray, A., St-Onge, G., Bernatchez, P., and Hétu, B.: Quartz OSL dating of late Holocene beach ridges from the Magdalen Islands (Quebec, Canada), Quat. Geochronol., 30, 264–269, https://doi.org/10.1016/j.quageo.2015.03.013, 2015.
Rémillard, A. M., St-Onge, G., Bernatchez, P., Hétu, B., Buylaert, J. P., Murray, A. S., and Vigneault, B.: Chronology and stratigraphy of the Magdalen Islands archipelago from the last glaciation to the early Holocene: new insights into the glacial and sea-level history of eastern Canada, Boreas, 45, 604–628, https://doi.org/10.1111/bor.12179, 2016.
Rémillard, A. M., St-Onge, G., Bernatchez, P., Hétu, B., Buylaert, J.-P., Murray, A. S., and Lajeunesse, P.: Relative sea-level changes and glacio-isostatic adjustment on the Magdalen Islands archipelago (Atlantic Canada) from MIS 5 to the late Holocene, Quaternary Sci. Rev., 171, 216–233, https://doi.org/10.1016/j.quascirev.2017.07.015, 2017.
Rodysill, J. R., Donnelly, J. P., Sullivan, R., Lane, P. D., Toomey, M., Woodruff, J. D., Hawkes, A. D., MacDonald, D., d'Entremont, N., and McKeon, K.: Historically unprecedented Northern Gulf of Mexico hurricane activity from 650 to 1250 CE, Sci. Rep., 10, 1–17, https://doi.org/10.1038/s41598-020-75874-0, 2020.
Shotyk, W.: Review of the inorganic geochemistry of peats and peatland waters, Earth-Sci. Rev., 25, 95–176, https://doi.org/10.1016/0012-8252(88)90067-0, 1988.
Sjöström, J. K., Cortizas, A. M., Hansson, S. V., Sánchez, N. S., Bindler, R., Rydberg, J., Mörth, C.-M., Ryberg, E. E., and Kylander, M. E.: Paleodust deposition and peat accumulation rates–Bog size matters, Chem. Geol., 554, 119795, https://doi.org/10.1016/j.chemgeo.2020.119795, 2020.
Sjöström, J. K., Gyllencreutz, R., Cortizas, A. M., Nylund, A., Piilo, S. R., Schenk, F., McKeown, M., Ryberg, E. E., and Kylander, M. E.: Holocene storminess dynamics in northwestern Ireland: Shifts in storm duration and frequency between the mid-and late Holocene, Quaternary Sci. Rev., 337, 108803, https://doi.org/10.1016/j.quascirev.2024.108803, 2024.
Steinmann, P. and Shotyk, W.: Geochemistry, mineralogy, and geochemical mass balance on major elements in two peat bog profiles (Jura Mountains, Switzerland), Chem. Geol., 138, 25–53, https://doi.org/10.1016/S0009-2541(96)00171-4, 1997.
ten Brink, U. S., Chaytor, J., Geist, E. L., Brothers, D. S., and Andrews, B. D.: Assessment of tsunami hazard to the US Atlantic margin, Mar. Geol., 353, 31–54, https://doi.org/10.1016/j.margeo.2014.02.011, 2014.
Ting, M., Kossin, J. P., Camargo, S. J., and Li, C.: Past and future hurricane intensity change along the US east coast, Sci. Rep., 9, 1–8, https://doi.org/10.1038/s41598-019-44252-w, 2019.
Troels-Smith, J.: Karakterisering af lose jordater (Characterization of unconsolidated sediments), Danmarks Geologiske Undersogelse IV. Række, 3, 1–73, https://doi.org/10.34194/raekke4.v3.6989, 1955.
Tukey, J. W.: Exploratory data analysis, Springer, https://doi.org/10.1007/978-0-387-32833-1_136, 1977.
Vaasma, T.: Grain-size analysis of lacustrine sediments: a comparison of pre-treatment methods, Estonian J. Ecol., 57, https://doi.org/10.3176/eco.2008.4.01, 2008.
Vaasma, T., Vandel, E., Sugita, S., Tõnisson, H., Suursaar, Ü., Kont, A., and Vilumaa, K.: Storminess reconstruction in the northeastern Baltic Sea region over the past 7600 years based on aeolian sand influx into coastal bogs, Holocene, 35, 61–74, https://doi.org/10.1177/09596836241285783, 2025.
Vacchi, M., Engelhart, S. E., Nikitina, D., Ashe, E. L., Peltier, W. R., Roy, K., Kopp, R. E., and Horton, B. P.: Postglacial relative sea-level histories along the eastern Canadian coastline, Quaternary Sci. Rev., 201, 124–146, https://doi.org/10.1016/j.quascirev.2018.09.043, 2018.
van de Plassche, O., Erkens, G., van Vliet, F., Brandsma, J., van der Borg, K., and de Jong, A. F.: Salt-marsh erosion associated with hurricane landfall in southern New England in the fifteenth and seventeenth centuries, Geology, 34, 829–832, https://doi.org/10.1130/G22598.1, 2006.
Van den Boogaart, K. G. and Tolosana-Delgado, R.: “Compositions”: a unified R package to analyze compositional data, Comput. Geosci., 34, 320–338, https://doi.org/10.1016/j.cageo.2006.11.017, 2008.
Van den Boogaart, K. G. and Tolosana-Delgado, R.: Analyzing compositional data with R, in: Use R!, edited by: Gentleman, R., Hornik, K., and Parmigiani, G. G., Springer, 258 pp., https://doi.org/10.1007/978-3-642-36809-7, 2013.
Van den Boogaart, K. G., Tolosana-Delgado, R., and Bren, M.: compositions: Compositional Data Analysis (R package version 2.0-8), CRAN [code], https://doi.org/10.32614/CRAN.package.compositions, 2024.
van Geel, B., Buurman, J., and Waterbolk, H. T.: Archaeological and palaeoecological indications of an abrupt climate change in The Netherlands, and evidence for climatological teleconnections around 2650 BP, J. Quaternary Sci., 11, 451–460, https://doi.org/10.1002/(SICI)1099-1417(199611/12)11:6<451::AID-JQS275>3.0.CO;2-9, 1996.
van Hengstum, P. J., Donnelly, J. P., Toomey, M. R., Albury, N. A., Lane, P., and Kakuk, B.: Heightened hurricane activity on the Little Bahama Bank from 1350 to 1650 AD, Cont. Shelf Res., 86, 103–115, https://doi.org/10.1016/j.csr.2013.04.032, 2014.
Vandel, E., Vaasma, T., Sugita, S., Tõnisson, H., Jaagus, J., Vilumaa, K., Anderson, A., and Kont, A.: Reconstruction of past storminess: Evaluation of an indicator approach using aeolian mineral grains buried in peat deposits, Estonia, Quaternary Sci. Rev., 218, 215–227, https://doi.org/10.1016/j.quascirev.2019.06.026, 2019.
Vimont, D. J. and Kossin, J. P.: The Atlantic meridional mode and hurricane activity, Geophys. Res. Lett., 34, https://doi.org/10.1029/2007GL029683, 2007.
Wallace, E., Donnelly, J. P., van Hengstum, P. J., Wiman, C., Sullivan, R., Winkler, T., d'Entremont, N., Toomey, M., and Albury, N.: Intense hurricane activity over the past 1500 years at South Andros Island, The Bahamas, Paleoceanogr. Paleoclimatol., 34, 1761–1783, https://doi.org/10.1029/2019PA003665, 2019.
Wallace, E., Donnelly, J., van Hengstum, P., Winkler, T., Dizon, C., LaBella, A., Lopez, I., d'Entremont, N., Sullivan, R., and Woodruff, J.: Regional shifts in paleohurricane activity over the last 1500 years derived from blue hole sediments offshore of Middle Caicos Island, Quaternary Sci. Rev., 268, 107126, https://doi.org/10.1016/j.quascirev.2021.107126, 2021a.
Wallace, E., Donnelly, J., van Hengstum, P., Winkler, T., McKeon, K., MacDonald, D., d'Entremont, N., Sullivan, R., Woodruff, J., and Hawkes, A.: 1,050 years of hurricane strikes on Long Island in The Bahamas, Paleoceanogr. Paleoclimatol., 36, e2020PA004156, https://doi.org/10.1029/2020PA004156, 2021b.
Wang, J., Yang, B., Ljungqvist, F. C., Luterbacher, J., Osborn, T. J., Briffa, K. R., and Zorita, E.: Internal and external forcing of multidecadal Atlantic climate variability over the past 1,200 years, Nat. Geosci., 10, 512–517, https://doi.org/10.1038/ngeo2962, 2017.
Wang, Y., Jahan, S., Burnett, W. C., Wu, Z., Elsner, J. B., Means, G. H., Liu, J., and Jiang, S.: Late Holocene tropical cyclones linked to climatic and solar variability, Quaternary Sci. Rev., 334, 108710, https://doi.org/10.1016/j.quascirev.2024.108710, 2024.
Weiss, D., Shotyk, W., Rieley, J., Page, S., Gloor, M., Reese, S., and Martinez-Cortizas, A.: The geochemistry of major and selected trace elements in a forested peat bog, Kalimantan, SE Asia, and its implications for past atmospheric dust deposition, Geochim. Cosmochim. Ac., 66, 2307–2323, https://doi.org/10.1016/S0016-7037(02)00834-7, 2002.
Wentworth, C. K.: A scale of grade and class terms for clastic sediments, J. Geol., 30, 377–392, https://doi.org/10.1086/622910, 1922.
Winkler, T., van Hengstum, P., Donnelly, J., Wallace, E., Albury, N., D'Entremont, N., Hawkes, A., Maio, C., Roberts, J., and Sullivan, R.: More frequent Hurricane passage across the Bahamian Archipelago during the little ice age, Paleoceanogr. Paleoclimatol., 38, e2023PA004623, https://doi.org/10.1029/2023PA004623, 2023.
Winkler, T. S., van Hengstum, P. J., Donnelly, J. P., Wallace, E. J., Sullivan, R. M., MacDonald, D., and Albury, N. A.: Revising evidence of hurricane strikes on Abaco Island (The Bahamas) over the last 700 years, Sci. Rep., 10, 16556, https://doi.org/10.1038/s41598-020-73132-x, 2020.
Winkler, T. S., van Hengstum, P. J., Donnelly, J. P., Wallace, E. J., D'Entremont, N., Hawkes, A. D., Maio, C. V., Sullivan, R. M., and Woodruff, J. D.: Oceanic passage of hurricanes across Cay Sal Bank in The Bahamas over the last 530 years, Mar. Geol., 443, 106653, https://doi.org/10.1016/j.margeo.2021.106653, 2022.
Wu, X., de Vernal, A., Fréchette, B., Moros, M., and Perner, K.: The signal of climate changes over the last two millennia in the Gulf of St. Lawrence, eastern Canada, Quaternary Res., 106, 28–43, https://doi.org/10.1017/qua.2021.56, 2022.
Yang, W., Wallace, E., Vecchi, G. A., Donnelly, J. P., Emile-Geay, J., Hakim, G. J., Horowitz, L. W., Sullivan, R. M., Tardif, R., and van Hengstum, P. J.: Last millennium hurricane activity linked to endogenous climate variability, Nat. Commun., 15, 816, https://doi.org/10.1038/s41467-024-45112-6, 2024.
Yang, Y., Maselli, V., Normandeau, A., Piper, D. J., Li, M. Z., Campbell, D. C., Gregory, T., and Gao, S.: Latitudinal response of storm activity to abrupt climate change during the last 6,500 years, Geophys. Res. Lett., 47, e2020GL089859, https://doi.org/10.1029/2020GL089859, 2020.
- Abstract
- Introduction
- Context
- Methods
- Results
- Discussion
- Conclusion
- Appendix A: Wind roses from the Magdalen Islands
- Appendix B: Supplementary information on core sampling and construction of the two composite cores
- Appendix C: Core pictures
- Appendix D: Chronostratigraphy
- Appendix E: Correlation results
- Appendix F: Historical hurricanes
- Data availability
- Author contributions
- Competing interests
- Disclaimer
- Acknowledgements
- Financial support
- Review statement
- References