the Creative Commons Attribution 4.0 License.
the Creative Commons Attribution 4.0 License.
 | 11 Nov 2025
Oligocene-early Miocene paradox of pCO2 inferred from alkenone carbon isotopic fractionation and sea surface temperature trends
José Guitián
Samuel Phelps
Reto S. Wijker
Pratigya J. Polissar
Laura Arnold
Heather M. Stoll
Atmospheric carbon dioxide decline is hypothesized to drive the progressive cooling over the Cenozoic. However, the decline in the phytoplankton carbon isotopic fractionation (εp) from the early Oligocene to Miocene time interval, interpreted as a long term CO2 decline, differs from the apparent long term stability in climate indicators like benthic oxygen isotopes. Here, we produce two new long-term records of εp over the Oligocene to early Miocene time interval from widely separated locations at IODP Site 1406 and ODP 1168 and increase the resolution of determinations at the equatorial Atlantic ODP 925. These new results confirm a global trend of εp decline occurring during this interval. Rapid 3 ‰ declines are found from 27 to 24.5 million years ago (Ma) and 24 to 22.5 Ma, and minimum εp is attained at 19 Ma. Between 29.7 and 28.7 Ma at IODP 1406, a 20–30 ky sampling resolution reveals orbital scale 100 kyr cyclicity in εp. Making use of alkenone-based sea surface temperature (SST) estimates and benthic δ18O estimates extracted from the same samples, we perform a direct comparison with εp to evaluate the relationship with climate. We observe that across the long Oligocene to early Miocene interval, εp is positively correlated to SST only at the Southern Ocean Site 1168, but not with SST at the North Atlantic Site 1406. Accounting for the temperature-driven growth rate or cell size effects on εp does not lead to stronger correlations between εp and benthic δ18O nor stronger correlations between εp and SST at Site 1406. Moreover, at orbital timescale, the relationship between εp and benthic δ18O, albeit weak, implies greater ice volume or colder deep ocean at higher CO2. Despite the persistence of climate paradox, the reproducible trends in three widely separated sites, which experienced contrasting temperature evolution and likely experienced different variations in nutrient availability, suggest that a common CO2 forcing is likely the dominant control on the long term trends in εp. Changing ocean heat transport to the North Atlantic may contribute to the observed decoupling of long term εp and SST in this location.
- Article
(5071 KB) - Full-text XML
-
Supplement
(1361 KB) - BibTeX
- EndNote


1.1 Oligocene to Miocene long term CO2 and climate trends
Geological records provide key context to current assessments of the consequences of rising atmospheric CO2 on ice sheet stability and oceanic temperatures (Foster et al., 2017; Golledge, 2020; Zachos et al., 2008). The Oligocene to Miocene time interval has been proposed to represent a nonlinear transition between the “greenhouse” and “icehouse” stages of Earth history (Miller et al., 1991; Zachos et al., 2001) useful to evaluate the Earth system climate sensitivity to the hypothesized progressive CO2 drawdown of the Cenozoic (Deconto et al., 2008; Zhang et al., 2013). However, the long term decline in CO2 estimated by existing proxy records contrasts with the rather stable climatic state with multimillion year warming (e.g. Late Oligocene Warming) and cooling (e.g. Mi-1 glaciation) trends interpreted from deep ocean (Cramer et al., 2011; Lear et al., 2000), and surface ocean records (Guitián et al., 2019; Liu et al., 2009; O'Brien et al., 2020) and variable Antarctic Ice sheet volume and sea level (Lear et al., 2004; Liebrand et al., 2017; Miller et al., 2020).
The long term pCO2 trends from the Oligocene to early Miocene are derived from the sensitivity of marine algae to pCO2 based on the carbon isotopic fractionation in organic matter during photosynthesis (εp) of marine phytoplankton (Henderiks and Pagani, 2008; Pagani et al., 1999, 2000, 2005; Super et al., 2018; Zhang et al., 2013) while published δ11B based CO2 estimates cover the latest Oligocene into early Miocene (younger than 24 Ma). The algae isotopic fractionation can be reconstructed in the past from sediments by the analysis of δ13C of the organic lipids and reconstruction of the δ13C of the DIC in the seawater from which biomass was produced. Fractionation (εp) is predicted to be higher when CO2 availability is high relative to cellular carbon demand. A decrease in atmospheric CO2 and consequently in CO2 of the surface ocean should therefore lead to a decrease in εp at any given site. However, in addition to CO2, the εp in phytoplankton is affected by physiological factors such as the rate of carbon fixation, which may vary over time in a given location due to variations in temperature or the supply of light (Rau et al., 1996; Stoll et al., 2019).
One approach to evaluate the relative contribution of physiological factors vs CO2 is to produce εp records from sites of widely contrasting oceanographic setting, where the CO2 signal may be expected to be common to both locations but the environmental factors affecting the fractionation such as nutrient availability might not be expected to change in unison. In this study, we produce a new long-term record of εp over the Oligocene to Miocene time interval at two new, widely separated locations: IODP Site1406 in the subtropical North Atlantic off the Newfoundland coast, and ODP 1168 in the Southern Ocean off Tasmania. We also increase the resolution of determinations at the equatorial Atlantic ODP 925. The existing εp-based CO2 estimations for the Oligocene are derived from ∼ 1 million year resolution measurements from two sites (Site 925 and 516) on the South American margin of the equatorial and South Atlantic; in the early Miocene an additional North Atlantic record (Site 608) provides data (CenCO2PIP Consortium, 2023).
Our new < 1 million year resolution εp records from these two mid- latitude locations allow us to directly compare εp with estimates of SST derived from alkenones extracted from the same samples, since unlike very warm tropical locations, the index still retains sensitivity to temperature in the mid-latitudes during the Oligocene and early Miocene. Additionally, we compare εp with benthic δ18O available from the same sediments. Variations in benthic δ18O are controlled by changes in both deep-water temperature and deep ocean δ18Osw which reflects ice volume. We further measure εp and benthic δ18O at approximately 20–30 ky resolution over a series of eccentricity cycles in the early Oligocene at IODP 1406. The dataset allows a robust evaluation of the relationship between εp and climate for this time interval. We further discuss the significance of the observed εp record with the implications for the phytoplankton sensitivity over multimillion year timescales over the Cenozoic.
1.2 An overview of alkenone εppCO2 proxy
The carbon isotopic fractionation in phytoplankton during photosynthesis is affected not only by the aqueous carbon dioxide (CO2[aq]) but also by physiological factors related to the cellular uptake of carbon. Physiological factors were initially modelled from the assumption of diffusive carbon acquisition in phytoplankton cells (Rau et al., 1996), where higher εp could be induced by higher CO2(aq), lower instantaneous growth rates, or a higher cellular surface area to volume ratio. Both cellular permeability and the carbon isotopic fractionation by the Rubisco enzyme have been assumed to be constant, with Rubisco fractionation typically estimated between 25 ‰ and 29 ‰ for alkenone producers (Pagani, 2014). Traditional attempts to reconstruct pCO2 from εp have simplified this original diffusive model by relating εp and CO2 with a single factor b defined to include all physiological parameters affecting the fractionation, and εf representing the fractionation of the Rubisco enzyme (Jasper et al., 1994).
The b-value has been estimated from modern photic zone and culture samples, for which CO2(aq) is independently known. For sedimentary alkenones, previous pCO2 calculates have either (1) assumed the modern b-value for that oceanographic setting remained constant in the past (e.g. Zhang et al., 2013), (2) applied modern relationships between b-value and phosphate and a simulated paleo-surface ocean phosphate concentration at the site (Pagani et al., 2011) (3) estimated the difference between the modern b-value at the site and the paleo-setting b-value from productivity proxies (Bolton et al., 2016) or (4) applied variation in the b-value at the site based on proxies for coccolithophore size (Henderiks and Pagani, 2007). Despite the appeal of this approach, a recent re-evaluation of cultures and field observations suggest the b term is not well predicted by growth rate, light or cell size alone in a diffusive model but that additional effects occur from carbon concentration mechanisms (CCM) on carbon uptake at lower CO2 concentrations, which cause a deviation in the CO2 dependence from the theoretical hyperbolic relationship (Stoll et al., 2019; Hernández-Almeida et al., 2020). A further challenge to the physical diffusive model is that the Rubisco fractionation in coccolithophores has been measured in-vitro as 11 ‰ rather than 25 ‰ (Boller et al., 2011), suggesting that fractionations larger than 11 ‰ may reflect the operation of additional enzymatic fractionations (Wilkes et al., 2018). The lower Rubisco fractionation implies a lower sensitivity of εp to CO2 (e.g. as explored in González-Lanchas et al., 2021).
A meta-analysis of experimental culture data (Stoll et al., 2019) suggests that εp features a logarithmic dependence on CO2, rather than the hyperbolic dependence implied by Rau et al. (1996). This analysis does not resolve the mechanisms for the observed relationship between εp and CO2, but over the range of CO2(aq) from 5 to 30 µM, it provides an empirical relationship for interpreting the magnitude of CO2(aq) change implied by a given εp change. The culture dataset illustrates more broadly how εp is the sum of its dependencies on ln(CO2), ln(light), and growth rate μi and cell radius:
where CO2(aq) is in µM, light is in µE, growth rate μi is d−1 and radius is in microns (see Stoll et al., 2019 for confidence intervals on the regression).
From this empirical culture calibration, two challenges remain for the estimation of past CO2 from εp measurements derived from sedimentary alkenones. First, its use would require an estimation of the cell radius, light during the season and depth of alkenone production, and the growth rate. While cell size can be estimated from coccolith length (Henderiks and Pagani, 2007), determining the absolute light and growth rate is rarely possible. Since the equation is a linear sum of these influences, these non-CO2 variables may be integrated into the intercept (e.g. as in González-Lanchas et al., 2021), where the intercept (I) would decrease with higher growth rates and larger cell sizes and increase with higher light.
Yet, as with Eq. (2), there remains the challenge of determining which value should be used for the intercept for past conditions, and whether a constant or variable I is more appropriate for a given site since there are limited proxies for algal growth rate. Recent culture studies document a 0.5 ‰ decrease in εp per 1 °C warming (Torres Romero et al., 2024), and show that this magnitude is identical to the product of εp dependence on growth rate (Stoll et al., 2019) and the modeled temperature dependence of coccolithophore growth rates (Krumhardt et al., 2017) derived from diverse culture and field studies (Fielding, 2013; Sherman et al., 2016; Behrenfeld et al., 2005). This suggests that growth rate, and I, may vary over time at a given location if temperature is variable. Therefore, records of SST from alkenone unsaturation or other proxies provide the opportunity to deconvolve the effects of temperature-driven growth rate variations on εp even when the absolute growth rate is not known.
In this study, given the potential for oceanographic conditions at the studied sites to differ significantly from those in the modern ocean at these locations, and the concomitant high uncertainties in estimating an appropriate b-value for the traditional approach or I for Eq. (3), we do not calculate the past absolute CO2 concentration from our εp measurements. Instead, we account for the potential influence of temperature-driven growth rate changes on our εp records using alkenone temperature estimates derived from the same samples. Similarly, we evaluate the potential impact of cell size variations on the εp changes. Then, we employ the sensitivity of εp to CO2 in Eq. (3) to estimate possible relative changes in CO2 in the case where the other nutrient-stimulated growth rate or light influences on εp were constant during the studied interval at each site evaluating evidence for this assumption.
We have selected two widely separated paleo locations for this study, from the mid latitude North Atlantic Ocean and the high to mid latitudes of the Southern Ocean, from IODP 1406 (40°21.0′ N, 51°39.0′ W; 3814 m b.s.l.), ODP 1168 (43°36.5′ S, 144°24.7′ E, and 2463 m b.s.l.), respectively (Fig. 1). A total of 43 and 34 sediment sampling spreading from 30 to 17 Ma at each site were selected. Additionally, 61 samples (at approximately 15 ky sampling interval for bulk carbonate isotopes) were obtained from IODP 1406 within the 30–29 Ma time window, of which 29 were processed for benthic foraminiferal isotopes and 22 yielded biomarkers sufficient for analysis. We also measured an additional six sample set from equatorial Site ODP 925 (4°12.25′ N, 43°29.33′ W, 3042 m b.s.l.) in order to increase the million-year scale resolution of the previous longest Oligocene record in alkenone carbon fractionation (Zhang et al., 2013).The age model for Sites 1406 and 1168 has been updated using new Sr isotope stratigraphy (Stoll et al., 2024) and the age-modelling software Bacon (Blaauw and Christen, 2011). The new age model for IODP Site 1406 is comparable to previously published chronologies (e.g. as in Guitián et al., 2019; Van Peer et al., 2017) but clarifies the duration of the upper Miocene hiatus between 33.3 and 34.7 m core depths (CCSF-A) as extending from 18.5 to 21 Ma. The age model of ODP Site 1168 was revised with the Sr isotope stratigraphy in the interval from 562 to 278 m b.s.f. The Site 1168 chronology is significantly shifted for most of the Oligocene to early Miocene compared with previous biostratigraphically-based age models and shipboard magnetostratigraphy (Pfuhl and McCave, 2003). Strontium isotope stratigraphy identifies a condensed interval from 22.5 to 21.6 Ma, but suggests sustained sedimentation thereafter through 16 Ma. The age model is most uncertain between 27 and 25 Ma where the Sr isotopic curve has a low rate of change. For the two ODP 1168 samples deeper than the Sr isotope measurements (562 m b.s.f.), and those from Site ODP 925 we use previous age constraints as published previously by Guitián et al. (2020).
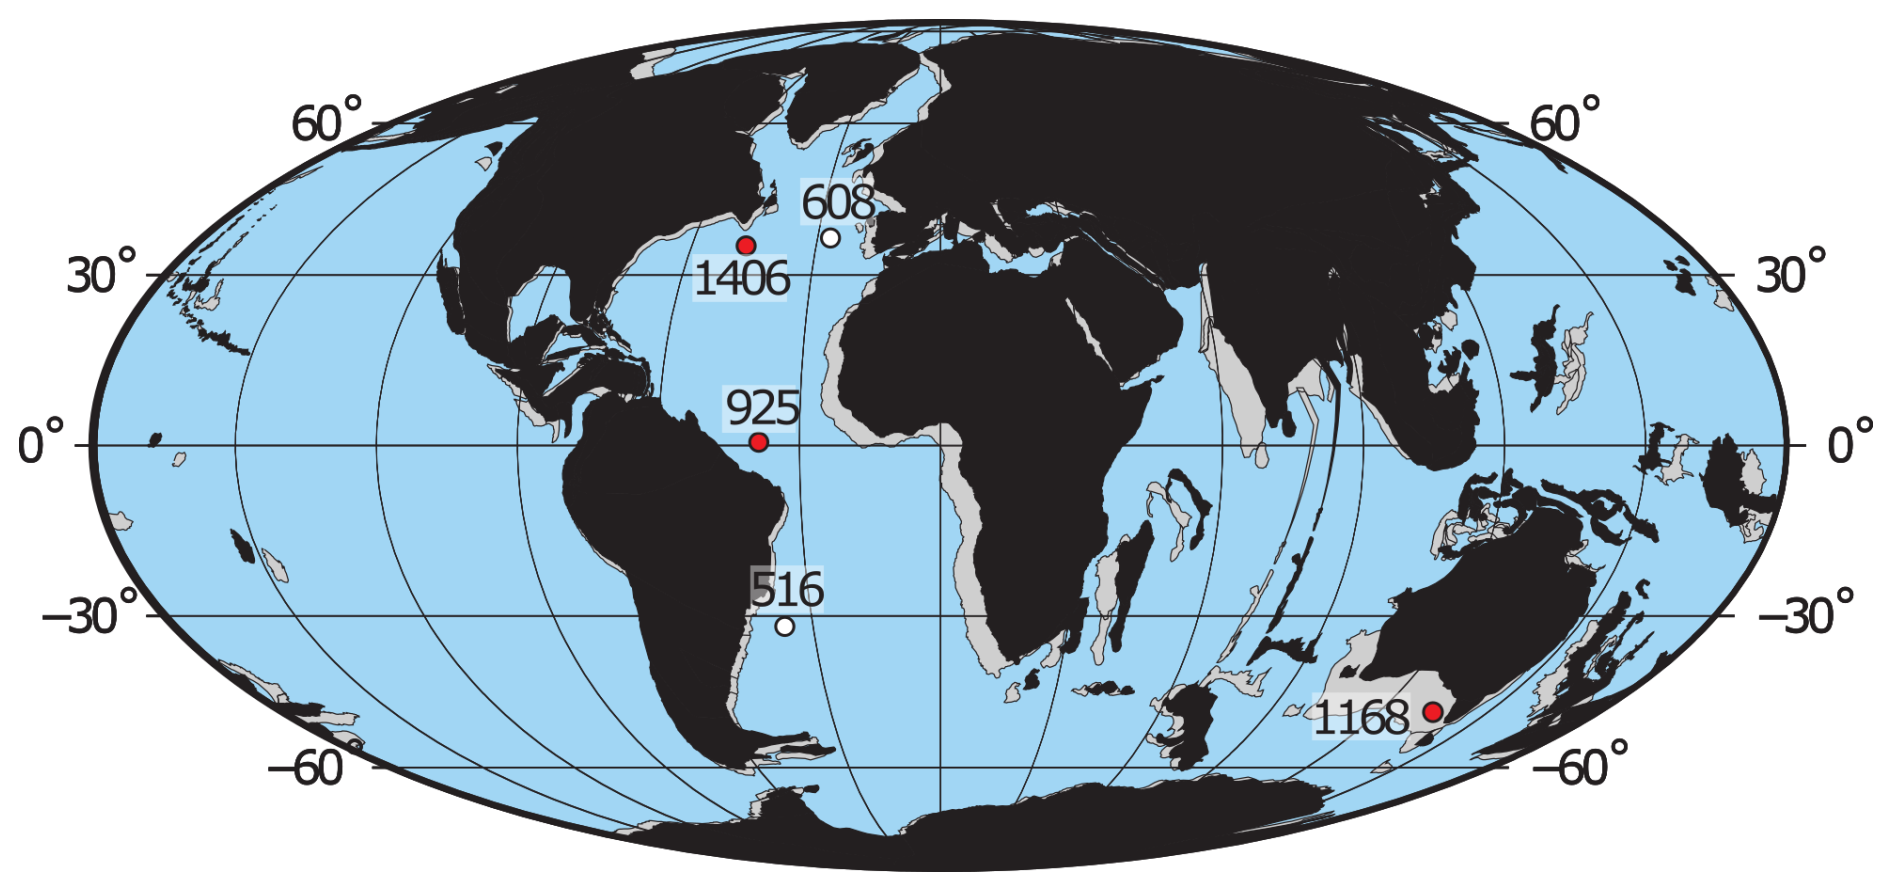
Figure 1Location of the study sites. Reconstructed map of continental distribution over the 30 Ma (grey)–17 Ma (black) time interval. Modified after the plate tectonic reconstruction service from the Ocean Drilling Stratigraphic Network (https://www.odsn.de/, last access: 4 November 2025) using the data from Hay et al. (1999).
The paleolatitude reconstruction for the Oligocene to early Miocene barely changes the position of Atlantic sites, in contrast, ODP 1168 moved from 55 to 48° S between 30 and 15 Ma (Torsvik et al., 2012; van Hinsbergen et al., 2015). Paleoecological reconstructions from dinoflagellates confirm that the waters above Site 1168 were continually influenced by the Leeuwin Current and located well equatorward of the Subtropical Front (Hou et al., 2023b) during the Miocene. Paleodepth estimates for coastal site ODP 1168 suggest a gradual deepening from the Eocene onwards (Exon et al., 2001).
3.1 Alkenone purification, quantification and δ13C analysis
Biomarkers from sediments of IODP 1406 and ODP 1168 were extracted from 30 g of freeze-dried sediment using an Accelerated Solvent Extractor 350 with CH2Cl (9:1 ) solvent for four static cycles at 100 °C and further silica gel column chromatography protocols for purification of the ketone fraction containing the alkenones (see Guitián et al., 2019 for details).
Alkenone ratios were obtained with a Thermo Scientific Trace 1310 Gas Chromatograph (GC)-FID. Originally, for IODP 1406 and 1168 samples the GC-FID was equipped with a non-polar (60 m × 0.25 mm × 0.25 µm) capillary column (ZB-1ms, Zebron™) at ETH Zurich and at Lamont-Doherty Earth Observatory from Columbia University (Guitián et al., 2019; Guitián and Stoll, 2021). However, ODP Site 1168 samples older than 22.4 Ma featured more complex chromatograms and a high diversity of compounds. To reduce the effects of coelution, samples were additionally analyzed on a 105 m column RTX-200ms at ETH Zurich, which improved separation of long chain ketones (Rama-Corredor et al., 2018). The following temperature program was used: 1 min at 50°C, temperature gradient of 40 °C min−1 to 200°C and 5 °C min−1 to 300°C, hold for 45 min, and increased to 320°C at 10 °C min−1 and hold for 8 min. Carrier gas was Helium at a flow rate of 1.5 mL min−1. In-house standards and replicates injected at every sequence ensured instrument precision. A subset of IODP Site 1406 and samples younger than 22.4 Ma from Site 1168 were re-measured with the RTX-200 to ensure replicability (Table S1 in the Supplement). Method used for each organic analysis is described in the supplementary material dataset.
Sea surface temperature was calculated from ratio using the Bayspline calibration (Tierney and Tingley, 2018) for all samples in IODP 1406 and for the young set (< 23.1 Ma) of samples in ODP 1168. Because for those, we find ratios within the analytical uncertainty using both columns, we report the original ZB-1 results for all Site 1406 samples and Site 1168 samples younger than 22.4 Ma/408.22 m depth. The RTX-200 column provided substantially improved resolution of C38 peaks, allowing quantification of C38:2 and C38:3 ME peaks. For samples between the ages of 23.1 and 29.1 Ma in ODP 1168 the RTX-200 column still did not sufficiently resolve coelutions on the C37:3 peaks. Therefore, for this interval we provide temperatures estimated from the ratio applying the Novak et al. (2022) core top calibration (Table S1). For the ODP 925 equatorial site samples, the C37:3 methyl ketone is under the detection limit, therefore we further purified and analyzed the extracted organics as in Guitián et al. (2019) to get the temperatures from the TEX86 ratio using the BAYSPAR calibration by Tierney and Tingley (2015).
Compound-specific δ13C measurements were performed on a Thermo Scientific Trace 1310 Gas Chromatograph coupled to a Thermo Scientific GC Isolink II, a Conflo IV, and a Delta V Plus Mass Spectrometer at ETH Zurich. Oxygen was flushed through the combustion reactor for one hour at the beginning of each sequence and seed oxidized for one minute before each injection. Alkenones from ODP Site 1168 and IODP 1406 were analyzed on a GC equipped with a non-polar capillary column (60 m × 0.25 mm × 0.25 µm) (ZB-1ms, Zebron™) and 5 m guard column. Helium was used as carrier gas flow with 2 mL min−1. GC oven was set to 90 °C, ramped to 250 at 25 °C min−1, to 313 °C at 1 °C min−1 and finally to 320 °C at 10 °C min−1. The GC oven was then maintained isothermally for 20 min. A subset of IODP 1406 samples were measured additionally at the Lamont-Doherty Earth Observatory on equivalent instrumentation but with some modifications for improved sensitivity (Baczynski et al., 2018) and following similar GC procedures, with similar results.
From ODP Site 1168, a subset of samples older than 24.5 Ma featuring more complex chromatograms were rerun on a GC-irMS equipped with a RTX-200 ms column. GC oven was set at 50 °C ramped to 275 °C at 40 °C min−1, to 295 °C at 0.5 °C, hold for 22 min, and finally ramped to 320 °C at 10 °C min−1 and hold for 5 min. Flow rate was 1.5 mL min−1. Comparison of a subset of samples from Site 1406 and ODP 1168 younger than 22.4 Ma showed that δ13C C37:2 were similar on both ZB-1 and RTX-200 columns. We consequently report here δ13C C37:2 from the ZB-1 runs, with the exception of the samples from Site 1168 older than 22.4 Ma. All values are reported here in parts per mil (‰) relative to VPDB (Vienna Pee Dee Belemnite). Sample replicates, in-house alkenone standard (provided by G. O'Neil, Western Washington University, and C. M. Reddy, Woods Hole Oceanographic Institution), and known isotopic mixtures A5 and B4 (supplied by A. Schimmelmann, Univ. of Indiana) were simultaneously measured to determine the analytical accuracy of the measurement and an uncertainty of 0.5 ‰.
3.2 Estimation of aqueous carbon dioxide δ13C
Isotopic composition of CO2[aq] is estimated from the temperature dependent fractionation between DIC and aqueous CO2 during alkenone production of Rau et al. (1996) based on Mook et al. (1974) and Freeman and Hayes (1992):
We calculate the δ13C DIC from the δ13C measured on the bulk carbonate, which is dominated by calcareous nannofossils, for which previous studies show Reticulofenestra to be the most abundant genera (Guitián et al., 2020). Because there is no divergence of vital effects between small and large coccoliths in the late Oligocene to early Miocene (Bolton and Stoll, 2013), we propose that the offset between coccolith δ13C and DIC is likely to remain constant. We subtract 0.5 ‰ from the δ13C bulk to calculate δ13C DIC, based on average alkenone-producing coccoliths cultured at DIC < 4 mM compiled in Stoll et al. (2019). Support for estimating photosynthetic fractionation from coccolith δ13C is provided by recent culture studies of G. oceanica (Torres Romero et al., 2024). In previous studies, the δ13C DIC has also been estimated from the δ13C of calcium carbonate of benthic foraminifera with the assumption of a constant and known offset between the δ13C DIC of the deep and surface ocean. Although the foraminifera content in Site 1406 and 925 is very low, sediments feature sufficient well preserved benthic foraminifera, mainly epifaunal Cibicidoides spp. in the size range larger than 200 µm. At ODP Site 1168 benthic foraminifera were scarce for picking for isotopes in many intervals and the progressive evolution of water depth at the site may change the δ13C offset between the benthic environment and the surface ocean over time (Exon et al., 2001). For an additional sensitivity test to evaluate the significance of the method of DIC estimation and facilitate comparison to other published εp records calculated from benthic δ13C, we also estimate surface ocean DIC by adding a constant offset of +2 ‰ to the δ13C benthic measurements, following previous Miocene and Oligocene studies (Guitián et al., 2019; Pagani et al., 2011; Zhang et al., 2013).
Bulk carbonate and benthic foraminifera were measured using analytical techniques described in Guitián et al. (2019) with the guidelines from Breitenbach and Bernasconi (2011) for small carbonate samples on a GAS BENCH II Delta V Plus irMS from Thermo Scientific with international (NBS-19 & 18) and in-house carbonate as standards achieving a precision of 0.07 ‰.
3.3 Calculation of εp 37.2 and CO2 doublings
Carbon isotopic fractionation (εp), describes the fractionation occurring during photosynthesis when carbon is fixed into algal cellular biomass (δ13Corg) from the ambient aqueous CO2 (δ13C) (Freeman and Hayes, 1992):
Organic δ13C is obtained from the δ13C analysis of haptophyte specific alkenone di-unsaturated C37.2. Culture experiments showed that the lipid organic matter is depleted in 13C relative to the whole cell isotopic composition by 4.2 ‰, a correction that needs to be applied (Wilkes et al., 2018; Popp et al., 1998):
Uncertainties were propagated by a full Monte Carlo (n= 10 000) simulation following Tanner et al. (2020).
To compare our new records with previous data spanning the same time interval, we discuss published εp datasets recently compiled by the paleo CO2 community (CenCO2PIP Consortium, 2023), from DSDP 516 in the South Atlantic (Pagani et al., 2000, 2005, 2011), DSDP 608 in the North Atlantic (Super et al., 2018), and the equatorial site from ODP 925 (Zhang et al., 2013). For these, we ensure that εp for the published records is calculated from biomarker-based paleothermometers. The most recent publications from DSDP 608 and 925 used glycerol dialkyl glycerol tetraethers (GDGT) derived estimations from TEX86. To better compare our results with DSDP 516, where originally temperatures were derived from δ18O of planktic foraminifera for the Miocene section and GDGTs for part of the Oligocene, we have updated the εp calculations using a running averaging of the recent higher resolution GDGT temperature reconstructions from Auderset et al. (2022) at the same site.
For our data of paired εp and alkenone SST, we calculate the shift in εp which is expected from temperature-stimulated growth rates. Using the relationship of −0.48 ‰ (95 % CI = −0.37 to −0.95 ‰) per 1 °C SST (Torres Romero et al., 2024), we adjusted each samples εp absolute value by using the difference between the SST estimated for that sample and the average SST during the studied interval at that site. We complete a similar exercise for cell radius, calculating the deviation in εp only relative to the median cell size, for each point using the culture dependence of εp on cell radius shown in Eq. (2) (Stoll et al., 2019). Biogenic silica (bioSi) was determined on 20 samples from ODP 1168 following methods described previously in Guitián et al. (2020).
From the εp time series we estimate the change in CO2 relative to the maximum values at 29 Ma, using the adjustment in εp for temperature sensitive growth rate described in the previous paragraph, and Eq. (3) as applied in González-Lanchas et al. (2021), where I reflects the size and light influences on εp and is assumed constant across all time intervals, and the εp dependence on ln [CO2[aq]] of 2.66 is the 50th percentile estimate of the modern cultures. We then estimate the doubling/halving of CO2 relative to the CO2 at the reference age (R) applying the solubility for the measured temperature (Zeebe and Wolf-Gladrow, 2001) which can be reduced to:
4.1 Trends in εp in the Oligocene to early Miocene
4.1.1 New εp records from sites 1406 and 1168
In both long-term records from Site 1406 and Site 1168, δ13C of C37.2 alkenones range from very low values near −30 ‰ in the early Oligocene (30–28 Ma) increasing to −24 ‰ by 20–18 Ma (Fig. 2). The new calculated εp decrease from the Oligocene to the early Miocene at the highest resolution North Atlantic Site 1406, features abrupt 3 ‰ declines from 27 to 24.5 Ma. At ODP 1168 the lack of εp measurements prior to 25 Ma hinders identification of a clear transition. Newly obtained ODP 925 εp determinations within the interval 25 to 19 Ma are in agreement with previous determinations at this site (Zhang et al., 2013) showing also the broad interval of εp decrease from 27 to 24.5 Ma. The trends in εp calculated from benthic δ13C are similar to those calculated from the coccolith-dominated bulk δ13C. In the high resolution section from 29.6 to 28.8 Ma in Site 1406 there is no long-term trend, but orbital scale εp variations exceed 1.5 ‰ in amplitude (Figs. 3 and S1). Over several ∼ 100 ky orbital cycles, variations of 0.75 ‰ benthic δ18O and bulk δ18O are observed, consistent with previous findings of high 100 ky power in benthic δ18O in other sites during this time period (Liebrand et al., 2017).
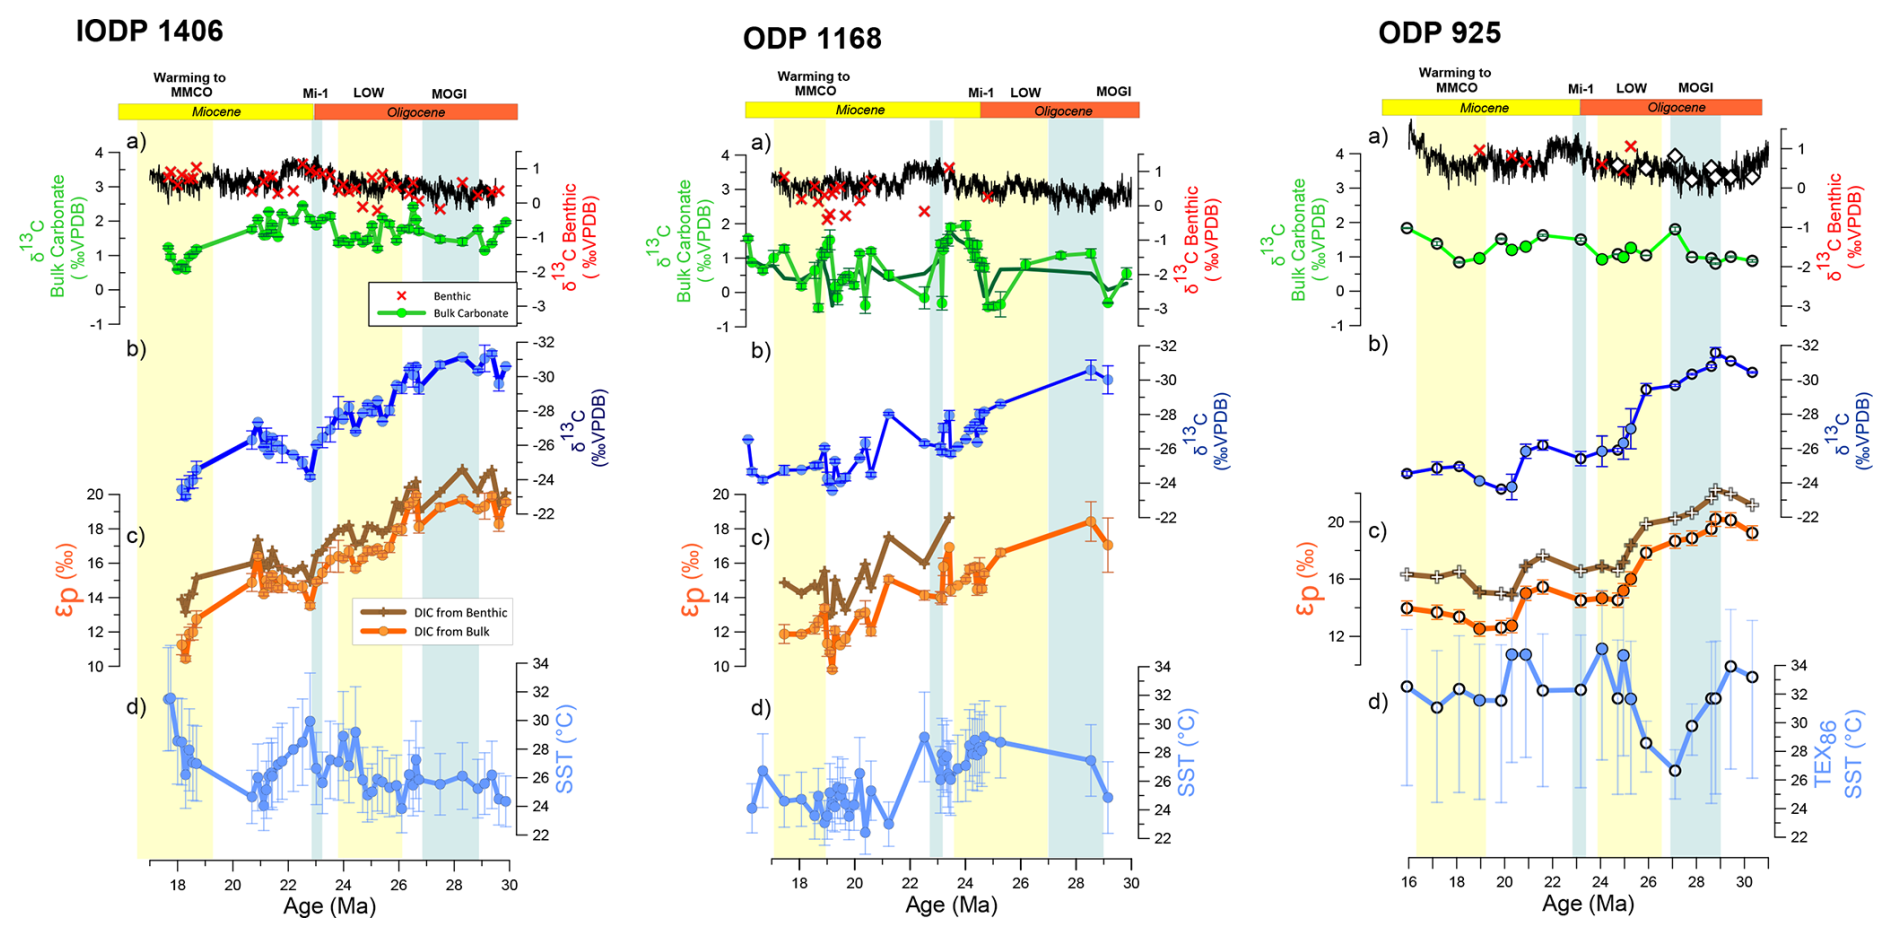
Figure 2Analytical results of this study. (a) Carbonate stable isotopes for benthic foraminifera (red crosses), data from this work for each site; black line shows results from Westerhold et al. (2020) and bulk sediment carbonate (green lines and cricles). (b) Alkenone C37.2δ13C. (c) Calculated alkenone carbon fractionation, solid line DIC δ13C is derived from bulk carbonate, transparent line from picked benthic foraminifera at the same samples. (d) Temperature estimates. IODP 1406, including SST and benthic δ18O dataset from Guitián et al. (2019); ODP 1168, dark green δ13C bulk carbonate shows the 4-point moving average used to calculate εp at the site; ODP 925, filled circles are new measurements for this study, white symbols are published data (Zhang et al., 2013), being εp recalculated following method described in text, SST is derived from GDGT at this site. Alkenone SST-derived show 1σ error bars and GDGTs 925-TEX86 refer to 2σ.
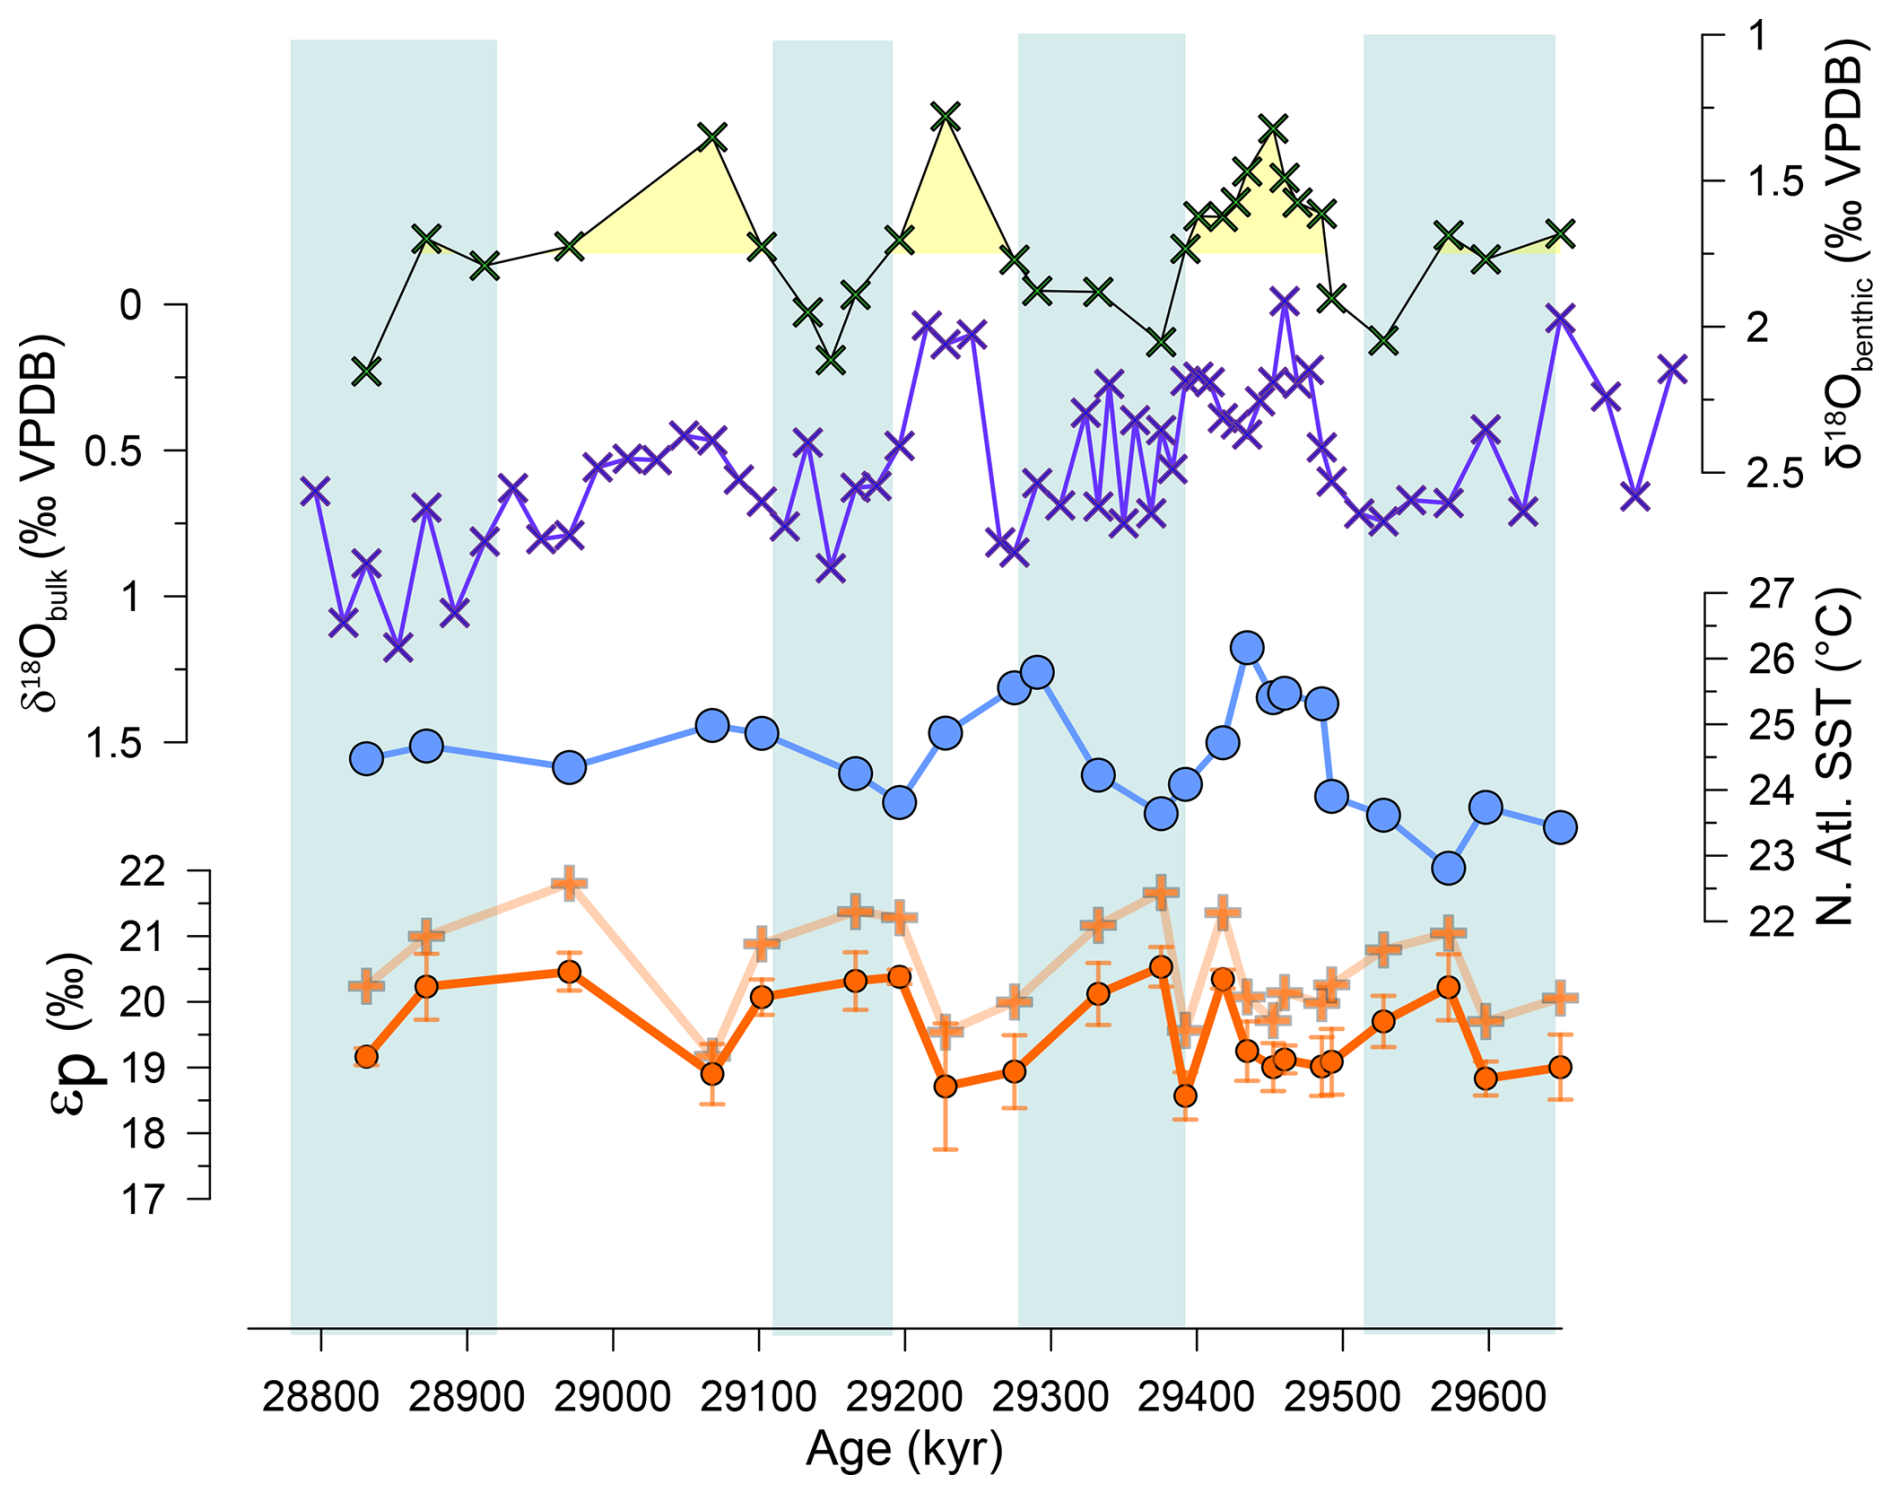
Figure 3High resolution sampling from IODP 1406, showing δ18O of bulk carbonate and benthic foraminifera, alkenone SST estimates, and εp calculated from bulk carbonate (circles) and benthic foraminifera assuming a constant offset (crosses).
4.1.2 Comparison of 1168 and 1406 εp records with published Atlantic records
The overall decline in εp through the time interval of our records, is broadly comparable to the trend in published εp datasets recently compiled by the paleo CO2 community (CenCO2PIP Consortium, 2023), which exhibits a long term decrease in the late Oligocene through the transition to the Miocene and to overall low and stable values in the early Miocene (Fig. 4). However, several factors complicate a detailed comparison of our new and the previously published records.
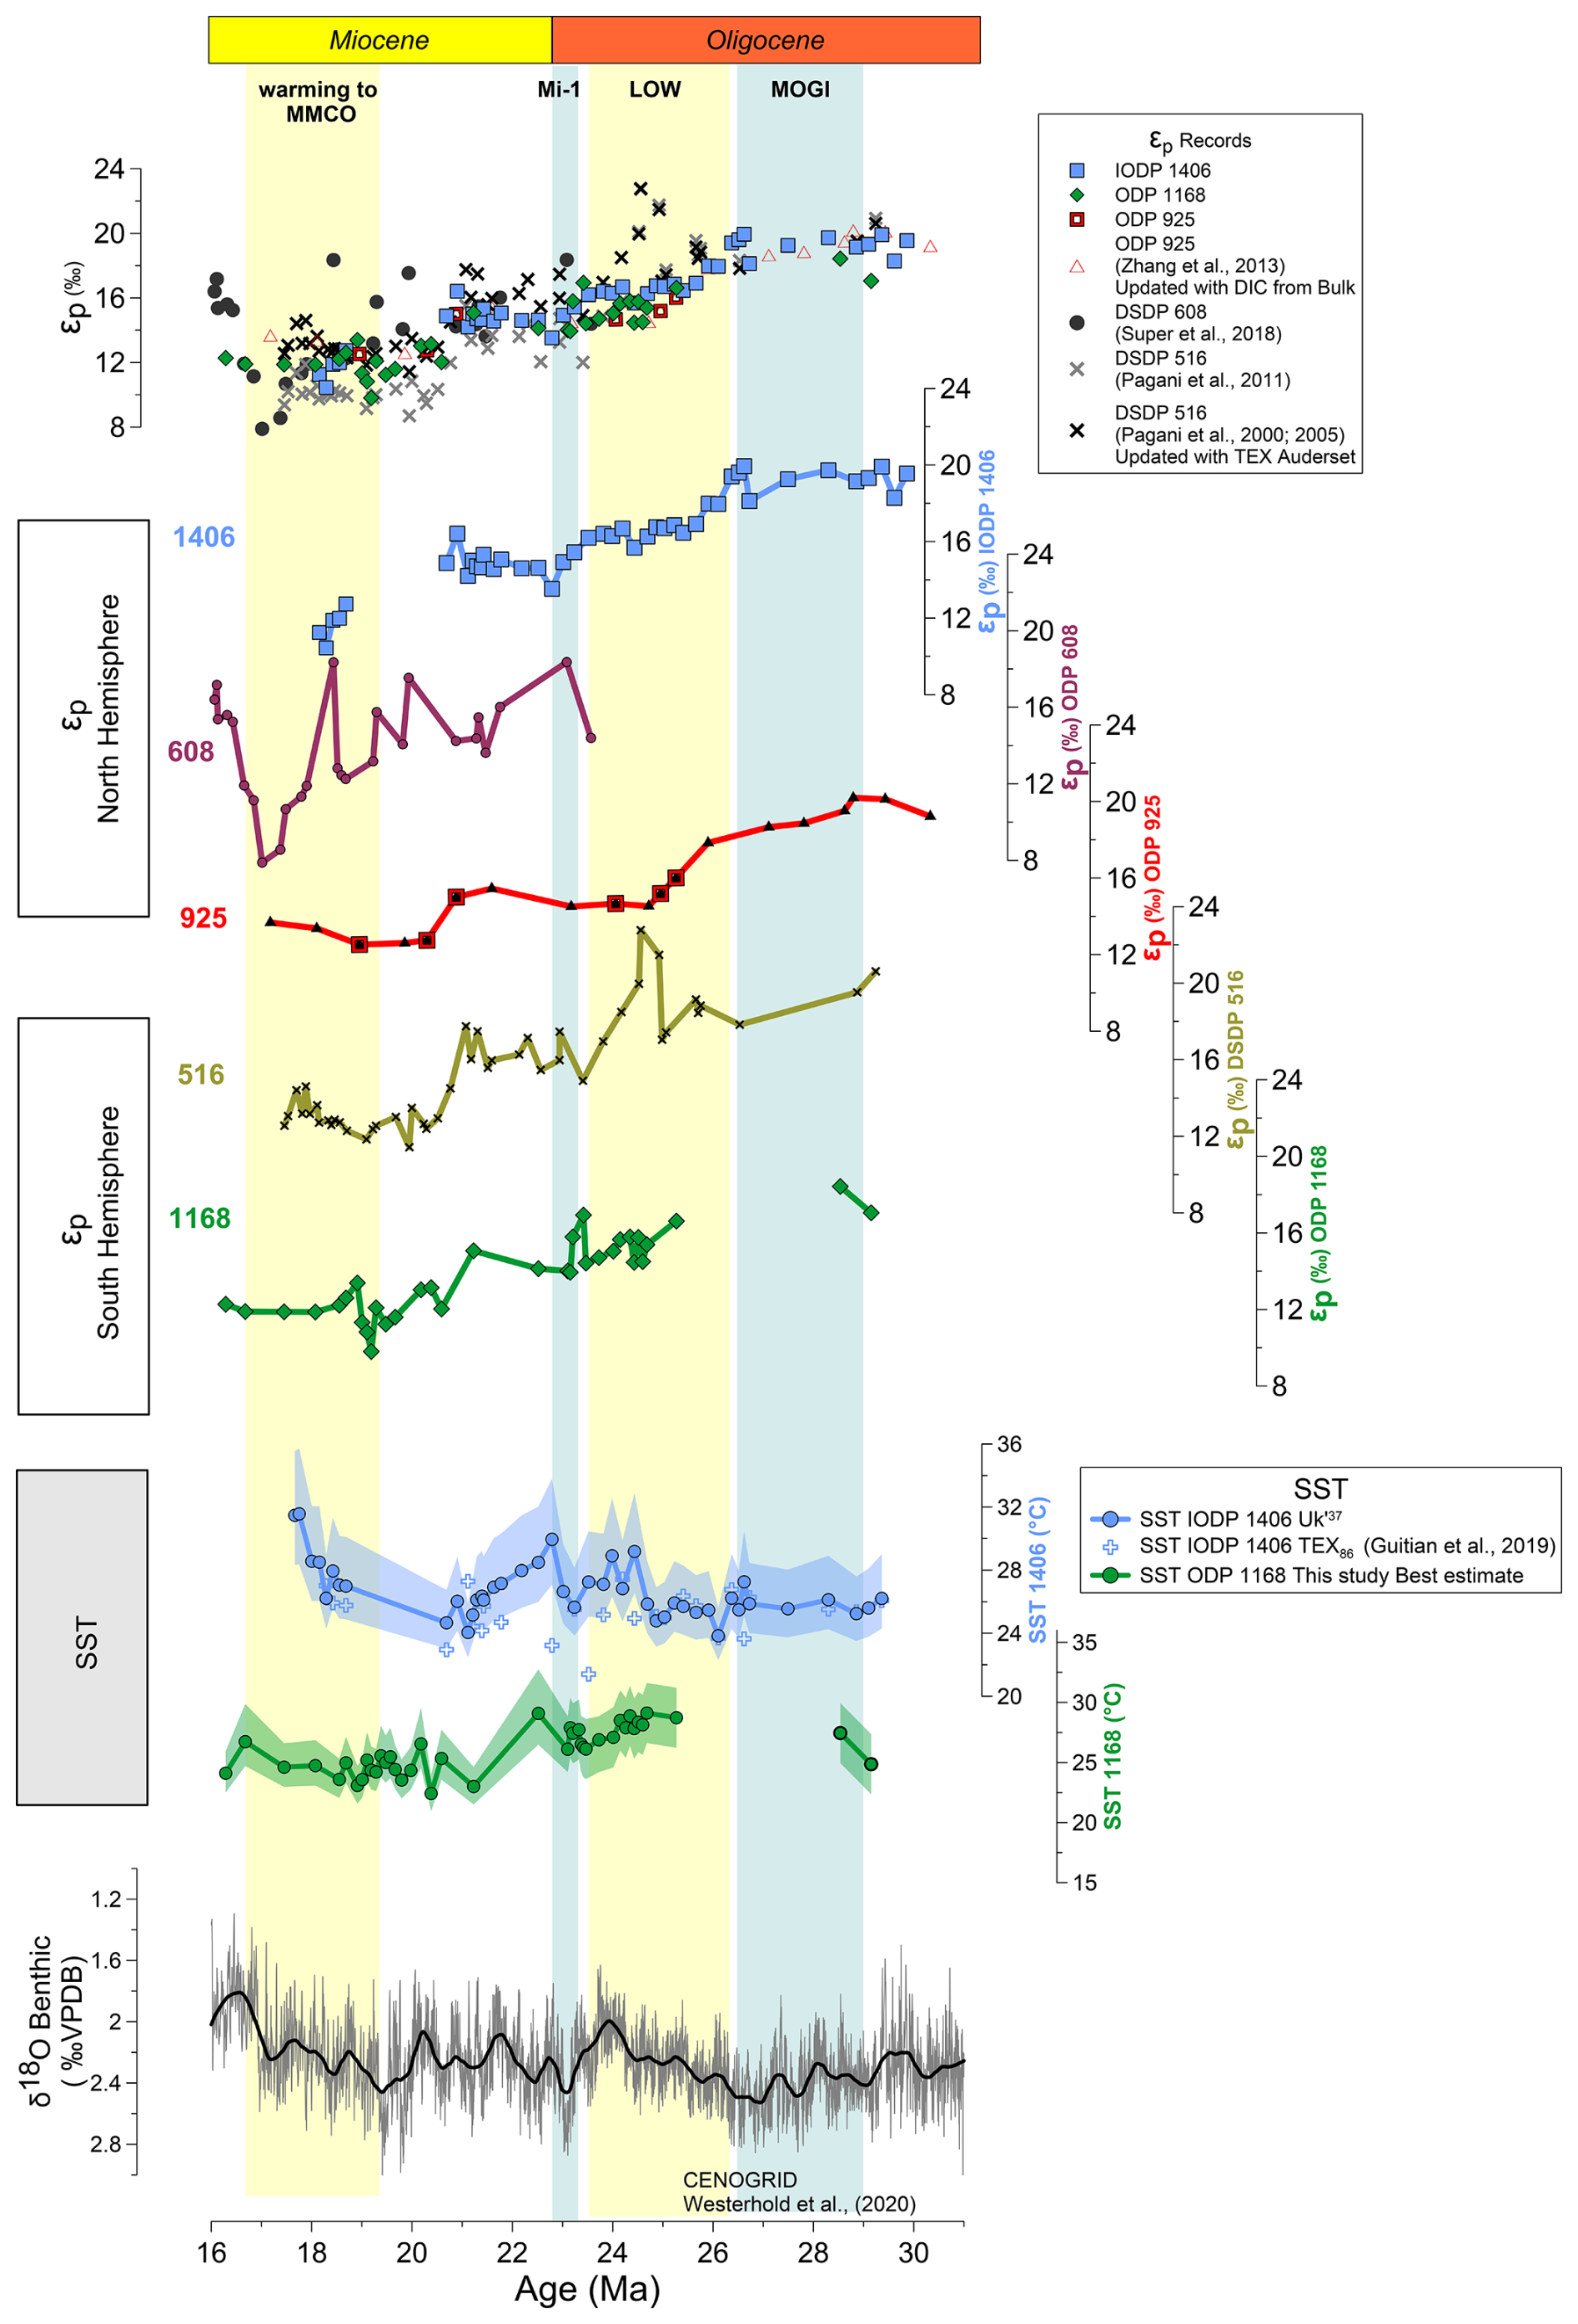
Figure 4Oligocene to Miocene global long term εp trends. Comparison of the new obtained εp records with previously published alkenone measurements. All εp estimates have been recalculated following the methodology described in text with data source described on Table S2.
The inference of rapid declines is also affected by the age models and the correlation of rapid εp shifts among different sites might be hindered by uncertainties in chronology among the different sites. Although all records are presented here on the GTS 2012 (Gradstein et al., 2012), ODP 1168 and IODP 1406 age models rely on Sr isotope stratigraphy (Stoll et al., 2024), whereas ODP 925, DSDP 516 and ODP 608 are based exclusively on biostratigraphic and magnetostratigraphic reversals datums (Curry et al., 1995; Guitián et al., 2020; CenCO2PIP Consortium, 2023). As previous studies document for sites 1168 and 1406, Sr isotopic stratigraphy can adjust age determinations by 0.5 to 1 Myr or even up to 2 Myr in a few cases (Stoll et al., 2024).
Additionally, differences in the absolute value of εp among records may also reflect contrasting approaches to the reconstruction of DIC δ13C in the different studies. At DSDP 608, the DIC δ13C was reconstructed from surface-dwelling foraminifera G. quadrilobatus (Pagani et al., 1999), while at DSDP 516 the Miocene section was estimated from planktic foraminifera and most of the Oligocene samples DIC δ13C was determined from fine fraction (Pagani et al., 2000, 2005). Published ODP 925 εp has been recalculated here with DIC δ13C derived from bulk carbonates of nearby samples, to resolve the previous divergent estimates from planktic and benthic foraminifera (Zhang et al., 2013).
The longest record from DSDP Site 516 exhibits a general εp decline from the Oligocene to early Miocene. However, due to lower resolution at this site, we cannot evaluate if there is an abrupt 3 ‰ decline from 27 to 24.5 Ma as seen in sites 1406 and 925. A steep εp decline between 21 and 20 Ma in Site 516 may be within age uncertainty of the decrease observed between 20 and 19 Ma at ODP 1168 and ODP 925; additional Sr isotope stratigraphy at Site 516 in this time interval could help test the synchronicity. The late Oligocene at DSDP 516 features a transient 5 ‰ positive excursion in εp between 24.5 and 24.9 Ma, which is not reflected at 1406, or 1168 sites. With current information, we cannot assess if this difference reflects age model uncertainty, potentially unresolved coelutions from GC-IRMS chromatography, or aliasing. The early Miocene record at DSDP Site 608 shows a more variable εp with a much steeper decline through the early Miocene and higher amplitude variation compared to other sites. The characteristic minimum in εp from 18 to 17 Ma is potentially within the age model uncertainty of the 19 Ma minimum in εp at 1168 and the 18.5 Ma minimum identified at Site 1406. Updated stratigraphy could contrast more robustly the timing of these events. If there is high amplitude short term variability in εp in the early Miocene as in the Oligocene time interval (Fig. 2), there is also the potential for low resolution sampling to undersample high frequency temporal variability and generate aliasing artefacts.
4.2 Potential for size and nutrient effects on εp
In addition to CO2, εp may be influenced by changes in cell size and cellular growth rate regulated by light and nutrients. There is no long-term trend in mean coccolith size in these records (Guitián et al., 2020) and estimating the impact of it on the εp records shows a negligible effect on long-term trends (Fig. 5). At discrete time intervals of IODP Site 1406, the correction for the size effect reduces most values older than 27 Ma and produces a steeper decrease on εp towards the Oligocene Miocene transition.
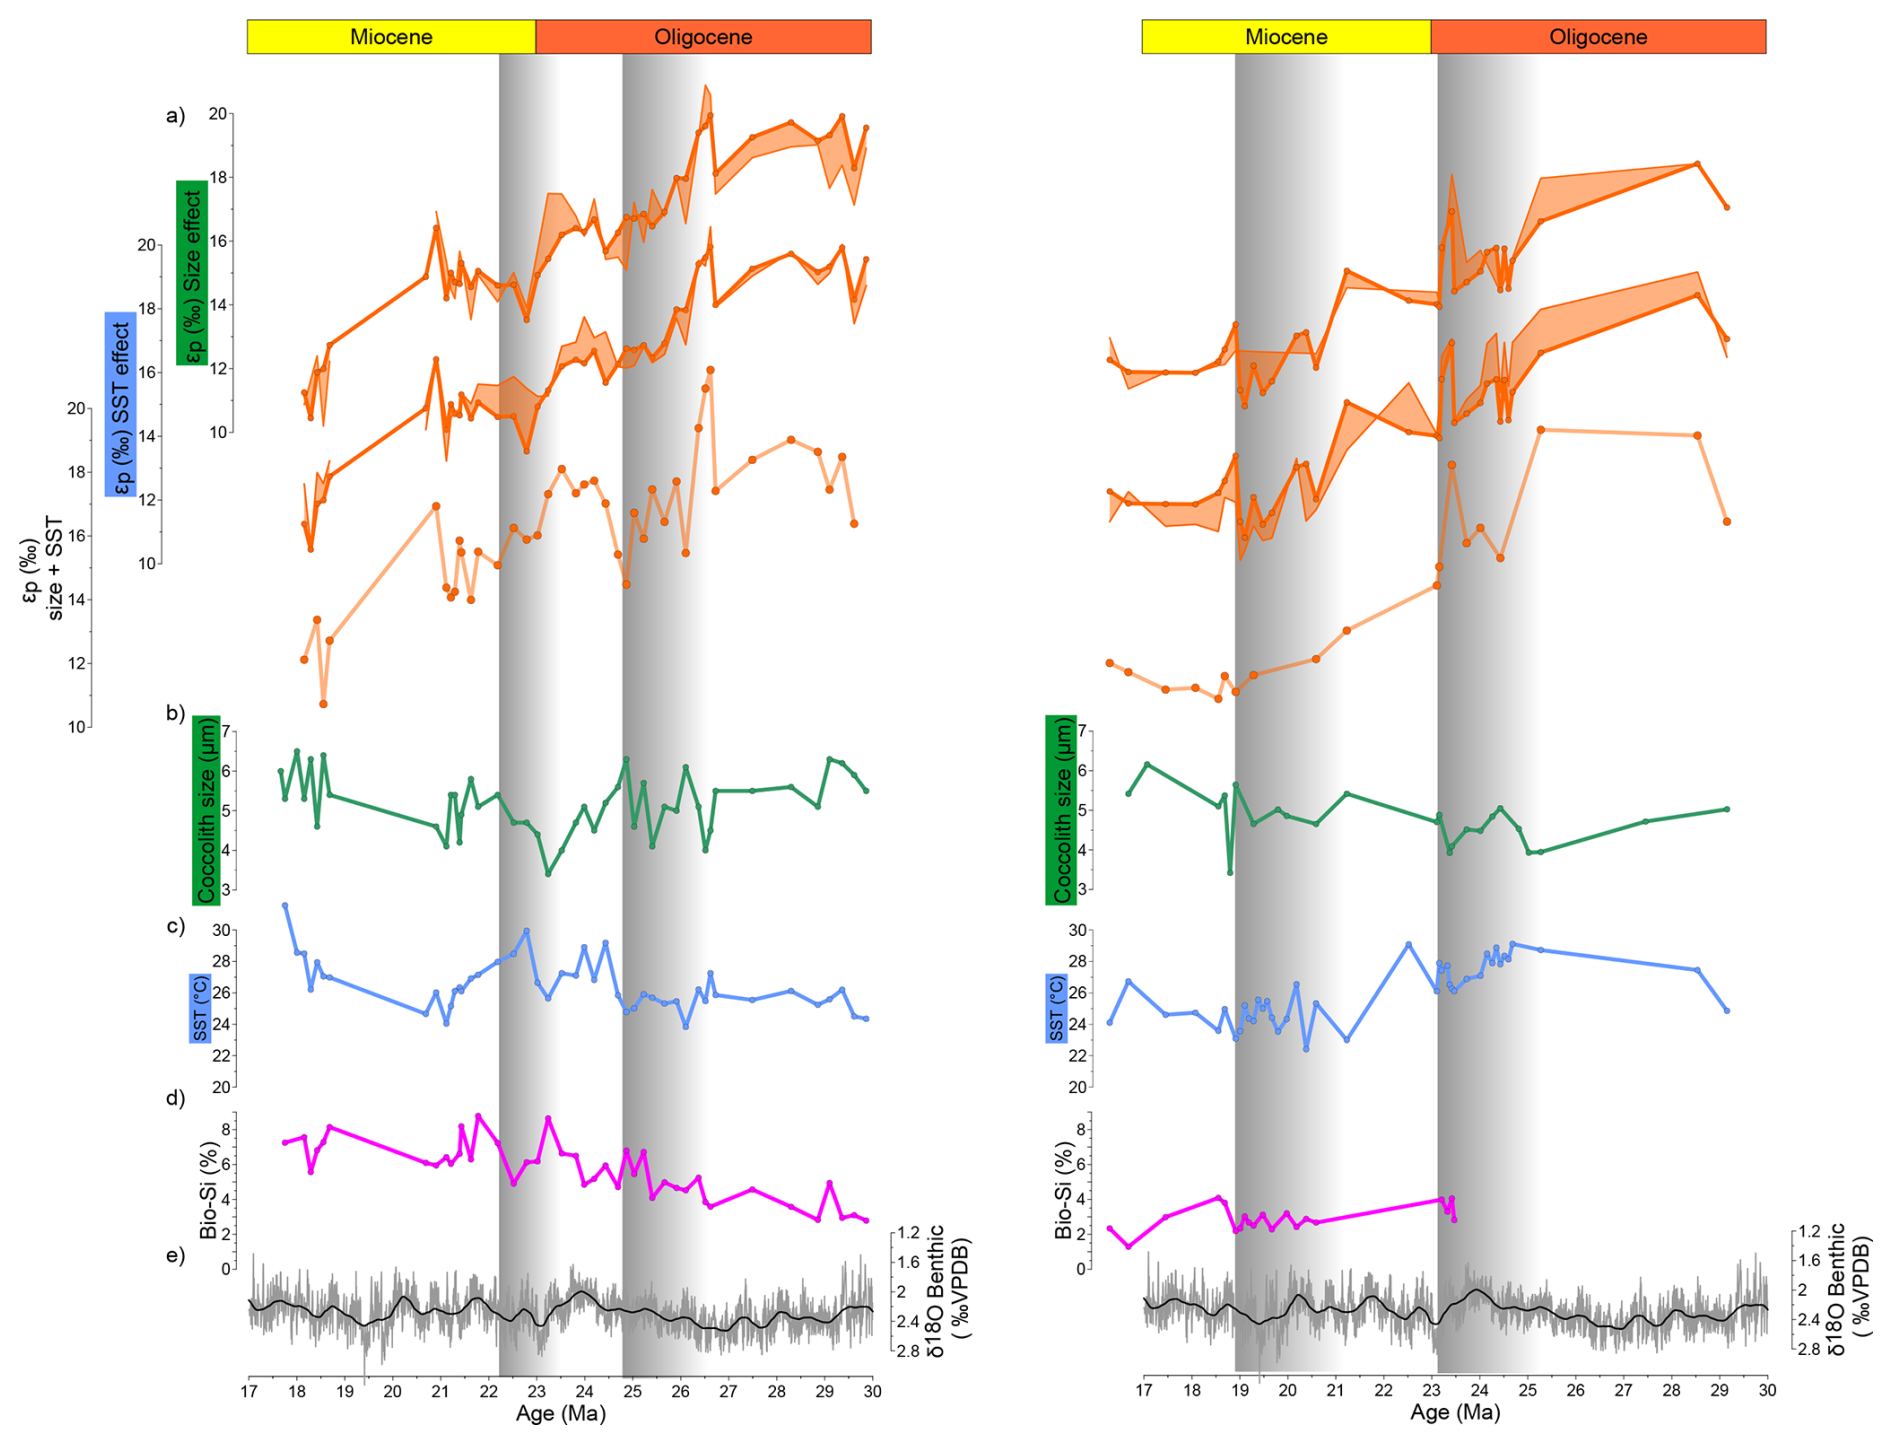
Figure 5Timeseries of εp at IODP 1406 and ODP 1168 including (a) the measured εp record (solid line) and the estimated εp resulted once size and temperature effect is applied following Torres et al. (2024), and Stoll et al. (2019) (transparent shadows). (b) Coccolith size record from Guitián et al. (2020); (c) SST estimates (d) Biogenic silica measurements (Guitián et al., 2020 and this study); (e) reference CENOGRID benthic δ18O curve (Westerhold et al., 2020). Grey squares point εp decreasing intervals.
For the statistical model of Eq. (2), it is complex to identify proxy records for any possible effect of nutrient-stimulation of growth rate or changes in the mean light conditions at the depth of growth. In modern spatial gradients in the ocean, these factors are often coupled, so that settings characterized by deep mixing and high nutrient supply rates to stimulate growth, are also characterized by lower mean light levels due to the deeper mixing, both factors lowering εp (Hernández-Almeida et al., 2020).
As one possible nutrient indicator, a higher concentration of biogenic silica (bioSi) in sediments may reflect a higher rate of bioSi delivery to the seafloor due to higher export production produced by siliceous organisms (mainly diatoms) in the ocean (Ragueneau et al., 2000). In the modern ocean, regions with abundant dissolved Si in the photic zone are regions also characterized by higher concentrations of macronutrients such as P and N. However, bioSi is an imperfect indicator of past surface nutrient content because coccolithophores have a minimal Si requirement, and Si remineralization in the ocean does not occur at the same rate as soft-tissue nutrients such as N and P. At IODP 1406, bioSi concentrations generally increase from the Oligocene to earliest Miocene, potentially indicating a gradual increase in the concentration of dissolved Si in surface waters at the site (Fig. 5). If the increase in dissolved silica observed at the North Atlantic is correlated to an increase in dissolved P or N, it could contribute to increase in growth rate, and therefore likely increase in biomass and chlorophyll, which would reduce light in the water column, both factors potentially contributing to the observed long term decrease of εp. However, the actual correlation between bioSi and εp is not that strong (Fig. S2), suggesting that while increased nutrient concentrations could contribute to the long-term evolution of εp, the specific steps of εp decline are less likely to be driven by increased nutrients and growth rate.
The drivers for increasing bioSi burial rates at Site 1406 are not clear. They could reflect a global increase in nutrient delivery or local effects. Important changes in the rate of continental weathering within the Oligocene- early Miocene are often interpreted from the evolution of radiogenic isotopes of Sr, Li and Os (Misra and Froelich, 2012) including the steep rise in Sr, although the precise origin of the late Eocene and Miocene increase in Sr remains under discussion (Rugenstein et al., 2019). On a global scale, the nutrient delivery may be conditioned by the riverine supply of P from continental erosion and weathering of P containing minerals. Yet, on the time scales examined in our records, much longer than the residence time of P, the net effect on nutrient concentrations depends on the balance of the supply and the nutrient removal in sediments.
While a significant increase in erosion and weathering and nutrient inventory is one mechanism to contribute to the long term decline in εp via enhanced algal growth rates, an increase in erosion and weathering can itself contribute to a CO2 drawdown by CO2 consumption through silicate weathering and enhanced burial of organic carbon in delta regions (Raymo and Ruddiman, 1992). If the biogenic Si increase at 1406 were representative of a global trend, an increase in nutrient supply may have contributed to εp decline through both CO2 decline and increased nutrient stimulation of phytoplankton growth. A global decline in εp solely from increased weathering and nutrient concentrations without a CO2 decline would require that in the Oligocene, the nutrient release from silicate weathering was less coupled to carbon burial than in the late Neogene. If the periodically glaciated margin of Antarctica is a major locus for increased erosion and weathering in the Oligocene (Reilly et al., 2002), release of nutrients and radiogenic isotopes may have occurred in the continental margins, but with much less organic carbon burial than the modern Himalaya system due to limited terrestrial biomass on Antarctica and temperature and sea-ice limited oceanic biomass production in the marine regions.
On the other hand, the long term trend of increased bioSi is not observed in the Southern ocean Site 1168 (Fig. 5). The available Miocene bioSi at ODP 1168 is stable with no change across the steep εp drop from the latest Oligocene to early Miocene. The increasing distance of Site 1168 from the coastline with basin subsidence may have decreased the availability of Si from the early Oligocene through the early Miocene, imparting a local effect superimposed on any potential global trend. However, likely not only Si but also other nutrients would decrease with increasing distance from the coast. If the long term trend in εp at both 1406 and 1168 sites were conditioned by increased nutrient availability, faster growth rates, and lower light levels it would require bioSi accumulation rates at Site 1168 to be decoupled from the overall changes in nutrient availability, which we consider less likely. Consequently, we propose that the similarity in trend and magnitude of the long term εp decline in both sites (and in tropical Site 925), is more consistent with a global forcing of εp, which may be most plausibly driven by a significant decrease in atmospheric CO2 and CO2aq.
4.3 Relationship between εp and SST and benthic δ18O
The new εp data from Site 1406 and Site 1168 provide the first records of εp from the early Oligocene to early Miocene with alkenone unsaturation indices as independent estimations of SST for the precise time intervals of εp determination. Since they are biomarkers derived from the same organism, alkenone-derived SST estimates correspond to the same season and growth depth as the alkenone εp determinations. There are two processes which may influence the relationship between temperature and εp. First, higher temperatures lead to higher phytoplankton carbon fixation rates, decreasing εp. Secondly, higher CO2 would increase εp and through radiative forcing lead to warmer global average temperature and SSTs. The expected relationship between εp and SST from either process could be obscured by a superposition of temperature effects on growth rate and a climatic correlation of εp with mean air temperature.
4.3.1 Million year scale relationships
Across the overall time interval, Site 1406 εp is weakly inversely correlated with SST, whereas Site 1168 εp is weakly positively correlated with SST (Figs. 6 and S3, Table S3). Our estimation of the growth rate effect due to warmer temperatures shows that it has a very limited impact on the long term εp trend, amplifying slightly the long-term excursion in ODP 1168 and imparting a minor increase in εp in the late Oligocene 25.5 to 24 Ma in IODP 1406 but otherwise not affecting the sign of the overall trend (Figs. 5, 6 and S3). At our studied sites across the 30 to 17 Ma time interval, the long term average warming of 2–3 °C is insufficient to account for the 7 ‰ decline in εp due to a temperature-driven growth rate effect. Unlike alkenone-based SST, the published TEX86 SST record at Site 1168 (Hou et al., 2023a) does not indicate a transition to lower temperatures from the Oligocene to early Miocene, suggesting different temperature trends in the season or depth niches of the different proxy carriers.
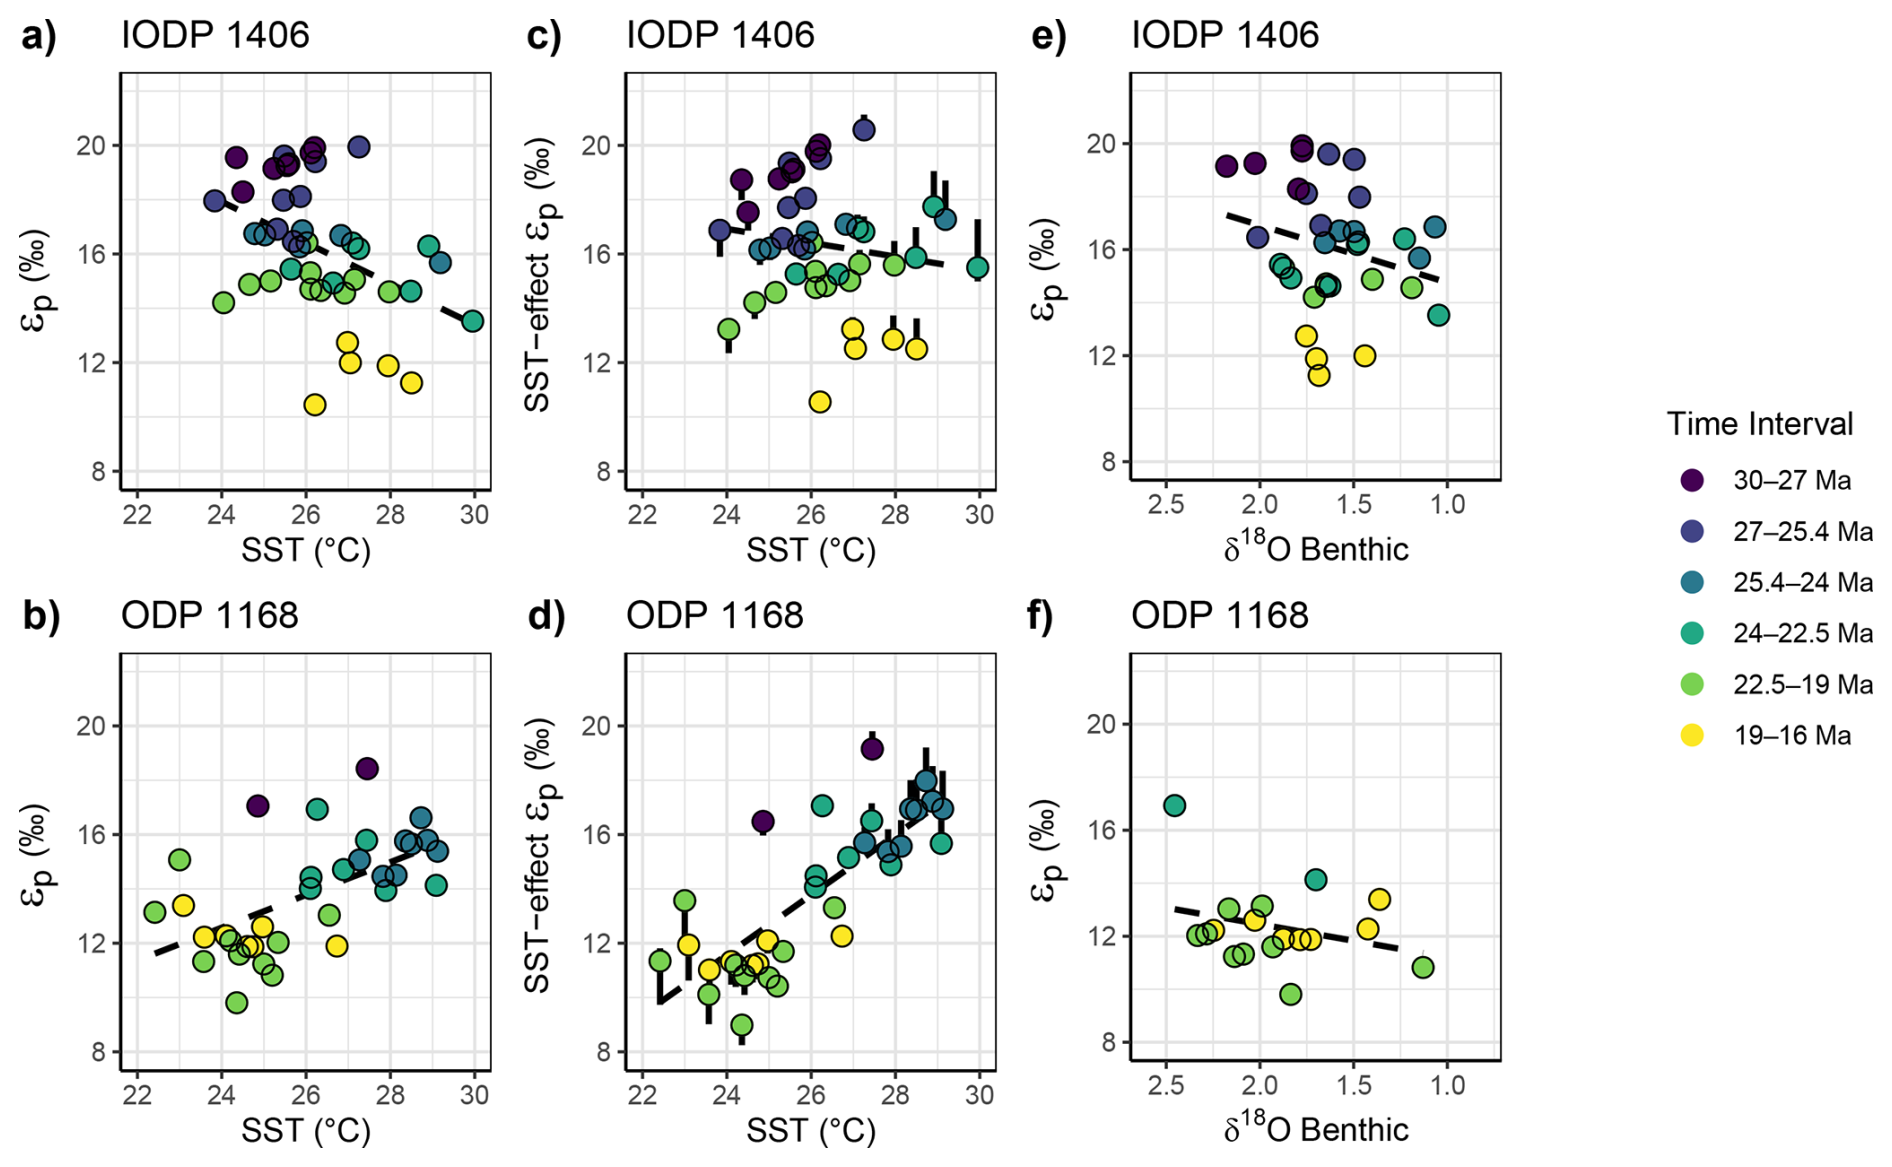
Figure 6(a–b) For paired samples, relationships between the measured εp and SST for Site 1406 and 1168. (c–d) Relationship between SST and εp, when the temperature-dependent growth rate effect on εp has been removed using the observed dependence of from culture experiments of 0.5 ‰ (0.37 ‰–0.95 ‰ range indicated by error bars) decrease in εp per 1 °C warming (Torres Romero et al., 2024). (e–f) For paired samples, measured εp and benthic δ18O. Dashed dark line in the plot background shows the regression for the overall dataset. See Fig. S3 and Table S3 for overall statistical relationships.
Over the studied time interval, SST and εp similarly show insignificant correlation for the previously published εp, records with updated age models and εp calculations (Fig. S4), although temperatures estimates are derived from GDGTs which might not reflect the same depth and/or season of coccolithophore growth. Negative covariance is observed at DSDP 608 from 19 to 16 Ma, at DSDP 516 before 21 Ma and for the few samples from 27 to 24 Ma at ODP 925. Some of these intervals feature significant temperature changes of 4 to 5 °C, and therefore the temperature-growth rate effect on εp may be significant, and the negative slopes observed in some intervals are consistent with this being the dominant effect. At 1406, during the older intervals of positive correlation of SST and εp, potentially the growth rate stimulation due to higher SST was balanced by a decrease of nutrient availability during warmer temperatures as suggested by the bioSi evolution (Fig. S2), whereas during younger time intervals, temperature exerted a dominant effect on growth rate.
Benthic δ18O was measured in multiple time intervals in Site 1406. Benthic δ18O has been proposed to reflect global surface temperature (Evans et al., 2024; Hansen et al., 2013) and as such may be less sensitive than SST to regional reorganizations of heat transport. Alternatively, benthic δ18O has been proposed to be highly sensitive to the areal extent of the Antarctic ice sheet due to its cooling effect on surface ocean temperatures in regions of deepwater formation (Lisiecki and Raymo, 2005; Shackleton, 1987; Bradshaw et al., 2021). If the global surface temperature change translated to changes in surface ocean temperatures at Site 1406 and Site 1168, we would expect the temperature-growth rate effect to generate a direct correlation between benthic δ18O and εp. If the radiative forcing effect on global temperature change were dominant, we would expect an inverse correlation between εp and benthic δ18O. As for SST, only the time intervals older than 25.4 Ma exhibit the inverse correlation expected from radiative forcing, whereas other intervals suggest neutral slope which may reflect the superposition of growth rate and CO2-radiative effects on εp.
4.3.2 Relationships between εp, temperature and benthic δ18O at orbital timescales
In the high resolution sampling between 29.0 and 29.6 Ma, despite a significant 1 ‰ range in δ18O benthic and δ18O bulk, we likewise observe no inverse relationship between εp and δ18O benthic, or between εp and δ18O bulk (Fig. 7). We also observe no significant correlation between εp and alkenone SST. Because the magnitude of SST variation is small over this time interval, the impact of temperature-stimulated carbon fixation rates is not a significant impact on the relationship between εp and SST or δ18O benthic – a temperature-corrected εp record for the 29.6 to 29 Ma interval would still not exhibit an inverse relationship between εp and δ18O benthic (Fig. 7e) as observed in the late Pleistocene glacial cycles (Hernández-Almeida et al., 2023). If εp variations are dominantly responding to CO2, our results suggest that low CO2 is not contributing to greater ice volume and/or colder ocean temperatures on 100 ky cycles and that the relationship between Antarctic ice growth and CO2 may be more complex at this time.
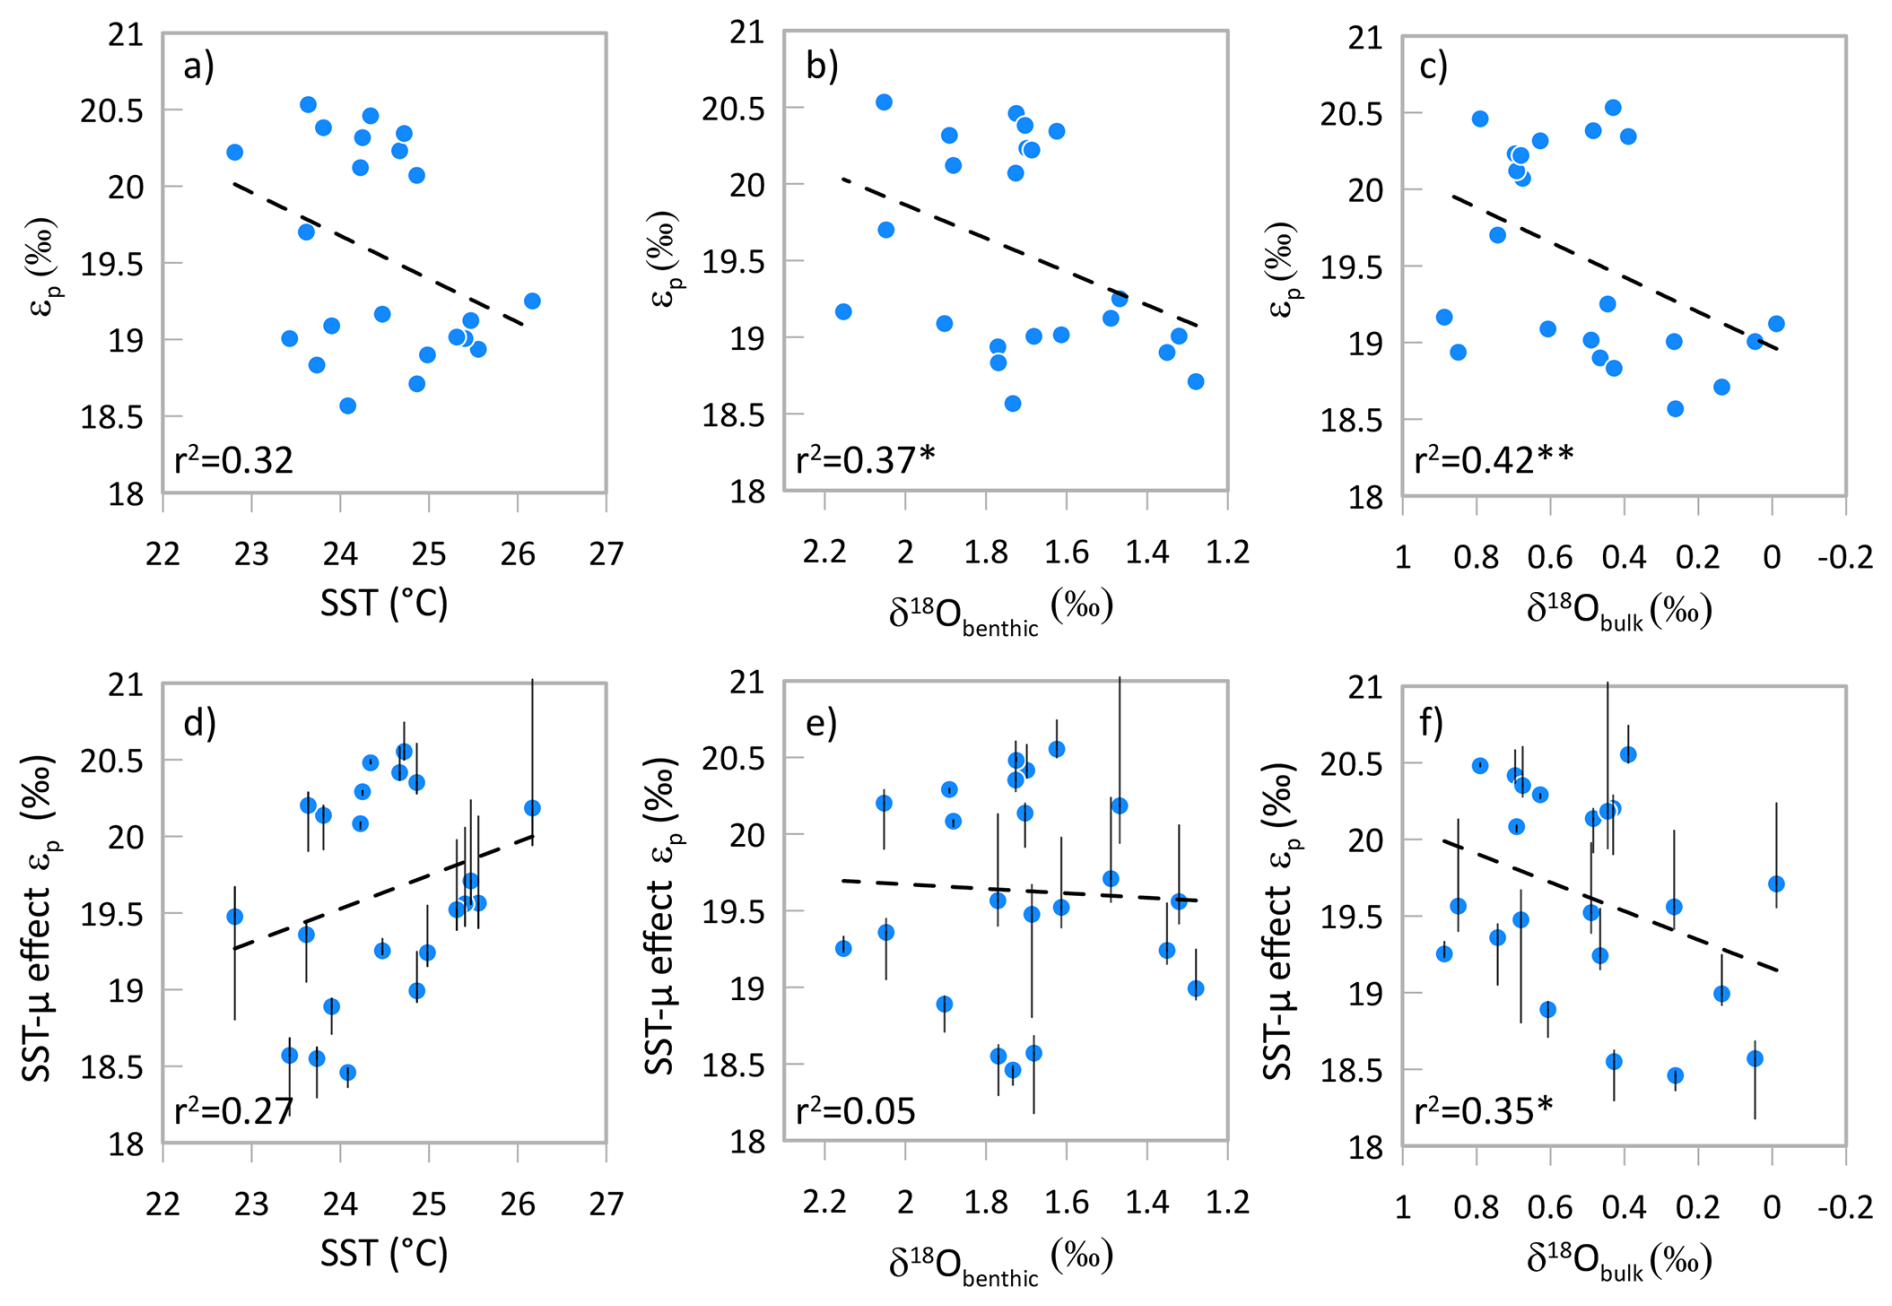
Figure 7For the high resolution 29 to 29.6 Ma interval at Site 1406, relationship between calculated εp and temperature, δ18O from benthic foraminifera, and δ18O from bulk carbonates. Panels (a) through (c) illustrate the measured εp. In panels (d), (e) and (f) εp is corrected for temperature-driven growth rate variation, using the temperature effect on εp following findings from cultures of 0.5 ‰ per 1 °C (Torres Romero et al., 2024). Vertical error bars illustrate εp values when the slope of the correction ranges from 0.37 to 0.95 ‰ per 1 °C warming. Dashed line shows the linear regression for all plotted samples. * p value < 0.1, p value < 0.05.
4.4 A Climate and CO2 paradox from the Oligocene to early Miocene
The long term trends between 30 and 16 Ma based on new εp data at two sites and recalculation of previous εp studies with uniform methods cannot be attributed to a temperature effect on growth rate and εp, nor to changes in the cell size of the alkenone producing community. Both effects are small in magnitude according to the sensitivities observed in cultures and do not alter the long-term trend (Fig. 5). Therefore, the long-term εp decline must have a significant global driver, with the most obvious being a decline in pCO2.
Although the calculation of absolute CO2 concentrations from εp in the Oligocene and early Miocene remains challenging, the logarithmic dependence of εp on CO2[aq] observed in cultures allows us to estimate the relative changes in CO2 if the sensitivity of εp to CO2 in the Oligocene were similar to modern cultured species using Eq. (7). If we incorporate a temperature correction and apply the 50th percentile estimate of the modern culture εp dependence on ln [CO2[aq]] of 2.66, it implies major changes in CO2 concentrations, with potentially 4 halvings of CO2 concentration from 29 to 16 Ma (Fig. 8). Modern General Circulation Models (GCM) summarized by the IPCC estimate climate sensitivity as “very likely” in the range of 2 to 5 °C per doubling or halving of CO2 (Forster et al., 2021), which if representative for the Oligocene to early Miocene, would imply 8 to 20 °C of cooling of earth's mean surface temperature (6 to 15 °C incorporating the lower confidence interval of modern culture εp dependence on ln [CO2[aq]] of 3.5, which would imply 3 halvings of CO2). Although ocean is 70 % of the globe and temperature changes are around 1.5-fold less than land temperature (Sutton et al., 2007), such a temperature change of at least 6 °C would be expected to be reflected in paleoceanographic proxies.
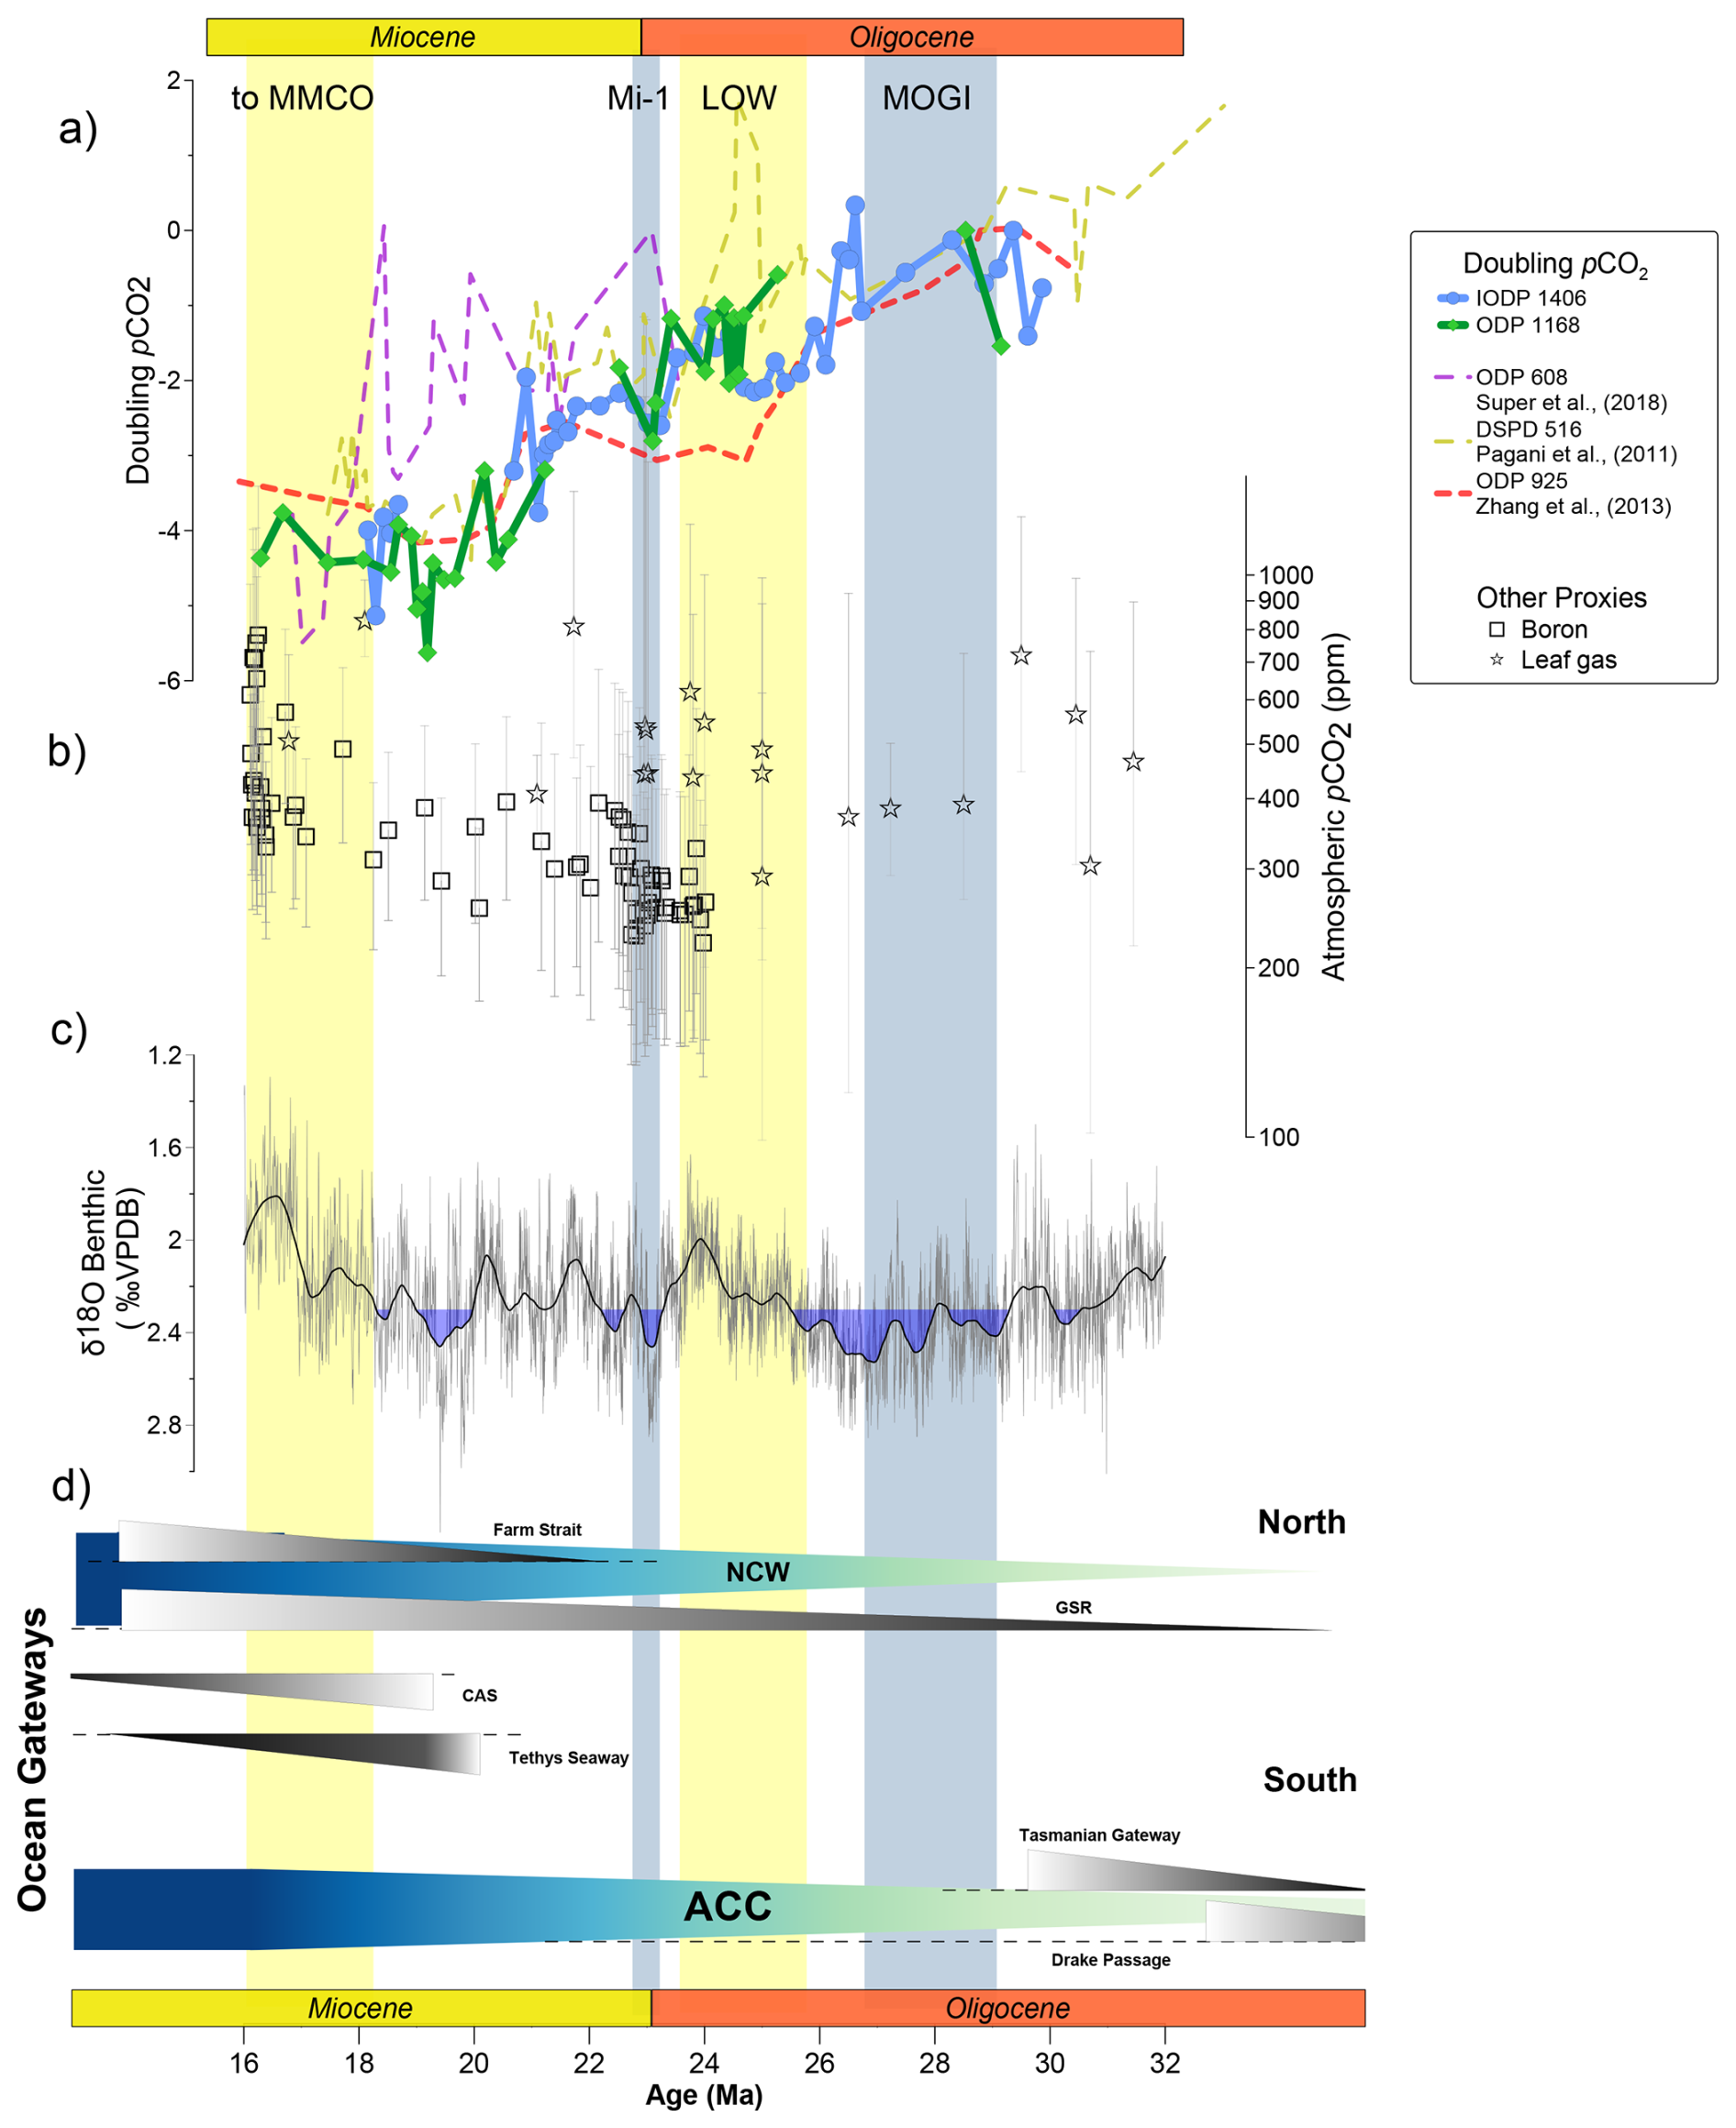
Figure 8Implications of CO2 as main climate driver. (a) pCO2 doubling for the discussed sites from εp referenced at 29 Ma (Site 608 referenced to maximum at 23 Ma). Solid lines are calculated using the SST corrected εp (b) pCO2 estimates from boron and leaf gas compiled in CenCO2PIP Consortium, (2023) (Sosdian et al., 2018; Greenop et al., 2019; Liang et al., 2022b; Londoño et al., 2018; Liang et al., 2022a; Tesfamichael et al., 2017; Reichgelt et al., 2020; Moraweck et al., 2019; Roth-Nebelsick et al., 2014; Sun et al., 2017; Erdei et al., 2012). (c) Benthic δ18O global compilation (Westerhold et al., 2020). (d) Schematic representation of main paleoceanographic and paleogeographic changes over the studied time interval for the Northern and Southern Hemisphere. ACC arrow refers to a shallow circulation not synonymous with the deep late Miocene ACC described by Evangelinos et al. (2024). Yellow and blue vertical bands show main warming and cold periods as Middle Miocene Climatic Optimum (MMCO), Mi-1 glaciation, Late Oligocene Warming (LOW) and Middle Oligocene Glacial Interval (MOGI). Antarctic Circumpolar Current. NCW: Northern Component Water.
Similar to phytoplankton proxy records, the available low resolution leaf gas CO2 records suggest a decline in CO2 from the mid to latest Oligocene. However, in contrast to phytoplankton proxy records indicating a significant long term decline in CO2 from the early Oligocene through mid-Miocene, leaf gas CO2 proxies suggest higher CO2 in the early Miocene than the Oligocene due to a positive shift across the OMT. Boron isotope-based CO2 records from 24 to 18 Ma show significant variability with no clear trend, although the higher density of data around the OMT suggests a CO2 rise from 23 to 20 Ma which may be consistent with the trend observed in the εp record at Site 1406, which has the highest resolution for this time interval.
The late Oligocene climate and CO2 paradox has been discussed based on previously published lower resolution εp record from Site 925 (O'Brien et al., 2020). Our new results from two additional sites confirm the steep CO2 decline through the late Oligocene warming and underscore the paradox. On a global scale, biomarker SST estimates do not show evidence for systematic cooling during the CO2 decline (Liu et al., 2018; O'Brien et al., 2020; Guitián et al., 2019). If the interpretation of εp as a CO2 decline is correct, it suggests that climate sensitivity was either significantly weaker so that no appreciable change in global mean surface temperature occurred, or that available paleotemperature estimates reflect a significant misinterpretation of measured biomarker signals. During this time the inferred CO2 decline also coincides with sequence stratigraphic evidence for ice margin retreat in Antarctica (Levy et al., 2019; Salabarnada et al., 2018), and sea level transgressions inferred from estimates of deep sea δ18Osw and records (Miller et al., 2020), suggesting a different relationship between ice expansion and CO2 than characterized the late Neogene.
For the late Oligocene to early Miocene, the Southern Ocean Site 1168 is the only surface ocean temperature record which exhibits a colder early Miocene coincident with the record of a large magnitude pCO2 decline. This long term cooling is despite the equatorward drift of the site over this time interval (Guitián and Stoll, 2021). If the ODP Site 1168 temperature trend is more representative of global average temperature trends, whereas the long term alkenone temperature record at Newfoundland Ridge Site 1406 and Site 1404 (Liu et al. 2018) is dominated by variations in the heat transport from the Gulf Stream, then the 1168 temperature trend may reflect the signal of radiative greenhouse forcing. Yet, temperature trends at either site may be subject to both global factors as well as regional temperatures, and with only two sites with temperature records paired to εp proxy records it is difficult to ascertain which, if any, of the sites may better reflect global temperature forcing.
A decoupling was at one time proposed for the late Miocene based on apparent negligible pCO2 change and substantial cooling of SST (LaRiviere et al., 2012). Revisions of the alkenone carbon fractionation to CO2 calibration approaches for low pCO2 periods have refined the record from the last 15 Ma, revealing clear pCO2 -SST covariation (Stoll et al., 2019; Rae et al., 2021). However, the Oligocene paradox is not easily resolvable from updated calibration of the εp-CO2 relationship. The late Oligocene paradox arises from an inverse correlation between εp and SST reconstructions in regions other than the Southern Ocean such as the North Atlantic, and a lack of correlation between εp and the global climate signal in benthic δ18O trends. The discrepancies between alkenone and published TEX86 at ODP 1168 suggests continued reevaluation of SST proxy interpretation are needed, along with evaluation of the potential influence of changing surface ocean circulation on SST in some locations such as the North Atlantic. Additionally, the divergence of CO2 trends among εp and boron isotopes suggest that further interrogation of ocean chemistry and biogeochemical cycles potentially affecting the growth and physiology of alkenone producers and the calculation of CO2 from boron isotopes, are crucial to reconcile climate sensitivity to CO2 in the Oligocene to early Miocene.
The new long term alkenone εp records from the Oligocene to early Miocene at North Atlantic Site IODP 1406 and Southern Ocean Site ODP 1168 reveal a significant 8 to 10 ‰ shift. The highest resolution Site 1406 record resolve an abrupt 3 ‰ decline from 27 to 24.5 Ma. The long term trend is comparable with previous lower resolution analysis when they are recalculated with the same methodology.
In addition to CO2, εp may be modified by changes in cellular surface area to volume ratio and growth rate regulated by light, temperature and nutrients. However, our assessment of these effects using records of coccolith size and alkenone temperature estimates for exact time intervals of εp determination, shows that size and temperature-stimulated growth rate effects have a negligible impact in the long term declining trend. The similarity of εp in widely separated sites experiencing contrasting temperature histories strongly suggests a global CO2 decline as the most likely cause of the declining εp. At the same time, our high-resolution sampling reveals significant orbital scale variability in εp and underscores the potential for aliasing in low resolution records. Higher resolution εp time series, and more precise age models on legacy εp records to facilitate more confident comparisons of trends among sites, will provide a better characterization of the key long term trends.
Our results highlight the paradox of complex relationships between CO2 indicators and SST at both the orbital and multi-million year timescales. The higher resolution sampling between 29.7 to 28.7 Ma shows that orbital εp maxima do not coincide with orbital minima in ice volume and/or warmer deep ocean temperature. Similarly, through the late Oligocene warming, CO2 decline contrasts with evidence for Antarctic ice retreat and evidence of stable or warming SST. The transition from late Oligocene to early Miocene, reaching minimum CO2 around 19 Ma, is coincident with significant cooling only in the Southern Ocean Site 1168, but not the North Atlantic site which may be more affected by changes in ocean heat transport.
Data presented in this paper is stored at Zenodo repository (https://doi.org/10.5281/zenodo.13908061, Guitián et al., 2025).
The supplement related to this article is available online at https://doi.org/10.5194/cp-21-2115-2025-supplement.
Study was conceived by HMS and PJP. Analysis completed by JG, SRP, RSW and LA. Interpretation by JG and HMS. Writing of original draft by JG and HMS with support of PJP.
The contact author has declared that none of the authors has any competing interests.
Publisher’s note: Copernicus Publications remains neutral with regard to jurisdictional claims made in the text, published maps, institutional affiliations, or any other geographical representation in this paper. While Copernicus Publications makes every effort to include appropriate place names, the final responsibility lies with the authors. Views expressed in the text are those of the authors and do not necessarily reflect the views of the publisher.
This paper presents data on sediment samples provided by the Ocean Drilling Program (ODP, IODP). We thank Maddie Santos for lab assistance with biogenic Si determinations. We thank Madalina Jaggi for assistance with carbonate stable isotope measurements.
This research was funded by the Swiss National Science Foundation Award 200021_182070 to HMS.
This paper was edited by Yannick Donnadieu and reviewed by two anonymous referees.
Auderset, A., Moretti, S., Taphorn, B., Ebner, P.-R., Kast, E., Wang, X. T., Schiebel, R., Sigman, D. M., Haug, G. H., and Martínez-García, A.: Enhanced ocean oxygenation during Cenozoic warm periods, Nature, 609, 77–82, 2022.
Baczynski, A. A., Polissar, P. J., Juchelka, D., Schwieters, J., Hilkert, A., Summons, R. E., and Freeman, K. H.: Picomolar-scale compound-specific isotope analyses, Rapid Communications in Mass Spectrometry, 32, 730–738, 2018.
Behrenfeld, M. J., Boss, E., Siegel, D. A., and Shea, D. M.: Carbon-based ocean productivity and phytoplankton physiology from space, Global Biogeochemical Cycles, 19, https://doi.org/10.1029/2004GB002299, 2005.
Blaauw, M. and Christen, J. A.: Flexible paleoclimate age-depth models using an autoregressive gamma process, Bayesian Analysis, 6, 457–474, 2011.
Boller, A. J., Thomas, P. J., Cavanaugh, C. M., and Scott, K. M.: Low stable carbon isotope fractionation by coccolithophore RubisCO, Geochimica et Cosmochimica Acta, 75, 7200–7207, 2011.
Bolton, C. T. and Stoll, H. M.: Late Miocene threshold response of marine algae to carbon dioxide limitation, Nature, 500, 558–562, 2013.
Bolton, C. T., Hernandez-Sanchez, M. T., Fuertes, M. A., Gonzalez-Lemos, S., Abrevaya, L., Mendez-Vicente, A., Flores, J. A., Probert, I., Giosan, L., Johnson, J., and Stoll, H. M.: Decrease in coccolithophore calcification and CO2 since the middle Miocene, Nat. Commun., 7, 10284, https://doi.org/10.1038/ncomms10284, 2016.
Bradshaw, C. D., Langebroek, P. M., Lear, C. H., Lunt, D. J., Coxall, H. K., Sosdian, S. M., and de Boer, A. M.: Hydrological impact of Middle Miocene Antarctic ice-free areas coupled to deep ocean temperatures, Nature Geoscience, 14, 429–436, 2021.
Breitenbach, S. F. and Bernasconi, S. M.: Carbon and oxygen isotope analysis of small carbonate samples (20 to 100 µg) with a GasBench II preparation device, Rapid Communications in Mass Spectrometry, 25, 1910–1914, 2011.
Consortium, C. P.: Toward a Cenozoic history of atmospheric CO2, Science, 382, eadi5177, https://doi.org/10.1126/science.adi5177, 2023.
Cramer, B., Miller, K., Barrett, P., and Wright, J.: Late Cretaceous–Neogene trends in deep ocean temperature and continental ice volume: Reconciling records of benthic foraminiferal geochemistry (δ18O and ) with sea level history, Journal of Geophysical Research: Oceans, 116, https://doi.org/10.1029/2011JC007255, 2011.
Curry, W., Shackleton, N., and Richter, C.: Leg 154, Synthesis. Proceedings ODP, Initial Reports, 154, 421–442, 1995.
Deconto, R. M., Pollard, D., Wilson, P. A., Palike, H., Lear, C. H., and Pagani, M.: Thresholds for Cenozoic bipolar glaciation, Nature, 455, 652–656, https://doi.org/10.1038/nature07337, 2008.
Erdei, B., Utescher, T., Hably, L., Tamas, J., Roth-Nebelsick, A., and Grein, M.: Early Oligocene continental climate of the Palaeogene Basin (Hungary and Slovenia) and the surrounding area, Turkish Journal of Earth Sciences, 21, 153–186, 2012.
Evangelinos, D., Etourneau, J., van de Flierdt, T., Crosta, X., Jeandel, C., Flores, J.-A., Harwood, D. M., Valero, L., Ducassou, E., and Sauermilch, I.: Late Miocene onset of the modern Antarctic circumpolar current, Nature Geoscience, 17, 165–170, 2024.
Evans, D., Brugger, J., Inglis, G. N., and Valdes, P.: The Temperature of the Deep Ocean Is a Robust Proxy for Global Mean Surface Temperature During the Cenozoic, Paleoceanography and Paleoclimatology, 39, e2023PA004788, https://doi.org/10.1029/2023PA004788, 2024.
Exon, N. F., Kennett, J. P., and Malone, M. J., et al.: Proceedings of the Ocean Drilling Program, Initial Reports Volume 189, https://doi.org/10.2973/odp.proc.ir.189.101.2001, 2001.
Fielding, S. R.: Emiliania huxleyi specific growth rate dependence on temperature, Limnology and Oceanography, 58, 663–666, 2013.
Forster, P. M., Storelvmo, T., Armour, K., Collins, W., Dufresne, J.-L., Frame, D., Lunt, D., Mauritsen, T., Palmer, M., Watanabe, M., Wild, M., and Zhang, H.: The Earth's Energy Budget, Climate Feedbacks and Climate Sensitivity, In Climate Change 2021: The Physical Science Basis. Contribution of Working Group I to the Sixth Assessment Report of the Intergovernmental Panel on Climate Change, edited by: Masson-Delmotte, V., Zhai, P., Pirani, A., Connors, S. L., Péan, C., Berger, S., Caud, N., Chen, Y., Goldfarb, L., Gomis, M. I., Huang, M., Leitzell, K., Lonnoy, E., Matthews, J. B. R., Maycock, T. K., Waterfield, T., Yelekçi, O., Yu, R., and Zhou, B., 923–1054, https://doi.org/10.1017/9781009157896.009, 2021.
Foster, G. L., Royer, D. L., and Lunt, D. J.: Future climate forcing potentially without precedent in the last 420 million years, Nature Communications, 8, 14845, https://doi.org/10.1038/ncomms14845, 2017.
Freeman, K. H. and Hayes, J.: Fractionation of carbon isotopes by phytoplankton and estimates of ancient CO2 levels, Global Biogeochemical Cycles, 6, 185–198, 1992.
Golledge, N. R.: Long-term projections of sea-level rise from ice sheets, Wiley Interdisciplinary Reviews: Climate Change, 11, e634, https://doi.org/10.1002/wcc.634 2020.
González-Lanchas, A., Hernández-Alméida, I., Flores, J. A., Sierro, F. J., Guitian, J., and Stoll, H. M.: Carbon Isotopic Fractionation of Alkenones and Gephyrocapsa Coccoliths Over the Late Quaternary (Marine Isotope Stages 12–9) Glacial-Interglacial Cycles at the Western Tropical Atlantic, Paleoceanography and Paleoclimatology, 36, e2020PA004175, https://doi.org/10.1029/2020PA004175, 2021.
Gradstein, F. M., Ogg, J. G., Schmitz, M., and Ogg, G.: The geologic time scale 2012, Elsevier, ISBN 978-0-44-459390-0, 2012.
Greenop, R., Sosdian, S. M., Henehan, M. J., Wilson, P. A., Lear, C. H., and Foster, G. L.: Orbital forcing, ice-volume and CO2 across the Oligocene-Miocene Transition, Paleoceanography and Paleoclimatology, https://doi.org/10.1029/2018PA003420, 2019.
Guitián, J. and Stoll, H. M.: Evolution of Sea Surface Temperature in the Southern Mid-latitudes from Late Oligocene through Early Miocene, Paleoceanography and Paleoclimatology, 36, e2020PA004199, https://doi.org/10.1029/2020PA004199, 2021.
Guitián, J., Phelps, S., Polissar, P. J., Ausín, B., Eglinton, T. I., and Stoll, H. M.: Midlatitude Temperature Variations in the Oligocene to Early Miocene, Paleoceanography and Paleoclimatology, 34, 1328–1343, 2019.
Guitián, J., Dunkley Jones, T., Hernández-Almeida, I., Löffel, T., and Stoll, H. M.: Adaptations of coccolithophore size to selective pressures during the Oligocene to Early Miocene high CO2 world, Paleoceanography and Paleoclimatology, 35, e2020PA003918, https://doi.org/10.1029/2020PA003918, 2020.
Guitián, J., Phelps, S., Wijker, R., Polissar, P., Arnold, L., and Stoll, H.: Alkenone carbon isotopic fractionation and sea surface temperature trends from 30 to 16 Ma. Sites IODP 1406, ODP 1168 and ODP 925, Zenodo [data set], https://doi.org/10.5281/zenodo.13908061, 2025.
Hansen, J., Sato, M., Russell, G., and Kharecha, P.: Climate sensitivity, sea level and atmospheric carbon dioxide, Philosophical Transactions of the Royal Society A: Mathematical, Physical and Engineering Sciences, 371, 20120294, https://doi.org/10.1098/rsta.2012.0294, 2013.
Hay, W. W., DeConto, R. M., Wold, C. N., Wilson, K. M., Voigt, S., Schulz, M., Wold, A. R., Dullo, W.-C., Ronov, A. B., and Balukhovsky, A. N.: Alternative global Cretaceous paleogeography, edited by: Barrera, E., and Johnson, C., 332, 1–47, https://doi.org/10.1130/0-8137-2332-9.1, 1999.
Henderiks, J. and Pagani, M.: Refining ancient carbon dioxide estimates: Significance of coccolithophore cell size for alkenone-based pCO2 records, Paleoceanography, 22, https://doi.org/10.1029/2006PA001399, 2007.
Henderiks, J. and Pagani, M.: Coccolithophore cell size and the Paleogene decline in atmospheric CO2, Earth and Planetary Science Letters, 269, 576–584, 2008.
Hernández-Almeida, I., Guitián, J., Tanner, T., Zhang, H., and Stoll, H. M.: Hydrographic control on carbon isotope fractionation in coccolithophores in the North Atlantic during the Mid-Pleistocene, Quaternary Science Reviews, 309, 108081, https://doi.org/10.1016/j.quascirev.2023.108081, 2023.
Hernández-Almeida, I., Krumhardt, K. M., Zhang, H., and Stoll, H. M.: Estimation of physiological factors controlling carbon isotope fractionation in coccolithophores in photic zone and core-top samples, Geochemistry, Geophysics, Geosystems, 21, e2020GC009272, https://doi.org/10.1029/2020GC009272, 2020.
Hou, S., Lamprou, F., Hoem, F. S., Hadju, M. R. N., Sangiorgi, F., Peterse, F., and Bijl, P. K.: Lipid-biomarker-based sea surface temperature record offshore Tasmania over the last 23 million years, Clim. Past, 19, 787–802, https://doi.org/10.5194/cp-19-787-2023, 2023a.
Hou, S., Stap, L. B., Paul, R., Nelissen, M., Hoem, F. S., Ziegler, M., Sluijs, A., Sangiorgi, F., and Bijl, P. K.: Reconciling Southern Ocean fronts equatorward migration with minor Antarctic ice volume change during Miocene cooling, Nature Communications, 14, 7230, https://doi.org/10.1038/s41467-023-43106-4, 2023b.
Jasper J. P., Hayes, J. M., Mix, A. C., and Prahl, F. G.: Photosynthetic fractionation of 13C and concentrations of dissolved CO2 in the central equatorial Pacific during the last 255,000 years, Paleoceanography, 9, 781–798, https://doi.org/10.1029/94PA02116, 1994.
Krumhardt, K. M., Lovenduski, N. S., Iglesias-Rodriguez, M. D., and Kleypas, J. A.: Coccolithophore growth and calcification in a changing ocean, Progress in Oceanography, 159, 276–295, 2017.
LaRiviere, J. P., Ravelo, A. C., Crimmins, A., Dekens, P. S., Ford, H. L., Lyle, M., and Wara, M. W.: Late Miocene decoupling of oceanic warmth and atmospheric carbon dioxide forcing, Nature, 486, 97–100, 2012.
Lear, C. H., Elderfield, H., and Wilson, P.: Cenozoic deep-sea temperatures and global ice volumes from in benthic foraminiferal calcite, Science, 287, 269–272, 2000.
Lear, C. H., Rosenthal, Y., Coxall, H. K., and Wilson, P.: Late Eocene to early Miocene ice sheet dynamics and the global carbon cycle, Paleoceanography, 19, https://doi.org/10.1029/2004PA001039, 2004.
Levy, R., Meyers, S., Naish, T., Golledge, N., McKay, R., Crampton, J., DeConto, R., De Santis, L., Florindo, F., and Gasson, E.: Antarctic ice-sheet sensitivity to obliquity forcing enhanced through ocean connections, Nature Geoscience, 1, https://doi.org/10.1038/s41561-018-0284-4, 2019.
Liang, J.-Q., Leng, Q., Xiao, L., Höfig, D. F., Royer, D. L., Zhang, Y. G., and Yang, H.: Early Miocene redwood fossils from Inner Mongolia: CO2 reconstructions and paleoclimate effects of a low Mongolian plateau, Review of Palaeobotany and Palynology, 70 305, 104743, https://doi.org/10.1016/j.revpalbo.2022.104743, 2022a.
Liang, J.-Q., Leng, Q., Höfig, D. F., Niu, G., Wang, L., Royer, D. L., Burke, K., Xiao, L., Zhang, Y. G., and Yang, H.: Constraining conifer physiological parameters in leaf gas-exchange models for ancient CO2 reconstruction, Global and Planetary Change, 209, 103737, https://doi.org/10.1016/j.gloplacha.2022.103737, 2022b.
Liebrand, D., de Bakker, A. T., Beddow, H. M., Wilson, P. A., Bohaty, S. M., Ruessink, G., Palike, H., Batenburg, S. J., Hilgen, F. J., Hodell, D. A., Huck, C. E., Kroon, D., Raffi, I., Saes, M. J., van Dijk, A. E., and Lourens, L. J.: Evolution of the early Antarctic ice ages, P. Natl. Acad. Sci. USA, 114, 3867–3872, https://doi.org/10.1073/pnas.1615440114, 2017.
Lisiecki, L. E. and Raymo, M. E.: A Pliocene-Pleistocene stack of 57 globally distributed benthic δ18O records, Paleoceanography, 20, https://doi.org/10.1029/2004PA001071, 2005.
Liu, Z., He, Y., Jiang, Y., Wang, H., Liu, W., Bohaty, S. M., and Wilson, P. A.: Transient temperature asymmetry between hemispheres in the Palaeogene Atlantic Ocean, Nature Geoscience, 11, 656, https://doi.org/10.1038/s41561-018-0182-9, 2018.
Liu, Z., Pagani, M., Zinniker, D., Deconto, R., Huber, M., Brinkhuis, H., Shah, S. R., Leckie, R. M., and Pearson, A.: Global cooling during the eocene-oligocene climate transition, Science, 323, 1187-1190, https://doi.org/10.1126/science.1166368, 2009.
Londoño, L., Royer, D. L., Jaramillo, C., Escobar, J., Foster, D. A., Cárdenas-Rozo, A. L., and Wood, A.: Early Miocene CO2 estimates from a Neotropical fossil leaf assemblage exceed 400 ppm, American Journal of Botany, 105, 1929–1937, 2018.
Miller, K. G., Wright, J. D., and Fairbanks, R. G.: Unlocking the ice house: Oligocene-Miocene oxygen isotopes, eustasy, and margin erosion, Journal of Geophysical Research: Solid Earth, 96, 6829–6848, 1991.
Miller, K. G., Browning, J. V., Schmelz, W. J., Kopp, R. E., Mountain, G. S., and Wright, J. D.: Cenozoic sea-level and cryospheric evolution from deep-sea geochemical and continental margin records, Science Advances, 6, eaaz1346, https://doi.org/10.1126/sciadv.aaz1346, 2020.
Misra, S. and Froelich, P. N.: Lithium isotope history of Cenozoic seawater: changes in silicate weathering and reverse weathering, Science, 335, 818–823, 2012.
Mook, W., Bommerson, J., and Staverman, W.: Carbon isotope fractionation between dissolved bicarbonate and gaseous carbon dioxide, Earth and Planetary Science Letters, 22, 169–176, 1974.
Moraweck, K., Grein, M., Konrad, W., Kvaček, J., Kova-Eder, J., Neinhuis, C., Traiser, C., and Kunzmann, L.: Leaf traits of long-ranging Paleogene species and their relationship with depositional facies, climate and atmospheric CO2 level; Leaf traits of long-ranging Paleogene species and their relationship with depositional facies, climate and atmospheric CO2 level, Palaeontographica Abteilung B: Palaeophytologie, 298, 93–172, 2019.
Novak, J., McGrath, S. M., Wang, K. J., Liao, S., Clemens, S. C., Kuhnt, W., and Huang, Y.: U38MEK′ Expands the linear dynamic range of the alkenone sea surface temperature proxy, Geochimica et Cosmochimica Acta, 328, 207–220, 2022.
O'Brien, C. L., Huber, M., Thomas, E., Pagani, M., Super, J. R., Elder, L. E., and Hull, P. M.: The enigma of Oligocene climate and global surface temperature evolution, Proceedings of the National Academy of Sciences, 117, 25302–25309, 2020.
Pagani, M., Arthur, M. A., and Freeman, K. H.: Miocene evolution of atmospheric carbon dioxide, Paleoceanography, 14, 273–292, 1999.
Pagani, M., Arthur, M. A., and Freeman, K. H.: Variations in Miocene phytoplankton growth rates in the southwest Atlantic: Evidence for changes in ocean circulation, Paleoceanography, 15, 486–496, 2000.
Pagani, M., Zachos, J. C., Freeman, K. H., Tipple, B., and Bohaty, S.: Marked decline in atmospheric carbon dioxide concentrations during the Paleogene, Science, 309, 600–603, 2005.
Pagani, M., Huber, M., Liu, Z., Bohaty, S. M., Henderiks, J., Sijp, W., Krishnan, S., and DeConto, R. M.: The role of carbon dioxide during the onset of Antarctic glaciation, Science, 334, 1261–1264, 2011.
Pagani, M.: 12.13 – Biomarker-Based Inferences of Past Climate: The Alkenone pCO2 Proxy, edited by: Holland, H. D. and Turekian, K. K., Treatise on Geochemistry, 2nd Edn., Elsevier, 361–378, ISBN 9780080983004, https://doi.org/10.1016/B978-0-08-095975-7.01027-5, 2014.
Pfuhl, H. A. and McCave, I. N.: Integrated age models for the early Oligocene-early Miocene, edited by: Exon, N. F., Kennett, J. P., and Malone, M. J., sites 1168 and 1170–1172, Proc. ODP, Sci. Results, 189, https://doi.org/10.2973/odp.proc.sr.189.108.2003, 2003.
Popp, B. N., Kenig, F., Wakeham, S. G., Laws, E. A., and Bidigare, R. R.: Does growth rate affect ketone unsaturation and intracellular carbon isotopic variability in Emiliania huxleyi?, Paleoceanography, 13, 35–41, 1998.
Rae, J. W., Zhang, Y. G., Liu, X., Foster, G. L., Stoll, H. M., and Whiteford, R. D.: Atmospheric CO2 over the past 66 million years from marine archives, Annual Review of Earth and Planetary Sciences, 49, 609–641, 2021.
Ragueneau, O., Tréguer, P., Leynaert, A., Anderson, R., Brzezinski, M., DeMaster, D., Dugdale, R., Dymond, J., Fischer, G., and Francois, R.: A review of the Si cycle in the modern ocean: recent progress and missing gaps in the application of biogenic opal as a paleoproductivity proxy, Global and Planetary Change, 26, 317–365, 2000.
Rama-Corredor, O., Cortina, A., Martrat, B., Lopez, J. F., and Grimalt, J. O.: Removal of bias in C37 alkenone-based sea surface temperature measurements by high-performance liquid chromatography fractionation, Journal of Chromatography A, 1567, 90–98, 2018.
Rau, G. H., Riebesell, U., and Wolf-Gladrow, D.: A model of photosynthetic 13C fractionation by marine phytoplankton based on diffusive molecular CO2 uptake, Marine Ecology Progress Series, 133, 275–285, 1996.
Raymo, M. E. and Ruddiman, W. F.: Tectonic forcing of late Cenozoic climate, Nature, 359, 117–122, 1992.
Reichgelt, T., D'Andrea, W. J., Valdivia-McCarthy, A. C., Fox, B. R. S., Bannister, J. M., Conran, J. G., Lee, W. G., and Lee, D. E.: Elevated CO2, increased leaf-level productivity, and water-use efficiency during the early Miocene, Clim. Past, 16, 1509–1521, https://doi.org/10.5194/cp-16-1509-2020, 2020.
Reilly, T. J., Miller, K. G., and Feigenson, M. D.: Latest Eocene-earliest Miocene Sr isotopic reference section, Site 522, eastern South Atlantic, Paleoceanography, 17, 18-11–18-19, 2002.
Roth-Nebelsick, A., Oehm, C., Grein, M., Utescher, T., Kunzmann, L., Friedrich, J.-P., and Konrad, W.: Stomatal density and index data of Platanus neptuni leaf fossils and their evaluation as a CO2 proxy for the Oligocene, Review of Palaeobotany and Palynology, 206, 1–9, 2014.
Rugenstein, J. K. C., Ibarra, D. E., and von Blanckenburg, F.: Neogene cooling driven by land surface reactivity rather than increased weathering fluxes, Nature, 571, 99–102, 2019.
Salabarnada, A., Escutia, C., Röhl, U., Nelson, C. H., McKay, R., Jiménez-Espejo, F. J., Bijl, P. K., Hartman, J. D., Strother, S. L., Salzmann, U., Evangelinos, D., López-Quirós, A., Flores, J. A., Sangiorgi, F., Ikehara, M., and Brinkhuis, H.: Paleoceanography and ice sheet variability offshore Wilkes Land, Antarctica – Part 1: Insights from late Oligocene astronomically paced contourite sedimentation, Clim. Past, 14, 991–1014, https://doi.org/10.5194/cp-14-991-2018, 2018.
Shackleton, N.: Oxygen isotopes, ice volume and sea level, Quaternary Science Reviews, 6, 183–190, 1987.
Sherman, E., Moore, J. K., Primeau, F., and Tanouye, D.: Temperature influence on phytoplankton community growth rates, Global Biogeochemical Cycles, 30, 550–559, 2016.
Sosdian, S. M., Greenop, R., Hain, M., Foster, G. L., Pearson, P. N., and Lear, C. H.: Constraining the evolution of Neogene ocean carbonate chemistry using the boron isotope pH proxy, Earth and Planetary Science Letters, 498, 362–376, 2018.
Stoll, H. M., Pena, L. D., Hernandez-Almeida, I., Guitián, J., Tanner, T., and Pälike, H.: Nonlinear increase in seawater Sr in the Oligocene to early Miocene and implications for climate-sensitive weathering, Clim. Past, 20, 25–36, https://doi.org/10.5194/cp-20-25-2024, 2024.
Stoll, H. M., Guitian, J., Hernandez-Almeida, I., Mejia, L. M., Phelps, S., Polissar, P., Rosenthal, Y., Zhang, H., and Ziveri, P.: Upregulation of phytoplankton carbon concentrating mechanisms during low CO2 glacial periods and implications for the phytoplankton pCO2 proxy, Quaternary Science Reviews, 208, 1–20, 2019.
Sun, B.-N., Wang, Q.-J., Konrad, W., Ma, F.-J., Dong, J.-L., and Wang, Z.-X.: Reconstruction of atmospheric CO2 during the Oligocene based on leaf fossils from the Ningming Formation in Guangxi, China, Palaeogeography, Palaeoclimatology, Palaeoecology, 467, 5–15, 2017.
Super, J. R., Thomas, E., Pagani, M., Huber, M., O'Brien, C., and Hull, P. M.: North Atlantic temperature and pCO2 coupling in the early-middle Miocene, Geology, 46, 519–522, 2018.
Sutton, R. T., Dong, B., and Gregory, J. M.: warming ratio in response to climate change: IPCC AR4 model results and comparison with observations, Geophysical Research Letters, 34, https://doi.org/10.1029/2006GL028164, 2007.
Tanner, T., Hernández-Almeida, I., Drury, A. J., Guitián, J., and Stoll, H.: Decreasing atmospheric CO2 during the late Miocene cooling, Paleoceanography and Paleoclimatology, 35, e2020PA003925, https://doi.org/10.1029/2020PA003925, 2020.
Tesfamichael, T., Jacobs, B., Tabor, N., Michel, L., Currano, E., Feseha, M., Barclay, R., Kappelman, J., and Schmitz, M.: Settling the issue of “decoupling” between atmospheric carbon dioxide and global temperature:[CO2] atm reconstructions across the warming Paleogene-Neogene divide, Geology, 45, 999–1002, 2017.
Tierney, J. E. and Tingley, M. P.: A TEX(8)(6) surface sediment database and extended Bayesian calibration, Sci. Data, 2, 150029, https://doi.org/10.1038/sdata.2015.29, 2015.
Tierney, J. E. and Tingley, M. P.: BAYSPLINE: A new calibration for the alkenone paleothermometer, Paleoceanography and Paleoclimatology, 33, 281–301, 2018.
Torres Romero, I., Clark, A. J., Wijker, R. S., Jaggi, M., Zhang, H., and Stoll, H. M.: Temperature-dependent carbon isotope fractionation in coccolithophores, Frontiers in Earth Science, 12, 1331179, https://doi.org/10.3389/feart.2024.1331179, 2024.
Torsvik, T. H., Van der Voo, R., Preeden, U., Mac Niocaill, C., Steinberger, B., Doubrovine, P. V., Van Hinsbergen, D. J., Domeier, M., Gaina, C., and Tohver, E.: Phanerozoic polar wander, palaeogeography and dynamics, Earth-Science Reviews, 114, 325–368, 2012.
van Hinsbergen, D. J., de Groot, L. V., van Schaik, S. J., Spakman, W., Bijl, P. K., Sluijs, A., Langereis, C. G., and Brinkhuis, H.: A paleolatitude calculator for paleoclimate studies, PloS one, 10, https://doi.org/10.1371/journal.pone.0126946, 2015.
Van Peer, T. E., Xuan, C., Lippert, P. C., Liebrand, D., Agnini, C., and Wilson, P. A.: Extracting a detailed magnetostratigraphy from weakly magnetized, Oligocene to early Miocene sediment drifts recovered at IODP Site U1406 (Newfoundland margin, northwest Atlantic Ocean), Geochemistry, Geophysics, Geosystems, 18, 3910–3928, 2017.
Westerhold, T., Marwan, N., Drury, A. J., Liebrand, D., Agnini, C., Anagnostou, E., Barnet, J. S., Bohaty, S. M., De Vleeschouwer, D., and Florindo, F.: An astronomically dated record of Earth's climate and its predictability over the last 66 million years, Science, 369, 1383–1387, 2020.
Wilkes, E. B., Lee, R. B., McClelland, H. L., Rickaby, R. E., and Pearson, A.: Carbon isotope ratios of coccolith–associated polysaccharides of Emiliania huxleyi as a function of growth rate and CO2 concentration, Organic Geochemistry, 119, 1–10, 2018.
Zachos, J., Pagani, M., Sloan, L., Thomas, E., and Billups, K.: Trends, rhythms, and aberrations in global climate 65 Ma to present, Science, 292, 686–693, https://doi.org/10.1126/science.1059412, 2001.
Zachos, J. C., Dickens, G. R., and Zeebe, R. E.: An early Cenozoic perspective on greenhouse warming and carbon-cycle dynamics, Nature, 451, 279–283, https://doi.org/10.1038/nature06588, 2008.
Zeebe, R. E. and Wolf-Gladrow, D.: CO2 in seawater: equilibrium, kinetics, isotopes, Gulf Professional Publishing, ISBN 9780444509468, 2001.
Zhang, Y. G., Pagani, M., Liu, Z., Bohaty, S. M., and Deconto, R.: A 40-million-year history of atmospheric CO2, Philos. Trans. A Math. Phys. Eng. Sci., 371, 20130096, https://doi.org/10.1098/rsta.2013.0096, 2013.