the Creative Commons Attribution 4.0 License.
the Creative Commons Attribution 4.0 License.
 | 20 Oct 2025
Using reduced-complexity volcanic aerosol and climate models to produce large ensemble simulations of Holocene temperature
Thomas J. Aubry
Chris Smith
Peter O. Hopcroft
Michael Sigl
Jessica E. Tierney
Kevin Anchukaitis
Matthew Osman
Anja Schmidt
Matthew Toohey
Volcanic eruptions are one of the most important drivers of climate variability, but climate model simulations typically show stronger surface cooling than proxy-based reconstructions. Uncertainties associated with eruption source parameters, aerosol–climate modelling, and internal climate variability might explain those discrepancies, but their quantification using complex global climate models is computationally expensive. In this study, we combine a reduced-complexity volcanic aerosol model (EVA_H) and a climate model (FaIR) to simulate global-mean surface temperature from 6755 BCE to 1900 CE (8705 to 50 BP) accounting for volcanic forcing, solar irradiance, orbital, ice sheet, greenhouse gases, land-use forcing, and anthropogenic aerosols and ozone forcing for the historical period (1750–1900 CE). The negligible computational cost of the models enables us to use a Monte Carlo approach to propagate uncertainties associated with eruption source parameters, aerosol and climate modelling, and internal climate variability. Averaging over the last 9000 years, we obtain a global-mean volcanic forcing of −0.15 W m−2 and an associated surface cooling of 0.12 K. Averaged over the 14 largest eruptions (injecting more than 20 Tg of SO2) of 1250–1900 CE, the mean temperature response in tree-ring-based reconstructions is in good agreement with the our simulations, scaled to Northern Hemisphere summer temperature. For individual eruptions, discrepancies between the simulated and reconstructed surface temperature response are almost always within uncertainties. At multimillennial timescales, our simulations reproduce the Holocene global warming trend typically derived from simulations and data assimilation products but exhibit some discrepancies on centennial to millennial timescales. In particular, the Medieval Climate Anomaly to Little Ice Age transition is weaker in our simulations, and we also do not capture a relatively cool period between 3000 and 1000 BCE (5000 and 3000 BP), visible in climate reanalyses. We discuss how uncertainties in land-use forcing and model limitations might explain these differences. Our study demonstrates the value of reduced-complexity volcanic aerosol–climate models to simulate climate at annual to multimillennial timescales.
- Article
(6915 KB) - Full-text XML
-
Supplement
(2089 KB) - BibTeX
- EndNote


Volcanic eruptions can inject large amounts of sulfur dioxide (SO2) into the stratosphere, where the resulting sulfate aerosols have a lifetime of 1–3 years, scatter shortwave radiation, and absorb longwave radiation. Volcanic forcing results in a net surface cooling and reduction in precipitation at the global scale, although it also affects large-scale modes of climate variability (e.g. ENSO) which strongly modulate regional climate responses (Marshall et al., 2022). Volcanic forcing is one of the main drivers of climate variability at annual to multidecadal time scales (Myhre et al., 2014; Sigl et al., 2015), and volcanic climate impacts have been linked to societal impacts such as crop failure and famines (e.g. Oppenheimer, 2015; Manning et al., 2017; Ljungqvist et al., 2024).
Past volcanic impacts on climate are typically investigated using two approaches: proxy-based reconstructions and model simulations. At an annual resolution, proxies include tree-ring growth, which has dominated reconstructions for the last millennium (e.g. PAGES 2k Consortium, 2019). Tree-ring records are sparsely situated and seasonally biased (King et al., 2021a; Lücke et al., 2021; Anchukaitis and Smerdon, 2022). Global circulation models (GCMs) or Earth system models (ESMs) simulate past climate based on volcanic emission or forcing datasets (e.g. Timmreck, 2012; van Dijk et al., 2024; Wainman et al., 2024). The comparison between the reconstructions and the simulations of past temperature shows discrepancies when it comes to the impact of volcanic eruptions (e.g. Mann et al., 2013; Marshall et al., 2025). Potential explanations include an underestimation of the cooling in the proxies (Anchukaitis et al., 2012; D'Arrigo et al., 2013; Lücke et al., 2019; Anchukaitis and Smerdon, 2022) or biases and uncertainties in estimating the dates, locations, and SO2 emissions of past eruptions using ice cores (Sigl et al., 2014; Marshall et al., 2019; Toohey and Sigl, 2017) and climate modelling uncertainty, resulting in an overestimation of the cooling (Zanchettin et al., 2019; Aubry et al., 2020; Chylek et al., 2020; Marshall et al., 2021).
Numerous uncertainties affect the simulation of volcanic impacts on climate: (i) uncertainties on eruption source parameters (e.g. SO2 emission mass, latitude, height and season) which govern the forcing (e.g. Marshall et al., 2019); (ii) aerosol modelling uncertainties (e.g. for the Tambora 1815 eruption, interactive stratospheric aerosol models differ by a factor ∼ 2 on both the timescale and magnitude of aerosol optical properties perturbation in response to the same volcanic SO2 emission Clyne et al., 2021); (iii) climate modelling uncertainties (i.e. for the same prescribed aerosol optical property perturbation, the radiative forcing and climate response differ significantly; Zanchettin et al., 2022); and (iv) uncertainties caused by the modulation of the forced response by internal climate variability (e.g. Zanchettin et al., 2019). Propagating all these uncertainties with GCMs or ESMs is currently highly computationally expensive, leading to most uncertainties being ignored. For example, the Paleoclimate Model Intercomparison Project (PMIP) last millennium experiment (Jungclaus et al., 2017) recommends a 10-member ensemble run with the recommended aerosol optical property dataset (Toohey and Sigl, 2017), hence assessing only the internal variability (iv) and climate modelling (iii) uncertainty subject to sufficient participating models. Even for experiments much shorter than the last millennium (e.g. McConnell et al., 2020; van Dijk et al., 2022), uncertainties on emission parameters (i) and aerosol modelling (ii) are not accounted for. A handful of studies have quantified the impact of emission uncertainties (e.g. Zanchettin et al., 2019), but they do not account for aerosol (ii) or climate modelling (iii) uncertainties.
Given the cost of rigorously quantifying uncertainties on volcanic climate impacts using GCMs – not least those with interactive stratospheric aerosol schemes – reduced-complexity models are advantageous. Hereafter, we refer to “reduced-complexity models” as idealised models relying on a limited number of parameters, allowing one to reproduce key metrics of complex aerosol or climate models with a low computing cost. For example, for volcanic aerosol modelling, the Easy Volcanic Aerosol model (EVA; Toohey et al., 2016; and its extension EVA_H; Aubry et al., 2020) represents the stratosphere using 3–8 boxes in which the aerosol production, loss, and transport are parametrised using constant timescales. EVA has been widely applied during the Coupled Model Intercomparison Project phase 6 (CMIP6; Eyring et al., 2016), for VolMIP (Zanchettin et al., 2022) and PMIP (Jungclaus et al., 2017). EVA_H has been used to propagate uncertainties on emission parameters to estimates of aerosol optical properties (e.g. Mackay et al., 2022; Vernier et al., 2024). Reduced-complexity climate models are also increasingly used in climate science and have a dedicated Model Intercomparison Project (Nicholls et al., 2020). These models have recently been applied to volcanic eruptions. For example, the FaIR climate model (Smith et al., 2018; Leach et al., 2021) was used to estimate the global-mean surface temperature (GMST) response to the 2019 Raikoke eruption (Vernier et al., 2024) and the 2022 Hunga Tonga–Hunga Ha'apai eruption (Jenkins et al., 2023) and to include future volcanic scenarios in climate projections (Chim et al., 2025). The aerosol optical properties, radiative forcing, and surface temperature impacts of an eruption can be rapidly assessed with the Volc2clim web tool (Schmidt et al., 2023; Vernier et al., 2024), which combines EVA_H and FaIR. Lücke et al. (2023) recently combined EVA and a reduced-complexity climate model to produce a large ensemble of GMST time series for the last millennium. They conclude that accounting for emission uncertainties (timing of eruption and mass of SO2) partly explains the proxy–model discrepancies on volcanic cooling. Their approach could be further enhanced by accounting for uncertainties associated with the latitude and altitude of volcanic injections, as well as uncertainties on parameters of reduced-complexity aerosol and climate models used.
Here, we combine reduced-complexity volcanic aerosol (EVA_H) and climate (FaIR) models to simulate the GMST response to volcanic eruptions during the last 9000 years. Compared to Lücke et al. (2023), our approach extends the simulation by 8000 years and makes use of a reduced-complexity aerosol model accounting for volcanic emission latitude and altitude (EVA_H) and of a reduced-complexity climate model, enabling us to emulate the full range of behaviour of CMIP climate models as well as internal climate variability (FaIR). We show that in general the reconstructed Holocene surface temperature can be well reproduced with our method. Section 2 presents forcing datasets and the proxy reconstructions, model simulations, and data assimilation products to which we compare our ensemble simulations. To test whether apparent discrepancies between proxy-based reconstructions and climate model simulations can be reconciled by uncertainties, we use Monte Carlo simulations to propagate uncertainties associated with SO2 emission parameters, volcanic aerosol and climate modelling, and internal variability (Sect. 3). Sections 4 and 5 present and discuss estimates of radiative forcing and temperature response and their comparison to proxy reconstructions.
2.1 Volcanic stratospheric sulfur injection (VSSI)
To simulate stratospheric aerosol optical properties (Sect. 3.1) and associated radiative forcing (Sect. 3.2), we need to constrain the timing, mass, latitude, and altitude of past volcanic SO2 injections. Datasets based on bipolar ice-core records provide estimates of the year and mass of sulfur injection. Here we use the HolVol (v1.0) dataset, covering the 9500–500 BCE period (Sigl et al., 2022), and the eVolv2k (version 3) dataset (Toohey and Sigl, 2017) for the period 500 BCE–1900 CE as it relies on a larger number of ice-cores.
Constraining the latitude and the altitude of injection requires linking ice-core sulfate deposition to specific known eruptions. Of the 920 injections recorded between 6755 BCE and 1900 CE (8705 to 50 BP), we identified 28 eruption source matches in the literature (Table S1 in the Supplement). 15 of these are particularly robust as they stem from matching the geochemistry of cryptotephra deposited in the ice-core with that of proximal eruption deposits (de Silva and Zielinski, 1998; Zdanowicz et al., 1999; Cook et al., 2018; McConnell et al., 2020; Pearson et al., 2022; Piva et al., 2023; Plunkett et al., 2023). For the 1628 BCE Aniakchak II and 43 BCE Okmok II eruptions, we use the date and mass of Pearson et al. (2022) instead of those in HolVol/eVolv2k as it is based on a larger set of ice cores. 13 matches were obtained based on the coincidental occurrence of a known eruption and a sulfur deposit in the ice core. We kept coincidental matches only for eruptions after 1750 CE, all consistent with the CMIP7 historical dataset (Aubry et al., 2025). This results in the removal of some of the matches proposed in eVolv2k (1873 Grimsvötn, 1831 Babuyan Claro, 1739 Shikotsu, 1721 Katla, 1707 Fujisan, 1673 Gamkonora, 1667 Shikotsu, 1640 Parker, 1595 Nevado del Ruiz, 1585 Colima, 1510 Hekla) and the addition of two new matches (1846 Hekla and 1760 Kie Besi). We note that two of the matches removed here, i.e. Zavaristskii in 1831 (46.9° N, Kurils) and Shikotsu in 1667 (42.7° N), were only recently identified by cryptotephra in Greenland ice cores (Gabriel et al., 2025; Hutchison et al., 2025).
For identified eruptions, we use the latitude of the source volcano. For unidentified eruptions, eVolv2k and HolVol attribute a single latitude to events with Greenland-only (≈ 45 or 48° N, respectively in eVolv2k and HolVol), Antarctica only (≈ 45 or 37° S), or bipolar (≈ 0 or 5° N) deposition. In HolVol, volcanic ice-core signals in Greenland of ≥ 10 years durations are attributed to Iceland (64° N). Here we instead scale the eruption latitude with the asymmetry ratio, using the best-fit relationship based on the CMIP7 historical dataset and geochemical matches prior to 1750 (Aubry et al., 2025) (Eq. 1):
where is the asymmetry of the deposit, and are the mass of SO4 deposited in Greenland and Antarctica ice-cores, respectively, and λ is the latitude in degrees N. Applying this formula to the 1831 injection gives a latitude of 44.2° N, which corresponds well to the proposed match to the Zavaritski Caldera, 46.9° N (Hutchison et al., 2025).
When an eruption is identified, we collect its plume height estimate from the literature whenever available. If this height is derived from isopleth maps (i.e. clast size obtained from deposit survey; Carey and Sparks, 1986; Rossi et al., 2019), it is very likely to overestimate the mean SO2 injection height, so we use the empirical correction of Engwell et al. (2023) (Eq. 2):
with corresponding to the SO2 injection height and Hiso to the height estimated from isopleths, both expressed in km above vent level. In the vast majority of cases, the injection height is unknown. We choose to scale the injection height on the default mass of SO2 (M) listed in our VSSI datasets, following the relationship used in the CMIP7 historical dataset (Aubry et al., 2025) (Eq. 3):
The scaling factor and exponent were determined over a compilation of satellite era eruptions and HolVol and eVolv2k eruptions with geochemical matches, as well as geological data, to constrain plume heights of ice-core events.
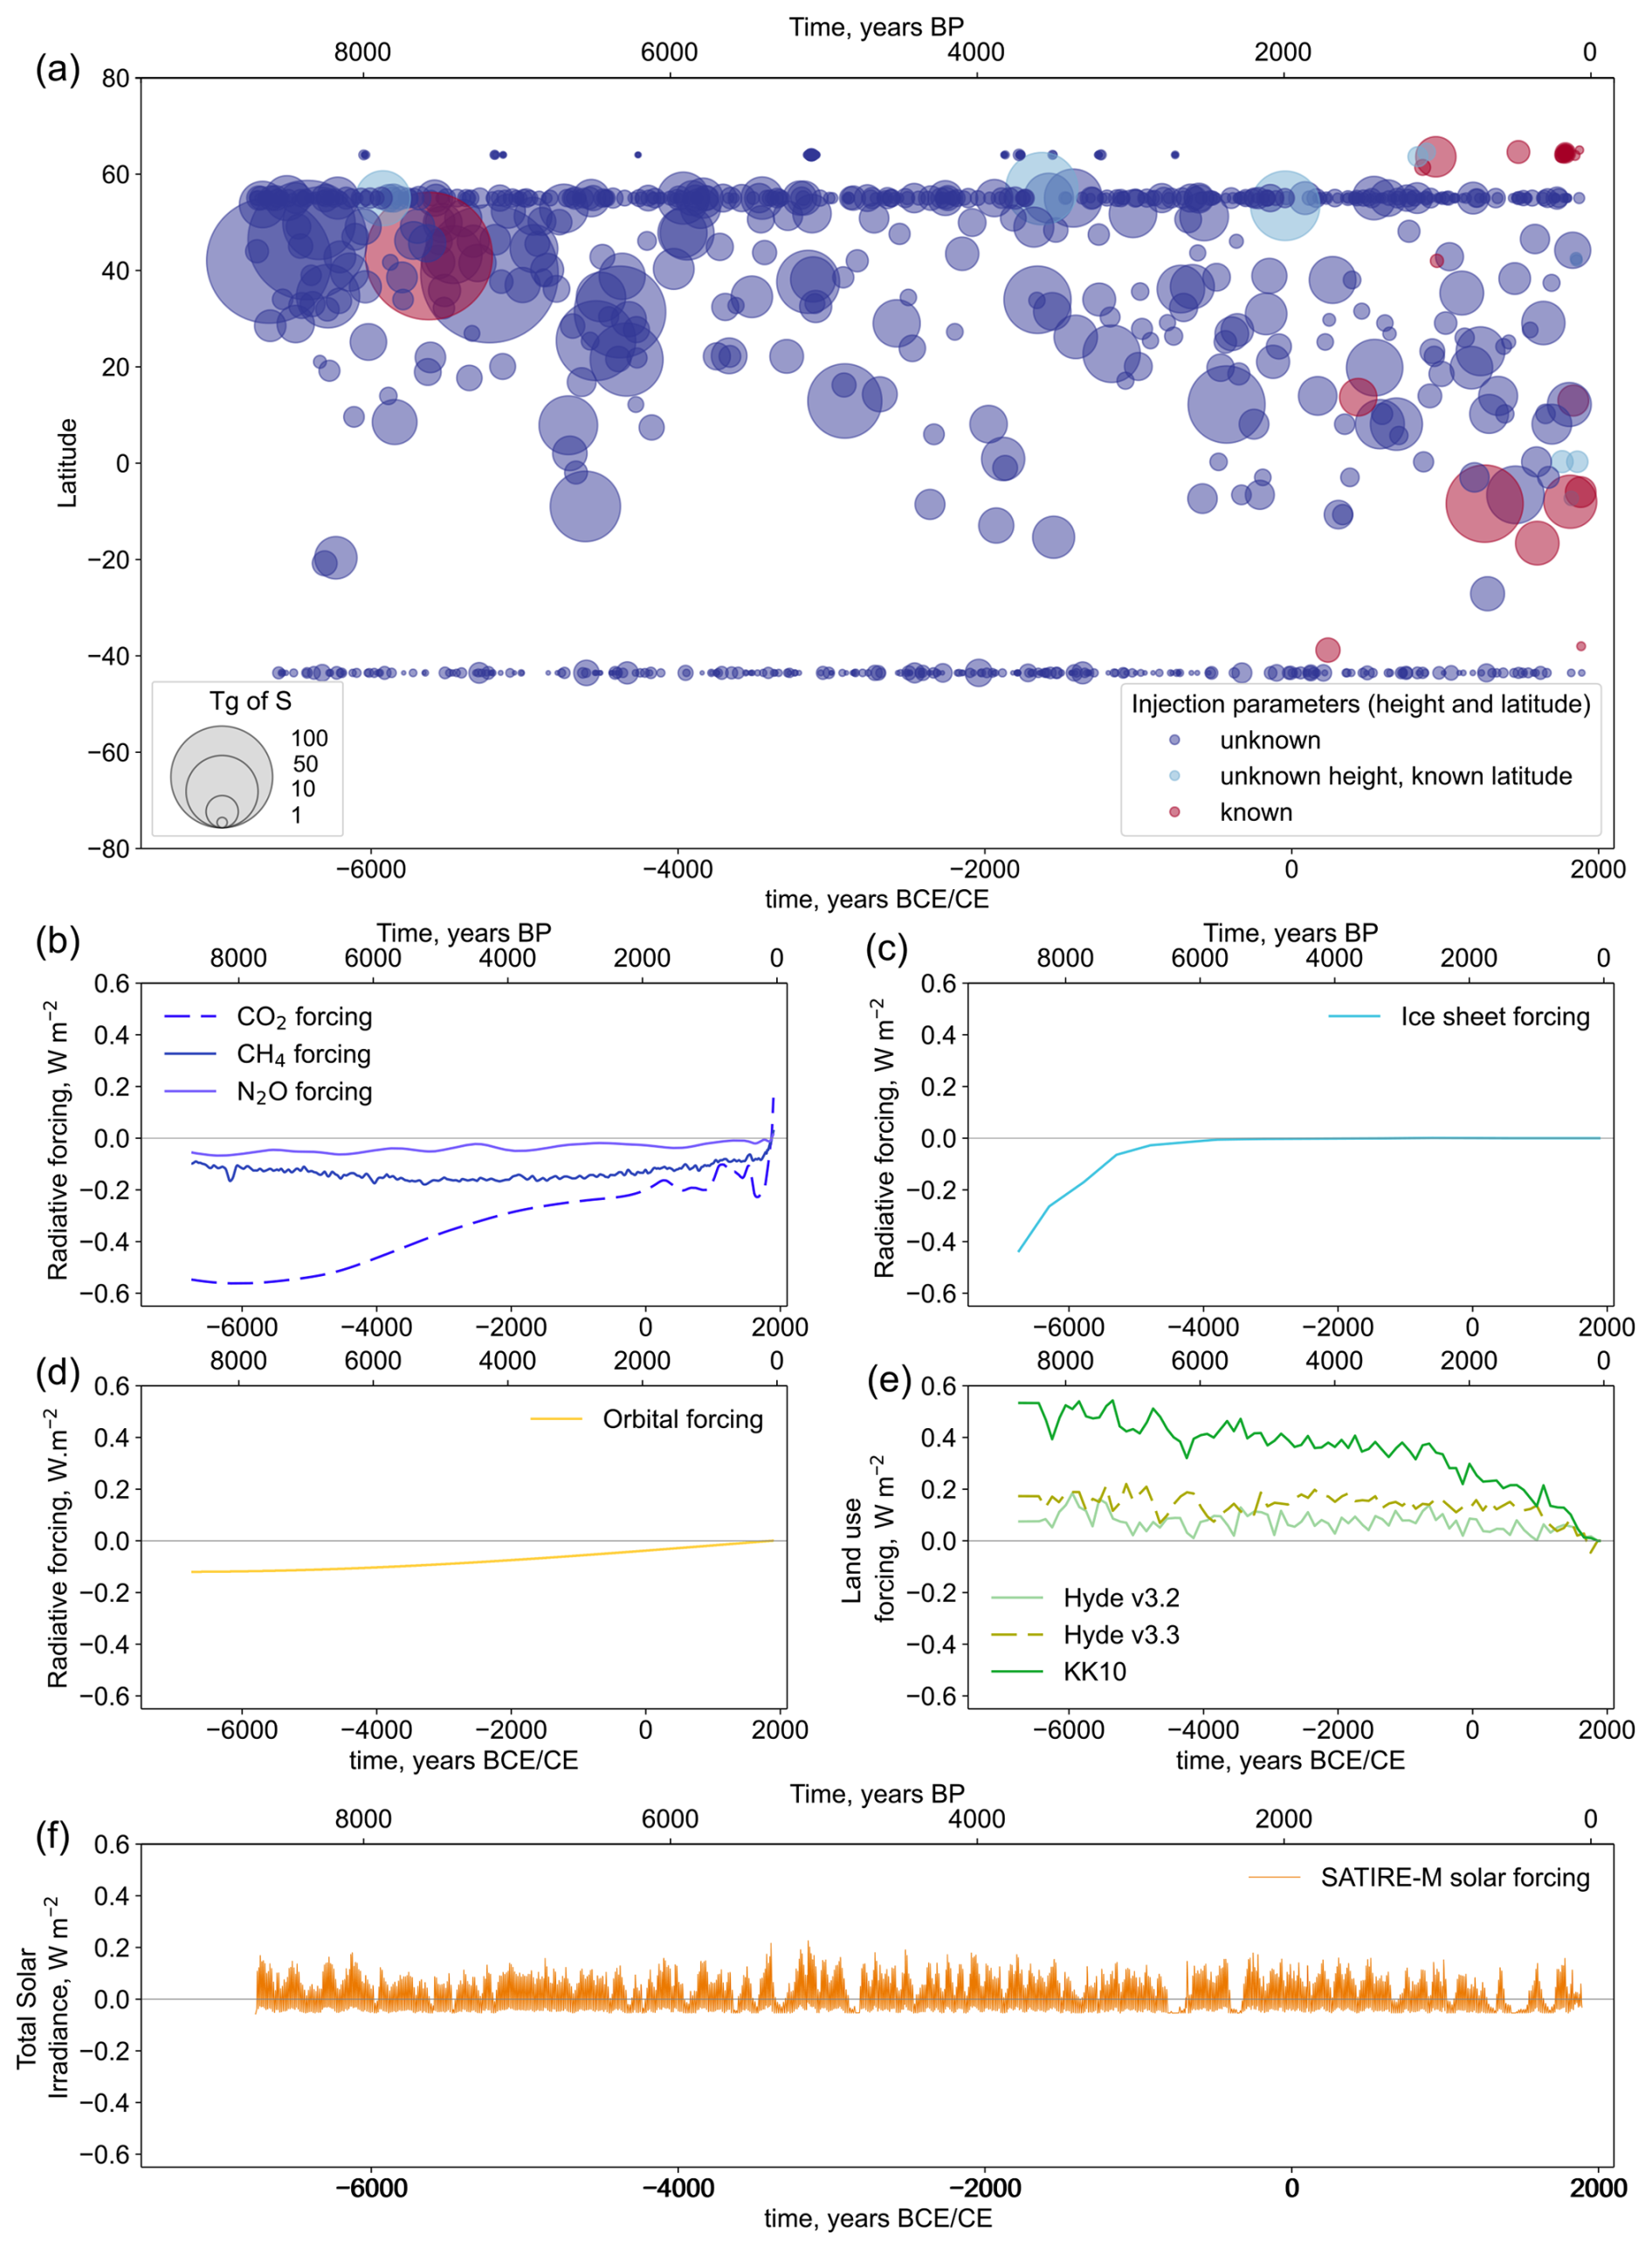
Figure 1Forcings used in our study: (a) spatiotemporal distribution of volcanic stratospheric sulfur injections, where injection heights are constrained from isopleth maps for most of the eruptions for which we have data (Table S1); (b) greenhouse gas forcing (CH4, N2O, CO2); (c) net ice sheet forcing; (d) orbital forcing; (e) land-use forcing; and (f) solar forcing. All the forcings are global forcing at the top of the atmosphere, expressed with respect to the 1860–1880 mean forcing.
Figure 1a provides an overview of the final volcanic SO2 emission parameters we used (a detailed table of our volcanic emission parameters is available from https://doi.org/10.5281/zenodo.14170014, Verkerk et al., 2024) after application of the above methods.
In addition to this 6755 BCE–1900 CE volcanic emission dataset, we also use the CMIP7 volcanic emission dataset (v2.2.1, Aubry et al., 2025) to construct an ensemble for the period 1850–2021 CE. For consistency with our pre-historical emission dataset, we exclude CMIP7 small-magnitude eruptions constrained from the Smithsonian Global Volcanism Programme database or from the high-resolution Greenland ice-core Fang et al. (2023) dataset. The eVolv2k dataset provides emissions for the period 1850–1900; emissions between 1901 and 1978 come from the bipolar ice-core record of Sigl et al. (2015). Between 1979 and 2021, we use the satellite record MSVOLSO2L4 (Carn, 2024). For unidentified eruptions or when the injection height is unknown, we apply the same principles as for the 6755 BCE–1900 CE emission dataset.
2.2 Other forcings
2.2.1 Greenhouse gases
To prescribe the concentrations of major greenhouse gases (GHGs), we use the Köhler et al. (2017) database of CH4, CO2, and N2O atmospheric concentrations derived from ice-core records. Although concentrations are provided at an annual time step in Köhler et al. (2017), the mean resolution for CO2 concentration measurements is coarser (e.g. 93 years between 7045 BCE and 136 CE). Figure 1b shows the radiative forcing resulting from GHG concentration changes, as calculated by FaIR (Sect. 3.3).
2.2.2 Forcing due to ice sheets
The albedo forcing and the longwave radiative forcing due to orographic changes following the retreat of ice sheets (Planck emissivity effect) have been calculated from transient Holocene simulations with the HadCM3-M2.1d climate model (Hopcroft et al., 2023). These simulations used the ICE-6G_C (VM5a) reconstruction of ice sheets and sea level (Argus et al., 2014; Peltier et al., 2015) (Fig. 1c).
2.2.3 Orbital forcing
Variations of the Earth's orbital parameters are a driver of climate changes, with successive ice ages being driven by precession, obliquity and eccentricity (Hays et al., 1976). Here we use the radiative forcing resulting from changes in the orbit as calculated by Hopcroft et al. (2023) (Fig. 1d). They simulate the incoming solar radiation at the top of the atmosphere using HadCM3-M2.1d based on changes in the orbit from Berger (1978). As we use a reduced-complexity climate model, we require only a global annual mean forcing, calculated as the annual average of the monthly shortwave top-of-atmosphere incoming radiation multiplied by (1−ap), with ap the preindustrial monthly planetary albedo. However, orbital forcing has strong latitudinal and seasonal dependences, both of which our model cannot capture.
2.2.4 Anthropogenic land-use forcing
We account for anthropogenic land-use forcing using three different reconstructions (Fig. 1e): HYDE 3.2 (Klein Goldewijk et al., 2017); its update, HYDE 3.3, that includes archaeological assessments from ArchaeoGLOBE Project (2019) and radiocarbon dates for Eurasia from the Landcover6K project (Landcover6K working group, 2025); and the KK10 dataset (Kaplan et al., 2011). HYDE 3.2 may underestimate the land use outside of Europe, while KK10 may be too intense outside of Europe, based on comparison to pollen-inferred land cover and archaeological data (ArchaeoGLOBE Project, 2019; Hopcroft et al., 2023). As HYDE 3.3 presents an intermediate forcing and is the most recent, we use it as our default land-use forcing, but we test the sensitivity of our results to the choice of land-use forcing reconstructions (Sect. 5.2 and 5.3).
2.2.5 Solar forcing
We use the SATIRE-M dataset of total irradiance (Wu et al., 2018) which provides a time series for 6755 BCE–present with an annual resolution (Fig. 1f). They use a solar surface model to invert the solar irradiance from sunspot observations (after 1600) or cosmogenic isotope measurement (14C and 10Be, before 1600).
2.2.6 Anthropogenic aerosols and ozone forcings
From 1750 CE onwards, we include the influence of anthropogenic forcings, which, in addition to the greenhouse gases and land-use change already considered over the Holocene period, includes aerosols and ozone. The simulations estimating these two forcings are performed by running the FaIR model with emissions of short-lived forcers (i.e. aerosol and ozone precursors), as well as greenhouse gas emissions from the RCMIP project (Nicholls et al., 2020, version 5.1.0, Nicholls and Lewis, 2021). Before 1750 CE, these forcings are set to their 1750 CE value; i.e. we consider that there is no change in anthropogenic forcing.
2.2.7 Forcings for the 1850–2021 CE ensemble
For the simulations covering exclusively the historical period, we include a larger range of anthropogenic forcings. These include short-lived climate forcers (seven species, e.g. black carbon, carbon monoxide); halogen gases (18 species, e.g. chlorofluorocarbons); fluorinated greenhouse gases (23 species, e.g. Hydrofluorocarbons); CO2, N2O, and CH4 emissions; and solar and land-use forcings. All these forcing estimates come from the RCMIP datasets for CMIP6 forcings and emissions (Nicholls et al., 2020). Ozone and anthropogenic aerosol forcings are calculated from their precursor emissions.
2.3 Temperature reconstructions and assimilation products
We compare our simulated model temperature to the following proxy reconstructions and data assimilation products:
-
The Last Glacial Maximum Reanalysis (LGMR) provides spatially resolved surface temperature globally for the past 24 000 years with a 200-year time step (Osman et al., 2021a). The LGMR was produced by assimilating proxies for sea surface temperature (e.g. δ18O of foraminifera into simulations from iCESM1.2 and iCESM1.3; Brady et al., 2019).
-
The Holocene data assimilation of Erb et al. (2022a) of 711 proxy records from the Temperature 12k proxy database (Kaufman et al., 2020) includes both oceanic and terrestrial records (e.g. δ18O, pollen). Two climate models are used as model prior: a HadCM3 simulation of the past 23 ka and the TraCE-21k simulation, with a decadal resolution. The prior climate state is updated, with the proxy data following a similar approach as in the LGMR.
-
The PAGES 2k reconstruction (PAGES 2k Consortium, 2019) is a GMST reconstruction for the last two millennia. It is based on the PAGES 2k multiproxy dataset (PAGES 2k Consortium, 2017), which includes both marine and continental records (e.g. geochemistry of marine and lake sediments, tree rings).
-
The King et al. (2021a) May to August Northern Hemisphere extratropical (30–90° N) (NH MJJA) temperature reconstruction covering the period 750–2011 CE. They assimilate 54 tree-ring records into 10 different model priors.
-
Four tree-ring-based reconstructions of the mid-latitudinal Northern Hemisphere summer: NTREND2015 (Wilson et al., 2016a), Büntgen2021 (Büntgen et al., 2021), Guillet2017 (Guillet et al., 2017a), and Schneider2015 (Schneider et al., 2015a). These reconstructions were calibrated to represent land-only temperatures between 40 and 75° N.
The main limitations of data assimilation products are the use of a limited number of climate model priors that do not consider volcanic forcing (LGMR, Holocene data assimilation and PAGES 2k) or utilise outdated volcanic forcing reconstructions (King et al., 2021a) and both biases linked to the proxy records (e.g. seasonal and spatial sampling) and to the model simulations propagate to reconstructions. For some global temperature reconstructions (Erb et al., 2022a; Kaufman et al., 2020; PAGES 2k Consortium, 2019), mid-latitude Northern Hemisphere records dominate the datasets, time resolution of records varies depending on the proxy (e.g. from annual to millennial resolution), and the seasonality recorded by the proxies can also lead to a mean response with a reduced interannual variability (Anchukaitis and Smerdon, 2022) or longer-term biases (e.g. Essell et al., 2024).
2.4 Model simulations
We also compare our simulations to the following model simulations:
-
TraCE-21k-II (He and Clark, 2022), a simulation of the global temperature over the last 21 000 years with a 10-year time step, performed with a coupled atmosphere–ocean general circulation model (CCSM3; Yeager et al., 2006). TraCE simulation is forced by greenhouse gases, fresh water forcing before ∼ 14.7 ka, and orbital and ice sheet variations.
-
The Holocene simulation with MPI-ESM1.2 from van Dijk et al. (2024) includes their “all forcing” simulation, which provides the temperature for the period 6000 BCE–1850 CE, forced by GHG concentrations, orbital changes, land use, stratospheric ozone, and solar and volcanic forcing.
-
UKESM1 simulations of GMST and 40–75° N land-only summer (MJJA) temperature from Marshall et al. (2025) between 1250 and 1849 CE and their comparison with five other simulations that ran the PMIP4 last millennium experiment. Simulations were performed using SO2-emission-driven models (UKESM1, CESM2(WACCM6ma) and MRI-ESM2) or models driven by aerosol optical properties (MIROC-ES2L, MPI-ESM1-2-LR, and IPSL-CM6A-LR). They used the SO2 emissions provided in the eVolv2k dataset, and aerosol optical properties are derived from eVolv2k using the reduced-complexity aerosol model EVA.
-
Reduced-complexity climate model simulations of the 885–2000 CE temperature from Lücke et al. (2023) account for solar, greenhouse gases, anthropogenic aerosols (after 1820), and volcanic forcings. The model is calibrated using simulations from the HadCM3 GCM. They perform two calibrations to simulate: (i) global annual mean surface temperature using global annual mean volcanic forcing and (ii) mid-latitudinal Northern Hemisphere summer land surface temperature using NH annual mean volcanic forcing. The second calibration enables more consistent comparison with tree-ring-based temperature reconstructions. Furthermore, they also test sensitivity to volcanic forcing uncertainty by randomly perturbing the mass of SO2 injected and the year and month of eruption within estimated uncertainties. Beyond the different period simulated in our study (6755 BCE–1900 CE instead of 885–2000 CE), key differences between our study and Lücke et al.'s include the following:
-
We use a revised list of identified eruptions (see Sect. 2.1).
-
Instead of EVA, we use EVA_H which accounts for the height of injection (see Sect. 3.1).
-
We use a different reduced-complexity climate model (FaIR, see Sect. 3.3), which was extensively used in CMIP6.
-
We use a different approach to estimate Northern Hemisphere temperature (see Sect. 3.3).
-
We account for uncertainties in VSSI latitude and altitude (unaccounted for in Lücke et al., 2023) but not in injection timing (accounted for in Lücke et al., 2023).
-
We account for uncertainties in aerosol forcing modelling, climate modelling, and internal climate variability (unaccounted for in Lücke et al., 2023) (see Sect. 3.4)
-
2.5 Historical observations
For the historical period (i.e. after 1850), we compare our 1850–2021 CE ensemble to instrumental observations. We use two observation datasets, the 1850–present Berkeley Earth temperature record (Rohde and Hausfather, 2020) and the 1850–2017 Cowtan and Way record (Cowtan and Way, 2014). Both datasets contain monthly temperatures, with a coarser spatial resolution for Cowtan and Way (5° by 5° grid, whereas Berkeley Earth has a spatial resolution of 1° by 1°). The surface temperature is interpolated in region with no station coverage, with Berkeley Earth using a larger number of land stations than Cowtan and Way (around 4 times more). Here, we use the global annual mean from these spatially resolved datasets to compare it to our simulations.
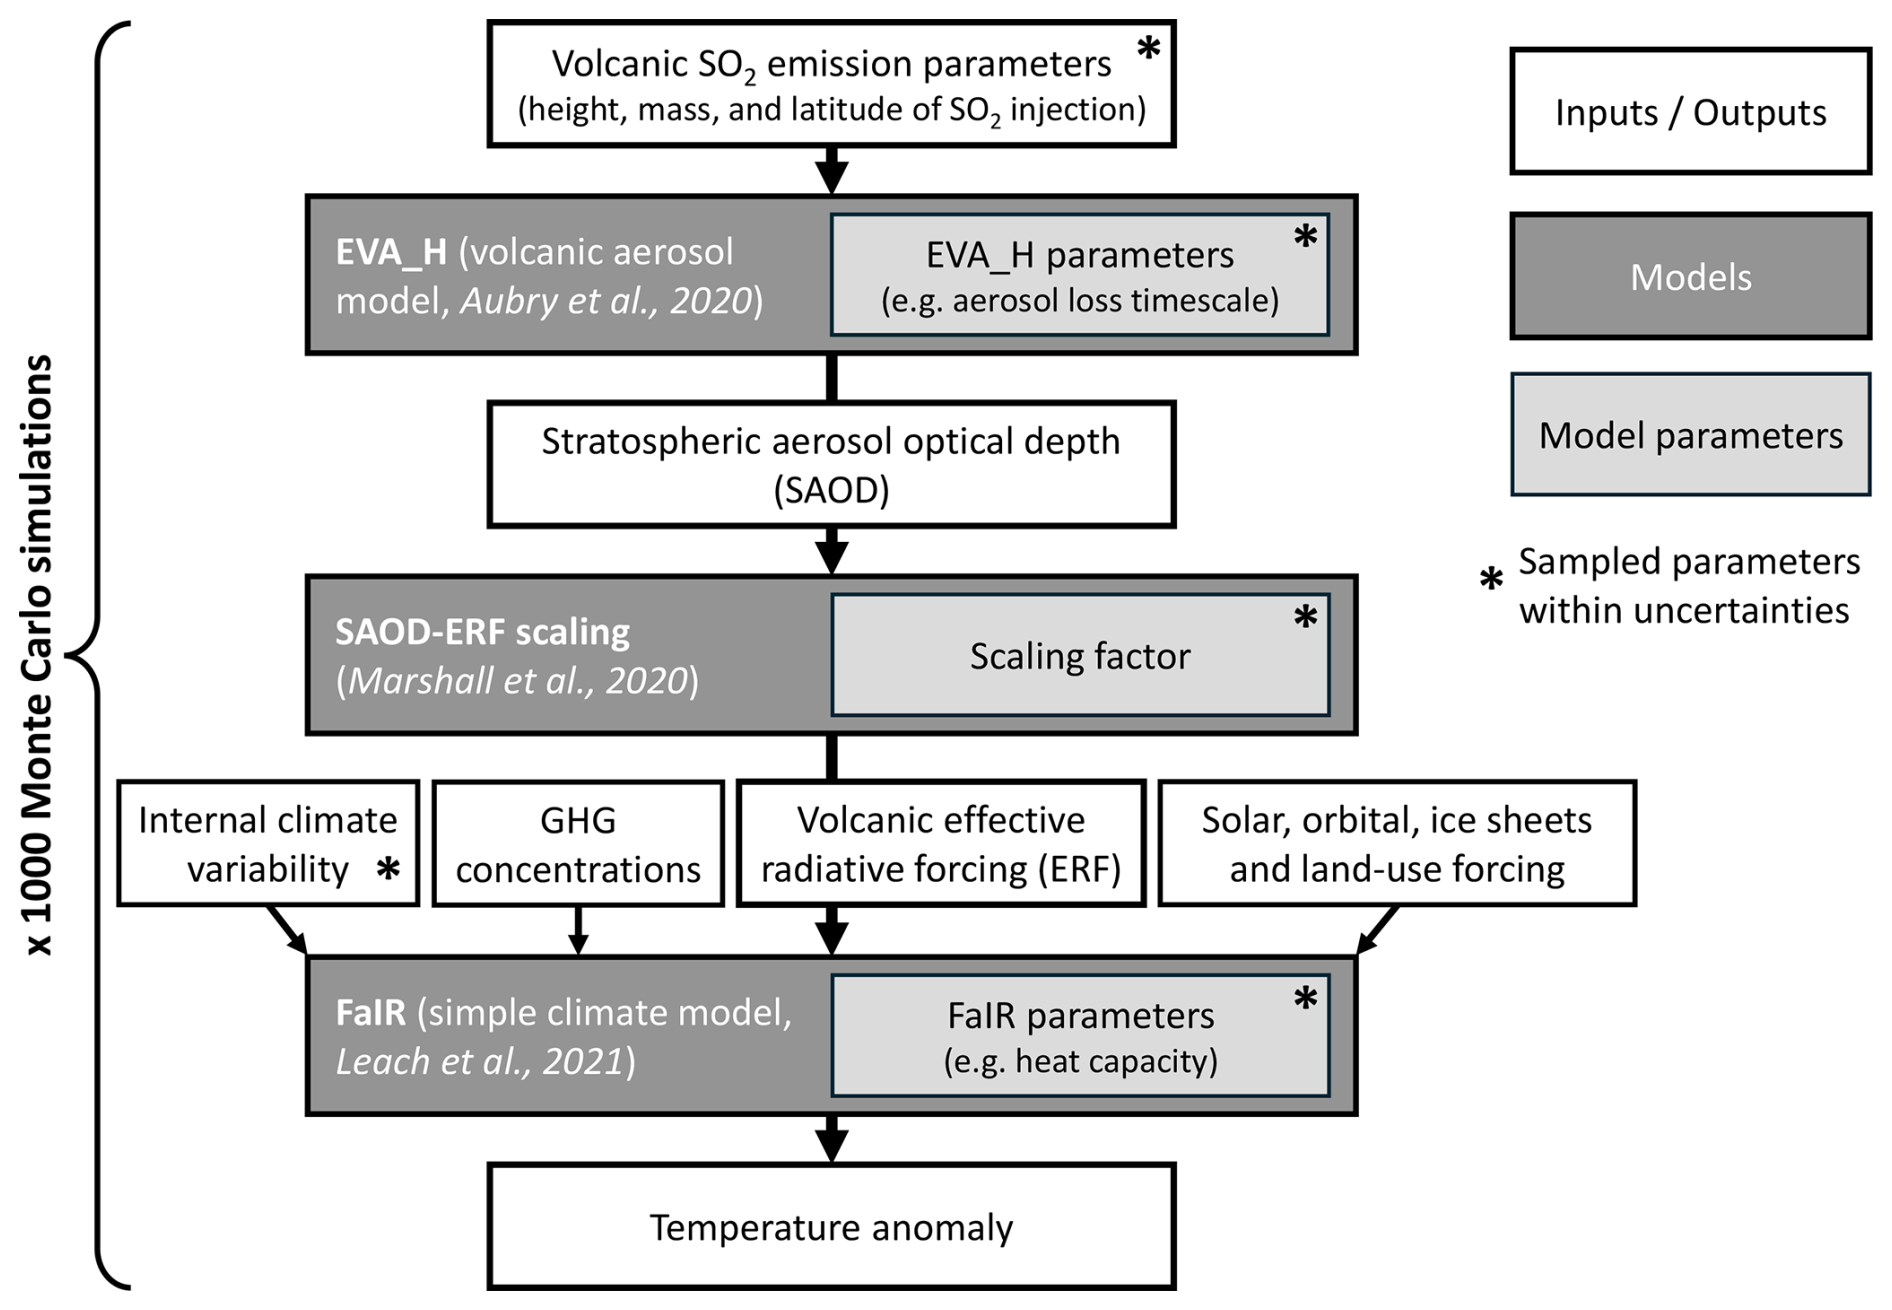
To simulate the 6755 BCE–1900 CE (8705 to 50 BP) surface temperature, we first use the reduced-complexity volcanic aerosol model EVA_H (Sect. 3.1) and a volcanic forcing scaling (Sect. 3.2) to estimate volcanic radiative forcing from our emission dataset (Sect. 2.1). We then input the volcanic forcing and all other forcings (Sect. 2.2) into the reduced-complexity climate model FaIR to simulate temperature evolution (Sect. 3.3). Uncertainties in volcanic emission, aerosol and climate model parameters, and internal variability are propagated using Monte Carlo simulation (Sect. 3.4). Figure 2 illustrates our full modelling workflow.
3.1 Stratospheric volcanic aerosol model: EVA_H
EVA_H is a reduced-complexity stratospheric aerosol model in which the stratosphere is represented by eight boxes corresponding to different vertical and latitudinal regions (Aubry et al., 2020). Volcanic SO2 injections are converted to sulfate aerosols (aerosol production) and transported horizontally (aerosol mixing) and downward (aerosol loss) between boxes. The key inputs are the mass of SO2, the latitude, height, and date of injection, provided by the databases described in Sect. 2.1. The key outputs are 4D (time, wavelength, latitude and altitude) stratospheric aerosol optical properties from which the global-mean stratospheric aerosol optical depth (SAOD) at wavelength 550 nm can be calculated.
In contrast to its predecessor model EVA (Toohey et al., 2016) used in Lücke et al. (2023), EVA_H accounts for the SO2 injection altitude. The injection latitude affects both the latitudinal distribution of SAOD and its global mean in EVA_H, whereas it only affects the former in EVA. Furthermore, EVA was calibrated against the Pinatubo 1991 eruption only, whereas EVA_H was calibrated using the full 1979–2016 satellite observations spanning a large parameter space in terms of volcanic injection magnitude, latitude, and altitude. In addition to a best estimate of EVA_H parameters (e.g. aerosol production, loss, and mixing timescales), an ensemble of 100 parameter sets was provided by repeating the calibration procedure with resampling of the input SO2 injection parameters and target aerosol optical properties within their uncertainties. Given the range of calibration of EVA_H, results should be interpreted cautiously for eruptions much larger than the ∼ 15 Tg of SO2 of the 1991 Pinatubo eruption, the biggest eruption used for calibration. EVA_H also uses the same SO2–sulfate aerosol production timescale for all eruptions, which results in too long an aerosol lifetime for eruptions much smaller than Pinatubo (Vernier et al., 2024). Despite these limitations, this model captures the magnitude of global-mean SAOD perturbations for 1979–2014 reasonably well (RMSE = 3.8 × 10⁻³, compared to a mean SAOD over the period of 0.015), as well as the latitudinal and vertical aerosol distribution, compared to observations from GloSSAC (Figs. 8 and 9, Aubry et al., 2020).
3.2 Volcanic forcing efficiency
To convert the global monthly mean SAOD at 550 nm (gmSAOD) obtained from EVA_H into a global-mean effective radiative forcing (ERF), we use the Marshall et al. (2020) scaling:
with W m−2 and ΔgmSAOD corresponding only to the volcanic contribution of the SAOD. Although the relationship between gmSAOD and ERF varies with the time after eruptions, eruption latitude, and season (Marshall et al., 2020), we use a single relationship as we simulate a sequence of eruptions whose forcing commonly overlap in time. Equation (4) was calibrated using UM-UKCA interactive stratospheric aerosol model simulations covering a large range of SO2 injection mass, latitude, and altitude (Marshall et al., 2020). For the same gmSAOD, Eq. (4) leads to a 20 %–25 % smaller forcing than the one estimated in IPCC AR5 (Myhre et al., 2014; Marshall et al., 2020) but compares well to the linear relationship used in AR6, with a coefficient of −20 ± 5 W m−2 (Forster et al., 2021), whereas previous studies typically used a linear gmSAOD-ERF scaling (e.g. Schmidt et al., 2018; Marshall et al., 2020) and showed that a non-linear relationship better captures the simulated forcing and is more physically consistent.
3.3 Climate model: FaIR
To simulate the GMST of the past 9000 years, we use the FaIR reduced-complexity climate model (v2.1.4), which reproduces the observed temperature of the last 150 years well (Smith et al., 2018; Leach et al., 2021). FaIR is a three-box energy balance model, whose parameters are the heat capacity, the heat exchange coefficient for each box, the climate feedback parameter, and the forcing efficacy, along with parameters describing responses of different forcings to their emissions. In FaIR, we consider a forcing efficacy for stratospheric aerosols of 1 ± 0.15, but we note that Günther et al. (2022) suggested an efficacy of 0.7 at decadal timescales. We force FaIR using GHGs, ice sheets, land use, orbital, solar, and volcanic forcing (Sect. 2.1 and 2.2) and, from 1750 CE onwards, anthropogenic aerosol and ozone forcings that become relevant from the start of the Industrial Era. FaIR also includes the internal variability with the addition of a stochastic term that is derived from the autocorrelation of the variability around the forced climate response that is calibrated on abrupt-4xCO2 simulations from CMIP6 models (Cummins et al., 2020; Smith et al., 2024), therefore simulating the projection of large-scale modes of variability such as ENSO onto global-mean surface temperature. FaIR is calibrated following three steps (Smith et al., 2024): (i) calibration of the model parameters against a range of CMIP6 experiments (e.g. 4 × CO2 experiments) for up to 49 CMIP6 models depending on component; (ii) sampling of 45 parameters within the distributions of values informed by the calibrations determined in (i), generating a 1.6 million-member prior ensemble; and (iii) constraining the different calibrations obtained in (ii), deriving a final posterior of 1000 ensemble members by comparing them to historical observations for 1850–2022 and constraining key climate metrics (e.g. equilibrium climate sensitivity) to the range of values from IPCC AR6. Here we use calibration version 1.4.2, which is based on CMIP6 historical emissions. As FaIR is calibrated for an equilibrium climate corresponding to 1750 forcings and our simulations start in 6755 BCE, we spin up the model for 1000 years with fixed forcing and concentrations corresponding to their values in 6755 BCE.
Conversion of global annual mean temperature in a NH MJJA temperature
The King et al. (2021a) reconstruction gives a time series of the NH extratropical summer (NH MJJA) temperature. The four other tree-ring reconstructions and simulations from Marshall et al. (2025) and Lücke et al. (2023) estimate 40–75° N land-only MJJA temperatures. To compare our model outputs to these reconstructions and simulations, we scale the FaIR-simulated GMST into a NH MJJA land-only temperature. We obtain a scaling factor of 1.32 from a linear regression of these two temperature metrics from the 1850–2017 Cowtan and Way (2014) dataset (R2=0.75). This approach is simplistic and could be affected by several biases. First, anthropogenic aerosol cooling during the second half of the 20th over the NH affects the regression. Performing the regression only on the period 1850–1950 leads to a decrease of the slope coefficient by 15 % (21 % for a regression over 1850–1900) (Fig. S1). Second, the 1850–2017 period only contains two eruptions injecting more than 15 Tg SO2. Furthermore, the relationship between NH MJJA and global annual temperature anomalies could differ in the aftermath of large eruptions. To test whether this could affect the scaling factor used, we estimate the relationship between GMST and NH MJJA land-only in six 1250–1850 ESM simulation ensembles from Marshall et al. (2025). This time period contains 16 eruptions injecting more than 15 Tg SO2. For each climate model, we calculate the scaling factors separately for the 5 years following each eruption injecting more than 15 Tg SO2 and for other years. The resulting factors range between 1.19 and 1.72 for years following large eruptions and 0.99 to 1.52 for other years (Table S2). Key results presented and discussed later in the paper are robust to using these model-derived values, including those derived from years following large eruptions, instead of the 1.32 used by default and derived from the 1850–2017 observational record (Fig. S2).
3.4 Resampling strategy for volcanic injection and model parameters
To propagate volcanic injection uncertainties and modelling uncertainties, we produce an ensemble of 1000 simulations over the period 6755 BCE–1900 CE, where injection and model parameters are resampled simultaneously using a Monte Carlo approach (Fig. 2). Although we do not resample uncertainties on forcings other than volcanic forcing, we produced one 1000-ensemble for each of the land-use datasets considered (Sect. 2.2).
For volcanic injection parameters, we resample the mass, latitude and altitude of injection within their uncertainties, assuming Gaussian distributions. Uncertainties on the SO2 mass are found in the VSSI datasets. For unidentified eruptions, we choose an uncertainty of 20° on the estimated latitude (Sect. 2.1). Regarding the injection height, if it is known for an identified eruption, we use a 1σ uncertainty of 25 % of this height. For unidentified eruptions, we use a 1σ uncertainty of 33 % of our estimated height (see Sect. 2.1). For EVA_H, we sample one of the 100 optimal parameter sets provided by Aubry et al. (2020). For the SAOD-ERF scaling factor (Sect. 3.2), α is resampled within its uncertainty for each run. In a run, the same factor is used for every eruption. For FaIR, we sample one of the 1000 parameter sets provided by Smith et al. (2024) (Sect. 3.3). We then apply the same methods to construct a 1000-member ensemble of simulations covering the 1850–2021 CE period. Overall, our design thus propagates uncertainty on (i) volcanic injection parameters, (ii) volcanic aerosol forcing modelling, (iii) climate sensitivity and uncertainty, and (iv) internal climate variability.
4.1 Volcanic SAOD and forcing
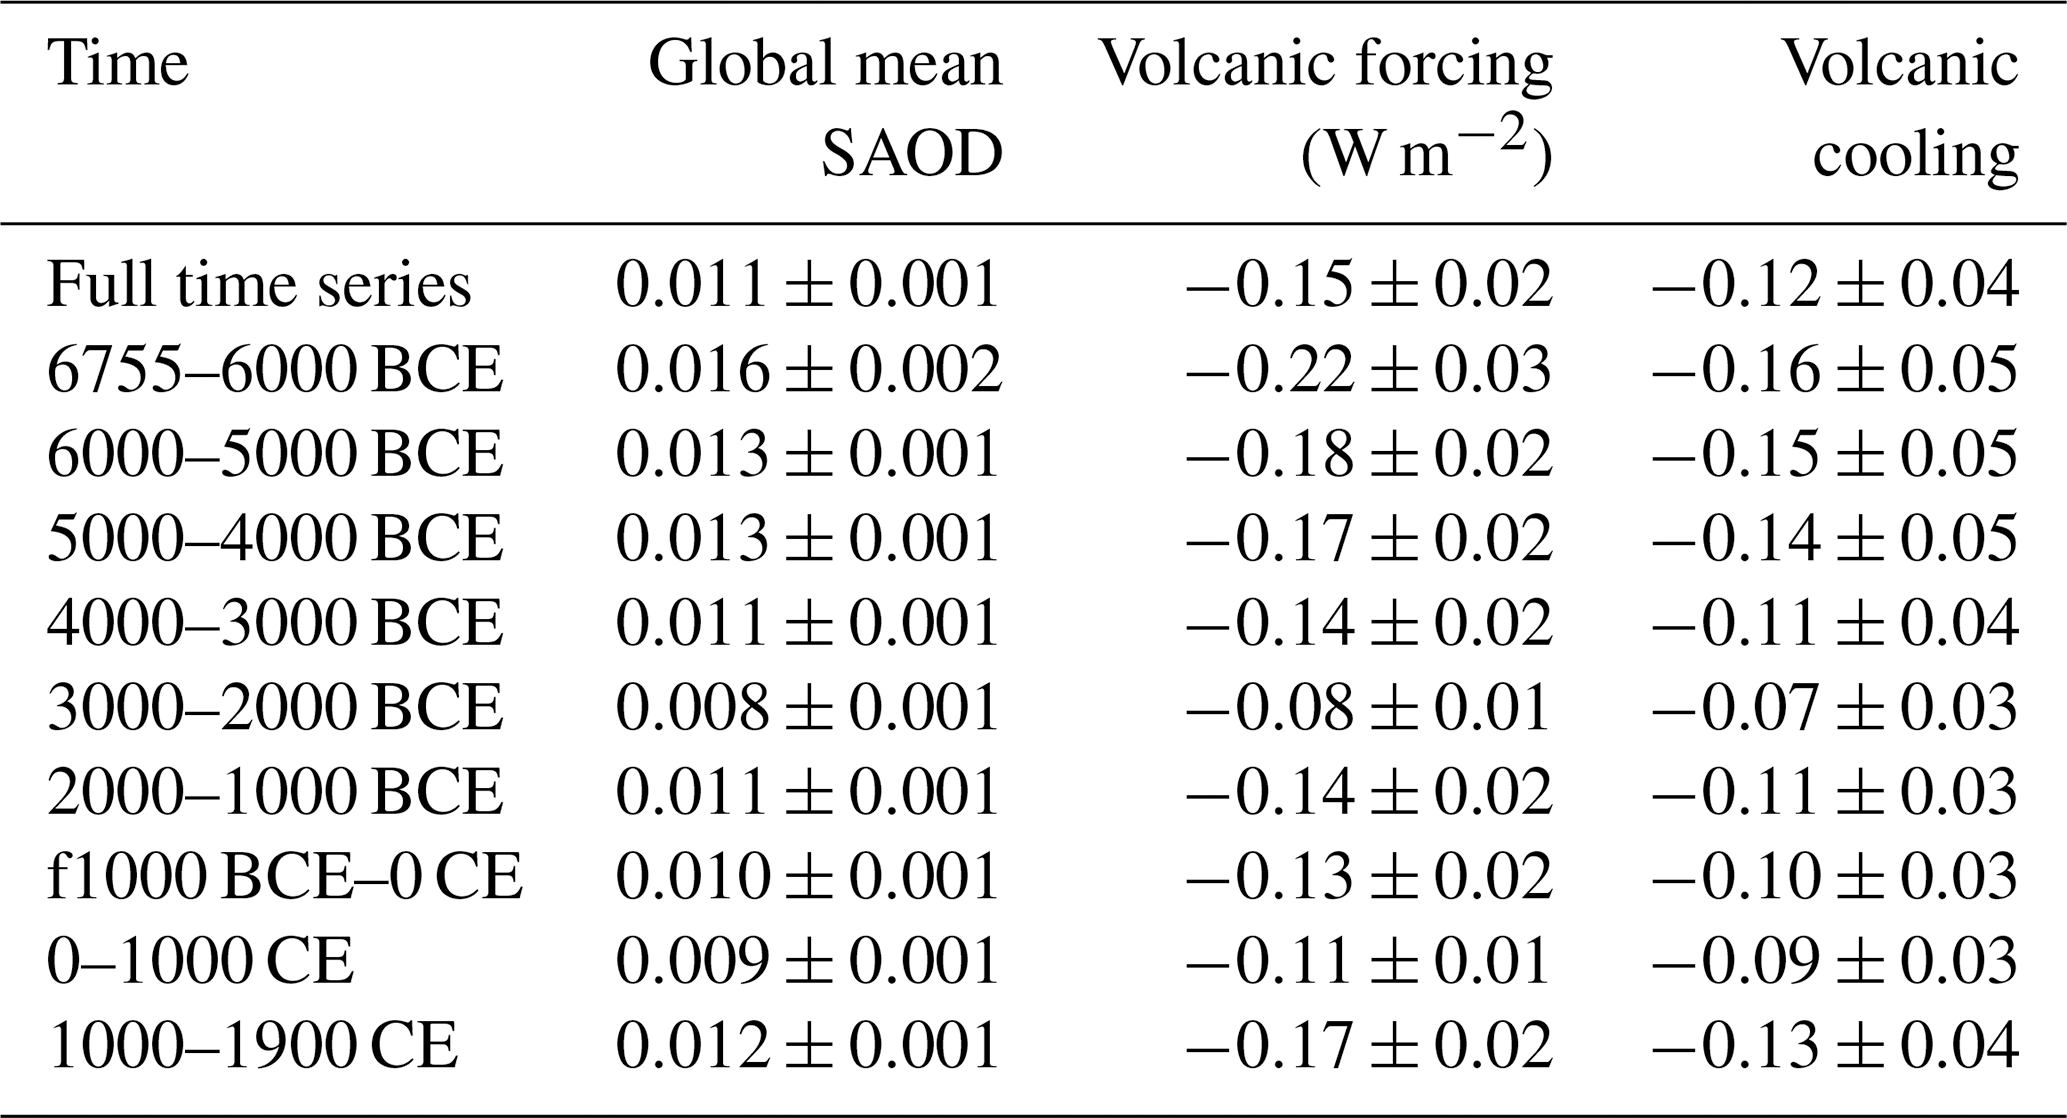
Figure 3a–b show our simulated gmSAOD and ERF, characterised by large changes following volcanic eruptions. The 6755 BCE–1900 CE mean gmSAOD and ERF are 0.011 ± 0.001 and −0.15 ± 0.02 W m−2, respectively (all uncertainties expressed as 1σ) (Table 1), with maximum monthly values of 0.8 ± 0.2 and −11 ± 2 W m−2 reached after the 5229 BCE (7179 BP) eruption (for comparison, we obtain a gmSAOD of 0.41 ± 0.08 and an ERF of −6.8 ± 1.1 W m−2 for the 1257 Samalas eruption). However, governed by individual eruptions, volcanic forcings exhibit clear long-term variability (Table 1). Millennial forcing averages vary by a factor 2, with a minimum for the third millennium BCE (0.008 mean gmSAOD, −0.08 W m−2 mean ERF) and a maximum for the 6th millennium BCE (0.013 mean gmSAOD, −0.18 W m−2 mean ERF), which contains the two largest eruptions since 6000 BCE (8000 BP).

Figure 3(a) Global-mean SAOD between 6755 BCE and 1900 CE; (b) corresponding global-mean effective radiative forcing; and (c) SAOD for a selected 50-year period (1780–1830 CE), with the global mean shown in panel (d).
Table 1Average global-mean SAOD, volcanic forcing, and volcanic cooling over different periods. The volcanic cooling is estimated simulations forced only with volcanic forcing.
Volcanic injections with known eruption match, and thus better constrained latitude and altitude, have smaller forcing uncertainties; e.g. the relative uncertainty on the peak gmSAOD following the Tambora 1815 CE eruption is 18 %, whereas it is 27 % for the unidentified eruption in 1809 (Fig. 3d). Figure 3c illustrates that the SAOD perturbation is largely confined to a single hemisphere for extra-tropical eruptions (e.g. Laki 1783–1784 CE) but not for tropical eruptions (e.g. Tambora 1815 CE). Furthermore, with EVA_H accounting for the effect of injection latitude and altitude, the magnitude of the gmSAOD perturbation is smaller for lower altitude and higher latitude injections. For example, whereas Laki 1783–1784 CE (42 Tg SO2, 64° N, 9–18 km) injects 26 % less SO2 than Tambora 1815 (56 Tg SO2, 8° N, 30 km), the 3-year mean gmSAOD perturbation after the eruption is 70 % smaller (Fig. 3d).
4.2 Surface temperature
Our simulated GMST has an overall warming trend with superimposed annual–millennial-scale variability (Fig. 4a). Figure 4b shows the contribution of different forcings to the simulated temperature, and the following subsections specifically discuss the simulated millennial-, centennial-, and decadal-scale variability and how it compares to available reconstructions.
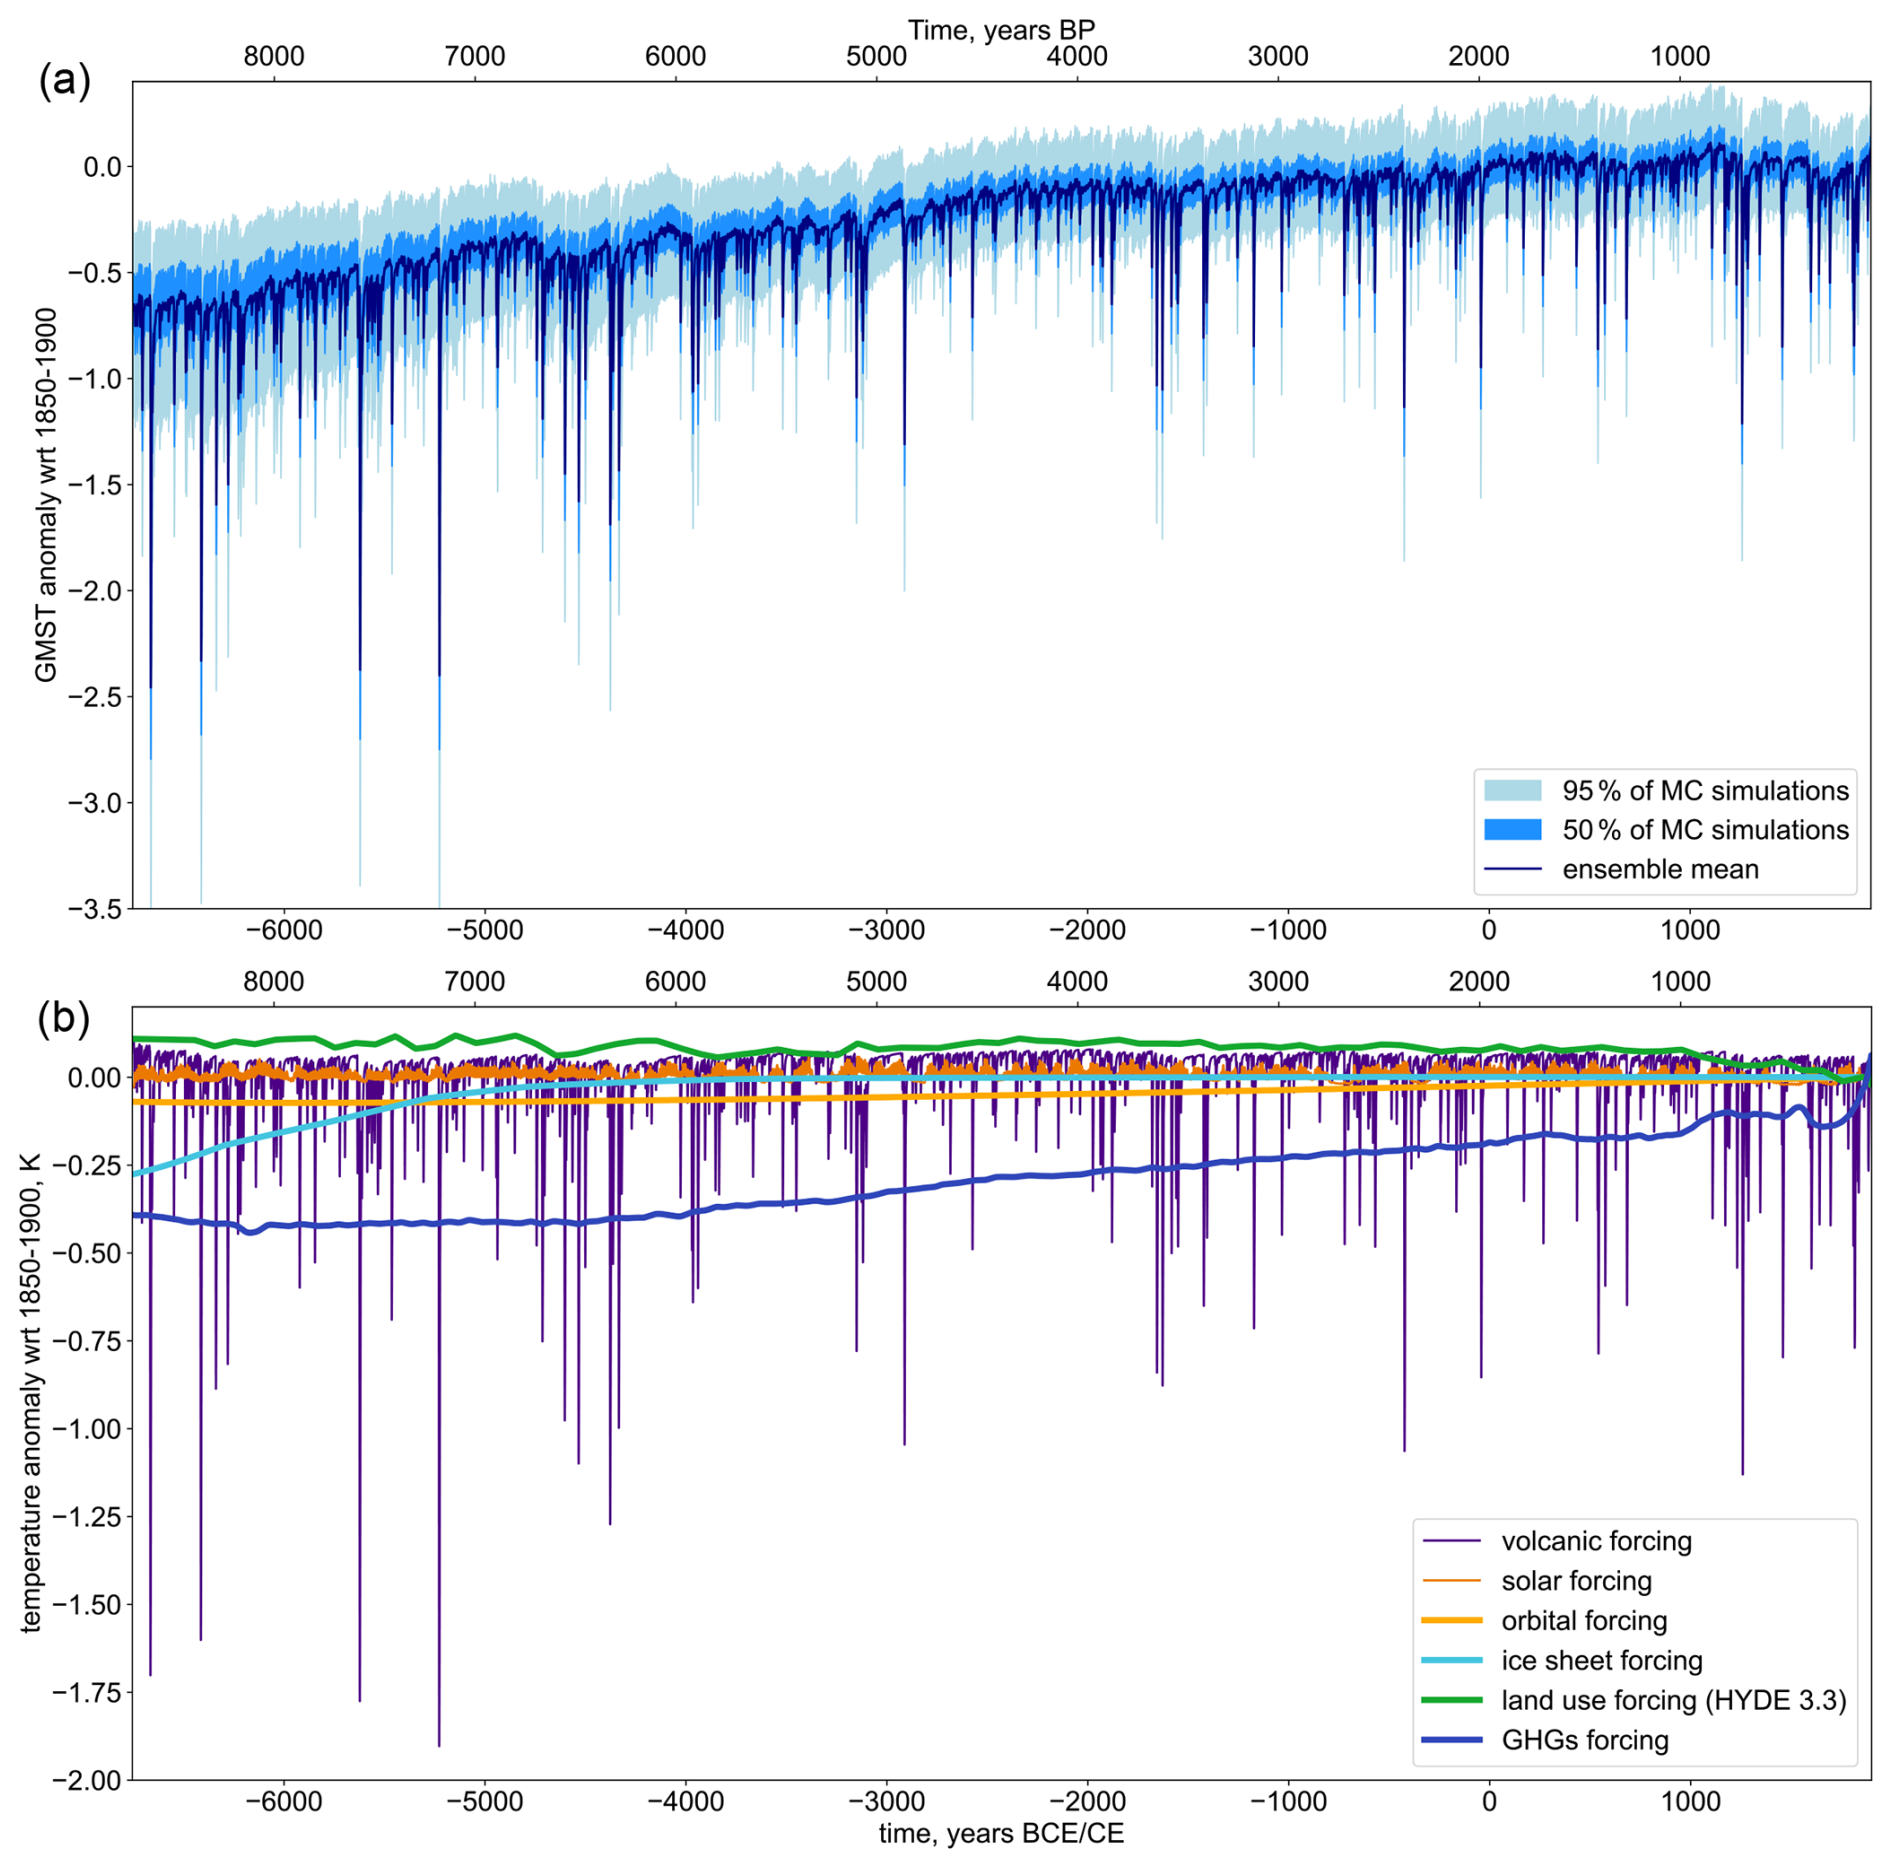
Figure 4(a) GMST from the full simulation ensemble (Sect. 3), expressed as an anomaly with respect to 1850–1900 CE and (b) simulated GMST with only one set of forcing varying, and all other ones set to their 6755 BCE value. FaIR is run using a single set of model parameters. The volcanic forcing corresponds to the 1000-member ensemble mean ERF.
The volcanic forcing results in a cooling with a strong interannual variability. We have a mean annual cooling of 0.12 ± 0.04 K over the period 6755 BCE–1900 CE. The maximum volcanic cooling is 2.1 ± 0.5 K following the 5229 BCE eruption (for comparison, for the 1257 Samalas eruption, we obtain a peak cooling of 1.3 ± 0.3 K).
4.2.1 Millennial-scale variability
Our simulations, the TraCE 21k simulations, the MPI-ESM1.2 simulation, and the LGMR reconstruction show a warming throughout the past 8500 years, with a trend of 0.08 ± 0.03, +0.09, +0.05, and +0.06 ± 0.04 K kyr−1, respectively (Fig. 5). In contrast, the Holocene data assimilation only exhibits a warming trend over 6600–4200 BCE (+0.15 ± 0.02 K kyr−1), which is then followed by a small cooling trend (−0.02 ± 0.01 K kyr−1). The multimillennial trend in our simulations is linked to the response to GHGs (around +0.4 K between 6755 BCE and preindustrial temperature), ice sheets (+0.4 K), orbital (+0.1 K), and land-use (−0.1 K) forcings. At a millennial scale, the mean volcanic cooling is 0.12 K, the same order of magnitude as the GHG-induced warming. Volcanic cooling averaged over a millennium can vary by a factor 2, with a maximum cooling during the 6th millennium BCE (0.15 K) and a minimum cooling during the 3rd millennium BCE (0.07 K) (Table 1).
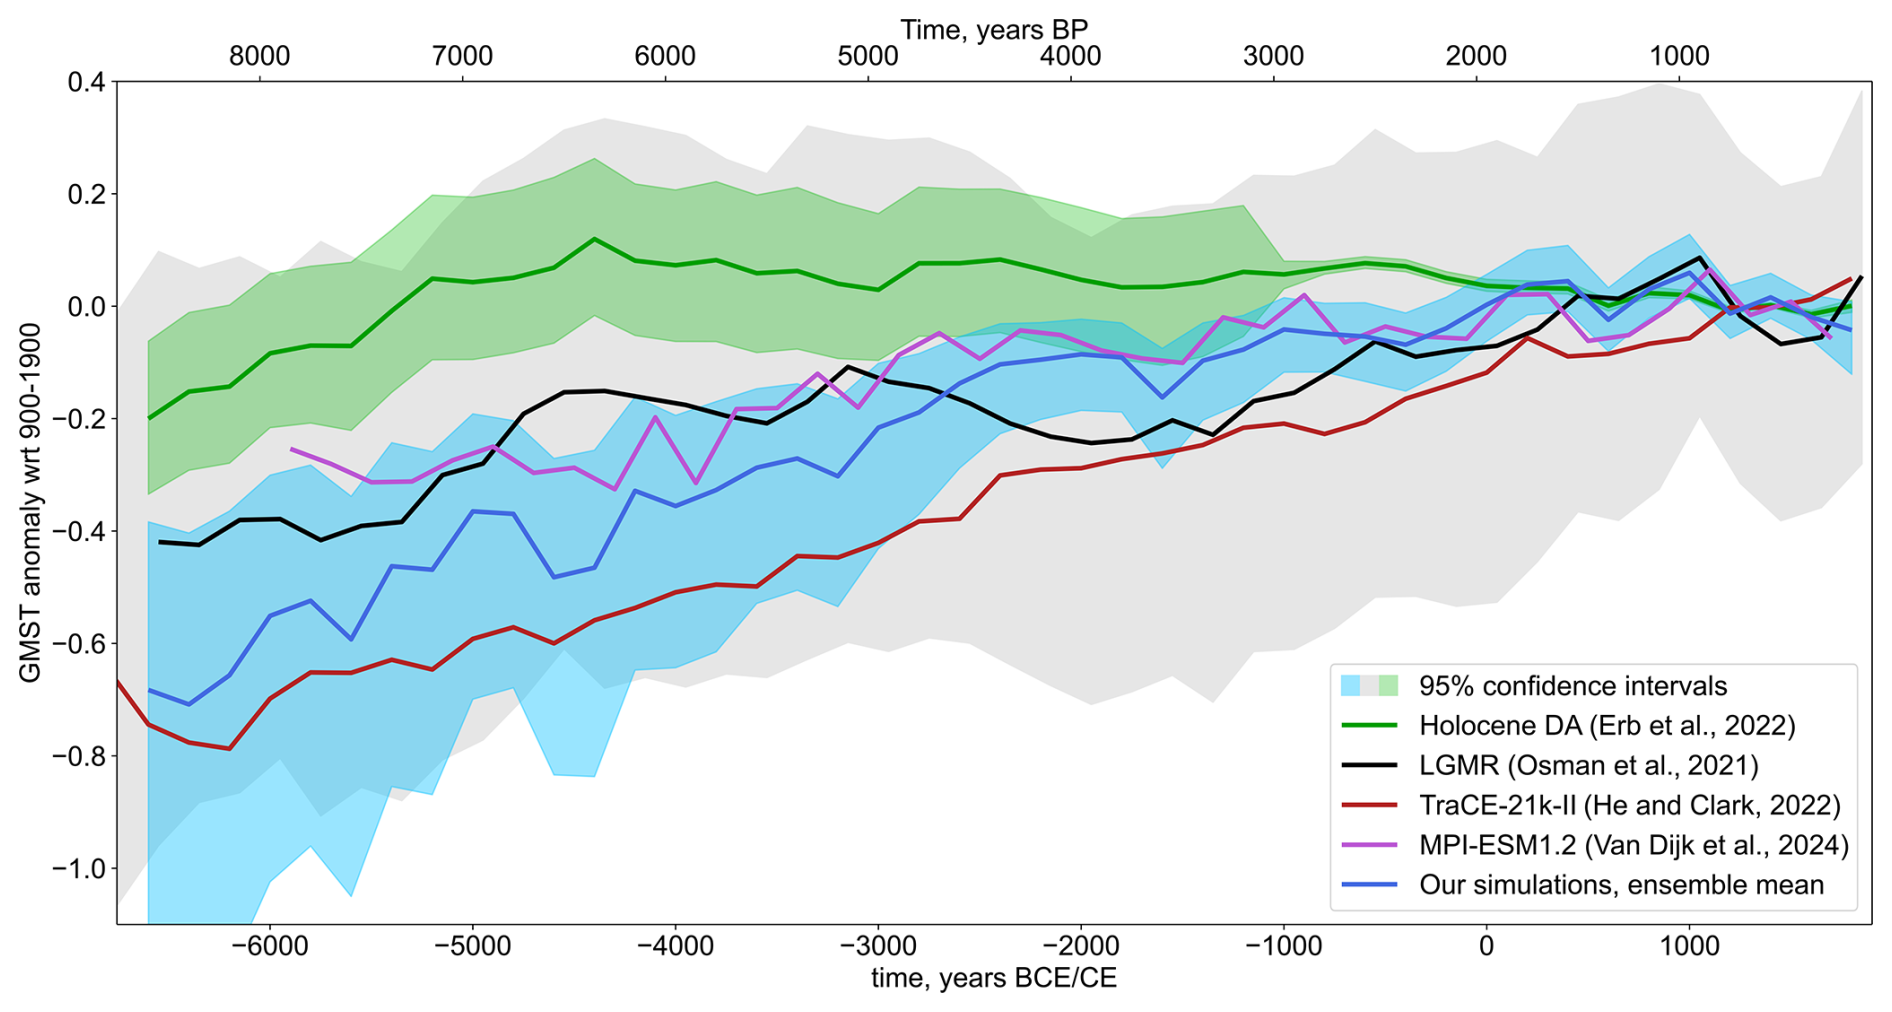
Figure 5Comparison of our simulated 200-year-smoothed temperatures to the LGMR (Osman et al., 2021a), Holocene DA (Erb et al., 2022a), MPI-ESM1.2 (van Dijk et al., 2024), and TraCE-21k-II (He and Clark, 2022), expressed as an anomaly with respect to the last millennium mean temperature.
Despite excellent agreement with LGMR for the 6600 BCE–1800 CE trend, millennial-scale variability sometimes differs between our simulations and reconstructions. Notably, we simulate a warming between 4500 and 2000 BCE (+0.16 ± 0.05 K kyr−1), whereas reconstructions assimilating proxy records show a stable GMST or slight cooling (0.04 ± 0.013 and 0.03 ± 0.03 K kyr−1 for LGMR and Holocene data assimilation, respectively).
4.2.2 Centennial-scale variability
Comparing our simulations to proxy-based reconstructions for the last two millennia shows some discrepancies on a centennial scale. Notably, our simulations show a weaker transition between the warm Medieval Climate Anomaly (MCA) and the cold Little Ice Age (LIA) (Table S3). The IPCC's fifth assessment report defines the MCA as 950–1250 CE and the LIA as 1450–1850 CE (Masson-Delmotte et al., 2013). Owing to the LGMR 200-year time resolution, we instead use 950–1150 and 1350–1750 CE.
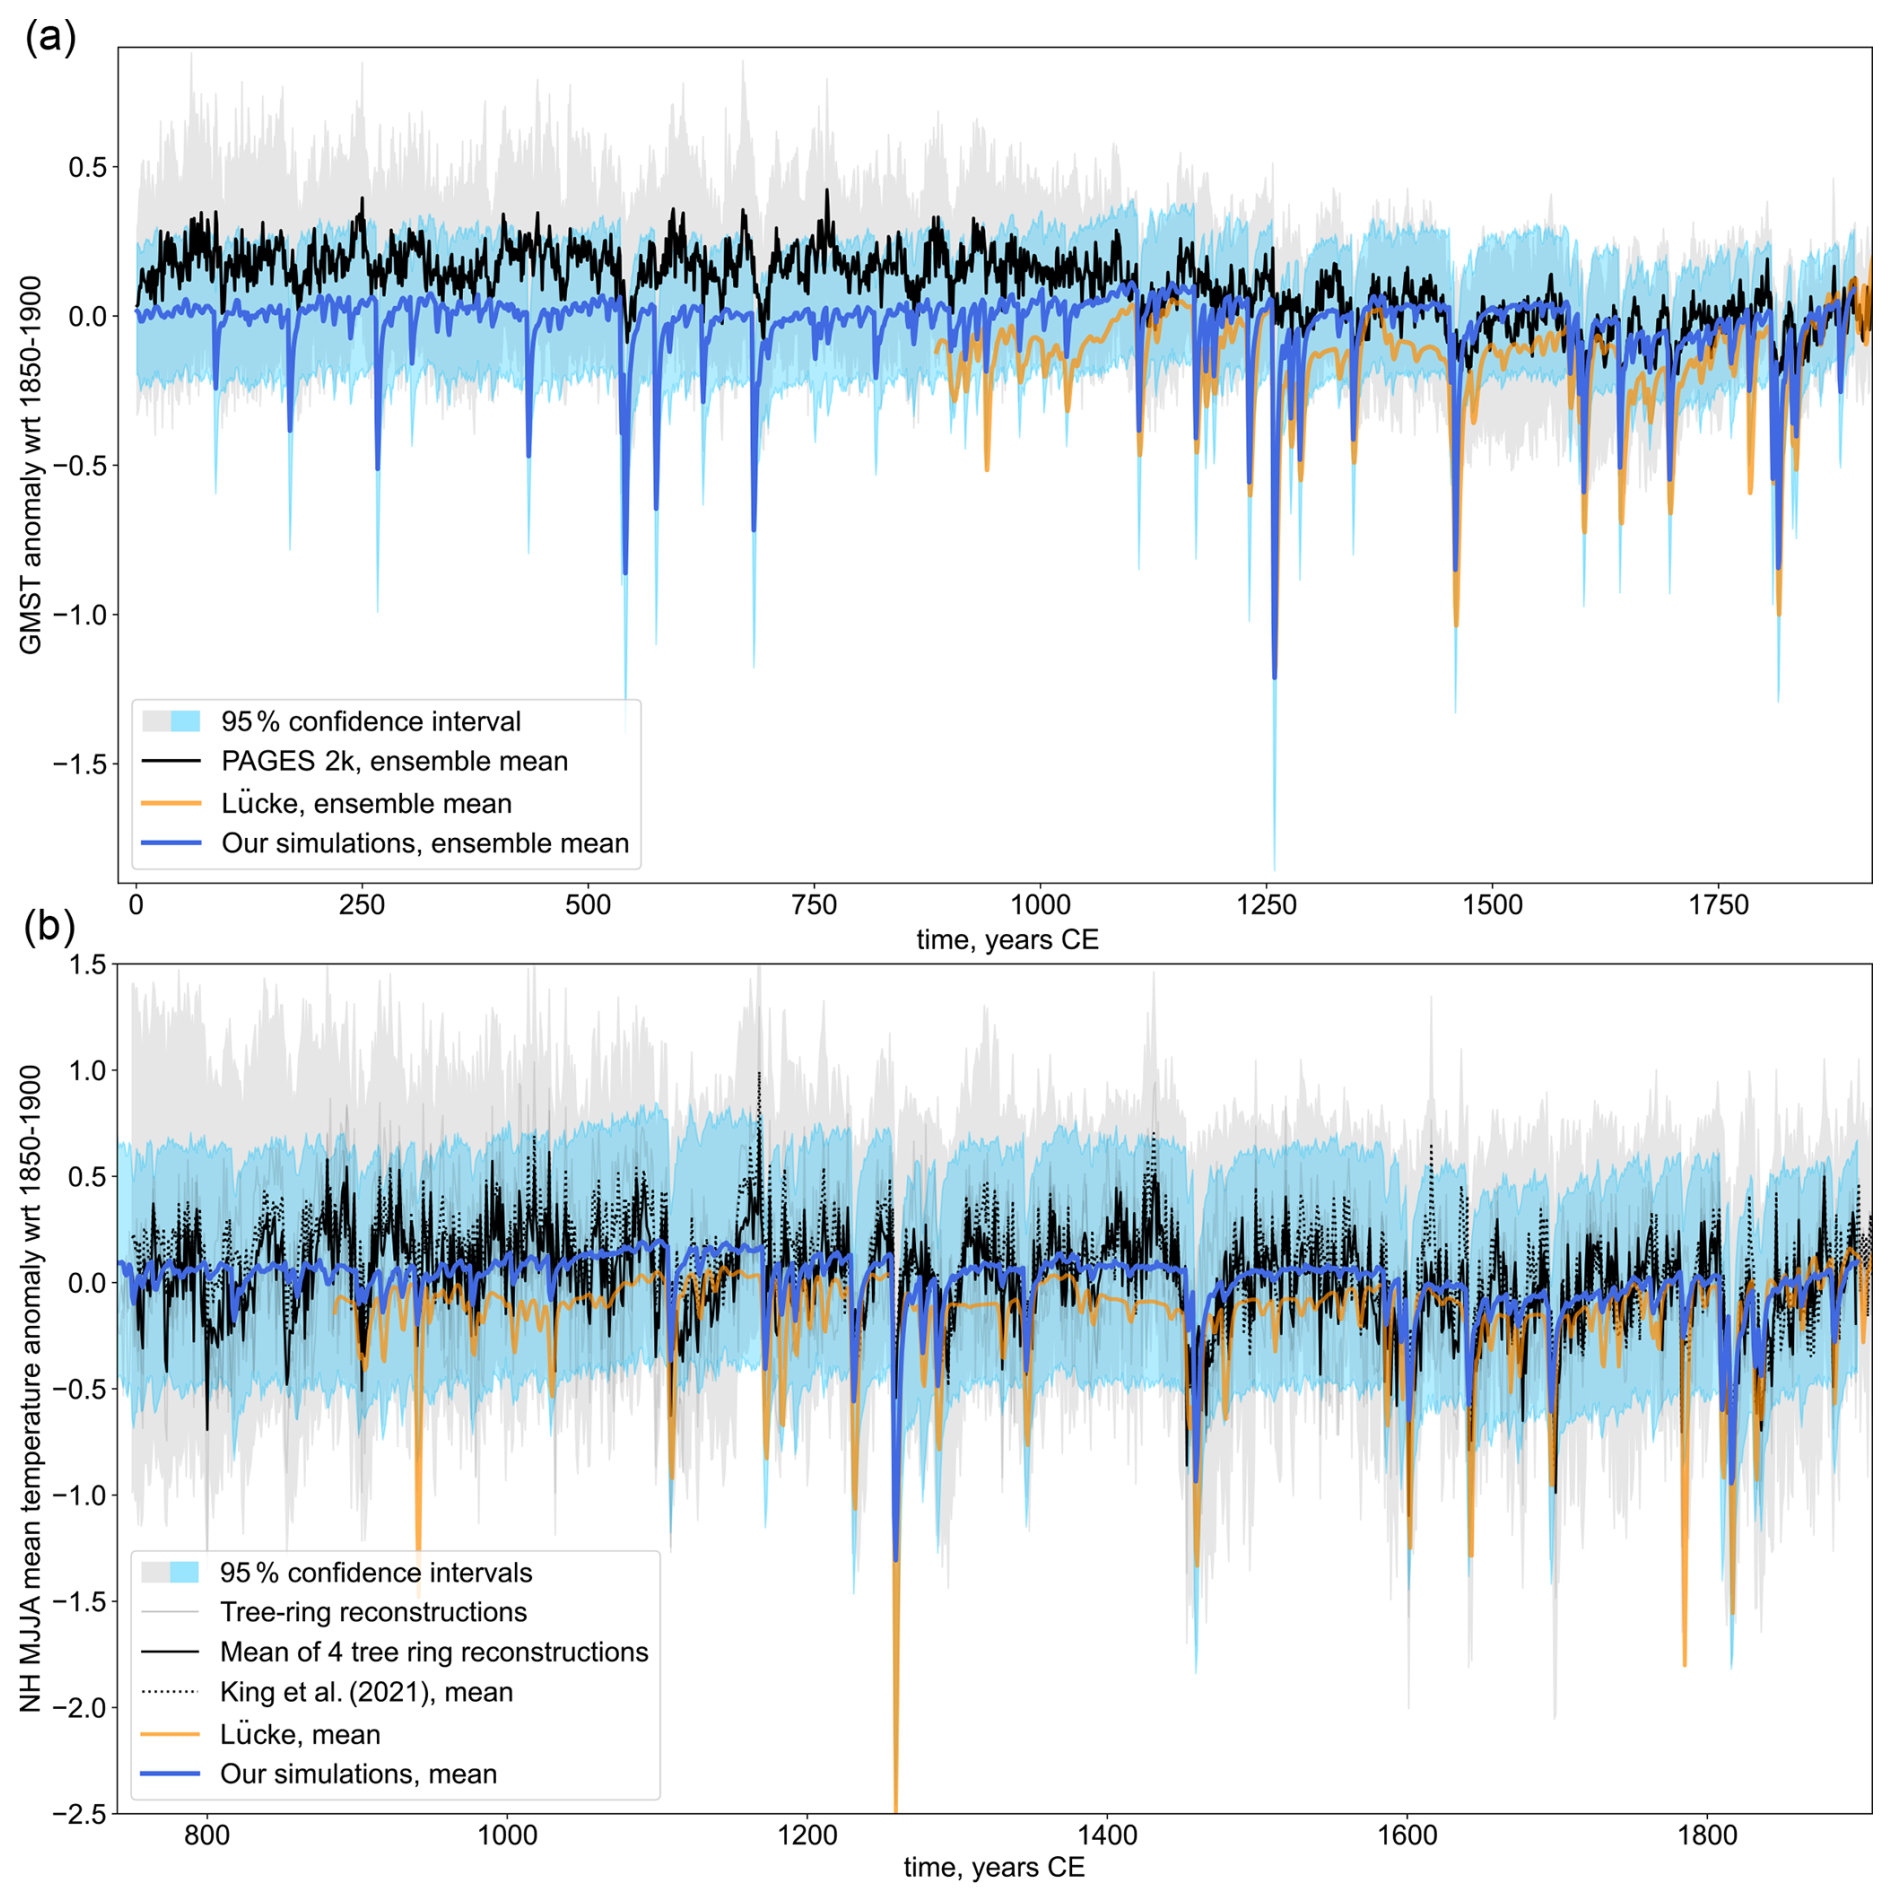
Figure 6(a) GMST for the past 2 kyr from our simulations compared to the PAGES 2k reconstruction and the simulations from Lücke et al. (2023); (b) NH MJJA temperature for the past millennium from our simulations compared to tree-ring-based reconstructions (mean of NTREND 2015, Schneider 2015, Guillet 2017 and Büntgen 2021 (solid line), and King et al., 2021a (dotted line)) and the simulations from Lücke et al. (2023).
The GMST difference between the MCA and LIA is 50 % stronger in PAGES 2k (0.16 ± 0.12 K, Fig. 6a) and LGMR (0.15 ± 0.19 K, Fig. 5, noting that the duration of MCA and LIA are comparable to the time resolution of LGMR) compared to our simulations (0.10 ± 0.04 K, Fig. 6a) and simulation from van Dijk et al. (2024) (0.09 K). The Holocene data assimilation exhibits no MCA–LIA transition (0.01 ± 0.01 K, Fig. 5). These results are robust to the choice of date to define MCA and LIA (Table S3). Compared to GMST reconstructions, the MCA–LIA transition is enhanced in some NH MJJA tree-ring-based temperature reconstructions (ranging between 0.15 and 0.32 K for NTREND 2015, Guillet 2017, Büntgen 2021, and King 2021, Fig. 6b, Table S3) but not in our simplistic simulated NH MJJA temperature estimates (0.13 ± 0.06 K, Fig. 6b). Lücke et al. (2023)'s simulations exhibit a cooling similar to our simulations (0.12 ± 0.08 and 0.11 ± 0.08 K, for GMST and NH MJJA land temperature, respectively, Fig. 6 and Table S3).
4.2.3 Decadal-scale variability
For individual eruptions, we simulate a cooling that lasts for 5 to 15 years for the largest eruptions. The maximum volcano-induced GMST cooling simulated is 2.0 ± 0.5 K following the 5229 BCE eruption. In terms of GMST response, we obtain excellent agreement between our simulations and simulations performed with ESMs from Marshall et al. (2025) (Fig. 7a and b). When compared to reconstructions, most of the model–reconstruction disagreement can be explained by uncertainties, even for large eruptions (e.g. Samalas 1257 eruption, Fig. 7c). Our simulated volcanic cooling is significantly larger than PAGES 2k (Fig. 6a), especially during the first millennia CE, which has been attributed to the large relative contribution (50 % to 70 %) of time-uncertain proxies within the database before 1000 CE obscuring the sharp climate response typically reproduced by tree-ring reconstruction (Büntgen et al., 2020; Anchukaitis and Smerdon, 2022; Plunkett et al., 2022; Esper et al., 2024b).
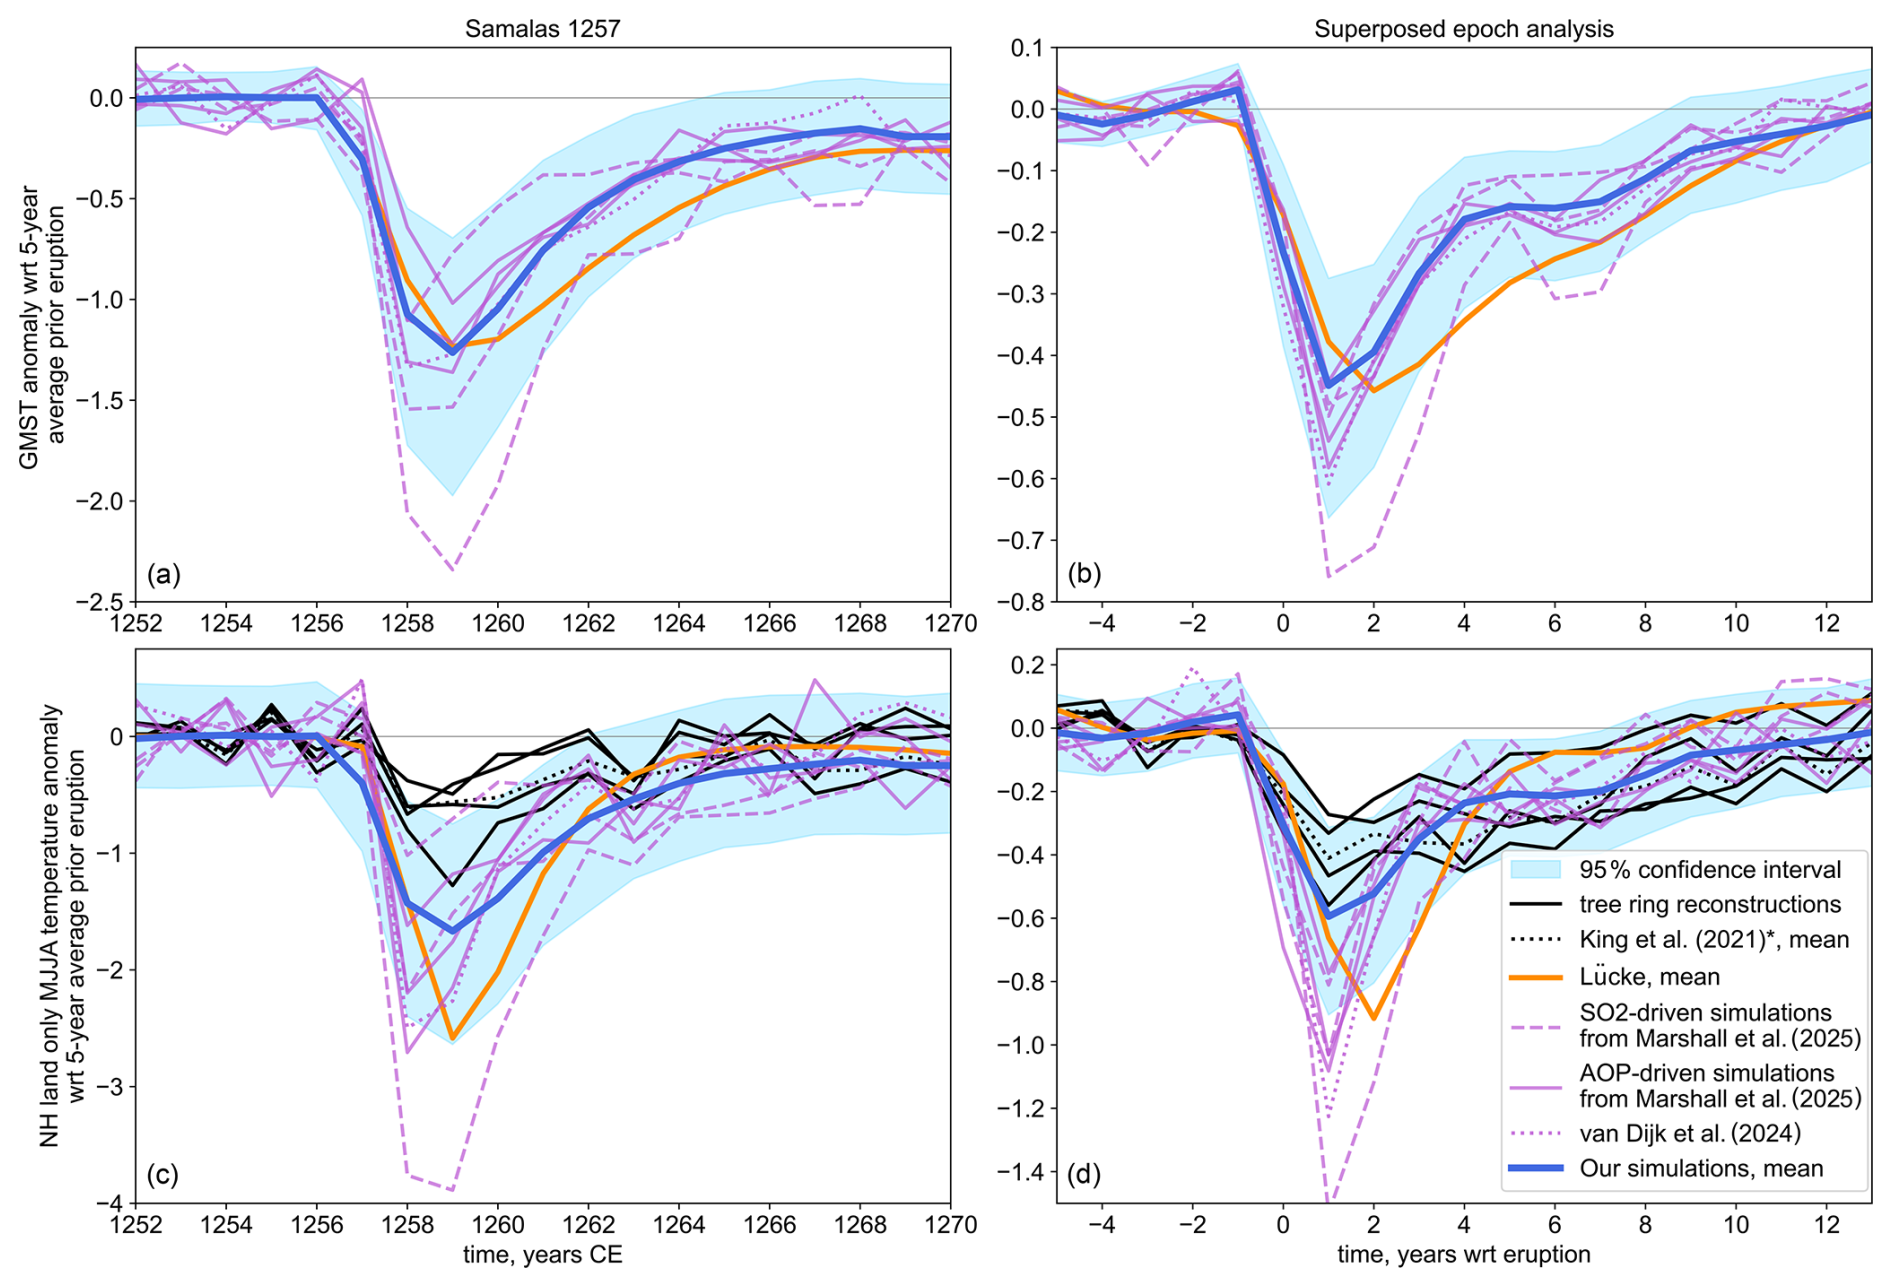
Figure 7(a) GMST response to Samalas 1257 eruption from our simulations compared to simulations from Marshall et al. (2025) and Lücke et al. (2023); (b) superposed epoch analysis of the GMST response to 14 eruptions injecting more than 20 Tg of SO2 that occurred between 1250 and 1850; (c) NH land-only MJJA temperature response to Samalas compared to tree-ring-based reconstructions (NTREND 2015, Schneider 2015, Guillet 2017, Büntgen 2021, King et al., 2021a) and simulations from Lücke et al. (2023) and Marshall et al. (2025); and (d) superposed epoch analysis of the NH land-only MJJA temperature response. ∗ Note that King et al. (2021a)'s reconstruction corresponds to land and sea mean temperature, whereas other reconstructions are land-only.
The superposed epoch analysis on 14 large eruptions (> 20 Tg of SO2, including clustered eruptions, that occurred between 1250 and 1850 CE) shows excellent agreement on the NH MJJA peak cooling magnitude (0.59 ± 0.15 K in our simulations, between 0.30 and 0.56 K in reconstructions, and a mean cooling of 0.35 ± 0.08 K and between 0.18 and 0.33 K, respectively, over the first 5 years after eruption, Fig. 7d). Lücke et al. (2023) and Marshall et al. (2025) obtain a NH land-only MJJA peak cooling 56 % and 76 % stronger than our simulations (0.92 and 1.04 K, respectively). The year of recovery, defined as the first post-eruption year with a cooling less than 5 % of the peak cooling, is in excellent agreement in our simulations (12 ± 3 years), tree-ring-based reconstructions (15 years for King 2021 and NTREND 2015, 13 and 18 years for Guillet 2017 and Büntgen 2021, respectively), and aerosol-property-driven simulations from Marshall et al. (2025) (12 ± 1 years). SO2-emission-driven simulations from Marshall et al. (2025), simulations from Lücke et al. (2023), and the Schneider 2015 tree-ring reconstruction recover earlier (10 ± 2, 8 ± 1, and 8 years, respectively). Defining the post-eruption warming trend as the linear trend between the year of peak cooling and year of recovery, we obtain a good agreement between reconstruction (between 0.022 and 0.036 K yr−1), aerosol-property-driven simulations from Marshall et al. (2025) (0.035 K yr−1), and our simulations (0.036 ± 0.07 K yr−1), with Lücke et al. (2023)'s and SO2-emission-driven simulations from Marshall et al. (2025) exhibiting a stronger trend (0.049 and 0.048 K yr−1, respectively). Note that, because of clustered eruptions, this does not reflect the mean response to a single eruption (see Fig. S3 for a superposed epoch analysis with no cluster).
4.2.4 Historical period variability (1850–2021 CE)
At a multi-decadal timescale (Fig. 8a), we observe that the global warming trend in our 1850–2021 ensemble of simulations follows closely the trend in the observations (+0.99 K in Cowtan and Way for the 2010–2016 period relative to the 1850–1900 mean, +1.07 K in Berkeley Earth, +0.97 ± 0.19 for our simulations). Most of the observed annual mean temperatures are within the 95 % confidence interval of our simulations (92 % of the Berkeley Earth dataset, 95 % of the Cowtan and Way dataset). We note that the mid-1930s to early 2000s temperatures appear warmer in the observations.
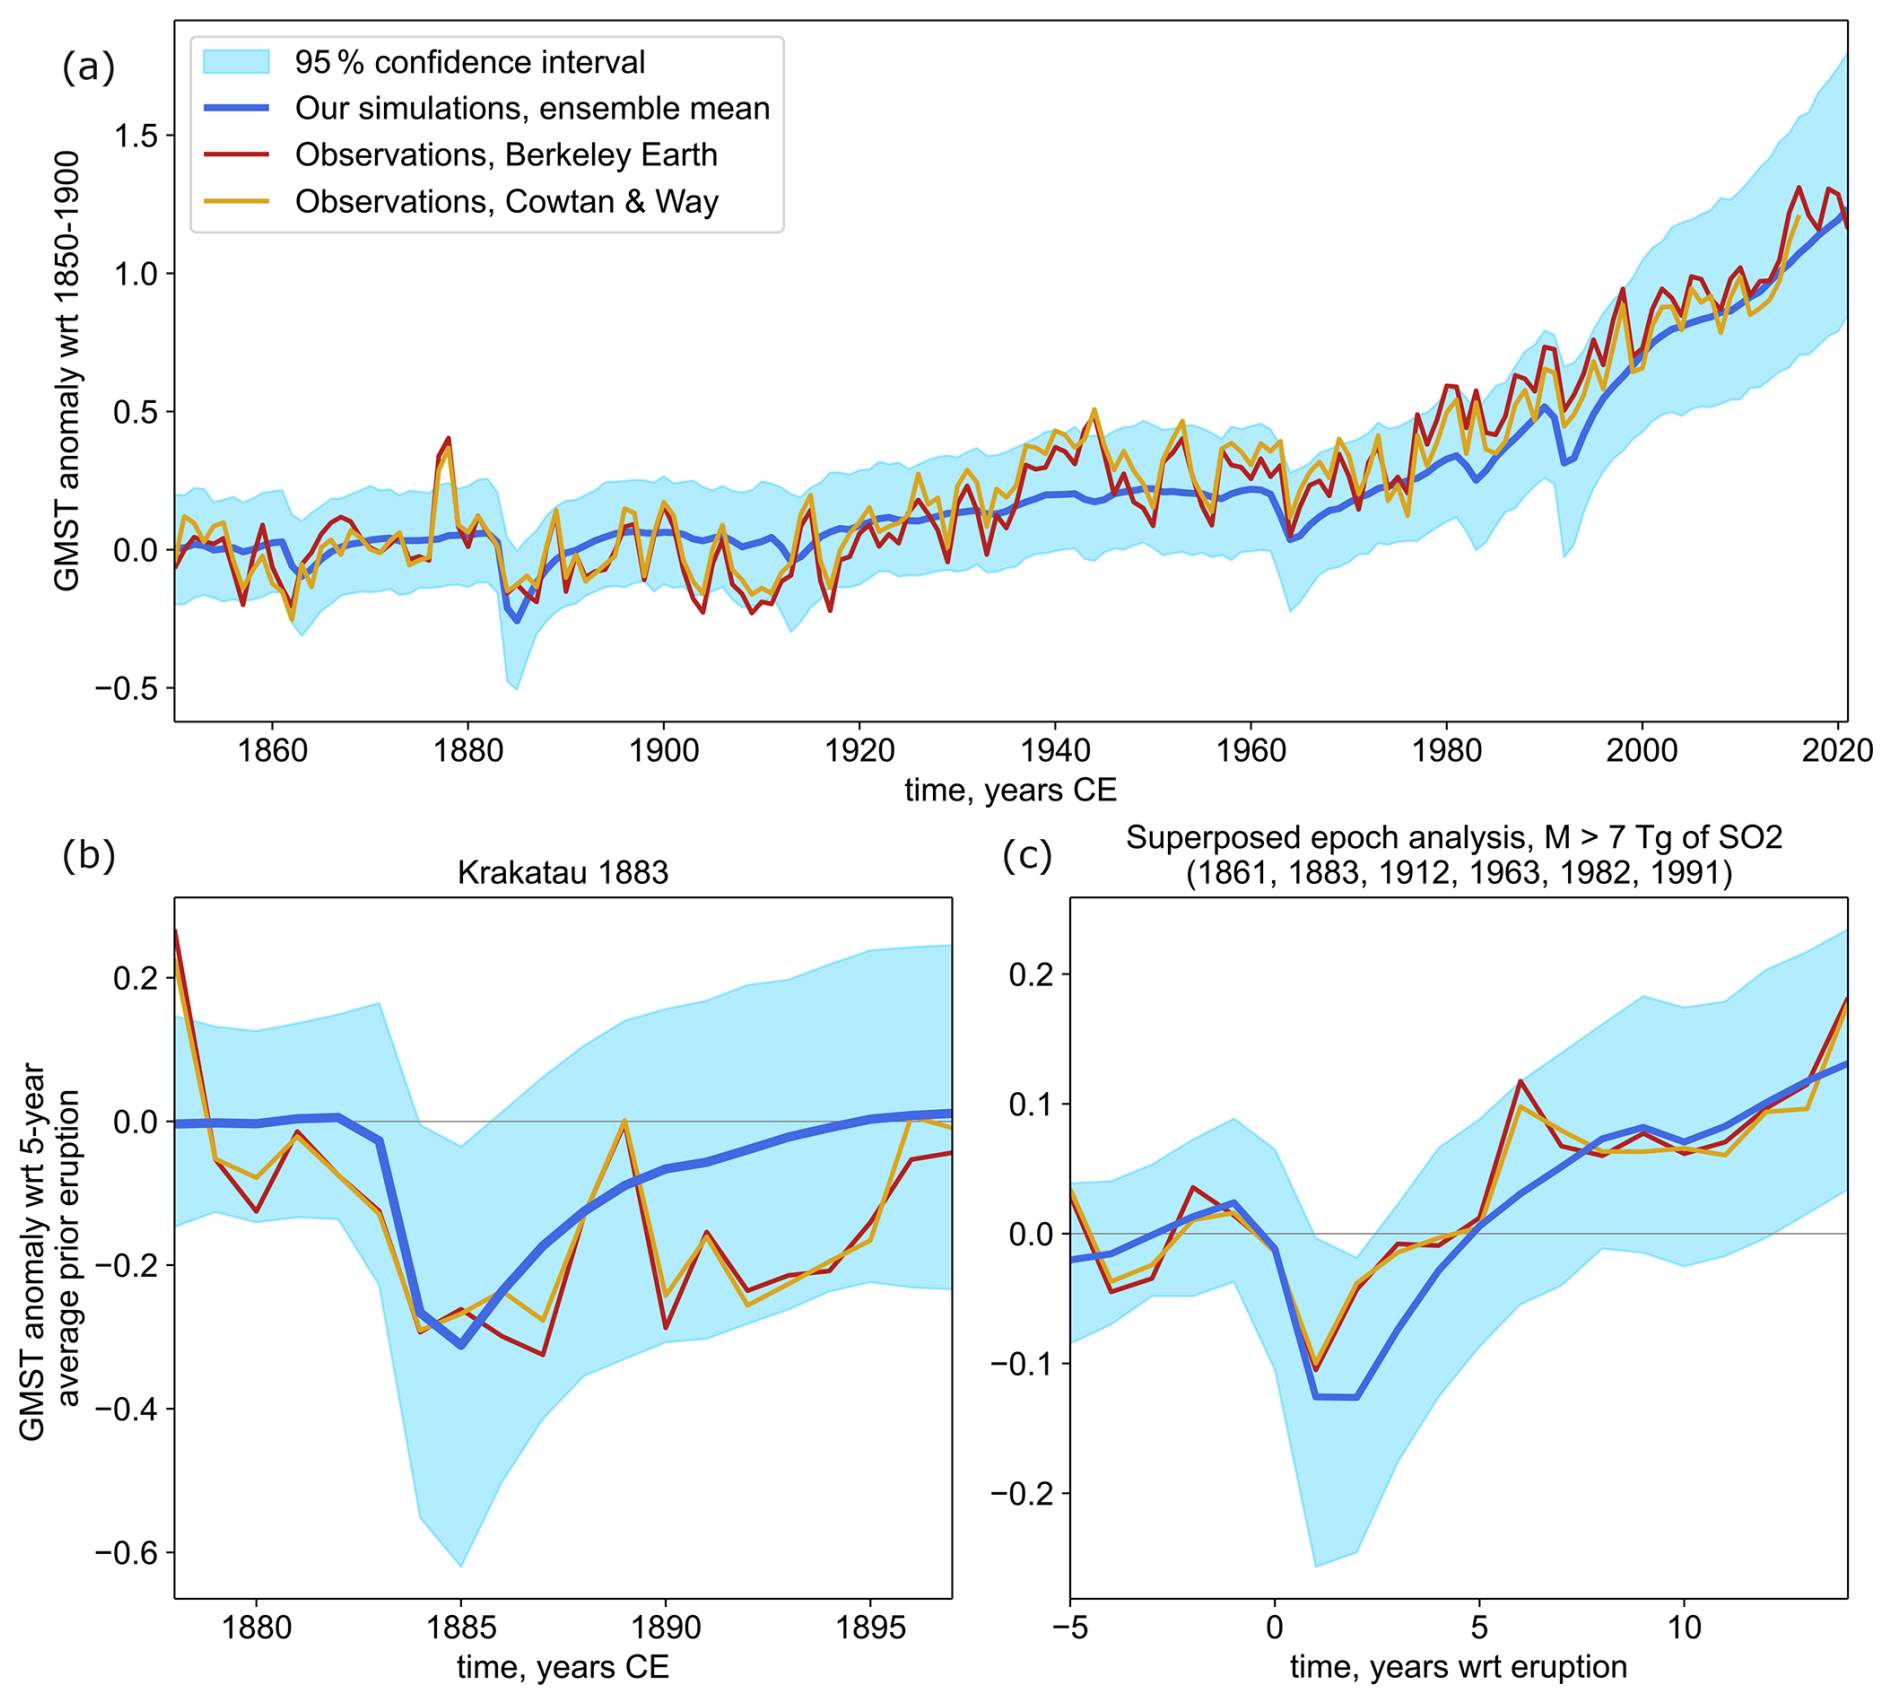
Figure 8(a) GMST for 1850–2021 from our simulations, compared to observations from Berkeley Earth and Cowtan and Way datasets; (b) GMST response to the Krakatau 1883 eruption; and (c) superposed epoch analysis of the GMST response to six eruptions injecting more than 7 Tg of SO2 that occurred between 1850 and 2021 (Kie Besi 1861, Krakatau 1883, Novarupta 1912, Agung 1963, El Chichón 1982, Pinatubo 1991).
The observational datasets show a strong interannual variability, with an amplitude similar to the response to volcanic eruptions (e.g. −0.22 K between 1991 and 1992 following the Pinatubo eruption and −0.24 K between 1998 and 1999). To compare the response to volcanic forcing between observations and simulations, we perform a superposed epoch analysis over 6 eruptions that injected more than 7 Tg of SO2 into the stratosphere (Kie Besi 1861, Krakatau 1883, Novarupta 1912, Agung 1963, El Chichón 1982, Pinatubo 1991). We obtain a peak cooling of 0.15 ± 0.06 K on average in our simulations, against 0.12 K in the two observational datasets (Fig. 8c). As in Fig. 7, the model-simulated warming after reaching peak cooling is in excellent agreement with the reconstructed one.
5.1 Sensitivity to volcanic aerosols and the climate model
The simulated annual GMST response to large volcanic eruptions is on average in good agreement between the simulations of Lücke et al. (2023) and ours (Fig. 7b). This result is surprising because our use of EVA_H instead of EVA for aerosol modelling results in lower global-mean SAOD estimates on average by 25 % (Fig. S4b). This is primarily caused by different calibration datasets (Aubry et al., 2020). EVA_H predicts a peak global-mean SAOD that is 25 % smaller than EVA for Pinatubo-like (tropical, high-altitude) volcanic injections (e.g. Fig. S4a, Tambora 1815). This smaller forcing in our simulations results in minor differences in terms of average climate response, likely as a consequence of compensating differences in climate models. With FaIR, our study resamples parameters to cover the full spectrum of CMIP6 climate model behaviour, whereas in Lücke et al. (2023) their reduced-complexity climate model is only tuned against HadCM3 simulations. Our simulation ensemble with FaIR will capture the HadCM behaviour thanks to our resampling strategy (including FaIR parameters, Sect. 3.3), but our predicted mean climate response will be a lot closer to the CMIP6 multimodel mean. The proportionally smaller cooling – with respect to SAOD – in Lücke et al. (2023) compared to our simulations can also be explained by the sampling of the date of eruption in their study for unidentified eruptions. Applying the same eruption date sampling method in our workflow to an unknown eruption (1809 eruption) results in peak gmSAOD and cooling 30 % and 20 % smaller, respectively, than our simulations without date uncertainty sampling (Fig. S5).
The main exception to the overall agreement in post-eruption GMST decrease between our study and Lücke et al. (2023) is for high-latitude Icelandic eruptions (e.g. Eldgja 939 and Laki 1783, Fig. S8), with differences by up to a factor 2.3. This is likely primarily caused by the fact that EVA_H accounts for the impact of both injection height and latitude on the magnitude and e-folding time of volcanic SAOD perturbations (Aubry et al., 2020), which can result in differences in SAOD by a factor of 2 for such eruptions (e.g. Fig. S4a, Laki 1783–1784). Last, we note that our method to compare reconstruction and simulated NH MJJA temperatures relies on a simplistic scaling of the annual GMST simulated using the global-mean SAOD. Lücke et al. (2023) use a more sophisticated approach, for land-only NH MJJA temperatures, with their reduced-complexity model calibrated to emulate the land-only NH MJJA temperature simulated by HadCM3 based on the NH mean SAOD. This method produces land-only NH MJJA temperature responses stronger by a factor 1.6 (Fig. 7b) to 3 (Fig. S7, for NH eruptions) than the land-only NH MJJA temperature directly scaled from annual GMST. Such calibration for FaIR using all CMIP6 models was beyond the scope of our study. Our simpler method shows good performances when comparing our NH MJJA temperature responses to tree-ring-based reconstructions (Sect. 4.2.3, Fig. 7c and d). Although the value of the scaling factor is uncertain and could differ in years following large eruptions (Table S2), the agreement between our model and tree-ring reconstruction holds when using values derived from six different ESM simulations for 1250–1850, whether calibrating the factor only against post-eruption years or against other years in the period (Fig. S3).
5.2 Medieval Climate Anomaly–Little Ice Age transition
Our simulations underestimate the magnitude of the MCA–LIA transition compared to proxy-based reconstructions (Sect. 4.2.2, Table S3). For example, in terms of NH MJJA temperature, for our default HYDE 3.3 land-use forcing and for our default MCA and LIA definitions of 950–1250 and 1450–1850, reconstructions have a transition ranging from 0.15 to 0.32 K, whereas we simulate a weaker transition at 0.13 ± 0.06 K. The magnitude of the transition is sensitive to the choice of exact period to define the MCA and LIA (Table S3), but regardless of the chosen period, our simulations underestimate this transition. The only proxy-based dataset with a weaker transition than our simulations is Schneider et al. (2015a), which might be explained by the fact that they do not use tree-ring width data, which might have a strong memory bias, leading to an overestimation of long-term anomalies (Lücke et al., 2019). However, our simulations are in better agreement with global-scale data assimilation methods and in terms of global-mean temperature, for which our simulated transition is only 35 % weaker than LGMR and PAGES 2k. This is expected since we simulate global-mean temperature, and the MCA–LIA transition was not a global phenomenon (Mann et al., 2009; Wanner et al., 2022) or not synchronous on different continents (Masson-Delmotte et al., 2013). Discrepancies remaining in terms of global-mean temperature might be due to the fact that even global reconstructions mostly assimilate NH land summer temperature proxy. Although the simplicity of our modelling approach might be another cause, the MCA–LIA transition simulated by CMIP5 GCMs in terms of NH temperature is also twice as small as proxy-based reconstructions (Masson-Delmotte et al., 2013). Last, the model–reconstruction discrepancy could simply be explained by forcing biases. In particular, the choice of the land-use forcing dataset (Sect. 2.2) strongly modulates the magnitude of the simulated transition (Table S3), with a weaker transition using HYDE 3.2 (Klein Goldewijk et al., 2017) and a stronger transition using KK10 (Kaplan et al., 2011), which has a steeper land-use forcing trend, in particular outside Europe (ArchaeoGLOBE Project, 2019). When using KK10, our simulated MCA–LIA transition agrees with any considered reconstruction within uncertainty. The only exception is the Holocene data assimilation (DA) in which no MCA–LIA is visible, which can be attributed to the low resolution and age synchronisation of the underlying proxies (Kaufman et al., 2020; Esper et al., 2024a) and the absence of volcanic and solar forcing in the model prior, which are considered the main drivers of the LIA (Mann et al., 2009; Owens et al., 2017; Wanner et al., 2022).
5.3 Millennial climate trends
We obtain a good agreement between proxy-based reconstructions and simulations in terms of the multimillennial trend but not for the period 4500–1000 BCE. Regardless of the land-use forcing used (Fig. S6), our simulations exhibit a relatively steady warming, whereas reconstructed temperatures are relatively stable or slightly cooling in both LGMR and the Holocene DA (Fig. 5). This reconstruction–simulation discrepancy, known as the Holocene temperature conundrum, is not unique to our simulations and has been extensively discussed in the literature (e.g. Liu et al., 2014; Hopcroft et al., 2023). Kaufman and Broadman (2023) suggest that an increasing volcanic forcing between 4000 BCE and the last millennium could partly explain the cooling trend observed in proxy reconstructions. Using the same base volcanic emission dataset (Sigl et al., 2022), our simulated temperature does not support this hypothesis (Table 1). We obtain a difference in volcanic cooling of −0.0005 ± 0.0116 K between the last millennium and mid-Holocene, using the same periods as Kaufman and Broadman (2023), suggesting a small contribution to the 0.1 K cooling visible in the Holocene data assimilation. Millennial-scale mean volcanic forcing and associated cooling were relatively constant between 4000 BCE–1000 CE (around 0.12 W m−2), followed by a stronger forcing only during the last millennium (0.17 W m−2) (Table 1). We note though that our reduced-complexity climate model is unable to account for non-linear effects and feedback. Another potential missing factor is the greening of Sahara (between 7000 and 4000 BCE; Hoelzmann et al., 1998). Our reduced-complexity model cannot reproduce this transition nor associated climate feedback, and the land-use forcing datasets we use only account for anthropogenic land-use change. Thompson et al. (2022) show that including a vegetation cover over the Sahara between 7000 and 4000 BCE could explain the warming until 4000 BCE and following cooling, comparable to the trends observed in the Holocene data assimilation (+0.15 ± 0.02 K kyr−1 for 6600–4200 BCE and −0.02 ± 0.01 K kyr−1 for 4000 BCE–present).
By combining reduced-complexity volcanic aerosol (EVA_H) and climate (FaIR) models, we produced a 1000-simulation ensemble of the 6755 BCE–1900 CE (8705–50 BP) temperatures, resampling uncertainties on the volcanic emissions, aerosol and climate models, and internal climate variability. We also account for the temperature variation induced by GHGs, solar, orbital, land-use, and ice-sheet-related forcings. We compare these simulations to proxy-based reconstructions for both global annual mean and NH summer temperature. We find a 6755 BCE–1900 CE mean volcanic forcing of −0.15 W m−2 and volcanic cooling of 0.12 K and quantify millennial-scale variations in volcanic cooling and forcing (1000-year average ranging between −0.08 and −0.22 W m−2 and 0.07 and 0.16 K, respectively). We obtain good agreement between tree-ring-based reconstructions and our simulations for the mean surface temperature response to the largest eruptions of the last millennium at annual to decadal timescales. For individual eruptions, we show that discrepancies between reconstructions and simulations can be explained by the uncertainties on volcanic emissions, aerosol and model parameters, and internal climate variability. At longer timescales, we obtain a good agreement between proxy-based reconstructions and simulations in terms of multimillennial trend. We note important discrepancies between our simulations and reconstructions in terms of centennial–millennial-scale variability, which also affect more complex GCMs and ESMs. Although the aerosol (EVA_H) and climate (FaIR) models are empirical, these successes are noteworthy since the periods investigated were not used for model calibration. Our modelling framework presents the advantage of a negligible computing cost, allowing us to simulate long climate time periods and/or large simulation ensembles to propagate uncertainties related to input forcings and models. Overall, this study supports the use of reduced-complexity aerosol and climate models to estimate the climate response to volcanic eruptions and more widely Holocene climate evolution. This approach perfectly complements studies with ESMs with or without interactive stratospheric aerosol schemes.
One of the main limitations of our modelling framework is that it is currently restricted to simulation of annual global-mean surface temperatures, whereas comparison to proxy reconstructions often require regional and seasonal signal, and societal impacts require assessment of regional climate response and other variables like precipitation. To make progress and simulate the response of diverse climate metrics at regional, seasonal scales whilst maintaining a low computing cost, future work could use methods developed for spatial emulation of ESMs. These methods include pattern scaling (e.g. Mathison et al., 2025) and machine learning methods (e.g. Watson-Parris et al., 2022), which to date have mostly been applied to investigate climate response to anthropogenic forcings but not volcanic forcing.
EVA_H is available from https://github.com/thomasaubry/EVA_H (Aubry et al., 2020). FaIR v.2.1.4 is available from https://github.com/OMS-NetZero/FAIR/tree/v2.1.4 (Leach et al., 2021).
gmSAOD, ERF, and volcanic simulation ensembles are available from https://doi.org/10.5281/zenodo.14170014 (Verkerk et al., 2024). Volcanic emissions reconstructions are available from https://doi.org/10.1594/PANGAEA.928646 (Sigl et al., 2021; HolVol v1.0) and https://doi.org/10.26050/WDCC/eVolv2k_v3 (Toohey and Sigl, 2019; eVolv2k v3). Orbital, solar, ice sheets, and land-use forcing reconstructions were provided by Peter O. Hopcroft, and corresponding reconstructions are available from https://doi.org/10.17617/1.5U (Solar Variability and Climate Group, 2017; solar irradiance), https://geo.public.data.uu.nl/vault-hyde/HYDE%203.3[1710493486] (last access: 1 October 2025; HYDE 3.3), https://doi.org/10.17026/DANS-25G-GEZ3 (Klein Goldewijk, 2017; HYDE 3.2), and https://doi.org/10.1594/PANGAEA.871369 (Kaplan and Krumhardt, 2011; KK10). CO2, CH4, and N2O concentrations are publicly available from https://doi.org/10.1594/PANGAEA.871273 (Köhler et al., 2017). For the historical period (1850–present), all forcings are taken from the RCMIP dataset (https://doi.org/10.5281/zenodo.4589756, Nicholls and Lewis, 2021), except for the volcanic forcing, taken from Aubry et al. (2025, https://doi.org/10.5281/zenodo.15556387; CMIP7 historical stratospheric volcanic sulfur emissions, based on Carn, 2024 (https://doi.org/10.5067/MEASURES/SO2/DATA405); Sigl et al., 2015; and Toohey and Sigl, 2019).
Most of the proxy reconstructions are publicly available from the NOAA National Centers for Environmental Information (NCEI), under the World Data Service (WDS) for Paleoclimatology at https://www.ncei.noaa.gov/access/paleo-search/ (last access: 1 October 2025; https://doi.org/10.25921/6mdt-5246, Schneider et al., 2015b, a; https://doi.org/10.25921/kztr-jd59, Wilson et al., 2016b, a; https://doi.org/10.25921/42gh-z167, Guillet et al., 2017b, a; https://doi.org/10.25921/tkxp-vn12, Neukom et al., 2019; PAGES 2k Consortium, 2019; https://doi.org/10.25921/9986-r929, Büntgen, 2021; Büntgen et al., 2021; https://doi.org/10.25921/vey7-kx38, King et al., 2021b, a; https://doi.org/10.25921/njxd-hg08, Osman et al., 2021b, a). The reconstruction from Erb et al. (2022a) is available on Zenodo at https://doi.org/10.5281/zenodo.6426332 (Erb et al., 2022b).
Simulations from Marshall et al. (2025) are available from the Supplement of Marshall et al. (2025). Simulations from Lücke et al. (2023) are available from https://doi.org/10.7488/ds/3834 (Luecke, 2023). TraCE-21K-II model data are available from https://trace-21k.nelson.wisc.edu (last access: 1 October 2025).
The supplement related to this article is available online at https://doi.org/10.5194/cp-21-1755-2025-supplement.
Conceptualisation: TJA, MV. Data curation: MV, CS, POH. Formal analysis: MV. Funding acquisition: TJA, CS. Investigation: MV. Methodology: MV, TJA, CS, POH, MS. Supervision: TJA, CS. Visualisation: MV. Writing (original draft preparation): MV, TJA. Writing (review and editing): all authors.
The contact author has declared that none of the authors has any competing interests.
Publisher's note: Copernicus Publications remains neutral with regard to jurisdictional claims made in the text, published maps, institutional affiliations, or any other geographical representation in this paper. While Copernicus Publications makes every effort to include appropriate place names, the final responsibility lies with the authors.
We sincerely thank Kees Klein Goldewijk for facilitating early access to version 3.3 of the HYDE dataset. We also thank Evelien van Dijk for sharing with us the MPI-ESM1.2 Holocene simulation from van Dijk et al. (2024).
Magali Verkerk acknowledges funding from the University of Exeter through a PhD scholarship and research funding from Exeter's Department of Earth and Environmental Sciences (DEES), the Met Office through a CASE studentship and IAVCEI Commission of tephrochronology. Thomas J. Aubry acknowledges support from the University of Arizona through a Haury Fellowship, a travel award from the Canada-UK Foundation, and the Exeter global travel fund, DEES, Camborne School of Mines International Travel Bursary.
We thank the anonymous reviewer and Lucie Lücke, whose thorough reviews and comments helped improve our manuscript.
This research has been supported by the University of Exeter (studentship reference: 4771) and the H2020 European Research Council (grant no. 820047). Magali Verkerk acknowledges funding from GW4 generator grant (no. GW4-GF4-018). This research has been funded by the European Space Agency (ESA) as part of the “Volcanic Forcing for CMIP” project of the Climate Change Initiative (CCI) (ESA ESRIN/contract no. 4000145911/24/I-LR). Kevin Anchukaitis acknowledges support from the US National Science Foundation (NSF; AGS-1803946 and AGS-2102993) and the US National Oceanographic and Atmospheric Administration (NOAA; NA18OAR4310420).
This paper was edited by Julien Emile-Geay and reviewed by Lucie Luecke and one anonymous referee.
Anchukaitis, K. J. and Smerdon, J. E.: Progress and uncertainties in global and hemispheric temperature reconstructions of the Common Era, Quat. Sci. Rev., 286, 107537, https://doi.org/10.1016/j.quascirev.2022.107537, 2022.
Anchukaitis, K. J., Breitenmoser, P., Briffa, K. R., Buchwal, A., Büntgen, U., Cook, E. R., D'Arrigo, R. D., Esper, J., Evans, M. N., Frank, D., Grudd, H., Gunnarson, B. E., Hughes, M. K., Kirdyanov, A. V., Körner, C., Krusic, P. J., Luckman, B., Melvin, T. M., Salzer, M. W., Shashkin, A. V., Timmreck, C., Vaganov, E. A., and Wilson, R. J. S.: Tree rings and volcanic cooling, Nat. Geosci., 5, 836–837, https://doi.org/10.1038/ngeo1645, 2012.
ArchaeoGLOBE Project: Archaeological assessment reveals Earth's early transformation through land use, Science, 365, 897–902, https://doi.org/10.1126/science.aax1192, 2019.
Argus, D. F., Peltier, W. R., Drummond, R., and Moore, A. W.: The Antarctica component of postglacial rebound model ICE-6G_C (VM5a) based on GPS positioning, exposure age dating of ice thicknesses, and relative sea level histories, Geophys. J. Int., 198, 537–563, https://doi.org/10.1093/gji/ggu140, 2014.
Aubry, T. J., Toohey, M., Marshall, L., Schmidt, A., and Jellinek, A. M.: A New Volcanic Stratospheric Sulfate Aerosol Forcing Emulator (EVA_H): Comparison With Interactive Stratospheric Aerosol Models, J. Geophys. Res.-Atmos., 125, e2019JD031303, https://doi.org/10.1029/2019JD031303, 2020.
Aubry, T. J., Schmidt, A., Kovilakam, M., Toohey, M., Khanal, S., Sigl, M., Chim, M. M., Johnson, B., Carn, S., Verkerk, M., Nicholls, Z., Smith, I., Stiller, D. Ziegler, E., Rieger, L., Thomason, L., Feng, J., Naik, V., and Durack, P.: CMIP7 historical stratospheric aerosol optical properties and stratospheric volcanic sulfur emissions: version 2.2.1 dataset and preliminary documentation, Zenodo [data set], https://doi.org/10.5281/zenodo.15556387, 2025.
Berger, A.: Long-Term Variations of Daily Insolation and Quaternary Climatic Changes, J. Atmos. Sci., 35, 2362–2367, https://doi.org/10.1175/1520-0469(1978)035<2362:LTVODI>2.0.CO;2, 1978.
Brady, E., Stevenson, S., Bailey, D., Liu, Z., Noone, D., Nusbaumer, J., Otto-Bliesner, B. L., Tabor, C., Tomas, R., Wong, T., Zhang, J., and Zhu, J.: The Connected Isotopic Water Cycle in the Community Earth System Model Version 1, J. Adv. Model. Earth Syst., 11, 2547–2566, https://doi.org/10.1029/2019MS001663, 2019.
Büntgen, U.: NOAA/WDS Paleoclimatology – Northern Hemisphere 2,000 Year Tree-Ring Ensemble Temperature Reconstructions, NOAA National Centers for Environmental Information [data set], https://doi.org/10.25921/9986-r929, 2021.
Büntgen, U., Arseneault, D., Boucher, É., Churakova (Sidorova), O. V., Gennaretti, F., Crivellaro, A., Hughes, M. K., Kirdyanov, A. V., Klippel, L., Krusic, P. J., Linderholm, H. W., Ljungqvist, F. C., Ludescher, J., McCormick, M., Myglan, V. S., Nicolussi, K., Piermattei, A., Oppenheimer, C., Reinig, F., Sigl, M., Vaganov, E. A., and Esper, J.: Prominent role of volcanism in Common Era climate variability and human history, Dendrochronologia, 64, 125757, https://doi.org/10.1016/j.dendro.2020.125757, 2020.
Büntgen, U., Allen, K., Anchukaitis, K. J., Arseneault, D., Boucher, É., Bräuning, A., Chatterjee, S., Cherubini, P., Churakova, O. V., Corona, C., Gennaretti, F., Grießinger, J., Guillet, S., Guiot, J., Gunnarson, B., Helama, S., Hochreuther, P., Hughes, M. K., Huybers, P., Kirdyanov, A. V., Krusic, P. J., Ludescher, J., Meier, W. J.-H., Myglan, V. S., Nicolussi, K., Oppenheimer, C., Reinig, F., Salzer, M. W., Seftigen, K., Stine, A. R., Stoffel, M., St. George, S., Tejedor, E., Trevino, A., Trouet, V., Wang, J., Wilson, R., Yang, B., Xu, G., and Esper, J.: The influence of decision-making in tree ring-based climate reconstructions, Nat. Commun., 12, 3411, https://doi.org/10.1038/s41467-021-23627-6, 2021.
Carey, S. and Sparks, R. S. J.: Quantitative models of the fallout and dispersal of tephra from volcanic eruption columns, B. Volcanol., 48, 109–125, https://doi.org/10.1007/BF01046546, 1986.
Carn, S.: GES DISC Dataset: Multi-Satellite Volcanic Sulfur Dioxide L4 Long-Term Global Database V4 (MSVOLSO2L4 4), NASA Goddard Earth Sciences Data and Information Services Center [data set], https://doi.org/10.5067/MEASURES/SO2/DATA405, 2024.
Chim, M. M., Aubry, T. J., Smith, C., and Schmidt, A.: Neglecting future sporadic volcanic eruptions underestimates climate uncertainty, Commun. Earth Environ., 6, 236, https://doi.org/10.1038/s43247-025-02208-1, 2025.
Chylek, P., Folland, C., Klett, J. D., and Dubey, M. K.: CMIP5 Climate Models Overestimate Cooling by Volcanic Aerosols, Geophys. Res. Lett., 47, e2020GL087047, https://doi.org/10.1029/2020GL087047, 2020.
Clyne, M., Lamarque, J.-F., Mills, M. J., Khodri, M., Ball, W., Bekki, S., Dhomse, S. S., Lebas, N., Mann, G., Marshall, L., Niemeier, U., Poulain, V., Robock, A., Rozanov, E., Schmidt, A., Stenke, A., Sukhodolov, T., Timmreck, C., Toohey, M., Tummon, F., Zanchettin, D., Zhu, Y., and Toon, O. B.: Model physics and chemistry causing intermodel disagreement within the VolMIP-Tambora Interactive Stratospheric Aerosol ensemble, Atmos. Chem. Phys., 21, 3317–3343, https://doi.org/10.5194/acp-21-3317-2021, 2021.
Cook, E., Portnyagin, M., Ponomareva, V., Bazanova, L., Svensson, A., and Garbe-Schönberg, D.: First identification of cryptotephra from the Kamchatka Peninsula in a Greenland ice core: Implications of a widespread marker deposit that links Greenland to the Pacific northwest, Quat. Sci. Rev., 181, 200–206, https://doi.org/10.1016/j.quascirev.2017.11.036, 2018.
Cowtan, K. and Way, R. G.: Coverage bias in the HadCRUT4 temperature series and its impact on recent temperature trends, Q. J. Roy. Meteor. Soc., 140, 1935–1944, https://doi.org/10.1002/qj.2297, 2014.
Cummins, D. P., Stephenson, D. B., and Stott, P. A.: Optimal Estimation of Stochastic Energy Balance Model Parameters, J. Climate, 33, 7909–7926, https://doi.org/10.1175/JCLI-D-19-0589.1, 2020.
D'Arrigo, R., Wilson, R., and Anchukaitis, K. J.: Volcanic cooling signal in tree ring temperature records for the past millennium, J. Geophys. Res.-Atmos., 118, 9000–9010, https://doi.org/10.1002/jgrd.50692, 2013.
de Silva, S. L. and Zielinski, G. A.: Global influence of the AD 1600 eruption of Huaynaputina, Peru, Nature, 393, 455–458, https://doi.org/10.1038/30948, 1998.
Engwell, S. L., Aubry, T. J., Bonadonna, C., Mastin, L. G., Carazzo, G., Van Eaton, A. R., Jessop, D. E., Grainger, R. G., Scollo, S., Taylor, I. A., Jellinek, A. M., Schmidt, A., Biass, S., and Gouhier, M.: New Insights Into the Relationship Between Mass Eruption Rate and Volcanic Column Height Based On the IVESPA Data Set, Geophys. Res. Lett., 50, e2022GL102633, https://doi.org/10.1029/2022GL102633, 2023.
Erb, M. P., McKay, N. P., Steiger, N., Dee, S., Hancock, C., Ivanovic, R. F., Gregoire, L. J., and Valdes, P.: Reconstructing Holocene temperatures in time and space using paleoclimate data assimilation, Clim. Past, 18, 2599–2629, https://doi.org/10.5194/cp-18-2599-2022, 2022a.
Erb, M. P., McKay, N. P., Steiger, N., Dee, S., Hancock, C., Ivanovic, R. F., Gregoire, L. J., and Valdes, P.: Holocene temperature reconstruction using paleoclimate data assimilation (1.0.0-beta), Zenodo [data set], https://doi.org/10.5281/zenodo.6426332, 2022b.
Esper, J., Schulz, P., and Büntgen, U.: Is Recent Warming Exceeding the Range of the Past 125,000 Years?, Atmosphere, 15, 405, https://doi.org/10.3390/atmos15040405, 2024a.
Esper, J., Smerdon, J. E., Anchukaitis, K. J., Allen, K., Cook, E. R., D'Arrigo, R., Guillet, S., Ljungqvist, F. C., Reinig, F., Schneider, L., Sigl, M., Stoffel, M., Trnka, M., Wilson, R., and Büntgen, U.: The IPCC's reductive Common Era temperature history, Commun. Earth Environ., 5, 222, https://doi.org/10.1038/s43247-024-01371-1, 2024b.
Essell, H., Esper, J., Wanner, H., and Büntgen, U.: Rethinking the Holocene temperature conundrum, Clim. Res., 92, 61–64, https://doi.org/10.3354/cr01735, 2024.
Eyring, V., Bony, S., Meehl, G. A., Senior, C. A., Stevens, B., Stouffer, R. J., and Taylor, K. E.: Overview of the Coupled Model Intercomparison Project Phase 6 (CMIP6) experimental design and organization, Geosci. Model Dev., 9, 1937–1958, https://doi.org/10.5194/gmd-9-1937-2016, 2016.
Fang, S.-W., Sigl, M., Toohey, M., Jungclaus, J., Zanchettin, D., and Timmreck, C.: The role of small to moderate volcanic eruptions in the early 19th century climate, Geophys. Res. Lett., 50, e2023GL105307, https://doi.org/10.1029/2023GL105307, 2023.
Forster, P., Storelvmo, T., Armour, K., Collins, W., Dufresne, J.-L., Frame, D., Lunt, D., Mauritsen, T., Palmer, M., Watanabe, M., Wild, M., and Zhang, H.: Chapter 7: The Earth's energy budget, climate feedbacks, and climate sensitivity, in: Climate Change 2021 – The Physical Science Basis: Working Group I Contribution to the Sixth Assessment Report of the Intergovernmental Panel on Climate Change, Cambridge University Press, Cambridge, 923–1054, https://doi.org/10.1017/9781009157896.009, 2021.
Gabriel, I., Innes, H. M., Abbott, P. M., Franke, J., Behrens, M., Chellman, N. J., Hörhold, M., Hutchison, W., McConnell, J. R., Twarloh, B., and Sigl, M.: Constraining the timing and climate forcing of the Long Island (Papua New Guinea) and Tarumae (Japan) eruptions and other 17th century volcanic eruptions, J. Volcanol. Geotherm. Res., 464, 108346, https://doi.org/10.1016/j.jvolgeores.2025.108346, 2025.
Guillet, S., Corona, C., Stoffel, M., Khodri, M., Lavigne, F., Ortega, P., Eckert, N., Sielenou, P. D., Daux, V., Churakova, O. V., Davi, N., Edouard, J.-L., Zhang, Y., Luckman, B. H., Myglan, V. S., Guiot, J., Beniston, M., Masson-Delmotte, V., and Oppenheimer, C.: Climate response to the Samalas volcanic eruption in 1257 revealed by proxy records, Nat. Geosci., 10, 123–128, https://doi.org/10.1038/ngeo2875, 2017a.
Guillet, S., Corona, C., Stoffel, M., Khodri, M., Lavigne, F., Ortega, P., Eckert, N., Dkengne Sielenou, P., Daux, V., Churakova, O. V., Davi, N. K., Edouard, J.-L., Zhang, Y., Luckman, B. H., Myglan, V. S., Guiot, J., Beniston, M., Masson-Delmotte, V., and Oppenheimer, C.: NOAA/WDS Paleoclimatology – Northern Hemisphere 1,500 Year Summer Temperature Reconstructions, NOAA National Centers for Environmental Information [data set], https://doi.org/10.25921/42gh-z167, 2017b.
Günther, M., Schmidt, H., Timmreck, C., and Toohey, M.: Climate Feedback to Stratospheric Aerosol Forcing: The Key Role of the Pattern Effect, J. Climate, 35, 7903–7917, https://doi.org/10.1175/JCLI-D-22-0306.1, 2022.
Hays, J. D., Imbrie, J., and Shackleton, N. J.: Variations in the Earth's Orbit: Pacemaker of the Ice Ages, Science, 194, 1121–1132, https://doi.org/10.1126/science.194.4270.1121, 1976.
He, F. and Clark, P. U.: Freshwater forcing of the Atlantic Meridional Overturning Circulation revisited, Nat. Clim. Change, 12, 449–454, https://doi.org/10.1038/s41558-022-01328-2, 2022.
Hoelzmann, P., Jolly, D., Harrison, S. P., Laarif, F., Bonnefille, R., and Pachur, H.-J.: Mid-Holocene land-surface conditions in northern Africa and the Arabian Peninsula: A data set for the analysis of biogeophysical feedbacks in the climate system, Global Biogeochem. Cy., 12, 35–51, https://doi.org/10.1029/97GB02733, 1998.
Hopcroft, P. O., Valdes, P. J., Shuman, B. N., Toohey, M., and Sigl, M.: Relative importance of forcings and feedbacks in the Holocene temperature conundrum, Quat. Sci. Rev., 319, 108322, https://doi.org/10.1016/j.quascirev.2023.108322, 2023.
Hutchison, W., Sugden, P., Burke, A., Abbott, P., Ponomareva, V. V., Dirksen, O., Portnyagin, M. V., MacInnes, B., Bourgeois, J., Fitzhugh, B., Verkerk, M., Aubry, T. J., Engwell, S. L., Svensson, A., Chellman, N. J., McConnell, J. R., Davies, S., Sigl, M., and Plunkett, G.: The 1831 CE mystery eruption identified as Zavaritskii caldera, Simushir Island (Kurils), P. Natl. Acad. Sci. USA, 122, e2416699122, https://doi.org/10.1073/pnas.2416699122, 2025.
Jenkins, S., Smith, C., Allen, M., and Grainger, R.: Tonga eruption increases chance of temporary surface temperature anomaly above 1.5 °C, Nat. Clim. Change, 13, 127–129, https://doi.org/10.1038/s41558-022-01568-2, 2023.
Jungclaus, J. H., Bard, E., Baroni, M., Braconnot, P., Cao, J., Chini, L. P., Egorova, T., Evans, M., González-Rouco, J. F., Goosse, H., Hurtt, G. C., Joos, F., Kaplan, J. O., Khodri, M., Klein Goldewijk, K., Krivova, N., LeGrande, A. N., Lorenz, S. J., Luterbacher, J., Man, W., Maycock, A. C., Meinshausen, M., Moberg, A., Muscheler, R., Nehrbass-Ahles, C., Otto-Bliesner, B. I., Phipps, S. J., Pongratz, J., Rozanov, E., Schmidt, G. A., Schmidt, H., Schmutz, W., Schurer, A., Shapiro, A. I., Sigl, M., Smerdon, J. E., Solanki, S. K., Timmreck, C., Toohey, M., Usoskin, I. G., Wagner, S., Wu, C.-J., Yeo, K. L., Zanchettin, D., Zhang, Q., and Zorita, E.: The PMIP4 contribution to CMIP6 – Part 3: The last millennium, scientific objective, and experimental design for the PMIP4 past1000 simulations, Geosci. Model Dev., 10, 4005–4033, https://doi.org/10.5194/gmd-10-4005-2017, 2017.
Kaplan, J. O. and Krumhardt, K. M.: The KK10 Anthropogenic Land Cover Change scenario for the preindustrial Holocene, link to data in NetCDF format, PANGAEA [data set], https://doi.org/10.1594/PANGAEA.871369, 2011.
Kaplan, J. O., Krumhardt, K. M., Ellis, E. C., Ruddiman, W. F., Lemmen, C., and Goldewijk, K. K.: Holocene carbon emissions as a result of anthropogenic land cover change, Holocene, 21, 775–791, https://doi.org/10.1177/0959683610386983, 2011.
Kaufman, D., McKay, N., Routson, C., Erb, M., Davis, B., Heiri, O., Jaccard, S., Tierney, J., Dätwyler, C., Axford, Y., Brussel, T., Cartapanis, O., Chase, B., Dawson, A., de Vernal, A., Engels, S., Jonkers, L., Marsicek, J., Moffa-Sánchez, P., Morrill, C., Orsi, A., Rehfeld, K., Saunders, K., Sommer, P. S., Thomas, E., Tonello, M., Tóth, M., Vachula, R., Andreev, A., Bertrand, S., Biskaborn, B., Bringué, M., Brooks, S., Caniupán, M., Chevalier, M., Cwynar, L., Emile-Geay, J., Fegyveresi, J., Feurdean, A., Finsinger, W., Fortin, M.-C., Foster, L., Fox, M., Gajewski, K., Grosjean, M., Hausmann, S., Heinrichs, M., Holmes, N., Ilyashuk, B., Ilyashuk, E., Juggins, S., Khider, D., Koinig, K., Langdon, P., Larocque-Tobler, I., Li, J., Lotter, A., Luoto, T., Mackay, A., Magyari, E., Malevich, S., Mark, B., Massaferro, J., Montade, V., Nazarova, L., Novenko, E., Pařil, P., Pearson, E., Peros, M., Pienitz, R., Płóciennik, M., Porinchu, D., Potito, A., Rees, A., Reinemann, S., Roberts, S., Rolland, N., Salonen, S., Self, A., Seppä, H., Shala, S., St-Jacques, J.-M., Stenni, B., Syrykh, L., Tarrats, P., Taylor, K., van den Bos, V., Velle, G., Wahl, E., Walker, I., Wilmshurst, J., Zhang, E., and Zhilich, S.: A global database of Holocene paleotemperature records, Sci. Data, 7, 115, https://doi.org/10.1038/s41597-020-0445-3, 2020.
Kaufman, D. S. and Broadman, E.: Revisiting the Holocene global temperature conundrum, Nature, 614, 425–435, https://doi.org/10.1038/s41586-022-05536-w, 2023.
King, J. M., Anchukaitis, K. J., Tierney, J. E., Hakim, G. J., Emile-Geay, J., Zhu, F., and Wilson, R.: A Data Assimilation Approach to Last Millennium Temperature Field Reconstruction Using a Limited High-Sensitivity Proxy Network, J. Climate, 34, 7091–7111, https://doi.org/10.1175/JCLI-D-20-0661.1, 2021a.
King, J. M., Anchukaitis, K. J., Tierney, J. E., Hakim, G. J., Emile-Geay, J., Zhu, F., and Wilson, R. J. S.: NOAA/WDS Paleoclimatology – Northern Hemisphere 1262 year NTREND Assimilation Surface Temperature Reconstructions, NOAA National Centers for Environmental Information, https://doi.org/10.25921/vey7-kx38, 2021b.
Klein Goldewijk, C. G. M.: Anthropogenic land-use estimates for the Holocene; HYDE 3.2, V2, DANS Data Station Archaeology [data set], https://doi.org/10.17026/DANS-25G-GEZ3, 2017.
Klein Goldewijk, K., Beusen, A., Doelman, J., and Stehfest, E.: Anthropogenic land use estimates for the Holocene – HYDE 3.2, Earth Syst. Sci. Data, 9, 927–953, https://doi.org/10.5194/essd-9-927-2017, 2017.
Köhler, P., Nehrbass-Ahles, C., Schmitt, J., Stocker, T. F., and Fischer, H.: Compilations and splined-smoothed calculations of continuous records of the atmospheric greenhouse gases CO2, CH4, and N2O and their radiative forcing since the penultimate glacial maximum, PANGAEA [data set], https://doi.org/10.1594/PANGAEA.871273, 2017.
Landcover6K working group: Landcover6K project, PAGES, https://pastglobalchanges.org/science/wg/former/landcover6k/intro, last access: 3 October 2025.
Leach, N. J., Jenkins, S., Nicholls, Z., Smith, C. J., Lynch, J., Cain, M., Walsh, T., Wu, B., Tsutsui, J., and Allen, M. R.: FaIRv2.0.0: a generalized impulse response model for climate uncertainty and future scenario exploration, Geosci. Model Dev., 14, 3007–3036, https://doi.org/10.5194/gmd-14-3007-2021, 2021.
Liu, Z., Zhu, J., Rosenthal, Y., Zhang, X., Otto-Bliesner, B. L., Timmermann, A., Smith, R. S., Lohmann, G., Zheng, W., and Elison Timm, O.: The Holocene temperature conundrum, P. Natl. Acad. Sci. USA, 111, E3501–E3505, https://doi.org/10.1073/pnas.1407229111, 2014.
Ljungqvist, F. C., Seim, A., and Collet, D.: Famines in medieval and early modern Europe – Connecting climate and society, WIREs Clim. Change, 15, e859, https://doi.org/10.1002/wcc.859, 2024.
Lücke, L. J., Hegerl, G. C., Schurer, A. P., and Wilson, R.: Effects of Memory Biases on Variability of Temperature Reconstructions, J. Climate, 32, 8713–8731, https://doi.org/10.1175/JCLI-D-19-0184.1, 2019.
Lücke, L. J., Schurer, A. P., Wilson, R., and Hegerl, G. C.: Orbital Forcing Strongly Influences Seasonal Temperature Trends During the Last Millennium, Geophys. Res. Lett., 48, e2020GL088776, https://doi.org/10.1029/2020GL088776, 2021.
Lücke, L. J., Schurer, A. P., Toohey, M., Marshall, L. R., and Hegerl, G. C.: The effect of uncertainties in natural forcing records on simulated temperature during the last millennium, Clim. Past, 19, 959–978, https://doi.org/10.5194/cp-19-959-2023, 2023.
Luecke, L. J.: Supporting material for “The effect of uncertainties in natural forcing records on simulated temperature during the last Millennium”, 0950-2020, The University of Edinburgh, School of GeoSciences [data set], https://doi.org/10.7488/ds/3834, 2023.
Mackay, H., Plunkett, G., Jensen, B. J. L., Aubry, T. J., Corona, C., Kim, W. M., Toohey, M., Sigl, M., Stoffel, M., Anchukaitis, K. J., Raible, C., Bolton, M. S. M., Manning, J. G., Newfield, T. P., Di Cosmo, N., Ludlow, F., Kostick, C., Yang, Z., Coyle McClung, L., Amesbury, M., Monteath, A., Hughes, P. D. M., Langdon, P. G., Charman, D., Booth, R., Davies, K. L., Blundell, A., and Swindles, G. T.: The 852/3 CE Mount Churchill eruption: examining the potential climatic and societal impacts and the timing of the Medieval Climate Anomaly in the North Atlantic region, Clim. Past, 18, 1475–1508, https://doi.org/10.5194/cp-18-1475-2022, 2022.
Mann, M. E., Zhang, Z., Rutherford, S., Bradley, R. S., Hughes, M. K., Shindell, D., Ammann, C., Faluvegi, G., and Ni, F.: Global Signatures and Dynamical Origins of the Little Ice Age and Medieval Climate Anomaly, Science, 326, 1256–1260, https://doi.org/10.1126/science.1177303, 2009.
Mann, M. E., Rutherford, S., Schurer, A., Tett, S. F. B., and Fuentes, J. D.: Discrepancies between the modeled and proxy-reconstructed response to volcanic forcing over the past millennium: Implications and possible mechanisms, J. Geophys. Res.-Atmos., 118, 7617–7627, https://doi.org/10.1002/jgrd.50609, 2013.
Manning, J. G., Ludlow, F., Stine, A. R., Boos, W. R., Sigl, M., and Marlon, J. R.: Volcanic suppression of Nile summer flooding triggers revolt and constrains interstate conflict in ancient Egypt, Nat. Commun., 8, 900, https://doi.org/10.1038/s41467-017-00957-y, 2017.
Marshall, L., Johnson, J. S., Mann, G. W., Lee, L., Dhomse, S. S., Regayre, L., Yoshioka, M., Carslaw, K. S., and Schmidt, A.: Exploring How Eruption Source Parameters Affect Volcanic Radiative Forcing Using Statistical Emulation, J. Geophys. Res.-Atmos., 124, 964–985, https://doi.org/10.1029/2018JD028675, 2019.
Marshall, L. R., Smith, C. J., Forster, P. M., Aubry, T. J., Andrews, T., and Schmidt, A.: Large Variations in Volcanic Aerosol Forcing Efficiency Due to Eruption Source Parameters and Rapid Adjustments, Geophys. Res. Lett., 47, e2020GL090241, https://doi.org/10.1029/2020GL090241, 2020.
Marshall, L. R., Schmidt, A., Johnson, J. S., Mann, G. W., Lee, L. A., Rigby, R., and Carslaw, K. S.: Unknown Eruption Source Parameters Cause Large Uncertainty in Historical Volcanic Radiative Forcing Reconstructions, J. Geophys. Res.-Atmos., 126, e2020JD033578, https://doi.org/10.1029/2020JD033578, 2021.
Marshall, L. R., Maters, E. C., Schmidt, A., Timmreck, C., Robock, A., and Toohey, M.: Volcanic effects on climate: recent advances and future avenues, Bull. Volcanol., 84, 54, https://doi.org/10.1007/s00445-022-01559-3, 2022.
Marshall, L. R., Schmidt, A., Schurer, A. P., Abraham, N. L., Lücke, L. J., Wilson, R., Anchukaitis, K. J., Hegerl, G. C., Johnson, B., Otto-Bliesner, B. L., Brady, E. C., Khodri, M., and Yoshida, K.: Last-millennium volcanic forcing and climate response using SO2 emissions, Clim. Past, 21, 161–184, https://doi.org/10.5194/cp-21-161-2025, 2025.
Masson-Delmotte, V., Schulz, M., Abe-Ouchi, A., Beer, J., Ganopolski, A., Fidel, J., Rouco, G., Jansen, E., Lambeck, K., Luterbacher, J., Naish, T., Ramesh, R., Rojas, M., Shao, X., Anchukaitis, K., Arblaster, J., Bartlein, P. J., Benito, G., Clark, P., Comiso, J. C., Crowley, T., Deckker, P. D., de Vernal, A., Delmonte, B., DiNezio, P., Dowsett, H. J., Edwards, R. L., Fischer, H., Fleitmann, D., Foster, G., Fröhlich, C., Hall, A., Hargreaves, J., Haywood, A., Hollis, C., Krinner, G., Landais, A., Li, C., Lunt, D., Mahowald, N., McGregor, S., Meehl, G., Mitrovica, J. X., Moberg, A., Mudelsee, M., Muhs, D. R., Mulitza, S., Müller, S., Overland, J., Parrenin, F., Pearson, P., Robock, A., Rohling, E., Salzmann, U., Savarino, J., Sedláček, J., Shindell, D., Smerdon, J., Solomina, O., Tarasov, P., Vinther, B., Waelbroeck, C., Wolf, D., Yokoyama, Y., Yoshimori, M., Zachos, J., Zwartz, D., Gupta, A. K., Rahimzadeh, F., Raynaud, D., and Wanner, H.: Information from Paleoclimate Archives, in: Climate Change 2013: The Physical Science Basis. Contribution of Working Group I to the Fifth Assessment Report of the Intergovernmental Panel on Climate Change, Cambridge University Press, https://doi.org/10.1017/CBO9781107415324.013, 2013.
Mathison, C., Burke, E. J., Munday, G., Jones, C. D., Smith, C. J., Steinert, N. J., Wiltshire, A. J., Huntingford, C., Kovacs, E., Gohar, L. K., Varney, R. M., and McNeall, D.: A rapid-application emissions-to-impacts tool for scenario assessment: Probabilistic Regional Impacts from Model patterns and Emissions (PRIME), Geosci. Model Dev., 18, 1785–1808, https://doi.org/10.5194/gmd-18-1785-2025, 2025.
McConnell, J. R., Sigl, M., Plunkett, G., Burke, A., Kim, W. M., Raible, C. C., Wilson, A. I., Manning, J. G., Ludlow, F., Chellman, N. J., Innes, H. M., Yang, Z., Larsen, J. F., Schaefer, J. R., Kipfstuhl, S., Mojtabavi, S., Wilhelms, F., Opel, T., Meyer, H., and Steffensen, J. P.: Extreme climate after massive eruption of Alaska's Okmok volcano in 43 BCE and effects on the late Roman Republic and Ptolemaic Kingdom, P. Natl. Acad. Sci. USA, 117, 15443–15449, https://doi.org/10.1073/pnas.2002722117, 2020.
Myhre, G., Shindell, D., Bréon, F.-M., Collins, W., Fuglestvedt, J., Huang, J., Koch, D., Lamarque, J.-F., Lee, D., Mendoza, B., Nakajima, T., Robock, A., Stephens, G., Takemura, T., and Zhang, H.: Anthropogenic and Natural Radiative Forcing, in: Climate Change 2013 – The Physical Science Basis, Cambridge University Press, 659–740, https://doi.org/10.1017/CBO9781107415324.018, 2014.
Neukom, R., Barboza, L. A., Erb, M. P., Shi, F., Emile-Geay, J., Evans, M. N., Franke, J., Kaufman, D. S., Lücke, L., Rehfeld, K., Schurer, A. P., Zhu, F., Brönnimann, S., Hakim, G. J., Henley, B. J., Ljungqvist, F. C., McKay, N. P., Valler, V., and von Gunten, L.: NOAA/WDS Paleoclimatology – PAGES2k Common Era Surface Temperature Reconstructions, NOAA National Centers for Environmental Information [data set], https://doi.org/10.25921/tkxp-vn12, 2019.
Nicholls, Z. and Lewis, J.: Reduced Complexity Model Intercomparison Project (RCMIP) protocol (v5.1.0), Zenodo [data set], https://doi.org/10.5281/zenodo.4589756, 2021.
Nicholls, Z. R. J., Meinshausen, M., Lewis, J., Gieseke, R., Dommenget, D., Dorheim, K., Fan, C.-S., Fuglestvedt, J. S., Gasser, T., Golüke, U., Goodwin, P., Hartin, C., Hope, A. P., Kriegler, E., Leach, N. J., Marchegiani, D., McBride, L. A., Quilcaille, Y., Rogelj, J., Salawitch, R. J., Samset, B. H., Sandstad, M., Shiklomanov, A. N., Skeie, R. B., Smith, C. J., Smith, S., Tanaka, K., Tsutsui, J., and Xie, Z.: Reduced Complexity Model Intercomparison Project Phase 1: introduction and evaluation of global-mean temperature response, Geosci. Model Dev., 13, 5175–5190, https://doi.org/10.5194/gmd-13-5175-2020, 2020.
Oppenheimer, C.: Eruption politics, Nat. Geosci., 8, 244–245, https://doi.org/10.1038/ngeo2408, 2015.
Osman, M. B., Tierney, J. E., Zhu, J., Tardif, R., Hakim, G. J., King, J., and Poulsen, C. J.: Globally resolved surface temperatures since the Last Glacial Maximum, Nature, 599, 239–244, https://doi.org/10.1038/s41586-021-03984-4, 2021a.
Osman, M. B., Tierney, J. E., Tardif, R., Hakim, G. J., and Poulsen, C. J.: NOAA/WDS Paleoclimatology – Globally Resolved Surface Temperatures Since the Last Glacial Maximum, NOAA National Centers for Environmental Information [data set], https://doi.org/10.25921/njxd-hg08, 2021b.
Owens, M. J., Lockwood, M., Hawkins, E., Usoskin, I., Jones, G. S., Barnard, L., Schurer, A., and Fasullo, J.: The Maunder minimum and the Little Ice Age: an update from recent reconstructions and climate simulations, J. Space Weather Space Clim., 7, A33, https://doi.org/10.1051/swsc/2017034, 2017.
PAGES 2k Consortium: A global multiproxy database for temperature reconstructions of the Common Era, Sci. Data, 4, 170088, https://doi.org/10.1038/sdata.2017.88, 2017.
PAGES 2k Consortium: Consistent multidecadal variability in global temperature reconstructions and simulations over the Common Era, Nat. Geosci., 12, 643–649, https://doi.org/10.1038/s41561-019-0400-0, 2019.
Pearson, C., Sigl, M., Burke, A., Davies, S., Kurbatov, A., Severi, M., Cole-Dai, J., Innes, H., Albert, P. G., and Helmick, M.: Geochemical ice-core constraints on the timing and climatic impact of Aniakchak II (1628 BCE) and Thera (Minoan) volcanic eruptions, PNAS Nexus, 1, pgac048, https://doi.org/10.1093/pnasnexus/pgac048, 2022.
Peltier, W. R., Argus, D. F., and Drummond, R.: Space geodesy constrains ice age terminal deglaciation: The global ICE-6G_C (VM5a) model, J. Geophys. Res.-Sol. Ea., 120, 450–487, https://doi.org/10.1002/2014JB011176, 2015.
Piva, S. B., Barker, S. J., Iverson, N. A., Winton, V. H. L., Bertler, N. A. N., Sigl, M., Wilson, C. J. N., Dunbar, N. W., Kurbatov, A. V., Carter, L., Charlier, B. L. A., and Newnham, R. M.: Volcanic glass from the 1.8 ka Taupō eruption (New Zealand) detected in Antarctic ice at ∼ 230 CE, Sci. Rep., 13, 16720, https://doi.org/10.1038/s41598-023-42602-3, 2023.
Plunkett, G., Sigl, M., Schwaiger, H. F., Tomlinson, E. L., Toohey, M., McConnell, J. R., Pilcher, J. R., Hasegawa, T., and Siebe, C.: No evidence for tephra in Greenland from the historic eruption of Vesuvius in 79 CE: implications for geochronology and paleoclimatology, Clim. Past, 18, 45–65, https://doi.org/10.5194/cp-18-45-2022, 2022.
Plunkett, G., Sigl, M., McConnell, J. R., Pilcher, J. R., and Chellman, N. J.: The significance of volcanic ash in Greenland ice cores during the Common Era, Quat. Sci. Rev., 301, 107936, https://doi.org/10.1016/j.quascirev.2022.107936, 2023.
Rohde, R. A. and Hausfather, Z.: The Berkeley Earth Land/Ocean Temperature Record, Earth Syst. Sci. Data, 12, 3469–3479, https://doi.org/10.5194/essd-12-3469-2020, 2020.
Rossi, E., Bonadonna, C., and Degruyter, W.: A new strategy for the estimation of plume height from clast dispersal in various atmospheric and eruptive conditions, Earth Planet. Sci. Lett., 505, 1–12, https://doi.org/10.1016/j.epsl.2018.10.007, 2019.
Schmidt, A., Mills, M. J., Ghan, S., Gregory, J. M., Allan, R. P., Andrews, T., Bardeen, C. G., Conley, A., Forster, P. M., Gettelman, A., Portmann, R. W., Solomon, S., and Toon, O. B.: Volcanic Radiative Forcing From 1979 to 2015, J. Geophys. Res.-Atmos., 123, 12491–12508, https://doi.org/10.1029/2018JD028776, 2018.
Schmidt, A., Aubry, T., Rigby, R., Stevenson, J. A., and Loughin, S.: cemac/volc2clim: version 1.0.3, Zenodo [code], https://doi.org/10.5281/zenodo.7646081, 2023.
Schneider, L., Smerdon, J. E., Büntgen, U., Wilson, R. J. S., Myglan, V. S., Kirdyanov, A. V., and Esper, J.: Revising midlatitude summer temperatures back to A.D. 600 based on a wood density network, Geophys. Res. Lett., 42, 4556–4562, https://doi.org/10.1002/2015GL063956, 2015a.
Schneider, L., Smerdon, J. E., Büntgen, U., Wilson, R. J. S., Myglan, V. S., Kirdyanov, A., and Esper, J.: NOAA/WDS Paleoclimatology – Northern Hemisphere Extratropics 1400 Year MXD Summer Temperature Reconstruction, NOAA National Centers for Environmental Information [data set], https://doi.org/10.25921/6mdt-5246, 2015b.
Sigl, M., McConnell, J. R., Toohey, M., Curran, M., Das, S. B., Edwards, R., Isaksson, E., Kawamura, K., Kipfstuhl, S., Krüger, K., Layman, L., Maselli, O. J., Motizuki, Y., Motoyama, H., Pasteris, D. R., and Severi, M.: Insights from Antarctica on volcanic forcing during the Common Era, Nat. Clim. Change, 4, 693–697, https://doi.org/10.1038/nclimate2293, 2014.
Sigl, M., Winstrup, M., McConnell, J. R., Welten, K. C., Plunkett, G., Ludlow, F., Büntgen, U., Caffee, M., Chellman, N., Dahl-Jensen, D., Fischer, H., Kipfstuhl, S., Kostick, C., Maselli, O. J., Mekhaldi, F., Mulvaney, R., Muscheler, R., Pasteris, D. R., Pilcher, J. R., Salzer, M., Schüpbach, S., Steffensen, J. P., Vinther, B. M., and Woodruff, T. E.: Timing and climate forcing of volcanic eruptions for the past 2,500 years, Nature, 523, 543–549, https://doi.org/10.1038/nature14565, 2015.
Sigl, M., Toohey, M., McConnell, J. R., Cole-Dai, J., and Severi, M.: HolVol: Reconstructed volcanic stratospheric sulfur injections and aerosol optical depth for the Holocene (9500 BCE to 1900 CE), PANGAEA [data set], https://doi.org/10.1594/PANGAEA.928646, 2021.
Sigl, M., Toohey, M., McConnell, J. R., Cole-Dai, J., and Severi, M.: Volcanic stratospheric sulfur injections and aerosol optical depth during the Holocene (past 11 500 years) from a bipolar ice-core array, Earth Syst. Sci. Data, 14, 3167–3196, https://doi.org/10.5194/essd-14-3167-2022, 2022.
Smith, C., Cummins, D. P., Fredriksen, H.-B., Nicholls, Z., Meinshausen, M., Allen, M., Jenkins, S., Leach, N., Mathison, C., and Partanen, A.-I.: fair-calibrate v1.4.1: calibration, constraining, and validation of the FaIR simple climate model for reliable future climate projections, Geosci. Model Dev., 17, 8569–8592, https://doi.org/10.5194/gmd-17-8569-2024, 2024.
Smith, C. J., Forster, P. M., Allen, M., Leach, N., Millar, R. J., Passerello, G. A., and Regayre, L. A.: FAIR v1.3: a simple emissions-based impulse response and carbon cycle model, Geosci. Model Dev., 11, 2273–2297, https://doi.org/10.5194/gmd-11-2273-2018, 2018.
Solar Variability and Climate Group: SATIRE model reconstruction of total and spectral solar irradiance, Max Planck Institute for Solar System Research [data set], https://doi.org/10.17617/1.5U, 2017.
Thompson, A. J., Zhu, J., Poulsen, C. J., Tierney, J. E., and Skinner, C. B.: Northern Hemisphere vegetation change drives a Holocene thermal maximum, Sci. Adv., 8, eabj6535, https://doi.org/10.1126/sciadv.abj6535, 2022.
Timmreck, C.: Modeling the climatic effects of large explosive volcanic eruptions, WIREs Clim. Change, 3, 545–564, https://doi.org/10.1002/wcc.192, 2012.
Toohey, M. and Sigl, M.: Volcanic stratospheric sulfur injections and aerosol optical depth from 500 BCE to 1900 CE, Earth Syst. Sci. Data, 9, 809–831, https://doi.org/10.5194/essd-9-809-2017, 2017.
Toohey, M. and Sigl, M.: Reconstructed volcanic stratospheric sulfur injections and aerosol optical depth, 500 BCE to 1900 CE, version 3, World Data Center for Climate (WDCC) at DKRZ [data set], https://doi.org/10.26050/WDCC/eVolv2k_v3, 2019.
Toohey, M., Stevens, B., Schmidt, H., and Timmreck, C.: Easy Volcanic Aerosol (EVA v1.0): an idealized forcing generator for climate simulations, Geosci. Model Dev., 9, 4049–4070, https://doi.org/10.5194/gmd-9-4049-2016, 2016.
van Dijk, E., Jungclaus, J., Lorenz, S., Timmreck, C., and Krüger, K.: Was there a volcanic-induced long-lasting cooling over the Northern Hemisphere in the mid-6th–7th century?, Clim. Past, 18, 1601–1623, https://doi.org/10.5194/cp-18-1601-2022, 2022.
van Dijk, E. J. C., Jungclaus, J., Sigl, M., Timmreck, C., and Krüger, K.: High-frequency climate forcing causes prolonged cold periods in the Holocene, Commun. Earth Environ., 5, 1–9, https://doi.org/10.1038/s43247-024-01380-0, 2024.
Verkerk, M., Aubry, T., Smith, C., and Hopcroft, P.: Large ensemble simulations of Holocene temperature and volcanic forcing, Zenodo [data set], https://doi.org/10.5281/zenodo.14170014, 2024.
Vernier, J.-P., Aubry, T. J., Timmreck, C., Schmidt, A., Clarisse, L., Prata, F., Theys, N., Prata, A. T., Mann, G., Choi, H., Carn, S., Rigby, R., Loughlin, S. C., and Stevenson, J. A.: The 2019 Raikoke eruption as a testbed used by the Volcano Response group for rapid assessment of volcanic atmospheric impacts, Atmos. Chem. Phys., 24, 5765–5782, https://doi.org/10.5194/acp-24-5765-2024, 2024.
Wainman, L., Marshall, L. R., and Schmidt, A.: Utilising a multi-proxy to model comparison to constrain the season and regionally heterogeneous impacts of the Mt Samalas 1257 eruption, Clim. Past, 20, 951–968, https://doi.org/10.5194/cp-20-951-2024, 2024.
Wanner, H., Pfister, C., and Neukom, R.: The variable European Little Ice Age, Quat. Sci. Rev., 287, 107531, https://doi.org/10.1016/j.quascirev.2022.107531, 2022.
Watson-Parris, D., Rao, Y., Olivié, D., Seland, Ø., Nowack, P., Camps-Valls, G., Stier, P., Bouabid, S., Dewey, M., Fons, E., Gonzalez, J., Harder, P., Jeggle, K., Lenhardt, J., Manshausen, P., Novitasari, M., Ricard, L., and Roesch, C.: ClimateBench v1.0: A Benchmark for Data-Driven Climate Projections, J. Adv. Model. Earth Syst., 14, e2021MS002954, https://doi.org/10.1029/2021MS002954, 2022.
Wilson, R., Anchukaitis, K., Briffa, K. R., Büntgen, U., Cook, E., D'Arrigo, R., Davi, N., Esper, J., Frank, D., Gunnarson, B., Hegerl, G., Helama, S., Klesse, S., Krusic, P. J., Linderholm, H. W., Myglan, V., Osborn, T. J., Rydval, M., Schneider, L., Schurer, A., Wiles, G., Zhang, P., and Zorita, E.: Last millennium northern hemisphere summer temperatures from tree rings: Part I: The long term context, Quat. Sci. Rev., 134, 1–18, https://doi.org/10.1016/j.quascirev.2015.12.005, 2016a.
Wilson, R. J. S., Anchukaitis, K. J., Briffa, K. R., Büntgen, U., Cook, E. R., D'Arrigo, R. D., Davi, N. K., Esper, J., Frank, D. C., Gunnarson, B. E., Hegerl, G. C., Helama, S., Klesse, S., Krusic, P. J., Linderholm, H. W., Myglan, V. S., Osborn, T. J., Rydval, M., Schneider, L., Schurer, A. P., Wiles, G., Zhang, P., and Zorita, E.: NOAA/WDS Paleoclimatology – Northern Hemisphere 1250 Year N-TREND Summer Temperature Reconstructions, NOAA National Centers for Environmental Information [data set], https://doi.org/10.25921/kztr-jd59, 2016b.
Wu, C.-J., Krivova, N. A., Solanki, S. K., and Usoskin, I. G.: Solar total and spectral irradiance reconstruction over the last 9000 years, Astron. Astrophys., 620, A120, https://doi.org/10.1051/0004-6361/201832956, 2018.
Yeager, S. G., Shields, C. A., Large, W. G., and Hack, J. J.: The Low-Resolution CCSM3, J. Climate, 19, 2545–2566, https://doi.org/10.1175/JCLI3744.1, 2006.
Zanchettin, D., Timmreck, C., Toohey, M., Jungclaus, J. H., Bittner, M., Lorenz, S. J., and Rubino, A.: Clarifying the Relative Role of Forcing Uncertainties and Initial-Condition Unknowns in Spreading the Climate Response to Volcanic Eruptions, Geophys. Res. Lett., 46, 1602–1611, https://doi.org/10.1029/2018GL081018, 2019.
Zanchettin, D., Timmreck, C., Khodri, M., Schmidt, A., Toohey, M., Abe, M., Bekki, S., Cole, J., Fang, S.-W., Feng, W., Hegerl, G., Johnson, B., Lebas, N., LeGrande, A. N., Mann, G. W., Marshall, L., Rieger, L., Robock, A., Rubinetti, S., Tsigaridis, K., and Weierbach, H.: Effects of forcing differences and initial conditions on inter-model agreement in the VolMIP volc-pinatubo-full experiment, Geosci. Model Dev., 15, 2265–2292, https://doi.org/10.5194/gmd-15-2265-2022, 2022.
Zdanowicz, C. M., Zielinski, G. A., and Germani, M. S.: Mount Mazama eruption: Calendrical age verified and atmospheric impact assessed, Geology, 27, 621–624, https://doi.org/10.1130/0091-7613(1999)027<0621:MMECAV>2.3.CO;2, 1999.