the Creative Commons Attribution 4.0 License.
the Creative Commons Attribution 4.0 License.
 | 31 Jul 2025
Climate variability off Africa's southern Cape over the past 260 000 years
Karl Purcell
Margit H. Simon
Ellie J. Pryor
Simon J. Armitage
H. J. L. van der Lubbe
Eystein Jansen
During the late Quaternary, the climatic conditions in southern South Africa experienced significant fluctuations, notably in temperatures and precipitation. These fluctuations were related to changes in the atmospheric and oceanic circulation systems from the subtropics and mid-latitudes, which are themselves affected by changes in orbital parameters. At the same time, this region preserves some of the most abundant Middle Stone Age (MSA) archaeological sites containing records of Homo sapiens behavioural and technological evolution. Consequently, there is a pressing need for precise climatic reconstructions that can provide climate constraints for the region's MSA record. However, there is a lack of continuous high-resolution climate records covering the majority of the MSA period, which spans ∼300 to ∼40 ka. In this study, we present data obtained from a marine sediment core (MD20-3592) that spans approximately the last 260 000 years (from marine isotope stages (MISs) 8 to 1) aiming to expand the spatial and temporal coverage of available climate archives in this region (including sediment cores, speleothems and hyrax middens). This marine sediment core documents both terrestrial hydroclimate and ocean variability because it is strategically positioned close to the South African coastline receiving terrestrial sediments via riverine input as well as being located under the marine influence of the Agulhas Current at the same time. X-ray fluorescence (XRF) core scanning, calibrated with discrete samples analysed by XRF spectroscopy, was used to determine the variability in the bulk elemental composition of the core over time. Spectral analyses reveal that the regional hydroclimate was mostly affected by local insolation changes caused by orbital precession and high-latitude forcing that varies on timescales associated with orbital obliquity and eccentricity. Increased fluvial input was associated with high local insolation due to the effects of precession on local convergence and seasonal rainfall. Comparison with other regional climate archives as mentioned confirmed the dominant influence of precession on precipitation in southern South Africa. On glacial–interglacial timescales, lower precipitation observed during glacial intervals could be explained by a northward shift in the Southern Hemisphere Westerlies (SHW) and South Indian Ocean Convergence Zone (SIOCZ). Finally, the data from core MD20-3592 can provide a climatic context for archaeological evidence in South Africa during the MSA.
- Article
(8724 KB) - Full-text XML
-
Supplement
(6616 KB) - BibTeX
- EndNote


Multiple archaeological sites in southern South Africa record the development of behavioural complexity in anatomically modern humans, Homo sapiens, between 120 and 50 ka (e.g. Bradfield et al., 2020; Brown et al., 2009; d'Errico and Henshilwood, 2007; Henshilwood et al., 2009, 2014, 2018; Mourre et al., 2010; Wurz, 2002, 2012). The findings in these sites highlight shifts towards more complex behaviours that include signs of abstract thinking, planning depth, innovativeness and symbolic behaviour (Mcbrearty and Brooks, 2000). The drivers of this critical transformation remain poorly understood, but one frequently suggested mechanism proposes that the complex behavioural changes may have been stimulated by the need to adapt to changing environmental and climatic conditions (e.g. Bar-Matthews et al., 2010; McCall and Thomas, 2012; Beyin et al., 2023). Verifying this mechanism is complicated by the absence of a strong framework to establish the causal link between climate and the inferred behavioural changes (Behrensmeyer, 2006) and by a dearth of high-resolution records available for southern African environmental and climatic change at this time interval (e.g. Chase, 2021). Thus, reconstructing the climatic conditions in southern Africa can help to contextualise the climatic conditions during this important interval. More specifically, precipitation over this region was highly variable during the last two glacial cycles (Simon et al., 2015) and could have had a major impact on the availability of resources to early humans in that area.
One aspect of this variability in precipitation is its impact on vegetation characteristics and ultimately small- and large-mammal distribution. It has been suggested that during MISs 5b and 4, the coastal lowlands in the southern Cape experienced higher summer rainfall and higher abundances of C4 grasses than during MIS 5a and MIS 3 (Braun et al., 2020). Increasing amounts of summer rainfall are associated with an increase in the percentage of C4 grasses, likely due to the fact that C4 grasses grow mainly in the summer months (Braun et al., 2020; Cowling, 1983). One driver of precipitation changes along coastal environments is the strong influence of the Agulhas Current (Chase and Quick, 2018). These authors propose that the warm Agulhas Current modifies the surface heat flux and increases the flow of moist air onshore, creating localised environmental conditions near the coast during the Holocene.
Further inland, solar insolation changes linked to orbital precession (23–19 ka cycles) seemed to have a stronger impact on vegetation (Braun et al., 2020) than the Agulhas Current. Precession has been repeatedly identified in records from southern Africa (e.g. Collins et al., 2014; Chase, 2021; Partridge et al., 1997; Simon et al., 2015). The most common interpretation is that this signal in southern African records is caused by changes in local summer insolation due to changes in precession. Higher summer insolation in the Southern Hemisphere (SH) is thought to strengthen the continental heat low and thus increase tropical–temperate troughs and convective rainfall over the southern coast of South Africa (Braun et al., 2020). However, the precession signal has had diverging interpretations, with it being assigned to changes in either high-latitude or low-latitude forcing mechanisms (cf. Chase, 2021; Collins et al., 2014; Stuut et al., 2002). In southwestern Africa, Chase (2021) discusses the possibility that the reduction in high-latitude boreal summer insolation could have induced cooler conditions and an expansion or equatorward shift in the Southern Hemisphere Westerlies (SHW), which would have increased winter rainfall. In southeastern Africa, one proposed mechanism is that the African tropical rainbelt was shifted poleward due to Northern Hemisphere cooling (Chase, 2021; Schefuß et al., 2011). An additional hypothesis is that the impact of local summer insolation changed through time, with a shift from low-latitude to high-latitude dominant forcing during the 70–14 ka period (MISs 4–2) (Chase, 2021).
The role of obliquity (41 ka cycles) on the hydroclimate of southern Africa is still debated (Chase, 2021; Daniau et al., 2023). This cycle has rarely been identified in records from southern Africa (Chase, 2021; Daniau et al., 2023). Furthermore, its origin remains a subject of debate, with prevailing interpretations suggesting a connection to high-northern-latitude insolation and ice sheets (Chase, 2021), while model experiments indicate that changes paced by obliquity can occur at lower latitudes independently of changes in ice sheets (Bosmans et al., 2015). One mechanism through which obliquity can affect the hydroclimate is by modulating the South African monsoon by influencing the cross-equatorial insolation gradient and transport of moisture (Bosmans et al., 2015; Daniau et al., 2023).
The effects of changes in high-latitude climate forcing, related to ice sheet volume, have been frequently invoked as a driver of southern African climate (e.g. Caley et al., 2018; Castañeda et al., 2016; Chase, 2021; Simon et al., 2015). There is still active debate on the main determinants of the pacing of the glacial–interglacial cycles, with precession and obliquity thought to play a major role, while eccentricity modulates the precession cycle (Chase, 2021; Huybers, 2006; Maslin and Ridgwell, 2005; Tzedakis et al., 2017). Nevertheless, the ∼ 100 ka frequency linked with orbital eccentricity is observable in a limited number of southeastern African records and with variable levels of influence (Chase, 2021). For instance, core MD96-2048 displays a strong positive correlation between eccentricity and humid periods (Caley et al., 2018), while core CD154-10-06P does not (Fig. 1; Chase, 2021; Simon et al., 2015). The discrepancies can be explained by spatial differences in the influence of eccentricity or the interplay of different forcing mechanisms (Chase, 2021). On glacial–interglacial timescale, one hypothesis that has been brought forward is that during glacials, the SHW, as well as the Intertropical Convergence Zone (ITCZ) and tropical easterlies, shifted northwards (Braun et al., 2020; Chase and Meadows, 2007; van Zinderen Bakker, 1976). This would cause an extension of the winter rainfall zone (WRZ) northwards and more arid conditions in the summer rainfall zone (SRZ) (Braun et al., 2020). An alternative hypothesis is that during glacials the ITCZ and tropical easterlies were shifted southward due to the Northern Hemisphere cooling more than the Southern Hemisphere (Broccoli et al., 2006).
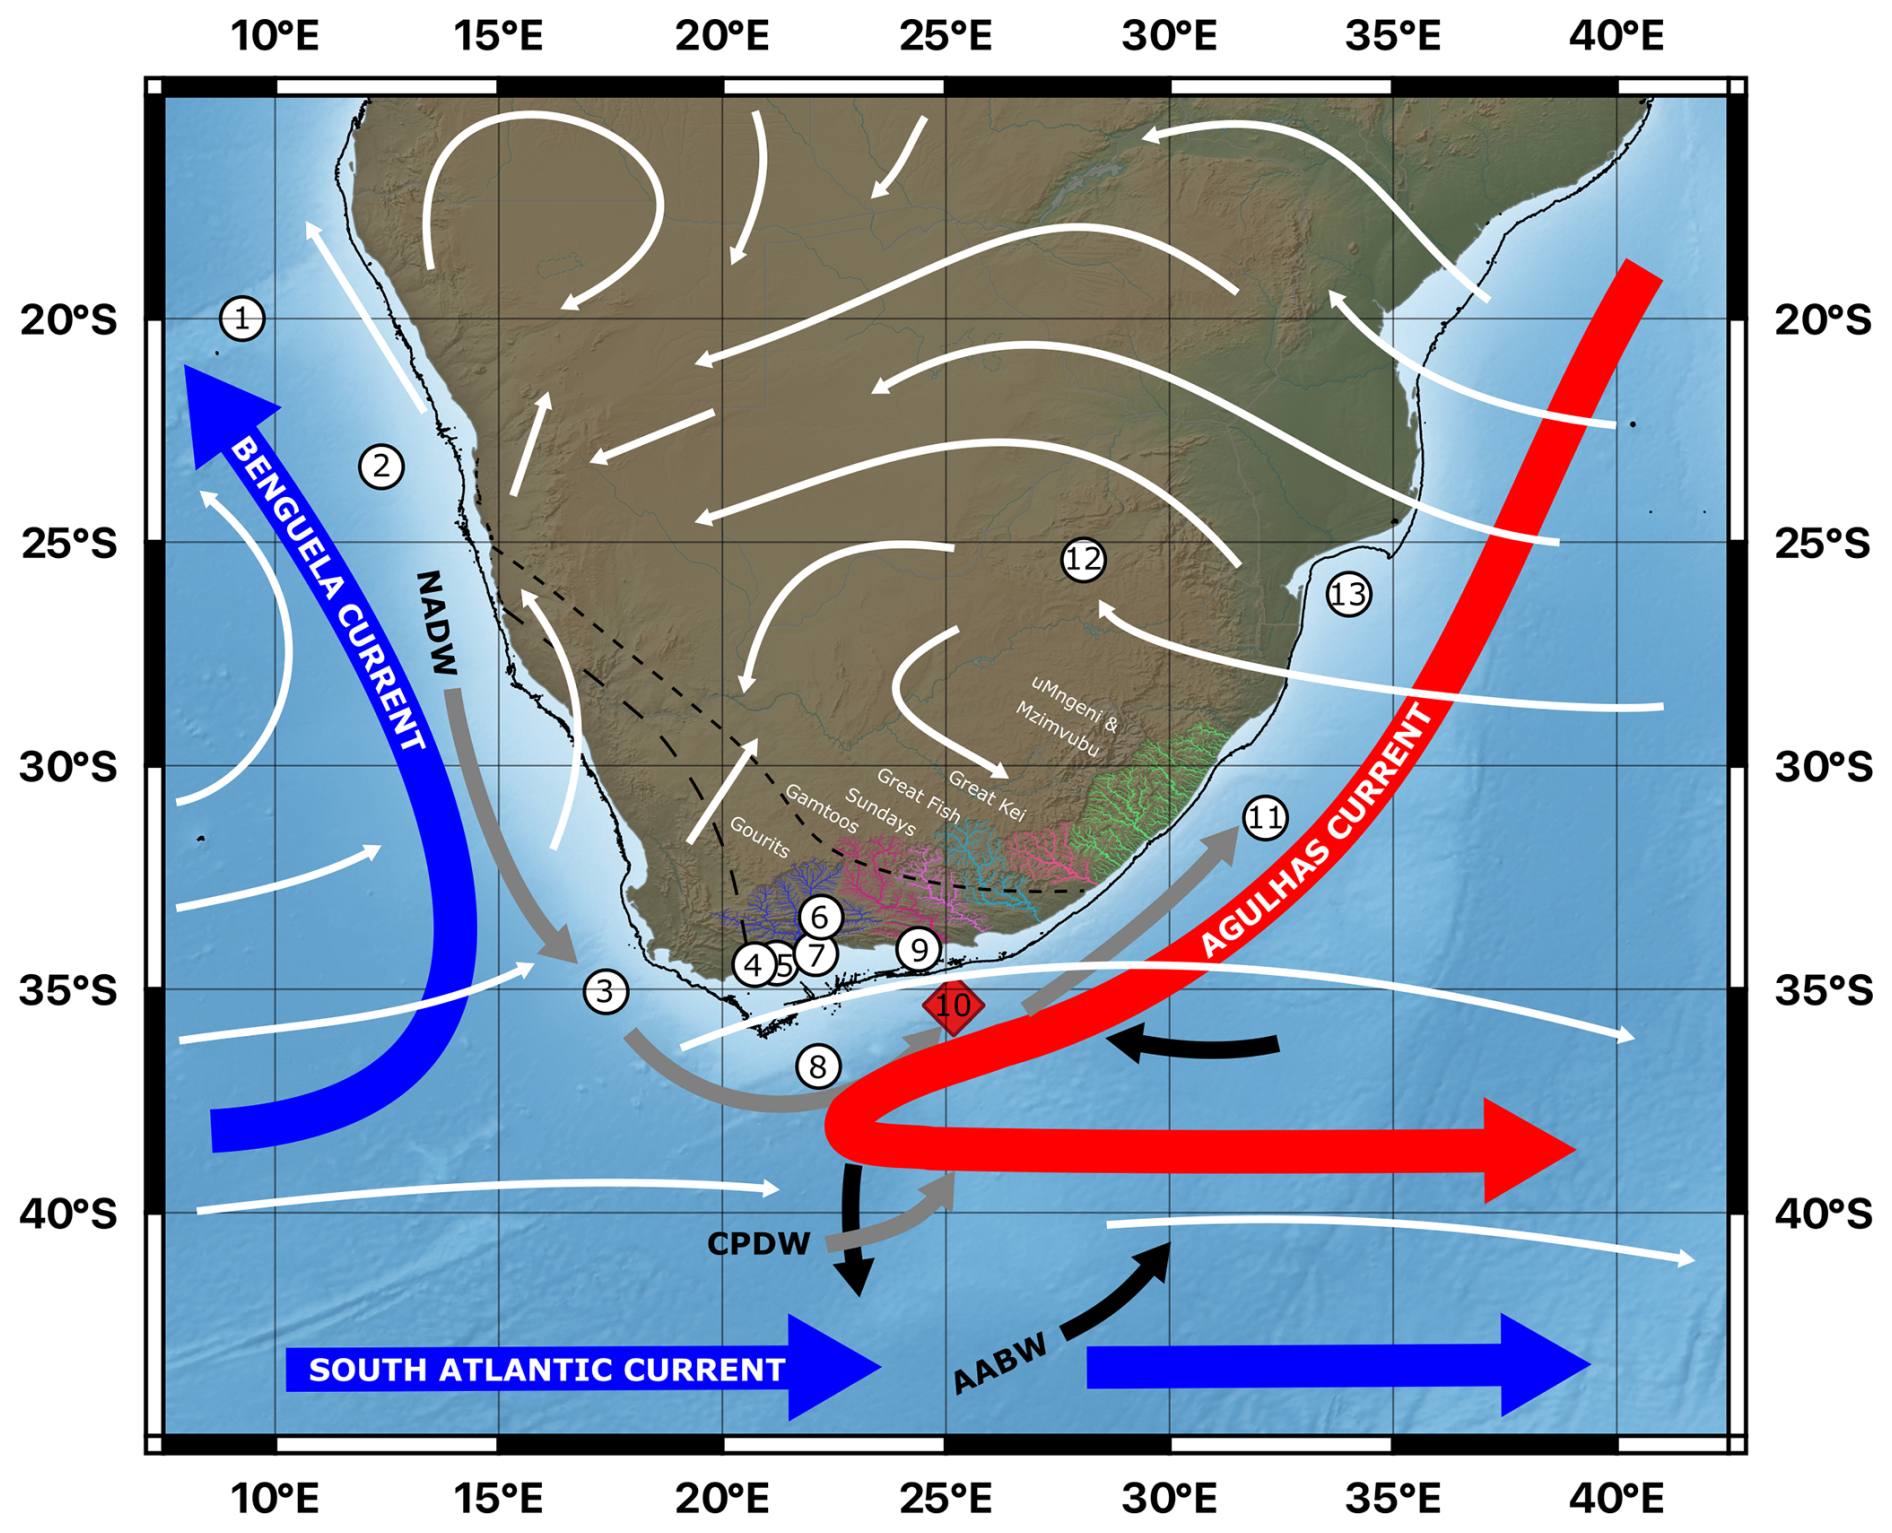
Figure 1Locations of study core, climatic archives and archaeological sites in southern Africa. The winter rainfall zone (WRZ), year-round rainfall zone (YRZ) and summer rainfall zone (SRZ) are shown and delimited by dashed lines (Hahn et al., 2021a). The −130 m isobath (Last Glacial Maximum (LGM)) shoreline: Cawthra et al., 2020b) is indicated by a black line. Dominant surface winds are represented by white arrows, surface currents by blue (cold) and red (warm) arrows, deep water flow by grey arrows (NADW, North Atlantic Deep Water; CDW, Circumpolar Deep Water), and bottom water flow by black arrows (AABW, Antarctic Bottom Water) (van Aken et al., 2004; Franzese et al., 2009; Chase, 2021). Relevant river basins are highlighted in colours along the Western Cape, the Eastern Cape and the KwaZulu-Natal province. Study core MD20-3592 is shown with a red diamond, while other palaeoclimatological and archaeological sites mentioned are indicated by white circles: (1) core MD96-2094 (Stuut et al., 2002), (2) core MD08-3167 (Collins et al., 2014), (3) core IODP site U1479 (Dupont et al., 2022), (4) Klipdrift shelter cave site (Henshilwood et al., 2014), (5) Blombos Cave site (Henshilwood et al., 2011), (6) Cape Fold Composite (Chase et al., 2021), (7) Pinnacle point (Brown et al., 2009), (8) MD20-3591 (Pryor et al., 2024), (9) Klasies River caves (d'Errico and Henshilwood, 2007), (11) core CD154 10-06P (Simon et al., 2015), (12) Tswaing Crater (Partridge et al., 1997) and (13) core MD96-2048 (Caley et al., 2018). Additional information on the palaeoclimatological and archaeological sites is presented in Table S1.
The hydroclimate of southern Africa is recorded in multiple terrestrial and marine climate archives (e.g. Chase, 2021). However, the southern part of South Africa is poorly resolved, especially on orbital timescales (Fig. 1). This study aims to extend the spatial coverage of palaeoclimatic reconstructions in the region by providing a high-resolution and continuous record of terrestrial climate for the highlighted river catchments (Fig. 1). The objectives are (1) to characterise the provenance of the sediment carrying the climate signal, (2) to construct a hydroclimatic proxy record for this region covering the last 260 ka and (3) to investigate the drivers of hydroclimatic variations on orbital timescales. Our starting hypothesis is that regional hydroclimate variability in southern South Africa over the past 260 ka is primarily driven by changes in local summer insolation associated with orbital precession and modulated by high-latitude climate dynamics linked to orbital obliquity and eccentricity, which together control precipitation patterns and their influence on sedimentary records. To test this hypothesis, we analysed the elemental composition of a 260 ka sediment sequence recovered from core site MD20-3592 located off the southern coast of South Africa (see Sect. 3.3).
In this study, we analysed marine sediment core MD20-3592 (35°21.726′ S, 25°10.302′ E; 4078 m water depth; Fig. 1) which was retrieved in the southwest Indian Ocean during the MD225 ACCLIMATE-2 cruise of the R/V Marion Dufresne (Vazquez Riveiros and Waelbroeck, 2020). The core site is situated beneath the surface Agulhas Current on the bottom of the Agulhas Passage, a channel that is bounded by the Agulhas Bank to the north and the Agulhas Plateau to the south (Uenzelmann-Neben and Huhn, 2009). The core is located offshore of a number of well-documented archaeological sites (Fig. 1) and is therefore an ideal candidate to reconstruct terrestrial climatic conditions experienced at coastal sites such as Klasies River Main, Blombos Cave, Pinnacle Point and Klipdrift Shelter.
A sediment provenance study found that the sediments near the study site (Fig. 1) are predominantly derived from local terrestrial sources, with additional contributions from eastern South Africa and eastern Africa, transported by the Agulhas Current (Franzese et al., 2009). Six major rivers discharge their sediments from the South African continental margin into the ocean near the study site: the Gourits river in the Western Cape province; the Gamtoos, Sundays and Great Fish rivers in the Eastern Cape province; and the Umgeni and Mzimvubu rivers in the KwaZulu-Natal province (Fig. 1). These rivers serve as the nearest sources of terrestrial material to the South African continental margin, with variations in their sediment composition reflecting fluctuations in sediment supply. These shifts, in turn, are driven by changes in rainfall within their catchment areas (Simon et al., 2015). The mouths of the rivers mentioned above in the Western Cape and Eastern Cape are at present between ∼ 150 and ∼ 400 km away from site MD20-3592. However, during periods of lower sea levels such as the Last Glacial Maximum (LGM) (see Fig. 1), their course would have been extended seaward up to 100 km, bringing the river mouths much closer to the core site (Cawthra et al., 2020b). Accordingly, changes in sediment composition observed throughout the core can be interpreted as indicating changes in the sediment supply to the core from nearby river catchments (i.e. rainfall amount) or in distance of the coring site to the river mouths (i.e. eustatic sea-level change).
The river catchments of the Gourits, Gamtoos, Sundays and Great Fish have a large portion that is located in the year-round rainfall zone (YRZ), a region which receives approximately equal precipitation during the winter and summer months (Chase and Meadows, 2007; Fig. 1) and is located between the SRZ and the WRZ (Chase and Meadows, 2007; Fig. 1). The Gamtoos, Sundays, Great Fish, Great Kei, Umgeni and Mzimvubu rivers are located in part or totally in the SRZ, where over 66 % of the rain falls between October–March (Fig. 1). Most of the rain in this zone can be attributed to the South Indian Ocean Convergence Zone (SIOCZ), which is a band of enhanced precipitation that extends from southern Africa into the southwest Indian Ocean, from 10–40° S to 0–60° E (Cook, 2000; Hahn et al., 2021b; Lazenby et al., 2016). Rainfall from the Indian Ocean is brought eastward by tropical–temperate troughs (TTTs), which form at the SIOCZ (Hahn et al., 2021b; Jury et al., 1993; Reason and Mulenga, 1999). These subtropical systems are driven by high sea surface temperatures (SSTs) and warming of the continents during the summer to establish strong convection cells (Chase and Meadows, 2007). The WRZ, with over 66 % of its precipitation occurring between April and September, is located along the western coast of the Western Cape province, the Northern Cape province and southern Namibia (Chase and Meadows, 2007; Fig. 1). It receives moisture from the Atlantic Ocean brought by temperate frontal systems linked to the SHW (Chase and Meadows, 2007).
A smaller proportion of the sediments near the study site has been found to originate from the southwest Atlantic, and this portion is thought to be brought by deep waters (Franzese et al., 2006), namely Antarctic Bottom Water (AABW) and North Atlantic Deep Water (NADW) which flows through the Agulhas Passage from southwest to northeast (Uenzelmann-Neben and Huhn, 2009; Fig. 1). Another potential source of terrigenous sediments to the study site is aeolian dust; however the southern coast of South Africa currently receives less than 1 g m−2 yr−1 of aeolian dust and up to 10 g m−2 yr−1 during dustier intervals such as the Last Glacial Maximum (LGM) (Maher et al., 2010). This represents ∼1 % to ∼7 % of the inferred sediment accumulation rate at the study site (142 g m−2 yr−1; see Sect. 4.2.2).
3.1 Planktonic foraminifera δ18O measurements
Samples were taken every ∼8 cm, with 10 specimens of Globigerinoides ruber (G. ruber) from size fraction 212–355 µm picked per analysis. The δ18O and δ13C values were obtained using a Finnigan MAT253 MS at FARLAB at the Department of Earth Science at the University of Bergen. The results are reported relative to Vienna Pee Dee Belemnite (VPDB), expressed as the average of the replicates, calibrated with NBS-19 and independently checked using NBS-18. Long-term repeatability (1 SD) of internal standards is aggregated across weeks to months ≤0.08 for δ18O and ≤0.03 for δ13C for samples between 15 and 100 µg.
3.2 Age model
For the uppermost 50 ka in the core, the age model (Fig. 2) is based on 14 radiocarbon dates of planktonic foraminifera (G. ruber) (see Table 1). The samples contained around 1 to 2 mg of material (> 250–315 µm). Accelerator mass spectrometry (AMS) analyses were conducted at the Laboratory of Ion Beam Physics Zurich at ETH Zurich in Switzerland. To calibrate individual radiocarbon dates for the upper portion of the core, we used the Marine20 radiocarbon age calibration curve (Heaton et al., 2020), with a local reservoir correction (ΔR) of 36±35 years obtained by averaging the reservoir correction of the 5 measurements which are closest to the coring site (Reimer and Reimer, 2001). Calibration of the radiocarbon dates was performed with the Bayesian 14C calibration software MatCal (Lougheed and Obrochta, 2016). The uncertainty on the radiocarbon dates is indicated in Table 1.
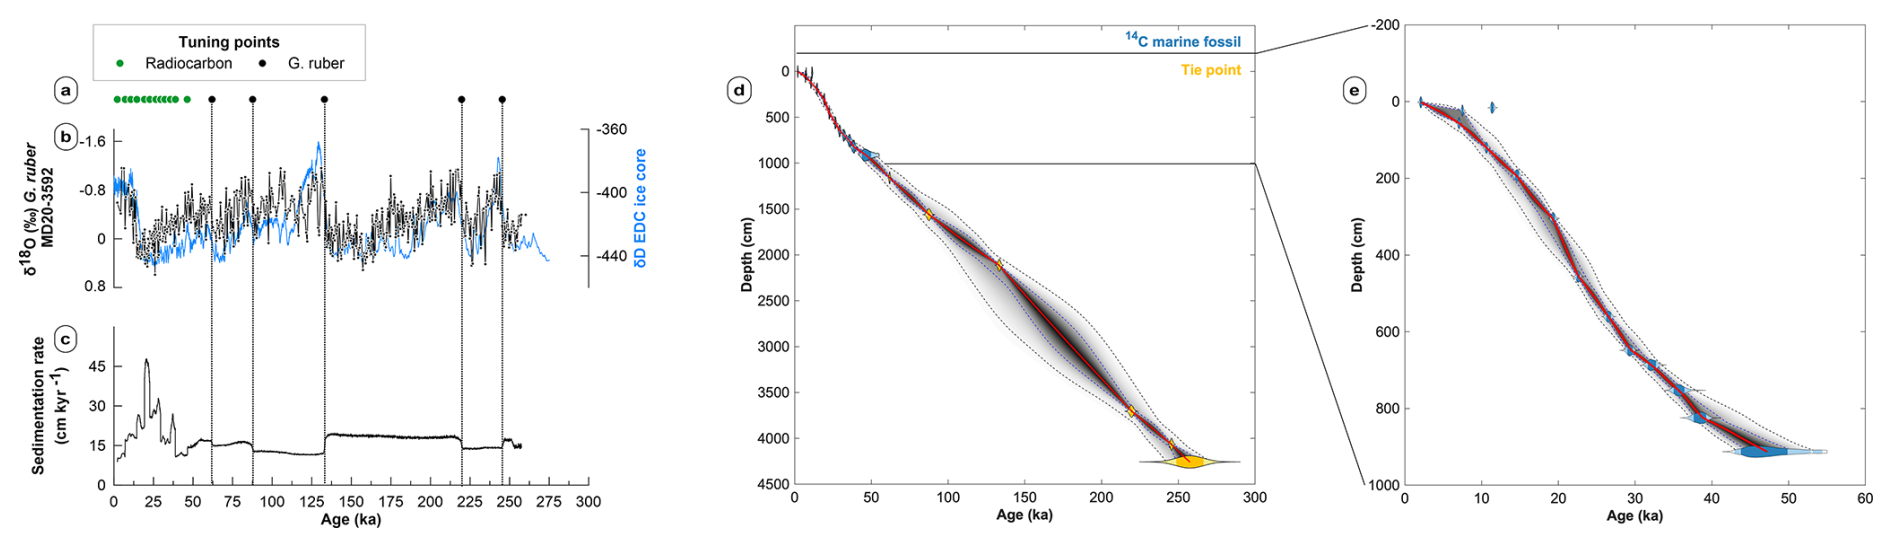
Figure 2Age model for core site MD20-3592. (a) Age control points: radiocarbon dates in green and G. ruber δ18O in black. (b) Graphical correlation of G. ruber δ18O (black line) with the 5-point-averaged EDC δD record (blue line) on the AICC2023 chronology (Bouchet et al., 2023; Jouzel et al., 2007). (c) Sedimentation rate calculated with “Undatable”. (d) Age–depth model produced for MD20-3592 with “Undatable”. (e) Close-up of the age–depth model for the radiocarbon dates. The radiocarbon dates are represented by blue probability density functions, with the deep blue representing 1σ and the light blue 2σ uncertainty. The tie points from the δ18O are represented by yellow density function, with the deep yellow representing 1σ and the light yellow 2σ uncertainty. The grey clouds indicate probability density for the age–depth model, with darker colours indicating higher age–depth probabilities. Blue and black dashed lines represent 68.27 % and 95.45 % confidence intervals, respectively. The red line shows the age–depth model median. An age reversal is observed around 7 ka, with the older age exerting less influence in the age model. An additional reversal is observed around 10 ka, but here the age is excluded from the model as an outlier.
Table 1AMS radiocarbon analyses on G. ruber from core MD20-3592. For calibration, the Marine20 curve (Heaton et al., 2020) was used with ΔR of 36±35 years.
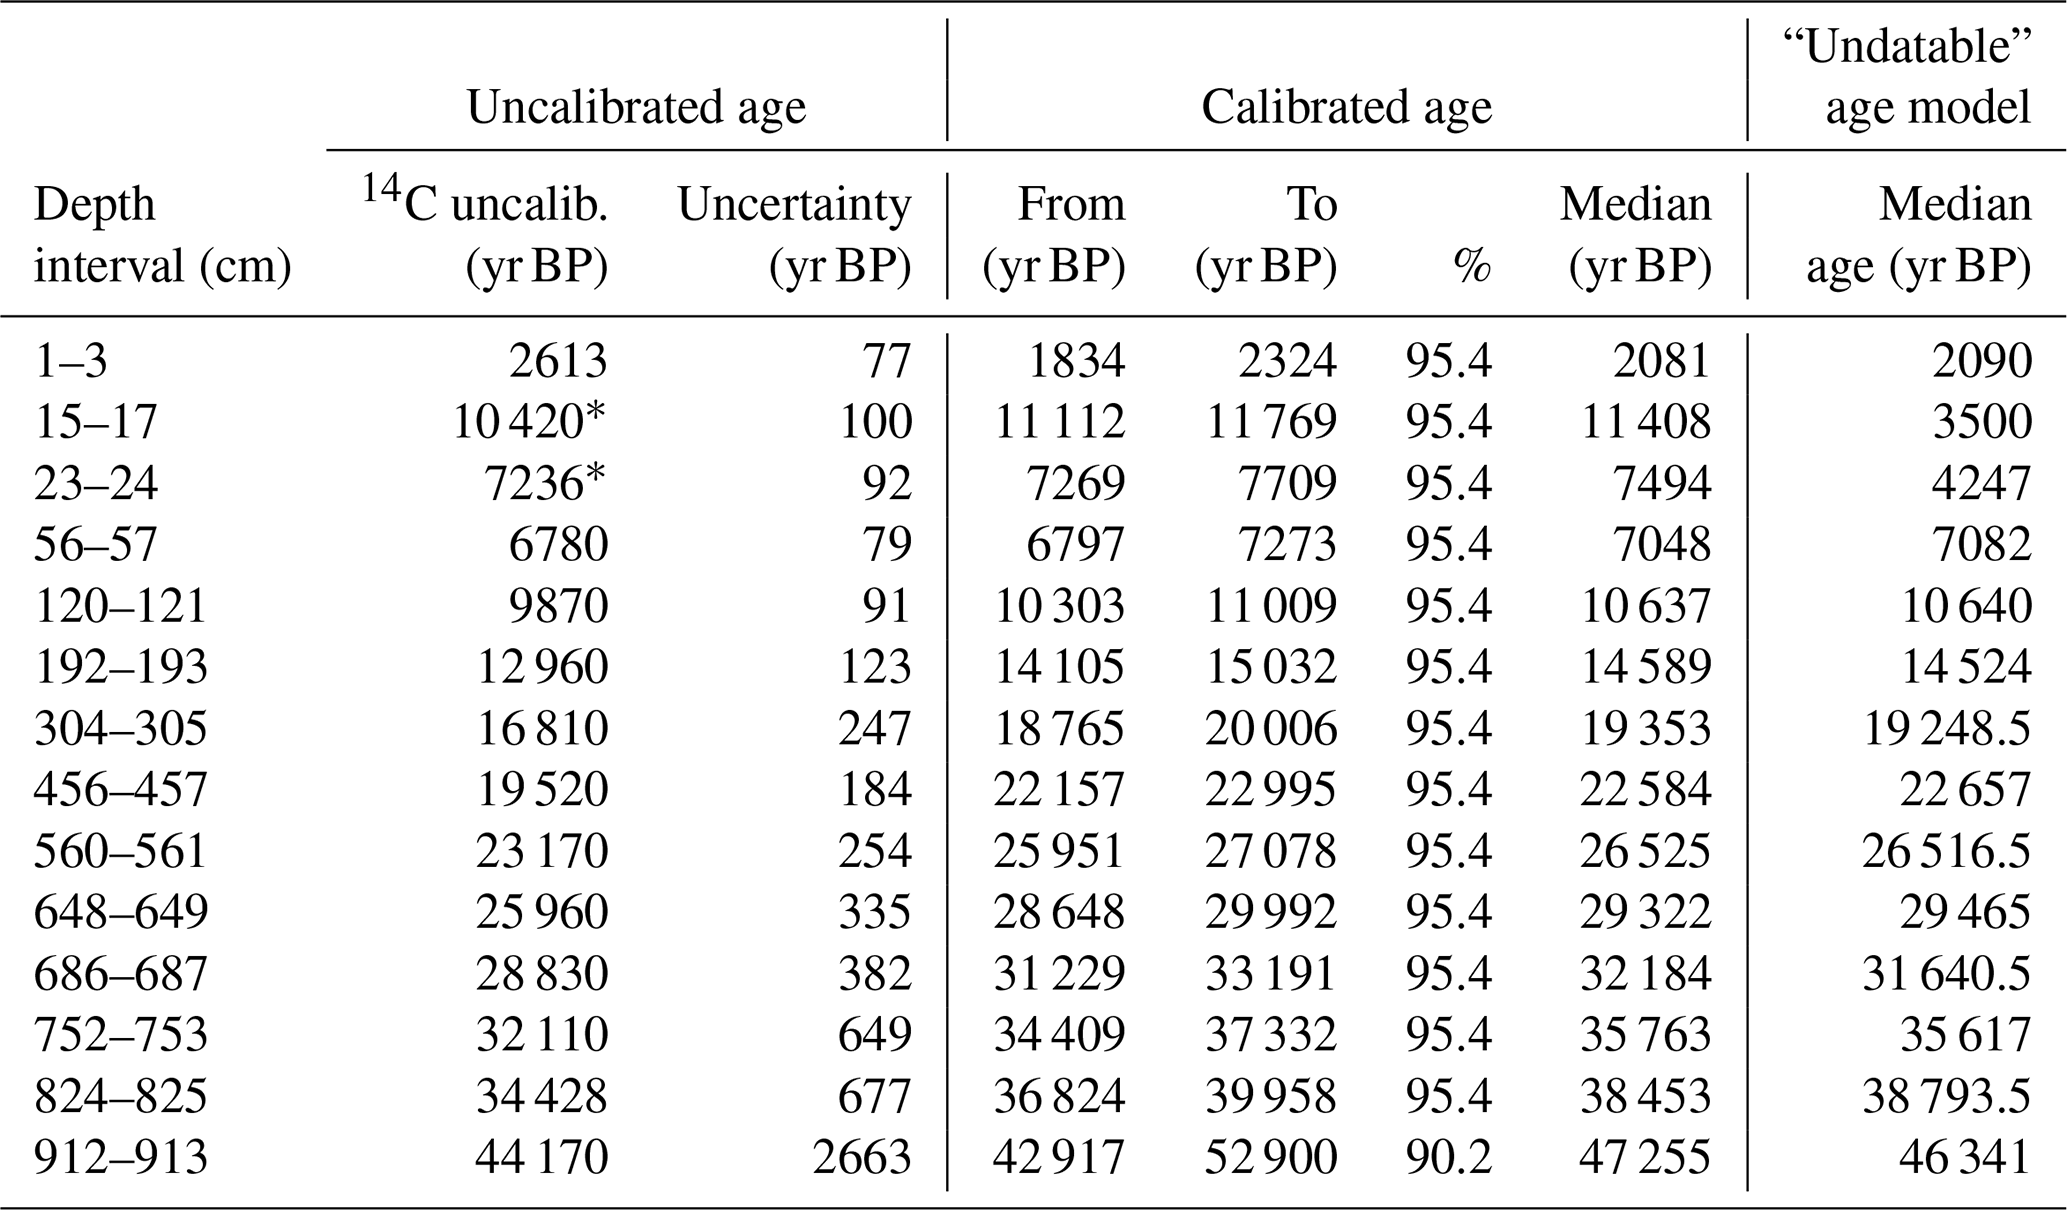
∗ The radiocarbon dates at 15–17 and 23–24 cm were rejected by “Undatable” as outliers.
Beyond the age range of the radiocarbon method, the chronology of core MD20-3592 is obtained by matching the pattern of the planktic foraminifera δ18O record with the δD record of the Antarctic ice core EPICA Dome C which comes from the Antarctic sector to the south of the coring site (EDC; Bouchet et al., 2023; Jouzel et al., 2007). The planktonic δ18O record reflects the combined influences of local sea-surface temperature and δ18O seawater fluctuation and global ice volume changes, while the δD reflects the past air temperatures in Antarctica. The δ18O values are reported relative to the VPDB scale, and the δD values are reported relative to the Vienna Standard Mean Ocean Water (VSMOW). These two records can be well matched with a relatively small number of tie points (n=5) and thus allow us to create an age model for core MD20-3592 based on the chronology of EDC. The δ18O curve is therefore graphically correlated with the EDC δD record using these 5 tie points. The tuning points have been selected at sharp climatic transitions: the end of MIS 4 (62 ka), MIS 5b (88 ka), the beginning of MIS 5e (133 ka), the end of MIS 7d (220 ka) and the end of MIS 8 (245 ka) (Fig. 2).
Using the Bayesian age–depth modelling program “Undatable” (Lougheed and Obrochta, 2019), age–depth relationships were created, taking into consideration the age and depth uncertainty of the 14C dates and δ18O chronological markers (Fig. 2). For the radiocarbon ages, the depth uncertainty covers the depth interval of the sediments sampled for each age, and the laboratory mean 14C ages are calibrated to an age distribution using the embedded “MatCal” function (Lougheed and Obrochta, 2016). For the δ18O tie points, the depth uncertainty is represented as a Gaussian function centred on the chosen tie point depth and a 1σ equal to the sampling resolution (8 cm), and the age uncertainty is estimated with the uncertainty reported for the nearest point on the EDC record (Bouchet et al., 2023). The age uncertainty on the bottom of the core is equal to the range of ages for the bottom calculated with the minimum and maximum sedimentation rate in the section dated by radiocarbon. The default values for the “xfactor” and bootstrapping percentage were set to 0.1 % and 30 %, respectively, and 105 simulations were used.
The average mass accumulation rate was calculated by multiplying the average density by the average sedimentation rate. The density measurements were conducted shortly after the core was retrieved, on board the R/V Marion Dufresne, using the MSCL (multi-sensor core logger) for geophysical properties. This instrument includes a Cs-137 gamma ray source and a detector to measure the attenuation of gamma rays, which is used to measure density. The methodology for density measurements and calculation of porosity is described in Vazquez Riveiros and Waelbroeck (2020).
3.3 Elemental composition measurement
The elemental composition of core MD20-3592 was analysed by X-ray fluorescence (XRF) core scanning, a method proven useful for palaeoclimatic reconstructions (Croudace and Rothwell, 2006). The use of elemental ratios is preferred over single elements as it reduces the influence of device-specific effects and core effects (Dunlea et al., 2020). One commonly used ratio is the ratio, used as an indicator of marine/terrestrial sedimentary inputs offshore of southern Africa (e.g. Hahn et al., 2021a). However, this ratio is sensitive to dilution effects such as enhanced biological productivity or carbonate dissolution, and therefore other ratios have been used to avoid this issue, such as , which was used in southeastern South Africa (Simon et al., 2015; Ziegler et al., 2013). A high ratio in tropical and subtropical humid areas points to considerable chemical weathering or soil erosion, likely driven by increased rainfall (Ziegler et al., 2013). One way to interpret the XRF data further is by means of principal component analysis (PCA), which effectively reduces a complex set of variables into a singular variable that maintains most of the relevant information (Taylor et al., 2022). This method offers a robust multivariate approach to analyse XRF data, capturing complex, interrelated variations that individual elemental ratios may overlook. By reducing dimensionality, PCA highlights the dominant processes driving sediment composition, such as detrital input or carbonate flux, while minimising noise and uncovering hidden relationships among elements. In contrast, individual elemental ratios provide valuable but narrower insights, which, when used alongside PCA, can complement and validate key findings. The first principal component, PC1, was further investigated in this study by spectral analysis, which includes frequency analysis, Gaussian filtering and wavelet analysis. This type of analysis allows for a clearer identification of temporal patterns linked to climatic drivers, such as orbital precession, directly testing the hypothesis.
3.3.1 XRF core scanning
XRF scanning was performed to quantify the changes in the geochemical characteristics of the sediment with a 2 mm resolution using an ITRAX core scanner from Cox Analytics (Croudace and Rothwell, 2006). Detailed information on the core preparation and core scanning can be found in the “X-ray fluorescence (XRF) core scanning” section in the supplementary material. Previous studies have used variations in sediment geochemistry to infer changes in the proportion of marine versus terrestrial deposition (e.g. ratio; Hahn et al., 2021a) or the proportion of physical and chemical weathering (e.g. ratio; Govin et al., 2012; Ziegler et al., 2013), both of which can be linked, among other factors, to changes in rainfall. The elemental counts were normalised against the sum of the total incoherent and coherent scattering to eliminate the imprint of down-core variations in the water content and organic components (Kylander et al., 2011; Davies et al., 2015). Log ratios of the element intensities were calculated since they provide the most reliable signal reflecting true sediment proportions because they avoid the problem of non-linear matrix effects and constant sum constraints (Weltje and Tjallingii, 2008; Supplement).
3.3.2 XRF calibration
The qualitative XRF data can be calibrated to convert the core scanner output to element concentrations and thus constrain the magnitude of changes in composition. Twenty discrete samples were selected for calibration throughout the core to represent the full range of elemental XRF intensity.
The samples taken from the core were freeze-dried and then were ground with an agate mortar and pestle. Around 0.1 g of bulk sediment was ignited in a furnace at 1000 °C for loss on ignition (LOI) to remove organic matter and carbonates (Dean, 1974). The samples were then digested with a mixture of HNO3 and HF in Savillex beakers on a heating plate at 135 °C. The dissolved and dried samples were subsequently dissolved in 2N HNO3. In cases where traces of undissolved oxides or sulfides were present, these were dissolved with small amounts of Aqua Regia ( 1:3). Before analysis, the samples were diluted in a solution of 2 % HNO3. Major elements (Al, B, Ba, Ca, Co, Cr, Cu, Fe, K, Li, Mg, Na Mn, Ni, P, Pb, S, Sr, Ti, V, Y, Zn, Zr) were measured using a Thermo Scientific ICap 7600 inductively coupled plasma atomic emission spectrometer (ICP-AES) at the University of Bergen. Trace elements (Ba, Co, Cr, Cs, Cu, Hf, Li, Mn, Nb, Ni, Pb, Rb, Sc, Sr, Ta, Th, Ti, U, V, Y, Zn, Zr, Ge, Mo and others) were measured with a Thermo Scientific Element XR high-resolution inductively coupled plasma mass spectrometer (HR-ICP-MS) at the University of Bergen. For both major and trace elements, the international standard BCR2 was run along the sample's measurements. The relative standard deviation displayed a precision of 0.1 % to 7.1 % for the elements of interest in BCR2.
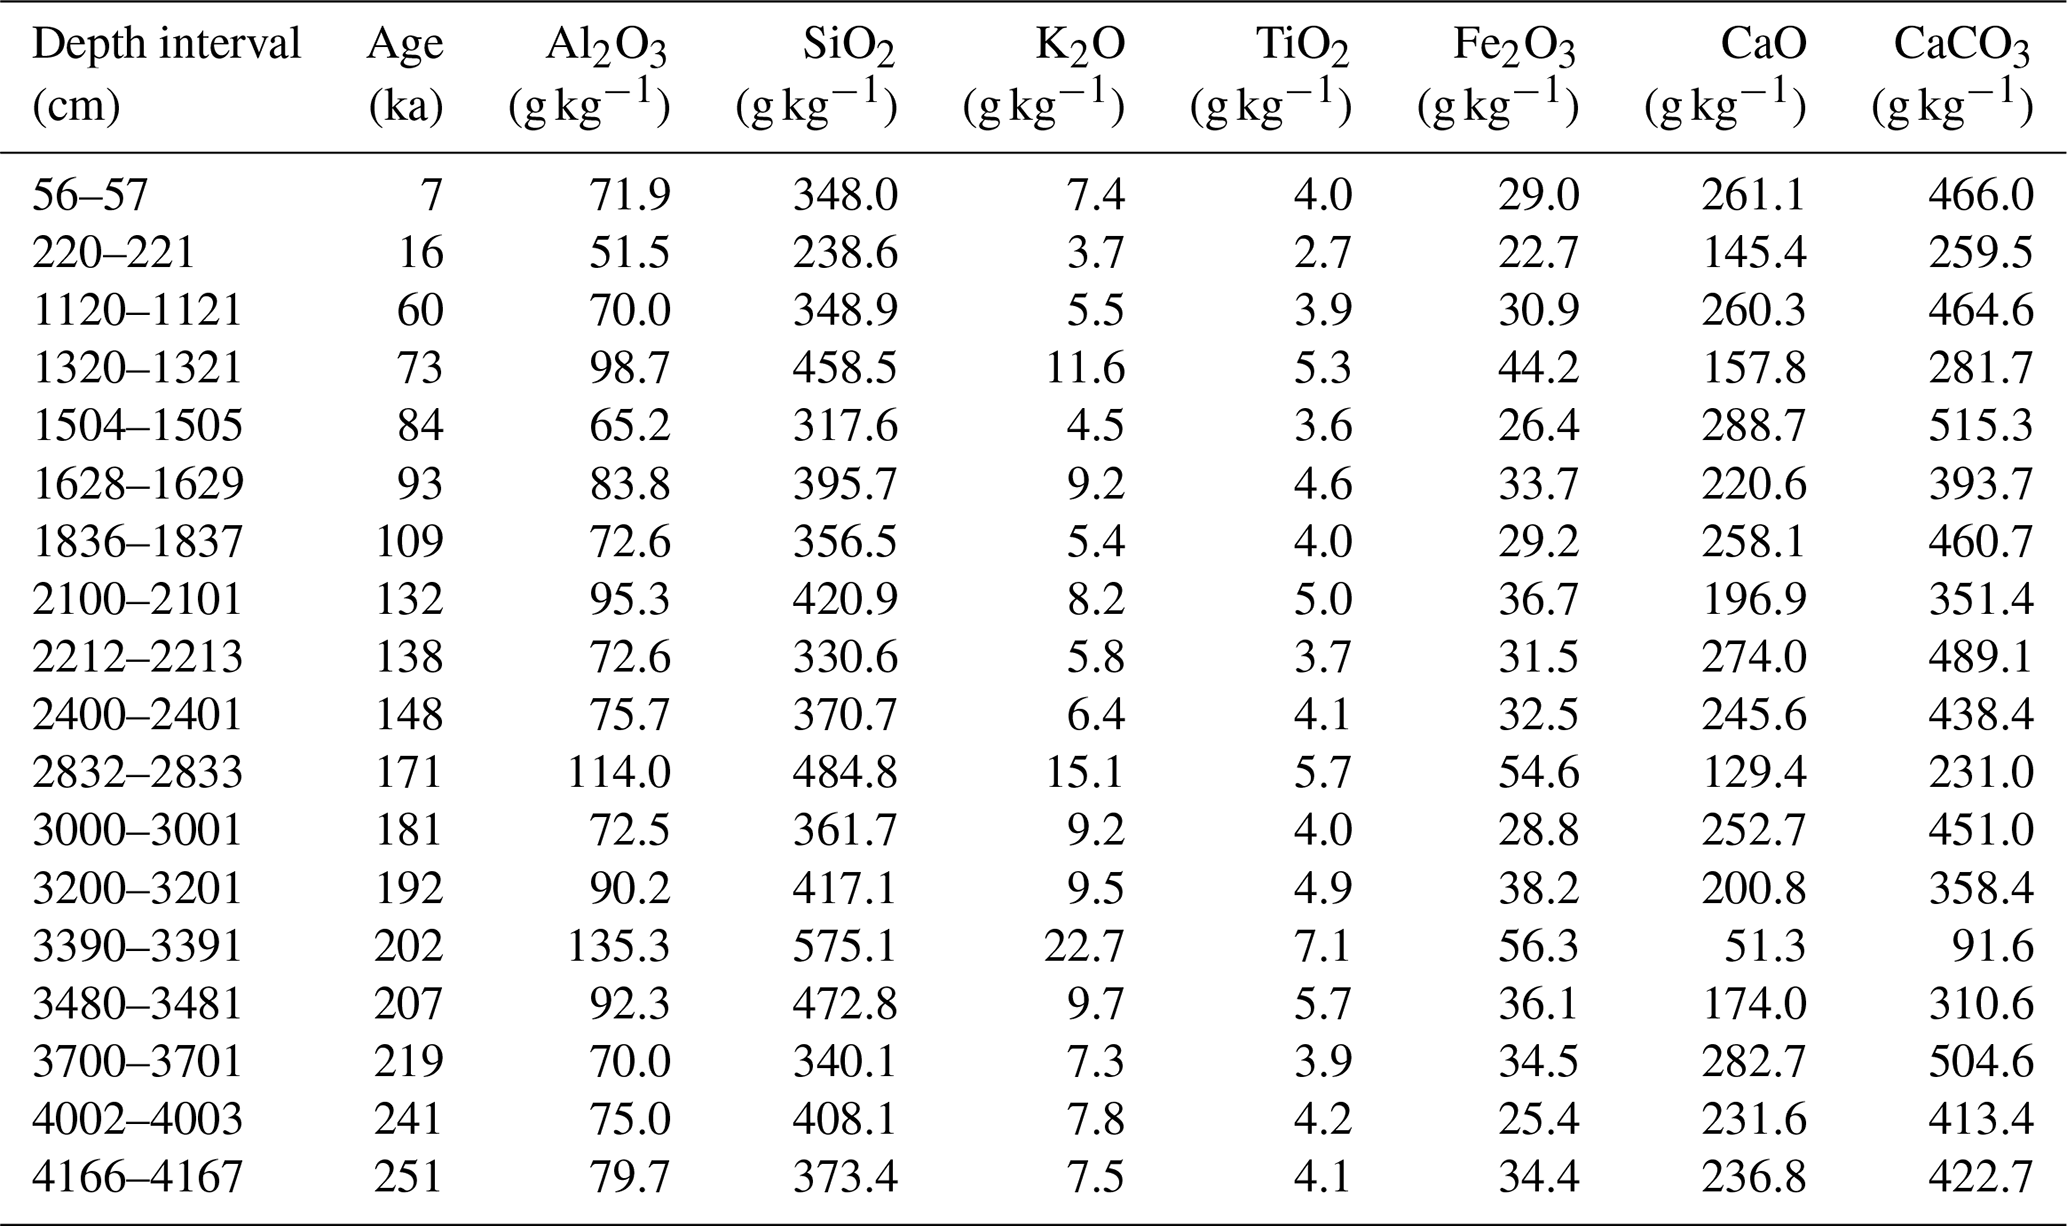
A total of 18 of the 20 discrete samples were then sub-sampled for XRF bulk chemistry analysis at the Vrije Universiteit Amsterdam (VU), with the samples at 512 and 660 cm depth having too little remaining material (see Tables 2 and S2). Bulk sediments were dried at 110 °C and subsequently powdered using an agate ball mill. About 1 g of dried sample powder was ignited at 1000 °C for 45 min, which allows us to determine the LOI. Hereafter, the samples powders were mixed with Li2B4O LiBO2 with a 1:4 dilution and fused to glass beads. The concentrations of major elements (Fe, Mn, Ti, Ca, K, P, Si, Al, Mg, Na, Ba) were subsequently measured by X-ray fluorescence spectroscopy (XRF) on a PANalytical Axios mAX instrument. The oxide concentrations were derived from the interference-corrected major element spectra using a calibration curve based on 28 international standards and are corrected for LOI. The major element data were normalised to 100 % with Fe expressed as Fe2O3. The long-term reproducibility for the geological standards AGV-2, BHVO-2 and GSP-2 was as follows: Fe2O3 ≤ 0.1 %, TiO2 ≤ 0.02 %, CaO ≤ 0.1 %, K2O ≤ 0.05 %, SiO2 ≤ 2 % and Al2O3 ≤ 0.3 at 2σ.
Using the concentrations obtained from discrete samples at VU, a log ratio calibration was conducted for the XRF core scanning data to obtain semiquantitative ratios by using the log ratio calibration described by Dunlea et al. (2020), with calcium as the common denominator because this element gave the best calibration results in Weltje and Tjallingii (2008).
Table 2Measured concentrations (in g kg−1) of selected element oxides for the calibration samples. The concentrations are for the dry sediments after LOI. CaCO3 estimated from the CaO concentration.
3.3.3 Principal component analysis
PCA was conducted to facilitate the interpretation of the XRF data by reducing the number of variables to analyse while preserving the majority of the variance in the initial dataset. The application of this method on XRF data from marine sediment cores has been shown to provide insight into geochemical and physical variability (Koutsodendris et al., 2021; Taylor et al., 2022). PCA was used on the normalised elemental counts of the XRF core scanning of the study core and on the elements with the highest measured average intensities (Ca, Fe, Sr, K, Ti and Zr), as well as Si, Rb and Al, which are associated with detrital material (Croudace and Rothwell, 2015; Govin et al., 2012). It was performed with the “prcomp” function in the R programming language (R Core Team, 2023).
3.3.4 Spectral analysis
After transferring the PC1 record onto age, the record was interpolated to the average age time step of 11.4 years with the Acycle MATLAB package (Li et al., 2019) to obtain equally spaced time series. Subsequently, the data were detrended using the second-order detrending method in Acycle to prevent power leakage from low-frequency components into higher frequencies of the spectrum (Li et al., 2019).
The following steps were used to perform spectral analysis:
-
To detect dominant temporal frequencies, the power spectra of PC1 on age was calculated with the periodogram function in Acycle (Li et al., 2019). An autoregressive AR(1) red noise model was fitted to the spectrum to determine which peaks are significantly different from noise, with 90 %, 95 % and 99 % confidence limits.
-
Gaussian filtering using the dominant frequencies found in (1) were then applied to PC1 using the filtering function in Acycle (Li et al., 2019) to determine whether the dominant frequencies observed in the data are in phase with the cyclical changes to the Earth's orbital parameters.
-
Wavelet analysis on PC1 was conducted to allow visualisation of its temporal evolution with the “continuous wavelet transform” (CWT) function in the Wavelet coherence MATLAB toolbox (Grinsted et al., 2004). The Morlet wavelet is used as it minimises ripple effects and retains the resolution of the original signal (Cohen, 2019).
More information on these steps can be found in the “Spectral analysis” section in the Supplement.
4.1 Age–depth model results
The 14 radiocarbon dates indicate that the first 9.13 m of the core cover approximatively 47.3 ka (Table 1), giving an average sedimentation rate of ∼19.3 cm ka−1. The accumulation rates obtained from the uppermost 9.13 m in the age model (Fig. 2) vary between 8.9 and 48.2 cm ka−1, with the highest accumulation rates occurring between 304.5 and 456.5 cm and the lowest rates near the top and bottom of this portion of the core. Reversed radiocarbon ages are observed at 16 and 23.5 cm depth respectively, with older ages occurring above younger ones below. These two dates were omitted by the “Undatable” software. They could be due to bioturbation, as is suggested by a dark elliptical shape seen around 22 cm depth in the core (Fig. S3). The age modelling using “Undatable” assumes a positive sedimentation rate and excludes age constraints outside of 2σ of the simulated age model (Lougheed and Obrochta, 2019). There is a close visual correspondence between the δ18O values on the radiocarbon-based age model and the EDC δD values. This supports the use of graphical correlation between the two records to provide an age model for the lower portions of MD20-3592. Further downcore, the age model obtained from the δ18O-based tuning gives an age of 245.4 ka at a depth of 4064.5 cm, giving an average sedimentation rate of 16.6 cm ka−1 or a mass accumulation rate of ∼14.5 g cm−2 ka−1.
4.2 Elemental composition measurement
4.2.1 X-ray fluorescence (XRF) core scanning
Over the entire core depth there is no apparent long-term trends in XRF bulk chemistry; however there are notable peaks towards higher values that occur in the ∼65–125 ka and ∼185–240 ka intervals for all elemental ratios with typically terrigenous and marine elements (Fig. 3). Low counts are recorded for all ratios between ∼135–165 ka. These ratios are expected to vary in tandem when there are variations in the amount of terrigenous material carried to the site from regional river discharge, and they can also be affected by other processes that are discussed below in Sect. 5.1.1. (Fig. 3g) varies in a comparable pattern with the other elemental ratios between typical marine- and terrigenous-derived elements. This similarity can be explained by increased physical and/or chemical weathering because high sedimentary values reflect more fluvial or aeolian input of intensively weathered material from humid areas in the source region to the continental margin (Govin et al., 2012). The ratio has the advantage of being more independent of variations in Ca concentration, which can be influenced by marine biological productivity. In tropical humid regions, high is the result of high chemical weathering and/or high soil erosion, both of which can be caused by increased precipitation (Ziegler et al., 2013). Increased weathering of clay minerals has the effect of enriching the soil in iron, and thus rivers originating in regions with increased weathering transport more iron towards the ocean. Additionally, increased soil erosion due to increased precipitation can also increase the ratio in marine sediments. It is to be noted that soil erodibility can also be increased by less protection from lower vegetation cover (Ludwig and Probst, 1998) and increased precipitation seasonality (Suescún et al., 2017). In the case of the K, its primary source is from potassium feldspar or illite, which is typical of a drier climate with low chemical weathering (Zabel et al., 2001). In addition, it can be observed that has the highest variability among all the plotted ratios. This is probably due to the low concentration of Al (Table 2) and subsequently the signal strength and X-ray absorption effect by pore water and water at the core surface under the plastic foil applied during scanning, which is stronger for light elements such as Al compared to Ca (Tjallingii et al., 2007).
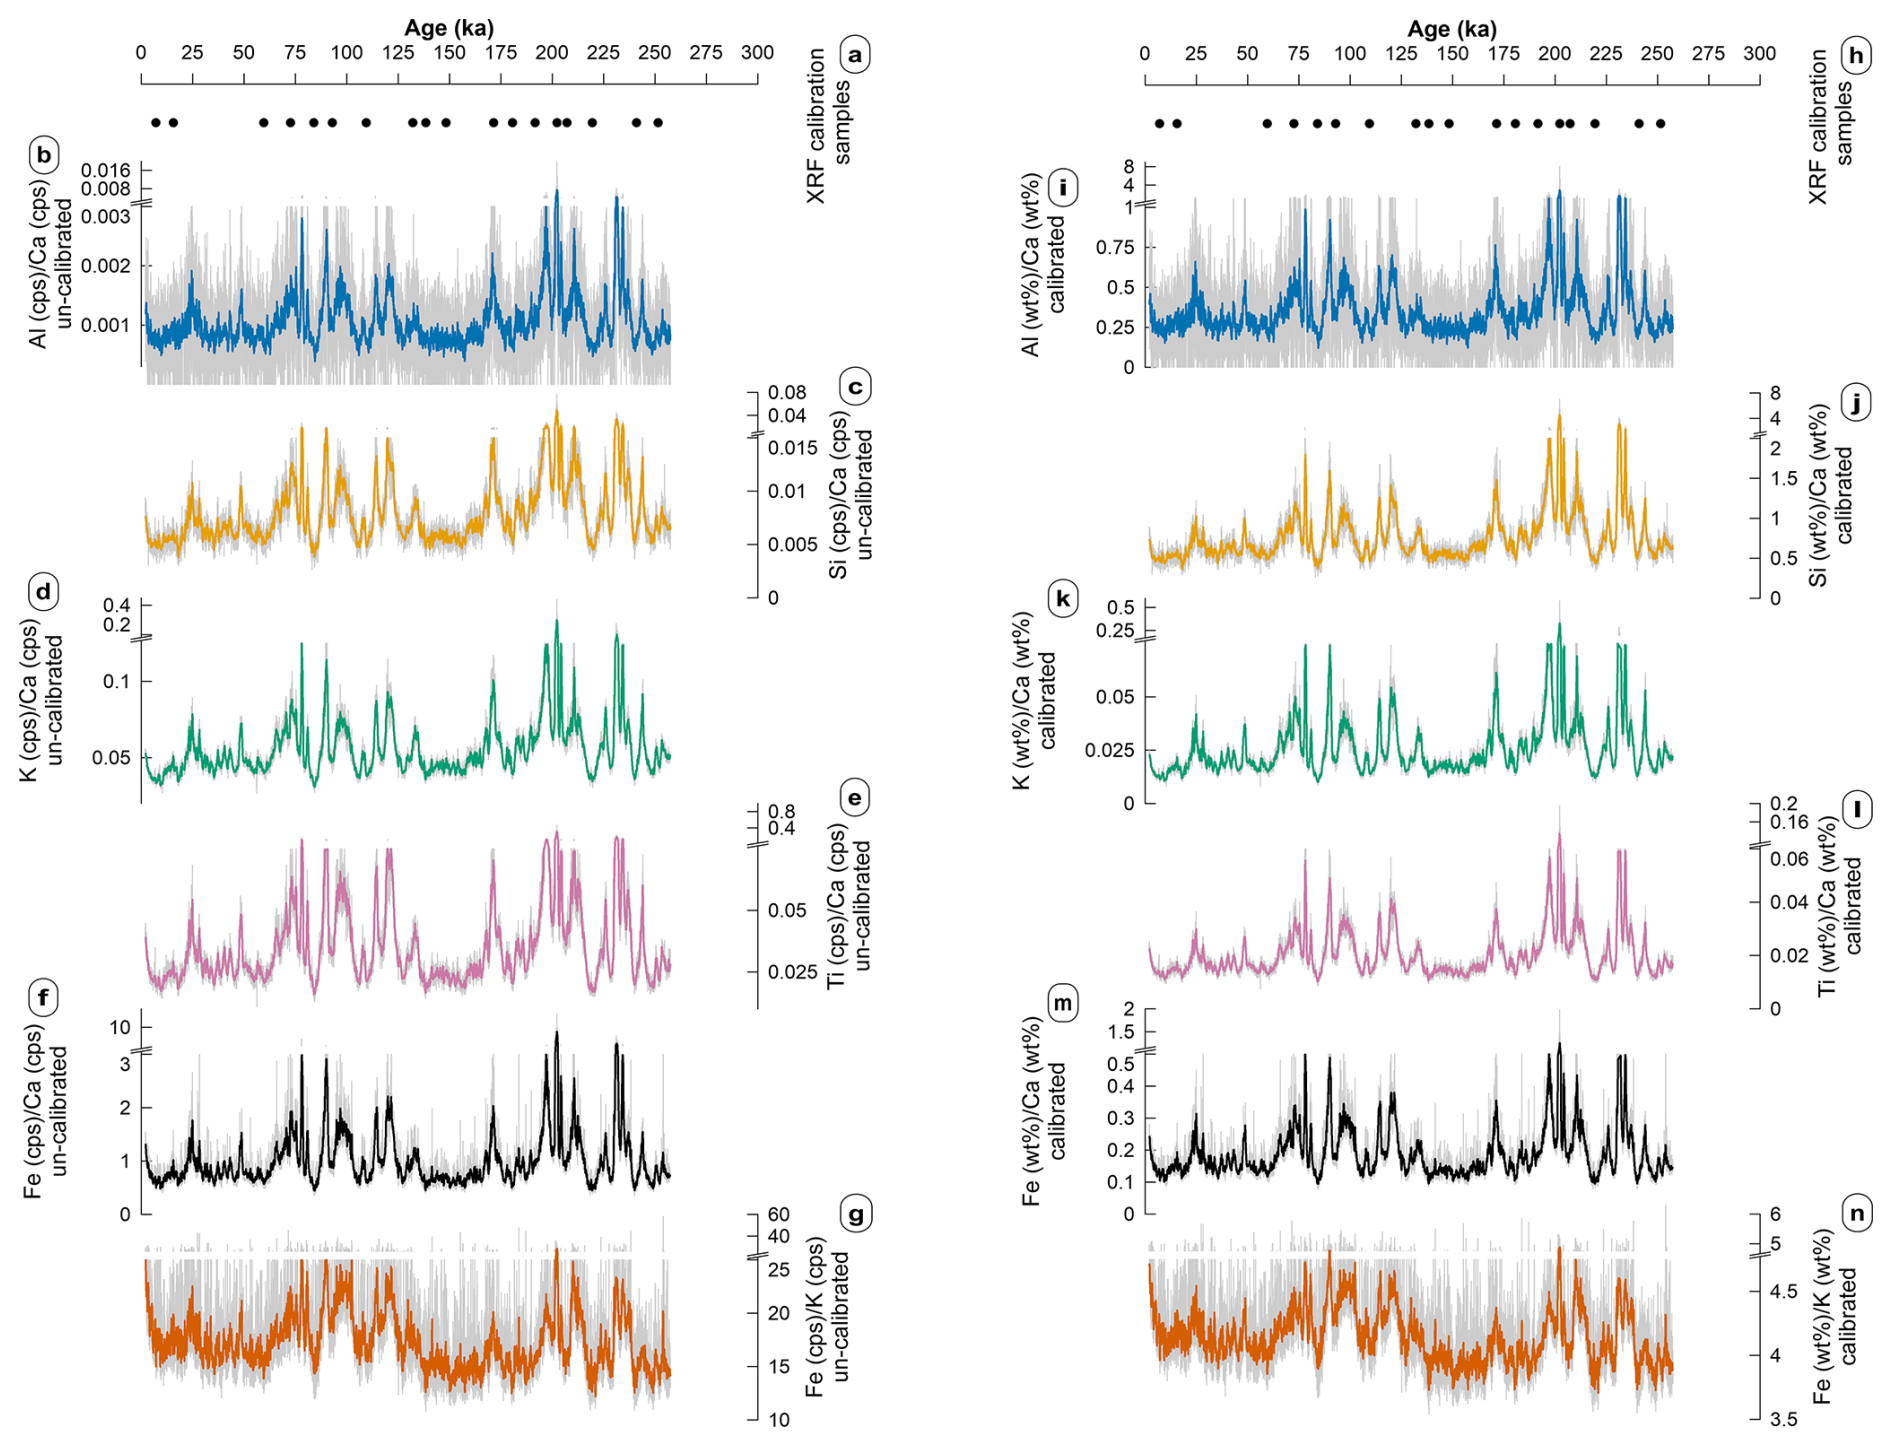
Figure 3XRF element ratios from sediment core MD20-3592. (a) Location of samples used for calibration. (b–g) Ratios of selected element intensities in counts per seconds (cps). Pale grey is full-resolution measurements, while dark colours are 21-point running means: in blue, in yellow, in green, in purple, in black and in orange. (h) Same as (a). (i–n) Elemental ratios after log calibration.
4.2.2 XRF calibration
The results from VU were chosen for calibration because they included SiO2, which is the most abundant oxide in core MD20-3592 (Table 2). The validity of the results obtained at VU are confirmed with the measurements done at the University of Bergen, as both methodologies show consistent results. The 18 replicate samples measured by both methodologies had results on average within 4 % of each other, with an average standard deviation of 14 % for the oxides discussed in Sect. 4.1.1 (refer to Tables 2, S2 and S3 and Fig. S5).
The sediments are hemipelagic, with a large proportion of terrigenous material and a relatively low amount of calcium carbonate (mean CaCO3 concentration: ∼ 25 %; Fig. S1). The measurements of the 18 samples were used to calibrate the log ratios of the XRF intensities to semiquantitative ratios.
The linear regression displays a good fit between the log ratios of the discrete samples normalised to Ca and the core scanning values, with an r2 value ranging from 0.94 to 0.99 (Fig. S6a), which indicates that the X-ray core scanning absorption effect by water was minimal. Using the calibration equations (see the “Calibration of XRF data” section in the Supplement), the selected elemental ratios are calculated and shown (Fig. 3i–n). The resulting calibrated ratios show similar trends to the XRF intensities ratios (Fig. 3b–g).
4.2.3 Principal component analysis
The first principal component (PC1), incorporating 60 % of the variance in the XRF record, was retained for further examination. It is marked by positive loadings of Ti, Fe, Rb, Si, K, Zr and Al and the negative loadings of Sr and Ca (Fig. 4). In PC1, the elements with positive loadings are associated with terrigenous sediments originating from the continent, while Ca mainly represents carbonate of marine origin and Sr substitutes for Ca in these carbonates (Govin et al., 2012). displays a comparable pattern to PC1 and other individual terrigenous versus marine elemental ratios, suggesting that these records can be used to represent the variability in and within the supply of sediments originating from land (Fig. 5).
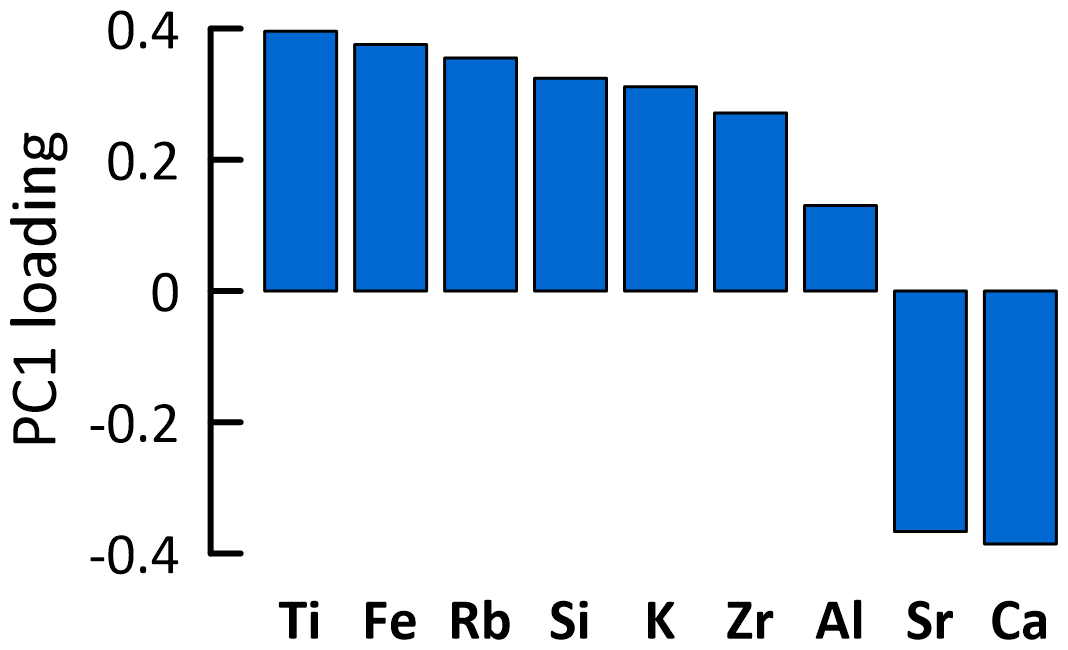
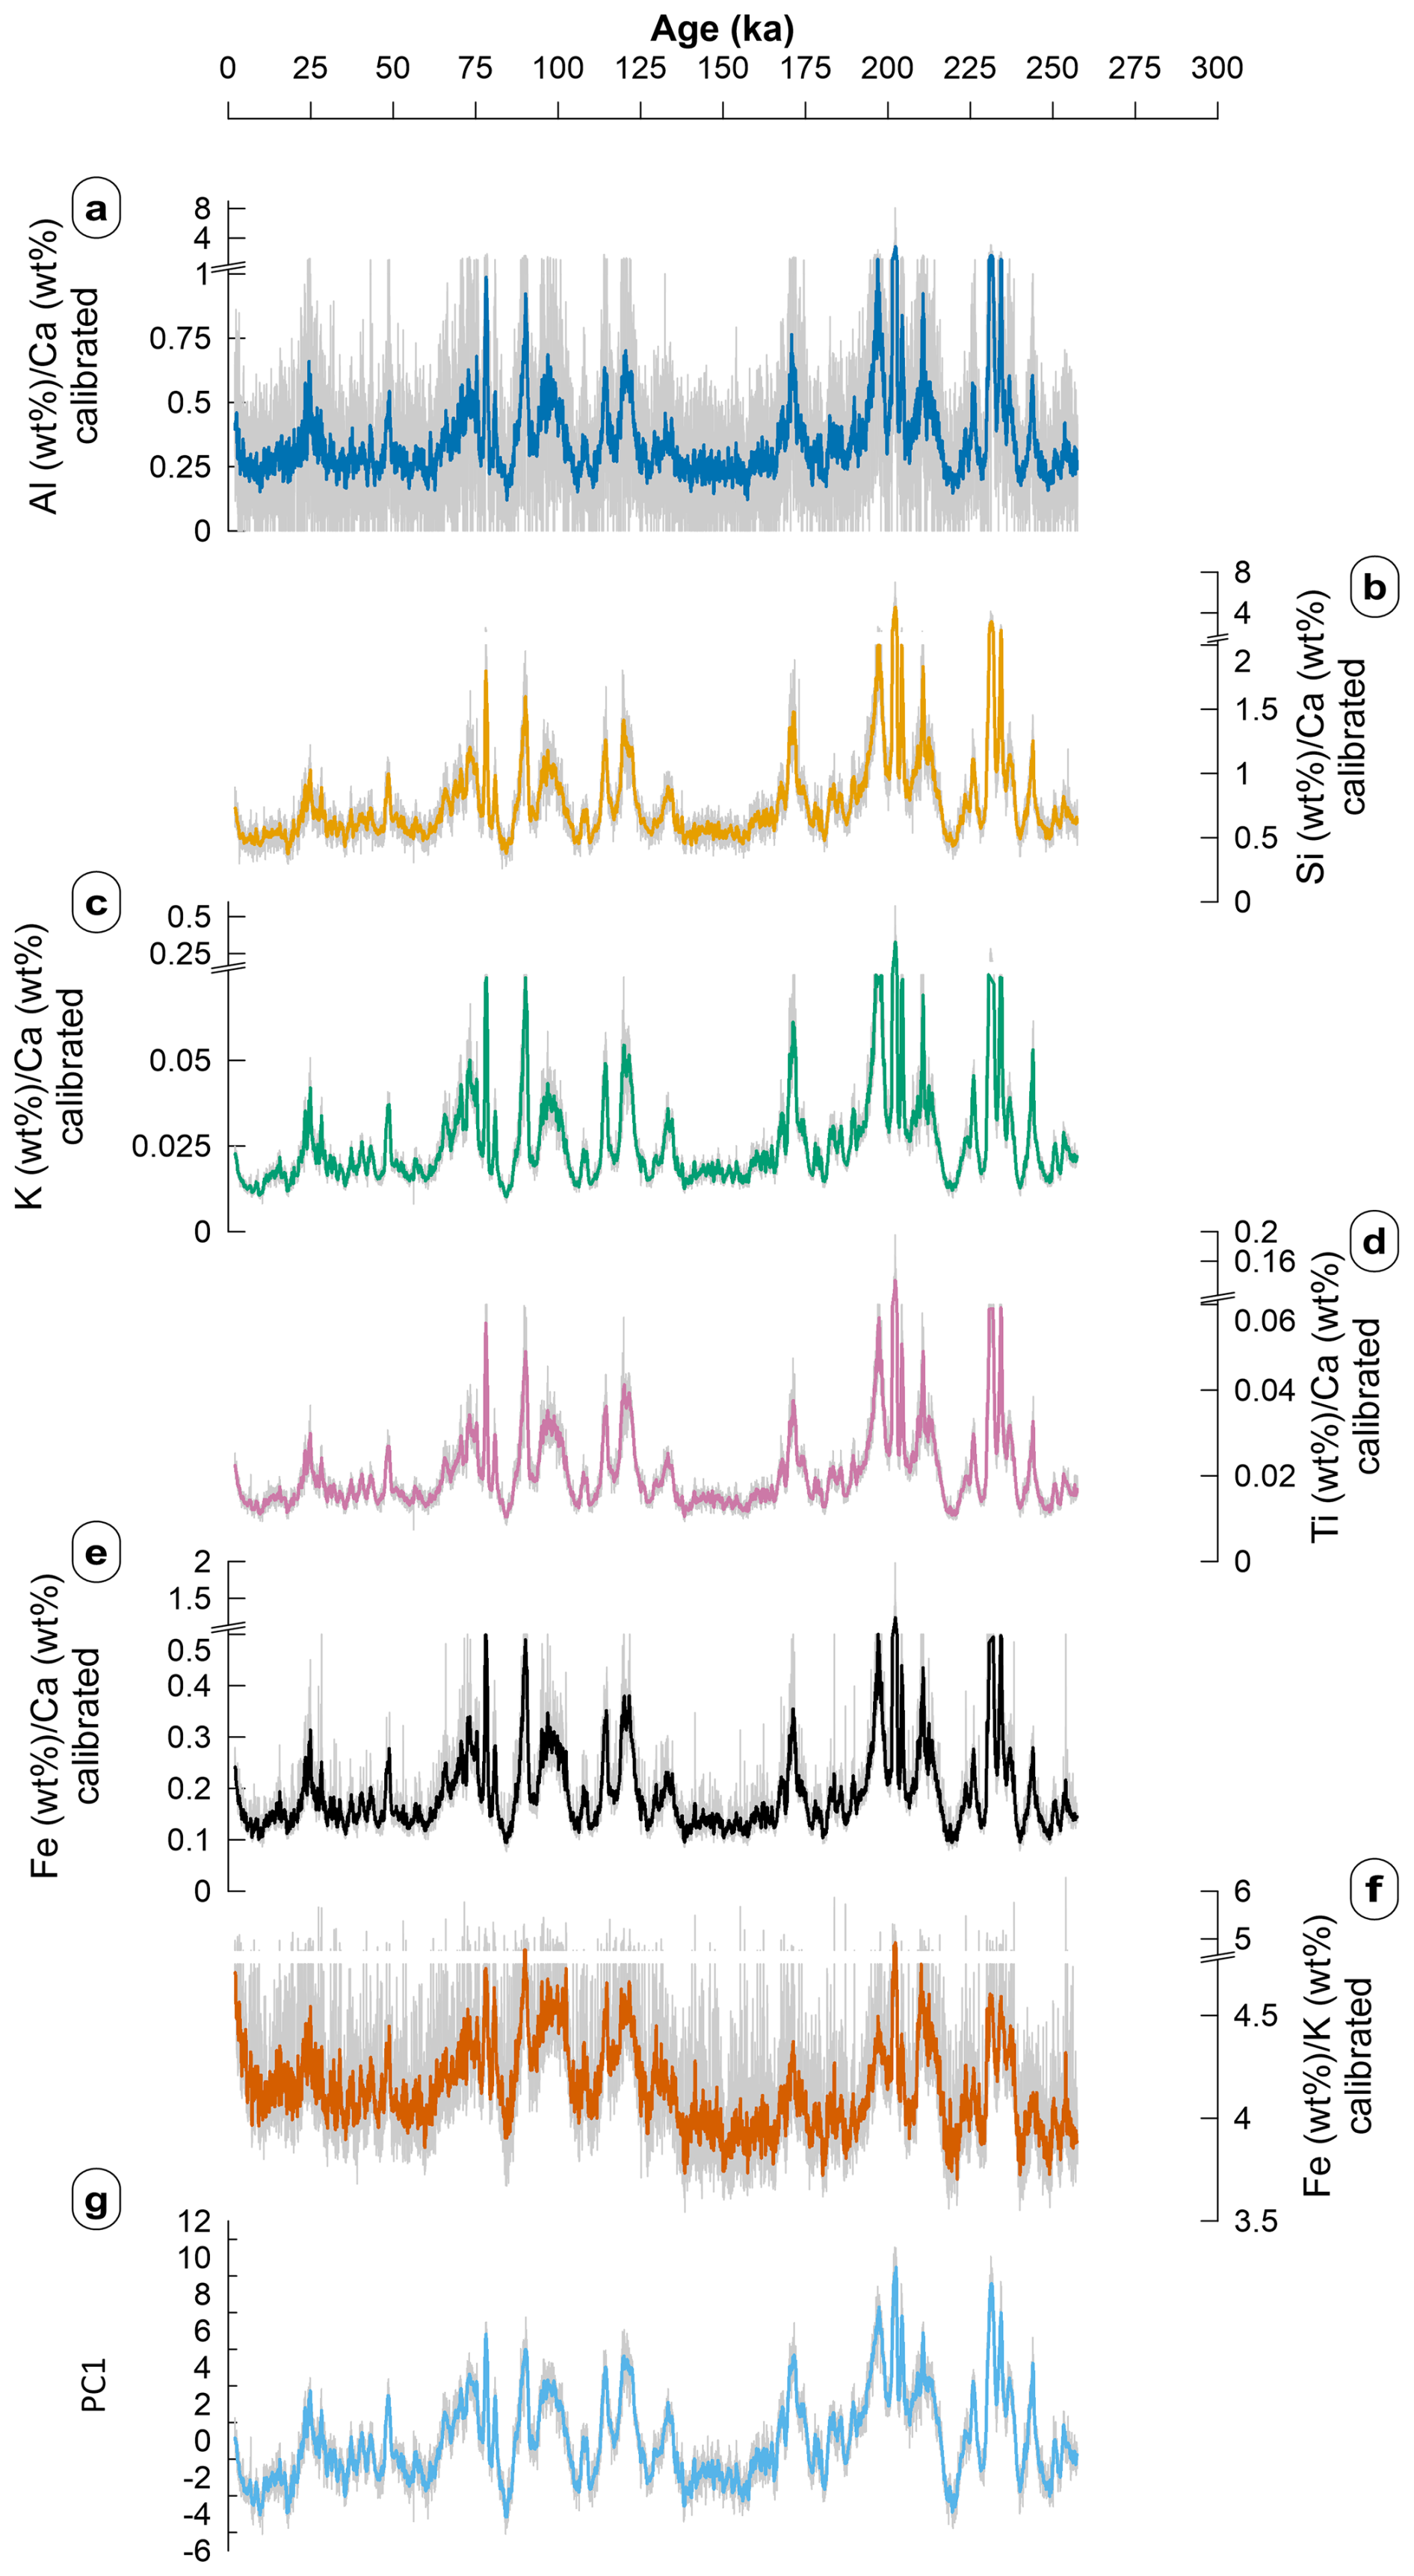
Figure 5Comparison of PC1 with calibrated elemental ratios. (a) in deep blue, (b) in yellow, (c) in green, (d) in purple, (e) in black, (f) in orange and (g) PC1 in sky blue.
4.2.4 Spectral analysis
The power spectra identified different frequencies above the 99 % confidence level, notably at periodicities of ∼23, ∼41 and ∼122 ka (Fig. 6a). These frequencies show that changes in the supply of terrigenous elements versus marine elements in the core have cyclicities that coincide with orbital cyclicities associated with precession for the ∼23 ka peak, obliquity for the ∼41 ka peak and potentially eccentricity for the ∼122 ka peak. Measuring the power spectra of eccentricity (Laskar et al., 2004) over the last ∼250 ka, with the same methodology that was used for PC1, gives a peak over the 99 % confidence level at ∼119 ka. This indicates that the ∼122 ka cyclicity observed in PC1 could be linked with eccentricity (see Fig. S7c). Likewise, measuring the power spectra of obliquity (Laskar et al., 2004) reveals an additional peak at 34 ka (see Fig. S7b), which could correspond to the peak observed in PC1. Similarly, the power spectra of precession has a ∼27 ka peak (see Fig. S7a; Laskar et al., 2004) that corresponds to the peak in PC1 of our study core.
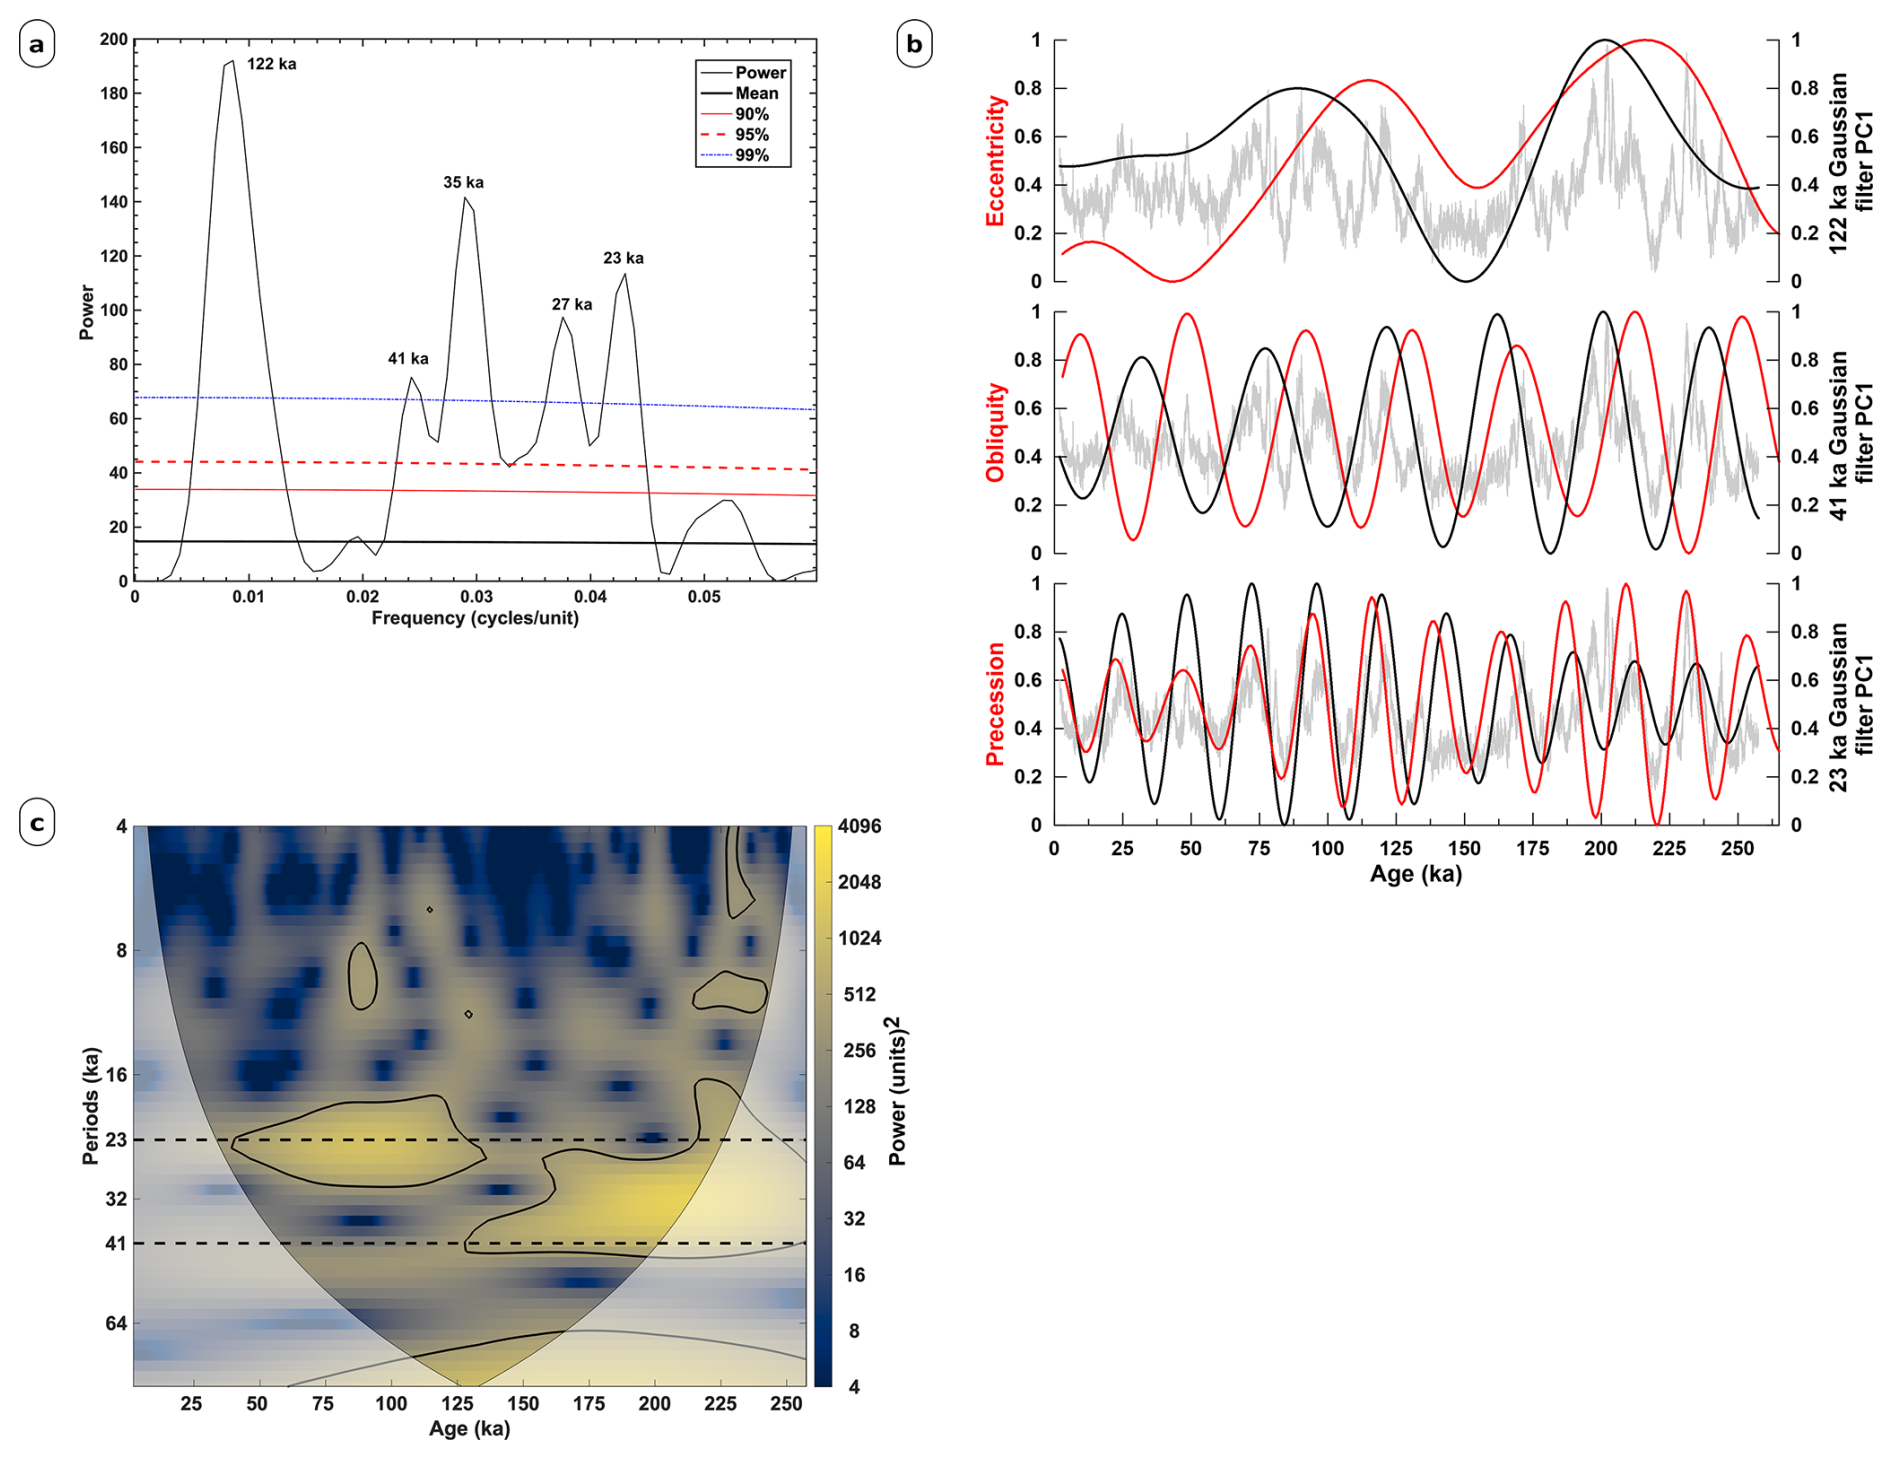
Figure 6Frequency analysis of PC1 of core MD20-3592. (a) Power spectrum of PC1 on the age model (black). The first-order autoregressive red noise model (AR(1)) is shown (heavy black) and so are the 99 % (blue dashed), 95 % (red dashed) and 90 % (red continuous) confidence levels relative to AR(1). Peaks over the 99 % confidence level at 122, 42 and 23 ka are identified. Peaks at ∼ 34 and ∼ 20 ka also appear over the 99 % confidence level. (b) Gaussian filters. PC1 is plotted on the age model (grey), while Gaussian filters are applied to PC1 with cyclicities of 23, 42 and 122 ka (black). Normalised precession, obliquity and eccentricity are also shown (red; Laskar et al., 2004). (c) Wavelet transform of PC1 on the age model. The vertical axis is on a logarithmic scale (base 2). Signal power is shown with colour, while the black contour encircles regions over the 95 % confidence level for a red-noise process (Torrence and Compo, 1998). The cone of influence in black shows the regions where boundary effects are present.
The orbital parameters can then be compared with the output from applying Gaussian filters to PC1 (Fig. 6b). The 23 ka filter output on PC1 matches well with Earth's precession throughout most of the core. The 41 ka filter output appears out of phase with Earth's obliquity. In the deeper portion of the core, starting at ∼260 ka (MIS 7) and ending at ∼125 ka (MIS 5), the 41 ka filter output is lagging behind obliquity (Fig. 6b). From ∼125 ka (MIS 5) to ∼2 ka (MIS 1), the filter output has an anti-phased relationship with obliquity. The 122 ka filter output produces a result that appears similar to Earth's eccentricity, with an offset of the filtered output towards the present in comparison with eccentricity.
The wavelet analysis (Fig. 6c) shows that from ∼260 to ∼128 ka (MISs 8–6) the ∼41 ka cyclicity (obliquity) is strong, and after ∼136 ka the ∼23 ka cyclicity (precession) dominates until ∼40 ka (MISs 5–3), while the ∼122 ka cyclicity is outside the cone of influence. A longer time series would be necessary to correctly identify this frequency. In summary, these results confirm that the orbital parameters of precession (∼23 ka) and obliquity (∼41 ka) can indeed be linked with changes in the supply of terrigenous elements into the marine realm of the region. The wavelet analysis implies that prior to ∼140 ka (MISs 8–6), obliquity is the dominant forcing factor, whereas after this time precession dominates. While the Gaussian-filtered data and the eccentricity look similar (Fig. 6c), it is difficult to confidently assert that eccentricity itself drives the observed signal due to a difference in timescale (∼100 ka for eccentricity versus ∼122 ka observed in PC1) and a short time series in comparison to the eccentricity timescale (∼260 ka versus ∼100 ka).
5.1 Orbital timescale climate variability
5.1.1 Interpretation of XRF signal
The similar patterns observed for all the marine versus terrigenous elemental ratios (Fig. 3) and PC1 (Fig. 5) imply that similar processes are affecting PC1 and the elemental ratios including . High is thought to indicate high soil erosion or chemical weathering, pointing to increased precipitation (Govin et al., 2012) in southern South Africa. The type of soil has a notable impact on the ratio; for instance, the KwaZulu-Natal province is extensively covered by Lixisols, which have a high Fe oxide content, while the Eastern Cape and Western Cape have a high proportion of Luvisols, which are lower in Fe oxide, and Durisols and Leptosols, which are even lower in Fe oxide (Driessen et al., 2001; Garzanti et al., 2014). The relationship between and river catchment precipitation can also be affected by other factors, notably vegetation cover, where low cover increases soil erodibility (Ludwig and Probst, 1998); organic acids released by vegetation which can increase the dissolution rate of minerals (Benedetti et al., 1994); higher temperatures accelerating chemical weathering in subtropical humid regions (Driessen et al., 2001); and diagenetic Fe remobilisation in marine sediments due to redox processes linked with changes in sedimentation rates or turbidites (e.g. März et al., 2008; Thomson et al., 1996).
As the oxide ratios are dependent on variations in the input of CaCO3, (i.e. marine productivity) and preservation, as well as terrestrial input, (i.e. Al2O3, SiO2, K2O, TiO2 and Fe2O3), variations in both need to be considered when making inferences based on these data. A higher amount of CaO originating from increased productivity could be expected during glacial intervals due to the intensification of trade winds and enhanced oceanic upwelling (Hernández-Almeida et al., 2019; Tangunan et al., 2021), and this could affect the interpretation of the XRF data by lowering the PC1 values. The pattern in the CaO concentrations from the discrete samples and the XRF measurements in core MD20-3592 between the LGM and the Holocene does not support this (Fig. S1, Table S2), as the values from both indicate a lower proportion of CaCO3 in the core at ∼ 25 ka in comparison to ∼ 7 ka. In the two previous glacial–interglacial transitions, there is also no increase in CaO percent corresponding to an expected increased productivity during glacial intervals. Glacial–interglacial variability in upper-ocean biogeochemistry and productivity in the southern Indian Ocean has been observed (Tangunan et al., 2021), but there is no indication of a 23 ka cycle in those processes. This excludes, based on the current knowledge, any surface water productivity changes that would drive the CaCO3 content of core MD20-3592 and bias the terrigenous signal on a precessional timescale. Additionally, the core is not located in an upwelling zone such as the Benguela System where we would expect nutrients to promote high biological productivity and increase carbonate production on precession timescales (West et al., 2004).
Changes in deep-water-mass properties at the coring site can also affect the preservation or dissolution of carbonates. Hines et al. (2021) and Yu et al. (2020) showed that during the LGM, a water mass with a low carbonate ion concentration reached up to 20° S in the South Atlantic at 3–4 km depth. This water mass, named Glacial Pacific Deep Water (GPDW), was enriched in respired carbon and therefore more corrosive to calcite. Nevertheless, this potentially amplified dissolution during glacials is not evident in core MD20-3592 (Fig. S1), possibly due to the study site being relatively deeper than the core of the GPDW. Consequently, the ratios of terrestrial elements on calcium are primarily driven by variations in terrestrial element inputs. This in turn implies that the inverse relationship observed between the terrestrial elements and Ca (and Sr) confirm that downcore variations in sediment composition are controlled by changes in terrigenous sediment supply carried by southern South African rivers, assuming approximatively constant or low fluctuations in the flux of marine biogenic sediments containing Ca and Sr. In addition to the GPDW potentially influencing the study site, the AABW could also have affected the study site with changes in calcite preservation (Fig. 1). Gottschalk et al. (2018) and Hodell et al. (2001) found higher burial of carbonate during glacials in the deep Cape Basin. This can be explained by the findings of Rickaby et al. (2010), which indicate that during glacials, there was an increased alkalinity (reduced corrosiveness) in the deep waters of the Weddell Sea near where the AABW forms. Thus, the enhanced carbonate accumulation recorded in the Atlantic sector of the Southern Ocean during glacials (Rickaby et al., 2010) can be explained by a reduction in dissolution of the carbonates by the AABW. Conversely, for sites bathed in NADW in the Atlantic sector of the Southern Ocean, calcite dissolution was elevated during glacials (Rickaby et al., 2010). This can be explained by the AABW reaching further northward and mixing with the NADW during glacials, causing the NADW to be more corrosive (Rickaby et al., 2010). However, both these changes in the NADW and AABW occurred on glacial–interglacial timescales, and this suggests that the composition of these water masses is not driving the changes in the XRF data of core MD20-3592 on a precessional timescale.
The sedimentation rate calculated in the radiocarbon dating range can give additional information on the processes controlling the sediment supply at core site MD20-3592. During MIS 2, calculated sedimentation rates were higher than in MISs 1 and 3–4, with values over 30 cm ka−1 at the start of MIS 2 and up to 48 cm ka−1 at 21 ka and then a reduction to 20–25 cm ka−1 from 19 to 14 ka (Fig. 2). One way to interpret this pattern is that increases in sediment supply by the rivers to the core site increases the sedimentation rate in this interval. This in turn, can be the result of two different processes: (a) increases in sediment supply from the river catchments to the core location due to more humid conditions on land from increased winter rains and (b) migration of river mouths closer to the core site in response to eustatic sea-level change. The latter situation occurs during sea-level low stands such as the LGM when significant coastline shifts in South Africa took place and river deltas moved seaward due to the Paleo-Agulhas Plain (PAP) exposure (Cawthra et al., 2020a). The maximum sedimentation rate does indeed occur at ∼21 ka, shortly after the period of lowest sea level (Fig. S2). This indicates that variations in river mouth locations due to sea-level change probably had an important influence on sedimentation rates, and some of the sediments likely originated from the exposed PAP. The PAP was exposed during periods of sea level lower than at present, during MISs 8, 6 and 2–4 (Cawthra et al., 2020b; Cowling et al., 2020). During the LGM, when the sea level was at its lowest, the PAP was covering 80 653 km2 (Cowling et al., 2020). However, processes of increased sediment supply from the catchments co-occurring cannot be ruled out as high PC1 values at the same time indicate more supply of terrestrial elements as well. Palaeoclimatic evidence and model results for the WRZ and YRZ support the scenario of southern South Africa experiencing a wetter climate during the LGM compared to the Holocene, potentially due to an increase in winter rains and high levels of effective moisture. In the WRZ, rock hyrax middens indicate increased precipitation during the LGM (Chase et al., 2017). This is also observed in the YRZ, with rock hyrax middens and pollen (Chase et al., 2018), micromammal assemblages (Faith et al., 2019), tooth enamel analysis (Sealy et al., 2016, 2020), and a review of proxy evidence by Faith et al. (2024). Lastly, model results by Engelbrecht et al. (2019) also indicate a wetter climate during the LGM in southern South Africa. Winter frontal rainfall is believed to have extended significantly equatorward, reaching as far north as central Namibia and Botswana (Engelbrecht et al., 2019). Consequently, regions that today experience predominantly summer rainfall likely received substantially more precipitation in winter than under present climatic conditions (Engelbrecht et al., 2019).
In addition to riverine inputs, other mechanism can affect the sedimentation rate and elemental composition of core MD20-3592, such as aeolian dust fluxes. The predominance of easterly winds in this region limits the amount of aeolian deposition at the coring site, since it is located to the south of potential dust sources (e.g. South Africa). Modelled aeolian mass accumulation rates in the study region for the LGM are 4–10 and 0.5–1 g m−2 yr−1 for the present, with dust coming mainly from the Kalahari Desert region and some from South America (Mahler et al., 2010). Using the mean accumulation rate (16.6 cm ka−1) and density (0.88 g cm−3) of core MD20-3592, these dust fluxes equate to 3 %–7 % (LGM) and 0.3 %–0.7 % (present day) of the core sediment accumulation rate. Nonetheless, sustained periods of low sediment accumulation rates (< 10 cm ka−1) occur during MISs 5e and 5d and during the late Holocene, and if aeolian inputs were as high as during the LGM (4–10 g m−2 yr−1) during MISs 1 and 5, then the aeolian contribution to the sediments would be larger than 7 %. However, because these two periods of low sedimentation are centred upon, or solely within, interglacials, it is reasonable to assume that approximatively present-day levels of aeolian inputs occurred. On this assumption, the aeolian contribution to sedimentation rates ranges between 0.7 %–1.3 % in these periods. Therefore, dust flux is unlikely to be an important driver of the sedimentation rates and elemental ratios in MD20-3592.
Increases in dust deposition at the study site during glacials (Maher et al., 2010) is not expected to produce large changes in sedimentation rates (see Sect. 2). However, increases in dust inputs during glacials could stimulate biological productivity in the waters overlying the study site. This could decrease the PC1 values by increasing the proportion of Ca of biological origin in the sediment, and PC1 is indeed observed to reduce towards the end of MIS 2 (between 25 and 18 ka). However, PC1 remains negative throughout most of MIS 1, which is inconsistent with this hypothesis. Another factor that can affect the sedimentation rates at the study site is sediment focusing, which is the redistribution of sediment on the seafloor by bottom currents. Starr et al. (2025) found evidence of a faster near-bottom flow speed of the CDW, in comparison with the Holocene, between ∼37–15 ka in cores MD02-2588 and IODP U1475 in the Agulhas Basin. This timing is comparable to the higher sedimentation rate estimated between ∼37–15 ka in core MD20-3592. The flow speed rose up to ∼10 cm s−1 (Starr et al., 2025), which is a speed that can induce selective deposition of sortable silts (McCave et al., 2017). This increased bottom flow speed could therefore be a factor that drives the increased sedimentation at the core site during MIS 2. However, with the current evidence available, this process cannot be disentangled from increased riverine discharge.
Overall, the lithogenic versus marine carbonate record expressed in PC1 shows a comparable pattern to , suggesting that high lithogenic input can be associated with increased soil erosion or chemical weathering. This indicates increased riverine sediment discharge and therefore more humid conditions and in turn (seasonal) increased rainfall.
5.1.2 Orbital timescales
The ∼ 122 ka periodicity observed in PC1 can potentially be linked with orbital eccentricity. It can be seen that the 122 ka Gaussian filter lags orbital eccentricity by ∼ 20 ka, with a high PC1 occurring during intervals of high eccentricity such as during MIS 5 and MIS 7 (Fig. 6c). Orbital eccentricity comprises 3 components: 413, 125 and 96 ka (Maslin and Ridgwell, 2005). Changes in eccentricity relate to the shape of Earth's orbit, with a more elliptical orbit intensifying seasonality in comparison with a circular orbit (Maslin and Ridgwell, 2005). It is to be noted that in discussions of orbital eccentricity, it is generally referred to as a 100 ka cycle, and many climate archives do display this cyclicity. However, the length of the PC1 time series is too short to resolve a ∼ 100 ka period accurately. Rial (1999) showed that a time window of 600 ka merged all the spectral peaks related to eccentricity and that the PC1 time series of core MD20-3592 is less than half of this time window. Despite the caveats mentioned, the fact that the 122 ka Gaussian filter applied on PC1 was relatively in phase with the ∼ 100 ka eccentricity cycle suggests this cycle has an influence on the regional climate recorded in core MD20-3592. The higher amplitude of PC1 on the precessional timescale during intervals of higher eccentricity (e.g. MIS 5 and MIS 7) could then be explained by the amplification of seasonality. This amplification either increases or reduces local SH summer insolation when the perihelion coincides with the SH summer or winter, which is determined by precession (see below). In regions where high-latitude drivers dominate, as opposed to climatic changes driven by changes in local insolation, changes in climatic sequences with the 100 ka periodicity can more plausibly be linked with the influence of obliquity and precession at high northern latitudes and the development of ice sheets (Chase, 2021). In contrast, in tropical regions, changes with a ∼ 100 ka periodicity can more conceivably be linked with the eccentricity modulating variations in direct insolation (Chase, 2021). The presence of a dominant precessional (∼ 23 ka) signal can provide an indication of a low-latitude forcing dominance, whereas the absence or muting of a 23 ka signal paired with a significant 41 ka signal indicates the prevalence of high-latitude mechanisms (Chase, 2021). In the case of core MD20-3592 where the ∼ 41 ka signal has a high power, as well as ∼ 23 and ∼ 122 ka, both high- and low-latitude forcings appear to be important (Fig. 6a).
The relationship observed between PC1 and obliquity varies through the core. The ∼ 41 ka frequency detected in the core (Fig. 6a) is dominant from the bottom of the core up to ∼ 128 ka (MIS 5e: Fig. 6c), while the ∼23 ka frequency dominates from ∼ 128 ka (MIS 5e) to ∼ 40 ka (MIS 3a). The matching variation in PC1 in phase with obliquity from the deeper part of the core up to ∼ 125 ka (MIS 5e) could be explained by a stronger cross-equatorial transport of moisture towards the summer hemisphere when obliquity is high (Bosmans et al., 2015; Daniau et al., 2023). Bosmans et al. (2015) observed in model experiments that during obliquity maxima, surface winds towards the summer hemisphere are strengthened, leading to an increase in moisture transport over the Indian Ocean and increased precipitation over part of the southern African summer monsoon region. The strengthened winds can be explained by an enhanced inter-hemispheric pressure gradient, which is itself driven by an increase in the summer inter-tropical insolation gradient (Bosmans et al., 2015). However, from ∼ 125 ka to the present, the relationship appears anti-phased (Fig. 6b). This observation is confirmed with a cross-wavelet transform analysis (Fig. S8b), as indicated by the arrows, where arrows pointing towards the left indicate an anti-phase relationship. The findings in our study core are in contrast to the expectations associated with the SHW influence on the region during low-obliquity phases, i.e. stronger westerlies and storm tracks and hence more precipitation over the YRZ during periods of lower obliquity. The pattern found in MD20-3592 between ∼ 260 and ∼ 125 ka (MISs 8–5e) shows the opposite, i.e. high PC1 values during obliquity maxima. Higher obliquity could influence sea surface temperatures in the South Indian Ocean, altering the strength of the Agulhas Current. A warmer Agulhas Current may lead to enhanced evaporation and regional convective precipitation, particularly in the southern Cape (Tim et al., 2023). Caley et al. (2011) found obliquity-driven SST variability in the Agulhas Current with higher ocean temperatures aligning with obliquity maxima. These Agulhas Current dynamics on obliquity timescales may serve as an additional factor linking the obliquity signal identified in the PC1 data of the core.
The precession signal is significant throughout the majority of the core as indicated by the frequency analysis (Fig. 6a); however it appears to have the strongest influence between ∼ 128 and ∼ 40 ka (Fig. 6c). Precession affects the distribution of solar insolation during the seasons, with precession being highly correlated with local summer insolation (Fig. S4). Indeed, Singarayer and Burrough (2015) found based on modelling experiments that the austral summer rainbelt moves southward during periods of increased local summer insolation. This is confirmed by proxy data that found that in southwestern Africa, increased local insolation is linked with an extension of the range or an intensifying of tropical systems that bring summer rainfall to this region (Chase, 2021). Most summer rains over South Africa come from synoptic-scale tropical–temperate trough (TTT) systems (Todd et al., 2004). During these events tropical convection over Africa is coupled with mid-latitude transient systems and brings a band of clouds and high rainfall that extends from central Africa southeastwards and is associated with the ITCZ (Todd et al., 2004). The tropical systems that are part of the TTT are weather systems driven by high SST and warming of the continents during the summer to establish strong convection cells (Chase and Meadows, 2007). Periods of high local summer insolation due to high precession could thus increase the summer precipitation in the YRZ by providing more energy to the tropical systems via increased SST and continental warming. In short, PC1 in core MD20-3592 displays a strong ∼ 23 ka cyclicity, which matches with orbital precession, and this finding gives additional support to the idea that precession is a major driver for precipitation in this region.
5.2 Wider regional comparison
Core MD20-3592 is compared with global records and with regional records to clarify the importance of the different climatic drivers and potential shifts in the dominant forcing factors (Figs. 7 and 8).
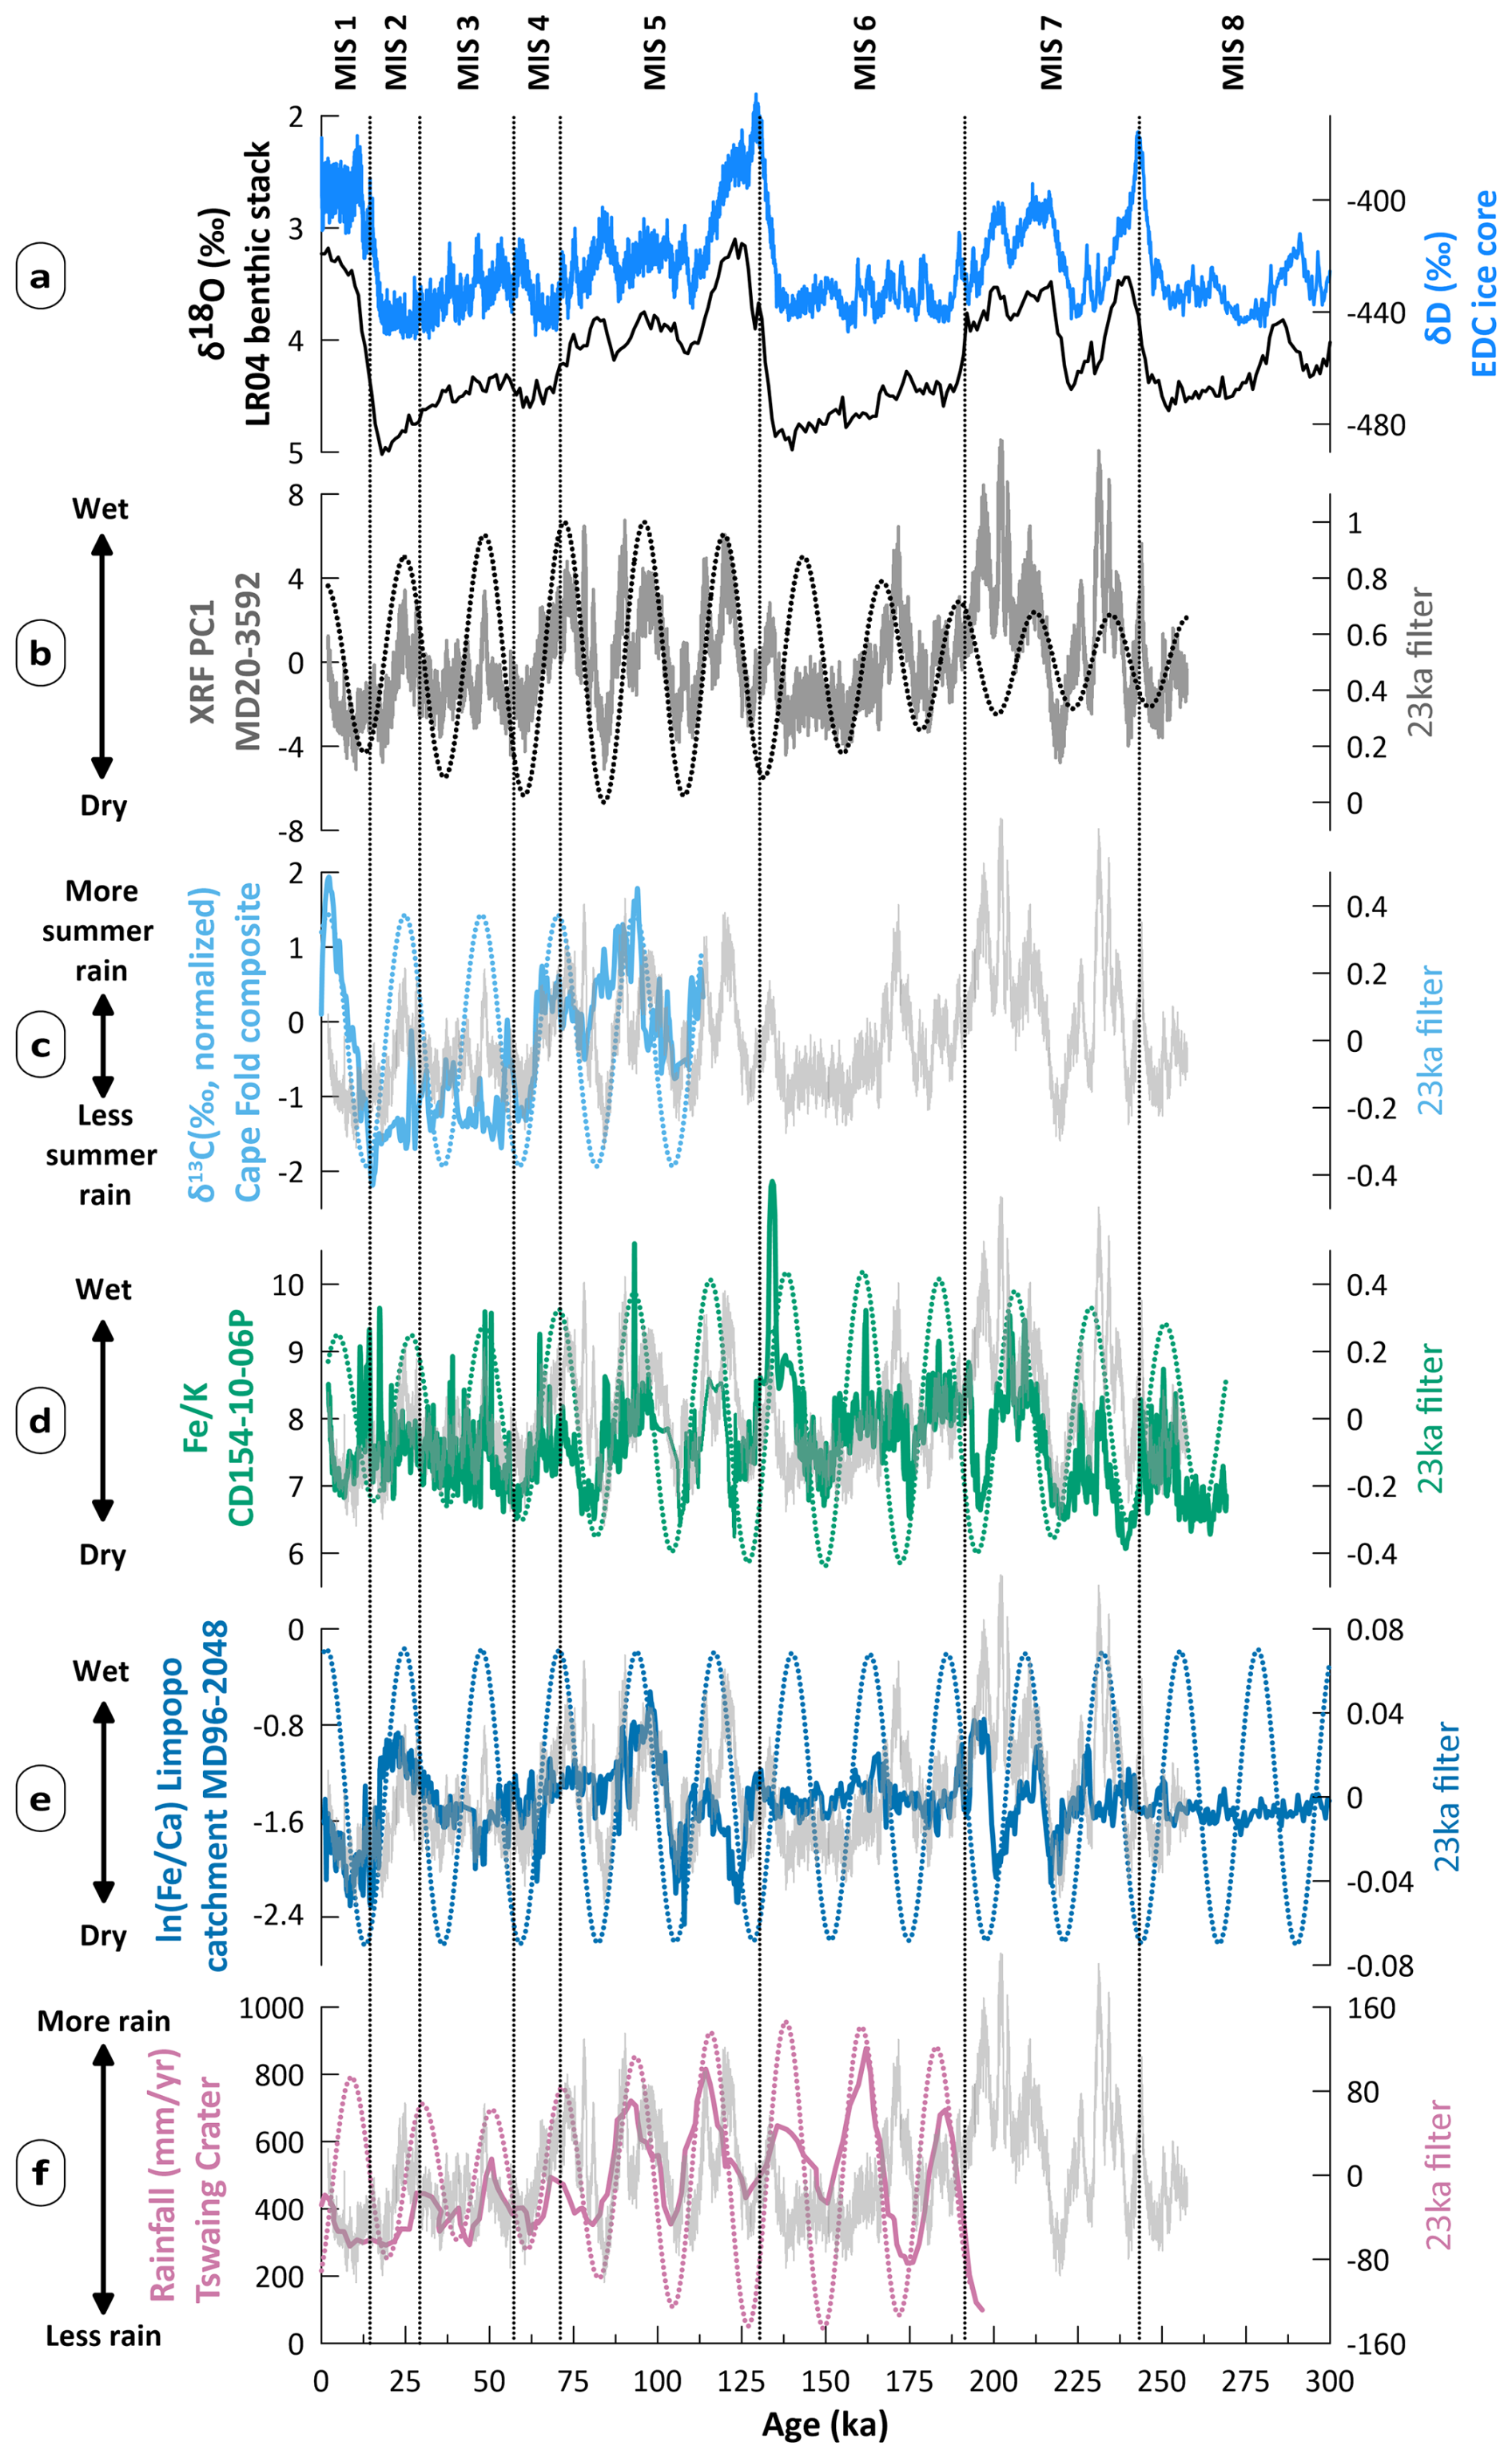
Figure 7Comparison of core MD20-3592 with global, local and eastern South African records. (a) Global records: LR04 δ18O global benthic stack (black line; Lisiecki and Raymo, 2005) and EDC δD record on the AICC2023 chronology (blue line; Bouchet et al., 2023; Jouzel et al., 2007). (b) PC1 of core MD20-3592 (grey line). (c) δ13C Cape Fold Composite record (sky blue line; Chase et al., 2021). (d) of core CD154-10-06P (green line; Simon et al., 2015). (e) ln() of core MD96-2048 (dark blue line; Caley et al., 2018). (f) Annual rainfall at Tswaing Crater (purple line; Partridge et al., 1997). Dotted lines are a 23 ka Gaussian filter applied on each time series. Core MD20-3592 PC1 data are superimposed on each time series in light grey. Marine isotope stages (MISs) 1 to 8 (Lisiecki and Raymo, 2005) are labelled.
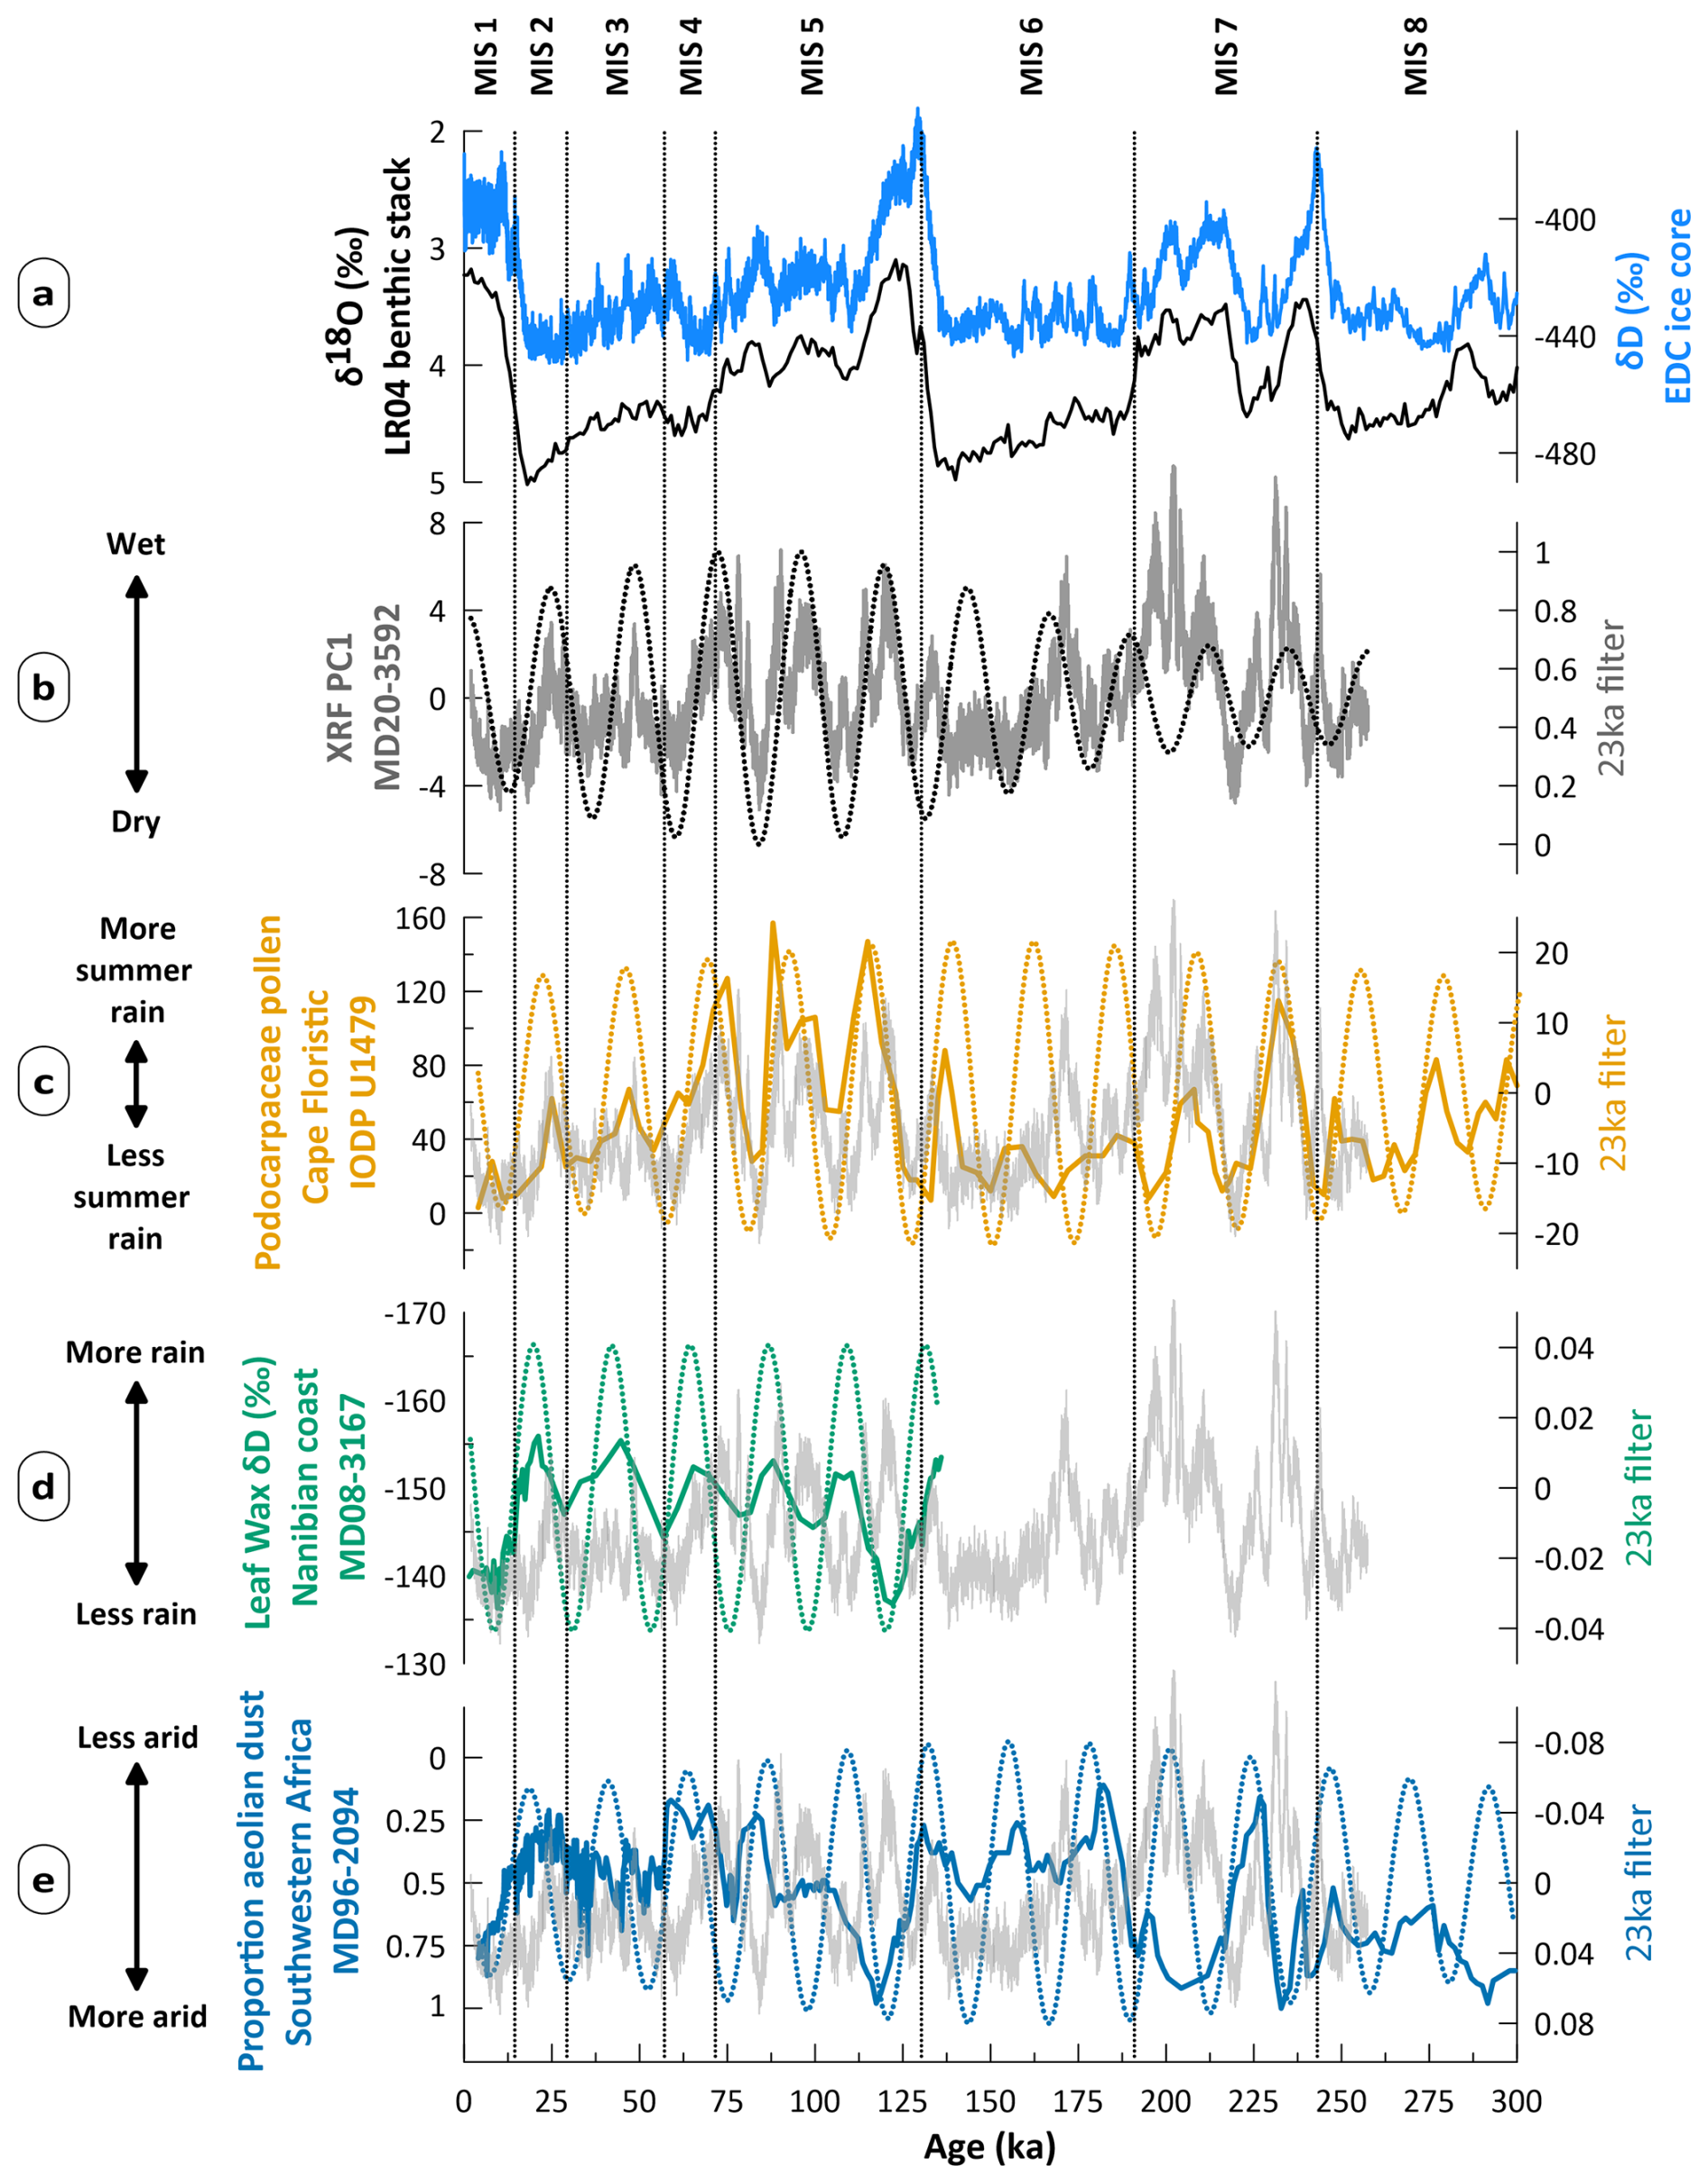
Figure 8Comparison of core MD20-3592 with global and western south African records. (a) Global records: LR04 δ18O global benthic stack (black line; Lisiecki and Raymo, 2005) and EDC δD record on the AICC2023 chronology (blue line; Bouchet et al., 2023; Jouzel et al., 2007). (b) PC1 of core MD20-3592 (grey line). (c) Podocarpaceae pollen in core IODP U1479 (yellow line; Dupont et al., 2022). (d) Leaf wax δD in core MD08-3167 (green line; Collins et al., 2014). (e) Proportion of aeolian dust in core MD96-2094 (dark blue line; Stuut et al., 2002). Dotted lines are a 23 ka Gaussian filter applied on each time series. Core MD20-3592 PC1 data are superimposed on each time series in light grey.
The PC1 record co-varies with changes in C4 grass abundance and summer rains inferred from δ13C values from speleothem and rock hyrax middens at the Cape Fold Composite (Fig. 7c; Chase et al., 2021). However, the PC1 record of this study displays larger amplitude variations on a precessional timescale in MISs 2 and 3 in comparison with the Cape Fold Composite, the latter displaying indications of generally lower precipitation during sea-level low stands at the end of MIS 4 to MIS 2. This could be due to the Cape Fold Composite being more affected by shifts in sea level than core site MD20-3592, which records the hydrology of regional river catchments extending further inland. Leaf wax δ2H values from nearby Blombos Cave and modelling results (Göktürk et al., 2023) support this interpretation of more arid conditions induced by increased continentality along the coast of the southern Cape during MIS 4 while interior South Africa became more humid.
On a precession timescale our record of hydroclimate variability is likewise in phase with the ratio of recording fluvial discharge in core CD154-10-06P (Fig. 7d; Simon et al., 2015), with rainfall estimates calculated with the portion of fine sediments of the Tswaing Crater record (Fig. 7f; Partridge et al., 1997), both representing SRZ climate and with the proportion of afrotemperate forests (requiring > 525 mm of annual rainfall) indicated by Podocarpaceae pollen in core IODP U1479 (Fig. 8c; Dupont et al., 2022; Fig. 1).
The PC1 record from core MD20-3592 further reinforces the hypothesis that precession and local summer insolation served as the primary drivers of South African rainfall on an orbital timescale. Numerical modelling by Simon et al. (2015) suggests that in eastern South Africa, increased precipitation during precession maxima is primarily driven by enhanced insolation, which heats the continent more than the ocean. This temperature contrast generates lower pressure over the land, drawing moisture from the Indian Ocean and the Mozambique coast toward KwaZulu-Natal and the Eastern Cape province. In the Tswaing crater record and in core CD154-10-06P, there are variations in these records on precession timescales, which are absent in the study core during MIS 6. This suggests a muting of the precession signal in the study core during MIS 6 and overall drier conditions, which is also observed in core IODP U1479. As elaborated later, this may result from the study core and core IODP U1479 receiving sediment from South Africa's southern coast, which experiences a different climate than sites situated further to the northeast. Our study core also shares similar patterns with the ratio of the Limpopo river record of core MD96-2048 (Fig. 7e; Caley et al., 2018) during MISs 1, 2, 5 and 7. The peaks that are shared are both in phase with orbital precession, and the interpretation by Caley et al. (2018) is that the main driver of hydroclimate for the Limpopo record is local summer insolation linked with orbital precession, in agreement with our own interpretation. Yet, the mismatches between our study core and core MD96-2048, which are more evident in MISs 3–4 and 6, remain to be explained and could be due to a different response of the Limpopo river basin to high-latitude forcings (Caley et al., 2018).
Our record is however not in phase with the precipitation amount indicated by δD of n-C31 alkane in leaf waxes from core MD08-3167 (Figs. 1, 8d; Collins et al., 2014) and changes in aridity inferred by the proportion of aeolian dust in core MD96-2094 (Fig. 8e; Stuut et al., 2002). However, the leaf wax record of core MD08-3167 exhibits a strong precessional component, which Collins et al. (2014) attribute to local summer insolation. The mismatch with core MD20-3592 can be explained by various factors. While the 23 ka period is seen to lead orbital precession in the study core (Fig. S8a), during MIS 5 the leaf wax record of core MD08-3167 lags local summer insolation which is itself lagging precession (Fig. S4). Chase et al. (2019), using rock hyrax middens, arrived at a conclusion opposite to that of Collins et al. (2014), suggesting that the hydroclimate of the Namib Desert is primarily influenced by the northern tropics. Their findings indicate that periods of increased local summer insolation are associated with reduced precipitation. Chase et al. (2019) explained the discrepancy between their terrestrial record and the marine core by a portion of the sediments in the marine core originating from central southern Africa, which experience a different hydroclimatic regime than the Namib Desert. Furthermore, the strength of the South Atlantic anticyclone has been found to become stronger during local summer insolation maxima (Chase et al., 2019; Little et al., 1997; Stuut et al., 2002), and during these periods there is evidence of increased aeolian transport (Lim et al., 2016; Shi et al., 2001). Thus, the mismatch between the study core and the marine cores from western South Africa could be due to these cores receiving a mix of dry Namib Desert sediments and sediment coming from further inland during local summer insolation maxima (Chase et al., 2019).
Increased rains during precession maxima can indicate that the proportion of summer rain increases; however the contribution of the winter rainfall has to be examined. Climate model results from Engelbrecht et al. (2019) projected that during the LGM the winter season was drier at the coast of the southern Cape but wetter further inland. Proxy evidence from Seweweekspoort (Chase et al., 2017, 2018) and Boomplaas Cave (Faith et al., 2019, 2024; Sealy et al., 2016), which are located currently ∼115 and ∼75 km from the coast, agrees with these model results. However, the evidence is less clear at the modern coastline of the southern Cape, with indications of drier conditions in pollen from Vankervelsvlei wetland (Quick et al., 2016) but also potential indications of increased winter precipitation recorded in bovid teeth at Nelson Bay Cave (Sealy et al., 2020). According to model results, conditions were projected to be more humid inland due to frontal systems making landfall at more northerly locations than present, caused by an equatorward shift in the SHW (Engelbrecht et al., 2019). Indications of an equatorward shift in the westerlies during cold glacial periods, including the LGM, have been observed in model results and palaeoclimatic proxies for decades (Moreno et al., 1999; Toggweiler et al., 2006). The model data comparison by Gray et al. (2023) implies that during the LGM, the westerlies were shifted equatorward by ∼4.8° and weakened by ∼25 %. This equatorward displacement is thought to result from an enhanced meridional temperature gradient during periods of global cooling, and additional factors contributing to this shift are the expansion of the polar high-pressure cells and sea ice (Engelbrecht et al., 2019). Low obliquity has also been found to favour stronger SHW and storm tracks by increasing the insolation gradient between high and low latitude (Ai et al., 2021; Timmermann et al., 2014). The model results from Engelbrecht et al. (2019) project an expansion of the YRZ in the current SRZ during the LGM. Conversely, rainfall decreases were projected near the coast because of a rain shadow occurring southeast of the Cape Fold mountains, with hot and dry berg winds being induced (Engelbrecht et al., 2019). According to these results, there would have been uneven effects in the river catchments feeding the sediments to the study coring site: in winter the upper catchments would have received more rain while the lower catchments would have received less. Additionally, work by Miller et al. (2020) suggests that an equatorward displacement of the SHW due to an increase in sea ice that occurred between 8 and 2 ka (MIS 1) was associated with a northeastward displacement of the SIOCZ and its associated rainfall. This mechanism could also have been present during glacial periods and could have reduced summer rainfalls over the south Cape coast, which seems to be the case during MIS 8, MIS 6 and MIS 3 in the study core and the Cape Floristic core IODP U1479 (Fig. 8). Additionally, both of these cores would have had the projected increase in winter rains inland mitigated by the decreased winter rains south and east of the Cape Fold mountains. Sites located northeast of the study site such as CD154-10-06P (Figs. 1, 7d; Simon et al., 2015), MD96-2048 (Figs. 1, 7e; Caley et al., 2018) and Tswaing Crater (Figs. 1, 7f; Partridge et al., 1997) do not exhibit this pattern, and this could be explained by these sites still remaining under the summer precipitation brought by the SIOCZ displaced towards the Equator. However, it is to be noted that there are alternative scenarios that can explain wetter conditions in southwestern South Africa during glacial periods such as the LGM, where the westerlies are shifted poleward or weakened. Mcgee (2020) found wetter conditions due to colder conditions and lower evaporation in southwestern South Africa. Sime et al. (2013) found that during the LGM, a weakened Hadley cell led to less subsidence of dry air around 30° S, which favoured wetter conditions near this latitude.
Finally, the data from core MD20-3592 can be used to provide a climatic context for the ∼ 120–50 ka time interval during which evidence of behavioural complexity in H. sapiens is mounting in South Africa. The general climatic trends inferred from the record are as follows: (1) initial humid conditions at ∼ 120 ka (MIS 5e) became progressively more arid from ∼ 117 to ∼ 102 ka (MISs 5d–5c); (2) more humid conditions returned between ∼ 98 and 88 ka (MISs 5c–5b), after which a pronounced period of aridity centred on ∼ 83 ka (MIS 5a) occurs; (3) conditions became progressively more humid between ∼ 83 and ∼ 72 ka (MIS 5a), after which progressive aridification occurred until ∼ 60 ka (MIS 4); (4) arid conditions persist until ∼ 50 ka (MIS 4c). These conditions overlap mostly with the changes in precession, with high values occurring at ∼ 116 ka (MIS 5d), ∼ 94 ka (MIS 5c) and ∼ 72 ka (MIS 5a) and low values occurring at ∼ 106 ka (MIS 5c), ∼ 83 ka (MIS 5a) and ∼ 60 ka (MIS 4).
The analysis of core MD20-3592 allowed us to evaluate river discharge changes in southeast African river systems due to adjustments of the hydrological cycle over the past two glacial cycles. An XRF core scanning record of elemental composition was produced and a calibration was established to obtain quantitative ratios of the elemental compositions. A comparison with regional palaeoclimate archives (core CD154-10-06P: Simon et al., 2015; Cape Fold Composite record: Chase et al., 2021) suggests that the climate signal in MD20-3592 represents the wider hydroclimatic variations that occurred in southern South Africa at that time.
Variations in the proportion of elements of terrestrial origin compared to marine carbonates in the core are interpreted to be controlled by changes in lithogenic input, with enhanced terrestrial inputs due to increased fluvial discharge during humid periods. Sediment provenance studies of the area have indicated that a major portion of the lithogenic sediments at the core site are from local sources inland (Franzese et al., 2009). Variations in terrestrial inputs have shared periodicities with orbital cycles, implying that high- and low-latitude forcings were affecting the hydrological cycle and hence riverine discharge of terrestrial sediment by increasing or reducing precipitation over the river basins. One of the main frequencies observed throughout most of the core is a precessional (∼ 23 ka) signal, as indicated by the power spectrum of PC1 (Fig. 6a) and 23 ka Gaussian filter of PC1 (Fig. 6b). This is a common feature in South African sequences and can be explained by the local insolation being mostly affected by orbital precession. Periods of high local summer insolation caused by a high precession are thought to increase the summer precipitation over the YRZ by warming the continent faster than the ocean in summer and establishing a stronger convection cell. This is in line with modelling work which showed an increased flow of moist air from the Indian Ocean and the coast of Mozambique towards eastern South Africa (Simon et al., 2015).
An obliquity (∼ 41 ka) signal was also detected in the PC1 time series, lagging behind orbital obliquity by ∼ 10 ka from ∼ 260 ka (MIS 7) until ∼ 125 ka (MIS 5) and then exhibiting an anti-phased relationship from ∼ 125 ka (MIS 5) to ∼ 2 ka (MIS 1). Therefore, aligning the obliquity signal in the sediment composition of core MD20-3592 with a specific climate-forcing mechanism remains challenging. Finally, a ∼ 122 ka cyclicity was observed in the core, which could be tied to orbital eccentricity. This observation could be explained by eccentricity modulating precession amplitude, since higher eccentricity causes higher precession and can, therefore, increase in summer precipitation.
Lower precipitation during MISs 3, 6 and 8 observed in the study core and the Cape Floristic core IODP U1479 could be explained by a northward shift in the SIOCZ and its related precipitation in response to an equatorward shift in the SHW during glacial periods. This shift in the SHW would have brought more winter rains to southwestern South Africa; however drier conditions would have been experienced at the Cape's south coast due to a rain shadow effect east and south of the Cape Fold mountains. It is important to acknowledge there are alternative scenarios explaining more humid conditions in southwestern South Africa which do not involve an equatorward shift in the SHW (Mcgee, 2020; Sime et al., 2013).
Lastly, the data from core MD20-3592 can be used to provide a climatic context for the ∼ 120–50 ka time interval (MISs 5e–3c) during which evidence of behavioural complexity mounted in South Africa (Beyin et al., 2023; Wurz, 2012). The period studied here is a key period for human evolution in southern Africa, and the data presented here may serve as a reference for future analyses of potential links between the climate and archaeological records. During this period, our PC1 records large-amplitude oscillations of precipitation on a precessional timescale. The climatic trends derived from the data can be summarised as follows: (1) humid conditions were present at ∼ 120 ka (MIS 5e) but transitioned to increasingly arid conditions from approximately ∼ 117 to ∼ 102 ka (MISs 5d–5c); (2) a return to more humid conditions occurred between ∼ 98 ka and ∼ 88 ka (MISs 5c–5b), followed by a significant arid phase centred at ∼ 83 ka (MIS 5a); (3) humidity levels increased again from ∼ 83 to ∼ 72 ka (MIS 5a), after which a gradual shift towards aridity took place until ∼ 60 ka (MIS 4); (4) arid conditions continued until ∼ 50 ka (MIS 4c).
All results from this study are available in the Supplement to this publication.
The supplement related to this article is available online at https://doi.org/10.5194/cp-21-1383-2025-supplement.
Study design: KP, MHS, EJ, SA. Methodology and data acquisition: KP, MHS, EP, JVDL. Visualisation and original draft preparation: KP. Writing and editing: KP, MHS, EJ, SA, EP, JVDL.
The contact author has declared that none of the authors has any competing interests.
Publisher’s note: Copernicus Publications remains neutral with regard to jurisdictional claims made in the text, published maps, institutional affiliations, or any other geographical representation in this paper. While Copernicus Publications makes every effort to include appropriate place names, the final responsibility lies with the authors.
We thank Natalia Vazquez Riveiros, Claire Waelbroeck, and the captain, officers and crew of R/V Marion Dufresne cruise no. MD20-225. Subsampling of the sediment core was conducted by Dag Inge Blindheim at NORCE in Bergen. Siv Hjorth Dundas and Hildegunn Almelid were responsible for element and trace element analysis at Universitetet I Bergen. Eivind Støren oversaw XRF analysis with the help of Sunniva Rutledal and Alan Kvindesland at Universitetet I Bergen. Stable oxygen isotope analysis was conducted under the supervision of Ulysses Silas Ninnemann at Universitetet I Bergen.
This research has been supported by the Research Council of Norway through its Centres of Excellence funding scheme, SFF Centre for Early Sapiens Behaviour (SapienCE) (project number 262618).
This paper was edited by Kathleen Wendt and reviewed by two anonymous referees.
Ai, X. E., Studer, A. S., Sigman, D. M., Martínez-garcía, A., Fripiat, F., Schmitt, M., Oleynik, S., Jaccard, S. L., and Haug, G. H.: Southern Ocean upwelling, Earth's obliquity, and glacial-interglacial atmospheric CO2 change, Science, 80, 1348–1352, https://doi.org/10.1126/science.abd2115, 2021.
Bar-Matthews, M., Marean, C. W., Jacobs, Z., Karkanas, P., Fisher, E. C., Herries, A. I. R., Brown, K., Williams, H. M., Bernatchez, J., Ayalon, A., and Nilssen, P. J.: A high resolution and continuous isotopic speleothem record of paleoclimate and paleoenvironment from 90 to 53 ka from Pinnacle Point on the south coast of South Africa, Quaternary Sci. Rev., 29, 2131–2145, https://doi.org/10.1016/j.quascirev.2010.05.009, 2010.
Behrensmeyer, A. K.: Climate Change and Human Evolution, Science, 311, 476–478, https://doi.org/10.1126/science.1116051, 2006.
Benedetti, M. F., Menard, O., Noack, Y., Carvalho, A., and Nahon, D.: Water-rock interactions in tropical catchments: field rates of weathering and biomass impact, Chem. Geol., 118, 203–220, https://doi.org/10.1016/0009-2541(94)90177-5, 1994.
Beyin, A., Wright, D. K., Wilkins, J., and Olszewski, D.: Handbook of Pleistocene Archaeology of Africa, Springer, 2146 pp., https://doi.org/10.1007/978-3-031-20290-2, 2023.
Bosmans, J. H. C., Hilgen, F. J., Tuenter, E., and Lourens, L. J.: Obliquity forcing of low-latitude climate, Clim. Past, 11, 1335–1346, https://doi.org/10.5194/cp-11-1335-2015, 2015.
Bouchet, M., Landais, A., Grisart, A., Parrenin, F., Prié, F., Jacob, R., Fourré, E., Capron, E., Raynaud, D., Lipenkov, V. Y., Loutre, M.-F., Extier, T., Svensson, A., Legrain, E., Martinerie, P., Leuenberger, M., Jiang, W., Ritterbusch, F., Lu, Z.-T., and Yang, G.-M.: The Antarctic Ice Core Chronology 2023 (AICC2023) chronological framework and associated timescale for the European Project for Ice Coring in Antarctica (EPICA) Dome C ice core, Clim. Past, 19, 2257–2286, https://doi.org/10.5194/cp-19-2257-2023, 2023.
Bradfield, J., Lombard, M., Reynard, J., and Wurz, S.: Further evidence for bow hunting and its implications more than 60 000 years ago: Results of a use-trace analysis of the bone point from Klasies River Main site, South Africa, Quaternary Sci. Rev., 236, 106295, https://doi.org/10.1016/j.quascirev.2020.106295, 2020.
Braun, K., Bar-Matthews, M., Matthews, A., Ayalon, A., Zilberman, T., Cowling, R. M., Fisher, E. C., Herries, A. I. R., Brink, J. S., and Marean, C. W.: Comparison of climate and environment on the edge of the Palaeo-Agulhas Plain to the Little Karoo (South Africa) in Marine Isotope Stages 5–3 as indicated by speleothems, Quaternary Sci. Rev., 235, 105803, https://doi.org/10.1016/j.quascirev.2019.06.025, 2020.
Broccoli, A. J., Dahl, K. A., and Stouffer, R. J.: Response of the ITCZ to Northern Hemisphere cooling, Geophys. Res. Lett., 33, 1–4, https://doi.org/10.1029/2005GL024546, 2006.
Brown, K. S., Marean, C. W., Herries, A. I. R., Jacobs, Z., Tribolo, C., Braun, D., Roberts, D. L., Meyer, M. C., and Bernatchez, J.: Fire as an engineering tool of early modern humans, Science, 325, 859–862, https://doi.org/10.1126/science.1175028, 2009.
Caley, T., Kim, J.-H., Malaizé, B., Giraudeau, J., Laepple, T., Caillon, N., Charlier, K., Rebaubier, H., Rossignol, L., Castañeda, I. S., Schouten, S., and Sinninghe Damsté, J. S.: High-latitude obliquity as a dominant forcing in the Agulhas current system, Clim. Past, 7, 1285–1296, https://doi.org/10.5194/cp-7-1285-2011, 2011.
Caley, T., Extier, T., Collins, J. A., Schefuß, E., Dupont, L., Malaizé, B., Rossignol, L., Souron, A., McClymont, E. L., Jimenez-Espejo, F. J., García-Comas, C., Eynaud, F., Martinez, P., Roche, D. M., Jorry, S. J., Charlier, K., Wary, M., Gourves, P. Y., Billy, I., and Giraudeau, J.: A two-million-year-long hydroclimatic context for hominin evolution in southeastern Africa, Nature, 560, 76–79, https://doi.org/10.1038/s41586-018-0309-6, 2018.
Castañeda, I. S., Caley, T., Dupont, L., Kim, J. H., Malaizé, B., and Schouten, S.: Middle to Late Pleistocene vegetation and climate change in subtropical southern East Africa, Earth Planet. Sci. Lett., 450, 306–316, https://doi.org/10.1016/j.epsl.2016.06.049, 2016.
Cawthra, H. C., Cowling, R. M., Andò, S., and Marean, C. W.: Geological and soil maps of the Palaeo-Agulhas Plain for the Last Glacial Maximum, Quaternary Sci. Rev., 235, 105858, https://doi.org/10.1016/j.quascirev.2019.07.040, 2020a.
Cawthra, H. C., Anderson, R. J., De Vynck, J. C., Jacobs, Z., Jerardino, A., Kyriacou, K., and Marean, C. W.: Migration of Pleistocene shorelines across the Palaeo-Agulhas Plain: Evidence from dated sub-bottom profiles and archaeological shellfish assemblages, Quaternary Sci. Rev., 235, 106107, https://doi.org/10.1016/j.quascirev.2019.106107, 2020b.
Chase, B., Harris, C., deWit, M. J., Kramers, J., Doel, S., and Stankiewicz, J.: South African speleothems reveal influence of high and lowlatitude forcing over the past 113.5 k.y., Geology, 49, 1353–1357, https://doi.org/10.1130/G49323.1, 2021.
Chase, B. M.: Orbital forcing in southern Africa: Towards a conceptual model for predicting deep time environmental change from an incomplete proxy record, Quaternary Sci. Rev., 265, 107050, https://doi.org/10.1016/j.quascirev.2021.107050, 2021.
Chase, B. M. and Meadows, M. E.: Late Quaternary dynamics of southern Africa's winter rainfall zone, Earth-Sci. Rev., 84, 103–138, https://doi.org/10.1016/j.earscirev.2007.06.002, 2007.
Chase, B. M. and Quick, L. J.: Influence of Agulhas forcing of Holocene climate change in South Africa's southern Cape, Quat. Res. (United States), 90, 303–309, https://doi.org/10.1017/qua.2018.57, 2018.
Chase, B. M., Chevalier, M., Boom, A., and Carr, A. S.: The dynamic relationship between temperate and tropical circulation systems across South Africa since the last glacial maximum, Quaternary Sci. Rev., 174, 54–62, https://doi.org/10.1016/j.quascirev.2017.08.011, 2017.
Chase, B. M., Faith, J. T., Mackay, A., Chevalier, M., Carr, A. S., Boom, A., Lim, S., and Reimer, P. J.: Climatic controls on Later Stone Age human adaptation in Africa's southern Cape, J. Hum. Evol., 114, 35–44, https://doi.org/10.1016/j.jhevol.2017.09.006, 2018.
Chase, B. M., Niedermeyer, E. M., Boom, A., Carr, A. S., Chevalier, M., He, F., Meadows, M. E., Ogle, N., and Reimer, P. J.: Orbital controls on Namib Desert hydroclimate over the past 50,000 years, Geology, 47, 867–871, https://doi.org/10.1130/G46334.1, 2019.
Cohen, M. X.: A better way to define and describe Morlet wavelets for time-frequency analysis, Neuroimage, 199, 81–86, https://doi.org/10.1016/j.neuroimage.2019.05.048, 2019.
Collins, J. A., Schefuß, E., Govin, A., Mulitza, S., and Tiedemann, R.: Insolation and glacial-interglacial control on southwestern African hydroclimate over the past 140000 years, Earth Planet. Sci. Lett., 398, 1–10, https://doi.org/10.1016/j.epsl.2014.04.034, 2014.
Cook, K. H.: The South Indian convergence zone and interannual rainfall variability over Southern Africa, J. Climate, 13, 3789–3804, https://doi.org/10.1175/1520-0442(2000)013<3789:TSICZA>2.0.CO;2, 2000.
Cowling, R. M.: The occurrence of 3 Carbon and 4 Carbon pathways in Fynbos and allied shrublands in the Southeastern Cape South Africa, Oecologia, 58, 121–127, 1983.
Cowling, R. M., Potts, A. J., Franklin, J., Midgley, G. F., Engelbrecht, F., and Marean, C. W.: Describing a drowned Pleistocene ecosystem: Last Glacial Maximum vegetation reconstruction of the Palaeo-Agulhas Plain, Quaternary Sci. Rev., 235, 105866, https://doi.org/10.1016/j.quascirev.2019.105866, 2020.
Croudace, I. W. and Rothwell, R. G.: ITRAX: Description and evaluation of a new multi-function X-ray core scanner, Geol. Soc. Spec. Publ., 267, 51–63, https://doi.org/10.1144/GSL.SP.2006.267.01.04, 2006.
Croudace, I. W. and Rothwell, R. G.: Micro-XRF Studies of Sediment Cores. Applications of a Non-destructive Tool for the Environmental Sciences, Springer, Dordrecht, 668 pp., https://doi.org/10.1007/978-94-017-9849-5, 2015.
Daniau, A. L., Loutre, M. F., Swingedouw, D., Laepple, T., Bassinot, F., Malaizé, B., Kageyama, M., Charlier, K., and Carfantan, H.: Precession and obliquity forcing of the South African monsoon revealed by sub-tropical fires, Quaternary Sci. Rev., 310, 108128, https://doi.org/10.1016/j.quascirev.2023.108128, 2023.
Davies, S. J., Lamb, H. F., and Roberts, S. J.: Micro-XRF Core Scanning in Palaeolimnology: Recent Developments, in: Micro-XRF Studies of Sediment Cores, edited by: Croudace, I. W. and Rothwell, R. G., Springer, 189–226, https://doi.org/10.1007/978-94-017-9849-5_7, 2015.
Dean, W. E. J.: Determination of carbonate and organic matter in calcareous sediments and sedimentary rocks by loss on ignition: Comparison with other methods, J. Sed. Pet., 44, 242–248, 1974.
d'Errico, F. and Henshilwood, C. S.: Additional evidence for bone technology in the southern African Middle Stone Age, J. Hum. Evol., 52, 142–163, https://doi.org/10.1016/j.jhevol.2006.08.003, 2007.
Driessen, P., Deckers, J., Spaargaren, O., and Nachtergaele, F. (Eds.): Lectures on the major soils of the world, 308 pp., https://openknowledge.fao.org/handle/20.500.14283/y1899e (last access: 14 July 2025), 2001.
Dunlea, A. G., Murray, R. W., Tada, R., Alvarez-Zarikian, C. A., Anderson, C. H., Gilli, A., Giosan, L., Gorgas, T., Hennekam, R., Irino, T., Murayama, M., Peterson, L. C., Reichart, G. J., Seki, A., Zheng, H., and Ziegler, M.: Intercomparison of XRF Core Scanning Results From Seven Labs and Approaches to Practical Calibration, Geochem. Geophys. Geosyst., 21, e2020GC009248, https://doi.org/10.1029/2020GC009248, 2020.
Dupont, L. M., Zhao, X., Charles, C., Faith, J. T., and Braun, D.: Continuous vegetation record of the Greater Cape Floristic Region (South Africa) covering the past 300 000 years (IODP U1479), Clim. Past, 18, 1–21, https://doi.org/10.5194/cp-18-1-2022, 2022.
Engelbrecht, F. A., Marean, C. W., Cowling, R. M., Engelbrecht, C. J., Neumann, F. H., Scott, L., Nkoana, R., O'Neal, D., Fisher, E., Shook, E., Franklin, J., Thatcher, M., McGregor, J. L., Van der Merwe, J., Dedekind, Z., and Difford, M.: Downscaling Last Glacial Maximum climate over southern Africa, Quaternary Sci. Rev., 226, 105879, https://doi.org/10.1016/j.quascirev.2019.105879, 2019.
Faith, J. T., Chase, B. M., and Avery, D. M.: Late Quaternary micromammals and the precipitation history of the southern Cape, South Africa, Quat. Res. (United States), 91, 729–750, https://doi.org/10.1017/qua.2018.105, 2019.
Faith, J. T., Chase, B. M., and Pargeter, J.: The Last Glacial Maximum climate at Boomplaas Cave, South Africa, Quaternary Sci. Rev., 329, 108557, https://doi.org/10.1016/j.quascirev.2024.108557, 2024.
Franzese, A. M., Hemming, S. R., Goldstein, S. L., and Anderson, R. F.: Reduced Agulhas Leakage during the Last Glacial Maximum inferred from an integrated provenance and flux study, Earth Planet. Sci. Lett., 250, 72–88, https://doi.org/10.1016/j.epsl.2006.07.002, 2006.
Franzese, A. M., Hemming, S. R., and Goldstein, S. L.: Use of strontium isotopes in detrital sediments to constrain the glacial position of the agulhas retroflection, Paleoceanography, 24, 1–12, https://doi.org/10.1029/2008PA001706, 2009.
Garzanti, E., Padoan, M., Setti, M., López-Galindo, A., and Villa, I. M.: Provenance versus weathering control on the composition of tropical river mud (southern Africa), Chem. Geol., 366, 61–74, https://doi.org/10.1016/j.chemgeo.2013.12.016, 2014.
Göktürk, O. M., Simon, M. H., Sobolowski, S. P., Zhang, Z., Van Der Bilt, W., Mørkved, P. T., D'Andrea, W. J., van Niekerk, K. L., Henshilwood, C. S., Armitage, S. J., and Jansen, E.: Behaviourally modern humans in coastal southern Africa experienced an increasingly continental climate during the transition from Marine Isotope Stage 5 to 4, Front. Earth Sci., 11, 1–20, https://doi.org/10.3389/feart.2023.1198068, 2023.
Gottschalk, J., Hodell, D. A., Skinner, L. C., Crowhurst, S. J., Jaccard, S. L., and Charles, C.: Past Carbonate Preservation Events in the Deep Southeast Atlantic Ocean (Cape Basin) and Their Implications for Atlantic Overturning Dynamics and Marine Carbon Cycling, Paleoceanogr. Paleoclimatol., 33, 643–663, https://doi.org/10.1029/2018PA003353, 2018.
Govin, A., Holzwarth, U., Heslop, D., Ford Keeling, L., Zabel, M., Mulitza, S., Collins, J. A., and Chiessi, C. M.: Distribution of major elements in Atlantic surface sediments (36° N–49° S): Imprint of terrigenous input and continental weathering, Geochemistry, Geophys. Geosyst., 13, 1–23, https://doi.org/10.1029/2011GC003785, 2012.
Gray, W. R., de Lavergne, C., Jnglin Wills, R. C., Menviel, L., Spence, P., Holzer, M., Kageyama, M., and Michel, E.: Poleward Shift in the Southern Hemisphere Westerly Winds Synchronous With the Deglacial Rise in CO2, Paleoceanogr. Paleoclimatol., 38, 1–23, https://doi.org/10.1029/2023PA004666, 2023.
Grinsted, A., Moore, J. C., and Jevrejeva, S.: Application of the cross wavelet transform and wavelet coherence to geophysical time series, Nonlin. Processes Geophys., 11, 561–566, https://doi.org/10.5194/npg-11-561-2004, 2004.
Hahn, A., Schefuß, E., Groeneveld, J., Miller, C., and Zabel, M.: Glacial to interglacial climate variability in the southeastern African subtropics (25–20° S), Clim. Past, 17, 345–360, https://doi.org/10.5194/cp-17-345-2021, 2021a.
Hahn, A., Neumann, F. H., Miller, C., Finch, J., Frankland, T., Cawthra, H. C., Schefuß, E., and Zabel, M.: Mid-to Late Holocene climatic and anthropogenic influences in Mpondoland, South Africa, Quaternary Sci. Rev., 261, 106938, https://doi.org/10.1016/j.quascirev.2021.106938, 2021b.
Heaton, T. J., Köhler, P., Butzin, M., Bard, E., Reimer, R. W., Austin, W. E. N., Bronk Ramsey, C., Grootes, P. M., Hughen, K. A., Kromer, B., Reimer, P. J., Adkins, J., Burke, A., Cook, M. S., Olsen, J., and Skinner, L. C.: Marine20 – The Marine Radiocarbon Age Calibration Curve (0–55,000 cal BP), Radiocarbon, 62, 779–820, https://doi.org/10.1017/RDC.2020.68, 2020.
Henshilwood, C. S., d'Errico, F., and Watts, I.: Engraved ochres from the Middle Stone Age levels at Blombos Cave, South Africa, J. Hum. Evol., 57, 27–47, https://doi.org/10.1016/j.jhevol.2009.01.005, 2009.
Henshilwood, C. S., D'Errico, F., Van Niekerk, K. L., Coquinot, Y., Jacobs, Z., Lauritzen, S. E., Menu, M., and García-Moreno, R.: A 100,000-year-old ochre-processing workshop at Blombos Cave, South Africa, Science, 334, 219–222, https://doi.org/10.1126/science.1211535, 2011.
Henshilwood, C. S., van Niekerk, K. L., Wurz, S., Delagnes, A., Armitage, S. J., Rifkin, R. F., Douze, K., Keene, P., Haaland, M. M., Reynard, J., Discamps, E., and Mienies, S. S.: Klipdrift Shelter, southern cape, south africa: Preliminary report on the howiesons poort layers, J. Archaeol. Sci., 45, 284–303, https://doi.org/10.1016/j.jas.2014.01.033, 2014.
Henshilwood, C. S., d'Errico, F., van Niekerk, K. L., Dayet, L., Queffelec, A., and Pollarolo, L.: An abstract drawing from the 73,000-year-old levels at Blombos Cave, South Africa, Nature, 562, 115–118, https://doi.org/10.1038/s41586-018-0514-3, 2018.
Hernández-Almeida, I., Ausín, B., Saavedra-Pellitero, M., Baumann, K. H., and Stoll, H. M.: Quantitative reconstruction of primary productivity in low latitudes during the last glacial maximum and the mid-to-late Holocene from a global Florisphaera profunda calibration dataset, Quaternary Sci. Rev., 205, 166–181, https://doi.org/10.1016/j.quascirev.2018.12.016, 2019.
Hines, S. K. V., Bolge, L., Goldstein, S. L., Charles, C. D., Hall, I. R., and Hemming, S. R.: Little Change in Ice Age Water Mass Structure From Cape Basin Benthic Neodymium and Carbon Isotopes, Paleoceanogr. Paleoclimatol., 36, e2021PA004281, https://doi.org/10.1029/2021PA004281, 2021.
Hodell, D. A., Charles, C. D., and Sierro, F. J.: Late Pleistocene evolution of the ocean's carbonate system, Earth Planet. Sci. Lett., 192, 109–124, https://doi.org/10.1016/S0012-821X(01)00430-7, 2001.
Huybers, P.: Early Pleistocene Glacial Cycles and the Integrated Summer Insolation Forcing, Science, 313, 508–511, https://doi.org/10.1126/science.1125249, 2006.
Jouzel, J., Masson-Delmotte, V., Cattani, O., Dreyfus, G., Falourd, S., Hoffmann, G., Minster, B., Nouet, J., Barnola, J. M., Chappellaz, J., Fischer, H., Gallet, J. C., Johnsen, S., Leuenberger, M., Loulergue, L., Luethi, D., Oerter, H., Parrenin, F., Raisbeck, G., Raynaud, D., Schilt, A., Schwander, J., Selmo, E., Souchez, R., Spahni, R., Stauffer, B., Steffensen, J. P., Stenni, B., Stocker, T. F., Tison, J. L., Werner, M., and Wolff, E. W.: Orbital and millennial antarctic climate variability over the past 800,000 years, Science, 317, 793–796, https://doi.org/10.1126/science.1141038, 2007.
Jury, M. R., Valentine, H. R., and Lutjeharms, J. R. E.: Influence of the Agulhas Current on Summer Rainfall along the Southeast Coast of South Africa, J. Appl. Meteorol., 32, 1282–1287, https://doi.org/10.1175/1520-0450(1993)032<1282:IOTACO>2.0.CO;2, 1993.
Koutsodendris, A., Nakajima, K., Kaboth-Bahr, S., Berke, M. A., Franzese, A. M., Hall, I. R., Hemming, S. R., Just, J., Levay, L. J., Pross, J., Robinson, R., Barker, S., Brentegani, L., Caley, T., Cartagena-Sierra, A., Charles, C. D., Coenen, J. J., Crespin, J. G., Gruetzner, J., Han, X., Hines, S. K. V., Espejo, F. J. J., Kubota, K., Lathika, N., Norris, R. D., Dos Santos, T. P., Rolinson, J. M., Simon, M. H., Tangunan, D., van der Lubbe, J. J. L., Yamane, M., and Zhang, H.: A plio-pleistocene (C. 0–4 ma) cyclostratigraphy for iodp site u1478 (mozambique channel, sw indian ocean): Exploring an offshore record of paleoclimate and ecosystem variability in se africa, Newsletters Stratigr., 54, 159–181, https://doi.org/10.1127/nos/2020/0608, 2021.
Kylander, M. E., Ampel, L., Wohlfarth, B., and Veres, D.: High-resolution X-ray fluorescence core scanning analysis of Les Echets (France) sedimentary sequence: New insights from chemical proxies, J. Quat. Sci., 26, 109–117, https://doi.org/10.1002/jqs.1438, 2011.
Laskar, J., Robutel, P., Joutel, F., Gastineau, M., Correia, A. C. M., and Levrard, B.: A long-term numerical solution for the insolation quantities of the Earth, Astron. Astrophys., 428, 261–285, https://doi.org/10.1051/0004-6361:20041335, 2004.
Lazenby, M. J., Todd, M. C., and Wang, Y.: Climate model simulation of the South Indian Ocean Convergence Zone: Mean state and variability, Clim. Res., 68, 59–71, https://doi.org/10.3354/cr01382, 2016.
Li, M., Hinnov, L., and Kump, L.: Acycle: Time-series analysis software for paleoclimate research and education, Comput. Geosci., 127, 12–22, https://doi.org/10.1016/j.cageo.2019.02.011, 2019.
Lim, S., Chase, B. M., Chevalier, M., and Reimer, P. J.: 50,000 years of vegetation and climate change in the southern Namib Desert, Pella, South Africa, Palaeogeogr. Palaeoclimatol. Palaeoecol., 451, 197–209, https://doi.org/10.1016/j.palaeo.2016.03.001, 2016.
Lisiecki, L. E. and Raymo, M. E.: A Pliocene-Pleistocene stack of 57 globally distributed benthic δ18O records, Paleoceanography, 20, 1–17, https://doi.org/10.1029/2004PA001071, 2005.
Little, M. G., Schneider, R. R., Kroon, D., Price, B., Summerhayes, C. P., and Segl, M.: Trade wind forcing of upwelling, seasonality, and Heinrich events as a response to sub-Milankovitch climate variability, Paleoceanography, 12, 568–576, https://doi.org/10.1029/97PA00823, 1997.
Lougheed, B. C. and Obrochta, S. P.: MatCal: Open Source Bayesian 14C Age Calibration in Matlab, J. Open Res. Softw., 4, 42, https://doi.org/10.5334/jors.130, 2016.
Lougheed, B. C. and Obrochta, S. P.: A Rapid, Deterministic Age-Depth Modeling Routine for Geological Sequences With Inherent Depth Uncertainty, Paleoceanogr. Paleoclimatol., 34, 122–133, https://doi.org/10.1029/2018PA003457, 2019.
Ludwig, W. and Probst, J. L.: River sediment discharge to the oceans; present-day controls and global budgets, Am. J. Sci., 298, 265–295, 1998.
Maher, B. A., Prospero, J. M., Mackie, D., Gaiero, D., Hesse, P. P., and Balkanski, Y.: Global connections between aeolian dust, climate and ocean biogeochemistry at the present day and at the last glacial maximum, Earth-Sci. Rev., 99, 61–97, https://doi.org/10.1016/j.earscirev.2009.12.001, 2010.
März, C., Hoffmann, J., Bleil, U., de Lange, G. J., and Kasten, S.: Diagenetic changes of magnetic and geochemical signals by anaerobic methane oxidation in sediments of the Zambezi deep-sea fan (SW Indian Ocean), Mar. Geol., 255, 118–130, https://doi.org/10.1016/j.margeo.2008.05.013, 2008.
Maslin, M. A. and Ridgwell, A. J.: Mid-Pleistocene revolution and the “eccentricity myth,” Geol. Soc. Spec. Publ., 247, 19–34, https://doi.org/10.1144/GSL.SP.2005.247.01.02, 2005.
Mcbrearty, S. and Brooks, A. S.: The revolution that wasn't: A new interpretation of the origin of modern human behavior, J. Hum. Evol., 39, 453–563, https://doi.org/10.1006/jhev.2000.0435, 2000.
McCall, G. S. and Thomas, J. T.: Still Bay and Howiesons Poort Foraging Strategies: Recent Research and Models of Culture Change, African Archaeol. Rev., 29, 7–50, https://doi.org/10.1007/s10437-012-9107-y, 2012.
McCave, I. N., Thornalley, D. J. R., and Hall, I. R.: Relation of sortable silt grain-size to deep-sea current speeds: Calibration of the `Mud Current Meter,' Deep. Res. Part I, 127, 1–12, https://doi.org/10.1016/j.dsr.2017.07.003, 2017.
Mcgee, D.: Glacial – Interglacial Precipitation Changes, Ann. Rev. Mar. Sci., 12, 525–557, https://doi.org/10.1146/annurev-marine-010419-010859, 2020.
Miller, C., Hahn, A., Liebrand, D., Zabel, M., and Schefuß, E.: Mid- and low latitude effects on eastern South African rainfall over the Holocene, Quaternary Sci. Rev., 229, 106088, https://doi.org/10.1016/j.quascirev.2019.106088, 2020.
Moreno, P. I., Lowell, T. V., Jacobson Jr., G. L., and Denton, G. H.: Abrupt Vegetation and Climate Changes During the Last Glacial Maximumand Last Termination in The Chilean Lake District: A Case Study from Canal De La Puntilla (41oS), Geogr. Ann. Ser. A Phys. Geogr., 81, 285–311, https://doi.org/10.1111/1468-0459.00059, 1999.
Mourre, V., Villa, P., and Henshilwood, C. S.: Early Use of Pressure Flaking on Lithic, Science, 330, 659–662, 2010.
Partridge, T. C., Demenocal, P. B., Lorentz, S. A., Paiker, M. J., and Vogel, J. C.: Orbital forcing of climate over South Africa: A 200,000-year rainfall record from the Pretoria Saltpan, Quaternary Sci. Rev., 16, 1125–1133, https://doi.org/10.1016/S0277-3791(97)00005-X, 1997.
Pryor, E. J., Tangunan, D., van der Lubbe, H. J. L., Simon, M. H., and Hall, I. R.: Recommended centrifuge method: Specific grain size separation in the < 63 µm fraction of marine sediments, MethodsX, 12, 102718, https://doi.org/10.1016/j.mex.2024.102718, 2024.
Quick, L. J., Meadows, M. E., Bateman, M. D., Kirsten, K. L., Mäusbacher, R., Haberzettl, T., and Chase, B. M.: Vegetation and climate dynamics during the last glacial period in the fynbos-afrotemperate forest ecotone, southern Cape, South Africa, Quaternary Int., 404, 136–149, https://doi.org/10.1016/j.quaint.2015.08.027, 2016.
R Core Team: R: A language and Environment for Statistical Computing, https://www.r-project.org/ (last access: 15 December 2023), 2023.
Reason, C. J. C. and Mulenga, H.: Relationships between South African rainfall and SST anomalies in the southwest Indian Ocean, Int. J. Climatol., 19, 1651–1673, https://doi.org/10.1002/(SICI)1097-0088(199912)19:15<1651::AID-JOC439>3.0.CO;2-U, 1999.
Reimer, P. J. and Reimer, R. W.: A marine reservoir correction database and on-line interface, Radiocarbon, 43, 461–463, https://doi.org/10.1017/s0033822200038339, 2001.
Rial, J. A.: Pacemaking the ice ages by frequency modulation of Earth's orbital eccentricity, Science, 285, 564–568, https://doi.org/10.1126/science.285.5427.564, 1999.
Rickaby, R. E. M., Elderfield, H., Roberts, N., Hillenbrand, C. D., and Mackensen, A.: Evidence for elevated alkalinity in the glacial Southern Ocean, Paleoceanography, 25, 1–15, https://doi.org/10.1029/2009PA001762, 2010.
Schefuß, E., Kuhlmann, H., Mollenhauer, G., Prange, M., and Pätzold, J.: Forcing of wet phases in southeast Africa over the past 17,000 years, Nature, 480, 509–512, https://doi.org/10.1038/nature10685, 2011.
Sealy, J., Lee-Thorp, J., Loftus, E., Faith, J. T., and Marean, C. W.: Late Quaternary environmental change in the Southern Cape, South Africa, from stable carbon and oxygen isotopes in faunal tooth enamel from Boomplaas Cave, J. Quat. Sci., 31, 919–927, https://doi.org/10.1002/jqs.2916, 2016.
Sealy, J., Naidoo, N., Hare, V. J., Brunton, S., and Faith, J. T.: Climate and ecology of the palaeo-Agulhas Plain from stable carbon and oxygen isotopes in bovid tooth enamel from Nelson Bay Cave, South Africa, Quaternary Sci. Rev., 235, 105974, https://doi.org/10.1016/j.quascirev.2019.105974, 2020.
Shi, N., Schneider, R., Beug, H. J., and Dupont, L. M.: Southeast trade wind variations during the last 135 kyr: Evidence from pollen spectra in eastern South Atlantic sediments, Earth Planet. Sci. Lett., 187, 311–321, https://doi.org/10.1016/S0012-821X(01)00267-9, 2001.
Sime, L. C., Kohfeld, K. E., Le Quéré, C., Wolff, E. W., de Boer, A. M., Graham, R. M., and Bopp, L.: Southern Hemisphere westerly wind changes during the Last Glacial Maximum: Model-data comparison, Quaternary Sci. Rev., 64, 104–120, https://doi.org/10.1016/j.quascirev.2012.12.008, 2013.
Simon, M. H., Ziegler, M., Bosmans, J., Barker, S., Reason, C. J. C., and Hall, I. R.: Eastern South African hydroclimate over the past 270,000 years, Sci. Rep., 5, 1–10, https://doi.org/10.1038/srep18153, 2015.
Singarayer, J. S. and Burrough, S. L.: Interhemispheric dynamics of the African rainbelt during the late Quaternary, Quaternary Sci. Rev., 124, 48–67, https://doi.org/10.1016/j.quascirev.2015.06.021, 2015.
Starr, A., Hall, I. R., Barker, S., Nederbragt, A., Owen, L., and Hemming, S. R.: Shifting Antarctic Circumpolar Current south of Africa over the past 1.9 million years, Sci. Adv., 11, eadp1692, https://doi.org/10.1126/sciadv.adp1692, 2025.
Stuut, J. B. W., Prins, M. A., Schneider, R. R., Weltje, G. J., Fred Jansen, J. H., and Postma, G.: A 300-kyr record of aridity and wind strength in southwestern Africa: Inferences from grain-size distributions of sediments on Walvis Ridge, SE Atlantic, Mar. Geol., 180, 221–233, https://doi.org/10.1016/S0025-3227(01)00215-8, 2002.
Suescún, D., Villegas, J. C., León, J. D., Flórez, C. P., García-Leoz, V., and Correa-Londoño, G. A.: Vegetation cover and rainfall seasonality impact nutrient loss via runoff and erosion in the Colombian Andes, Reg. Environ. Chang., 17, 827–839, https://doi.org/10.1007/s10113-016-1071-7, 2017.
Tangunan, D., Berke, M. A., Cartagena-Sierra, A., Flores, J. A., Gruetzner, J., Jiménez-Espejo, F., LeVay, L. J., Baumann, K. H., Romero, O., Saavedra-Pellitero, M., Coenen, J. J., Starr, A., Hemming, S. R., Hall, I. R., Barker, S., Brentegani, L., Caley, T., Charles, C. D., Crespin, J. G., Franzese, A. M., Han, X., Hines, S. K. V., Jimenez Espejo, F. J., Just, J., Koutsodendris, A., Kubota, K., Lathika, N., Norris, R. D., dos Santos, T. P., Robinson, R. S., Rolison, J. M., Simon, M. H., Tangunan, D., van der Lubbe, J. J. L., Yamane, M., and Zhang, H.: Strong glacial-interglacial variability in upper ocean hydrodynamics, biogeochemistry, and productivity in the southern Indian Ocean, Commun. Earth Environ., 2, 80, https://doi.org/10.1038/s43247-021-00148-0, 2021.
Taylor, S. P., Patterson, M. O., Lam, A. R., Jones, H., Woodard, S. C., Habicht, M. H., Thomas, E. K., and Grant, G. R.: Expanded North Pacific Subtropical Gyre and Heterodyne Expression During the Mid-Pleistocene, Paleoceanogr. Paleoclimatol., 37, 1–22, https://doi.org/10.1029/2021PA004395, 2022.
Thomson, J., Higgs, N. C., and Colley, S.: Diagenetic redistributions of redox-sensitive elements in northeast Atlantic glacial/interglacial transition sediments, Earth Planet. Sci. Lett., 139, 365–377, https://doi.org/10.1016/0012-821X(96)00031-3, 1996.
Tim, N., Zorita, E., Hünicke, B., and Ivanciu, I.: The impact of the Agulhas Current system on precipitation in southern Africa in regional climate simulations covering the recent past and future, Weather Clim. Dynam., 4, 381–397, https://doi.org/10.5194/wcd-4-381-2023, 2023.
Timmermann, A., Friedrich, T., Timm, O. E., Chikamoto, M. O., Abe-Ouchi, A., and Ganopolski, A.: Modeling obliquity and CO2 effects on southern hemisphere climate during the past 408 ka, J. Climate, 27, 1863–1875, https://doi.org/10.1175/JCLI-D-13-00311.1, 2014.
Tjallingii, R., Röhl, U., Kölling, M., and Bickert, T.: Influence of the water content on X-ray fluorescence corescanning measurements in soft marine sediments, Geochem. Geophys. Geosyst., 8, 1–12, https://doi.org/10.1029/2006GC001393, 2007.
Todd, M. C., Washington, R., and Palmer, P. I.: Water vapour transport associated with tropical-temperate trough systems over southern Africa and the southwest Indian Ocean, Int. J. Climatol., 24, 555–568, https://doi.org/10.1002/joc.1023, 2004.
Toggweiler, J. R., Russell, J. L., and Carson, S. R.: Midlatitude westerlies, atmospheric CO2, and climate change during the ice ages, Paleoceanography, 21, 1–15, https://doi.org/10.1029/2005PA001154, 2006.
Torrence, C. and Compo, G. P.: A Practical Guide to Wavelet Analysis, Bull. Am. Meteorol. Soc., 79, 61–78, https://doi.org/10.1175/1520-0477(1998)079<0061:APGTWA>2.0.CO;2, 1998.
Tzedakis, P. C., Crucifix, M., Mitsui, T., and Wolff, E. W.: A simple rule to determine which insolation cycles lead to interglacials, Nature, 542, 427–432, https://doi.org/10.1038/nature21364, 2017.
Uenzelmann-Neben, G. and Huhn, K.: Sedimentary deposits on the southern South African continental margin: Slumping versus non-deposition or erosion by oceanic currents?, Mar. Geol., 266, 65–79, https://doi.org/10.1016/j.margeo.2009.07.011, 2009.
van Aken, H. M., Ridderinkhof, H., and De Ruijter, W. P. M.: North Atlantic deep water in the south-western Indian Ocean, Deep. Res. Part I, 51, 755–776, https://doi.org/10.1016/j.dsr.2004.01.008, 2004.
van Zinderen Bakker, E. M.: The evolution of late Quaternary paleoclimates of Southern Africa, Palaeoecol. Africa, 9, 160–202, 1976.
Vazquez Riveiros, N. and Waelbroeck, C.: MD 225 / ACCLIMATE-2 cruise, RV Marion Dufresne, 171 pp., https://doi.org/10.17600/18001350, 2020.
Weltje, G. J. and Tjallingii, R.: Calibration of XRF core scanners for quantitative geochemical logging of sediment cores: Theory and application, Earth Planet. Sci. Lett., 274, 423–438, https://doi.org/10.1016/j.epsl.2008.07.054, 2008.
West, S., Jansen, J. H. F., and Stuut, J. B.: Surface water conditions in the Northern Benguela Region (SE Atlantic) during the last 450 ky reconstructed from assemblages of planktonic foraminifera, Mar. Micropaleontol., 51, 321–344, https://doi.org/10.1016/j.marmicro.2004.01.004, 2004.
Wurz, S.: Variability in the Middle Stone Age lithic sequence, 115,000–60,000 years ago at Klasies River, South Africa, J. Archaeol. Sci., 29, 1001–1015, https://doi.org/10.1006/jasc.2001.0799, 2002.
Wurz, S.: The Transition to Modern Behavior, Nat. Educ. Knowl., 3, 1–9, 2012.
Yu, J., Menviel, L., Jin, Z. D., Anderson, R. F., Jian, Z., Piotrowski, A. M., Ma, X., Rohling, E. J., Zhang, F., Marino, G., and McManus, J. F.: Last glacial atmospheric CO2 decline due to widespread Pacific deep-water expansion, Nat. Geosci., 13, 628–633, https://doi.org/10.1038/s41561-020-0610-5, 2020.
Zabel, M., Schneider, R. R., Wagner, T., Adegbie, A. T., De Vries, U., and Kolonic, S.: Late quaternary climate changes in central Africa as inferred from terrigenous input to the Niger fan, Quat. Res., 56, 207–217, https://doi.org/10.1006/qres.2001.2261, 2001.
Ziegler, M., Simon, M. H., Hall, I. R., Barker, S., Stringer, C., and Zahn, R.: Development of Middle Stone Age innovation linked to rapid climate change, Nat. Commun., 4, 1905–1909, https://doi.org/10.1038/ncomms2897, 2013.