the Creative Commons Attribution 4.0 License.
the Creative Commons Attribution 4.0 License.
 | 16 Apr 2024
Utilising a multi-proxy to model comparison to constrain the season and regionally heterogeneous impacts of the Mt Samalas 1257 eruption
Laura Wainman
Lauren R. Marshall
Anja Schmidt
The Mt Samalas eruption, thought to have occurred in summer 1257, ranks as one of the most explosive sulfur-rich eruptions of the Common Era. Despite recent convergence, several dates have been proposed for the eruption ranging between 1256–1258, with, as of yet, no single combination of evidence that has been able to robustly distinguish between and exclude the other dates proposed for the Mt Samalas eruption. Widespread surface cooling and hydroclimate perturbations following the eruption have been invoked as contributing to a host of 13th century social and economic crises, although regional-scale variability in the post-eruption climate response remains uncertain. In this study we run ensemble simulations using the UK Earth System Model (UKESM1) with a range of eruption scenarios and initial conditions in order to compare our simulations with the most complete globally resolved multi-proxy database for the Mt Samalas eruption to date, incorporating tree rings, ice cores, and historical records. This allows more precise constraints to be placed on the year and season of the Mt Samalas eruption, as well as an investigation into the regionally heterogeneous post-eruption climate response. Using a multi-proxy to model comparison, we are able to robustly distinguish between July 1257 and January 1258 eruption scenarios, where the July 1257 ensemble simulation achieves considerably better agreement with spatially averaged and regionally resolved proxy surface temperature reconstructions. These reconstructions suggest the onset of significant cooling across Asia and Europe in 1258 and thus support the plausibility of previously inferred historical connections. Model-simulated temperature anomalies also point to severe surface cooling across the Southern Hemisphere with as of yet unexplored historical implications for impacted civilisations. Model simulations of polar sulfate deposition also reveal distinct differences in the timing of ice sheet deposition between the two simulated eruption dates, although comparison of the magnitude or asymmetric deposition of sulfate aerosol remains limited by large inter-model differences and complex intra-model dependencies. Overall, the multi-proxy to model comparison employed in this study has strong potential in constraining similar uncertainties in eruption source parameters for other historical eruptions for which sufficient coincident proxy records are available, although care is needed to avoid the pitfalls of model–multi-proxy comparison.
- Article
(2155 KB) - Full-text XML
-
Supplement
(2501 KB) - BibTeX
- EndNote


The Mt Samalas eruption, which occurred on the Indonesian island of Lombok between 1257 and 1258, is identified in ice cores as one of the largest volcanic sulfate deposition events of the last 2500 years (Palais et al., 1992; Zielinski et al., 1994; Sigl et al., 2015). Petrological analysis suggests a release of ∼ 120 Tg of sulfur dioxide (SO2) into the stratosphere, with a maximum estimated plume height of 43 km and a volcanic explosivity index (VEI) of 7, meaning the eruption ranks as one of the most explosive sulfur-rich eruptions of the Common Era (Lavigne et al., 2013; Vidal et al., 2015; Toohey and Sigl, 2017). Tree ring reconstructions suggest a peak Northern Hemisphere (NH) average summer cooling of −0.8 to −1.2 °C between summer 1258 and 1259 (Schneider et al., 2015; Guillet et al., 2017; Wilson et al., 2016; Büntgen et al., 2022). The surface air temperature (SAT) anomalies and potential hydroclimate perturbations induced by the eruption have been invoked by historians as contributing factors to a host of 13th century social and economic crises (Campbell, 2017; Malawani et al., 2022; Guillet et al., 2017; Bierstedt, 2019; Stothers, 2000; Green, 2020; Di Cosmo et al., 2021).
The full span of dates proposed for the Mt Samalas eruption ranges from 1256 to 1258, with suggestions including an eruption in spring 1256 (Bauch, 2019), summer 1257 (Lavigne et al., 2013; Oppenheimer, 2003), and early 1258 (Stothers, 2000). While consensus has converged on a summer 1257 eruption date, as of yet no single combination of evidence has been able to robustly distinguish between and exclude the other dates proposed for the Mt Samalas eruption. The suggestion of spring 1256 was based on historical evidence for a dust veil over Asia and the Middle East in late 1256 and early 1257 (Bauch, 2019). This is more likely attributed to a smaller eruption, such as the 1256 Medina eruption which had only localised impacts (Saliba, 2017). A mid-1257 eruption date was first proposed by Oppenheimer (2003), based on the spatial distribution of negative temperature anomalies across both hemispheres for 1257–1259. Radiocarbon dating of the pyroclastic flow deposits associated with the eruption also yields a youngest eruption age boundary of 1257, with some samples being older, but no samples are younger than 1257 (Lavigne et al., 2013). Based on the westerly displacement of ash isopachs, Lavigne et al. (2013) proposed that easterly winds prevailed at the time of the eruption, indicative of the eruption occurring during the May–October dry season. Negative tree ring width (TRW) growth anomalies in the late 1257 growth season (Büntgen et al., 2022) and frost rings (Salzer and Hughes, 2007) in the western US in 1257 and 1259 also add support for a potential eruption date prior to August 1257. Modelling studies for the Mt Samalas eruption have achieved best agreement with tree ring reconstructions for a May–July eruption window (Stoffel et al., 2015). Nonetheless, Stothers (2000) suggests a later eruption date of early 1258, based on peak sulfate deposition for the Mt Samalas eruption occurring in 1259 (from Hammer et al., 1980) and the first historical reports of a dust veil over Europe appearing in summer 1258, which they suggest is most compatible with an early 1258 eruption. Therefore, there is still a need to constrain the year and season of the eruption with greater certainty, with implications for evaluating the robustness of inferred connections to synchronous historical events, as well as in the role of the eruption sulfate deposition spike as a key temporal calibration marker in ice core records.
The regionally heterogeneous climate response to the Mt Samalas eruption also remains largely unconstrained at a global level. Guillet et al. (2017) utilised a wealth of historical records and tree ring chronologies to assess the impact of the eruption across the NH, with particular focus on the climate response to the eruption revealed by historical sources in western Europe. Medieval chronicles point to abnormal weather conditions in summer 1258, with economic records highlighting delayed and poor harvests which likely aggravated ongoing grain shortages. Stothers (2000) suggested that frequently cold and rainy weather lead to widespread crop damage and famine, also noting the outbreak of a plague across Europe and the Middle East in 1258–1259. Suggestions that the Mt Samalas eruption can be linked to the initiation of the “Big Bang” diversification event which led to the Branch 1 strain of Yersinia pestis responsible for the Black Death in Europe (Fell et al., 2020) have recently been refuted, with consensus forming instead that this plague proliferation event can be traced to the Tian Shan region much earlier in the 13th century (Green, 2020; Fancy and Green, 2021). Nonetheless, connections have still been drawn between the anomalous climatic conditions following the eruption and the fall of Baghdad to the Mongol Empire in 1258, as well as the subsequent defeat of the Mongol Army at the battle of Ayn Jālūt in 1260 which marked the collapse of the Mongol westward advance (Green, 2020; Di Cosmo et al., 2021; Kern et al., 2021). Without a comprehensive understanding of the extent and chronology of climate response to the eruption on a regional scale, the robustness of these inferred connections between post-eruption climate response and historical events remains difficult to constrain.
The magnitude and spatial distribution of the post-eruption climate response following large volcanic eruptions is known to show a strong seasonal dependency (Stevenson et al., 2017; Toohey et al., 2011). Asymmetric cooling between hemispheres occurs due to seasonal variation in the Brewer–Dobson circulation which modulates hemispheric aerosol distribution (e.g. Toohey et al., 2011). Asymmetric aerosol distribution combined with enhanced land–albedo feedbacks during NH winter can therefore increase the magnitude of temperature anomalies between hemispheres (Stevenson et al., 2017). Hemispheric temperature contrasts can subsequently drive latitudinal shifts in the Inter-Tropical Convergence Zone (ITCZ), an equatorial band of enhanced rainfall and lower pressure, away from the hemisphere of greatest cooling, resulting in hydroclimate perturbations (Broccoli et al., 2006). Therefore, depending on if the Mt Samalas eruption occurred in summer 1257 or in early 1258, differences in the magnitude and spatial distribution of resulting SAT and precipitation anomalies are expected.
In this study we utilise a multi-proxy to model comparison to place more precise constraints on the year and season of the Mt Samalas eruption, tested across the whole window of proposed eruption dates. We utilise both model and proxy constraints to assess regionally heterogeneous impacts of the Mt Samalas eruption, with reference to proposed historical consequences. Van Dijk et al. (2023) demonstrated the effectiveness of this model–multi-proxy approach in their investigation of the regional climatic and social consequences in Scandinavia following the 536 and 540 CE double eruption event, including incorporating additional archaeological evidence. UK Earth System Model (UKESM1) simulations were run across January and July eruption scenarios, and a globally resolved database of proxy records was collated, consisting of tree ring chronologies, historical sources, and ice core records (Sheet S1 in the Supplement). Our study demonstrates the ability of a multi-proxy to model comparison to more precisely constrain the date of the Mt Samalas eruption, where previous studies have tended to utilise only a single-proxy approach (Stothers, 2000; Bauch, 2019; Büntgen et al., 2022; Stoffel et al., 2015). The multi-proxy to model comparison employed in this study is shown to have significant potential in constraining similar uncertainties in eruption source parameters for other historical eruptions where sufficient coincident proxy records are available.
2.1 Model simulations using the UK Earth System Model (UKESM)
The state-of-the-art interactive aerosol–climate model UKESM1 (Sellar et al., 2019) was used, consisting of the physical global climate model HadGEM3-GC3.1 with additional configurations for terrestrial and marine biogeochemistry, land and ocean physics, ocean–sea ice, and dynamic terrestrial vegetation. The model also includes the UK Chemistry and Aerosol (UKCA) interactive stratospheric–tropospheric chemistry and aerosol schemes (Archibald et al., 2020; Mulcahy et al., 2020). The full life cycle of stratospheric sulfur and sulfate aerosol particles is included, from the injection of SO2, oxidation, particle formation, and subsequent growth to sedimentation and removal.
The model has a horizontal atmospheric resolution of 1.875° by 1.25° and a 1° by 1° resolution in the ocean, giving a vertical resolution of 85 levels in the atmosphere and 75 levels in the ocean. This results in well-resolved ocean and atmosphere dynamics and an internally generated quasi-biennial oscillation (QBO). Coupled ocean–atmosphere simulations were run with greenhouse gases set to a representative preindustrial (CE 1850) background state. The difference between a preindustrial and bespoke 13th century background state is small compared to the model internal variability and thus does not represent a significant limitation of the approach.
In total, 18 UKESM eruption-perturbed ensemble simulations were run, with 9 simulating a January eruption (JAN1258) and 9 a July eruption (JUL1257), where January and July are winter/summer representatives, respectively. Given the preindustrial background, the January/July ensemble groupings are not constrained to a specific year, and therefore the two ensemble groupings have been used to assess the full range of dates proposed for the Mt Samalas eruption between the years 1256 and 1258. The ensembles sample a range of initial conditions, with the starting phase of both QBO and the El Niño–Southern Oscillation (ENSO) varying between ensembles. For full details of ensemble initial condition classification, see Table S1. Across the 18 ensembles, only the eruption season and initial conditions were varied, with all other eruption source parameters held constant and as listed in Table 1.
Table 1Eruption source parameter values used in the ensemble simulations.
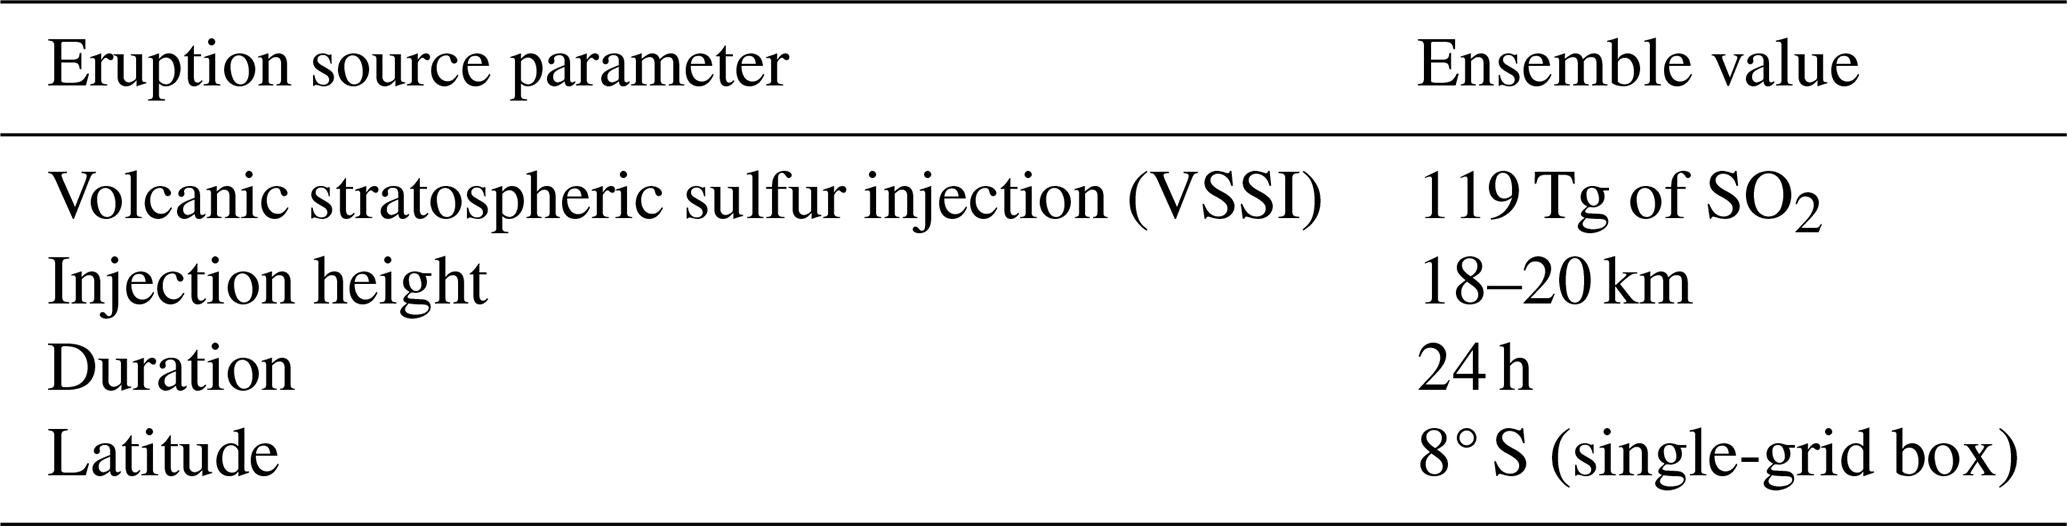
A total of 119 Tg of SO2 was taken from the updated database of VSSI estimates (eVolv2k; Toohey and Sigl, 2017), which is within the error of 126 ± 9.6 Tg estimated by Vidal et al. (2016). In our simulations, the injection height is set at 18–20 km to be consistent with the 1991 Mt Pinatubo eruption and to allow for lofting of aerosol to higher altitudes in the stratosphere. This height is lower than the estimated 38–40 km column heights (Lavigne et al., 2013; Vidal et al., 2015). However, those column heights refer to the maximum altitude of tephra and ash rather than the height of sulfur injection in the stratosphere or the maximum altitude of the SO2 plume. A 24 h eruption duration agrees well with Lavigne et al. (2013), who estimated the eruption duration to be 23.8 ± 10.3 h.
An equivalent control ensemble, with identical starting conditions but no eruption perturbation, was run for each of the individual eruption-perturbed ensemble simulations. Anomalies were calculated with respect to a climatological background constructed from the control ensemble mean.
2.2 Multi-proxy database of surface temperature impacts
The proxy database (see Sheets S1 and S2 in the Supplement for full details) was constructed by compiling records indicative of changes to climate (tree ring chronologies, ice core records, and historical sources) that span the range of dates proposed for the eruption with a minimum of annual resolution. While the aim was to create a global database of proxy records, this was significantly impeded by the limited global distribution of all types of proxy records, which show a strong bias to the NH, European, and North American localities. No suitable data for this study were found from Africa or South America.
2.2.1 Tree ring chronologies
We include 24 region-specific tree ring studies, distributed predominantly across the NH, although two studies from Australia and New Zealand are included. The parameter used for temperature reconstruction varies between studies, as does the tree species analysed and season of reconstruction depending on study location (see Sheet S1 for details). SAT anomalies for 1258 and 1259 were taken either directly from the referenced study or calculated from reconstructed SAT anomalies using a background climatology which was constructed from the 10-year average prior to the eruption. Where studies reported that frost rings were present, they have also been included in the database.
In addition to the 24 region-specific studies, 4 NH spatially averaged reconstructions have also been incorporated (Wilson et al., 2016; Schneider et al., 2015; Büntgen et al., 2021; Guillet et al., 2017), along with the N-TREND reconstruction which is spatially resolved for the NH (Anchukaitis et al., 2017; see Fig. S3 for the spatial distribution of records used in the N-TREND reconstruction). For consistency in this study, all tree-ring-reconstructed SAT anomalies are calculated from the 10-year average prior to 1257.
2.2.2 Ice core records
We include six δ18O isotope series ice core records from Greenland and Antarctica, where records were chosen on the basis of both annual resolution and an age dating precision of ±1 year. Linear regression analysis was applied to calibrate the series to June–August (JJA) gridded temperature anomalies (with respect to 1990–1960) from the BEST dataset (Rohde and Hausfather, 2020). An additional SAT constraint is also included in Greenland for summer 1258 from analysis by Guillet et al. (2017), who utilised three Greenland ice cores at GRIP, CRETE, and DYE3 (Vinther et al., 2010) to calculate a clustered SAT anomaly for the region. Additional ice core records were investigated to expand this analysis such as the Illimani ice core in Bolivia and the Belukha ice core in Altai, Siberia; however, these records lacked the annual resolution required to constrain abrupt temperature changes associated with volcanic eruptions and/or the age dating precision to clearly identify signatures from the Mt Samalas eruption.
2.2.3 Historical sources
Historical sources consist predominantly of medieval chronicles which refer to abnormal and/or extreme weather events in the years 1258–1259. Analysis of medieval chronicles and economic records for the years 1258–1259 by Guillet et al. (2017) form the basis of historical constraints in Europe. Additional chronicles include references from the Russian Annals in the Altai Mountains (Borisenkov and Paseckij, 1983; Guillet et al., 2017), the Chronicle of Novgorod from Central Russia (Stothers, 2000), the Þorgils Saga Skarða in Iceland (Bierstedt, 2019), and Azuma Kagami from Japan (Farris, 2006). References to abnormally dark lunar eclipses are also included from the Chronicle of the Abbey of Bury St. Edmunds (Stothers, 2000) and the Annales Ianuenses (Guillet et al., 2017). Additional historical sources across Europe, as well as some from the Middle East, report plague, famine, and economic crises for 1258–1260 (Stothers, 2000). These sources have not been incorporated into the database, as they refer to social and economic disturbances rather than making direct references to abnormal climatological phenomena.
2.3 Simulated SAT anomalies
2.3.1 Northern Hemisphere average
Spatially averaged NH summer land SAT anomalies were calculated for the mean of the nine JUL1257 and JAN1258 ensembles, respectively. Constraints were applied to model-simulated surface temperature outputs to make them most comparable to tree ring reconstructions (latitudes of 40–75° N, land only; JJA was taken as representative of the growth season). Using four NH spatially averaged tree ring chronologies (Wilson et al., 2016; Schneider et al., 2015; Büntgen et al., 2021; Guillet et al., 2017; see Fig. S1 in the Supplement for individual chronology comparison), a mean NH summer SAT anomaly time series was also calculated to which the model-simulated anomalies are compared.
2.3.2 Spatially resolved comparison
Spatially resolved model-simulated summer (JJA) SAT anomalies were calculated globally and for the NH between 1258–1259. This time window was chosen because the JUL1257 and JAN1258 ensemble simulations show the greatest divergence in SAT anomalies for the summers in 1258–1259. Model-simulated NH SAT anomalies were re-gridded and masked to facilitate more direct comparison with the N-TREND dataset (Anchukaitis et al., 2017). An analysis of variance (ANOVA) test was performed by eruption season to determine at which grid points the variance in means between the 1258 and 1259 perturbed ensembles exceeded 95 % significance relative to the control ensemble simulations, where the null hypothesis was that there was no difference between the mean grid point anomalies for the perturbed 1258 and 1259 ensembles compared to the control ensemble.
3.1 Multi-proxy to model comparison
3.1.1 Northern Hemisphere
Figure 1 shows that the JUL1257 ensemble mean (solid blue line) is the only eruption scenario to lie consistently within 2σ of the tree ring mean (grey band around the black line), with good agreement with tree-ring-reconstructed anomalies for both the timing and magnitude of peak cooling across the whole period (1257–1262). The JAN1258 eruption ensemble mean (solid pink line) also results in peak cooling occurring in summer 1258, although the magnitude of model-simulated cooling is much greater (by over 1 °C) than the peak tree ring reconstructed cooling. Across individual JAN1258 eruption ensembles (shown in Fig. S2), only two lie within 2σ of the tree ring mean for the whole period. By contrast, for the individual JUL1257 eruption ensembles, seven lie within 2σ of the tree ring mean for the whole period (Fig. S2). Both JUL1256 (dashed blue line) and JAN1257 (dashed pink line) eruption scenarios result in peak cooling occurring a year early relative to the tree-ring-reconstructed mean, and across both scenarios no individual ensemble members lie within 2σ of the tree ring mean for 1257–1260.
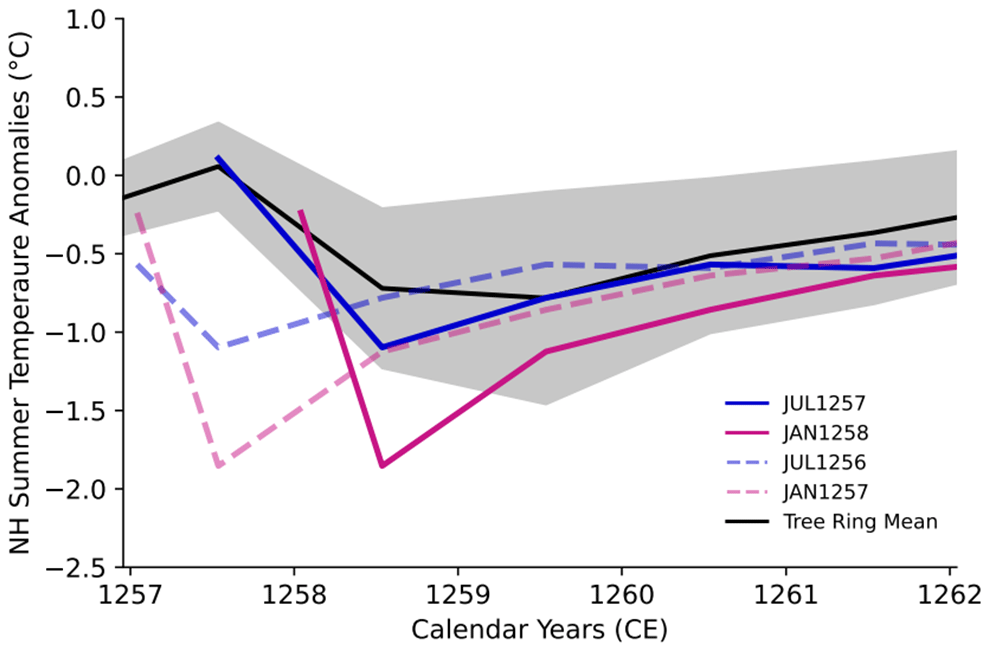
Figure 1NH summer JJA surface temperature anomalies. Blue shows the JUL1257 ensemble mean. Pink shows the JAN1258 ensemble mean. Solid and dashed lines indicate different eruption years. Black line shows the mean of the tree-ring-reconstructed summer surface air temperature anomalies, and the grey band shows 2σ around the tree ring mean. Tree ring data refer to Wilson et al. (2016), Schneider et al. (2015), Büntgen et al. (2021), Guillet et al. (2017). See Sheet S2 in the Supplement for details of each tree ring study.
When compared to the N-TREND spatially resolved tree-ring-reconstructed anomalies (Fig. 2a, d), the JUL1257 ensemble mean (Fig. 2c, f) results in more consistent agreement with the magnitude and spatial distribution of SAT anomalies across the NH for the summers of 1258 and 1259. For summer 1258, the mean grid point difference between N-TREND reconstructions and the JUL1257 ensemble mean is +0.19 (σ= 1.08), while the difference with the JAN1258 ensemble mean is +0.78 (σ= 0.99), with the JAN1258 ensemble mean (Fig. 2b, e) tending to overpredict summer SAT anomalies relative to N-TREND reconstructions. Across the US West Coast and central and northern Europe, N-TREND reconstructions suggest cooling of −1 to −2 °C, whereas model-simulated anomalies for the JAN1258 ensemble mean are on the order of −2 to −3 °C. By contrast, the JUL1257 ensemble mean shows widespread but more moderate negative SAT anomalies of −1 to −2 °C across the NH for summer 1258 and thus achieves better agreement with N-TREND reconstructions. Nonetheless, model-simulated anomalies for the JUL1257 mean suggest cooling of up to −2 °C in central and northwest Asia, which is an underprediction relative to N-TREND tree ring reconstructions which suggest cooling of up to −3 °C in summer 1258.
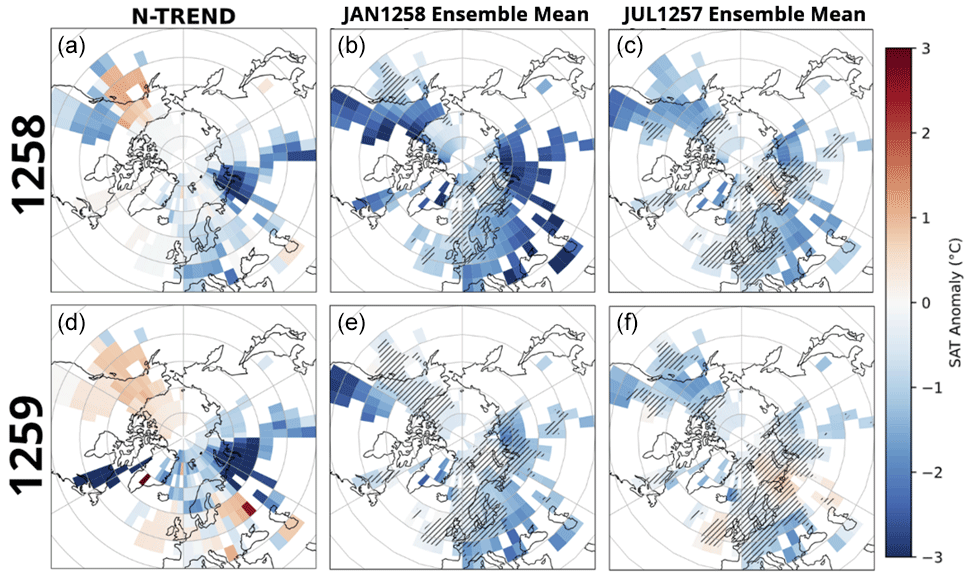
Figure 2Spatially resolved N-TREND model comparison for JJA average 1258–1259 for the Northern Hemisphere (40–90° N). N-TREND data are from Anchukaitis et al. (2017). First column shows N-TREND reconstructed summer surface temperature anomalies. Second column shows model-simulated summer surface temperature anomalies for the JAN1258 ensemble mean. Third column shows the same for the JUL1257 ensemble mean. Hashed areas show regions of less than 95 % significance, as determined using a grid box ANOVA analysis.
Greater regional variability is seen in N-TREND SAT anomalies for summer 1259. N-TREND reconstructions suggest negative SAT anomalies in northern Eurasia and Quebec of up to −3 °C and between −1 and −2 °C in northern Europe and central Asia. Positive SAT anomalies of up to +1 °C are seen in Alaska and western Europe. The JAN1258 ensemble mean shows continued widespread negative anomalies of −1 to −3 °C across the whole NH and thus does not achieve consistent agreement with reconstructed anomalies across northern and western Europe, the US West Coast, or Alaska. By contrast, the JUL1257 ensemble mean shows moderate positive SAT anomalies in northern and western Europe of up to +0.5 °C, although it still somewhat underpredicts the magnitude of cooling in central and northern Asia and the US East Coast relative to N-TREND reconstructions.
Notably, neither the JUL1257 nor JAN1258 ensemble mean achieves agreement with positive SAT anomalies reconstructed in Alaska for the summers of 1258 and 1259. Across individual ensembles (see Figs. S4–S7) only one JUL1257 and four JAN1258 ensembles show positive SAT anomalies in this region. Of these ensembles, three are classified as having warm-phase ENSO initial conditions. N-TREND reconstructions show moderate SAT anomalies in Alaska from 1255–1256, with strong positive SAT anomalies first appearing in reconstructions for summer 1257 (shown in Fig. S8).
3.1.2 Globally resolved multi-proxy constraints
Model-simulated SAT anomalies for a JUL1257 eruption (Fig. 3a, b) and a JAN1258 eruption (Fig. 3c, d) across the summers (JJA) of 1258 (Fig. 3a, c) and 1259 (Fig. 3b, d) are shown in Fig. 3, with symbols denoting the degree of agreement with multi-proxy-reconstructed SAT anomalies. The locations and SAT anomalies constrained by proxy records are shown in Fig. S3. Overall, the JUL1257 ensemble mean shows more consistent agreement with proxy SAT constraints across Europe, Asia, and North America, while the JAN1258 ensemble mean tends to overpredict the magnitude of negative SAT anomalies relative to quantitative proxy constraints.
Summer 1258
For summer 1258, large negative SAT anomalies are well constrained across central Asia, with tree ring reconstructions suggesting cooling in the region of up to −0.4 °C in Tibet and −1.1 °C in Mongolia (Xu et al., 2019; Davi et al., 2015, 2021), as well as the presence of frost rings late in the 1258 growth season (D'Arrigo et al., 2001). In Japan, the Mirror of the East refers to persistent cold and wet conditions. Negative SAT anomalies are constrained across northern Russia, with cooling up to −2.7 °C (Briffa et al., 2013) and frost rings also present in the Polar Urals, Siberia (Hantemirov et al., 2004). Both JAN1258 and JUL1257 model ensembles suggest strong cooling across central and northern Asia; however, only the JUL1257 ensemble mean lies consistently within ±1 °C of the proxy constraints, while anomalies of up to −4 °C for the JAN1258 ensemble mean are an overprediction relative to proxy constraints (see filled symbols in Fig. 3c and e).
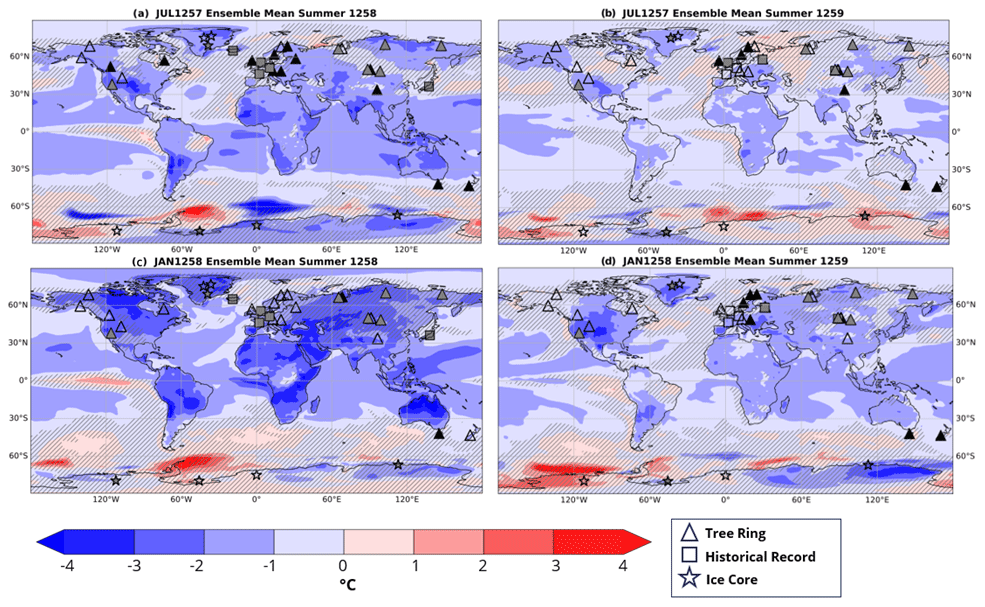
Figure 3(a–b) Globally resolved multi-proxy database visualised for the summers of 1258 and 1259. Symbols denote proxy data type, where blue/red shading denotes absolute negative or positive anomalies, respectively. (c–f) Globally resolved surface air temperature anomalies for the summers (June–July–August) of 1258 (a, c) and 1259 (b, d) for JUL1257 eruptions (a, b) and JAN1258 eruptions (c, d) and ensemble means. Surface air temperature anomalies were calculated relative to a 10-year background climatology constructed from the control ensemble mean. Hashed lines denote anomalies at < 95 % significance as determined by a grid point ANOVA analysis. Black filled symbols denote agreement within ±1 °C between model-simulated anomalies and quantitative proxy records. Grey filled symbols denote qualitative agreement with proxy records. Locations and proxy-constrained SAT anomalies are shown in Fig. S3.
Across northern, central, and western Europe, negative SAT anomalies are constrained by a combination of tree ring reconstructions, with moderate cooling of up to −0.3 °C in Europe (Büntgen et al., 2011) and a multitude of medieval chronicles across France, Germany, and England which refer to cold and wet conditions (Guillet et al., 2017). The JUL1257 ensemble shows SAT anomalies of up to −1 °C, which is in good agreement with proxy constraints on the magnitude of cooling (see filled triangles across Europe in Fig. 3a), whereas the JAN1258 ensemble mean shows cooling between −2 and −3 °C. The Þorgils Saga Skarða in Iceland also refers to abnormally cold and wet weather during 1258 (Bierstedt, 2019), although ice core reconstructions in Greenland show only minor SAT anomalies of between +0.09 and −0.1 °C (Guillet et al., 2017; Vinther et al., 2010; Fischer et al., 1998; Vinther et al., 2006). JAN1258 and JUL1257 ensemble means suggest cooling of up to −3 and −2 °C, respectively, and so both overpredict the magnitude of cooling across Greenland. Ice core records across Antarctica all show moderate negative SAT anomalies of up to −0.1 °C. The JUL1257 ensemble mean does show negative anomalies across three of the four ice core sites, although the magnitude of model-simulated cooling (−2 to −3 °C) is much greater. The JAN1258 ensemble shows more variable SAT anomalies with both warming and cooling anomalies across Antarctica.
SAT anomalies are more variable across North America, with reconstructions in eastern Canada showing both positive and negative SAT anomalies of 0.09 and −1.6 °C, respectively (Gennaretti et al., 2014; Moore et al., 2001). The JUL1257 ensemble shows agreement with both proxy constraints, suggesting cooling of up to −2 °C on Baffin Island and showing no significant SAT anomaly in the Quebec region, while the JAN1258 ensemble mean shows cooling of up to −3 °C and thus overpredicts cooling in both regions. Tree ring reconstructions in the western US and Canadian Rockies suggest negative SAT anomalies of up to −0.5 and −1.6 °C (Martin et al., 2020; Luckman and Wilson, 2005). The JAN1258 ensemble overpredicts the magnitude of cooling relative to proxy constraints with SAT anomalies of up to −3 °C, while the JUL1257 ensemble mean shows more moderate anomalies of up to −2 °C. Positive SAT anomalies are well constrained by tree ring reconstructions in the Gulf of Alaska, with warming of up to 0.1 and 0.9 °C (Wiles et al., 2014). However, neither the JAN1258 nor the JUL1257 ensemble means show positive SAT anomalies in this region.
Summer 1259
Persistent strong negative SAT anomalies are well constrained for central Asia with tree ring reconstructions suggesting continued cooling of up to −2.3 °C in Mongolia and −0.3 °C in Tibet (Davi et al., 2015; Xu et al., 2019) as well as frost rings present early in the 1259 growth season (Churakova et al., 2019; D'Arrigo et al., 2001). The Russian Annals in the Altai Mountains and the Chronicles of Novgorod from Central Russia make reference to abnormal summer snowfall and unusual frost days in April 1259 (Borisenkov and Paseckij, 1983; Guillet et al., 2017; Stothers, 2000), with tree ring reconstructions showing continued negative SAT anomalies across northern Russia of up to −4 °C (Briffa et al., 2013). Both JAN1258 and JUL1257 ensemble means show moderate negative anomalies of between −1 and −2 °C in central Asia; however, only the JAN1258 ensemble mean shows stronger negative SAT anomalies of up to −3 °C in northern Russia, while anomalies for the JUL1257 ensemble mean do not exceed 95 % significance. Tree ring reconstructions show some positive SAT anomalies across central Europe of up to 0.2 °C (Büntgen et al., 2011), and in western Europe, medieval chronicles refer to a hot and dry summer (Guillet et al., 2017). Very moderate SAT anomalies across Europe are only shown by the JUL1257 ensemble mean, while the JAN1258 ensemble continues to show cooling in the region of up to −2 °C. Ice core records in Greenland show very moderate SAT anomalies of 0.02 °C (Fischer et al., 1998) and −0.009 °C (Vinther et al., 2006). However, both JAN1258 and JUL1257 ensemble means show cooling across Greenland of −1 to −2 °C.
Negative SAT anomalies persist across eastern North America with cooling of up to −2.6 °C (Gennaretti et al., 2014). Cooling of up to −2 °C is shown by both ensemble means across Baffin Island (NE Canada); however, neither ensemble achieves agreement with the stronger cooling signal in Quebec. Along the western coast of North America, tree ring reconstructions yield positive SAT anomalies of up to +0.8 °C in the Missouri River basin and +0.3 °C in the Canadian Rockies (Martin et al., 2020; Luckman and Wilson, 2005). Both ensembles continue to show cooling along the US West Coast, although the magnitude is more moderate for the JUL1257 ensemble. In the Gulf of Alaska, tree ring reconstructions suggest continued positive SAT anomalies of up to +0.7 °C (Wiles et al., 2014). The JAN1258 ensemble mean shows no anomalies exceeding 95 % significance in Alaska, while the JUL1257 ensemble mean shows continued cooling of up to −2 °C, and so neither eruption scenario achieves good agreement with proxy constraints. Ice core records across Antarctica continue to show moderate cooling anomalies of up to −0.15 °C, apart from the Law Dome (Plummer et al., 2012; 112° E) core which shows a moderate warming anomaly of +0.16. The JUL1257 ensemble mean does show a warming anomaly in the east of Antarctica; however, cooling anomalies are more isolated in west Antarctica compared to those reconstructed from ice core records. The JAN1258 ensemble mean shows poor agreement with ice core records with warm SAT anomalies in the east of Antarctica and cool SAT anomalies in the west.
3.2 Re-evaluating evidence for a January 1258 eruption date
Two lines of evidence have previously been invoked to support an early 1258 eruption date, with references in medieval chronicles to a “dark lunar eclipse” in mid-May 1258 (Stothers, 2000) and peak sulfate fallout in Greenland ice scores in early 1259 (Hammer et al., 1980). Figure 4a shows the model-simulated stratospheric aerosol optical depth (SAOD) averaged across western Europe for the years following the eruption, with the black line showing the eVolv2k SAOD for the PMIP4 forcing, which is based on a July 1257 eruption date (Toohey and Sigl, 2017). Marked by the grey lines are the dark lunar eclipses of 18–19 May and 12–13 November 1258, as identified by Stothers (2000) in the Chronicle of the Abbey of Bury St. Edmunds and Guillet et al. (2017) in the Annales Ianuenses, respectively, where an SAOD > 0.1 is needed for the moon to appear dark (Stothers, 2005). While a JAN1258 eruption scenario does result in a later SAOD peak, both a JUL1257 and a JAN1258 eruption result in SAOD ≫ 0.1 during both May and November 1258, and therefore, either eruption scenario could account for observations of darkened lunar eclipses. This is supported by findings from Guillet et al. (2023) that a dark total lunar eclipse is most likely to be observed 3 to 20 months following an eruption. SAOD in the UKESM for both JUL1257 and JAN1258 ensembles decays more rapidly than SAOD under PMIP4 forcing, for which SAOD remains > 0.1 until mid-1260 CE.
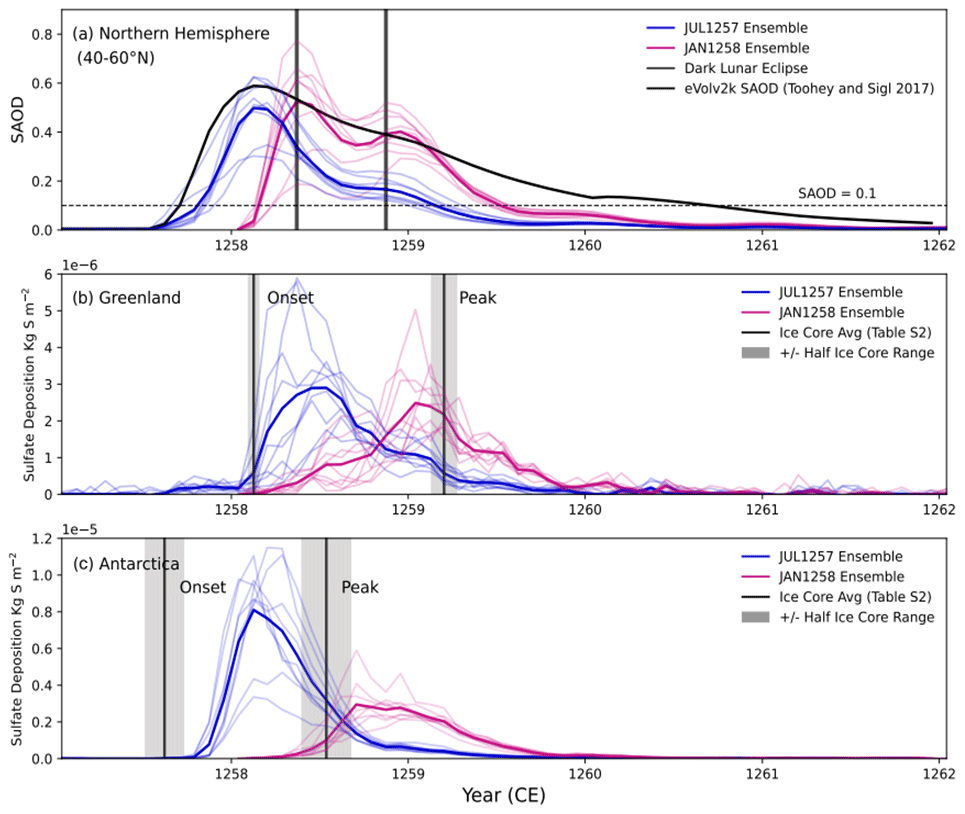
Figure 4(a) Model-simulated stratospheric aerosol optical depth (SAOD) time series averaged across western Europe (latitude 40–60° N, longitude 10° W–10° E) for JUL1257 (blue line) and JAN1258 (pink line) eruption scenarios, where bold lines are the ensemble means. Vertical grey bars denote historical records of dark lunar eclipses in May 1258 (England) and November 1258 (Genoa). The dashed horizontal line at SAOD = 0.1 denotes the minimum SAOD required for a dark lunar eclipse. (b–c) Model-simulated sulfate deposition (kg S m−2) over the Greenland and Antarctica ice sheets for JUL1257 (blue) and JAN1258 (pink) eruption scenarios. The region of deposition is limited to the single-model grid box containing the NEEM (North Greenland Eemian Ice Drilling; Greenland) and the WDC (WAIS (West Antarctic Ice Sheet) Divide; Antarctica) ice core drill sites, respectively. Black lines are time series from NEEM and WDC ice core records, respectively (Sigl et al., 2015), with grey bars showing ±1-year uncertainty for the timing of peak deposition.
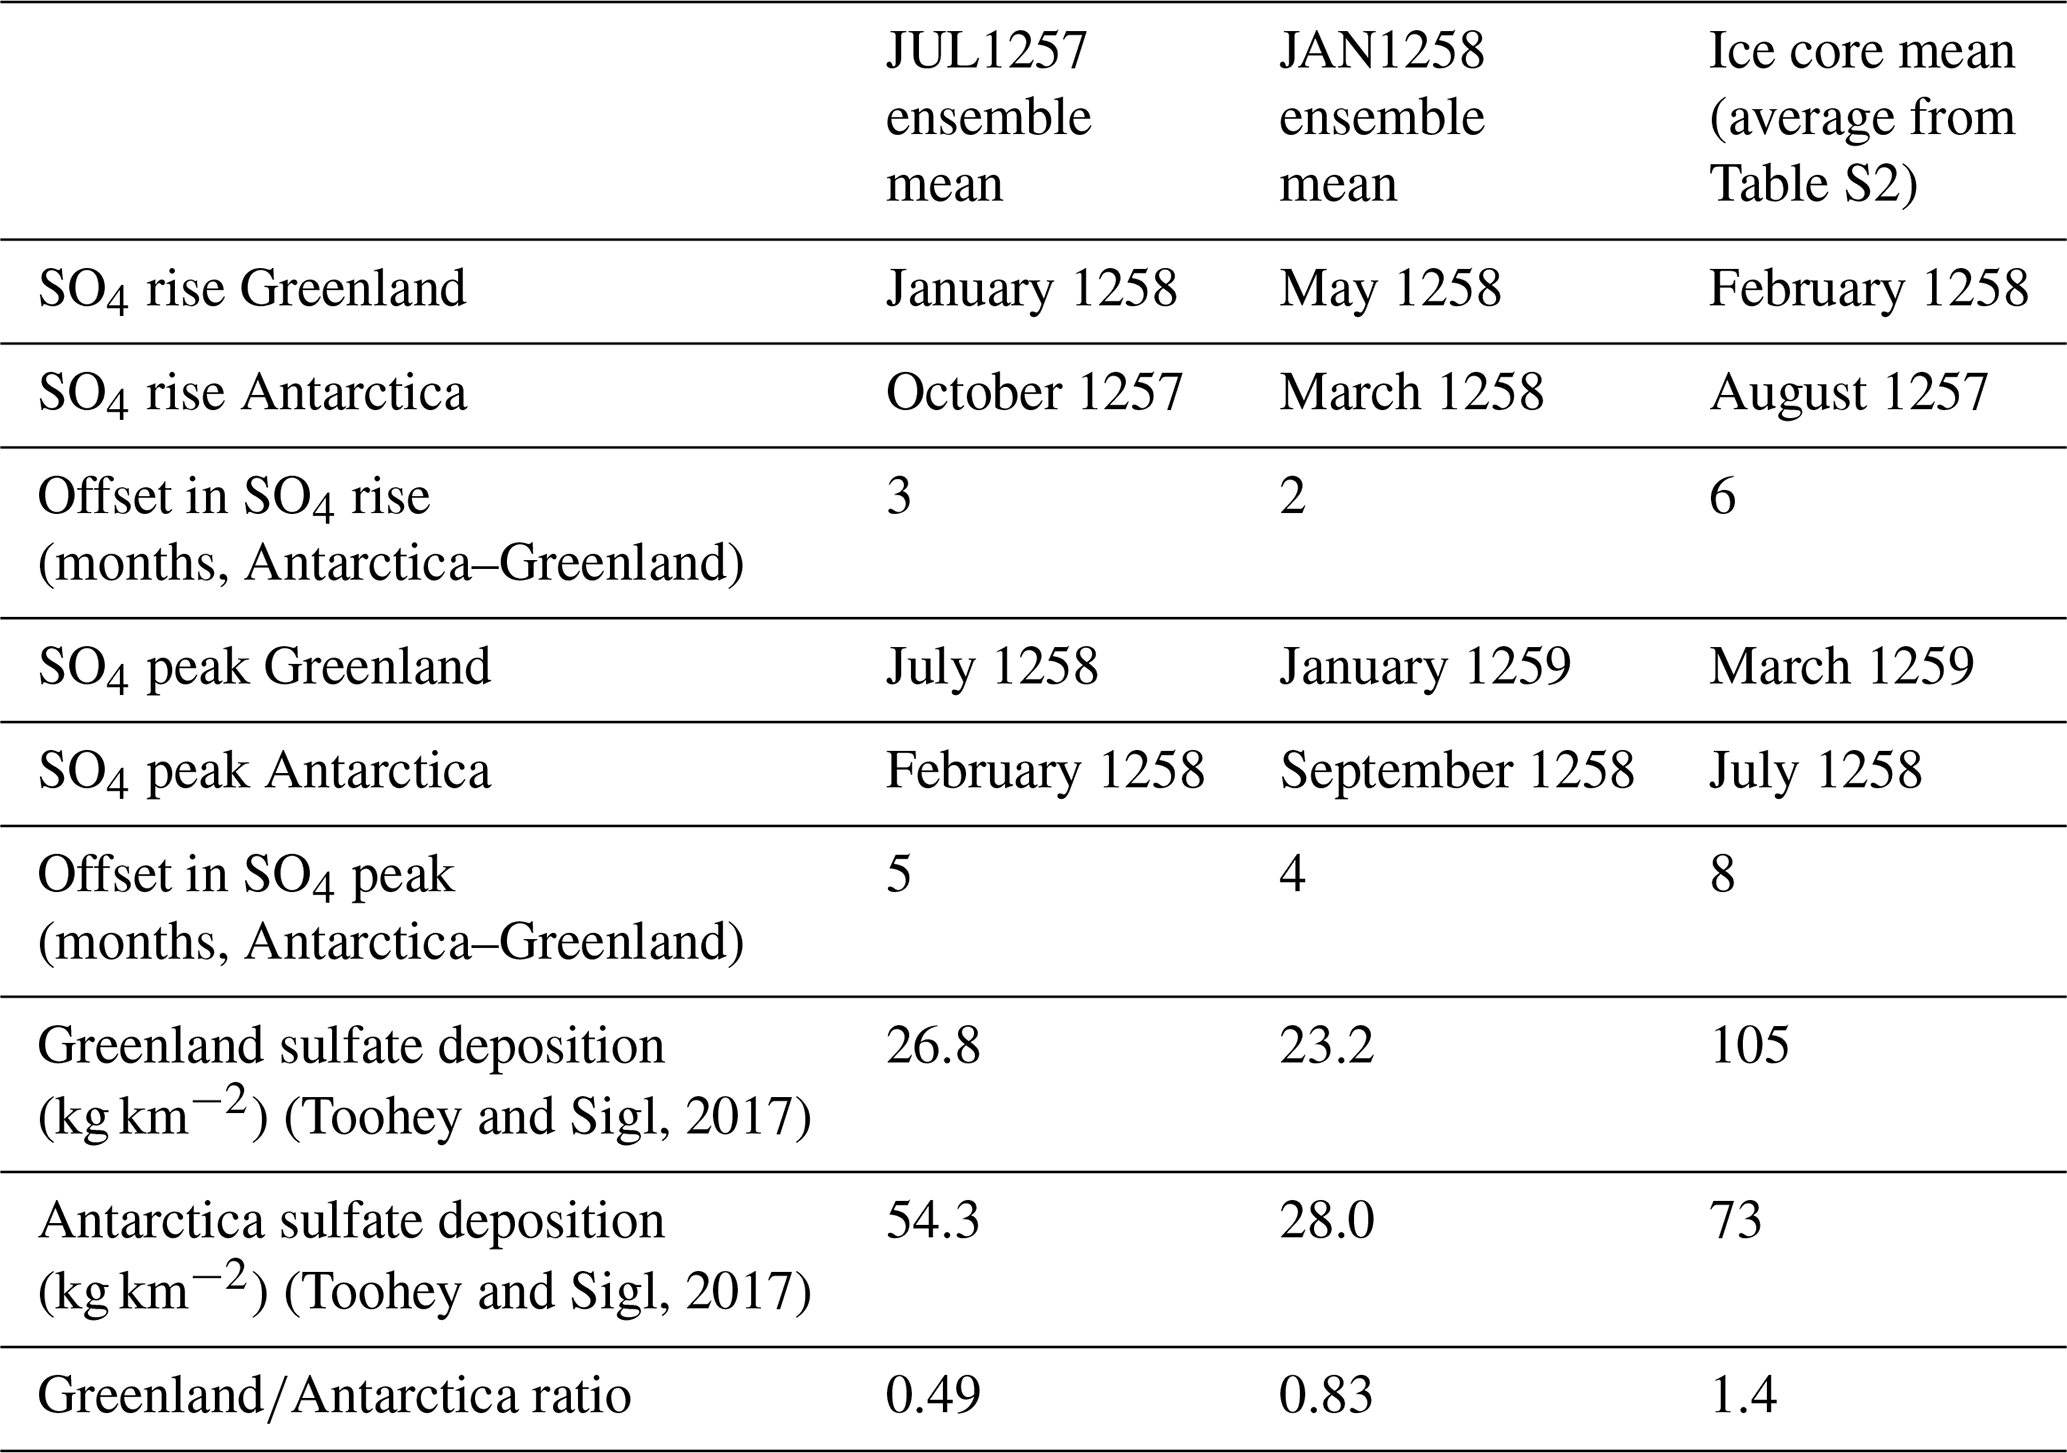
Figure 4b and c show ice-sheet-averaged model-simulated sulfate deposition across the Greenland and Antarctic ice sheets, respectively, for the JUL1257 and JAN1258 eruption scenarios. The mean beginning of sulfate rise and the timing of peak sulfate deposition across four high-resolution ice sheets (see Table S2) are also shown as vertical black lines. Table 2 shows a comparison between the ice core average (from Table S2) and ensemble means for JUL1257 and JAN1258 model simulations for the timing of the SO4 rise, peak, and total deposition in Greenland and Antarctica. The JUL1257 ensemble shows the beginning of sulfate rise in January 1285 in Greenland and October 1257 in Antarctica, with peak deposition occurring in July 1258 and February 1258, respectively, while the JAN1258 ensemble shows the sulfate rise beginning in May and March 1258 in Greenland and Antarctica, respectively, with peak deposition in January 1259 and September 1258. Across four high-resolution ice cores (Table S2) the mean onset of sulfate rise occurs in February 1258 in Greenland and August 1257 in Antarctica, thus showing closest agreement with the timing of simulated sulfate rise for a July 1257 eruption date, where only an eruption in summer 1257 can account for the beginning of sulfate deposition in Antarctica in autumn 1257. Across the four ice core records mean peak deposition in Greenland occurs in March 1259, while mean peak deposition in Antarctica occurs earlier in July 1258. The timing of peak deposition therefore shows better agreement with simulated peak deposition for a January 1258 eruption date, with the peak model-simulated deposition occurring too early in the JUL1257 ensemble relative to ice core records. Ice core records also suggest an asymmetry in sulfate dispersal and deposition, with sulfate rise and peak deposition in Antarctica being 6 and 8 months ahead of Greenland, respectively. The JUL1257 ensemble shows a greater degree of asymmetry compared to the JAN1258 ensemble, although offsets of 3 and 5 months between Antarctica and Greenland are still lower than the offset suggested by the ice core record. While the offset between the beginning of sulfate rise and peak sulfate deposition is approximately a year in both Greenland (13 months) and Antarctica (11 months), the offset for model-simulated deposition in the UKESM is considerably shorter across both JUL1257 and JAN1258 ensembles (ranging from 4–8 months). This may represent a limitation specific to the UKESM, where Marshall et al. (2018) suggested the poleward transport of volcanic aerosol may be too weak (or midlatitude deposition too strong) in the UKESM relative to other models tested. This weaker poleward transport may also contribute to the lower magnitude of total polar deposition simulated by the UKESM relative to ice core records, where Marshall et al. (2018) also found that the UKESM simulates 2 times too little deposited sulfate compared to mean ice-core-derived estimates for the Tambora 1815 eruption. Both model-simulated ensembles show greater total sulfate deposition in Antarctica compared to Greenland, while ice core records suggest the opposite asymmetry favouring greater deposition in Greenland.
Table 2Comparison between ice core average (from Table S2) and ensemble means for JUL1257 and JAN1258 model simulations for the timing of the SO4 rise, peak, and total deposition in Greenland and Antarctica.
4.1 Constraining the eruption year and season of the Mt Samalas eruption
As shown in Fig. 1, both JUL1256 and JAN1257 eruption scenarios result in peak surface cooling occurring a year too early relative to reconstructed SAT anomalies. Thus, an early eruption date such as spring 1256, as proposed by Bauch (2019), is unfeasible for the Mt Samalas eruption. Across the two remaining eruption scenarios, only the JUL1257 eruption ensemble lies consistently within 2σ of the tree-ring-reconstructed mean between 1258–1262. By contrast, the JAN1258 eruption ensemble results in peak cooling being over 1 °C greater than tree ring reconstructions for summer 1258.
When compared with spatially resolved N-TREND reconstructions, model-simulated SAT anomalies for the JAN1258 ensemble mean continue to consistently overpredict the magnitude of cooling for both 1258 and 1259 across the NH. While the spatial agreement of SAT anomalies for the JUL1257 ensemble mean does not precisely replicate those reconstructed from the N-TREND tree ring record, it does show widespread but less extreme negative SAT anomalies across the NH and thus achieves better agreement with reconstructed anomalies on a regional basis. This is supported by comparison between globally resolved model-simulated ensemble mean SAT anomalies and multi-proxy-reconstructed anomalies, where the JAN1258 ensemble mean consistently overpredicts the magnitude of cooling in key regions across Europe, central Asia, and the US, while the JUL1257 ensemble mean results in generally better agreement across these regions with more moderate negative SAT anomalies.
A re-evaluation of evidence for a January 1258 eruption finds that a summer 1257 eruption can also satisfy constraints from both ice core records and historically documented dark lunar eclipses. Model-simulated ice sheet sulfate deposition shows that for eruption scenarios 6 months apart there is a distinguishable offset in the timing and magnitude of deposition, with the bi-polar ratio of simulated sulfate depositions between Northern Hemisphere and Southern Hemisphere ice sheets varying depending on eruption season. The onset of model-simulated sulfate deposition in Greenland and Antarctica for the JUL1257 ensemble mean achieves better agreement with ice core record tie points, where the onset of sulfate deposition in Antarctica in August 1257 can only be aligned with an eruption during or prior to summer 1257. Nonetheless, the timing of peak model-simulated sulfate deposition achieves better agreement with the JAN1258 ensemble mean, potentially reflecting limitations in aerosol transport within the UKESM leading to the simulated aerosol decay being too rapid (Marshall et al., 2018).
Overall, the multi-proxy to model comparison utilised in this study provides a clear distinction between JUL1257 and JAN1258 eruption scenarios, with better agreement between proxy reconstructions and model-simulated anomalies being shown for a July 1257 eruption date. This is consistent with the May–August 1257 date constraint suggested by Guillet et al. (2023), based on their analysis of contemporary reports of total lunar eclipses, combined with tree ring-based climate proxies and aerosol model simulations. Although consensus has converged on a summer 1257 date for the Mt Samalas eruption, it remains to be seen if a more precise constraint (i.e. to a specific month) could be achieved given current model and proxy uncertainties (as discussed in Sect. 4.3). Nonetheless, this 4-month window remains an improvement upon previous dating uncertainty and is still sufficient at present for interrogating both climatic and human consequences following the eruption.
4.2 Regionally heterogenous climate response
Multi-proxy SAT reconstructions highlight the regionally heterogenous climate response following the Mt Samalas eruption. The largest negative SAT anomalies occur across central Asia and northern Russia, with cooling of −2 to −4 °C between 1258 and 1259, making these some of the most severely impacted regions in the NH. The role of sudden and severe cooling associated with the Mt Samalas eruption in the collapse of the Mongol westward advance is therefore plausible (Di Cosmo et al., 2021). Alongside references to extreme and abnormal weather conditions, the Azuma Kagami in Japan also highlights the severity of the Shôga famine between 1257–1260 (Farris, 2006). Model-simulated cooling of up to −1 °C across Japan suggests the severity of this famine could have been amplified by the climate response to the Mt Samalas eruption in 1258–1259. Similar evidence exists in the Middle East, with famine and pestilence reported across Syria, Iraq, and southern Türkiye in 1258 (Stothers, 2000). A model-simulated JUL1257 eruption scenario suggests cooling of up to −2 °C in the region and thus supports a possible association with the Mt Samalas eruption. Reconstructed and model-simulated SAT anomalies suggest less severe cooling across Europe for 1258 (< −1 °C) and relative warming in the region for 1259. Nonetheless, this is still associated with significant economic and social disturbances, with historical records reporting famine and social unrest (Guillet et al., 2017; Stothers, 2000). Van Dijk et al. (2023) find similar regional variability in both the climatic effects and social consequences across Scandinavia following the 536 and 540 double eruption event, finding the severity of impacts depended heavily both on local topography and the subsistence methods employed by different communities.
Büntgen et al. (2022) find negative TRW growth anomalies along the US West Coast for summer 1257 and suggest this is evidence for the onset of climate perturbations in the NH before the end of the 1257 growth season and therefore support a summer 1257 eruption date. Model-simulated anomalies for a JUL1257 eruption, however, show no significant anomalies occurring across the US or NH during summer 1257 (see Fig. S9). The presence of frost rings in 1257 and 1259 (Salzer and Hughes, 2007), but not in 1258, also contradicts model-simulated cooling, which consistently shows the strongest cooling in 1258. Model-simulated SAT anomalies for a JUL1257 eruption only show significant negative SAT anomalies in late summer 1257 across South America, Africa, and Oceania, with cooling in some regions of up to −2 °C; although, without well-dated, geographically distributed climate proxies in the Southern Hemisphere (SH), it will remain difficult to resolve whether this is a potential model/proxy discrepancy in the SH (Neukom et al., 2014). However, if extreme and sudden cooling did occur in the SH then it would be expected to have significant, but as yet unknown, consequences for communities and civilisations in the Southern Hemisphere. Additional large volcanic eruptions in 1269, 1276 (UE5), and 1286 (UE6), which, combined with the eruption in 1257, make the sulfate loading in the 13th century 2 to 10 times larger than any other century in the last 1500 years (Gao et al., 2008; Guillet et al., 2023), may have led to further climate anomalies with effects on impacted civilisations being prolonged throughout the latter half of the 13th century. For example, the first settlement of New Zealand most likely occurred between 1250–1275, with suggestions that this may have reflected a climate-induced migration associated at least in part with the impacts of the Mt Samalas, and subsequent, eruptions (Anderson, 2016; Bunbury et al., 2022). Apart from recent analysis of the localised impacts and recovery following the Mt Samalas eruption (Malawani et al., 2022), the general sparsity of currently available proxy data across the SH precludes definitive conclusions as to climate and social response in the SH following the Mt Samalas eruption.
Notably, neither the JAN1258 nor JUL1257 ensemble mean replicates reconstructed positive SAT anomalies in Alaska for summer 1258 or the wider US west coast for summer 1259. Across individual realisations only five show positive SAT anomalies in this region for 1258–1259, and of these ensembles, three are classified as having warm-phase ENSO initial conditions. N-TREND spatially resolved reconstructions show positive SAT anomalies over Alaska from summer 1257–1259, with warm-phase El Niño-like conditions during this period being supported by positive tree-ring-reconstructed temperature anomalies in Alaska (Guillet et al., 2017) and the muted absolute temperature signal seen in δ18O coral reconstructions from the central tropical Pacific (most likely explained by the superposition of a volcanic cooling signal and a warm El-Niño-like signal; Dee et al., 2020; Robock, 2020). The role of volcanic eruptions in perturbing ENSO remains debated (Mann et al., 2005; Stevenson et al., 2018; Dee et al., 2020; Robock, 2020), although climate simulations and proxy records suggest an increased probability for the occurrence of an El Niño event in the first or second year after a large volcanic eruption (see McGregor et al., 2020, for a full review). El-Niño-like warm conditions may therefore have prevailed at the time of the Mt Samalas eruption, with subsequent volcano–ENSO interactions potentially acting to enhance these pre-existing El-Niño-like conditions.
4.3 Model and proxy limitations
The majority of temperature anomaly constraints applied in this study are provided by SAT tree ring reconstructions, where tree ring data have been shown to effectively record extreme cooling events synchronous with evidence for explosive volcanic eruptions over the last 2 millennia without chronological errors (Stoffel et al., 2015; Büntgen et al., 2020, 2016; Sigl et al., 2015) and are in good agreement with instrumental observations following large eruptions (Esper et al., 2018). Lücke et al. (2019) highlight the importance of accounting for biologically based memory effects, which can lead to dampening of volcanic cooling signals in ring-width-based chronologies. However, many of the tree-ring-based reconstructions utilised in this work do incorporate maximum latewood density (MXD) data, as well as TRW (see Fig. S3) which has been shown to reduce attenuation of volcanic cooling signals (Esper et al., 2014; Stoffel et al., 2015). Additional temperature anomaly constraints are also provided by historical sources, although these records are inherently more limited being non-quantitative and subjective accounts. The application of historical records to the model–multi-proxy framework is limited by the sparsity of historical records, both spatially, being predominantly concentrated in the NH, and temporally, being biased in frequency, dating accuracy, and traceability towards more recent volcanic eruptions, although they have been applied effectively to understand the aftermath and impacts of the Mt Samalas 1257 eruption (Malawani et al., 2022). In this study, ensemble simulations do show hydroclimate perturbations following the Mt Samalas eruption for both JUL1257 and JAN1258 scenarios (Fig. S10), although, due to the limited number of realisations, these are not included in our model–proxy framework. Nonetheless, the magnitude of precipitation anomalies for summer 1258 is greatest in the equatorial regions, potentially indicative of a shift in the ITCZ due to asymmetric cooling between hemispheres. Therefore, future studies may also consider including hydroclimate proxies alongside SAT reconstructions in order to add an additional constraint on model–proxy agreement.
Model-simulated anomalies are strongly dependent on model setup, including model resolution, modelled stratospheric winds, aerosol microphysics, and sedimentation and deposition schemes (Marshall et al., 2018; Quaglia et al., 2023). In recent model intercomparison studies (Marshall et al., 2018; Quaglia et al., 2023), the UKESM showed a bias towards stronger transport to the NH extratropics, resulting in a hemispherically asymmetric aerosol load. The spatial distribution of volcanic forcing can influence the subsequent growth of sulfate aerosols and their global distribution, in turn affecting the persistence of aerosols in the stratosphere (Quaglia et al., 2023). Compared to other global aerosol models, the UKESM also has relatively weaker poleward transport, with stronger meridional deposition which may lead to a more equatorially focussed aerosol distribution and deposition (Marshall et al., 2018). The UKESM does not have prescribed OH, which may prevent the timescale for sulfate formation from being properly simulated and thus result in a bias towards low aerosol effective radius in the UKESM compared to observations (Clyne et al., 2021; Dhomse et al., 2014). Disentangling large inter-model differences from the range of model components that contribute to this uncertainty remains challenging, although future multi-model–multi-proxy studies may be of use.
Even within a single model, uncertainties persist in initial eruption conditions (e.g. phase of atmospheric modes and aerosol size distribution) and volcanic forcing parameters (e.g. timing, magnitude, injection height, and latitude of eruption). Timmerick et al. (2021) demonstrated that both the magnitude of forcing and its spatial structure can similarly affect reconstruction–simulation comparisons, particularly in the NH extratropics. This is supported by Lücke et al. (2023), who demonstrate a significant spread in the temperature response due to volcanic forcing uncertainties which can strongly affect agreement with proxy reconstructions. The VSSI estimate used in this study was taken from the eVolv2k reconstruction (Toohey and Sigl, 2017) and is within the error of other SO2 emission estimates for the Mt Samalas eruption (Vidal et al., 2016; Lavigne et al., 2013). While maximum plume heights have been estimated for the Mt Samalas eruption (∼ 43 km Vidal et al., 2015), the injection height remains unknown. In our simulations, the injection height is set to 18–20 km, which may be too low but does allow upward lofting of aerosol. Moreover, Stoffel et al. (2015) found that increasing plume height from 22–26 to 33–36 km for simulations of the Mt Samalas 1257 eruption increased the magnitude of the peak post-eruption NH JJA temperature anomaly to −4 °C for a January eruption and −1 and −2 °C for May and July eruption scenarios, respectively. A higher plume height than the 20 km used in our study would therefore likely further enforce our central conclusion that a better agreement between proxy and model temperature anomalies is achieved for a summer 1257 eruption date, while a greater plume height for a January 1258 eruption would only further overpredict the magnitude of post-eruption cooling. Timmreck et al. (2009) also highlight the strong dependence of model-simulated post-eruption climate responses following large volcanic eruptions on the aerosol particle size distribution due to the self-limiting effects of larger particles (Pinto et al., 1989). These particle characteristics are difficult to constrain retrospectively for historic eruptions such as Mt Samalas and thus represent a significant uncertainty with modelling historic eruptions.
Model-simulated ice sheet sulfate deposition (Fig. 4) shows a clear distinction between the JAN1258 and JUL1257 eruption scenarios in both the timing and hemispheric distribution of deposition. For the same stratospheric SO2 injection, an eruption during NH summer results in more pronounced asymmetric polar deposition, with the magnitude of peak deposition in Antarctica being nearly a factor of 3 greater than for an eruption during the SH summer, likely due to the stronger branch of the Brewer–Dobson circulation and seasonal effects on aerosol transport and depositional processes. Nonetheless, modelling of the Tambora 1815 eruption by Marshall et al. (2018) found a strong model dependency for the timing, magnitude, and spatial distribution of sulfate deposition. Polar sulfate deposition in the UKESM was 2× less than in ice cores for the Tambora 1815 eruption and considerably lower than deposition in the other MAECHAM5-HAM and SOCOL-AER models tested (see Table S3). In our JUL1257 and JAN1258 simulations for the Mt Samalas 1257 eruption, the total mean deposition in Antarctica (55–28 kg km−2) and Greenland (26–23 kg km−2) was also lower than the total deposition from ice core records (73 and 105 kg km−2, respectively; see Table 2). The overall lower polar total sulfate deposition may reflect weaker poleward transport (or stronger meridional deposition) in the UKESM (Marshall et al., 2018). For our JUL1257 and JAN1258 model, simulated sulfate deposition both eruption scenarios result in ratios < 1, with a summer 1257 eruption showing a much more asymmetric distribution (0.49) than a January 1258 eruption (0.83). These ratios, however, disagree with the ratio derived from ice cores (1.4; Toohey and Sigl, 2017), suggesting that aerosol transport in the UKESM may not sufficiently transport to the NH and favours distribution to the SH. Of the four models tested by Marshall et al. (2018) for the Tambora 1815 eruption, the UKESM was one of two models which had greater deposition in Greenland compared to Antarctica (Table S3; = 1.7). Both Tambora 1815 and Mt Samalas 1257 were large-magnitude eruptions at a similar latitude; therefore, this intra-model difference in the asymmetric distribution of sulfate aerosol likely reflects the variation in the initial internal conditions within the model (such as QBO or other atmospheric-mode phases). Moreover, this further highlights the complications of disentangling inter-model differences and the intra-model parameter-specific variation. Given both these inter- and intra-model differences in hemispheric aerosol distribution and deposition, the current robustness of this parameter in distinguishing between eruption scenarios when compared to ice core records is limited, with further work being needed to understand model- and starting-condition-specific effects.
While comparisons of simulated and reconstructed climate responses following large volcanic eruptions have been used effectively by a multitude of studies (van Dijk et al., 2023; Büntgen et al., 2022; Stoffel et al., 2015), several risks remain surrounding this approach. Given the uncertainties associated with both proxy reconstructions and model simulations, neither can be taken as the inherently “correct” baseline with which to fit the other, and thus particular care should be taken when using model–proxy comparison to validate the correctness of underlying records or model input parameters. For example, the missing tree ring hypothesis (Mann et al., 2012), which has since been widely rejected, proposed that the mismatch between climate simulations and proxy reconstructions resulted from chronological errors due to missing growth rings. This has, however, since been resolved with improved estimates of volcanic forcing (Toohey and Sigl, 2017) and the greater inclusion of MXD records in tree ring reconstructions (Stoffel et al., 2015; Schneider et al., 2015; Wilson et al., 2016; Anchukaitis et al., 2017). When utilising an array of different proxy data, there is the risk of confirmation bias, meaning records which show significant agreement with model simulations being given greater weighting than those which show less agreement. A more quantifiable approach to the model–proxy comparison, where a greater number of model realisations would allow for more robust statistical evaluation, would therefore be a considerable improvement for the application of the model–multi-proxy framework.
We have utilised 18 aerosol–climate UKESM1 ensemble simulations for the 1257 Mt Samalas eruption in combination with the most complete globally resolved multi-proxy database to date for the Mt Samalas eruption. This allowed more precise constraints on the year and season, as well as the regionally heterogeneous climate response following the Mt Samalas eruption. Comparison with NH-averaged and spatially resolved tree ring reconstructions showed that a summer 1257 eruption scenario agrees best with reconstructed SAT anomalies, with a January 1258 eruption consistently overpredicting the magnitude of cooling relative to reconstructions. The regionally variable SAT response following the eruption is revealed by multi-proxy reconstructions, which lend support to inferred social, economic, and historical consequences across Europe and Asia following the eruption. Model-simulated SAT anomalies also suggest the onset of sudden a severe cooling across the SH, with the potential for significant social and economic consequences in impacted communities across South America, Africa, and Oceania. The spatial distribution of SAT anomalies shows sensitivity to initial atmospheric–ocean conditions, with positive SAT anomalies in Alaska being potentially indicative of warm El-Niño-like conditions at the time of the eruption, with potential ENSO–volcano interactions enhancing these conditions further.
Overall, the proxy to model comparison employed in this study has been shown as an effective approach to constrain uncertain eruption source parameters. Model–multi-proxy frameworks have similarly been employed by other recent studies (see Guillet et al., 2023, and van Dijk et al., 2023) which have also demonstrated its potential in constraining unknown initial conditions, as well as regional climatic impacts for historic eruptions where there is sufficient concurrent proxy evidence. A greater global distribution of proxy evidence, especially in the Southern Hemisphere where all types of proxy evidence are sparse, will strengthen this proxy–model framework approach for future analysis. The incorporation of hydroclimate anomalies in particular has the potential to add further independent constraints, although this relies on the development of higher-resolution records, especially at low-latitude sites. Model simulations of polar sulfate deposition also reveal distinct differences in the timing of ice sheet deposition between the two simulated eruption dates, although a comparison of the magnitude or asymmetric deposition of sulfate aerosol remains limited by large inter-model differences and complex intra-model dependencies.
Finally, both proxy-reconstructed and model-simulated temperature anomalies highlight the severity of the global climate response following a large tropical explosive eruption, with historical records confirming widespread and severe economic and social consequences. This adds further weight to recent calls (Cassidy and Mani, 2022) for increased global preparedness for the next large-magnitude explosive volcanic eruption, given profound global consequences that would be expected, as clearly demonstrated by the Mt Samalas eruption.
Data have been uploaded to the CEDA archive and are pending review. The catalogue record can be found at https://catalogue.ceda.ac.uk/uuid/e0221b37aa174dd290c5e105263b59d1 (Wainman et al., 2024).
The supplement related to this article is available online at: https://doi.org/10.5194/cp-20-951-2024-supplement.
LW, LRM, and AS jointly conceived the project methodology. LRM ran the UKESM model simulations. LW performed the analysis, visualisation, and writing of the paper, with supervision from LRM and AS. All authors jointly reviewed and edited the paper.
The contact author has declared that none of the authors has any competing interests.
Publisher’s note: Copernicus Publications remains neutral with regard to jurisdictional claims made in the text, published maps, institutional affiliations, or any other geographical representation in this paper. While Copernicus Publications makes every effort to include appropriate place names, the final responsibility lies with the authors.
This research formed part of Laura Wainman's Master of Science thesis at the University of Cambridge. Laura Wainman would like to thank Oliver Shorttle and Elizabeth Harper for their additional supervision and encouragement throughout this project, as well as Newnham College for supporting the presentation of this work through a travel bursary. The authors would also like to thank Michael Sigl and Kevin Anchukaitis, for providing the ice core and tree ring datasets utilised in this project, and Nathan Luke Abraham, for technical modelling support. This work used the ARCHER UK National Supercomputing Service (http://www.archer.ac.uk, last access: 1 November 2023) and JASMIN, the UK collaborative data analysis facility. The authors would also like to thank Monica Green for her correspondence and insightful perspectives on the historical context for the eruption, as well as the two anonymous reviewers for their constructive feedback and suggestions.
This research has been supported by NERC (grant no. NE/S000887/1 (VOL-CLIM) and grant no. NE/S00436X/1 (V-PLUS)).
This paper was edited by Eric Wolff and reviewed by two anonymous referees.
Anchukaitis, K. J., Wilson, R., Briffa, K. R., Büntgen, U., Cook, E. R., D'Arrigo, R., Davi, N., Esper, J., Frank, D., Gunnarson, B. E., Hegerl, G., Helama, S., Klesse, S., Krusic, P. J., Linderholm, H. W., Myglan, V., Osborn, T. J., Zhang, P., Rydval, M., and Schneider, L.: Last millennium Northern Hemisphere summer temperatures from tree rings: Part II, spatially resolved reconstructions, Quaternary Sci. Rev., 163, 1–22, https://doi.org/10.1016/j.quascirev.2017.02.020, 2017.
Anderson, A.: The first migration: Māori origins 3000BC–AD1450, Wellington, New Zealand: Bridget Williams Books, https://doi.org/10.7810/9780947492793, 2016.
Archibald, A. T., O'Connor, F. M., Abraham, N. L., Archer-Nicholls, S., Chipperfield, M. P., Dalvi, M., Folberth, G. A., Dennison, F., Dhomse, S. S., Griffiths, P. T., Hardacre, C., Hewitt, A. J., Hill, R. S., Johnson, C. E., Keeble, J., Köhler, M. O., Morgenstern, O., Mulcahy, J. P., Ordóñez, C., Pope, R. J., Rumbold, S. T., Russo, M. R., Savage, N. H., Sellar, A., Stringer, M., Turnock, S. T., Wild, O., and Zeng, G.: Description and evaluation of the UKCA stratosphere–troposphere chemistry scheme (StratTrop vn 1.0) implemented in UKESM1, Geosci. Model Dev., 13, 1223–1266, https://doi.org/10.5194/gmd-13-1223-2020, 2020.
Bauch, M.: Chronology and impact of a global moment in the 13th century, in: The Dance of Death in Late Medieval and Renaissance Europe, Routledge, ISBN 9781032083391, 2019.
Bierstedt, A.: Weather and Ideology in Íslendinga saga A Case Study of the Volcanic Climate Forcing of the 1257 Samalas eruption, MA thesis, University of Iceland, https://www.academia.edu/45128500/Weather_and_Ideology_in_%C3%8Dslendinga_saga_A_Case_Study_of_the_Volcanic_Climate_Forcing_of_the_1257_Samalas_eruption (last access: 10 November 2023), 2019.
Borisenkov, Y. P. and Paseckij, V. M.: Extreme natural phenomena in the Russian chronicles of the 11–17 centuries, Gidrometeoizdat, 240 pp., 1983.
Briffa, K. R., Melvin, T. M., Osborn, T. J., Hantemirov, R. M., Kirdyanov, A., Mazepa, V. S., Shiyatov, S. G., and Esper, J.: NOAA/WDS Paleoclimatology – Yamalia, NW Siberia 2000 Year Tree Ring Summer Temperature Reconstructions [Jun–Jul, anomalized], NOAA National Centers for Environmental Information [data set], https://doi.org/10.25921/q8ph-4s07, 2013.
Broccoli, A. J., Dahl, K. A., and Stouffer, R. J.: Response of the ITCZ to Northern Hemisphere cooling, Geophys. Res. Lett., 33, L01702, https://doi.org/10.1029/2005gl024546, 2006.
Bunbury, M. M. E., Petchey, F., and Bickler, S. H.: A new chronology for the Māori settlement of Aotearoa (NZ) and the potential role of climate change in demographic developments, P. Natl. Acad. Sci., 119, e2207609119, https://doi.org/10.1073/pnas.2207609119, 2022.
Büntgen, U., Tegel, W., Nicolussi, K., McCormick, M., Frank, D., Trouet, V., Kaplan, J. O., Herzig, F., Heussner, K.-U., Wanner, H., Luterbacher, J., and Esper, J.: 2500 Years of European Climate Variability and Human Susceptibility, Science, 331, 578–582, https://doi.org/10.1126/science.1197175, 2011.
Büntgen, U., Myglan, V. S., Ljungqvist, F. C., McCormick, M., Di Cosmo, N., Sigl, M., Jungclaus, J., Wagner, S., Krusic, P. J., Esper, J., Kaplan, J. O., de Vaan, M. A. C., Luterbacher, J., Wacker, L., Tegel, W., and Kirdyanov, A. V.: Cooling and societal change during the Late Antique Little Ice Age from 536 to around 660 AD, Nat. Geosci., 9, 231–236, 2016.
Büntgen, U., Arseneault, D., Boucher, É., Churakova, O. V., Gennaretti, F., Crivellaro, A., Hughes, M. K., Kirdyanov, A. V., Klippel, L., Krusic, P. J., Linderholm, H. W., Ljungqvist, F. C., Ludescher, J., McCormick, M., Myglan, V. S., Nicolussi, K., Piermattei, A., Oppenheimer, C., Reinig, F., Sigl, M., Vaganov, E. A., and Esper, J.: Prominent role of volcanism in Common Era climate variability and human history, Dendrochronologia, 64, 125757, https://doi.org/10.1016/j.dendro.2020.125757, 2020.
Büntgen, U., Allen, K., Anchukaitis, K. J., Arseneault, D., Boucher, É., Bräuning, A., Chatterjee, S., Cherubini, P., Churakova (Sidorova), O. V., Corona, C., Gennaretti, F., Grießinger, J., Guillet, S., Guiot, J., Gunnarson, B., Helama, S., Hochreuther, P., Hughes, M. K., Huybers, P., and Kirdyanov, A. V.: The influence of decision-making in tree ring-based climate reconstructions, Nat. Commun., 12, 3411, https://doi.org/10.1038/s41467-021-23627-6, 2021.
Büntgen, U., Smith, S. H., Wagner, S., Krusic, P., Esper, J., Piermattei, A., Crivellaro, A., Reinig, F., Tegel, W., Kirdyanov, A., Trnka, M., and Oppenheimer, C.: Global tree-ring response and inferred climate variation following the mid-thirteenth century Samalas eruption, Clim. Dynam., 59, 531–546, https://doi.org/10.1007/s00382-022-06141-3, 2022.
Campbell, B. M. S.: Global climates, the 1257 mega-eruption of Samalas volcano, Indonesia, and the English food crisis of 1258, T. Roy. Hist. Soc., 27, 87–121, https://doi.org/10.1017/s0080440117000056, 2017.
Cassidy, M. and Mani, L.: Huge volcanic eruptions: time to prepare, Nature, 608, 469–471, https://doi.org/10.1038/d41586-022-02177-x, 2022.
Churakova (Sidorova), O. V., Fonti, M. V., Saurer, M., Guillet, S., Corona, C., Fonti, P., Myglan, V. S., Kirdyanov, A. V., Naumova, O. V., Ovchinnikov, D. V., Shashkin, A. V., Panyushkina, I. P., Büntgen, U., Hughes, M. K., Vaganov, E. A., Siegwolf, R. T. W., and Stoffel, M.: Siberian tree-ring and stable isotope proxies as indicators of temperature and moisture changes after major stratospheric volcanic eruptions, Clim. Past, 15, 685–700, https://doi.org/10.5194/cp-15-685-2019, 2019.
Clyne, M., Lamarque, J.-F., Mills, M. J., Khodri, M., Ball, W., Bekki, S., Dhomse, S. S., Lebas, N., Mann, G., Marshall, L., Niemeier, U., Poulain, V., Robock, A., Rozanov, E., Schmidt, A., Stenke, A., Sukhodolov, T., Timmreck, C., Toohey, M., Tummon, F., Zanchettin, D., Zhu, Y., and Toon, O. B.: Model physics and chemistry causing intermodel disagreement within the VolMIP-Tambora Interactive Stratospheric Aerosol ensemble, Atmos. Chem. Phys., 21, 3317–3343, https://doi.org/10.5194/acp-21-3317-2021, 2021.
D’Arrigo, R., Frank, D., Jacoby, G., and Pederson, N.: Spatial Response to Major Volcanic Events in or about AD 536, 934 and 1258: Frost Rings and Other Dendrochronological Evidence from Mongolia and Northern Siberia: Comment on R. B. Stothers, “Volcanic Dry Fogs, Climate Cooling, and Plague Pandemics in Europe and the Middle East” (Climatic Change, 42, 1999), Climatic Change, 49, 239–246, https://doi.org/10.1023/a:1010727122905, 2001.
Davi, N. K., D'Arrigo, R., Jacoby, G. C., Cook, E. R., Anchukaitis, K. J., Nachin, B., Rao, M. P., and Leland, C.: A long-term context (931–2005 C.E.) for rapid warming over Central Asia. Quaternary Sci. Rev., 121, 89–97, https://doi.org/10.1016/j.quascirev.2015.05.020, 2015.
Davi, N. K., Rao, M. P., Wilson, R., Andreu-Hayles, L., Oelkers, R., D'Arrigo, R., Nachin, B., Buckley, B., Pederson, N., Leland, C., and Suran, B.: Accelerated Recent Warming and Temperature Variability Over the Past Eight Centuries in the Central Asian Altai From Blue Intensity in Tree Rings, Geophys. Res. Lett., 48, e2021GL092933, https://doi.org/10.1029/2021gl092933, 2021.
Dee, S. G., Cobb, K. M., Emile-Geay, J., Ault, T. R., Edwards, R. L., Cheng, H., and Charles, C. D.: No consistent ENSO response to volcanic forcing over the last millennium, Science, 367, 1477–1481, https://doi.org/10.1126/science.aax2000, 2020.
Dhomse, S. S., Emmerson, K. M., Mann, G. W., Bellouin, N., Carslaw, K. S., Chipperfield, M. P., Hommel, R., Abraham, N. L., Telford, P., Braesicke, P., Dalvi, M., Johnson, C. E., O'Connor, F., Morgenstern, O., Pyle, J. A., Deshler, T., Zawodny, J. M., and Thomason, L. W.: Aerosol microphysics simulations of the Mt. Pinatubo eruption with the UM-UKCA composition-climate model, Atmos. Chem. Phys., 14, 11221–11246, https://doi.org/10.5194/acp-14-11221-2014, 2014.
Di Cosmo, N., Wagner, S., and Büntgen, U.: Climate and environmental context of the Mongol invasion of Syria and defeat at 'Ayn Jālūt (1258–1260 CE), Erdkunde, 75, 87–104, https://doi.org/10.3112/erdkunde.2021.02.02, 2021.
Esper, J., Düthorn, E., Krusic, P. J., Timonen, M., and Büntgen, U.: Northern European summer temperature variations over the Common Era from integrated tree-ring density records, J. Quaternary Sci., 29, 487–494, https://doi.org/10.1002/jqs.2726, 2014.
Esper, J., George, S. St., Anchukaitis, K., D'Arrigo, R., Ljungqvist, F. C., Luterbacher, J., Schneider, L., Stoffel, M., Wilson, R., and Büntgen, U.: Large-scale, millennial-length temperature reconstructions from tree-rings, Dendrochronologia, 50, 81–90, https://doi.org/10.1016/j.dendro.2018.06.001, 2018.
Fancy, N. and Green, M.: Plague and the Fall of Baghdad (1258), Med. Hist., 65, 157–177, https://doi.org/10.1017/mdh.2021.3, 2021.
Farris, W.: Japan's medieval population: famine, fertility, and warfare in a transformative age, Honolulu: University Of Hawai'i Press, ISBN 9780824834241, 2006.
Fell, H. G., Baldini, J. U. L., Dodds, B., and Sharples, G. J.: Volcanism and global plague pandemics: Towards an interdisciplinary synthesis, J. Hist. Geogr., 70, 36–46, https://doi.org/10.1016/j.jhg.2020.10.001, 2020.
Fischer, H., Werner, M., Wagenbach, D., Schwager, M., Thorsteinnson, T., Wilhelms, F., Kipfstuhl, J., and Sommer, S.: Little Ice Age clearly recorded in northern Greenland ice cores, Geophys. Res. Lett., 25, 1749–1752, https://doi.org/10.1029/98gl01177, 1998.
Gao, C., Robock, A., and Ammann, C.: Volcanic forcing of climate over the past 1500 years: An improved ice core-based index for climate models, J. Geophys. Res., 113, D23111, https://doi.org/10.1029/2008jd010239, 2008.
Gennaretti, F., Arseneault, D., Nicault, A., Perreault, L., and Begin, Y.: Volcano-induced regime shifts in millennial tree-ring chronologies from northeastern North America, P. Natl. Acad. Sci., 111, 10077–10082, https://doi.org/10.1073/pnas.1324220111, 2014.
Green, M. H.: The Four Black Deaths, Am. Hist. Rev., 125, 1601–1631, https://doi.org/10.1093/ahr/rhaa511, 2020.
Guillet, S., Corona, C., Stoffel, M., Khodri, M., Lavigne, F., Ortega, P., Eckert, N., Sielenou, P. D., Daux, V., Churakova (Sidorova), Olga V., Davi, N., Edouard, J.-L., Zhang, Y., Luckman, Brian H., Myglan, V. S., Guiot, J., Beniston, M., Masson-Delmotte, V., and Oppenheimer, C.: Climate response to the Samalas volcanic eruption in 1257 revealed by proxy records, Nat. Geosci., 10, 123–128, https://doi.org/10.1038/ngeo2875, 2017.
Guillet, S., Corona, C., Oppenheimer, C., Lavigne, F., Khodri, M., Ludlow, F., Sigl, M., Toohey, M., Atkins, P. S., Yang, Z., Muranaka, T., Horikawa, N., and Stoffel, M.: Lunar eclipses illuminate timing and climate impact of medieval volcanism, Nature, 616, 90–95, 2023.
Hammer, C. U., Clausen, H. B., and Dansgaard, W.: Greenland ice sheet evidence of post-glacial volcanism and its climatic impact, Nature, 288, 230–235, https://doi.org/10.1038/288230a0, 1980.
Hantemirov, R. M., Gorlanova, L. A., and Shiyatov, S. G.: Extreme temperature events in summer in northwest Siberia since AD 742 inferred from tree rings, Palaeogeogr. Palaeocl., 209, 155–164, https://doi.org/10.1016/j.palaeo.2003.12.023, 2004.
Kern, Z., Pow, S., Pinke, Z., and Ferenczi, L.: Samalas and the Fall of the Mongol Empire: A volcanic eruption’s influence on the dissolution of history’s largest contiguous empire, EGU General Assembly 2021, online, 19–30 April 2021, EGU21-3460, https://doi.org/10.5194/egusphere-egu21-3460, 2021.
Lavigne, F., Degeai, J.-P., Komorowski, J.-C., Guillet, S., Robert, V., Lahitte, P., Oppenheimer, C., Stoffel, M., Vidal, C. M., Surono, Pratomo, I., Wassmer, P., Hajdas, I., Hadmoko, D. S., and de Belizal, E.: Source of the great A.D. 1257 mystery eruption unveiled, Samalas volcano, Rinjani Volcanic Complex, Indonesia, P. Natl. Acad. Sci., 110, 16742–16747, https://doi.org/10.1073/pnas.1307520110, 2013.
Lücke, L. J., Schurer, A. P., Toohey, M., Marshall, L. R., and Hegerl, G. C.: The effect of uncertainties in natural forcing records on simulated temperature during the last millennium, Clim. Past, 19, 959–978, https://doi.org/10.5194/cp-19-959-2023, 2023.
Lücke, L. J., Hegerl, G. C., Schurer, A. P., and Wilson, R.: Effects of Memory Biases on Variability of Temperature Reconstructions, J. Climate, 32, 8713–8731, https://doi.org/10.1175/jcli-d-19-0184.1, 2019.
Luckman, B. H. and Wilson, R. J. S.: Summer temperatures in the Canadian Rockies during the last millennium: a revised record, Clim. Dynam., 24, 131–144, https://doi.org/10.1007/s00382-004-0511-0, 2005.
Malawani, M. N., Lavigne, F., Sastrawan, W. J., Jamaluddin, Sirulhaq, A., and Hadmoko, D. S.: The 1257 CE cataclysmic eruption of Samalas volcano (Indonesia) revealed by indigenous written sources: Forgotten kingdoms, emergency response, and societal recovery, J. Volcanol. Geoth. Res., 432, 107688, https://doi.org/10.1016/j.jvolgeores.2022.107688, 2022.
Mann, M. E., Cane, M. A., Zebiak, S. E., and Clement, A.: Volcanic and Solar Forcing of the Tropical Pacific over the Past 1000 Years, J. Climate, 18, 447–456, https://doi.org/10.1175/jcli-3276.1, 2005.
Mann, M. E., Fuentes, J. D., and Rutherford, S.: Underestimation of volcanic cooling in tree-ring-based reconstructions of hemispheric temperatures, Nat. Geosci., 5, 202–205, https://doi.org/10.1038/ngeo1394, 2012.
Marshall, L., Schmidt, A., Toohey, M., Carslaw, K. S., Mann, G. W., Sigl, M., Khodri, M., Timmreck, C., Zanchettin, D., Ball, W. T., Bekki, S., Brooke, J. S. A., Dhomse, S., Johnson, C., Lamarque, J.-F., LeGrande, A. N., Mills, M. J., Niemeier, U., Pope, J. O., Poulain, V., Robock, A., Rozanov, E., Stenke, A., Sukhodolov, T., Tilmes, S., Tsigaridis, K., and Tummon, F.: Multi-model comparison of the volcanic sulfate deposition from the 1815 eruption of Mt. Tambora, Atmos. Chem. Phys., 18, 2307–2328, https://doi.org/10.5194/acp-18-2307-2018, 2018.
Martin, J. T., Pederson, G. T., Woodhouse, C. A., Cook, E. R., McCabe, G. J., Anchukaitis, K. J., Wise, E. K., Erger, P. J., Dolan, L., McGuire, M., Gangopadhyay, S., Chase, K. J., Littell, J. S., Gray, S. T., George, S. S., Friedman, J. M., Sauchyn, D. J., St-Jacques, J.-M., and King, J.: Increased drought severity tracks warming in the United States' largest river basin, P. Natl. Acad. Sci., 117, 11328–11336. https://doi.org/10.1073/pnas.1916208117, 2020.
McGregor, S., Khodri, M., Maher, N., Ohba, M., Pausata, F. S. R., and Stevenson, S.: The Effect of Strong Volcanic Eruptions on ENSO, Geophysical Monograph Series, 267–287, https://doi.org/10.1002/9781119548164.ch12, 2020.
Moore, J. J., Hughen, K. A., Miller, G. H., and Overpeck, J. T.: Little Ice Age recorded in summer temperature reconstruction from vared sediments of Donard Lake, Baffin Island, Canada, J. Paleolimnol., 25, 503–517, https://doi.org/10.1023/a:1011181301514, 2001.
Mulcahy, J. P., Johnson, C., Jones, C. G., Povey, A. C., Scott, C. E., Sellar, A., Turnock, S. T., Woodhouse, M. T., Abraham, N. L., Andrews, M. B., Bellouin, N., Browse, J., Carslaw, K. S., Dalvi, M., Folberth, G. A., Glover, M., Grosvenor, D. P., Hardacre, C., Hill, R., Johnson, B., Jones, A., Kipling, Z., Mann, G., Mollard, J., O'Connor, F. M., Palmiéri, J., Reddington, C., Rumbold, S. T., Richardson, M., Schutgens, N. A. J., Stier, P., Stringer, M., Tang, Y., Walton, J., Woodward, S., and Yool, A.: Description and evaluation of aerosol in UKESM1 and HadGEM3-GC3.1 CMIP6 historical simulations, Geosci. Model Dev., 13, 6383–6423, https://doi.org/10.5194/gmd-13-6383-2020, 2020.
Neukom, R., Gergis, J., Karoly, D. J., Wanner, H., Curran, M., Elbert, J., González-Rouco, F., Linsley, B. K., Moy, A. D., Mundo, I., Raible, C. C., Steig, E. J., van Ommen, T., Vance, T., Villalba, R., Zinke, J., and Frank, D.: Inter-hemispheric temperature variability over the past millennium, Nat. Clim. Change, 4, 362–367, https://doi.org/10.1038/nclimate2174, 2014.
Oppenheimer, C.: Ice core and palaeoclimatic evidence for the timing and nature of the great mid-13th century volcanic eruption, Int. J. Climatol., 23, 417–426, https://doi.org/10.1002/joc.891, 2003.
Palais, J. M., Germani, M. S., and Zielinski, G. A.: Inter-hemispheric Transport of Volcanic Ash from a 1259 A.D. Volcanic Eruption to the Greenland and Antarctic Ice Sheets, Geophys. Res. Lett., 19, 801–804, https://doi.org/10.1029/92gl00240, 1992.
Pinto, J. P., Turco, R. P., and Toon, O. B.: Self-limiting physical and chemical effects in volcanic eruption clouds, J. Geophys. Res., 94, 11165, https://doi.org/10.1029/jd094id08p11165, 1989.
Plummer, C. T., Curran, M. A. J., van Ommen, T. D., Rasmussen, S. O., Moy, A. D., Vance, T. R., Clausen, H. B., Vinther, B. M., and Mayewski, P. A.: An independently dated 2000-yr volcanic record from Law Dome, East Antarctica, including a new perspective on the dating of the 1450s CE eruption of Kuwae, Vanuatu, Clim. Past, 8, 1929–1940, https://doi.org/10.5194/cp-8-1929-2012, 2012.
Quaglia, I., Timmreck, C., Niemeier, U., Visioni, D., Pitari, G., Brodowsky, C., Brühl, C., Dhomse, S. S., Franke, H., Laakso, A., Mann, G. W., Rozanov, E., and Sukhodolov, T.: Interactive stratospheric aerosol models' response to different amounts and altitudes of SO2 injection during the 1991 Pinatubo eruption, Atmos. Chem. Phys., 23, 921–948, https://doi.org/10.5194/acp-23-921-2023, 2023.
Robock, A.: Comment on `No consistent ENSO response to volcanic forcing over the last millennium', Science, 369, , https://doi.org/10.1126/science.abc0502, 2020.
Rohde, R. A. and Hausfather, Z.: The Berkeley Earth Land/Ocean Temperature Record, Earth Syst. Sci. Data, 12, 3469–3479, https://doi.org/10.5194/essd-12-3469-2020, 2020.
Saliba, G.: Cultural Implications of Natural Disasters: Historical Reports of the Volcano Eruption of July, 1256 CE, Transcultural Research – Heidelberg Studies on Asia and Europe in a Global Context, 139–154, https://doi.org/10.1007/978-3-319-49163-9_7, 2017.
Salzer, M. W. and Hughes, M. K.: Bristlecone pine tree rings and volcanic eruptions over the last 5000 yr, Quaternary Res., 67, 57–68, 2007.
Schneider, L., Smerdon, J. E., Büntgen, U., Wilson, R. J. S., Myglan, V. S., Kirdyanov, A. V., and Esper, J.: Revising midlatitude summer temperatures back to A.D. 600 based on a wood density network, Geophys. Res. Lett., 42, 4556–4562, https://doi.org/10.1002/2015gl063956, 2015.
Sellar, A. A., Jones, C. G., Mulcahy, J. P., Tang, Y., Yool, A., Wiltshire, A., O'Connor, F. M., Stringer, M., Hill, R., Palmieri, J., Woodward, S., Mora, L., Kuhlbrodt, T., Rumbold, S. T., Kelley, D. I., Ellis, R., Johnson, C. E., Walton, J., Abraham, N. L., and Andrews, M. B.: UKESM1: Description and Evaluation of the U.K. Earth System Model, J. Adv. Model. Earth Sy., 11, 4513–4558, https://doi.org/10.1029/2019ms001739, 2019.
Sigl, M., Winstrup, M., McConnell, J. R., Welten, K. C., Plunkett, G., Ludlow, F., Büntgen, U., Caffee, M., Chellman, N., Dahl-Jensen, D., Fischer, H., Kipfstuhl, S., Kostick, C., Maselli, O. J., Mekhaldi, F., Mulvaney, R., Muscheler, R., Pasteris, D. R., Pilcher, J. R., and Salzer, M.: Timing and climate forcing of volcanic eruptions for the past 2,500 years, Nature, 523, 543–549, https://doi.org/10.1038/nature14565, 2015.
Stevenson, S., Fasullo, J. T., Otto-Bliesner, B. L., Tomas, R. A., and Gao, C.: Role of eruption season in reconciling model and proxy responses to tropical volcanism, P. Natl. Acad. Sci., 114, 1822–1826, https://doi.org/10.1073/pnas.1612505114, 2017.
Stevenson, S., Overpeck, J. T., Fasullo, J., Coats, S., Parsons, L., Otto-Bliesner, B., Ault, T., Loope, G., and Cole, J.: Climate Variability, Volcanic Forcing, and Last Millennium Hydroclimate Extremes, J. Climate, 31, 4309–4327, https://doi.org/10.1175/jcli-d-17-0407.1, 2018.
Stoffel, M., Khodri, M., Corona, C., Guillet, S., Poulain, V., Bekki, S., Guiot, J., Luckman, B. H., Oppenheimer, C., Lebas, N., Beniston, M., and Masson-Delmotte, V.: Estimates of volcanic-induced cooling in the Northern Hemisphere over the past 1,500 years, Nat. Geosci., 8, 784–788, https://doi.org/10.1038/ngeo2526, 2015.
Stothers, R. B.: Climatic and Demographic Consequences of the Massive Volcanic Eruption of 1258, Clim. Change, 45, 361–374, https://doi.org/10.1023/a:1005523330643, 2000.
Stothers, R. B.: Stratospheric Transparency Derived from Total Lunar Eclipse Colors, 1801–1881, Publ. Astron. Soc. Pac., 117, 1445–1450, https://doi.org/10.1086/497016, 2005.
Timmreck, C., Lorenz, S. J., Crowley, T. J., Kinne, S., Raddatz, T. J., Thomas, M. A., and Jungclaus, J. H.: Limited temperature response to the very large AD 1258 volcanic eruption, Geophys. Res. Lett., 36, L21708, https://doi.org/10.1029/2009gl040083, 2009.
Timmreck, C., Toohey, M., Zanchettin, D., Brönnimann, S., Lundstad, E., and Wilson, R.: The unidentified eruption of 1809: a climatic cold case, Clim. Past, 17, 1455–1482, https://doi.org/10.5194/cp-17-1455-2021, 2021.
Toohey, M. and Sigl, M.: Volcanic stratospheric sulfur injections and aerosol optical depth from 500 BCE to 1900 CE, Earth Syst. Sci. Data, 9, 809–831, https://doi.org/10.5194/essd-9-809-2017, 2017.
Toohey, M., Krüger, K., Niemeier, U., and Timmreck, C.: The influence of eruption season on the global aerosol evolution and radiative impact of tropical volcanic eruptions, Atmos. Chem. Phys., 11, 12351–12367, https://doi.org/10.5194/acp-11-12351-2011, 2011.
van Dijk, E., Mørkestøl Gundersen, I., de Bode, A., Høeg, H., Loftsgarden, K., Iversen, F., Timmreck, C., Jungclaus, J., and Krüger, K.: Climatic and societal impacts in Scandinavia following the 536 and 540 CE volcanic double event, Clim. Past, 19, 357–398, https://doi.org/10.5194/cp-19-357-2023, 2023.
Vidal, C. M., Komorowski, J.-C., Métrich, N., Pratomo, I., Kartadinata, N., Prambada, O., Michel, A., Carazzo, G., Lavigne, F., Rodysill, J., Fontijn, K., and Surono: Dynamics of the major plinian eruption of Samalas in 1257 A.D. (Lombok, Indonesia), B. Volcanol., 77, 73, https://doi.org/10.1007/s00445-015-0960-9, 2015.
Vinther, B. M., Clausen, H. B., Johnsen, S. J., Rasmussen, S. O., Andersen, K. K., Buchardt, S. L., Dahl-Jensen, D., Seierstad, I. K., Siggaard-Andersen, M.-L. ., Steffensen, J. P., Svensson, A., Olsen, J., and Heinemeier, J.: A synchronized dating of three Greenland ice cores throughout the Holocene, J. Geophys. Res., 111, D13102, https://doi.org/10.1029/2005jd006921, 2006.
Vinther, B. M., Jones, P. D., Briffa, K. R., Clausen, H. B., Andersen, K. K., Dahl-Jensen, D., and Johnsen, S. J.: Climatic signals in multiple highly resolved stable isotope records from Greenland, Quaternary Sci. Rev., 29, 522–538, https://doi.org/10.1016/j.quascirev.2009.11.002, 2010.
Wainman, L., Marshall, L., Schmidt, A., and Abraham, L.: VOL-CLIM: UKESM1 Gridded Output for Mt. Samalas 1257 Simulations, NERC EDS Centre for Environmental Data Analysis [data set], https://catalogue.ceda.ac.uk/uuid/e0221b37aa174dd290c5e105263b59d1 (last access: 13 November 2023), 2024.
Wiles, G. C., D'Arrigo, R. D., Barclay, D., Wilson, R. S., Jarvis, S. K., Vargo, L., and Frank, D.: Surface air temperature variability reconstructed with tree rings for the Gulf of Alaska over the past 1200 years, The Holocene, 24, 198–208, https://doi.org/10.1177/0959683613516815, 2014.
Wilson, R., Anchukaitis, K., Briffa, K. R., Büntgen, U., Cook, E., D'Arrigo, R., Davi, N., Esper, J., Frank, D., Gunnarson, B., Hegerl, G., Helama, S., Klesse, S., Krusic, P. J., Linderholm, H. W., Myglan, V., Osborn, T. J., Rydval, M., Schneider, L., and Schurer, A.: Last millennium northern hemisphere summer temperatures from tree rings: Part I: The long term context, Quaternary Sci. Rev., 134, 1–18, https://doi.org/10.1016/j.quascirev.2015.12.005, 2016.
Xu, G., Liu, X., Zhang, Q., Zhang, Q., Hudson, A. R., and Trouet, V.: NOAA/WDS Paleoclimatology – Tibetan Plateau 1000 Year Air Temperature Anomaly Reconstructions; [relative to 1961-1990 CE; Northeastern Tibetan Plateau], NOAA National Centers for Environmental Information [data set], https://doi.org/10.25921/yx18-g761, 2019.
Zielinski, G. A., Mayewski, P. A., Meeker, L. D., Whitlow, S., Twickler, M. S., Morrison, M., Meese, D. A., Gow, A. J., and Alley, R. B.: Record of Volcanism Since 7000 B.C. from the GISP2 Greenland Ice Core and Implications for the Volcano-Climate System, Science, 264, 948–952, https://doi.org/10.1126/science.264.5161.948, 1994.