the Creative Commons Attribution 4.0 License.
the Creative Commons Attribution 4.0 License.
 | 11 Apr 2024
Hydroclimatic anomalies detected by a sub-decadal diatom oxygen isotope record of the last 220 years from Lake Khamra, Siberia
Boris K. Biskaborn
Ulrike Herzschuh
Jens Strauss
Luidmila Pestryakova
Hanno Meyer
Northern latitudes have been significantly impacted by recent climate warming, which has increased the probability of experiencing extreme weather events. To comprehensively understand hydroclimate change and reconstruct hydroclimatic anomalies such as drought periods, appropriate proxy records reaching further back in time beyond meteorological measurements are needed. Here we present a 220-year (2015–1790 CE), continuous, stable oxygen isotope record of diatoms (δ18Odiatom) from Lake Khamra (59.99° N, 112.98° E) in eastern Siberia, an area highly sensitive to climate change and for which there is a demand for palaeohydrological data. This high-resolution proxy record was obtained from a 210Pb–137Cs-dated sediment short core and analysed to reconstruct hydroclimate variability at a sub-decadal scale. The interpretation of the δ18Odiatom record is supported by meteorological data, modern isotope hydrology and geochemical analyses of the same sediment, which is indicative of the conditions in the lake and catchment. A comparison with meteorological data going back to 1930 CE revealed that the δ18Odiatom record of Lake Khamra is primarily influenced by regional precipitation changes rather than the air temperature. We identified winter precipitation, which enters the lake as isotopically depleted snowmelt water, as the key process impacting the diatom isotope variability. We related the overall depletion of δ18Odiatom in recent decades to an observed increase in winter precipitation in the area, likely associated with the global air temperature rise, Arctic sea ice retreat and increased moisture transport inland. Available palaeoclimate proxy records, including a fire reconstruction for the same lake, support the idea that the new record is a valuable hydroclimate proxy that is indicative of precipitation deficits and excludes solar insolation and air temperature as primary driving forces, even before the first meteorological recordings. We propose two possible hydroclimatic anomalies that were detected in the Lake Khamra δ18Odiatom record: one at the beginning of the 19th century and a second prominent event in the 1950s. Both are interpreted as prolonged dry periods associated with enriched δ18Odiatom values likely caused by reduced winter precipitation, which coincide with phases of reconstructed severe wildfires in the region. Despite the apparent pristine lake area, we observed a three- to fourfold increase in mercury concentrations and accumulation rates within the sediment record since the early 20th century, which is partly attributed to human air pollution.
- Article
(4827 KB) - Full-text XML
- BibTeX
- EndNote


Siberia experienced an extraordinary heatwave during the initial 6 months of 2020 (Overland and Wang, 2020; Collow et al., 2022), which would have been highly improbable without human-induced climate change (Ciavarella et al., 2021). Since 1979, the northern latitudes have warmed nearly 4 times faster than the rest of the world (Rantanen et al., 2022), and this warming has even accelerated since the beginning of the 21st century (Chylek et al., 2022), a phenomenon known as Arctic amplification (Manabe and Stouffer, 1980; Miller et al., 2010; Previdi et al., 2021). Rapidly increasing air temperatures due to rising emissions of greenhouse gases increase the frequency and/or intensities of extreme events (Seneviratne et al., 2021). Hydroclimatic extreme events, such as drought periods or intensified precipitation, are linked with ocean currents and large-scale dynamics (Churakova Sidorova et al., 2021; Marshall, 2021; Seneviratne et al., 2021; Watanabe et al., 2023). In the 21st century, Arctic precipitation is expected to increase significantly due to Arctic sea-ice retreat and increased evaporation (Bintanja and Selten, 2014; Bintanja, 2018).
The hydroclimate across Siberia has undergone notable alterations in recent decades but differs regionally. While snow depth has decreased over most southern parts of Russia, it has increased in the northern parts, including northern central Siberia (Ye et al., 1998; Bulygina et al., 2009; Ghatak et al., 2012; Sato et al., 2022). In Yakutia (the Republic of Sakha), located in the Russian Far East (Fig. 1a), the snow cover duration has been prolonged (Bulygina et al., 2009), and there has been a notable rise in overall precipitation levels in the past 5 decades (Gorokhov and Fedorov, 2018). Despite this, Yakutia is one of the most vulnerable regions for forest fires in Russia (Kirillina et al., 2020) and underwent its most severe fire season of the past 40 years in 2021 (Tomshin and Solovyev, 2022), highlighting that it is an area of extremes. Meteorological records only start at the beginning of the 20th century, and there is a scarcity of high-resolution hydroclimate records predating this period.
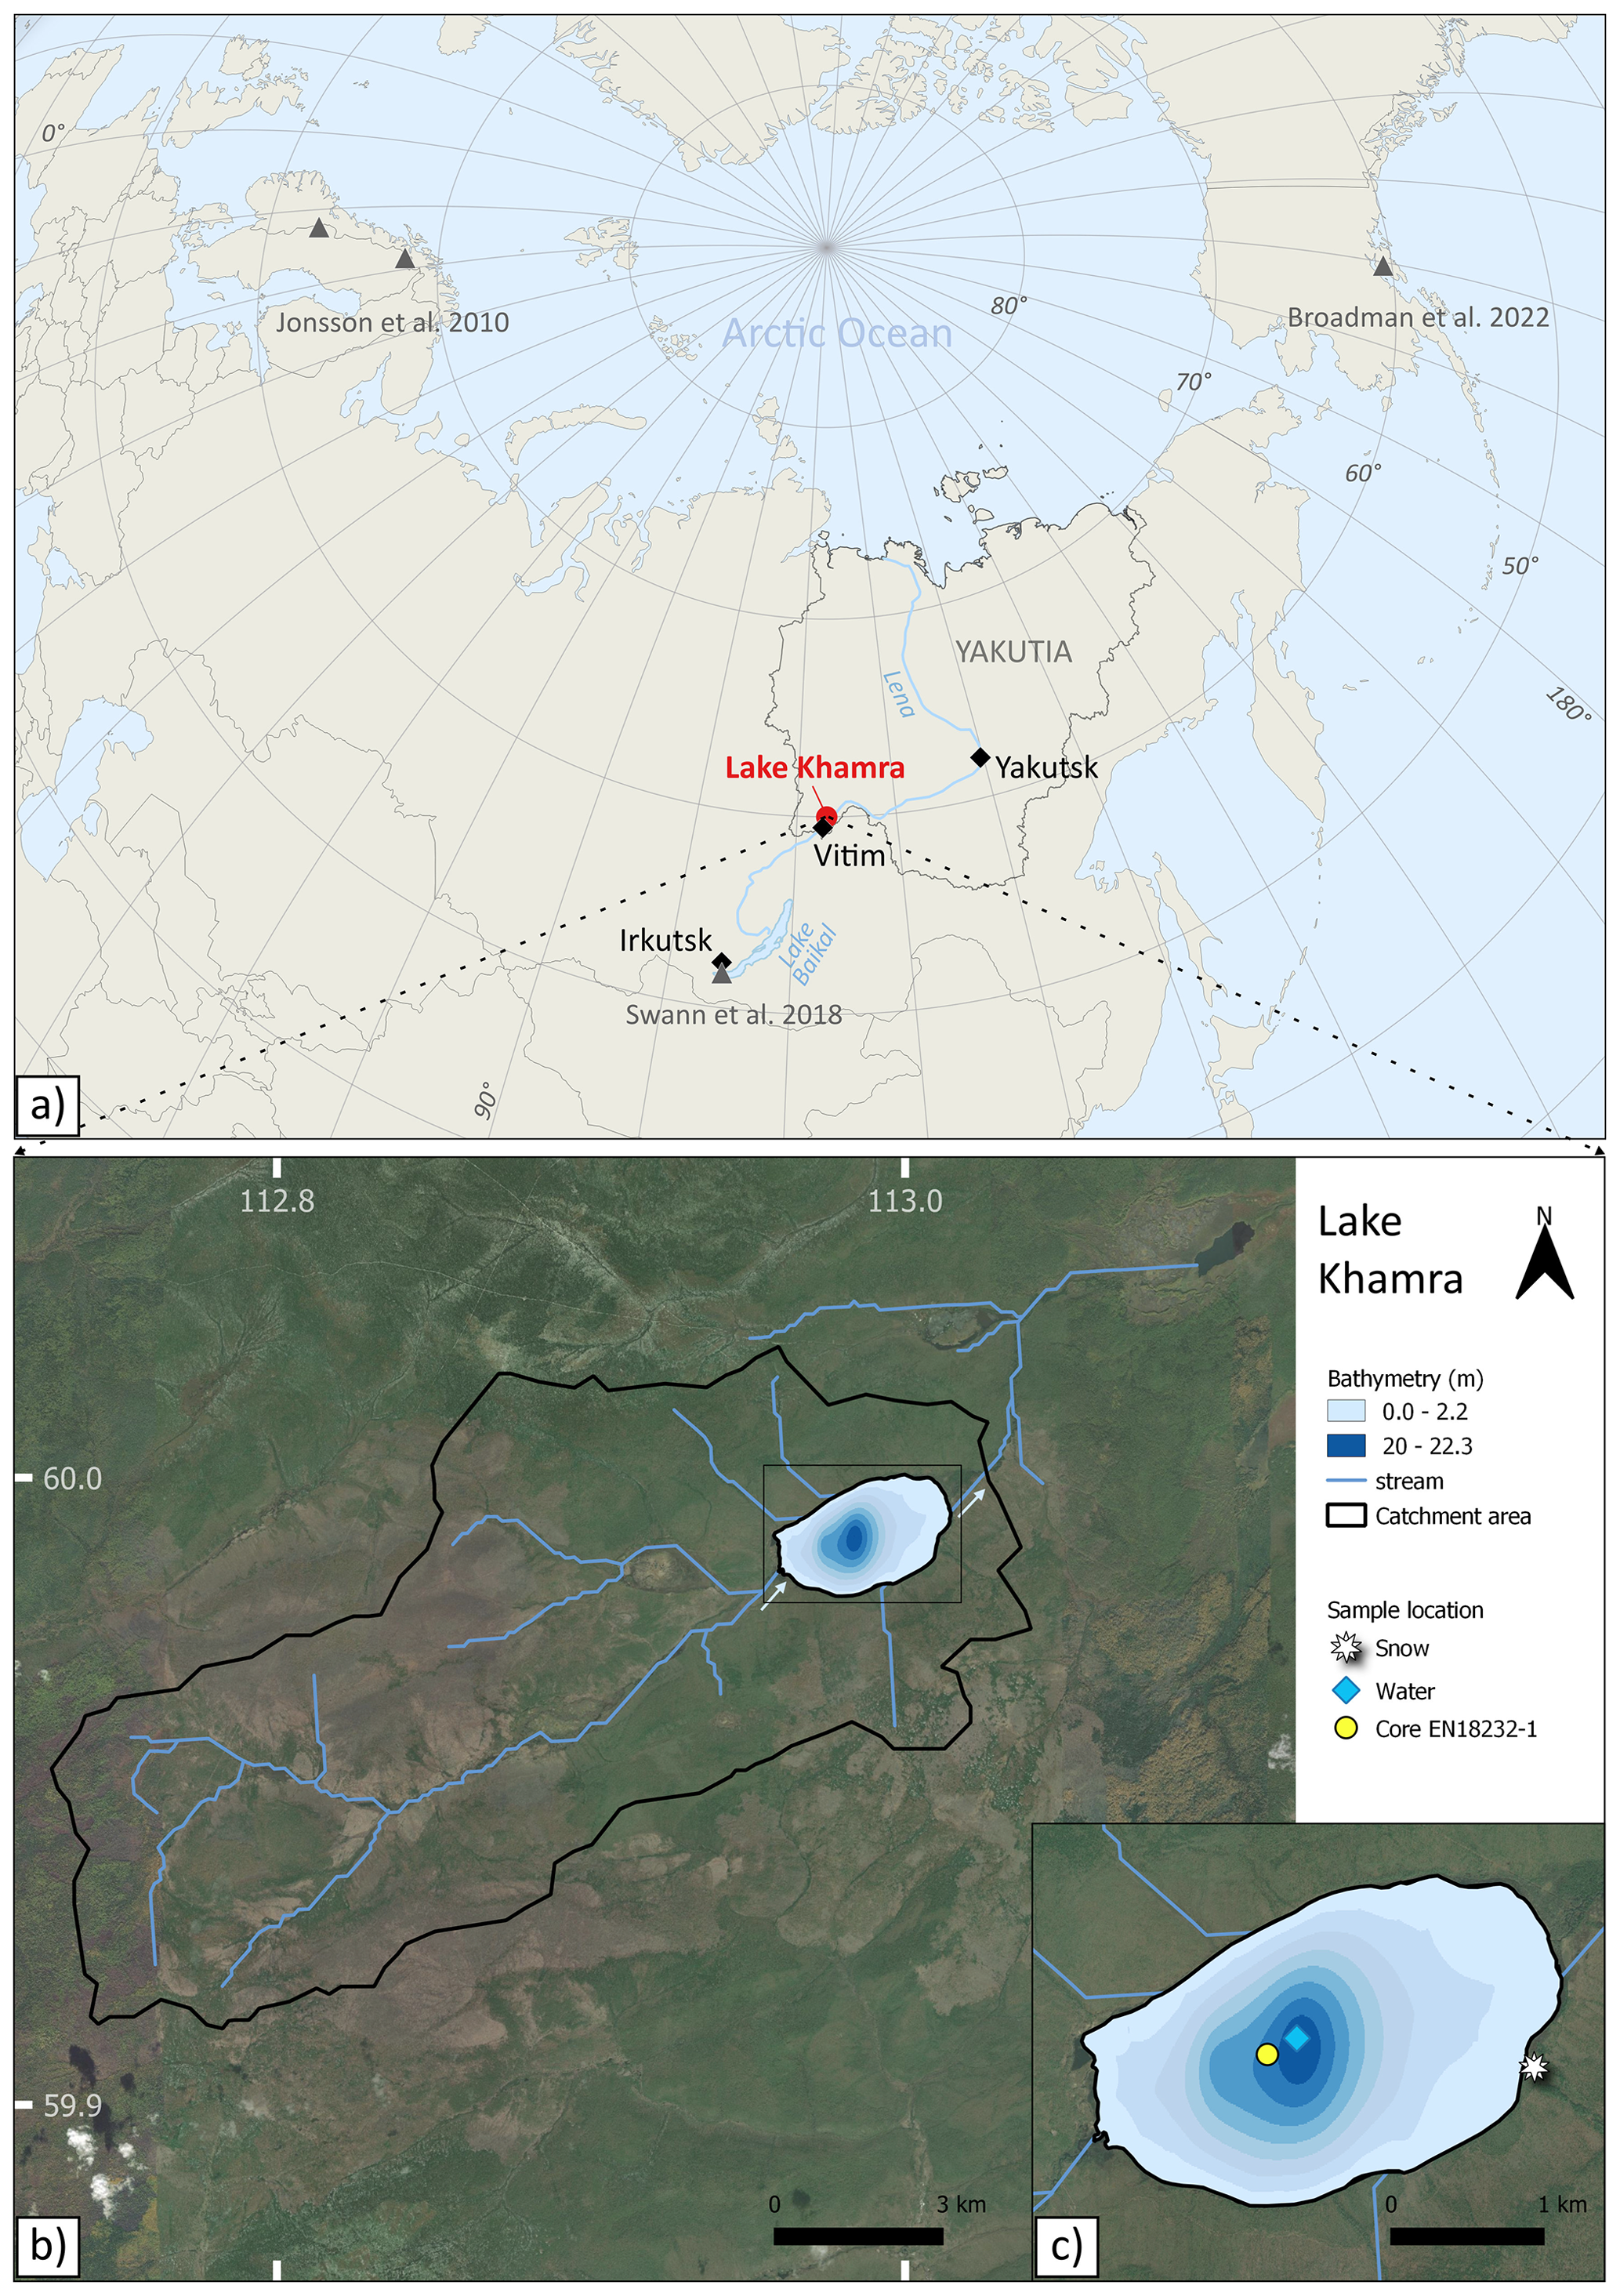
Figure 1Study area. (a) Position of Lake Khamra in the south-western part of Yakutia, close to the Lena River; the closest weather station is located in Vitim, and Lake Khamra lies in between the cities of Yakutsk and Irkutsk. Other high-resolution study sites are indicated as grey triangles (Jonsson et al., 2010; Swann et al., 2018; Broadman et al., 2022). (b) Catchment of Lake Khamra. The main in- and outflows are indicated by arrows. (c) Sample locations at Lake Khamra. Service layer credits: © OpenStreetMap contributors 2023 (distributed under the Open Data Commons Open Database License (ODbL) v1.0), Esri, Maxar, Earthstar Geographics, and the GIS User Community.
To reconstruct hydroclimatic anomalies, appropriate high-resolution proxy records are needed. Oxygen isotopes of lacustrine diatoms (δ18Odiatom) have proven to be a valuable proxy to investigate temperature and hydrological variations in numerous studies (Leng and Barker, 2006; van Hardenbroek et al., 2018). δ18Odiatom is influenced by different environmental and climatic factors, such as precipitation, evaporation or atmospheric circulation patterns, and is generally linked to variations in temperature and the oxygen isotope composition of the lake water (δ18Olake; Leng and Barker, 2006; Meister et al., 2024). Nevertheless, influencing factors vary by location and have to be evaluated for each study site individually. Diatom oxygen isotope records located in Russia have been interpreted as a palaeo-precipitation proxy (Chapligin et al., 2012b; Kostrova et al., 2013a, b; Meyer et al., 2022) or a proxy sensitive to snow or glacier meltwater input (Mackay et al., 2013; Kostrova et al., 2013b, 2014, 2021; Meyer et al., 2015, 2022), dominated by summer temperatures on millennial timescales (Meyer et al., 2022). Furthermore, long-term trends in the δ18Odiatom records correspond to those in summer insolation (Meyer et al., 2015; Kostrova et al., 2021; Meister et al., 2024), and teleconnections between Central Asia and the North Atlantic could be identified (Mackay et al., 2013). The available lake sediment δ18Odiatom records predominantly cover the Holocene, especially the last 2000 years (Meister et al., 2024). For Asia, there are 21 published diatom isotope records, with a special emphasis on Siberia (Meister et al., 2024). However, the δ18Odiatom records mainly focus on millennial timescales, whereas high-resolution records of the past hundred years are very scarce. Moreover, only one Russian high-resolution study at Lake Baikal has been interpreted as a hydroclimate proxy (Swann et al., 2018; see Fig. 1a).
This study aims to provide a new hydroclimate proxy record from Lake Khamra (59.99° N, 112.98° E) in southern Yakutia (Fig. 1a). We hypothesise that a high-resolution δ18Odiatom record can be used to reconstruct hydroclimatic anomalies such as drought events or prolonged rainfall periods on a sub-decadal scale since 1790 CE. For this purpose, the latest 90 years of the record are validated by meteorological data to identify the main drivers of the δ18Odiatom record in the study area. Comparisons with available palaeoclimate proxy records are used to assess key factors responsible for the diatom isotope variability and to analyse common trends beyond meteorological timescales. For the identification of large-scale dynamics, the δ18Odiatom record is placed in the broader context of the northern landscape development. Additionally, we survey the possible human impact on this remote lake ecosystem since the onset of the Industrial Revolution.
Lake Khamra (59.99° N, 112.98° E, 340 m a.s.l.) is located in a sparsely populated area in south-west Yakutia, eastern Siberia, Russia (Fig. 1a). The closest urban settlements, Peleduy and Vitim, are situated 40 and 60 km south-west of the lake, respectively. The city of Yakutsk is located 930 km to the north-east; Irkutsk is ca. 1000 km to the south-west.
Lake Khamra covers an area of 4.6 km2 and has a catchment size of 107.3 km2, extending towards the south-west. The water depth ranges from shallow shore areas towards a maximum of 22.3 m in the central part of the lake (Fig. 1c). There are several small tributaries flowing down the gentle hills into the lake, with the main inflow to the south-west and an outflow in the north-east (Fig. 1b). The lake is a hydrologically open system with an estimated average long-term discharge of 1.1 m3 s−1 (0.03 km3 a−1) and an average residence time of approximately 474 d (Messager et al., 2016). In winter, the lake is covered by ice and snow. During field work in March 2020, the ice thickness was on average 0.5 m and the snow cover was about 1 m thick at different drilling locations (Biskaborn et al., 2021a).
The lake is located within Cambrian bedrock comprising dolomite and limestone alternating with silty Ordovician sandstone and small delineated areas of clayey Silurian limestone (Chelnokova et al., 1988). The landscape is classified as mountain taiga within a discontinuous and sporadic permafrost zone (Brown et al., 1997; Fedorov et al., 2018). According to field observations, the catchment of the mountain lake Khamra is covered by a mixed-coniferous forest mainly consisting of the tree species Larix gmelinii, Picea obovata, Pinus siberica and Abies siberica (Kruse et al., 2019; Miesner et al., 2022).
According to the nearest weather station in Vitim (Fig. 1a), the region of Lake Khamra is strongly influenced by the continental climate, which is characterised by a large annual temperature range of 47 °C, shifting from extremely cold and dry winters (lowest monthly mean temperature in January: −28.8 °C, 1929–2018 CE) to warm and humid summer months (highest monthly mean temperature July: +18.1 °C, 1929–2018 CE). The mean annual air temperature is −5.0 °C, with an annual mean precipitation amount of 423 mm (1929–2018 CE) and most precipitation falling between June and September (see Fig. 2). The variability of snow accumulation in the area may depend on changing air-mass trajectories and changing moisture sources. Between November and March, the Siberian high is predominant, as there is a shallow high-pressure system above central Siberia associated with very cold and dry conditions (Shahgedanova, 2002). Winter precipitation is linked with frontal activity and mainly influenced by the Icelandic Low in the north-west and the Aleutian Low in the north-east, which is linked to a depression in the upper troposphere (Mock et al., 1998; Shahgedanova, 2002). Thereby, moisture is generally transported from the Icelandic Low originating from the North Atlantic by westerly winds to central Siberia (Shahgedanova, 2002).
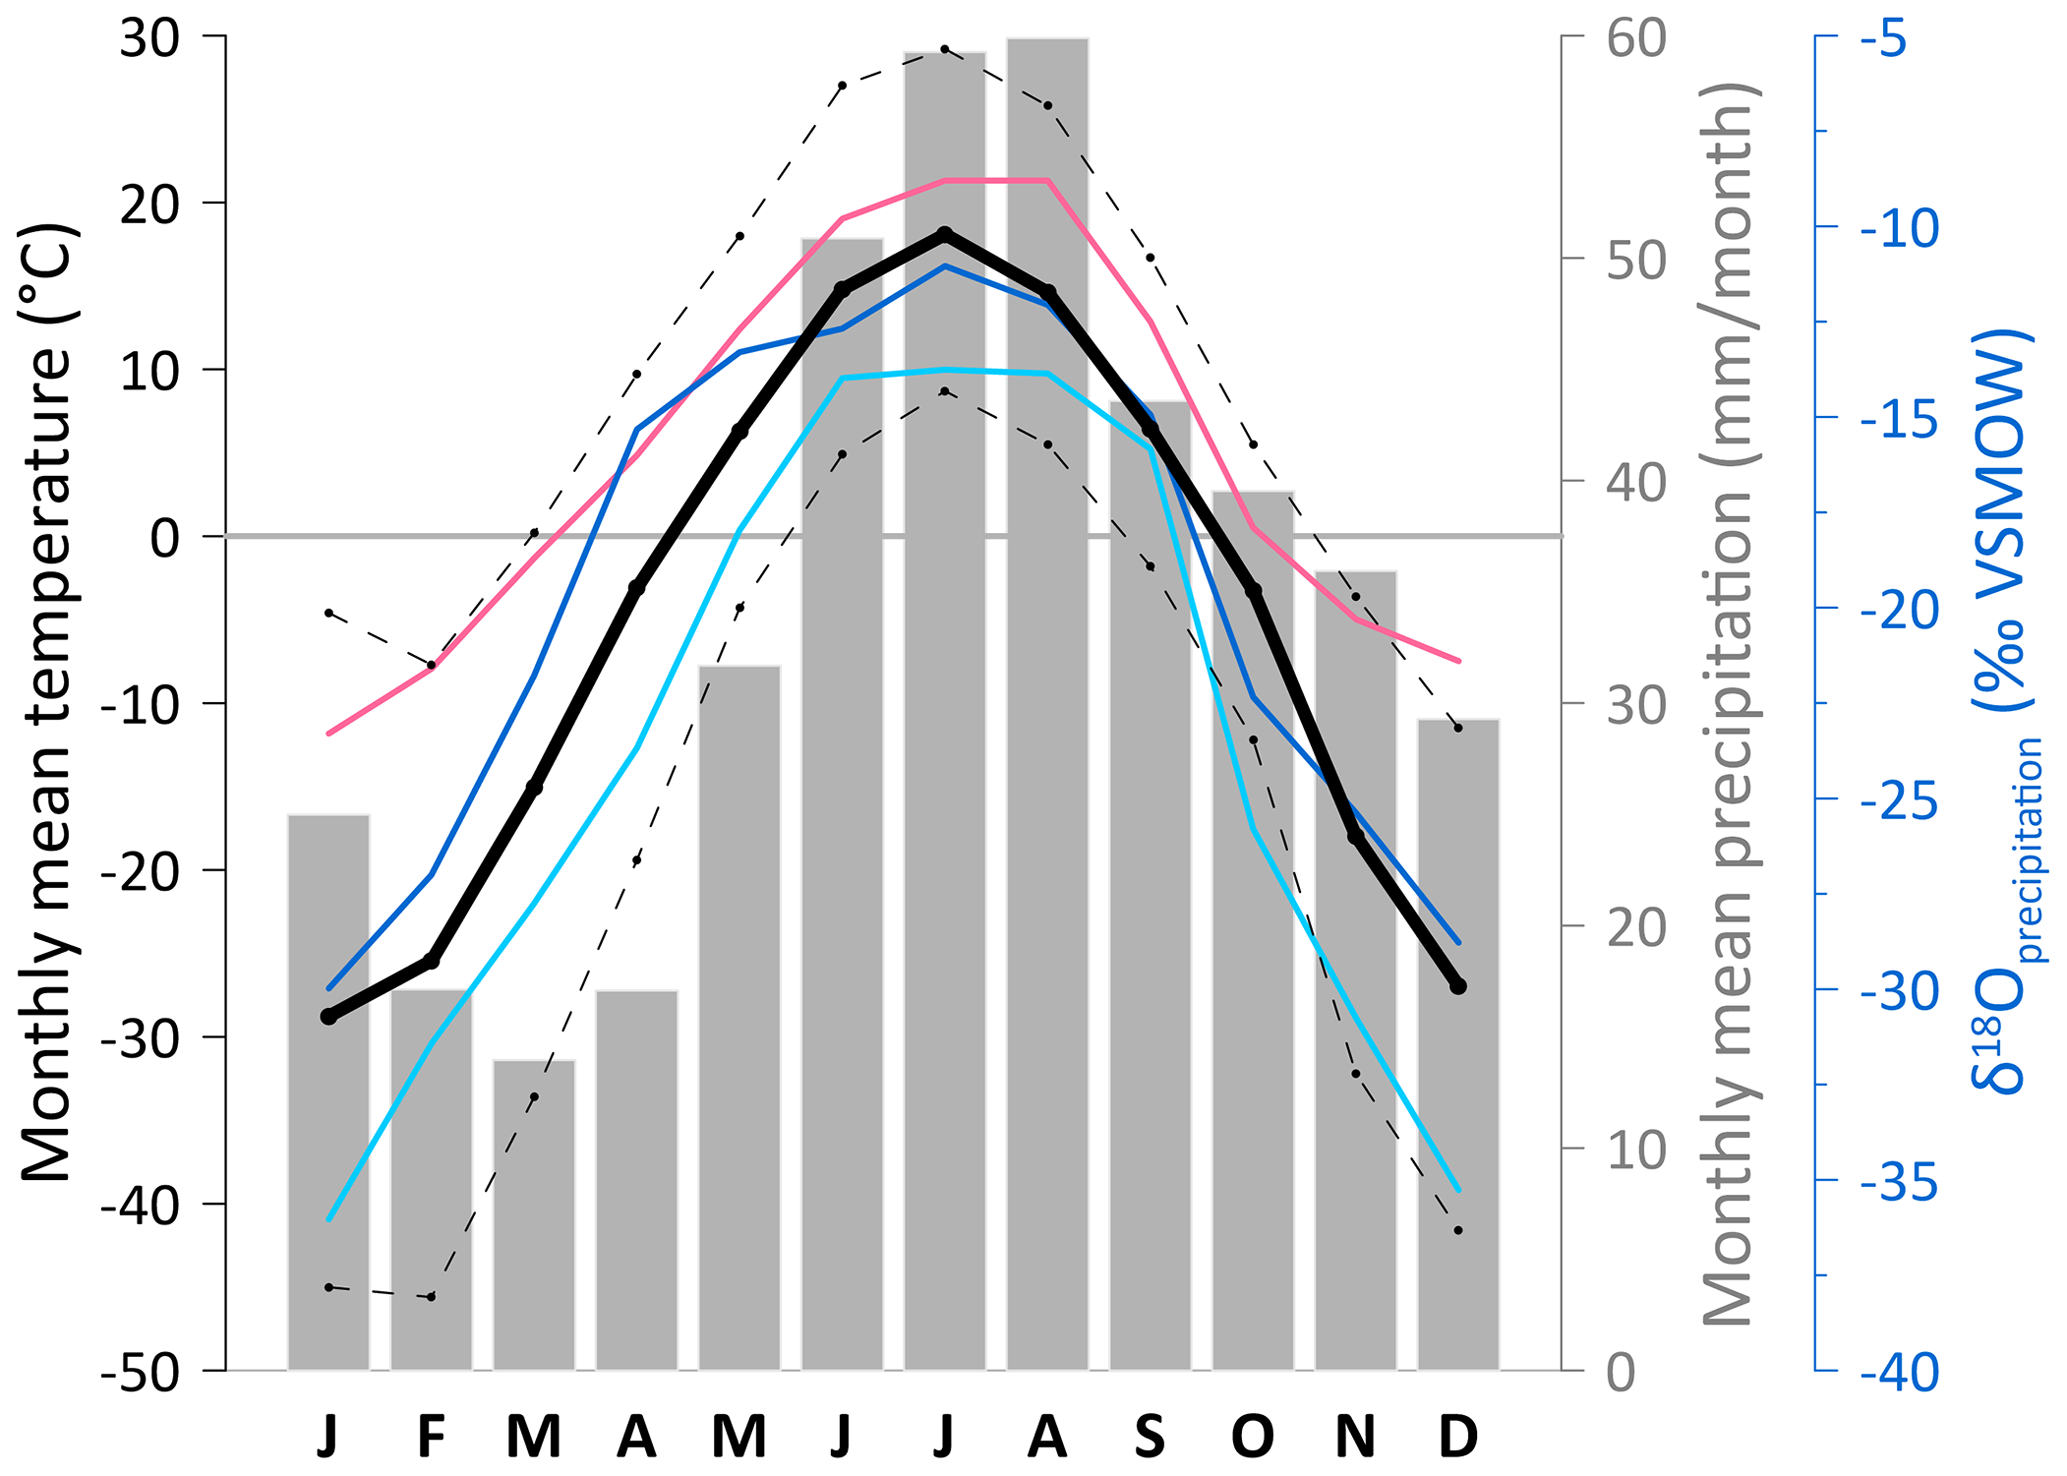
Figure 2Meteorological data from the weather station in Vitim (59.45° N, 112.58° E; 186 m a.s.l.; ECA (European Climate Assessment) station code 3235; data accessible via the KNMI Climate Explorer https://climexp.knmi.nl (last access: 15 May 2023)): monthly mean precipitation amount for 1929–2018 CE (90 years; grey bars) and monthly mean temperature for 1929–2018 CE (90 years; black line; Klein Tank et al., 2002); daily max temperature for 1930–2019 CE (upper dashed line) and min temperature for 1928–2019 CE (lower dashed line; Durre et al., 2008). Monthly mean oxygen isotope values for precipitation (δ18Oprec) recorded in Yakutsk are shown by the light blue line (Kurita et al., 2004); those recorded in Irkutsk are highlighted by the dark blue line (Kostrova et al., 2020). Modelled monthly δ18Oprec values for the region (latitude 60°, longitude 113°; altitude 340 m) are shown as a pink line (Bowen et al., 2005; Bowen, 2023; IAEA/WMO, 2023).
Oxygen isotope measurements for precipitation (δ18Oprec) recorded in Yakutsk (Kurita et al., 2004) and Irkutsk (Kostrova et al., 2020) as well as the modelled monthly δ18Oprec values for the region (Bowen et al., 2005; Bowen, 2023; IAEA/WMO, 2023) all follow the annual pattern of the temperature amplitude, with strongly depleted values observed in the winter months and more enriched values in summer (see Fig. 2). Overall, the modelled data show the highest δ18Oprec values, whereas the Yakutsk region shows the lowest.
3.1 Water isotope samples of Lake Khamra and meteorological data
During two field campaigns, in August 2018 and in March 2020, the isotopic composition of the lake water was analysed. During the summer field campaign in 2018, surface water (0–0.05 m) was sampled in the central part of the lake, and hydrological parameters like pH, conductivity and temperature were measured on-site using a WTW Multilab 340i. In spring 2020, six water samples were taken along a water-depth profile below the lake ice cover (0.65 m thick), which was additionally sampled. Two snow samples were collected near the shore within a profile of 60 cm (see map of the different sample locations in Fig. 1c).
The snow and ice samples were all completely melted and subsequently stored at a cool temperature in 30 mL polyethylene bottles prior to stable isotope measurements. Hydrogen (δD) and oxygen (δ18O) isotopes were analysed at the ISOLAB Facility at the Alfred Wegener Institute Helmholtz Centre for Polar and Marine Research (AWI) in Potsdam, Germany, with a Finnigan MAT Delta-S mass spectrometer employing the equilibration method (details in Meyer et al., 2000). Data are given in per mille (‰) relative to Vienna Standard Mean Ocean Water (V-SMOW). The standard deviation includes all measurements of the individual sample, which is generally better than the external (or machine) error. The external errors of long-term standard measurements for hydrogen and oxygen are better than ±0.8 ‰ and ±0.10 ‰, respectively (Meyer et al., 2000). The second-order parameter deuterium excess (d excess) was computed as follows: (Dansgaard, 1964).
The water isotope samples of Lake Khamra are compared to the global meteoric water line (GMWL; ; Craig, 1961) and to Global Network of Isotopes in Precipitation (GNIP) data (IAEA/WMO, 2023) recorded in Yakutsk (Kurita et al., 2004) and in Irkutsk (Kostrova et al., 2020). Additionally, the mean monthly and annual isotope compositions of precipitation were modelled for the study area (latitude 60°, longitude 113°; altitude 340 m) using the Online Isotopes in Precipitation Calculator (OIPC; Bowen and Revenaugh, 2003; Bowen et al., 2005; Bowen, 2023; IAEA/WMO, 2023). The monthly modelled data serve as a basis for the local meteoric water line (LMWL).
All meteorological data used in this study stem from the KNMI Climate Explorer website (https://climexp.knmi.nl, last access: 15 May 2023), from the weather stations in Vitim (59.45° N, 112.58° E; 186 m a.s.l.; ECA station code 3235; 1928–2019 CE), Yakutsk (62.02° N, 129.72° E; 98 m a.s.l.; ECA station code: 3214; 1888–2019 CE) and Irkutsk (52.27° N, 104.35° E; 467 m a.s.l.; ECA station code: 3245; 1882–2018 CE; Klein Tank et al., 2002). For comparability with the weather station in Vitim, only meteorological data for the years 1929–2018 CE were considered.
3.2 Sediment short core recovery and subsampling
During the field work in August 2018, a 42 cm sediment short core, EN18232-1, was retrieved from the central and deepest part of Lake Khamra (59.99091° N; 112.98373° E; water depth: 22.3 m) by using a UWITEC gravity corer (60 mm). The water depth was determined with a surveying rope and a handheld HONDEX PS-7 LCD digital sounder. After the field work, the sediment core was transported in a PVC tube to the AWI in Potsdam and stored in the dark at a cool temperature (4 °C) until further analysis.
In October 2021, the short core was subsampled in continuous 1 cm increments (n=39). The rim material (<0.5 cm) of the individual sample layers was removed to avoid contamination. With the help of a 1 cm3 tool, 24 subsamples were also taken to determine the water content and dry bulk density (0–10 cm every 1 cm; >10 cm every 2 cm). All sediment samples were frozen and subsequently freeze dried for at least 48 h.
3.3 Dating
To establish the high-resolution age–depth model, freeze-dried subsamples of the short core EN18232-1 (n=31) were analysed for 210Pb, 226Ra, 137Cs and 241Am by direct gamma assay in the Liverpool University Environmental Radioactivity Laboratory using Ortec HPGe GWL series well-type coaxial low-background intrinsic germanium detectors (Appleby et al., 1986).
With the intention of extending the 210Pb–137Cs age–depth model, subsamples (n=4) of the freeze-dried bulk material of the deeper part of the short core were sent to the radiocarbon analysis laboratory at AWI Bremerhaven. No plant macrofossils were found in the very fine-grained sample material and thus only bulk sediment samples were dated. 14C was analysed by using an accelerator mass spectrometer (AMS), MICADAS (MIni CArbon Dating System; Mollenhauer et al., 2021), and calibrated with the IntCal20 14C calibration curve (Reimer et al., 2020) using the CALIB radiocarbon calibration program (CALIB REV 8.2; Stuiver and Reimer, 1986, 1993).
To compute the age–depth model, a Bayesian accumulation model within the R package “rbacon” v2.5.8 (Blaauw and Christen, 2011; R version 4.1.1) was used, based on the 210Pb chronology.
3.4 Diatom isotope purification process, δ18Odiatom analysis and contamination correction
The diatom isotope purification process includes both chemical and physical preparation steps to obtain a purified diatom sample (Morley et al., 2004; Leng and Barker, 2006). Aliquots (2 g) of dried sediment samples (n=39) were processed for δ18Odiatom analysis. The cleaning procedure is based on the processing steps described in Morley et al. (2004) and refined in Kostrova et al. (2021). However, processing depends on the respective material and requires an individual approach (Leng and Sloane, 2008). Relevant steps include the removal of organic matter by adding H2O2 (30 %, 50 °C, ∼55 h) and then the addition of HCl (10 %, 50 °C, ∼16 h) to eliminate carbonates. Before starting the heavy liquid separations (HLSs), all samples were washed neutrally with ultra-pure water. By centrifuging the samples in sodium polytungstate (SPT, 3Na2WO49WO3 ⋅ H2O) solutions with decreasing densities (2.50–2.12 g cm−3), the diatoms were gradually separated from the heavy minerogenic fraction. An inverse HLS, described in detail in Kostrova et al. (2021), detached light microparticles like charcoal from the diatom valves. To remove possible residues of acid, SPT and clay minerals, all samples were washed neutrally with ultra-pure water using a 3 µm cellulose filter.
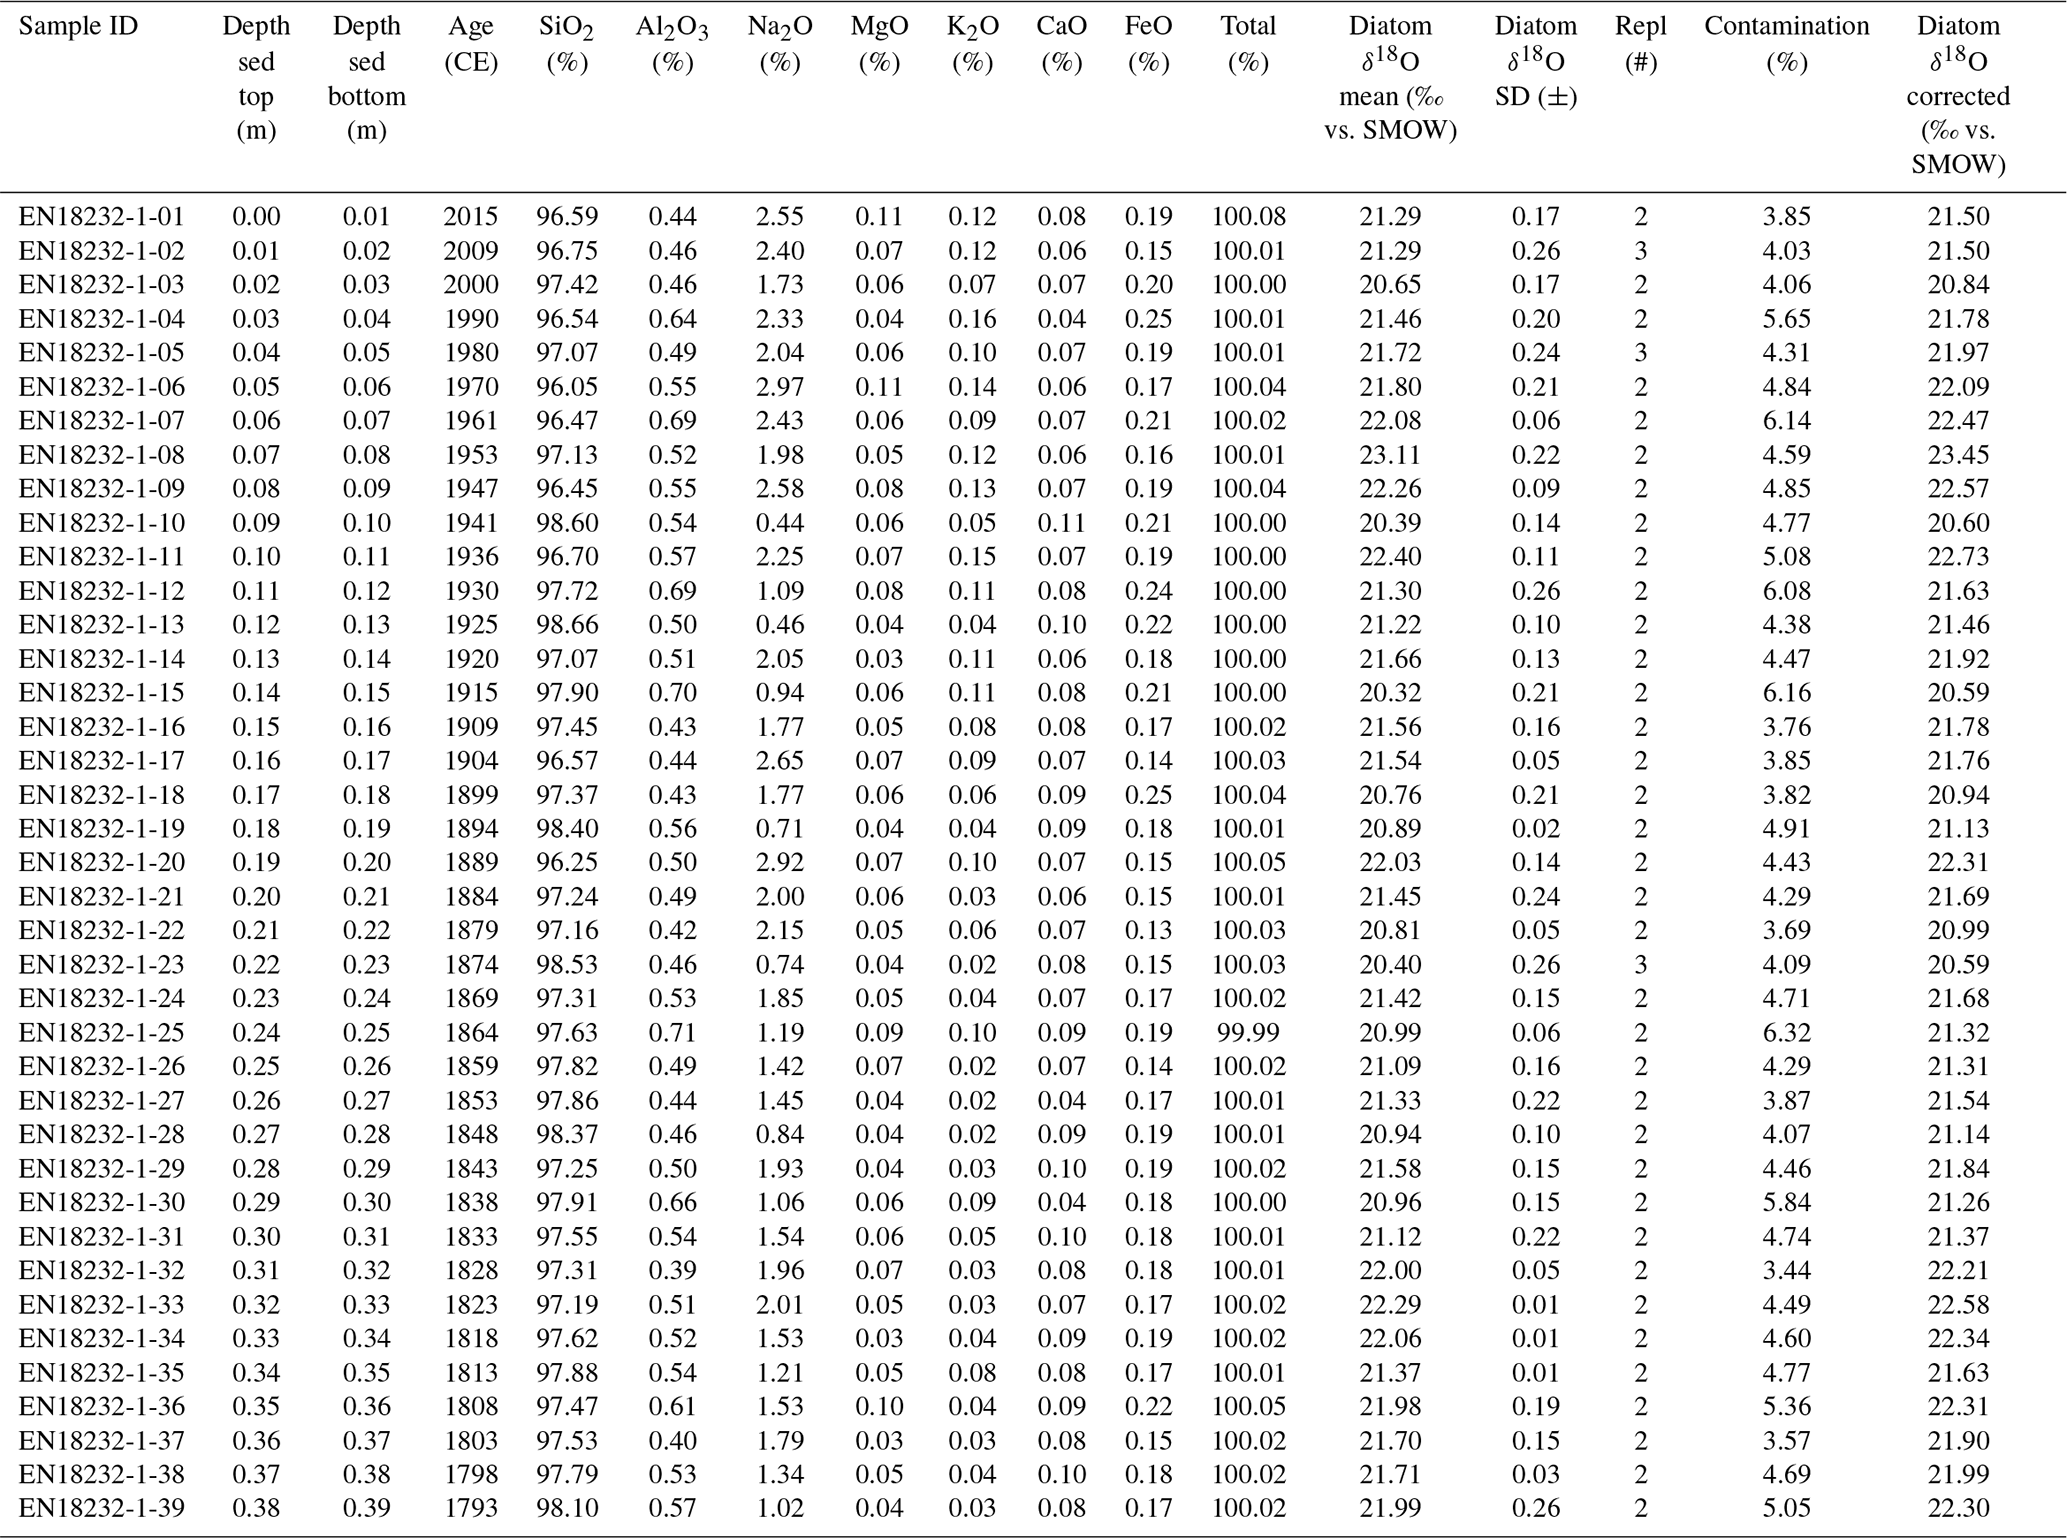
A contamination assessment of all processed samples (n=39) was carried out by a JEOL M-IT500HR analytical scanning electron microscope (SEM) with an integrated energy-dispersive X-ray spectroscopy (EDS) system supplied with a Peltier-element-cooled detector (SDD). The standardless procedure was used according to Chapligin et al. (2012a) (six repetitions, an acceleration voltage of 20.0 kV, a magnification of 300 and a measuring time of 30 s). Detected elements are given as oxides with weight percentages. The SiO2 content indicates the purity of the processed sample, whereas Al2O3 is used as an indicator of contamination with clay fractions. The latter should be below 2.5 % to avoid excessive shifts in the δ18Odiatom record due to the contamination correction (Chapligin et al., 2012a). All 39 samples were highly purified for δ18O measurements and had Al2O3 contents ranging between 0.4 % and 0.7 % and SiO2 contents of 96.1 % to 98.7 %. EDS results, including the two oxides, are given in the appendices (Table A1).
Before isotope measurement, aliquots of the processed sample material were heated up at 1100 °C by ramp degassing under a helium flow to remove the exchangeable hydroxyl groups of the siliceous diatom cell walls by applying the inert gas flow dehydration method (iGFD; Chapligin et al., 2010). The oxygen isotope composition of the samples (n=39; contaminants, n=3) was measured at the ISOLAB Facility at AWI Potsdam with a semi-automated laser-fluorination line (Chapligin et al., 2010) combined with a Sercon HS2022 mass spectrometer. The laser fluorination method uses bromine pentafluoride (BrF5) as a reagent to completely release oxygen (Clayton and Mayeda, 1963).
The oxygen isotope composition was directly measured against a reference material of known isotopic composition given in delta notation (δ18O) relative to VSMOW in per mille (‰). We used the laboratory standards PS Jun17 (δ18O = +43.61 ‰ ± 0.16 ‰, n=13) and BFC 1 (δ18O = +28.92 ‰ ± 0.08 ‰, n=19), which were calibrated against the marine standard PS1772-8 (Chapligin et al., 2010, 2011) and the standard biogenic silica (BFC; Chapligin et al., 2011), respectively. All samples were measured twice, and some of them were measured three times. The analytical reproducibility of the sample material was ≤0.26 ‰, indicating an accuracy and analytical precision comparable to the method's long-term analytical reproducibility (1σ) of ±0.25 ‰ (Chapligin et al., 2010).
All δ18O measurements (δ18Omeas) were contamination corrected (δ18Ocorr) following a geochemical mass-balance approach (Brewer et al., 2008; Swann and Leng, 2009; Chapligin et al., 2012a):
where δ18Ocont represents the average δ18O value of three samples of the heavy minerogenic fraction from the first heavy liquid separation of >2.50 g cm−3 (δ18Ocont = +16.1 ± 0.40 ‰, n=3), assumed to have 100 % contamination. The percentages of contamination (ccont) were calculated by dividing the individual Al2O3 content of each sample by the mean Al2O3 content of contaminants (11.3±0.39 % Al2O3, n=3) obtained using the EDS results, where cdiatom gives the degree of purity (100 % − ccont).
In order to increase comparability and to detect the impact of hydroclimate variability within the δ18Odiatom record, the isotope values were standardised. Therefore, the z-scores of each δ18Odiatom value were calculated by subtracting the overall mean and dividing it by the standard deviation of the time series.
3.5 Other lake internal proxies
The inorganic carbon (TIC) content was determined for all 39 subsamples to analyse it as a possible proxy for sediment supply from the carbonate-bearing bedrock in the catchment, as outlined in Lenz et al. (2021). Prior to the measurements, freeze-dried aliquots were milled to gain a homogeneous material. TIC was measured by using an Elementar soli TOC cube. The measurement accuracy was ±0.1 %. To detect possible heavy metal pollution within the sediment record, the total mercury concentration (THg) was quantified in each subsample. THg (given in µg kg−1) was measured with a MLS-MWS DMA-80 evo III at the Permafrost Carbon and Nitrogen Lab (CarLa) at AWI Potsdam. The machine detection limit was 0.003 ng, with a laboratory-proven limit of determination of 0.4 ng. Furthermore, mercury concentrations were converted into fluxes (HgAR, µg m−2 a−1) by following the procedure described in detail in Biskaborn et al. (2023). The sedimentation rates (SR in cm a−1) were calculated using the age–depth model results according to Eq. (2) (Pfalz et al., 2022), where xi is the sample depth of interest and xi−1 is the depth of the previous layer:
Subsequently, the mass accumulation rate (MAR in g cm−2 a−1) was computed by using following equation (Eq. 3), where DBD is the dry bulk density (in g cm−3):
We used the mean dry bulk density value here to calculate the mercury accumulation rate HgAR in µg m−2 a−1:
4.1 Water isotopes of Lake Khamra
Water, ice and snow isotope data sampled during the two field campaigns are shown in a δ18O–δD diagram in Fig. 3a. According to the surface water sample collected in summer 2018, δ18Olake has a value of −21.16 ‰, a δDlake of −165.3 ‰ and a d excess of +4.1 ‰ (n=1). The water sample has a pH of 6.07. In March 2020, δ18Olake had a mean of −19.98 ‰ ± 0.14 ‰, a δDlake of −159.3 ‰ ± 0.7 ‰ and a d excess of +0.5 ‰ ± 0.5 ‰ (n=6), which is isotopically enriched in comparison to the isotope values from 2018. δ18Olake reveals only small variations of ±0.35 ‰ within the water profile, with continuous depletion towards the bottom water (see Fig. 3b). The lake water temperature (Tlake) below the ice cover is quite low, varying from a minimum of 2 to 2.7 °C downwards (Fig. 3c). All measurements are listed in Table 1.
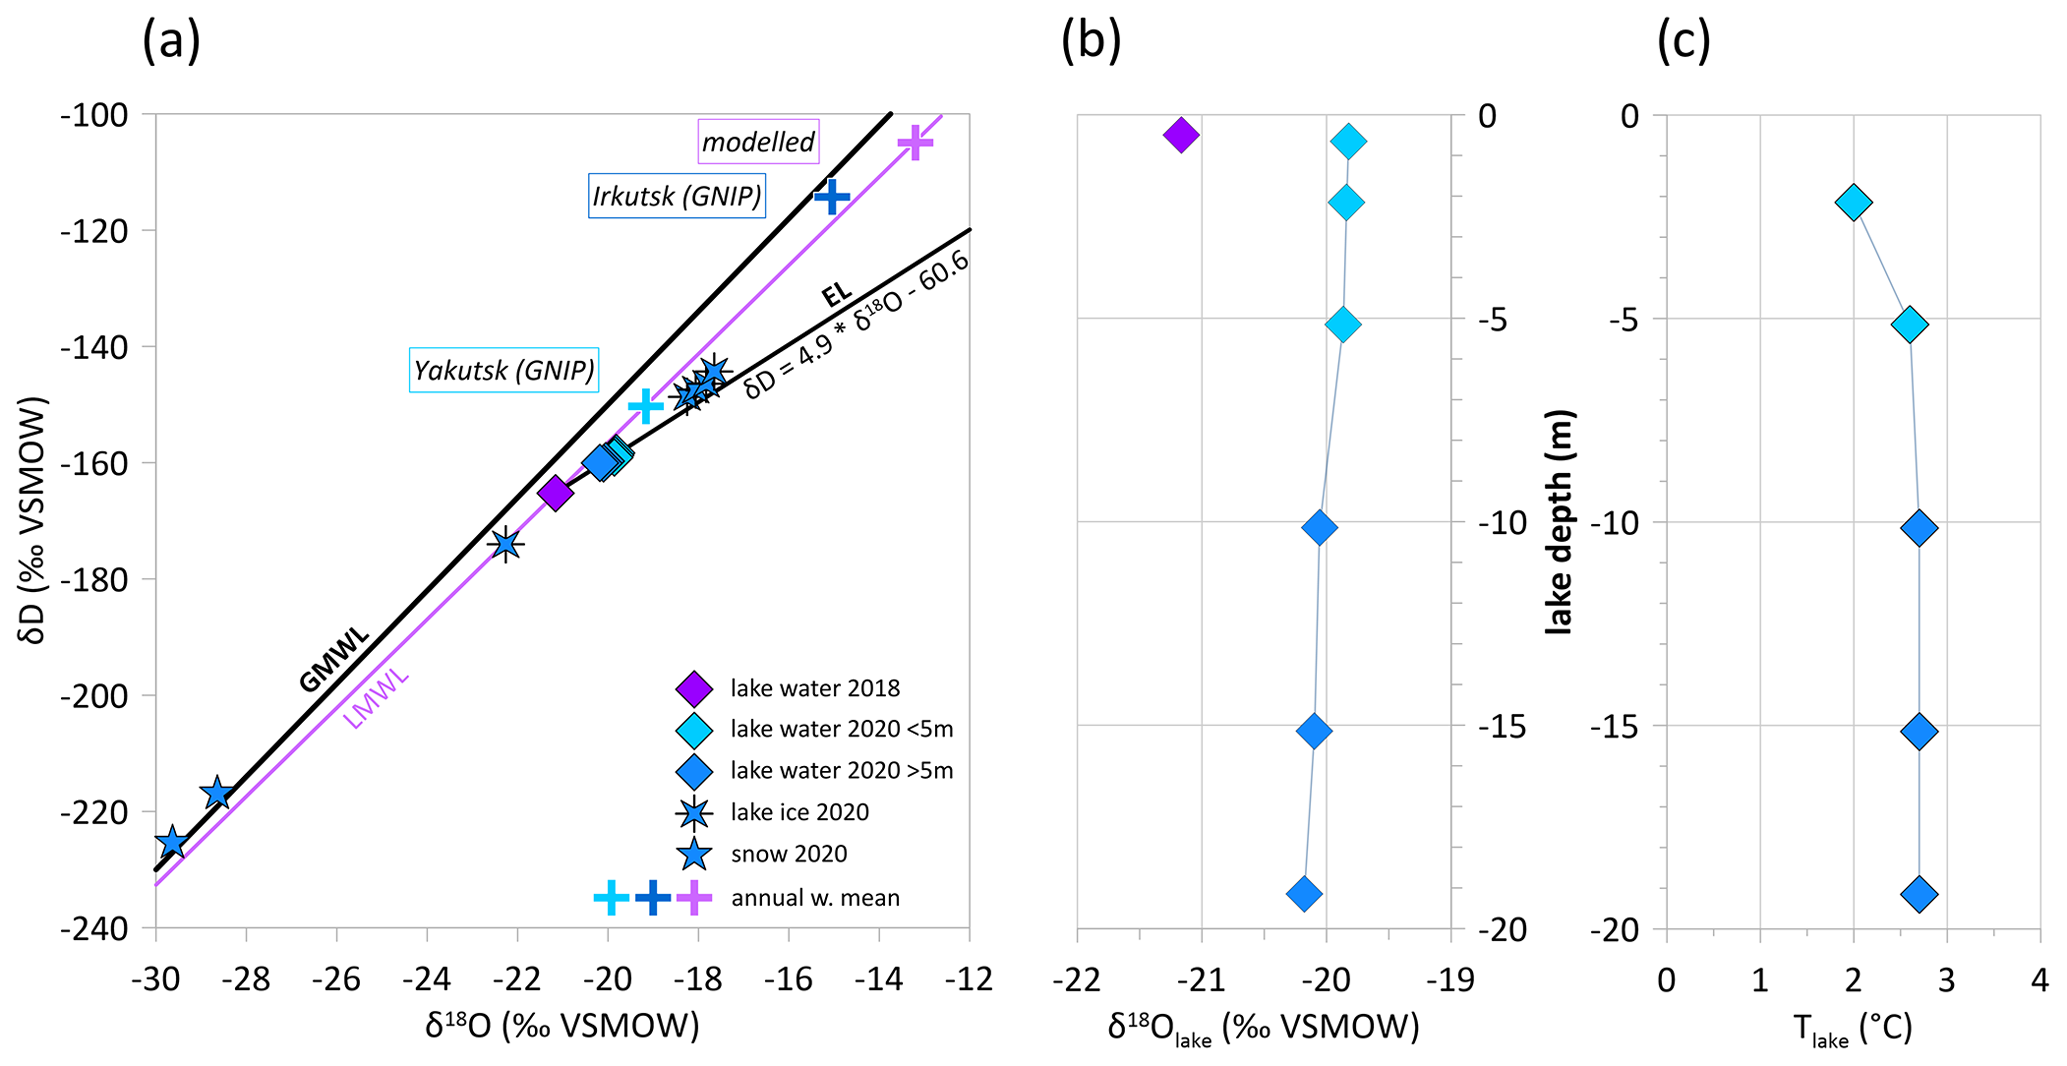
Figure 3(a) Co-isotope plot (δ18O–δD) of lake water, ice and snow samples taken during the two field campaigns in August 2018 and March 2020 in relation to the GMWL (Craig, 1961) and the LMWL according to the modelled monthly mean values. Annual weighted mean values of precipitation modelled for the region (Bowen and Revenaugh, 2003; Bowen et al., 2005; Bowen, 2023; IAEA/WMO, 2023) and from the GNIP stations in Yakutsk and Irkutsk (IAEA/WMO, 2023) are marked as crosses. The intercept point between the local evaporation line (EL) and the modelled LMWL is at δ18O −20.9 ‰ and δD −164.0 ‰. (b) δ18O of a water-depth profile of Lake Khamra, sampled below the lake ice in March 2020. (c) Tlake of the water-depth profile, taken below ice cover in March 2020.
Table 1Water, ice and snow samples from Lake Khamra received in August 2018 and March 2020. The water temperature, measured in August 2018, is probably incorrect and not used further for interpretation. The conductivity of the water sample EN18232 is given in µS cm−1; the conductivities of the water samples collected in March 2020 are measured in mg L−1.
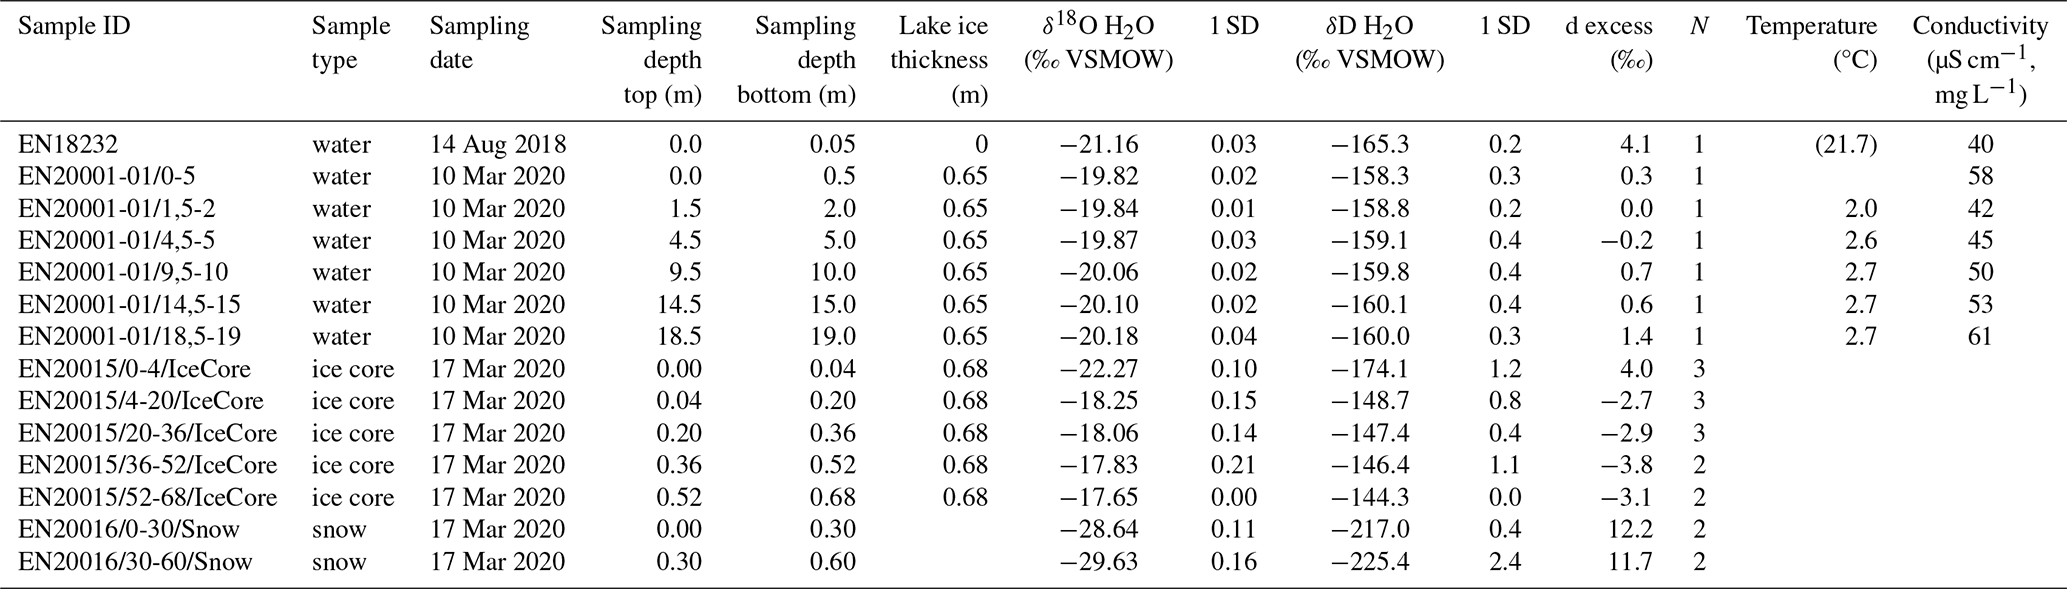
The ice cover of the lake, which had a total thickness of 0.68 m, was sampled in five segments in March 2020 (see Table 1). The δ18O values vary by ±4.6 ‰, with the minimum of −22.3 ‰ occurring at the surface and the maximum of −17.7 ‰ occurring at the transition from ice to water. δD ranges from −174.1 ‰ at the top to −144.3 ‰ at the bottom. This results in a positive d excess value of +4.0 ‰ in the upper ice sample and negative d excess values dropping down to −3.8 ‰ in the lower samples. The snow samples, which were collected close to the lakeshore, reveal the lowest δ18O values (with a mean of −29.14 ‰), a δD of −221.2 ‰ and a d excess of +11.9 ‰. In comparison to the GMWL (Craig, 1961), only the snow samples lie slightly above the GMWL, with all water and ice samples of Lake Khamra lying slightly below the GMWL and below or along the modelled LMWL of monthly values (Fig. 3a; Bowen et al., 2005; Bowen, 2023; IAEA/WMO, 2023). The modelled annual mean for the region (δ18O: −13.2 ‰, δD: −105 ‰; Bowen and Revenaugh, 2003; Bowen, 2023; IAEA/WMO, 2023) is offset from the measurement results, lying towards more enriched values (Fig. 3a).
4.2 Age–depth model
The sample material appeared very uniform in colour during sampling, without visible stratifications. The dry bulk density of the short core EN18232-1 is variable, which is likely a result of the high and fluctuating water content (82 %–94 %, n=24), especially in the upper part of the short core. Therefore, we determined a mean dry bulk density (122±35 mg cm−3, n=38). The homogeneity of the sample material is visible in the results of the 210Pb and 137Cs dating, which imply relatively uniform accumulation at this site and a relatively uniform volumetric sedimentation rate of around 0.19 cm yr−1, with slightly lower values since the 1950s (Peter Appleby, personal communication, 2022) – visible in a slight flattening of the age–depth model in Fig. 4. According to the age–depth model based on the 210Pb and 137Cs dating, the short core, with a total length of 39 cm, spans a period of 222 years (ca. 2015–1793 CE, mean ages). Hence, the mean sampling resolution of the record is sub-decadal: 5.7±1.7 years (min: 2, max: 10 years).
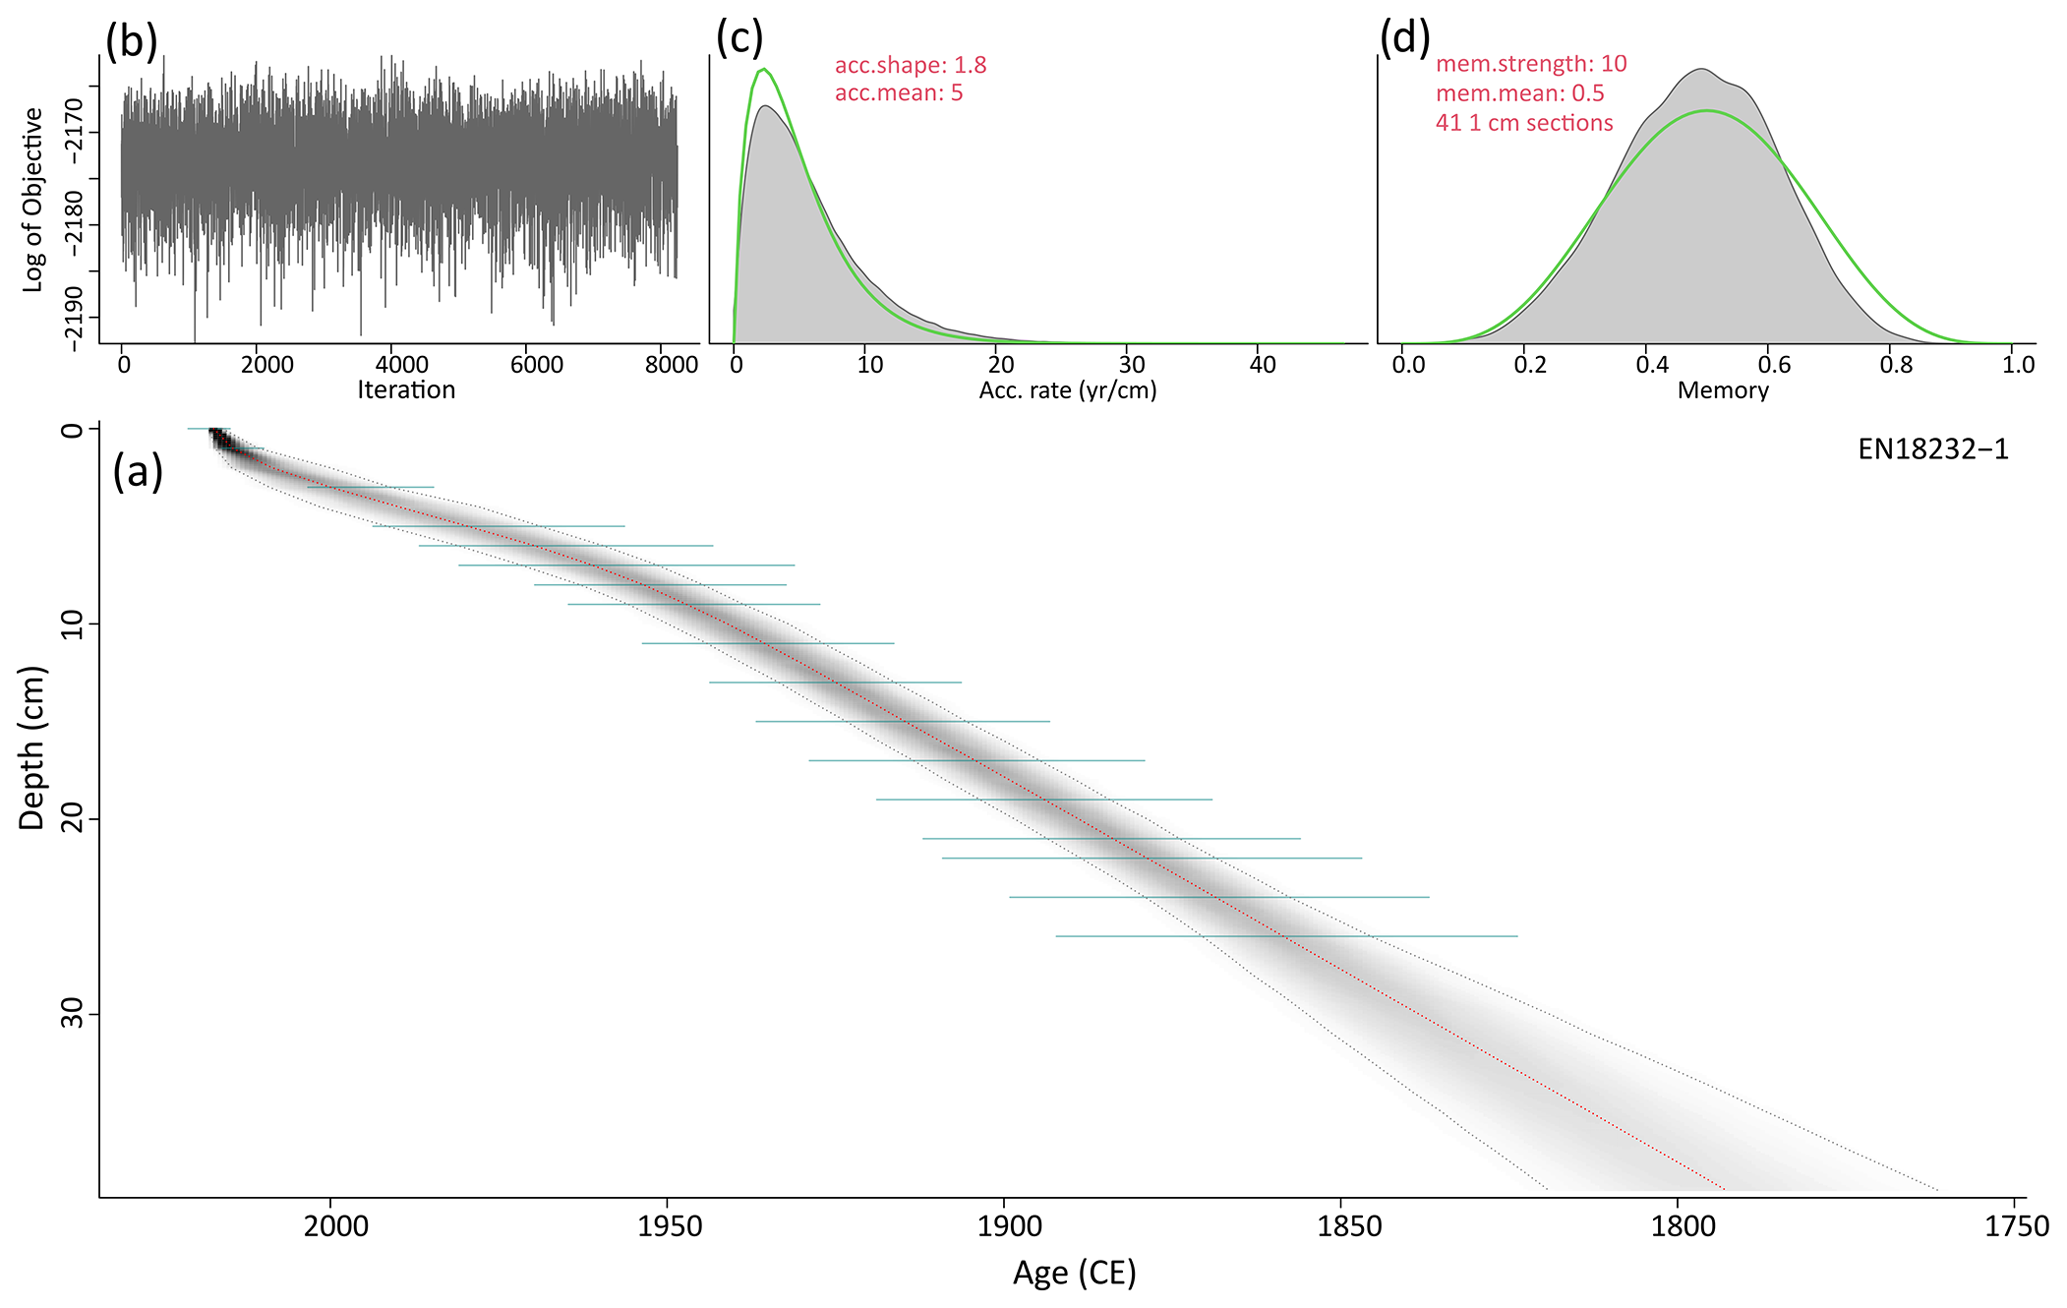
Figure 4(a) Bayesian accumulation model obtained by applying the R package “rbacon” (Blaauw and Christen, 2011) and based on the 210Pb and 137Cs dating (green lines) of the short core EN18232-1 (grey lines indicate the 2σ range; red line indicates the median). (b) Model iteration log. (c, d) Prior (green line) and posterior (grey area) distributions for accumulation rate and memory, respectively.
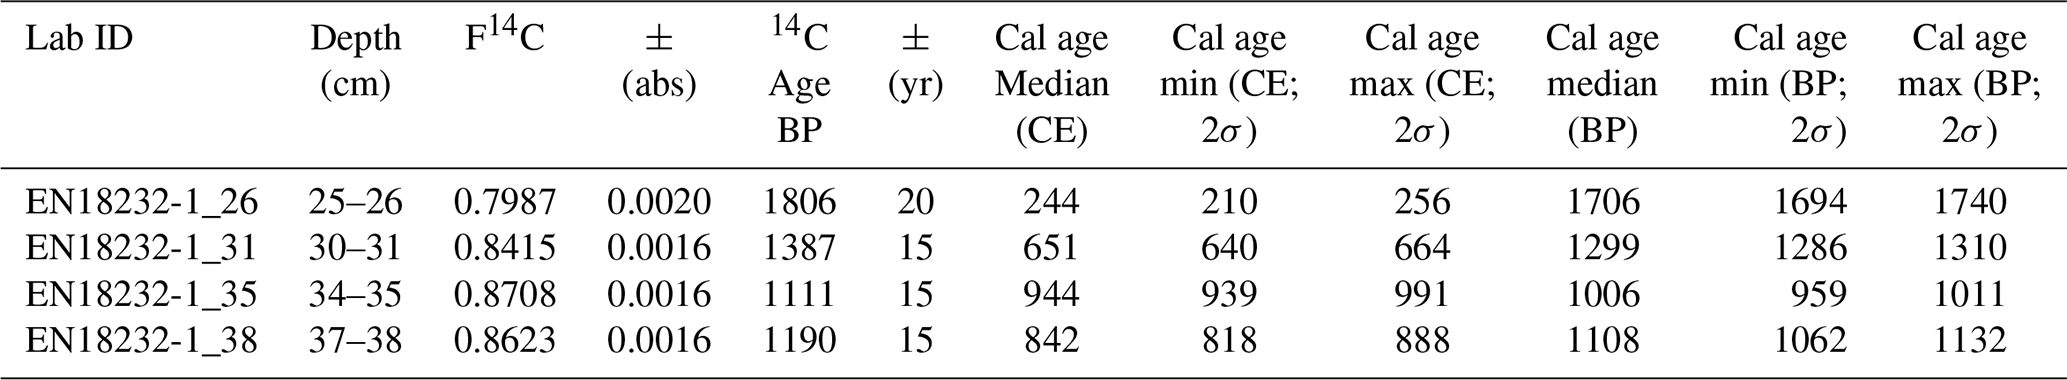
The four 14C ages of the bulk sediment show a clear offset with respect to the 210Pb and 137Cs chronology, with significantly older ages that nearly get progressively younger with depth (see Table 2). Comparing two dating results for the same sample depth (25–26 cm), we obtain a 14C age of 1806±20 14C yr BP (before present), which corresponds to a calibrated 14C age of 244 calibrated CE (2σ range: 210–256). The same sample was dated by the 210Pb and 137Cs method and received an age of 1858 CE ± 11, resulting in an offset of 1614 years. A comparable large age difference in surface samples was observed in another study at Lake Khamra (Glückler et al., 2021) that used macrofossil as well as bulk sediment samples to retrieve 14C ages. Possible reasons were discussed, such as an influence of dissolved carbonates (the so-called hard-water effect; Björck and Wohlfarth, 2001; Philippsen, 2013), input of old organic carbon (Colman et al., 1996; Vyse et al., 2020) or mixing processes within the sediment (Biskaborn et al., 2012), which could have led to discontinuous 14C age development with depth. At Lake Khamra, very old macrofossils can be transported into the lake and could possibly influence the radiocarbon age within the bulk sediment (Glückler et al., 2021). The origin of old carbon from eroding permafrost cannot be ruled out either, as the area lies in a sporadic permafrost zone (Brown et al., 1997; Fedorov et al., 2018). Additionally, inorganic carbon can be transported into the lake by the main inflow, as the catchment contains early Palaeozoic carbonates (Chelnokova et al., 1988; Glückler et al., 2021). Large age uncertainties make it very difficult to use 14C ages for records covering the last few hundred years (Björck and Wohlfarth, 2001). Since the old and non-continuous 14C ages are not consistent with the homogeneous and high-resolution 210Pb and 137Cs dating results, the 14C dating results are excluded from the age–depth model.
Table 2Results for the 14C ages of the bulk sediment samples EN18232-1.
4.3 δ18Odiatom record
The diatom δ18O record of Lake Khamra (EN18232-1) covers approximately the last 220 years (ca. 2015–1790 CE, mean ages; n=39). δ18Odiatom has an overall mean of +21.7 ‰, it varies by ±2.8 ‰ and it has a standard deviation of ±0.6 ‰. The absolute minimum is +20.6 ‰, which occurs at about 1940 CE, 1915 CE and 1875 CE. The absolute maximum of +23.4 ‰ occurs at circa 1955 CE. Contamination correction increased all measured δ18O values by a mean of +0.3 ‰, with a narrow range of between +0.2 ‰ and +0.4 ‰ (Fig. 5). This indicates a very low degree of contamination after cleaning and a low correction overall that is within or close to the analytical error of ±0.25 ‰. The trends before and after contamination correction are identical (−0.0006; n=39), which implies uniformly prepared sample material where the correction has no (significant) effect on the course of the record. All descriptions refer to the corrected values (referred to as δ18Odiatom).
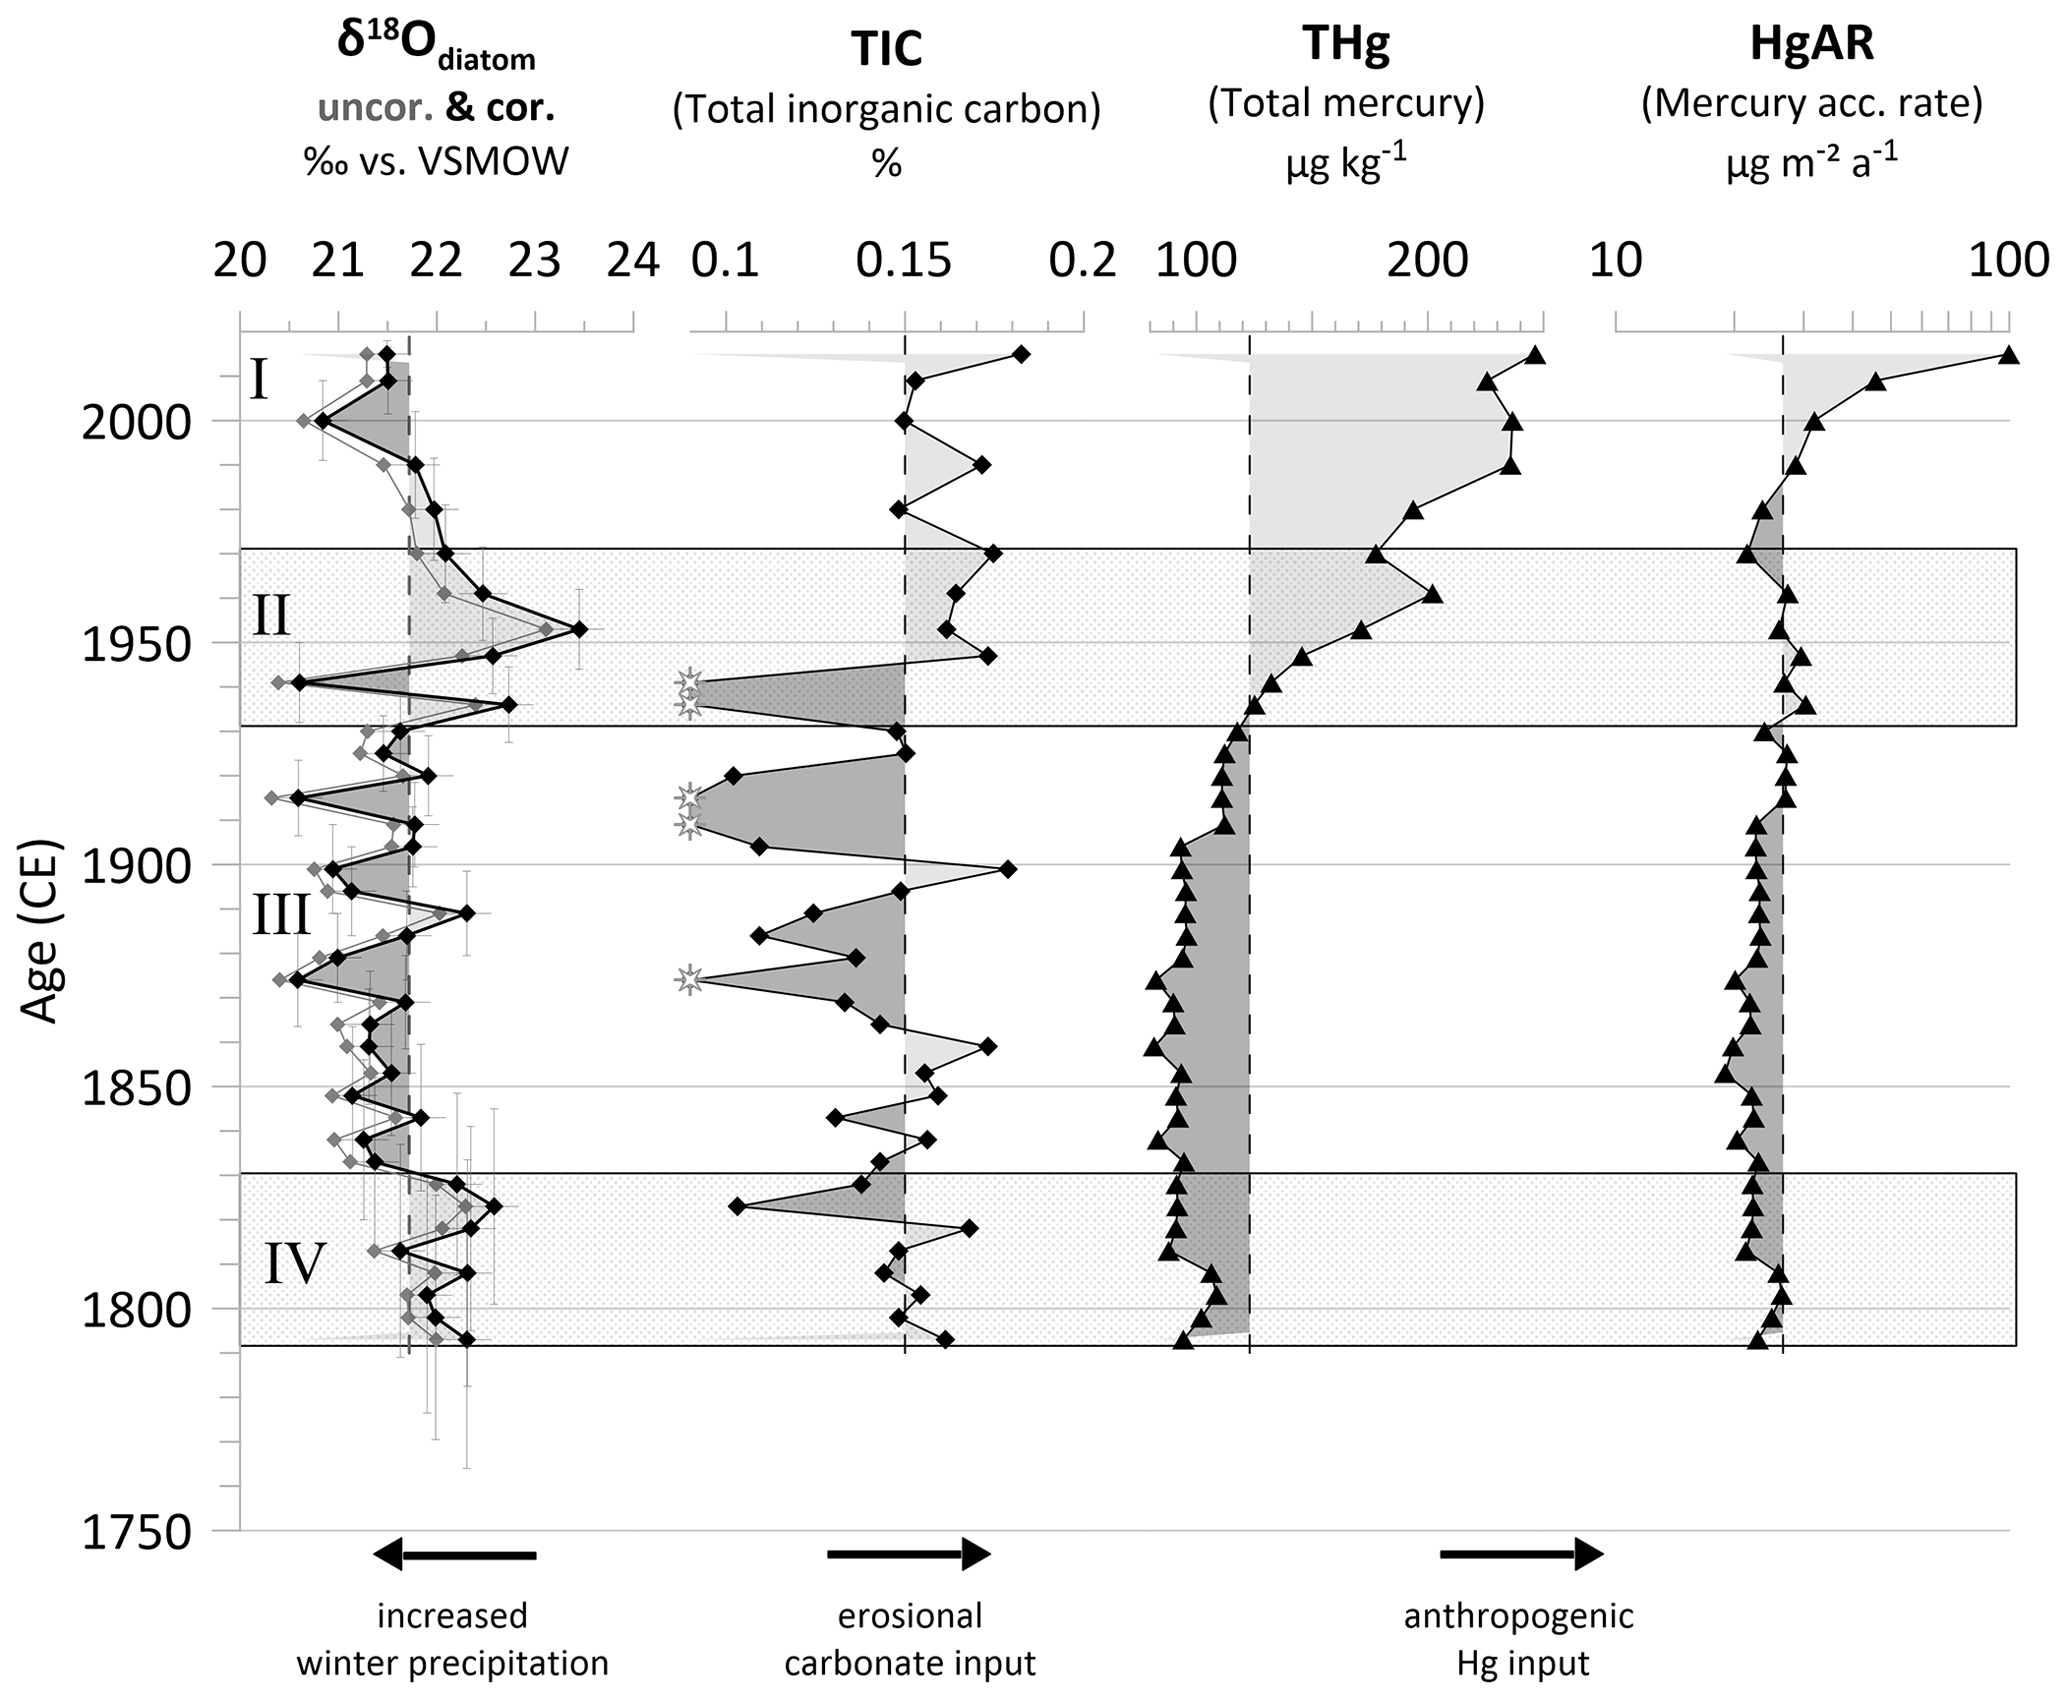
Figure 5Lake internal proxy records of the short core EN18232-1 from Lake Khamra. I–IV indicate the four phases according to the δ18Odiatom record. Diatom δ18O: measured δ18Odiatom (grey line) and contamination-corrected δ18Odiatom values (black line) are shown with analytical and chronological errors. Geochemical records: white stars for the total inorganic carbon (TIC) indicate values below the detection limit; mercury measurements are given in total mercury (THg, in µg kg−1) and converted into accumulation rates (HgAR, in µg m−2 a−1). The individual mean values are displayed as vertical dashed lines. Arrows indicate a possible interpretation of the proxy.
4.3.1 Phases of the Lake Khamra δ18Odiatom record
We identify four phases (I–IV) into which the δ18Odiatom time series for Lake Khamra is subdivided (Fig. 5). This differentiation from top to bottom of the core is mainly based on the deviation from the overall mean δ18Odiatom value of +21.7 ‰. The description of phases begins with the most recent segment of the core and progresses towards the older sections, as the following discussion first validates the youngest part of the record with meteorological data.
Phase I (2015–1970 CE, n=5)
In the most recent phase, phase I, δ18Odiatom of Lake Khamra shows values that are mostly below the overall mean, with a low variability of ±1.2 ‰, a mean of +21.5 ‰ and a standard deviation of ±0.4 ‰. The main characteristics are a continuous decrease since ca. 1970 CE with a clear minimum at ca. 2000 CE (Fig. 5). From 2000 CE, δ18Odiatom increases slightly but still remains below the absolute mean value.
Phase II (1970–1930 CE, n=6)
In contrast to phase I, δ18Odiatom values in phase II are enriched in heavy isotopes above the overall mean, with the absolute maximum (+23.4 ‰) occurring around 1950 CE and only one depleted value, a minimum, occurring at about 1940 CE (+20.6 ‰). This results in the largest variability, ±2.8 ‰, of the entire δ18Odiatom record, a clearly elevated mean value of +22.3 ‰ and a standard deviation of ±1 ‰. The maximum reaches a z-score of +2.7, while the minimum has a negative score of −1.8.
Phase III (1930–1830 CE, n=20)
Phase III consists of depleted δ18Odiatom values, mainly below the overall mean. It begins rather abruptly around 1830 CE and persists until around 1930 CE, and values vary by ±1.7 ‰. It is the longest phase of the diatom record (ca. 100 years), has the lowest mean value of all the phases (+21.4 ‰) and includes two absolute minima (+20.6 ‰ at ca. 1915 CE and 1875 CE), each with a z-score of −1.8. The standard deviation is comparable to phase I (±0.4 ‰).
Phase IV (1830–1790 CE, n=8)
Phase IV of the Khamra record is characterised by notably enriched δ18Odiatom values that are primarily above the absolute mean. The internal mean of +22.2 ‰ is similar to phase II but less pronounced, with a variability of ±1 ‰ and a standard deviation of only ±0.3 ‰ (Fig. 5).
4.4 Carbon and mercury concentrations (TIC, THg, HgAR)
From the onset of the record at about 1790 CE to the 1950s, TIC measurements remain constant at or slightly below the overall mean of 0.15 % (Fig. 5). At ca. 1875 CE, 1910 CE and 1940 CE, five samples are below the detection limit of <0.1 %. At about 1950 CE, TIC switches to above-mean values, reaching a maximum of 0.18 % in the uppermost sample.
THg shows a drastic increase, with a tripling of the mercury concentrations in recent times (Fig. 5). All values are above the detection limit of 0.003 ng. At the beginning of the record until around 1920 CE, THg values fluctuate slightly between the minimum of 82 and 111 µg kg−1, below the mean of 123 µg kg−1. From ca. 1930 CE, THg rises nearly continuously, reaching a maximum of 246 µg kg−1 in the topmost sample. The mercury accumulation rates have a mean of 26.6 µg m−2 a−1 (18.9–99.8 µg m−2 a−1). In the lower part of the short core, HgAR remains below or at the mean values (Fig. 5). Between about 1930 CE and 1950 CE, HgAR increases slightly above the mean before falling below the mean around the 1970s. After that, we observe a drastic increase to the maximum value of 99.8 µg m−2 a−1 in the youngest sample.
5.1 Modern lake hydrology and isotopic signature of precipitation
The interpretation of the oxygen isotope record of lacustrine diatom silica (δ18Odiatom) requires careful consideration of the current hydrological conditions of the respective study site (Leng and Barker, 2006). δ18Odiatom is influenced directly and indirectly by various depleting and enriching factors, as summarised in Meister et al. (2024). Besides the lake water temperature (Tlake), the oxygen isotope composition (δ18Olake) and its sensitivity to evaporation also affect the δ18Odiatom signal. The water residence time of Lake Khamra has been modelled as about 1 year and 3 months (474 d; Messager et al., 2016), which implies nearly annual exchange of the lake water and hence the possibility of only seasonal evaporative effects. The water-depth profile, taken below the spring ice cover, confirms a well-mixed water column with only slight variations in δ18Olake (±0.3 ‰) and no thermocline, at least in March 2020 (Fig. 3b and c). Lake Khamra is an open lake system with an outflow in the north-east (see Map Fig. 1b). In open lake systems, δ18Olake generally mirrors the oxygen isotope signal of precipitation (δ18Oprec), including the local precipitation intermittency (Leng and Barker, 2006). We compare δ18Olake to δ18Oprec data from the nearest GNIP stations in Yakutsk and Irkutsk (Fig. 1a). The recent mean δ18Olake of −20.0 ‰ (March 2020) at Lake Khamra is closest to the long-term annual weighted mean δ18Oprec at Yakutsk (Fig. 3a) but is more depleted overall compared to Yakutsk, Irkutsk and the modelled annual mean δ18Oprec (Fig. 3a). Consequently, the offset of δ18Olake towards a depleted isotope composition indicates that the water of Lake Khamra is strongly influenced by isotopically light precipitation – likely snow or snowmelt originating during the cold winter months (Fig. 2). The similarity of the δ18Olake to Yakutsk (Fig. 3a) might be explained by the fact that the monthly mean values of δ18Oprec measured in Yakutsk were lower overall compared to Irkutsk and the regional modelled data (Fig. 2). δ18Oprec is temperature dependent and its global mean increases with rising air temperatures (Tair) by +0.7 ‰ per °C (Dansgaard, 1964). This reveals that Yakutsk has colder annual mean temperatures compared to Vitim and Irkutsk (−9.3 °C, 1929–2018 CE, Yakutsk, ECA station code: 3214), which can be ascribed to its more northerly position (Fig. 1a), and thus Yakutsk has the most depleted δ18Oprec (Dansgaard, 1964).
The Khamra δ18Olake measurements plot below the GMWL (Fig. 3a), and the water samples measured in March 2020 even plot slightly below the modelled LMWL (Fig. 3a), indicating potential evaporation effects at this site. The water samples taken in August and in March show a linear correlation with a slope of 4.9 and an intercept of −60.6 ‰ (n=7, R2=0.99), which can be interpreted as an evaporation line (EL; Fig. 3a) comparable with the local ELs of central Yakutian lakes (slope = 4.99; n=39, R2=0.95; Wetterich et al., 2008). The intersection point of the EL with the modelled LMWL (δ18O: −20.9 ‰, δD: −164.0 ‰) is assumed to reflect the δ18O of the mean influx to the lake and is nearly identical to the δ18Olake measurement from August 2018 (δ18Olake: −21.2 ‰, δDlake: −165.3 ‰). This suggests that the August δ18Olake sample has a clear precipitation signal and evaporation effects are negligible, as supported by its very low conductivity of 40 µS cm−1 (Table 1). However, the δ18Olake value measured in August 2018 is strongly depleted (Fig. 3a) and corresponds to a modelled monthly mean value of precipitation between November and December (Fig. 2). Since there only one water sample was measured in summer 2018 and the difference of 1.2 ‰ from the water samples in March 2020 is low, this single data point should be interpreted with caution. However, in summer, an isotopically heavier δ18Olake value would be expected due to higher summer temperatures, potential evaporation effects and the clear seasonality with enriched δ18Oprec in the summer months (Fig. 2). Hence, the inflow of meltwater from either snow and/or glaciers in the catchment, which is isotopically light water, could lower δ18Olake, as seen in other studies in Eurasia (Mackay et al., 2013; Meyer et al., 2015, 2022; Kostrova et al., 2021). Lake Khamra lies at a relatively low altitude of 340 m a.s.l. and there are no glaciers in its catchment that could be responsible for the depleted meltwater input. We know from an expedition report (Biskaborn et al., 2021a) that a lot of snow can accumulate in this area, as observed in March 2020. These snow samples reveal the lowest isotope composition of all analysed samples (Table 1). Therefore, enhanced snow meltwater input could lead to an isotopic depletion of the lake water, which can apparently last until the summer months.
5.2 Drivers of δ18Odiatom
Different factors determine the isotopic signature of diatom shells (Leng and Barker, 2006; Meister et al., 2024). It is directly controlled by Tlake and δ18Olake during biosynthesis (Moschen et al., 2005; Dodd and Sharp, 2010). Leclerc and Labeyrie (1987) developed an equation based on the temperature-dependent fractionation between water and biogenic silica that can be used to reconstruct the water temperature conditions that prevailed during diatom shell formation. Applying Eq. (5) below, we use the recent measured δ18Odiatom = +21.5 ‰ and the mean δ18Olake = −20.0 ‰, measured in March 2020, to calculate a water–silica isotope fractionation factor of :
(Leclerc and Labeyrie, 1987).
The following isotope fractionation correlation, Eq. (6), between fossil diatom silica and water is then obtained:
(Leclerc and Labeyrie, 1987).
We derive a Tlake of +8.7 °C, which is substantially higher than the mean Tlake of +2.5 °C measured in March 2020 below the ice. Calculating Tlake from the δ18Olake of −21.16 ‰ as measured in August 2018 (), we derive a temperature of +4.8 °C. The calculated water temperature range (+4.8 to +8.7 °C) seems to be realistic for the early summer months when the ice cover of Lake Khamra starts to melt (May is the first month in which monthly mean Tair>0 °C, 1928–2019 CE, Vitim, Fig. 2). Further analyses of the short core EN18232-1 are of diatom assemblages, which will be the focus of a follow-up study and are therefore not included here. Overall, the planktonic diatom genus Aulacoseira (Thwaites) is by far the most abundant and consists mainly of the planktonic species Aulacoseira subarctica (O. Müller), for which the growth conditions (Gibson et al., 2003) agree very well with the reconstructed water temperature range. It is assumed that in lake systems, the effect of diatom species-dependent isotope fractionation, the so-called vital effect, is negligible (Shemesh and Peteet, 1998; Rosqvist et al., 1999; Shemesh et al., 2001; Leng and Barker, 2006; Chapligin et al., 2012b). Since the genus Aulacoseira builds up heavy and highly silicified diatom frustules (Laing and Smol, 2003), it likely also dominates the diatom biomass and hence the isotopic signal. Using Eq. (6) with δ18Olake and Tlake measured in March 2020, we can calculate an expected recent δ18Odiatom of +23.4 ‰. The calculated δ18Odiatom is enriched by +1.9 ‰ compared to the actual measured surface δ18Odiatom value (+21.5 ‰), likely due to the very low water temperature measured in March, which probably does not correspond to the diatom growth temperature, as discussed above. Nevertheless, as the reconstructed water temperature aligns with the dominant diatom species, the δ18Odiatom record of Lake Khamra is generally assumed to be suitable for palaeoclimate reconstructions.
Globally, Tair and δ18Oprec have a positive fractionation coefficient of +0.7 ‰ per °C (Dansgaard, 1964), which compensates for the fractionation of biosynthesis between Tlake and δ18Olake (−0.2 ‰ per °C, Moschen et al., 2005; Dodd and Sharp, 2010). As a consequence, Tair has a stronger effect on δ18Oprec (linked with δ18Olake at Lake Khamra) and therefore δ18Odiatom than Tlake. This tendency is visible in other δ18Odiatom studies of the Northern Hemisphere (Meyer et al., 2015; Chapligin et al., 2016; Broadman et al., 2022). The fractionation coefficient is significantly higher (+0.81 ‰ per °C) than the global coefficient when using the monthly average Tair values of the weather station in Vitim and the monthly modelled δ18Oprec values (n=12) for the region (Bowen et al., 2005; Bowen, 2023; IAEA/WMO, 2023). The distinct seasonality of δ18Oprec highlights its strong Tair dependency in the Lake Khamra region, given the high annual Tair range of 47 °C (Fig. 2). Therefore, we conclude that the Tair-dependent fractionation of precipitation dominates over the fractionation due to biosynthesis; hence, Tair has a stronger effect on the δ18Odiatom record, and its variations rather than Tlake shape palaeoclimate trends.
5.3 Comparison of δ18Odiatom with meteorological data since 1930 CE, including lake internal proxies
The comparison of the diatom isotope record with meteorological data from Vitim, starting in the 1930s (Fig. 6), enables the validation of the variability of the δ18Odiatom record based on factors such as Tair, evaporation, precipitation and seasonality, at least in the upper part of the record (phases I and II).
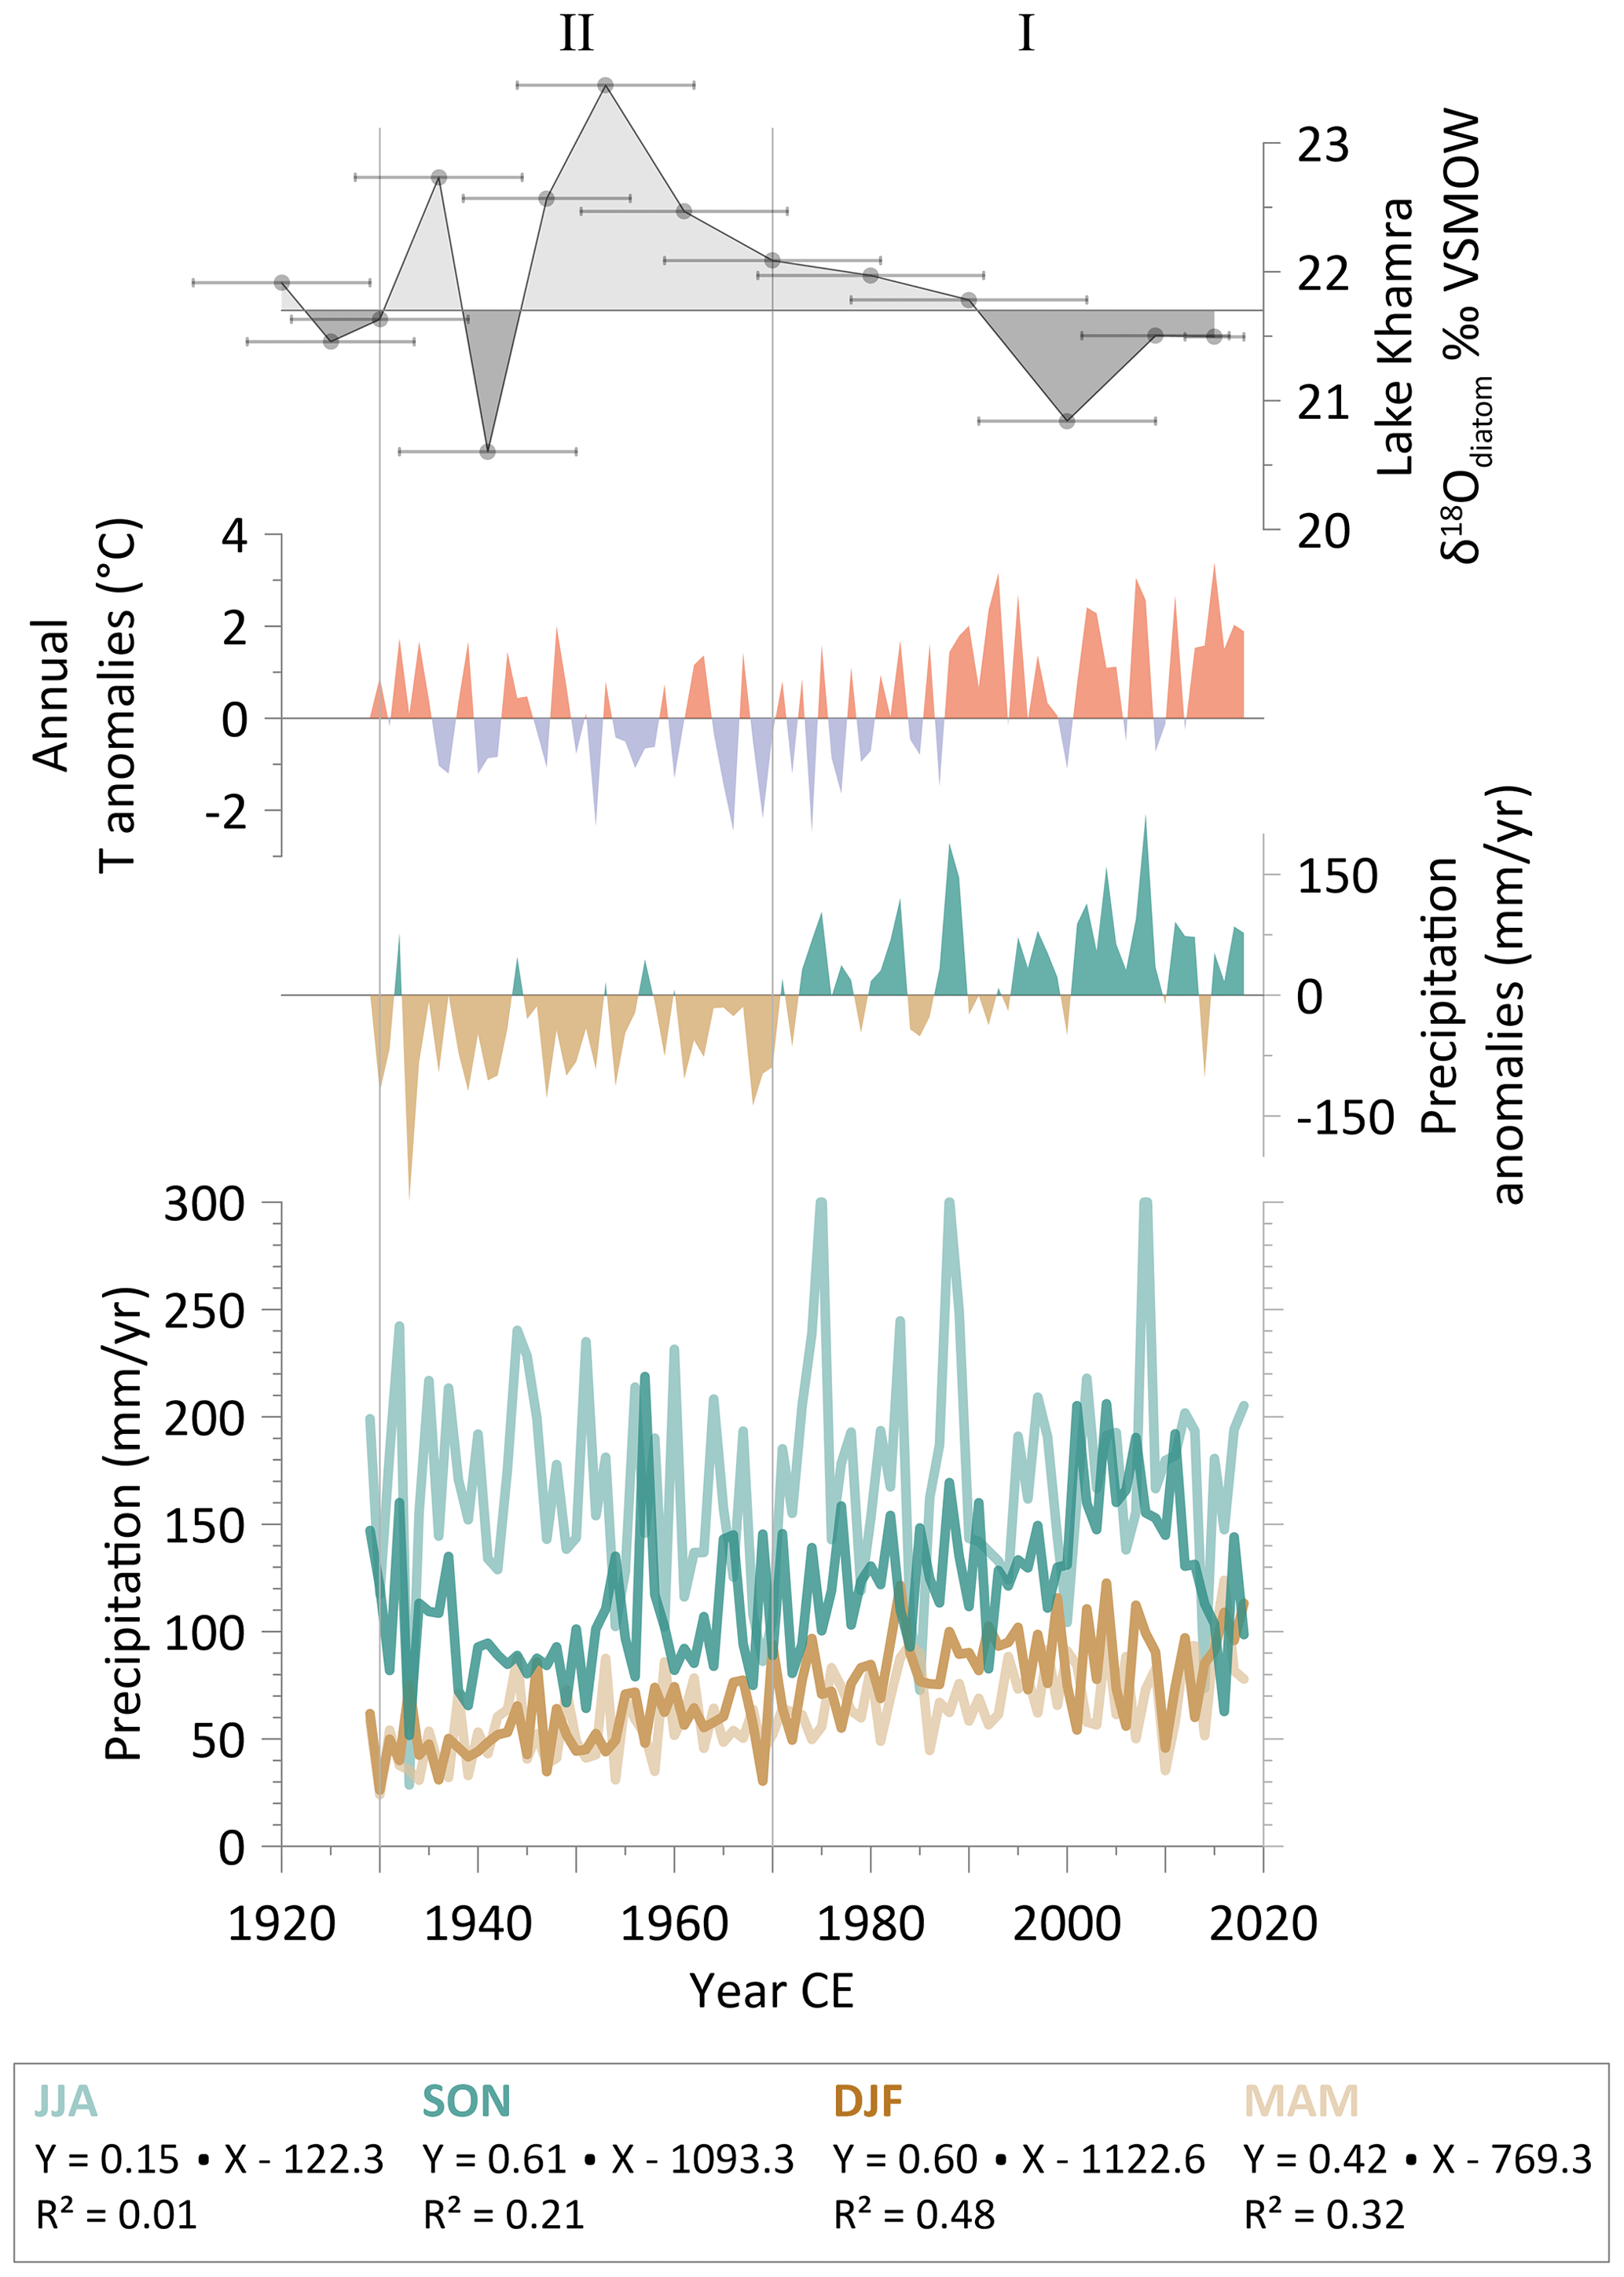
Figure 6The top three plots show the Khamra δ18Odiatom record (with age uncertainties) for phases I and II compared to the annual temperature anomalies and annual precipitation anomalies of Vitim (1929–2018 CE, 90 years, reference period 1961–1990 CE). The lower plot shows the variation in precipitation amount for the period 1929–2018 CE (90 years) displayed by season: June, July, August (JJA); September, October, November (SON); December, January, February (DJF); and March, April, May (MAM). Individual trends for each season are shown in the box. All meteorological data are from the weather station in Vitim (59.45° N, 112.58° E; 186 m a.s.l.; ECA station code: 3235); the data are accessible via https://climexp.knmi.nl (last access: 15 May 2023) (Klein Tank et al., 2002).
In phase I, we see an overall depletion of δ18Odiatom values. In contrast, the annual Tair rises and shows almost continuous positive anomalies from about the 1980s, reaching up to +3.4 °C (Fig. 6). A rising Tair would lead to enriched δ18Oprec values (Dansgaard, 1964) followed by rising δ18Olake and δ18Odiatom values. Moreover, an increase in Tair probably leads to stronger evaporative effects, which would even further enrich δ18Olake and hence δ18Odiatom, as observed within the recent sediment samples of a δ18Odiatom record in Alaska (Broadman et al., 2020). If we assume Tair to be the main controlling factor, we would expect a continuous increase in δ18Odiatom. As a consequence, Tair cannot explain the observed recent depletion in δ18Odiatom, and it likely plays a subordinate role, at least in phase I.
However, we see a significant increase in total rainfall amounts in the study area, as illustrated by almost consistently positive annual precipitation anomalies during phase I (Fig. 6). An increase in precipitation in addition to rising temperatures would buffer evaporation effects and thus potentially weaken the increase in δ18Olake due to rising Tair. This is supported by the isotope composition of the recent lake water samples, which show only a minor effect of evaporation (Fig. 3a). In order to achieve a decrease in δ18Odiatom resulting from higher precipitation levels, a greater quantity of isotopically depleted water has to reach the lake and then be incorporated into the diatom frustules. Most depleted δ18Oprec falls during cold seasons, mainly as snow, when regional monthly mean temperatures are below 0 °C for 7 months (October to April; Fig. 2). All three cold seasons (September, October, November: SON; December, January, February: DJF; March, April, May: MAM) show a more pronounced precipitation increase, whereas there is only a slight increase during the summer months (June, July, August: JJA; Fig. 6). The highest increase is recorded during SON (+0.61 mm yr−1, R2=0.2) and DJF (+0.60 mm yr−1, R2=0.5). Consequently, the overall increase in annual precipitation is likely mainly due to the increase in winter precipitation. Several studies discuss a change in snowfall amount over Eurasia in recent decades, probably as a result of extreme temperature rises in the Arctic, leading to a loss of sea ice and increased evaporation over the Arctic Ocean (Ghatak et al., 2010, 2012; Wegmann et al., 2015; Bailey et al., 2021; Sato et al., 2022). Increased moisture amounts are transported southwards, leading to increased snowfall and duration of snow cover between 1966–2007 CE in specific areas of Eurasia, including Yakutia (Bulygina et al., 2009). During SON, the second largest amount of annual precipitation is received (Fig. 2), which may contribute significantly to δ18Olake. Most of the precipitation during the SON season is expected to fall as snow (monthly mean Tair for Vitim in September: 6.4 °C; in October: −3.3 °C; in November: −18.0 °C; 1929–2018 CE) with highly depleted δ18O values (Fig. 3a). The snow can accumulate in the catchment and lead to a depletion of δ18Olake and, thus, of δ18Odiatom when it reaches the lake as meltwater in the next spring season. The influence of the variation in the amount of snowmelt as a controlling factor in the diatom isotopes has been observed in other lacustrine δ18Odiatom records in northern latitudes (Mackay et al., 2013; Rosqvist et al., 2013; Broadman et al., 2022; Meyer et al., 2022).
Increased snowmelt runoff might increase (soil) erosion within Lake Khamra's catchment. Dolomite and limestone are present in the bedrock (Chelnokova et al., 1988) and are possible sources of total inorganic carbon (TIC) in the sediment (Fig. 5), which probably contributes to the observed 14C age offset (see Sect. 4.2). At Lake Bolshoye Shchuchye in Russia, elevated TIC values are used as a proxy for erosion and sediment supply from detrital carbonate in the bedrock (Lenz et al., 2021). Overall, measured TIC values at Lake Khamra are low. The consistently above-average TIC values in phase I are comparable to a deglaciation period described at Lake Bolshoye Shchuchye, supporting our argument for possible erosional input from the catchment (Fig. 5). Nevertheless, there are possible other sources of TIC in lake sediments, like biogenic carbonate sources, including carbonate fossils. As they are absent in the Khamra sediments, they are a rather unlikely TIC source. Since the pH value of the modern Lake Khamra (pH 6) indicates acidic conditions, and given the rather cold lake water temperature, autochthonous calcite precipitation as a source of TIC (Cohen, 2003) seems rather unlikely too. However, to exclude the presence of carbonate minerals with certainty, an SEM analysis of the sediment would be required (Last and Smol, 2001), which is beyond the scope of this study.
Mercury levels (THg) exhibit a continuous increase and significant enrichment (Fig. 5), clearly surpassing the naturally occurring mercury concentrations measured in Yakutian permafrost, with a background signal of 5.21±3.66 µg kg−1 (Rutkowski et al., 2021). Mercury is known to be deposited in lake sediments due to human pollution by different anthropogenic sources such as air fallout, erosion, mining and agriculture as well as industry and urban waste waters (Wang et al., 2004). Lake Khamra is very pristine, with no great industry or urban settlements in the close vicinity. It is likely that mercury reaches Lake Khamra by air pollution, which is comparable to Lake Bolshoe Toko, another pristine Russian lake (Biskaborn et al., 2021b). The mercury accumulation rates (HgAR) show a more than fourfold increase in phase I, corresponding to mercury fluxes observed at Lake Baikal post-1850 CE, especially in the south basin and the Selenga delta (Roberts et al., 2020). We assume that the rising HgAR at Lake Khamra, especially since the 1990s (Fig. 5), may be connected with the concurrent industrialisation in Asia (dominated by China and India) and the associated Hg emissions (Pacyna et al., 2016; Sundseth et al., 2017), as discussed in Roberts et al. (2020).
Phase II is meteorologically characterised by a clear precipitation deficit, while temperatures indicate a rather moderate to cool period, contrary to phase I (Fig. 6). Rather cool temperatures cannot explain the enriched δ18Odiatom data due to the positive correlation between Tair and δ18Odiatom, whereas the precipitation deficit may provide an explanation. From about 1935 CE to 1955 CE, we see a clear reduction in SON precipitation (Fig. 6). Less snow accumulation leads to less meltwater input in the following spring and hence possibly to less depleted δ18Odiatom values. The relative influence of summer precipitation (JJA) on δ18Olake could increase and, with its enriched δ18Oprec values, could also lead to increased δ18Odiatom values. Additionally, evaporative effects due to the overall precipitation deficit in phase II might further increase δ18Olake and, hence, δ18Odiatom.
TIC shows a shift around 1950 CE from below to above the detection limit that occurs almost simultaneously with the change from a minimum to a maximum in δ18Odiatom (Fig. 5). However, an assumed enhanced erosional input from the catchment linked with elevated TIC contrasts with the observed overall precipitation deficit in phase II. Mercury levels start to rise rapidly from 1930 CE and show a first maximum around 1960 CE, which was probably due to deposition of air pollution, as black carbon emissions quickly increased in Russia at that time (Eckhardt et al., 2023).
According to the correlation with regional meteorological data, air temperature alone cannot be the driving factor of δ18Odiatom at Lake Khamra. We assume that, at least in phases I and II, variability of precipitation is a key factor influencing the δ18Odiatom signal.
5.4 Comparison of δ18Odiatom and internal proxies beyond meteorological data
In contrast to phases I and II, there are no meteorological data covering phases III and IV. If we adopt the interpretation applied for phases I and II, the prolonged phase III, which has the lowest δ18Odiatom mean value of all four phases, suggests a phase of dominant winter precipitation, which is comparable to phase I and the rather constant hydroclimatic conditions overall at Lake Khamra (Fig. 5). Cool air temperatures along with generally more depleted δ18Oprec values likely lead to reduced δ18Odiatom values. Thus, together with possible increased winter precipitation, cold and wet periods have a reinforcing effect on δ18Odiatom that is difficult to disentangle. Therefore, Tair as an influencing factor in this part of the record cannot be ruled out, and it is possible that the record changes from a precipitation-dominated to a temperature-dominated regime, as seen in other studies (Meyer et al., 2015, 2022; Broadman et al., 2022). TIC values vary mainly below the mean, indicating rather negligible carbonate input from the catchment. Mercury levels stay nearly constant (around 100 µg kg−1), as also seen in phase IV (Fig. 5), which could be assumed to be the baseline value of the short core in pre-industrial times. Mercury fluxes also show nearly constant values that are slightly below or along the mean (26.6 µg m−2 a−1). Slightly enriched HgAR values at about 1910 CE are nearly identical to the fluxes observed in the south basin of Lake Baikal (1910 CE: 0.26 ng cm−2 yr−1; Roberts et al., 2020), although local industrialisation is given as the cause there.
Following the interpretation, we would expect a rather dry period with reduced winter precipitation linked with distinct enriched δ18Odiatom values in phase IV (Fig. 5), which is comparable to phase II. However, higher temperatures could also have led to enriched δ18Odiatom values at the beginning of the record. Similarly to phase III, a warm and simultaneously dry phase could have amplified the diatom isotope signal. As a consequence, in the older part of the record (phases III and IV), it stays indistinct, which is a decisive factor in the δ18Odiatom variability, and Tair cannot be ruled out as the prevailing influence on the diatom isotopy.
5.5 Comparison with regional to hemispherical proxy records
Prior to meteorological recordings, comparable high-resolution climate proxies of the region are rare. A charcoal record from a parallel sediment core from Lake Khamra (Glückler et al., 2021) is used as a regional wildfire proxy for the past 2200 years (shown in Fig. 7 from 1750 CE as “robust CHAR”, which accounts for accumulated uncertainties). Statistical analyses of this charcoal record reveal two maxima for the last 250 years, which can be interpreted as increased fire activity in the area. One occurs around 1950 CE; the other (which is less pronounced) occurs in the early 1800s (Glückler et al., 2021). The increased fire activity corresponds very well with enriched δ18Odiatom values observed in phases II and IV (Fig. 7). As persistent dry conditions favour forest fires, the overlap supports the interpretation that the enriched δ18Odiatom corresponds to dry conditions with reduced winter precipitation at Lake Khamra. A reduction in snow accumulation might lead to less soil moisture availability after snowmelt, and when an early end of snowmelt coincides with higher temperatures, it can force extreme wildfires in eastern Siberia (Scholten et al., 2022). In contrast, periods of low fire activity, indicated by a low level of “robust CHAR” (Glückler et al., 2021), coincide with the assumption of rather wet periods with increased winter precipitation, as seen in phases I and III of the δ18Odiatom record (Fig. 7). While snow accumulation might increase soil moisture, a prolonged snow cover duration, which has been observed since 1966 CE in Yakutia (Bulygina et al., 2009), might also limit the duration of the subsequent annual fire season.
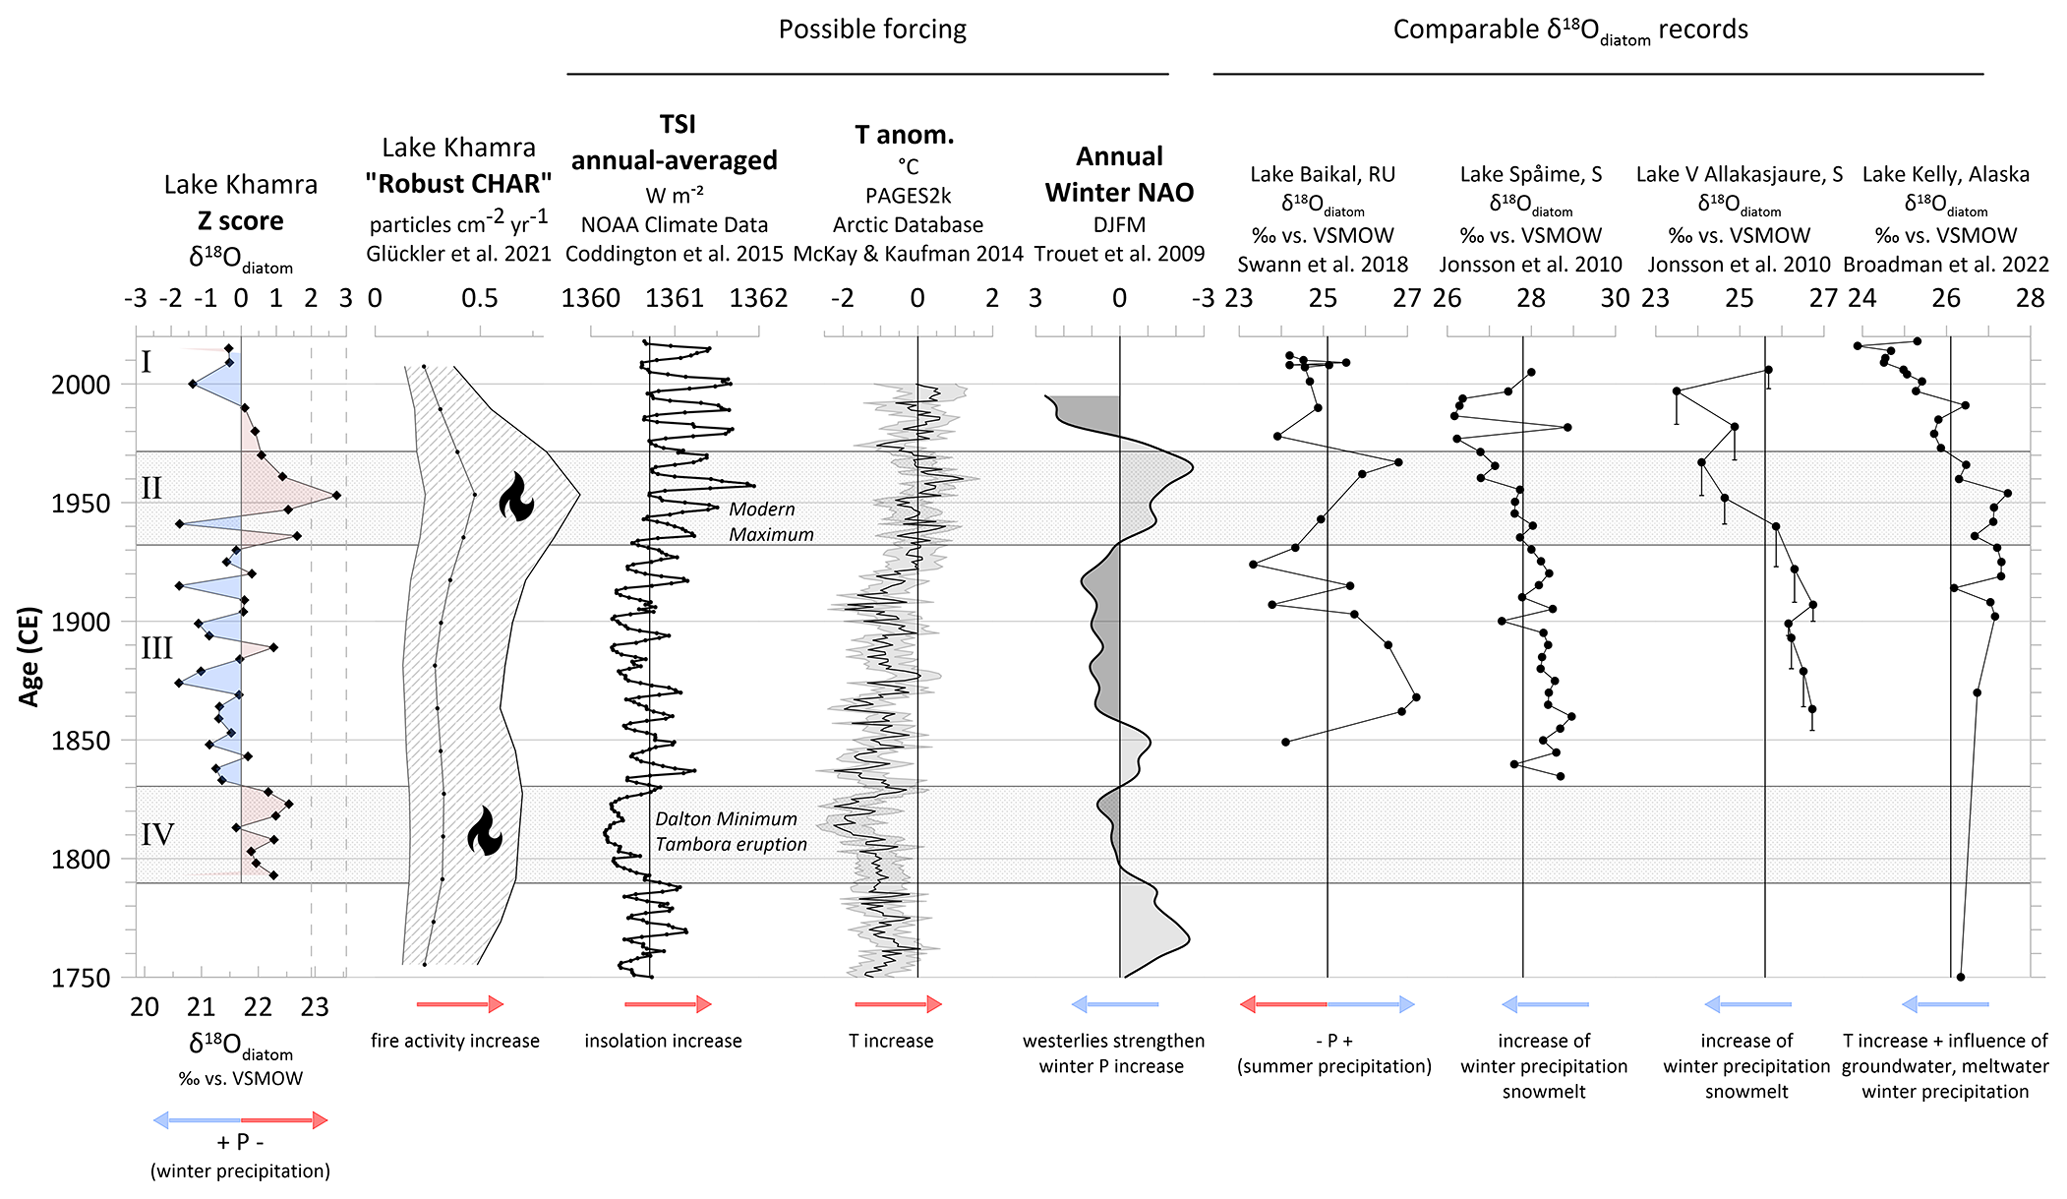
Figure 7The Khamra diatom oxygen isotope record, shown as absolute values and z-scores, in comparison to possible forcing and comparable diatom δ18O records. The proxies for comparison include a charcoal record of Lake Khamra (Glückler et al., 2021), the annual averaged total solar insolation (TSI; Coddington et al., 2015), a reconstructed temperature anomaly for the Arctic (McKay and Kaufman, 2014) and a multi-decadal winter North Atlantic Oscillation (NAO) reconstruction (Trouet et al., 2009). Comparable δ18O records include a record from Lake Baikal in Russia (RU) (Swann et al., 2018), those from two lakes in Sweden (S) (Jonsson et al., 2010) and a study from Alaska (Broadman et al., 2022). Arrows aid the interpretation of the plots. Vertical lines indicate mean values.
Other diatom isotope studies in the Northern Hemisphere indicate a correlation with solar insolation on millennial timescales (Swann et al., 2010; Kostrova et al., 2019, 2021; Meyer et al., 2022). Insolation mainly influences Tair and, thus, δ18Oprec. The maxima of δ18Odiatom and fire activity occur around 1950 CE, which coincides with the modern solar maximum (Coddington et al., 2015) and a temperature peak in the Northern Hemisphere (McKay and Kaufman, 2014) (Fig. 7). This reinforces the interpretation of a dry period in phase II during which the increased Tair could even amplify the enriched δ18Odiatom values. In contrast, the enriched δ18Odiatom values in phase IV and the charcoal peak around 1800 CE (Glückler et al., 2021) overlap with the coldest reconstructed temperatures of the time period studied in our paper (McKay and Kaufman, 2014) and with the Dalton Minimum, a period of low sunspot activity between circa 1790 CE and 1830 CE which coincided with the eruption of Mount Tambora in Indonesia in 1815 CE. This volcanic eruption is considered as one of the largest in recent centuries (Zielinski et al., 1994; Bradley, 2015) and resulted in a significant drop in global air temperatures, leading to, among other effects, an increase in the polar sea ice extent (Stenchikov et al., 2009). In addition, there was significantly less precipitation for over a decade, including in regions north of 40° N (Kandlbauer et al., 2013), which overlaps with a reported dry period from 1750 CE to 1820 CE based on a tree ring δ18O moisture reconstruction from Northeast China (Liu et al., 2022). As a consequence, the Dalton Minimum and the corresponding low temperatures must have had a subordinate effect on the δ18Odiatom record, as the oxygen isotopes of diatoms are, in general, positively correlated with temperature, and a reduction in temperature would lead to a depletion in δ18Odiatom. Therefore, the increased δ18Odiatom values in phase IV also likely correspond to dry conditions, and temperature as well as insolation can largely be excluded as a driving force. Furthermore, the occurrence of dry conditions around these times serves as a potential explanation for the increased fire activity despite the cool temperatures.
Cooler temperatures and an expanded sea ice coverage across the Arctic Ocean (Stenchikov et al., 2009) during phase IV might have resulted in diminished inland moisture transport (especially during the winter months), potentially contributing to drier conditions in the Lake Khamra region. A 30-year smoothed and normalised winter North Atlantic Oscillation (NAO) reconstruction (Trouet et al., 2009) indicates high variability over the last 250 years (Fig. 7), with negative values signifying a diminished pressure gradient and a weakening of the westerlies, resulting in a reduced eastward moisture transport potential (Hurrell, 1995; Osborn, 2006; Hurrell and Deser, 2010). This could favour dry conditions within the Khamra region, whereas a positive NAO phase can increase winter precipitation by enhancing westerlies and promoting moisture transport. The significant negative NAO peak during phase II (reduced winter precipitation) and the transition to a positive state in phase I (possibly snow rich) correspond to the regional meteorological data (Fig. 6) and are consistent with the hydroclimatic interpretation of the diatom record. The strong negative phase in the NAO reconstruction between 1750 CE and 1800 CE does not directly correspond to the increased diatom values in phase IV (Fig. 7). However, a previous significant negative NAO phase may have already favoured dry conditions in the region, which were also promoted by the observed increase in fire frequency from 1750 CE (Glückler et al., 2021) and a dry period recorded in a moisture reconstruction from Northeast China (Liu et al., 2022).
Since there are opposite temperature and insolation trends in phase II (rather warm, high insolation) and phase IV (rather cool, low insolation) but the Khamra δ18Odiatom values are isotopically enriched in both phases, we conclude that temperature and insolation likely play a minor role as prevailing influences in our diatom record. The good agreement of the Khamra δ18Odiatom record with the local charcoal record and the winter NAO index contribute to the identification of past hydroclimate variability. This strengthens the argument that variations in precipitation dominate the δ18Odiatom signal, and that this extends to the earlier phases prior to meteorological observations.
5.6 Comparable high-resolution δ18Odiatom records (regional and in the Northern Hemisphere)
There are very few high-resolution δ18Odiatom records at northern latitudes that cover the same time period and can be considered for comparison. For Russia, we only found one high-resolution, decadal-scale diatom isotope study of the southern basin of Lake Baikal (Fig. 1a; Swann et al., 2018). It includes a composite δ18Odiatom record for the period 2010–1850 CE (160 years). The authors interpret their δ18Odiatom values oppositely to the Khamra record. Low δ18Odiatom values do not correspond to an increase but to a decrease in precipitation, presumably because isotopically enriched summer precipitation (linked with the Atlantic Multi-decadal Oscillation; Sun et al., 2015; Swann et al., 2018) dominates the Baikal record, in contrast to the dominance of heavily depleted winter precipitation at Lake Khamra, which is linked with the NAO. Furthermore, there are two high-resolution δ18Odiatom records from high-altitude sub-Arctic lakes in Scandinavia (Figs. 1a and 7) covering the period from about 2005–1835 CE (Jonsson et al., 2010). Here, decreasing δ18Odiatom values are linked with increased winter precipitation that enters the lake as snowmelt, coinciding with a high NAO index (Jonsson et al., 2010). This is a very similar interpretation to the Khamra record and supports its use as a proxy for winter precipitation and snowmelt. A similar context of snow-dominated lacustrine environments has been found for Kamchatka (Meyer et al., 2015) and the Polar Urals (Meyer et al., 2022), albeit over longer timescales. In Alaska, a multi-proxy palaeoclimate study includes a high-resolution δ18Odiatom record from Kelly Lake on the Kenai Peninsula (Fig. 1a) spanning the last 120 years (2018–1902 CE; Broadman et al., 2022). The record is interpreted as a hydroclimate proxy, whereby the temperature effect is superimposed by various hydroclimatic variables (Leng and Barker, 2006; Broadman et al., 2022), which corresponds to the δ18Odiatom interpretation of Lake Khamra. There is another diatom isotope study of Kenai Peninsula (Broadman et al., 2020) that focuses on millennial-timescale hydroclimatic changes but includes a high-resolution part (2018–1902 CE). Comparison with meteorological data reveals that δ18Odiatom in Alaska is mainly driven by the precipitation and evaporation balance (P–E).
All δ18Odiatom records of the mentioned studies (Jonsson et al., 2010; Swann et al., 2018; Broadman et al., 2020, 2022) are significantly enriched in heavy isotopes compared to the Khamra δ18Odiatom record (Fig. 7). The offset in δ18Odiatom between these study sites is mainly due to considerably cooler Tair and the distinctly continental climate of the Lake Khamra region and its reflection in δ18Oprec. All compared δ18Odiatom records shown in Fig. 7 indicate a decreasing trend and a striking shift towards enriched δ18Odiatom values in the youngest samples. The Lake Khamra record has no overall decreasing trend from 1850 CE until 1950 CE, after which the Khamra record shows a clear decreasing trend until 2000 CE, with the two youngest samples showing a rise (Fig. 7).
The Lake Baikal record (Swann et al., 2018) also has two minima at the onset of the 20th century and a maximum in the 1970s, which is comparable to the Lake Khamra record. The enriched δ18Odiatom values between 1850 CE and 1950 CE do not fit with the overall trend for the values in phase III of the Khamra record to be below the mean δ18Odiatom. Extreme regional differences between these two lakes, such as in catchment size and water residence time, as well as differences in the development of summer and winter precipitation probably lead to the contrasting interpretation.
Jonsson et al. (2010) report the presence of a peak around 1980 CE in both Swedish δ18Odiatom records (Fig. 7), which is delayed compared to the peak in the 1950s within the Khamra record but also potentially attributable to a reduced ratio of winter-to-summer precipitation during that period. In general, the Swedish site shares similarities with the Khamra region in terms of NAO-driven winter precipitation fluctuations. Nevertheless, the δ18Odiatom increase after 1990 CE is seen as a result of decreasing winter precipitation and simultaneous rising summer precipitation as well as rising annual temperatures (Jonsson et al., 2010), whereas winter precipitation and air temperature increased in the Lake Khamra region (Fig. 6). Remaining regional differences in hydroclimate, such as the influence of the Arctic Ocean on precipitation in the Khamra region, probably led to the different magnitudes of increase in the two records after 1990 CE.
The δ18Odiatom record from Kelly Lake is similar to the Khamra record in phases I and II, with a maximum in the 1950s and a decrease afterwards. The authors relate this decrease to an increasing amount of depleted winter precipitation due to a reduction in sea ice extent, depleted glacial meltwater originating from the glaciers and/or depleted groundwater fed by glacial meltwater (Broadman et al., 2022). Unfortunately, there are no data available on groundwater conditions at Lake Khamra. Since there are no glaciers in the catchment of Lake Khamra which could contribute to an isotopic decrease, the interpretation of Khamra δ18Odiatom as a winter precipitation proxy is strengthened.
Consequently, the regional setting strongly influences the characteristics of each diatom record, requiring a case-by-case approach to data interpretation and cross-site comparisons. Nonetheless, this comparison reveals similar hydroclimate reactions that support the interpretation for Lake Khamra and strengthen the significance of the Khamra diatom record as a hydroclimate proxy not only locally but also for comparisons between regions with contrasting large-scale hydrological patterns.
5.7 Hydroclimatic anomalies covered by the Khamra δ18Odiatom record
Our investigations reveal that the Khamra δ18Odiatom record can be interpreted as a hydroclimate proxy for winter precipitation variability in which Tair has a rather subordinate effect on δ18Odiatom. Hence, extreme values in the δ18Odiatom record of Lake Khamra are most likely linked to phases characterised by drier conditions, which exhibit reduced snowfall (maxima), or phases with wetter conditions, which are associated with increased snowfall (minima). Considering that Lake Khamra's residence time is modelled as being about 1 year and 3 months (474 d; Messager et al., 2016) and age uncertainties limit the resolution of our record, multi-day precipitation anomalies are unlikely to be captured by the diatom record. Consequently, a hydroclimatic anomaly must be of a “prolonged” or “persistent” nature (i.e. several dry or moist years in a row) or must lead to a lasting change in the conditions in the catchment area to have an impact that is detectable within our sub-decadal diatom record.
The minima of the continuous δ18Odiatom record occur in phase III and in phase II, whereas the maximum occurs in phase II. Thus, the short phase II (1970–1930 CE, n=6) is characterised by the highest variability within this record. Hence, this is interpreted as a period with an increased probability of hydroclimatic anomalies with rapidly changing and/or exceptional environmental conditions. The maximum in 1950 CE lies outside the 99 % percentile, and z-score analysis confirms that it is an exceptionally high value, as it is the only one that deviates by nearly 3 times the standard deviation within the record (Fig. 7). This maximum can be ruled out as a measurement error or outlier, as the sample has been measured in duplicate. Moreover, the values before and after it support this maximum. Elevated δ18Odiatom values correspond to elevated δ18Olake values, likely caused by diminished meltwater input. Between 1935 CE and 1955 CE, a decrease in autumn (SON) precipitation is evident. This period lies within a period of overall precipitation deficit in the region until the late 1960s (Fig. 6). The precipitation reduction corresponds to a prolonged negative phase of winter NAO (Fig. 7), with a minimum in the 1960s (Trouet et al., 2009). Moreover, the δ18Odiatom maximum at 1950 CE coincides well with a clear maximum of regional wildfire activity (Glückler et al., 2021, Fig. 7). Vegetation surveys carried out during the 2018 expedition (Kruse et al., 2019) revealed extensive regions of forest succession without less dense forest cover in the vicinity of Lake Khamra. Remote sensing data on historical forest fires and forest loss reach back to only 2000 CE (Hansen et al., 2013; Giglio et al., 2018). We hypothesise that in the 1950s (corresponding to the observed dry period), wildfires likely occurred and had a considerable impact, destroying the dense forest in the lake's vicinity and resulting in the formation of large forest succession areas afterwards, which can be observed today. An increase in Cyperaceae pollen and more evergreen versus deciduous arboreal pollen types in the 1950s (Glückler et al., 2021) supports the assumption of a massive vegetation change in the vicinity of Lake Khamra after the 1950 CE fire event. Furthermore, Cyperaceae have the capability to promptly establish in recently disturbed and deforested regions, such as regions after a wildfire, besides their ability to grow in wet areas (Glückler et al., 2021 and references therein).
The lake internal proxies also show a distinct shift at the time of the δ18Odiatom maximum. Assuming that a severe fire suddenly led to an opening in the previously dense forest vegetation in the catchment, the affected area, especially the soil cover, would likely have become more vulnerable to erosion from rain and snowmelt flowing into the lake. Even years after the fire event, the loss of vegetation cover could have altered the input into the lake, in line with the TIC values from the 1950s on that were consistently above the mean (Fig. 5). Additionally, the first peak in THg around 1960 CE (Fig. 5) might be related to changed conditions in the catchment area. Anthropogenic mercury inputs from increasing industrial combustion that were transported by air (as discussed in Sect. 5.3) were likely the main Hg source. Mercury can be released into the air by burning plant material (Driscoll et al., 2013), but it can also accumulate in burned soils, so it could have subsequently been transported into the lake by erosion (Burke et al., 2010). The mercury accumulation rates rise above the mean (26.6 µg m−2 a−1) for the first time within the Lake Khamra record between 1930 CE and 1950 CE. However, since the increase in the accumulation rate is rather small, we assume that the main source of Hg accumulation was still atmospheric Hg deposition from anthropogenic sources.
Even though the z-scores of the δ18Odiatom record are less pronounced than in phase II, we identify a similar temporal correspondence between a charcoal peak in the early 1800s (Glückler et al., 2021) and elevated δ18Odiatom values in phase IV (Fig. 7). Hydroclimatic anomalies such as prolonged dry periods, which are mainly due to a deficit of winter precipitation, form the basis for enhanced forest fire activity in this area. This hydroclimatic variability is reflected in the diatom isotope record of Lake Khamra, which agrees well with the regional reconstruction of forest fires.
The presented δ18Odiatom record of Lake Khamra provides a valuable sub-decadal hydroclimate proxy record spanning from about 1790 CE to 2015 CE for the understudied area of south-west Yakutia in eastern Siberia. For the period since meteorological measurements began in the 1930s, we can exclude air temperature as the main driving factor for the variability of the δ18Odiatom record of Lake Khamra. Instead, δ18Odiatom is linked to seasonal precipitation changes in the region, especially variations in early winter precipitation that enter the lake as isotopically depleted snowmelt water. An overall depletion of δ18Odiatom since the 1950s is interpreted as an increase in winter precipitation in the area that is positively correlated with the winter NAO index. Prior to meteorological recordings, the δ18Odiatom signal also appears to be little influenced by air temperature or solar insolation. Comparisons with available palaeoclimate proxy records and other high-resolution δ18Odiatom records from the Northern Hemisphere support the use of the δ18Odiatom record of Lake Khamra as a valuable hydroclimate proxy, especially for winter precipitation shifts.
Hydroclimatic anomalies within the Lake Khamra δ18Odiatom record are interpreted as dry periods that were likely caused by reduced winter precipitation, which led to enriched δ18Odiatom values at the onset of the 19th century and especially in the 1950s, with the latter confirmed by meteorological data. These two dry periods overlap with reconstructed charcoal maxima and serve as a potential explanation for high fire activity in the area despite rather cool temperatures, especially during an insolation minimum around 1800 CE. This highlights that the reconstruction of hydroclimate conditions is a highly valuable means to better understand climatic drivers of past fire activity.
We also detected a significant increase in mercury levels that occurred nearly synchronously with the peak in δ18Odiatom around 1950 CE and is mainly attributed to human air pollution, despite the remote location of Lake Khamra.
Table A1Main geochemical characteristics and isotopic signatures of diatom samples from Lake Khamra. The purity of the sample material was determined by EDS. The SiO2 content ranges between 96.1 % and 98.7 % and the Al2O3 content between 0.4 % and 0.7 %. Mean δ18Odiatom values (“Diatom δ18Omean”), calculated contamination values (%) and δ18O values corrected for contamination (“Diatom δ18Ocorrected”) are given. “sed” stands for sediment.
The datasets used in this study, including water isotope data, 14C and 210Pb–137Cs dates, mercury, total inorganic carbon and the Khamra δ18Odiatom record, are available via PANGAEA (https://doi.org/10.1594/PANGAEA.962988, Stieg et al., 2024).
AS, HM, BKB and UH designed the research project. BKB, UH and LP conducted fieldwork and received the sediment core and water samples in 2018 and 2020. AS processed and analysed the sediment samples in the lab and, together with HM, interpreted the diatom and water isotope datasets. AS coordinated the sediment dating and performed the age–depth modelling. JS supervised the mercury and inorganic carbon analysis and helped interpret these proxies. AS, HM and BKB structured the manuscript. AS produced all figures and tables and wrote the manuscript. All authors commented on drafts and approved the final version.
The contact author has declared that none of the authors has any competing interests.
Publisher's note: Copernicus Publications remains neutral with regard to jurisdictional claims made in the text, published maps, institutional affiliations, or any other geographical representation in this paper. While Copernicus Publications makes every effort to include appropriate place names, the final responsibility lies with the authors.
We thank the teams of the ISOLAB Facility, the CarLa lab and the MICADAS radiocarbon laboratory of the AWI. We would further like to thank Ramesh Glückler for his help with sampling the sediment core and for his expertise in regional wildfire reconstruction as well as all participants in the joint German–Russian expedition in Yakutia 2018 and 2020 for their support. We thank the editor Bjørg Risebrobakken and the referee Anson Mackay as well as an anonymous reviewer for their valuable assessment of the manuscript and for their comments, which helped to improve our work.
Amelie Stieg is funded by AWI INSPIRES (International Science Program for Integrative Research in Earth Systems).
The article processing charges for this open-access publication were covered by the Alfred-Wegener-Institut Helmholtz-Zentrum für Polar- und Meeresforschung.
This paper was edited by Bjørg Risebrobakken and reviewed by Anson Mackay and one anonymous referee.
Appleby, P. G., Nolan, P. J., Gifford, D. W., Godfrey, M. J., Oldfield, F., Anderson, N. J., and Battarbee, R. W.: 210Pb dating by low background gamma counting, Hydrobiologia, 143, 21–27, https://doi.org/10.1007/bf00026640, 1986.
Bailey, H., Hubbard, A., Klein, E. S., Mustonen, K.-R., Akers, P. D., Marttila, H., and Welker, J. M.: Arctic sea-ice loss fuels extreme European snowfall, Nat. Geosci., 14, 283–288, https://doi.org/10.1038/s41561-021-00719-y, 2021.
Bintanja, R.: The impact of Arctic warming on increased rainfall, Sci. Rep., 8, 16001, https://doi.org/10.1038/s41598-018-34450-3, 2018.
Bintanja, R. and Selten, F. M.: Future increases in Arctic precipitation linked to local evaporation and sea-ice retreat, Nature, 509, 479–482, https://doi.org/10.1038/nature13259, 2014.
Biskaborn, B. K., Herzschuh, U., Bolshiyanov, D., Savelieva, L., and Diekmann, B.: Environmental variability in northeastern Siberia during the last ∼ 13,300 yr inferred from lake diatoms and sediment–geochemical parameters, Palaeogeogr. Palaeoclim. Palaeoecol., 329–330, 22–36, https://doi.org/10.1016/j.palaeo.2012.02.003, 2012.
Biskaborn, B. K., Bolshiyanov, D., Grigoriev, M. N., Morgenstern, A., Pestryakova, L. A., Tsibizov, L., and Dill, A.: Russian-German Cooperation: Expeditions to Siberia in 2020, Berichte zur Polar- und Meeresforschung = Reports on polar and marine research, Alfred Wegener Institute for Polar and Marine Research, Bremerhaven, 81, https://doi.org/10.48433/BzPM_0756_2021, 2021a.
Biskaborn, B. K., Narancic, B., Stoof-Leichsenring, K. R., Pestryakova, L. A., Appleby, P. G., Piliposian, G. T., and Diekmann, B.: Effects of climate change and industrialization on Lake Bolshoe Toko, eastern Siberia, J. Paleolimnol., 65, 335–352, https://doi.org/10.1007/s10933-021-00175-z, 2021b.
Biskaborn, B. K., Forster, A., Pfalz, G., Pestryakova, L. A., Stoof-Leichsenring, K., Strauss, J., Kröger, T., and Herzschuh, U.: Diatom responses and geochemical feedbacks to environmental changes at Lake Rauchuagytgyn (Far East Russian Arctic), Biogeosciences, 20, 1691–1712, https://doi.org/10.5194/bg-20-1691-2023, 2023.
Björck, S. and Wohlfarth, B.: 14C Chronostratigraphic Techniques in Paleolimnology, in: Tracking Environmental Change Using Lake Sediments: Basin Analysis, Coring, and Chronological Techniques, edited by: Last, W. M. and Smol, J. P., Springer Netherlands, Dordrecht, 205–245, ISBN 978-0-306-47669-3, https://doi.org/10.1007/0-306-47669-X_10, 2001.
Blaauw, M. and Christen, J. A.: Flexible paleoclimate age-depth models using an autoregressive gamma process, Bayes. Anal., 6, 457–474, https://doi.org/10.1214/11-ba618, 2011.
Bowen, G. J.: The Online Isotopes in Precipitation Calculator, version OIPC3.1:, http://www.waterisotopes.org (last access: 18 October 2023), 2023.
Bowen, G. J. and Revenaugh, J.: Interpolating the isotopic composition of modern meteoric precipitation, Water Resour. Res., 39, 1299, https://doi.org/10.1029/2003WR002086, 2003.
Bowen, G. J., Wassenaar, L. I., and Hobson, K. A.: Global application of stable hydrogen and oxygen isotopes to wildlife forensics, Oecologia, 143, 337–348, https://doi.org/10.1007/s00442-004-1813-y, 2005.
Bradley, R. S.: Paleoclimatology: Reconstructing Climates of the Quaternary, in: 3rd Edn., Academic Press, San Diego, ISBN 9780123869135, 2015.
Brewer, T. S., Leng, M. J., Mackay, A. W., Lamb, A. L., Tyler, J. J., and Marsh, N. G.: Unravelling contamination signals in biogenic silica oxygen isotope composition: the role of major and trace element geochemistry, J. Quaternary Sci., 23, 321–330, https://doi.org/10.1002/jqs.1171, 2008.
Broadman, E., Kaufman, D. S., Henderson, A. C. G., Berg, E. E., Anderson, R. S., Leng, M. J., Stahnke, S. A., and Muñoz, S. E.: Multi-proxy evidence for millennial-scale changes in North Pacific Holocene hydroclimate from the Kenai Peninsula lowlands, south-central Alaska, Quaternary Sci. Rev., 241, 106420, https://doi.org/10.1016/j.quascirev.2020.106420, 2020.
Broadman, E., Kaufman, D. S., Anderson, R. S., Bogle, S., Ford, M., Fortin, D., Henderson, A. C. G., Lacey, J. H., Leng, M. J., McKay, N. P., and Muñoz, S. E.: Reconstructing postglacial hydrologic and environmental change in the eastern Kenai Peninsula lowlands using proxy data and mass balance modeling, Quatern. Res., 107, 1–26, https://doi.org/10.1017/qua.2021.75, 2022.
Brown, J., Ferrians Jr., O. J., Heginbottom, J. A., and Melnikov, E. S.: Circum-Arctic map of permafrost and ground-ice conditions, Report 45, USGS, https://doi.org/10.3133/cp45, 1997.
Bulygina, O. N., Razuvaev, V. N., and Korshunova, N. N.: Changes in snow cover over Northern Eurasia in the last few decades, Environ. Res. Lett., 4, 045026, https://doi.org/10.1088/1748-9326/4/4/045026, 2009.
Burke, M. P., Hogue, T. S., Ferreira, M., Mendez, C. B., Navarro, B., Lopez, S., and Jay, J. A.: The Effect of Wildfire on Soil Mercury Concentrations in Southern California Watersheds, Water Air Soil Pollut., 212, 369–385, https://doi.org/10.1007/s11270-010-0351-y, 2010.
Chapligin, B., Meyer, H., Friedrichsen, H., Marent, A., Sohns, E., and Hubberten, H. W.: A high-performance, safer and semi-automated approach for the delta18O analysis of diatom silica and new methods for removing exchangeable oxygen, Rapid Commun. Mass Spectrom., 24, 2655–2664, https://doi.org/10.1002/rcm.4689, 2010.
Chapligin, B., Leng, M. J., Webb, E., Alexandre, A., Dodd, J. P., Ijiri, A., Lücke, A., Shemesh, A., Abelmann, A., Herzschuh, U., Longstaffe, F. J., Meyer, H., Moschen, R., Okazaki, Y., Rees, N. H., Sharp, Z. D., Sloane, H. J., Sonzogni, C., Swann, G. E. A., Sylvestre, F., Tyler, J. J., and Yam, R.: Inter-laboratory comparison of oxygen isotope compositions from biogenic silica, Geochim. Cosmochim. Ac., 75, 7242–7256, https://doi.org/10.1016/j.gca.2011.08.011, 2011.
Chapligin, B., Meyer, H., Bryan, A., Snyder, J., and Kemnitz, H.: Assessment of purification and contamination correction methods for analysing the oxygen isotope composition from biogenic silica, Chem. Geol., 300–301, 185–199, https://doi.org/10.1016/j.chemgeo.2012.01.004, 2012a.
Chapligin, B., Meyer, H., Swann, G. E. A., Meyer-Jacob, C., and Hubberten, H. W.: A 250 ka oxygen isotope record from diatoms at Lake El'gygytgyn, far east Russian Arctic, Clim. Past, 8, 1621–1636, https://doi.org/10.5194/cp-8-1621-2012, 2012b.
Chapligin, B., Narancic, B., Meyer, H., and Pienitz, R.: Paleo-environmental gateways in the eastern Canadian arctic – Recent isotope hydrology and diatom oxygen isotopes from Nettilling Lake, Baffin Island, Canada, Quaternary Sci. Rev., 147, 379–390, https://doi.org/10.1016/j.quascirev.2016.03.028, 2016.
Chelnokova, S. M., Chikina, I. D., and Radchenko, S. A.: Geologic map of Yakutia P-48,49, 1:000000, VSEGEI, Leningrad, http://www.geokniga.org/sites/geokniga/ (last access: 11 November 2022), 1988.
Churakova Sidorova, O. V., Siegwolf, R. T. W., Fonti, M. V., Vaganov, E. A., and Saurer, M.: Spring arctic oscillation as a trigger of summer drought in Siberian subarctic over the past 1494 years, Sci. Rep., 11, 19010, https://doi.org/10.1038/s41598-021-97911-2, 2021.
Chylek, P., Folland, C., Klett, J. D., Wang, M., Hengartner, N., Lesins, G., and Dubey, M. K.: Annual Mean Arctic Amplification 1970–2020: Observed and Simulated by CMIP6 Climate Models, Geophys. Res. Lett., 49, e2022GL099371, https://doi.org/10.1029/2022gl099371, 2022.
Ciavarella, A., Cotterill, D., Stott, P., Kew, S., Philip, S., van Oldenborgh, G. J., Skalevag, A., Lorenz, P., Robin, Y., Otto, F., Hauser, M., Seneviratne, S. I., Lehner, F., and Zolina, O.: Prolonged Siberian heat of 2020 almost impossible without human influence, Climatic Change, 166, 9, https://doi.org/10.1007/s10584-021-03052-w, 2021.
Clayton, R. N. and Mayeda, T. K.: The use of bromine pentafluoride in the extraction of oxygen from oxides and silicates for isotopic analysis, Geochim. Cosmochim. Ac., 27, 43–52, https://doi.org/10.1016/0016-7037(63)90071-1, 1963.
Coddington, O., Lean, J. L., Lindholm, D., Pilewskie, P., Snow, M., and Program, N. C.: NOAA Climate Data Record (CDR) of Total Solar Irradiance (TSI), NRLTSI Version 2, NOAA [data set], https://doi.org/10.7289/V55B00C1, 2015.
Cohen, A. S.: Paleolimnology: The history and evolution of lake systems, Oxford University Press, New York, ISBN 0-19-513353-6, 2003.
Collow, A. B. M., Thomas, N. P., Bosilovich, M. G., Lim, Y.-K., Schubert, S. D., and Koster, R. D.: Seasonal Variability in the Mechanisms behind the 2020 Siberian Heatwaves, J. Climate, 35, 3075–3090, https://doi.org/10.1175/jcli-d-21-0432.1, 2022.
Colman, S. M., Jones, G. A., Rubin, M., King, J. W., Peck, J. A., and Orem, W. H.: AMS radiocarbon analyses from Lake Baikal, Siberia: Challanges of dating sediments from a large, oligotrophic lake, Quaternary Sci. Rev., 15, 669–684, https://doi.org/10.1016/0277-3791(96)00027-3, 1996.
Craig, H.: Isotopic Variations in Meteoric Waters, Science, 133, 1702–1703, https://doi.org/10.1126/science.133.3465.1702, 1961.
Dansgaard, W.: Stable isotopes in precipitation, Tellus A, 16, 436–468, https://doi.org/10.3402/tellusa.v16i4.8993, 1964.
Dodd, J. P. and Sharp, Z. D.: A laser fluorination method for oxygen isotope analysis of biogenic silica and a new oxygen isotope calibration of modern diatoms in freshwater environments, Geochim. Cosmochim. Ac., 74, 1381–1390, https://doi.org/10.1016/j.gca.2009.11.023, 2010.
Driscoll, C. T., Mason, R. P., Chan, H. M., Jacob, D. J., and Pirrone, N.: Mercury as a Global Pollutant: Sources, Pathways, and Effects, Environ. Sci. Technol., 47, 4967–4983, https://doi.org/10.1021/es305071v, 2013.
Durre, I., Menne, M. J., and Vose, R. S.: Strategies for evaluating quality assurance procedures, J. Appl. Meteorol. Clim., 47, 1785–1791, https://doi.org/10.1175/2007jamc1706.1, 2008.
Eckhardt, S., Pisso, I., Evangeliou, N., Zwaaftink, C. G., Plach, A., McConnell, J. R., Sigl, M., Ruppel, M., Zdanowicz, C., Lim, S., Chellman, N., Opel, T., Meyer, H., Steffensen, J. P., Schwikowski, M., and Stohl, A.: Revised historical Northern Hemisphere black carbon emissions based on inverse modeling of ice core records, Nat. Commun., 14, 271, https://doi.org/10.1038/s41467-022-35660-0, 2023.
Fedorov, A., Vasilyev, N., Torgovkin, Y., Shestakova, A., Varlamov, S., Zheleznyak, M., Shepelev, V., Konstantinov, P., Kalinicheva, S., Basharin, N., Makarov, V., Ugarov, I., Efremov, P., Argunov, R., Egorova, L., Samsonova, V., Shepelev, A., Vasiliev, A., Ivanova, R., Galanin, A., Lytkin, V., Kuzmin, G., and Kunitsky, V.: Permafrost-Landscape Map of the Republic of Sakha (Yakutia) on a Scale , Geosciences, 8, 465, https://doi.org/10.3390/geosciences8120465, 2018.
Ghatak, D., Frei, A., Gong, G., Stroeve, J., and Robinson, D.: On the emergence of an Arctic amplification signal in terrestrial Arctic snow extent, J. Geophys. Res.-Atmos., 115, D24105, https://doi.org/10.1029/2010jd014007, 2010.
Ghatak, D., Deser, C., Frei, A., Gong, G., Phillips, A., Robinson, D. A., and Stroeve, J.: Simulated Siberian snow cover response to observed Arctic sea ice loss, 1979–2008, J. Geophys. Res.-Atmos., 117, D23108, https://doi.org/10.1029/2012jd018047, 2012.
Gibson, C. E., Anderson, N. J., and Haworth, E. Y.: Aulacoseira subarctica: taxonomy, physiology, ecology and palaeoecology, Eur. J. Phycol., 38, 83–101, https://doi.org/10.1080/0967026031000094102, 2003.
Giglio, L., Boschetti, L., Roy, D. P., Humber, M. L., and Justice, C. O.: The Collection 6 MODIS burned area mapping algorithm and product, Remote Sens. Environ., 217, 72–85, https://doi.org/10.1016/j.rse.2018.08.005, 2018.
Glückler, R., Herzschuh, U., Kruse, S., Andreev, A., Vyse, S. A., Winkler, B., Biskaborn, B. K., Pestryakova, L., and Dietze, E.: Wildfire history of the boreal forest of south-western Yakutia (Siberia) over the last two millennia documented by a lake-sediment charcoal record, Biogeosciences, 18, 4185–4209, https://doi.org/10.5194/bg-18-4185-2021, 2021.
Gorokhov, A. N. and Fedorov, A. N.: Current Trends in Climate Change in Yakutia, Geogr. Nat. Resour., 39, 153–161, https://doi.org/10.1134/s1875372818020087, 2018.
Hansen, M. C., Potapov, P. V., Moore, R., Hancher, M., Turubanova, S. A., Tyukavina, A., Thau, D., Stehman, S. V., Goetz, S. J., Loveland, T. R., Kommareddy, A., Egorov, A., Chini, L., Justice, C. O., and Townshend, J. R.: High-resolution global maps of 21st-century forest cover change, Science, 342, 850–853, https://doi.org/10.1126/science.1244693, 2013.
Hurrell, J. W.: Decadal trends in the north atlantic oscillation: regional temperatures and precipitation, Science, 269, 676–679, https://doi.org/10.1126/science.269.5224.676, 1995.
Hurrell, J. W. and Deser, C.: North Atlantic climate variability: The role of the North Atlantic Oscillation, J. Mar. Syst., 79, 231–244, https://doi.org/10.1016/j.jmarsys.2009.11.002, 2010.
IAEA/WMO: Global Network for Isotopes in Precipitation, The GNIP Database, https://nucleus.iaea.org/wiser (last access: 20 June 2023), 2023.
Jonsson, C. E., Rosqvist, G. C., Leng, M. J., Bigler, C., Bergman, J., Tillman, P. K., and Sloane, H. J.: High-resolution diatom δ18O records, from the last 150 years, reflecting changes in amount of winter precipitation in two sub-Arctic high-altitude lakes in the Swedish Scandes, J. Quaternary Sci., 25, 918–930, https://doi.org/10.1002/jqs.1372, 2010.
Kandlbauer, J., Hopcroft, P. O., Valdes, P. J., and Sparks, R. S. J.: Climate and carbon cycle response to the 1815 Tambora volcanic eruption, J. Geophys. Res.-Atmos., 118, 12497–12507, https://doi.org/10.1002/2013jd019767, 2013.
Kirillina, K., Shvetsov, E. G., Protopopova, V. V., Thiesmeyer, L., and Yan, W.: Consideration of anthropogenic factors in boreal forest fire regime changes during rapid socio-economic development: case study of forestry districts with increasing burnt area in the Sakha Republic, Russia, Environ. Res. Lett., 15, 035009, https://doi.org/10.1088/1748-9326/ab6c6e, 2020.
Klein Tank, A. M. G., Wijngaard, J. B., Können, G. P., Böhm, R., Demarée, G., Gocheva, A., Mileta, M., Pashiardis, S., Hejkrlik, L., Kern-Hansen, C., Heino, R., Bessemoulin, P., Müller-Westermeier, G., Tzanakou, M., Szalai, S., Pálsdóttir, T., Fitzgerald, D., Rubin, S., Capaldo, M., Maugeri, M., Leitass, A., Bukantis, A., Aberfeld, R., van Engelen, A. F. V., Forland, E., Mietus, M., Coelho, F., Mares, C., Razuvaev, V., Nieplova, E., Cegnar, T., Antonio López, J., Dahlström, B., Moberg, A., Kirchhofer, W., Ceylan, A., Pachaliuk, O., Alexander, L. V., and Petrovic, P.: Daily dataset of 20th-century surface air temperature and precipitation series for the European Climate Assessment, Int. J. Climatol., 22, 1441–1453, https://doi.org/10.1002/joc.773, 2002.
Kostrova, S. S., Meyer, H., Chapligin, B., Bezrukova, E. V., Tarasov, P. E., and Kuz'min, M. I.: Reconstruction of the Holocene climate of Transbaikalia: Evidence from the oxygen isotope analysis of fossil diatoms from Kotokel Lake, Dokl. Earth Sci., 451, 732–736, https://doi.org/10.1134/S1028334x13070039, 2013a.
Kostrova, S. S., Meyer, H., Chapligin, B., Kossler, A., Bezrukova, E. V., and Tarasov, P. E.: Holocene oxygen isotope record of diatoms from Lake Kotokel (southern Siberia, Russia) and its palaeoclimatic implications, Quatern. Int., 290, 21–34, https://doi.org/10.1016/j.quaint.2012.05.011, 2013b.
Kostrova, S. S., Meyer, H., Chapligin, B., Tarasov, P. E., and Bezrukova, E. V.: The last glacial maximum and late glacial environmental and climate dynamics in the Baikal region inferred from an oxygen isotope record of lacustrine diatom silica, Quatern. Int., 348, 25–36, https://doi.org/10.1016/j.quaint.2014.07.034, 2014.
Kostrova, S. S., Meyer, H., Bailey, H. L., Ludikova, A. V., Gromig, R., Kuhn, G., Shibaev, Y. A., Kozachek, A. V., Ekaykin, A. A., and Chapligin, B.: Holocene hydrological variability of Lake Ladoga, northwest Russia, as inferred from diatom oxygen isotopes, Boreas, 48, 361–376, https://doi.org/10.1111/bor.12385, 2019.
Kostrova, S. S., Meyer, H., Fernandoy, F., Werner, M., and Tarasov, P. E.: Moisture origin and stable isotope characteristics of precipitation in southeast Siberia, Hydrol. Process., 34, 51–67, https://doi.org/10.1002/hyp.13571, 2020.
Kostrova, S. S., Biskaborn, B. K., Pestryakova, L. A., Fernandoy, F., Lenz, M. M., and Meyer, H.: Climate and environmental changes of the Lateglacial transition and Holocene in northeastern Siberia: Evidence from diatom oxygen isotopes and assemblage composition at Lake Emanda, Quaternary Sci. Rev., 259, 106905, https://doi.org/10.1016/j.quascirev.2021.106905, 2021.
Kruse, S., Bolshiyanov, D., Grigoriev, M. N., Morgenstern, A., Pestryakova, L., Tsibizov, L., and Udke, A.: Russian-German Cooperation: Expeditions to Siberia in 2018, TIB, https://doi.org/10.2312/BzPM_0734_2019, 2019.
Kurita, N., Yoshida, N., Inoue, G., and Chayanova, E. A.: Modern isotope climatology of Russia: A first assessment, J. Geophys. Res.-Atmos., 109, D03102, https://doi.org/10.1029/2003jd003404, 2004.
Laing, T. E. and Smol, J. P.: Late Holocene environmental changes inferred from diatoms in a lake on the western Taimyr Peninsula, northern Russia, J. Paleolimnol., 30, 231–247, https://doi.org/10.1023/A:1025561905506, 2003.
Last, W. M. and Smol, J. P. (Eds.): Tracking Environmental Change Using Lake Sediments, in: Volume 2: Physical and Geochemical Methods, Developments in Paleoenvironmental Research, Springer Dordrecht, ISBN 978-0-306-47670-9, https://doi.org/10.1007/0-306-47670-3, 2001.
Leclerc, A. J. and Labeyrie, L.: Temperature dependence of the oxygen isotopic fractionation between diatom silica and water, Earth Planet. Sc. Lett., 84, 69–74, https://doi.org/10.1016/0012-821X(87)90177-4, 1987.
Leng, M. J. and Barker, P. A.: A review of the oxygen isotope composition of lacustrine diatom silica for palaeoclimate reconstruction, Earth-Sci. Rev., 75, 5–27, https://doi.org/10.1016/j.earscirev.2005.10.001, 2006.
Leng, M. J. and Sloane, H. J.: Combined oxygen and silicon isotope analysis of biogenic silica, J. Quaternary Sci., 23, 313–319, https://doi.org/10.1002/jqs.1177, 2008.
Lenz, M. M., Andreev, A., Nazarova, L., Syrykh, L. S., Scheidt, S., Haflidason, H., Meyer, H., Brill, D., Wagner, B., Gromig, R., Lenz, M., Rolf, C., Kuhn, G., Fedorov, G., Svendsen, J. I., and Melles, M.: Climate, glacial and vegetation history of the polar Ural Mountains since c. 27 cal ka BP, inferred from a 54 m long sediment core from Lake Bolshoye Shchuchye, J. Quaternary Sci., 37, 818–835, https://doi.org/10.1002/jqs.3400, 2021.
Liu, Y., An, W., Wang, X., and Xu, C.: Moisture history in the Northeast China since 1750s reconstructed from tree-ring cellulose oxygen isotope, Quatern. Int., 625, 49–59, https://doi.org/10.1016/j.quaint.2022.03.009, 2022.
Mackay, A. W., Swann, G. E. A., Fagel, N., Fietz, S., Leng, M. J., Morley, D., Rioual, P., and Tarasov, P.: Hydrological instability during the Last Interglacial in central Asia: a new diatom oxygen isotope record from Lake Baikal, Quaternary Sci. Rev., 66, 45–54, https://doi.org/10.1016/j.quascirev.2012.09.025, 2013.
Manabe, S. and Stouffer, R. J.: Sensitivity of a global climate model to an increase of CO2concentration in the atmosphere, J. Geophys. Res., 85, 5529–5554, https://doi.org/10.1029/JC085iC10p05529, 1980.
Marshall, G. J.: Decadal Variability in the Impact of Atmospheric Circulation Patterns on the Winter Climate of Northern Russia, J. Climate, 34, 1005–1021, https://doi.org/10.1175/jcli-d-20-0566.1, 2021.
McKay, N. P. and Kaufman, D. S.: An extended Arctic proxy temperature database for the past 2,000 years, Sci. Data, 1, 140026, https://doi.org/10.1038/sdata.2014.26, 2014.
Meister, P., Alexandre, A., Bailey, H., Barker, P., Biskaborn, B. K., Broadman, E., Cartier, R., Chapligin, B., Couapel, M., Dean, J. R., Diekmann, B., Harding, P., Henderson, A. C. G., Hernandez, A., Herzschuh, U., Kostrova, S. S., Lacey, J., Leng, M. J., Lücke, A., Mackay, A. W., Magyari, E. K., Narancic, B., Porchier, C., Rosqvist, G., Shemesh, A., Sonzogni, C., Swann, G. E. A., Sylvestre, F., and Meyer, H.: A global compilation of diatom silica oxygen isotope records from lake sediment – trends and implications for climate reconstruction, Clim Past, 20, 363–392, https://doi.org/10.5194/cp-20-363-2024, 2024.
Messager, M. L., Lehner, B., Grill, G., Nedeva, I., and Schmitt, O.: Estimating the volume and age of water stored in global lakes using a geo-statistical approach, Nat. Commun., 7, 13603, https://doi.org/10.1038/ncomms13603, 2016.
Meyer, H., Schonicke, L., Wand, U., Hubberten, H. W., and Friedrichsen, H.: Isotope studies of hydrogen and oxygen in ground ice-experiences with the equilibration technique, Isotop. Environ. Health Stud., 36, 133–149, https://doi.org/10.1080/10256010008032939, 2000.
Meyer, H., Chapligin, B., Hoff, U., Nazarova, L., and Diekmann, B.: Oxygen isotope composition of diatoms as Late Holocene climate proxy at Two-Yurts Lake, Central Kamchatka, Russia, Global Planet. Change, 134, 118–128, https://doi.org/10.1016/j.gloplacha.2014.04.008, 2015.
Meyer, H., Kostrova, S. S., Meister, P., Lenz, M. M., Kuhn, G., Nazarova, L., Syrykh, L. S., and Dvornikov, Y.: Lacustrine diatom oxygen isotopes as palaeo precipitation proxy – Holocene environmental and snowmelt variations recorded at Lake Bolshoye Shchuchye, Polar Urals, Russia, Quaternary Sci. Rev., 290, 107620, https://doi.org/10.1016/j.quascirev.2022.107620, 2022.
Miesner, T., Herzschuh, U., Pestryakova, L. A., Wieczorek, M., Zakharov, E. S., Kolmogorov, A. I., Davydova, P. V., and Kruse, S.: Forest structure and individual tree inventories of northeastern Siberia along climatic gradients, Earth Syst. Sci. Data, 14, 5695–5716, https://doi.org/10.5194/essd-14-5695-2022, 2022.
Miller, G. H., Alley, R. B., Brigham-Grette, J., Fitzpatrick, J. J., Polyak, L., Serreze, M. C., and White, J. W. C.: Arctic amplification: can the past constrain the future?, Quaternary Sci. Rev., 29, 1779–1790, https://doi.org/10.1016/j.quascirev.2010.02.008, 2010.
Mock, C. J., Bartlein, P. J., and Anderson, P. M.: Atmospheric circulation patterns and spatial climatic variations in Beringia, Int. J. Climatol., 18, 1085–1104, https://doi.org/10.1002/(sici)1097-0088(199808)18:10<1085::Aid-joc305>3.0.Co;2-k, 1998.
Mollenhauer, G., Grotheer, H., Gentz, T., Bonk, E., and Hefter, J.: Standard operation procedures and performance of the MICADAS radiocarbon laboratory at Alfred Wegener Institute (AWI), Germany, Nucl. Instrum. Meth. Phys. Res. Sect. B, 496, 45–51, https://doi.org/10.1016/j.nimb.2021.03.016, 2021.
Morley, D. W., Leng, M. J., Mackay, A. W., Sloane, H. J., Rioual, P., and Battarbee, R. W.: Cleaning of lake sediment samples for diatom oxygen isotope analysis, J. Paleolimnol., 31, 391–401, https://doi.org/10.1023/B:JOPL.0000021854.70714.6b, 2004.
Moschen, R., Lücke, A., and Schleser, G. H.: Sensitivity of biogenic silica oxygen isotopes to changes in surface water temperature and palaeoclimatology, Geophys. Res. Lett., 32, L07708, https://doi.org/10.1029/2004gl022167, 2005.
Osborn, T. J.: Recent variations in the winter North Atlantic Oscillation, Weather, 61, 353–355, https://doi.org/10.1256/wea.190.06, 2006.
Overland, J. E. and Wang, M.: The 2020 Siberian heat wave, Int. J. Climatol., 41, E2341–E2346, https://doi.org/10.1002/joc.6850, 2020.
Pacyna, J. M., Travnikov, O., De Simone, F., Hedgecock, I. M., Sundseth, K., Pacyna, E. G., Steenhuisen, F., Pirrone, N., Munthe, J., and Kindbom, K.: Current and future levels of mercury atmospheric pollution on a global scale, Atmos. Chem. Phys., 16, 12495–12511, https://doi.org/10.5194/acp-16-12495-2016, 2016.
Pfalz, G., Diekmann, B., Freytag, J.-C., Syrykh, L., Subetto, D. A., and Biskaborn, B. K.: Improving age–depth relationships by using the LANDO (“Linked age and depth modeling”) model ensemble, Geochronology, 4, 269–295, https://doi.org/10.5194/gchron-4-269-2022, 2022.
Philippsen, B.: The freshwater reservoir effect in radiocarbon dating, Heritage Sci., 1, 24, https://doi.org/10.1186/2050-7445-1-24, 2013.
Previdi, M., Smith, K. L., and Polvani, L. M.: Arctic amplification of climate change: a review of underlying mechanisms, Environ. Res. Lett., 16, 093003, https://doi.org/10.1088/1748-9326/ac1c29, 2021.
Rantanen, M., Karpechko, A. Y., Lipponen, A., Nordling, K., Hyvärinen, O., Ruosteenoja, K., Vihma, T., and Laaksonen, A.: The Arctic has warmed nearly four times faster than the globe since 1979, Commun. Earth Environ., 3, 168, https://doi.org/10.1038/s43247-022-00498-3, 2022.
Reimer, P. J., Austin, W. E. N., Bard, E., Bayliss, A., Blackwell, P. G., Bronk Ramsey, C., Butzin, M., Cheng, H., Edwards, R. L., Friedrich, M., Grootes, P. M., Guilderson, T. P., Hajdas, I., Heaton, T. J., Hogg, A. G., Hughen, K. A., Kromer, B., Manning, S. W., Muscheler, R., Palmer, J. G., Pearson, C., van der Plicht, J., Reimer, R. W., Richards, D. A., Scott, E. M., Southon, J. R., Turney, C. S. M., Wacker, L., Adolphi, F., Büntgen, U., Capano, M., Fahrni, S. M., Fogtmann-Schulz, A., Friedrich, R., Köhler, P., Kudsk, S., Miyake, F., Olsen, J., Reinig, F., Sakamoto, M., Sookdeo, A., and Talamo, S.: The IntCal20 Northern Hemisphere Radiocarbon Age Calibration Curve (0–55 cal kBP), Radiocarbon, 62, 725–757, https://doi.org/10.1017/rdc.2020.41, 2020.
Roberts, S., Adams, J. K., Mackay, A. W., Swann, G. E. A., McGowan, S., Rose, N. L., Panizzo, V., Yang, H., Vologina, E., Sturm, M., and Shchetnikov, A. A.: Mercury loading within the Selenga River basin and Lake Baikal, Siberia, Environ. Pollut., 259, 113814, https://doi.org/10.1016/j.envpol.2019.113814, 2020.
Rosqvist, G. C., Rietti-Shati, M., and Shemesh, A.: Late glacial to middle Holocene climatic record of lacustrine biogenic silica oxygen isotopes from a Southern Ocean island, Geology, 27, 967–970, https://doi.org/10.1130/0091-7613(1999)027<0967:Lgtmhc>2.3.Co;2, 1999.
Rosqvist, G. C., Leng, M. J., Goslar, T., Sloane, H. J., Bigler, C., Cunningham, L., Dadal, A., Bergman, J., Berntsson, A., Jonsson, C., and Wastegård, S.: Shifts in precipitation during the last millennium in northern Scandinavia from lacustrine isotope records, Quaternary Sci. Rev., 66, 22–34, https://doi.org/10.1016/j.quascirev.2012.10.030, 2013.
Rutkowski, C., Lenz, J., Lang, A., Wolter, J., Mothes, S., Reemtsma, T., Grosse, G., Ulrich, M., Fuchs, M., Schirrmeister, L., Fedorov, A., Grigoriev, M., Lantuit, H., and Strauss, J.: Mercury in sediment core samples from deep Siberian ice-rich permafrost, Front. Earth Sci., 9, 718153, https://doi.org/10.3389/feart.2021.718153, 2021.
Sato, T., Nakamura, T., Iijima, Y., and Hiyama, T.: Enhanced Arctic moisture transport toward Siberia in autumn revealed by tagged moisture transport model experiment, npj Clim. Atmos. Sci., 5, 91, https://doi.org/10.1038/s41612-022-00310-1, 2022.
Scholten, R. C., Coumou, D., Luo, F., and Veraverbeke, S.: Early snowmelt and polar jet dynamics co-influence recent extreme Siberian fire seasons, Science, 378, 1005–1009, https://doi.org/10.1126/science.abn4419, 2022.
Seneviratne, S. I., Zhang, X., Adnan, M., Badi, W., Dereczynski, C., Di Luca, A., Ghosh, S., Iskandar, I., Kossin, J., Lewis, S., Otto, F., Pinto, I., Satoh, M., Vicente-Serrano, S. M., Wehner, M., and Zho, B.: Weather and Climate Extreme Events in a Changing Climate, in: Climate Change 2021: The Physical Science Basis, Contribution of Working Group I to the Sixth Assessment Report of the Intergovernmental Panel on Climate Change, edited by: Masson-Delmotte, V., Zhai, P., Pirani, A., Connors, S. L., Péan, C., Berger, S., Caud, N., Chen, Y., Goldfarb, L., Gomis, M. I., Huang, M., Leitzell, K., Lonnoy, E., Matthews, J. B. R., Maycock, T. K., Waterfield, T., Yelekçi, O., Yu, R., and Zhou, B., Cambridge University Press, Cambridge, UK and New York, NY, USA, 1513–1766, https://doi.org/10.1017/9781009157896.013, 2021.
Shahgedanova, M.: Climate at present and in the historical past, The physical geography of northern Eurasia, Oxford University Press, Oxford, 70–102, ISBN 0-19-823384-1, 2002.
Shemesh, A. and Peteet, D.: Oxygen isotopes in fresh water biogenic opal – Northeastern US Alleröd-Younger Dryas temperature shift, Geophys. Res. Lett., 25, 1935–1938, https://doi.org/10.1029/98gl01443, 1998.
Shemesh, A., Rosqvist, G., Rietti-Shati, M., Rubensdotter, L., Bigler, C., Yam, R., and Karlén, W.: Holocene climatic change in Swedish Lapland inferred from an oxygen-isotope record of lacustrine biogenic silica, Holocene, 11, 447–454, https://doi.org/10.1191/095968301678302887, 2001.
Stenchikov, G., Delworth, T. L., Ramaswamy, V., Stouffer, R. J., Wittenberg, A., and Zeng, F.: Volcanic signals in oceans, J. Geophys. Res., 114, D16104, https://doi.org/10.1029/2008jd011673, 2009.
Stieg, A., Biskaborn, B. K., Herzschuh, U., Strauss, J., Pestryakova, L. A., and Meyer, H.: Sub-decadal diatom oxygen isotope record and biogeochemical data of the last 220 years (2015–1790 CE) based on a sediment short core from Lake Khamra, Yakutia, Siberia, PANGAEA [data set], https://doi.org/10.1594/PANGAEA.962988, 2024.
Stuiver, M. and Reimer, P. J.: A Computer Program for Radiocarbon Age Calibration, Radiocarbon, 28, 1022–1030, https://doi.org/10.1017/S0033822200060276, 1986.
Stuiver, M. and Reimer, P. J.: Extended 14C Data Base and Revised CALIB 3.0 14C Age Calibration Program, Radiocarbon, 35, 215–230, https://doi.org/10.1017/S0033822200013904, 1993.
Sun, C., Li, J., and Zhao, S.: Remote influence of Atlantic multidecadal variability on Siberian warm season precipitation, Sci. Rep., 5, 16853, https://doi.org/10.1038/srep16853, 2015.
Sundseth, K., Pacyna, J. M., Pacyna, E. G., Pirrone, N., and Thorne, R. J.: Global Sources and Pathways of Mercury in the Context of Human Health, Int. J. Environ. Res. Publ. Health, 14, 105, https://doi.org/10.3390/ijerph14010105, 2017.
Swann, G. E. A. and Leng, M. J.: A review of diatom δ18O in palaeoceanography, Quaternary Sci. Rev., 28, 384–398, https://doi.org/10.1016/j.quascirev.2008.11.002, 2009.
Swann, G. E. A., Leng, M. J., Juschus, O., Melles, M., Brigham-Grette, J., and Sloane, H. J.: A combined oxygen and silicon diatom isotope record of Late Quaternary change in Lake El'gygytgyn, North East Siberia, Quaternary Sci. Rev., 29, 774–786, https://doi.org/10.1016/j.quascirev.2009.11.024, 2010.
Swann, G. E. A., Mackay, A. W., Vologina, E., Jones, M. D., Panizzo, V. N., Leng, M. J., Sloane, H. J., Snelling, A. M., and Sturm, M.: Lake Baikal isotope records of Holocene Central Asian precipitation, Quaternary Sci. Rev., 189, 210–222, https://doi.org/10.1016/j.quascirev.2018.04.013, 2018.
Tomshin, O. and Solovyev, V.: Features of the Extreme Fire Season of 2021 in Yakutia (Eastern Siberia) and Heavy Air Pollution Caused by Biomass Burning, Remote Sens., 14, 4980, https://doi.org/10.3390/rs14194980, 2022.
Trouet, V., Esper, J., Graham, N. E., Baker, A., Scourse, J. D., and Frank, D. C.: Persistent positive North Atlantic oscillation mode dominated the Medieval Climate Anomaly, Science, 324, 78–80, https://doi.org/10.1126/science.1166349, 2009.
van Hardenbroek, M., Chakraborty, A., Davies, K. L., Harding, P., Heiri, O., Henderson, A. C. G., Holmes, J. A., Lasher, G. E., Leng, M. J., Panizzo, V. N., Roberts, L., Schilder, J., Trueman, C. N., and Wooller, M. J.: The stable isotope composition of organic and inorganic fossils in lake sediment records: Current understanding, challenges, and future directions, Quaternary Sci. Rev., 196, 154–176, https://doi.org/10.1016/j.quascirev.2018.08.003, 2018.
Vyse, S. A., Herzschuh, U., Andreev, A. A., Pestryakova, L. A., Diekmann, B., Armitage, S. J., and Biskaborn, B. K.: Geochemical and sedimentological responses of arctic glacial Lake Ilirney, chukotka (far east Russia) to palaeoenvironmental change since ∼51.8 ka BP, Quaternary Sci. Rev., 247, 106607, https://doi.org/10.1016/j.quascirev.2020.106607, 2020.
Wang, Q., Kim, D., Dionysiou, D. D., Sorial, G. A., and Timberlake, D.: Sources and remediation for mercury contamination in aquatic systems – a literature review, Environ. Pollut., 131, 323–336, https://doi.org/10.1016/j.envpol.2004.01.010, 2004.
Watanabe, T., Matsuyama, H., Kuzhevskaia, I., Nechepurenko, O., Chursin, V., and Zemtsov, V.: Long-Term Trends of Extreme Climate Indexes in the Southern Part of Siberia in Comparison with Those of Surrounding Regions, Atmosphere, 14, 1131, https://doi.org/10.3390/atmos14071131, 2023.
Wegmann, M., Orsolini, Y., Vázquez, M., Gimeno, L., Nieto, R., Bulygina, O., Jaiser, R., Handorf, D., Rinke, A., Dethloff, K., Sterin, A., and Brönnimann, S.: Arctic moisture source for Eurasian snow cover variations in autumn, Environm. Res. Lett., 10, 054015, https://doi.org/10.1088/1748-9326/10/5/054015, 2015.
Wetterich, S., Herzschuh, U., Meyer, H., Pestryakova, L., Plessen, B., Lopez, C. M. L., and Schirrmeister, L.: Evaporation effects as reflected in freshwaters and ostracod calcite from modern environments in Central and Northeast Yakutia (East Siberia, Russia), Hydrobiologia, 614, 171–195, https://doi.org/10.1007/s10750-008-9505-y, 2008.
Ye, H. C., Cho, H. R., and Gustafson, P. E.: The changes in Russian winter snow accumulation during 1936-83 and its spatial patterns, J. Climate, 11, 856–863, https://doi.org/10.1175/1520-0442(1998)011<0856:Tcirws>2.0.Co;2, 1998.
Zielinski, G. A., Mayewski, P. A., Meeker, L. D., Whitlow, S., Twickler, M. S., Morrison, M., Meese, D. A., Gow, A. J., and Alley, R. B.: Record of Volcanism Since 7000 B.C. from the GISP2 Greenland Ice Core and Implications for the Volcano-Climate System, Science, 264, 948–952, https://doi.org/10.1126/science.264.5161.948, 1994.