the Creative Commons Attribution 4.0 License.
the Creative Commons Attribution 4.0 License.
 | 18 Mar 2024
A past and present perspective on the European summer vapor pressure deficit
Viorica Nagavciuc
Simon L. L. Michel
Daniel F. Balting
Gerhard Helle
Mandy Freund
Gerhard H. Schleser
David N. Steger
Gerrit Lohmann
Monica Ionita
The response of evapotranspiration to anthropogenic warming is of critical importance for the water and carbon cycle. Contradictory conclusions about evapotranspiration changes are caused primarily by their brevity in time and sparsity in space, as well as the strong influence of internal variability. Here, we present the first gridded reconstruction of the summer (June, July, and August) vapor pressure deficit (VPD) for the past 4 centuries at the European level. This gridded reconstruction is based on 26 European tree ring oxygen isotope records and is obtained using a random forest approach. According to validation scores obtained with the Nash–Sutcliffe model efficiency, our reconstruction is robust over large parts of Europe since 1600, in particular for the westernmost and northernmost regions, where most tree ring records are located. Based on our reconstruction, we show that from the mid-1700s a trend towards higher summer VPD occurred in central Europe and the Mediterranean region that is related to a simultaneous increase in temperature and decrease in precipitation. This increasing summer VPD trend continues throughout the observational period and in recent times. Moreover, our summer VPD reconstruction helps to visualize the local and regional impacts of the current climate change, as well as to minimize statistical uncertainties of historical VPD variability. This paper provides also new insights into the relationship between summer VPD and large-scale atmospheric circulation, and we show that summer VPD has two preferred modes of variability, namely a NW–SE dipole-like mode and a N–S dipole-like mode. Furthermore, the interdisciplinary use of the data should be emphasized, as summer VPD is a crucial parameter for many climatological feedback processes in the Earth's surface system. The reconstructed summer VPD gridded data over the last 400 years are available at the following link: https://doi.org/10.5281/zenodo.5958836 (Balting et al., 2022).
- Article
(6119 KB) - Full-text XML
-
Supplement
(918 KB) - BibTeX
- EndNote


Evapotranspiration is a critical factor for understanding the links and feedback between atmospheric CO2 and global climate (Good et al., 2015; IPCC, 2021b, a). Within the terrestrial water fluxes, vegetation-produced transpiration represents the dominant factor (Good et al., 2015; IPCC, 2021b, a). One key driver for such vegetation resources and dynamics is vapor pressure deficit (VPD), defined by the difference between the water vapor pressure at saturation and the actual water vapor pressure (Good et al., 2015; IPCC, 2021b, a). The VPD represents the atmospheric evaporative demand, which has an influence on the leaf-level transpiration of terrestrial vegetation and the corresponding stomatal conductance (Grossiord et al., 2020). With increasing VPD, the stomata are closing to minimize water loss (Running, 1976) due to the high atmospheric evaporative demand. Consequently, a minimal stomata opening decreases stomatal conductance and photosynthetic activity (Fletcher et al., 2007).
Vapor pressure deficit (VPD), a fundamental meteorological parameter, exerts a profound influence on diverse aspects of agriculture, ecosystems, and the environment as a whole (Novick et al., 2016). VPD plays a pivotal role in regulating plant growth and health by influencing transpiration rates, stomatal conductance, and overall water uptake mechanisms, which in turn dictate plant morphology, physiology, and productivity (Restaino et al., 2016). Elevated VPD is associated with increased forest mortality (Williams et al., 2013) and enhanced drought susceptibility (Dai, 2013). Furthermore, VPD plays a critical role in crop production and quality. Maintaining an optimal VPD range is essential for maximizing photosynthetic efficiency, nutrient uptake, and ultimately crop yield. Deviating from this optimal range can lead to stress-induced physiological disorders, reduced yields, and inferior produce quality (Zhao et al., 2017). Moreover, high VPD values are linked to elevated wildfire risk (Seager et al., 2015). Understanding VPD dynamics is crucial for wildfire prediction, management, and mitigation strategies aimed at minimizing the destructive impacts of wildfires on both natural ecosystems and human settlements. Changes in VPD driven by climate variability can induce shifts in vegetation patterns, alter species distributions, and affect biodiversity (Zhang et al., 2019). Comprehending the complexities of VPD and its interactions with various environmental factors is essential for sustainable agriculture, ecosystem conservation, and effective fire management.
Since VPD is a function of temperature (Lawrence, 2005), the effects of climate change and the associated increase in the mean global temperature lead to positive trends in the regional and global VPD (Grossiord et al., 2020; IPCC, 2021b). For instance, studies have shown that the VPD has been increasing sharply at a global scale since the year 2000 (Simmons et al., 2010; Willett et al., 2014; Yuan et al., 2019). Spatially explicit VPD records derived from remote sensing data cover only the last ∼50 years and vary in quality, so long-term perspectives of VPD variability are lacking. However, long-term perspectives can help to put recently observed trends of VPD in a long-term context relevant for estimating the significance and robustness of these changes at both local and continental scales. Furthermore, it is essential to investigate the independent physiological effects of VPD on large-scale vegetation dynamics, a topic that is far less explored (Grossiord et al., 2020). So far, the first local reconstruction studies have shown the potential for a long-term perspective on VPD (Liu et al., 2017; Roibu et al., 2022). Churakova Sidorova et al. (2020) have shown that the recent VPD increase does not yet exceed the maximum values reconstructed during the Medieval Warm Anomaly in Siberia. Nevertheless, most studies lack a wider spatial perspective as they only reconstruct VPD time series for a single location. Therefore, it appears necessary for high-resolution VPD reconstructions over extended spatial regions (e.g., the European region).
Tree ring sequences are one of the most used proxy archives for paleoclimatic and environmental reconstructions because of their annual resolution, precise dating, and widespread spatial extent (Leonelli et al., 2017). Moreover, they allow us to create chronologies of thousands of years and give us the possibility to explore the climate through different tree-ring-based climate-sensitive parameters, such as tree ring width, maximum density, and/or stable isotopes (Nagavciuc et al., 2022). Of all physical or chemical parameters to be measured of annual rings, the stable oxygen isotope ratio of tree ring cellulose (δ18O) has the advantages that the isotopic fractions controlled by physiological processes are reasonably well understood and the statistical relationship with climatic and environmental quantities is rather robust (McCarroll and Loader, 2004; Siegwolf et al., 2022). Combining these advantages with the advantages of annual tree rings, stable oxygen isotopes in tree ring cellulose may be one of the most valuable proxies for the paleoclimatic reconstructions. Nonetheless, there are still questions to be answered about the variability of δ18O in the arboreal system (Gagen et al., 2022).
The δ18O in tree ring cellulose is mainly influenced (i) by δ18O signature of precipitation (through water uptake by the roots from the soil) (McCarroll and Loader, 2004; Siegwolf et al., 2022); (ii) by biochemical fractionation including partial isotopic exchange of cellulose precursors with stem water during cellulose biosynthesis (Barbour, 2007; Roden et al., 2000; Saurer et al., 1997), which is considered to be largely constant at 27±4 ‰ (Sternberg and DeNiro, 1983); and (iii) most importantly by the evaporative 18O enrichment of leaf or needle water via transpiration of water vapor to the atmosphere (Kahmen et al., 2011; Roden et al., 2000; Saurer et al., 1997). Trees absorb water from the soil, which reflects the δ18O values of local precipitation. As δ18O values of precipitation change, this is reflected in the δ18O values of the trees' cellulose, providing a valuable proxy for past climate conditions. Balting et al. (2021) analyzed the relationship between intra-annual tree ring δ18O data from the ISONET network and δ18O in precipitation water and found significant correlations, results which are supported by numerous local-scale studies (Jones et al., 2016; Locosselli et al., 2020). The transpiration process is controlled by leaf-to-air VPD modified by the aperture of stomata controlling the conductance of water vapor (Buckley, 2019; McCarroll and Loader, 2004). The δ18O values of leaf water are typically enriched in 18O compared to the plant's parent water because evaporative losses are greater for the lighter 16O than for 18O (Roden et al., 2000). However, the δ18O signature of chloroplast water is not in isotopic equilibrium with leaf water at the actual sites of transpiration (stomata), i.e., the higher the transpiration rates, the lower the rate of enrichment of the chloroplast water, the so-called Péclet effect (Barbour et al., 2004). To a good approximation, tree ring δ18O from European sites can be considered a combined signal of the largely temperature-dependent δ18O of the water source (precipitation, soil water) and the evaporative 18O enrichment of leaf water controlled by leaf-to-air VPD, meaning that tree ring δ18O can be used as a proxy for variations in VPD (Ferrio and Voltas, 2005; Kahmen et al., 2011).
In order to have a long-term overview of the observed changes and trends in the regional and global VPD, one needs to look back in the past by employing different proxy indicators (e.g., from tree rings). In this respect, the availability of the ISONET network (Balting et al., 2021; ISONET Project Members et al., 2023; Treydte et al., 2007a, b) gave us the opportunity to develop the first gridded summer VPD reconstruction at the European level by using multiple stable oxygen isotope records derived from tree rings. The reconstruction of our VPD dataset, which covers the last 400 years, has been obtained by applying a random forest (RF) regression method (Breiman, 2001). According to Yang et al. (2020), RF has become one of the most successful machine learning algorithms for practical applications over the last 2 decades due to its proven accuracy, stability, speed of processing, and ease of use (Bair et al., 2018; Belgiu and Drăgu, 2016; Maxwell et al., 2018; Qu et al., 2019; Reichstein et al., 2019; Rodriguez-Galiano et al., 2012; Tyralis et al., 2019). The term RF describes a nonlinear and robust technique in which several decision trees are built and aggregated at the end to make predictions or perform reconstructions (Breiman, 2001). The RF approach is increasingly applied in climate and environmental sciences and has been used for the prediction of snow depth (Yang et al., 2020), solar radiation (Prasad et al., 2019), daily ozone (Zhan et al., 2018), and precipitation (Ali et al., 2020); for reconstructions of last millennium North Atlantic Oscillation (NAO; Michel et al., 2020), Atlantic Multidecadal Variability (Michel et al., 2022), El Niño–Southern Oscillation (Delcroix et al., 2022), streamflow since 1485 CE (Li et al., 2019), and vegetation cover during the mid-Holocene and the Last Glacial Maximum (Lindgren et al., 2021); and for calculating tree growth response to earthquakes (Mohr et al., 2021). Although RF models have proved to be a useful method in geosciences, studies on the spatial–temporal reconstruction of climate variables based on δ18O are relatively rare due to the low availability of δ18O time series. Here, the RF model is used independently for the reconstruction of each grid point, meaning that we build several one-dimensional climate time series reconstruction models where the respective weights of the δ18O values of tree ring cellulose vary for each grid point (see Sect. 2). In this regard, recent studies reconstructing climate time series as done here showed that RF generally outperforms most commonly used variants of linear regression model (e.g., principal component regression, partial least squares; Delcroix et al., 2022; Michel et al., 2020, 2022).
The purpose of this study is to apply an RF approach (Breiman, 2001) for reconstructing the European summer (averaged for June–July–August) VPD for the first time on a gridded scale from a proxy network that is based on 26 series of tree ring δ18O and covers the period 1600–1994 (Balting et al., 2021; ISONET Project Members et al., 2023). The main aim is to present the summer VPD reconstruction dataset for the last 400 years over Europe and provide both a spatial and a temporal long-term perspective on the past summer VPD variability. The VPD reconstruction is analyzed subsequently from a spatiotemporal perspective for northern Europe, central Europe, and the Mediterranean region (Iturbide et al., 2020), as defined and used in the Sixth Assessment Report (AR6) of the IPCC (IPCC, 2021a). The data evaluation in this paper is structured as follows. In Sect. 2 we give a detailed description of the data and methods employed, while the main results are presented in Sect. 3. First, we present the sensitivity of δ18O for VPD variability and the validations statistics for the reconstruction. Second, we investigate the spatial variability of VPD in comparison with other studies and analyses for selected extreme years for additional validation of our reconstructions. We also present the relationship between summer VPD and large-scale atmospheric circulation in a long-term context. Statistical uncertainties are discussed in Sect. 4, while conclusions and outlooks are presented in Sect. 5. In this way, the past and present VPD conditions are presented and evaluated to assess the statistical significance of observed trends to understand VPD variability on a local, regional, and continental scale.
2.1 The stable isotope network
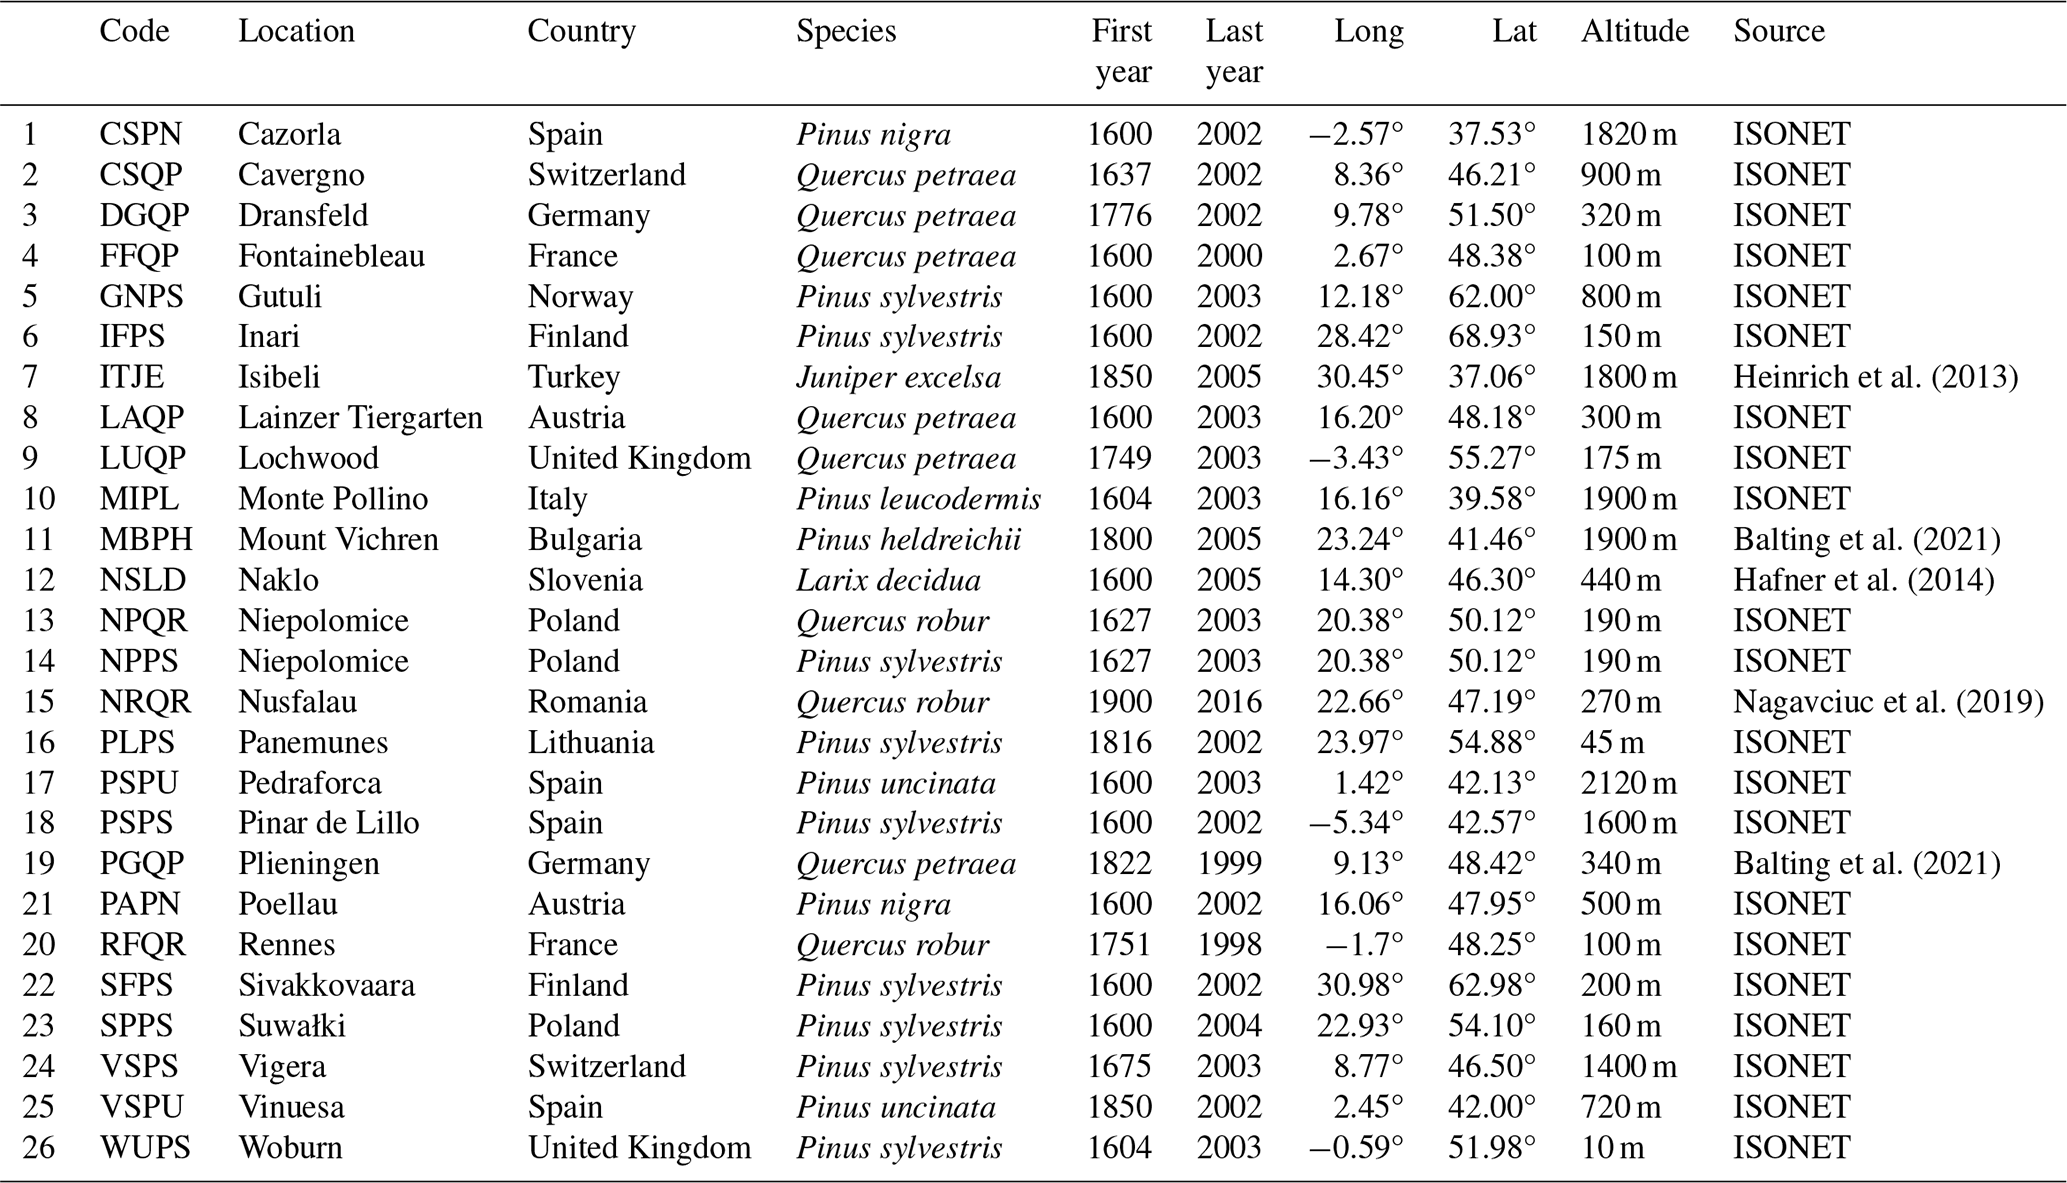
To reconstruct the European summer VPD, we used 26 time series of stable oxygen isotopes in tree ring cellulose (δ18O) (Fig. 1, Table 1). From the 26 time series used in this study, 21 time series were obtained from the dataset generated by the EU project ISONET (EVK2-CT-2002-00147) (Balting et al., 2021; ISONET Project Members et al., 2023; Treydte et al., 2007a, b). In addition to the ISONET dataset, we added five new δ18O time series from Bulgaria, Turkey, southwestern Germany, Romania, and Slovenia (Balting et al., 2021; Hafner et al., 2014; Heinrich et al., 2013; Nagavciuc et al., 2019) (Fig. 1).
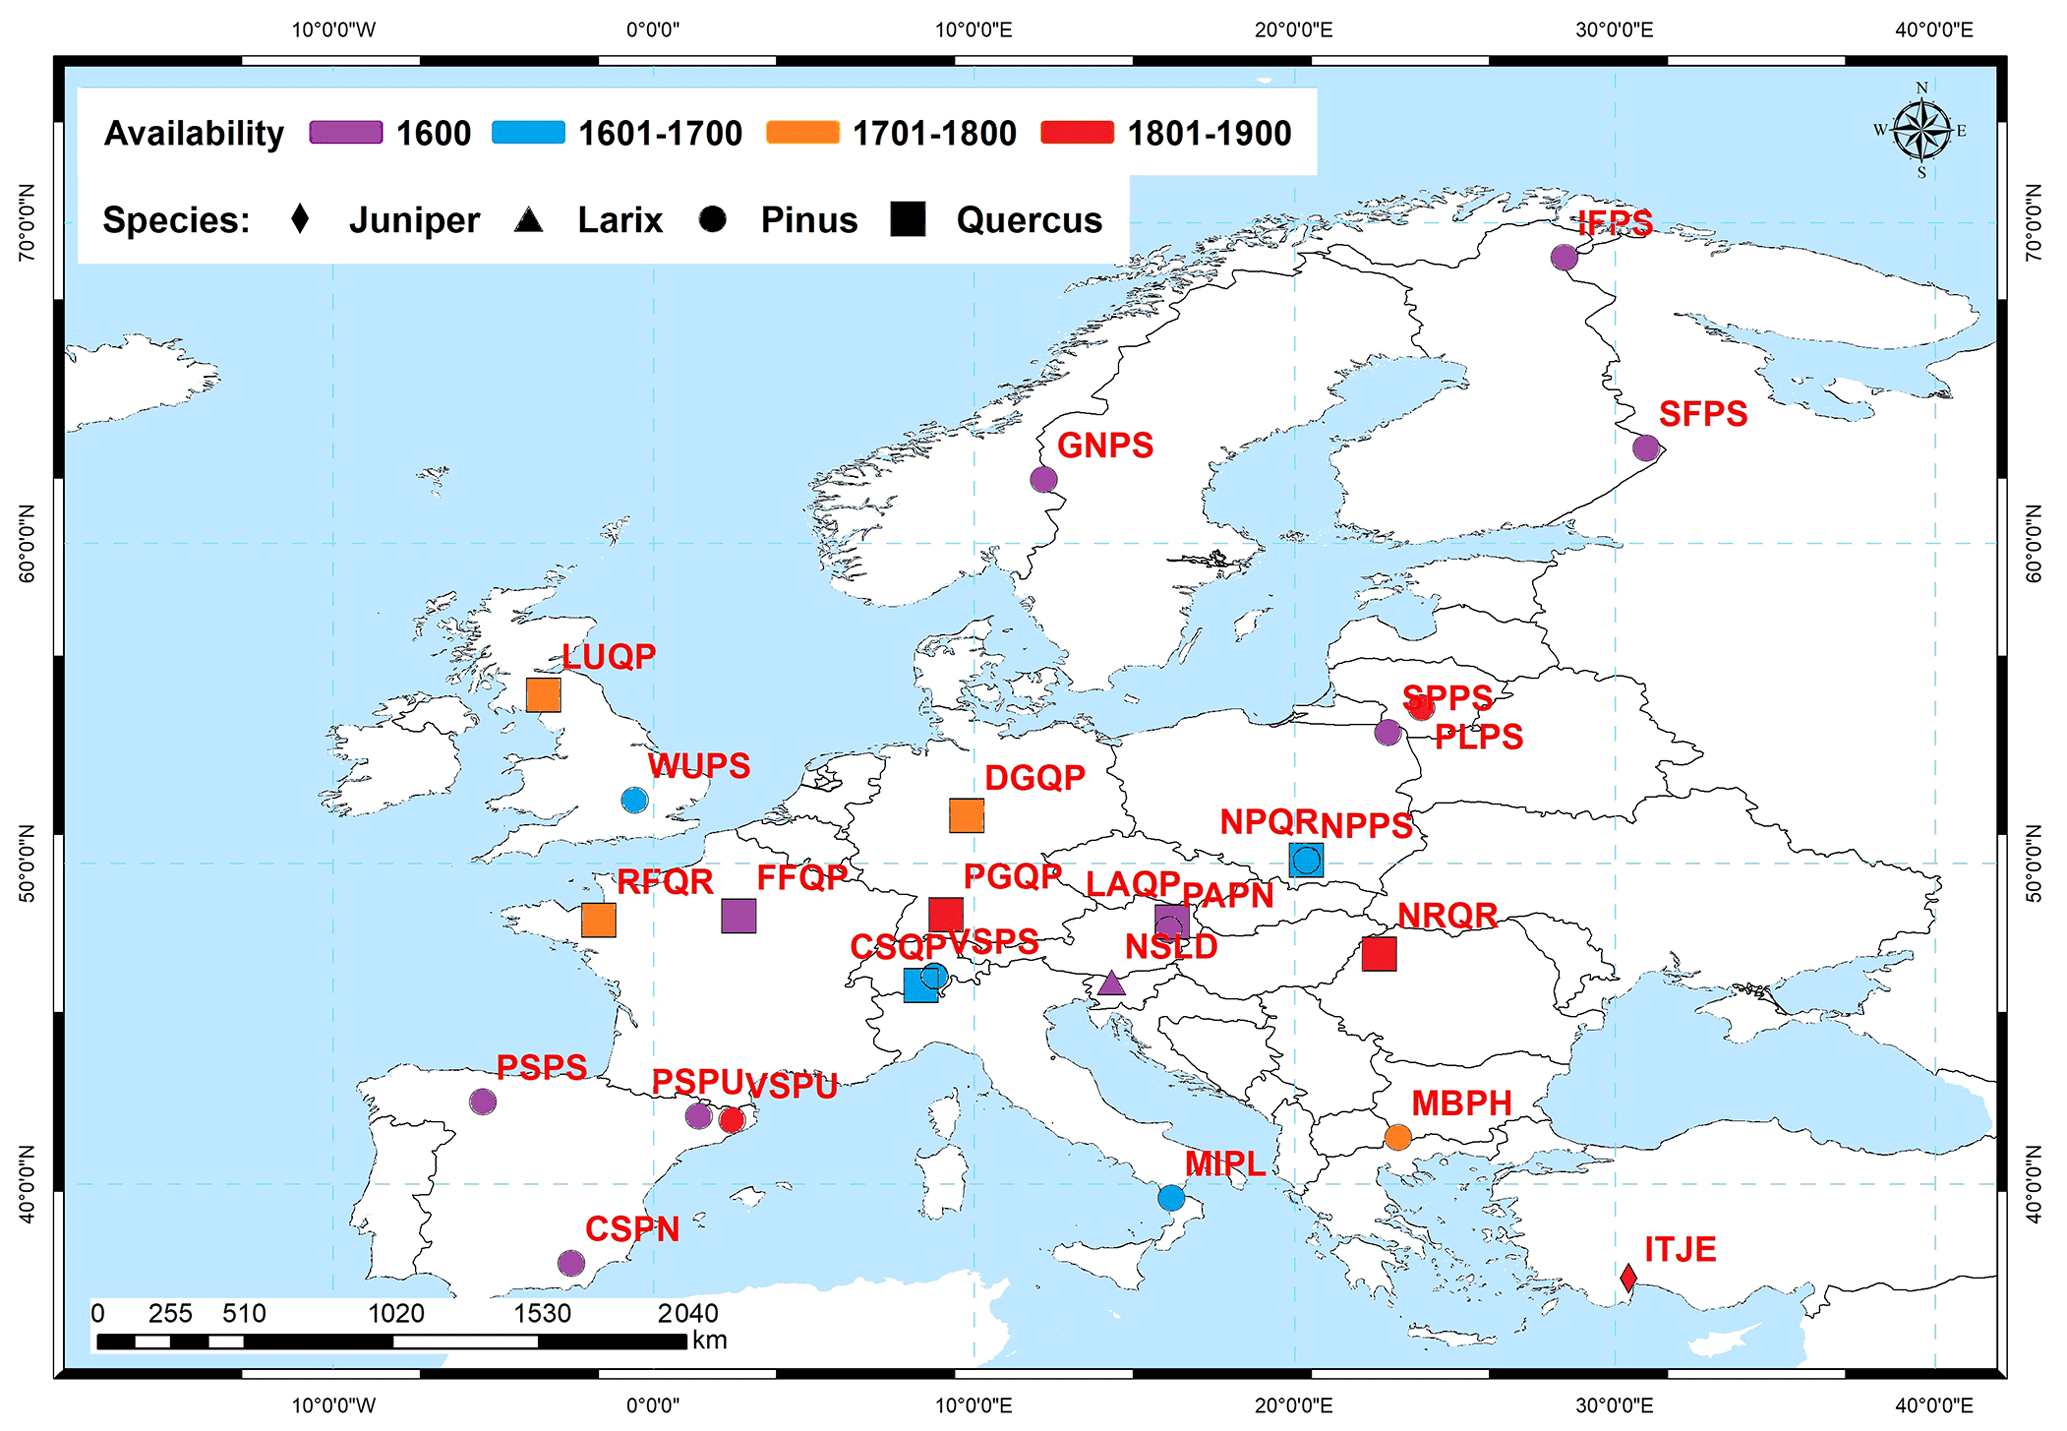
Figure 1The site distribution of the δ18O network composed of 21 ISONET and 5 additional datasets (see Table 1). Colors indicate the past temporal availability of each tree ring dataset: starts in 1600 or earlier (purple), starts between 1601 and 1700 (blue), starts between 1701 and 1800 (orange), and starts between 1801 and 1900 (red). Symbols indicate tree species used for each record: Juniper (diamond), Larix (triangle), Pinus (circle), and Quercus (square).
The detailed measurement methodologies used within the ISONET project and the other sites are described in the description file of the dataset (ISONET Project Members et al., 2023) and also described in more detail in previously published papers (Boettger et al., 2007; Hafner et al., 2014; Heinrich et al., 2013; Nagavciuc et al., 2019; Treydte et al., 2007b, a). At least four dominant trees were selected at each site and two increment cores were taken per tree for the ISONET project; 15 cores of 5 living trees were taken from the site in Turkey (Heinrich et al., 2013), 12 trees were sampled for the Slovenian time series (Hafner et al., 2014), and 1 core per tree was taken from 9 trees in Romania (Nagavciuc et al., 2019). A standard dendrochronological dating method was performed (Fritts, 1976), and subsequent individual growth rings were dissected from the cores. All tree rings from the same year were pooled for most sites prior to cellulose extraction for the ISONET sites (Treydte et al., 2007b, a) and the Romanian site (Nagavciuc et al., 2019). The dissected tree rings from the Slovenian and Turkish sites were measured individually and not pooled (Hafner et al., 2014; Heinrich et al., 2013). For oak, only the latewood was used for the analyses. This approach was assumed to use predominantly climate signals from the current year, as the earlywood of oaks can contain climate information from the previous year (Davies and Loader, 2020; González-González et al., 2015). All δ18O time series were measured according to standard methodology, and the inter-lab differences are assumed negligible for future analysis. The results are expressed using the conventional δ (delta) notation, i.e., in per mil (‰) relative to the Vienna Standard Mean Ocean Water (VSMOW) (Craig, 1957).
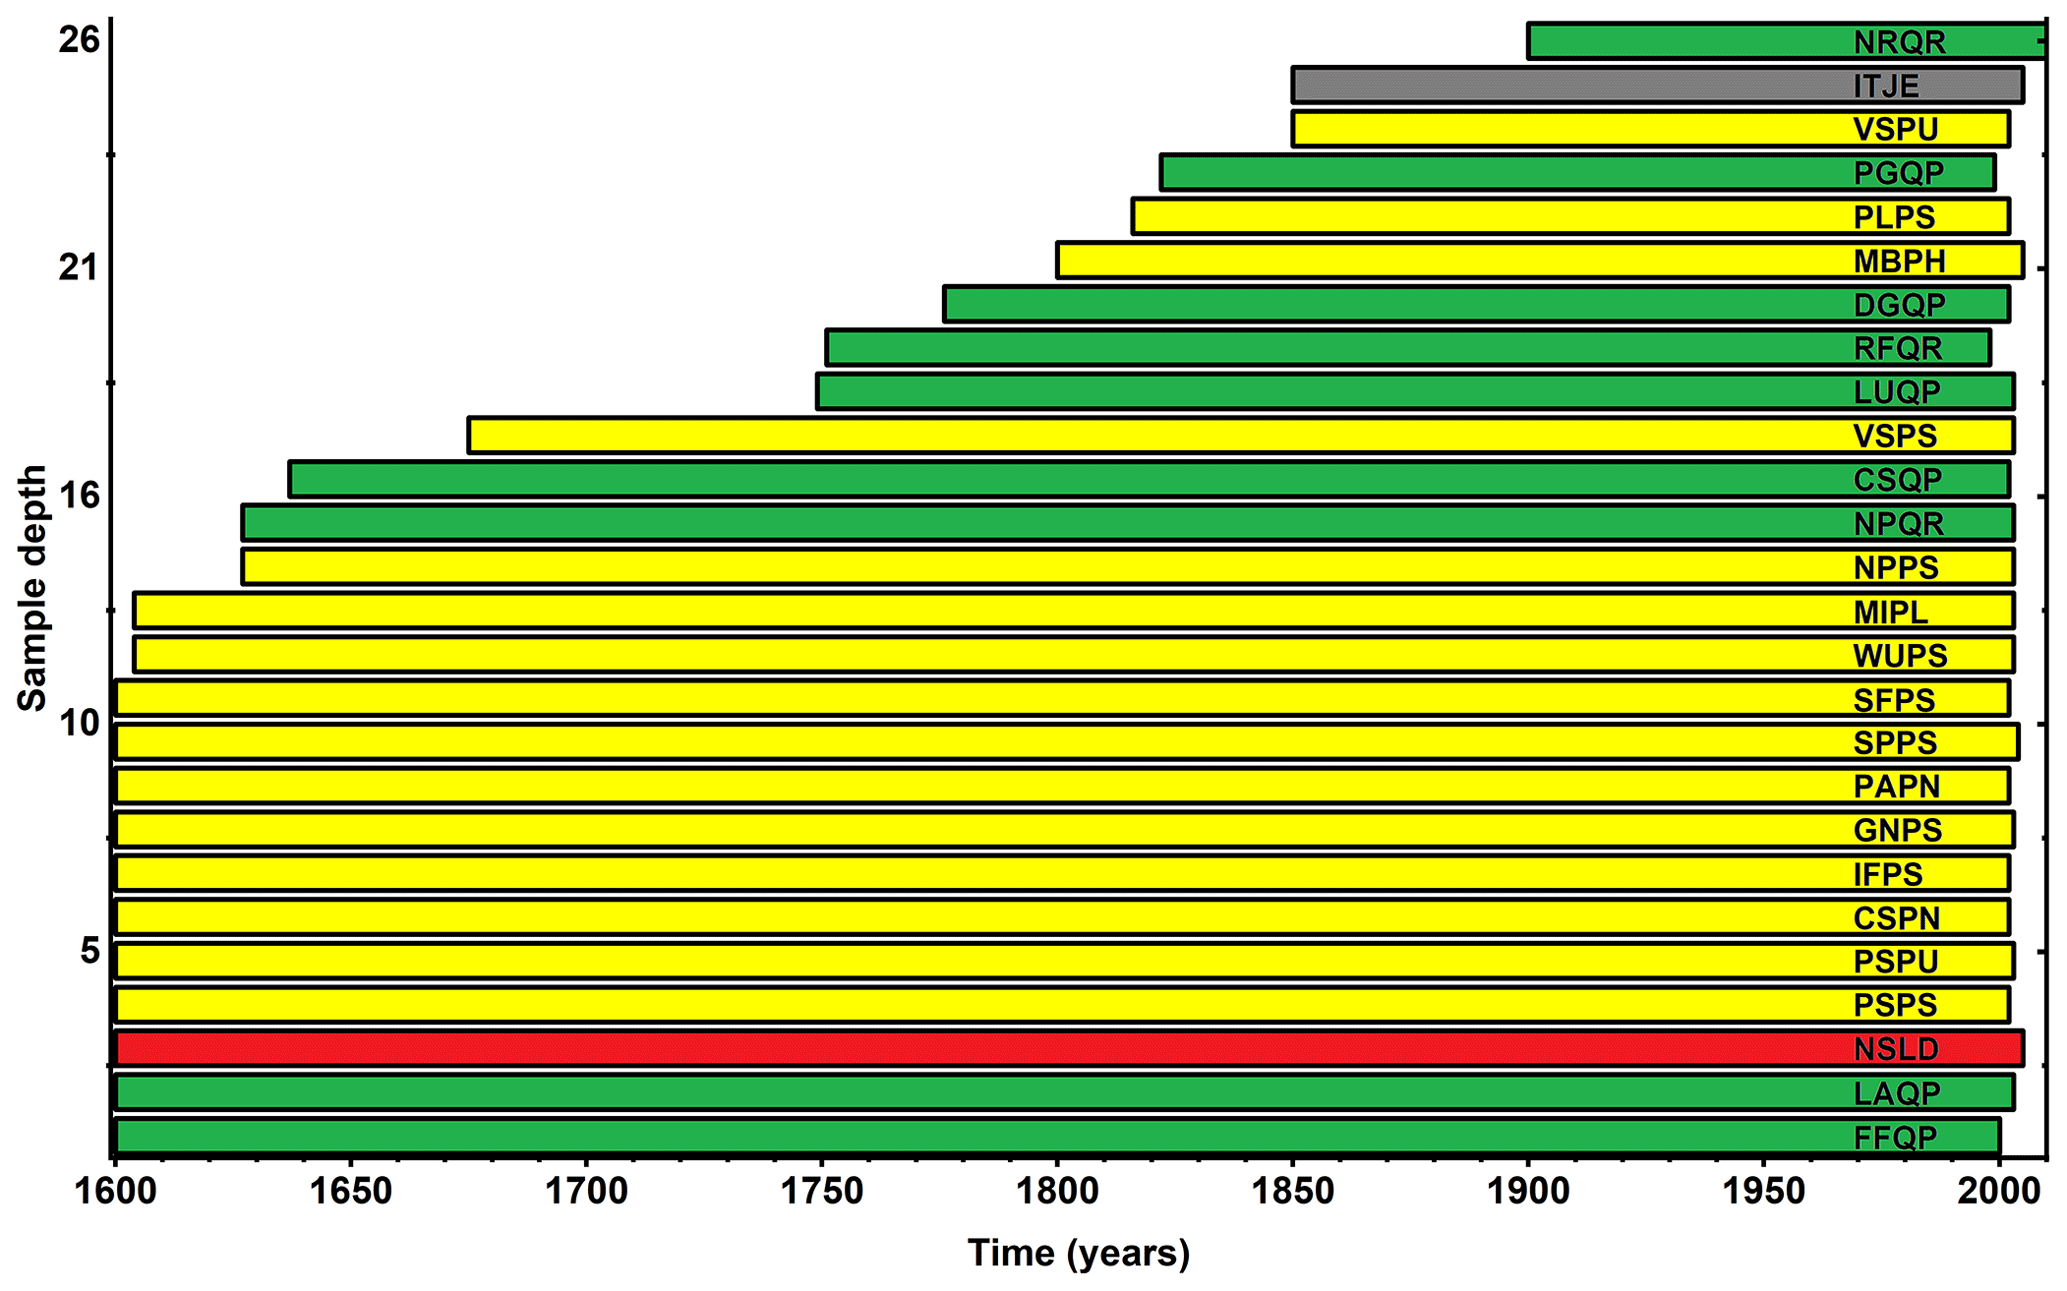
Figure 2The number of available δ18O time series within the network composed of 21 ISONET and 5 additional data (see Table 1). The Quercus sites are represented with green color, Pinus sites with yellow, Larix with red, and Juniperus with grey. For site codes, please see Table 1.
The isotope network presented here consists of nine deciduous tree sites (Quercus) and 17 conifer sites (Pinus, Juniper, Larix; see Table 1). The sample sites are well distributed over Europe (Fig. 1). The elevation of the locations varies from 10 m a.s.l. (Woburn, UK) to 2120 m a.s.l. (Pedraforca, Spain). The longest chronologies cover a period from 1600 to 2005. The highest data density (i.e., 26 time series) is available for the period 1900–1994 (Fig. 2). For several sites or regional groups of sites from the ISONET datasets, the data are published within individual studies (Andreu-Hayles et al., 2017; Etien et al., 2008; Haupt et al., 2011; Helama et al., 2014; Hilasvuori et al., 2009; Labuhn et al., 2014, 2016; Rinne et al., 2013; Saurer et al., 2014, 2008, 2012; Vitas, 2008).
Table 1Characteristics of each sample site used within our study. A total of 21 of the 26 δ18O records were obtained from the EU project ISONET, and the 5 additional sites are from Bulgaria, Turkey, southwestern Germany, Romania, and Slovenia.
2.2 (Paleo)climate data
Mean air temperature (°C) and relative humidity (%) from the near-surface (i.e., 2 m above ground level) were derived from the 20th Century Reanalysis Project (20CR) version V3 (Slivinski et al., 2019) at a monthly resolution to build the statistical model for VPD reconstruction. The 20CR reanalysis has a temporal resolution of 3 h, 28 different pressure levels, and a resolution of 1° × 1°. We use the ensemble mean derived from an 80-member ensemble. The climate variables are available for the period from 1836 to 2015, and they are provided by NOAA/OAR/ESRL PSL, Boulder, Colorado, USA (https://psl.noaa.gov/data/gridded/data.20thC_ReanV3.html, last access: 16 October 2023). To analyze the large-scale drivers of summer VPD in a long-term context, we make use of the monthly paleoclimate reanalysis (i.e., EKF400v2) (Valler et al., 2022) covering the period 1604 to 2003. This paleoclimate reanalysis dataset was generated using data assimilation techniques for the reconstruction of past climate states using both observation information and model simulations. The EKF400v2 is based on atmospheric-only general circulation model simulations, an observational network of early instrumental temperature and pressure data, documentary evidence, and tree ring width and density proxy records (Valler et al., 2022).
2.3 VPD computation and further pre-processing
The monthly VPD values were calculated based on the equation presented by Barkhordarian et al. (2019) by using the near-surface air temperature (e.g., 2 m above the ground) (T) and the dew point temperature (Td), both in °C. Since dew point temperature is not available for each grid point of the datasets, we have used T and relative humidity (RH, %) to compute Td as follows:
where a1 and a2 are defined as a1= 243.04 and a2= 17.625. This computation is reliable and is notably used in many climate models (Barkhordarian et al., 2019). We utilize the Clausius–Clapeyron relation by applying a term for the saturation vapor content of the air and a term for the actual vapor pressure to calculate VPD as follows (Barkhordarian et al., 2019; Behrangi et al., 2016; Marengo et al., 2008; Seager et al., 2015):
where c1= 0.611 kPa, c2= 17.5, c3= 240.978 °C, and VPD is expressed in kPa (see WMO, 2018, for further information). We calculated these quantities for monthly reanalysis averages and computed seasonal VPD averages for summer (JJA June to August) upon which we will focus our analyses in the following.
Here, we use the 20CR reanalysis as it spans a large enough time frame to calibrate statistical reconstruction models, which is at the expense of increased data uncertainties. To ensure that values from 20CR are in line with other historical VPD estimates, we also computed VPD for the ERA5 reanalysis dataset (Hersbach et al., 2020) over the European area (35–75° N, 10° W–40° E), where we found good agreement between both datasets (Supplement Fig. S1).
2.4 Application of random forest
The VPD data derived from 20CRV3 (Slivinski et al., 2019), Sect. 2.3) and the δ18O network data were used as input. There is a small number of missing data in the δ18O time series (0.38 % entries in total) that are infilled using an iterative principal component analysis approach following Josse and Husson (2016).
To spatially reconstruct the European summer VPD for the last 400 years we have used the random forest (RF) method (see Supplement Sect. S1 and Fig. S2 for details) (Breiman, 2001). The RF is an ensemble bootstrapping method consisting of aggregating several predictions given by simple, and generally low-efficiency, nonlinear regression trees (Breiman, 2001). Regression trees consist of a recursive convex optimization. First, the predictor is chosen (δ18O time series here) that best splits the initial summer VPD values in time into two groups (leaves) where the Euclidean distances from group centers are minimized. This is recursively applied where the specific group giving the best split is also considered in the minimization (on top of the δ18O time series and its values best splitting summer VPD data). The algorithm stops when one group is composed of a threshold number of VPD values. In the case of using regression trees within a RF, this threshold is recommended to be set to 5, which we will do here for all RF models, as its optimization is costly and generally not worth the computation (Breiman, 2001). Regression trees generally overfit the data they are trained with since removing one single predictor (for instance the δ18O time series used at the first split of the tree) can result in drastically different modeled data (Breiman, 2001). This is the reason why RF was developed: it consists of constructing several regression trees, each based on a randomly drawn sample of the initial set of δ18O time series. The number of trees was shown to give converging predictions for a wide variety of datasets when set to 256 or higher (Oshiro et al., 2012). Hence, here we used a number of 256 trees for all RF models we have computed. Finally, the number of random predictors (i.e., δ18O time series) selected is tuned using a 10-fold cross-validation (Michel et al., 2020, 2022) for all RF models of the study in a possible range extending from one to the number of initially selected δ18O time series (see next paragraph); see Sect. S1 for further details. Once a RF model is trained and tuned from cross-validation, a reconstruction is obtained by browsing all trees from the training using the values of δ18O time series in the past. The reconstructed summer VPD value is obtained as the average of values.
2.5 General procedure of the European VPD reconstruction
The RF algorithm as used here is not directly adapted for spatial reconstruction. We thus computed several RF models tuned with cross-validation, each specifically computed for the reconstruction of a single grid point. For climate time series reconstruction as performed here, RF was shown to most generally overclass several linear regression methods, including principal component regression, which has been extensively used in the climate reconstruction literature (e.g., Ortega et al., 2015; Wang et al., 2017). For each grid point of the observations, sensitivity tests are performed prior to the reconstruction, where only δ18O data significantly correlated at the 95 % confidence level when the observed VPDs are considered. This makes the reconstruction of each grid point from the summer VPD dataset unique as only relevant δ18O time series are selected for each. These tests are carried out with a correction of the degrees of freedom using first-order autocorrelation coefficients estimated from both time series, as in Michel et al. (2020).
In our study, we focus on the continental area of the European region (35.5 to 74.5° N, 9.5° W–39.5° E). The learning is set from 1900 to 1994, which constitutes the longest period covered by all tree ring data from Table 1 starting from 1900 (Fig. 2). Because δ18O time series cover different periods in the past, we use a nesting approach to produce the reconstruction. Starting from the longest time frame of reconstruction (i.e., 1600–1994), a new gridded reconstruction is computed as a new δ18O time series becomes available (see Table 1). At the end of the calculations, all imbricated time series for a given grid point are put one after the other to obtain the final reconstruction (Michel et al., 2022), which is done for all cells from the grid.
Each of the reconstructions for each grid point and nested time frame is evaluated by splitting up the data 30 times through time into training and testing samples of 80 % and 20 % of the size of the initial learning period (i.e., 1900–1994), respectively. For each training sample, a RF model is built and tuned, and a reconstruction of summer VPD for the testing period is obtained using corresponding values from δ18O time series only. The evaluation over testing samples is made using the coefficient of efficiency score (S_{CE}, Nash and Sutcliffe, 1970). This score is defined from −∞ to 1, where positive values indicate better reconstruction skill than what the empirical average of the training set would give. The reconstruction for a grid point over a given time frame of the nested reconstruction is thus considered robust and reliable only if the average of the 30 S_{CE} is significantly positive at the 95 % confidence level through the sample, based on a one-tailed Student's t test. Hence, our final reconstruction extending back to 1600 is composed of gaps in space and time, where filled data are only those where robust reconstruction skills as described here were found. Once the RF model is evaluated through the 30 training and testing splits, a final reconstruction is computed as the median of the 30 individual reconstructions obtained from training and testing splits. Therefore, statistical uncertainties of the gridded reconstruction are provided as the 10 %–90 % range of these 30 individual reconstructions.
In addition, standard errors are computed from reconstructed time series with respect to summer VPD observations over the period 1900–1994. For each grid point and each time frame of the nested reconstruction, we computed the uncertainties as an envelope of twice the standard errors on each side of the reconstruction as in, e.g., Ortega et al. (2015).
2.6 Reconstruction analyses
In order to further test the feasibility of our VPD reconstruction, in the final step of the analysis we compare the regional averages and running averages (30 years) of the reconstructed VPD with temperature (Luterbacher et al., 2004), precipitation (Pauling et al., 2006), and Palmer Drought Severity Index (PDSI) reconstructions (Cook et al., 2015) for the three European regions, as defined by IPCC Sixth Assessment Report (AR6) (IPCC, 2021a; Iturbide et al., 2020): northern Europe, central Europe, and the Mediterranean. Furthermore, we show maps of the European summer VPD for the most extreme positive years (1868, 1707, 1835) and most extreme negative years (1785, 1742, 1747) to investigate the spatial variability in concordance with past historical data (Brázdil et al., 2013; Brooks and Glasspoole, 1922; Cook et al., 2015; Glaser, 2008; Ionita et al., 2021; Marusek, 2010; Pauling et al., 2006; Trigo et al., 2009). Prior to this mapping, all VPD grid cells are centered and standardized (z transformation) to present z anomalies for each grid cell.
3.1 Vapor pressure deficit – δ18O relationship
The network of δ18O time series is significantly correlated with the European Summer VPD over the observational period (i.e., 1900–1994). In Fig. 3, we show the correlations of the individual δ18O time series with the respective time series of the grid cell from the calculated VPD of 20CRV3 (Slivinski et al., 2019). High values of significant correlations are reached between the local summer VPD and the δ18O time series (Fig. 3). We found that 23 of the 26 sites show significant correlations with local summer VPD (i.e., from the closest grid point) at the 95 % confidence level, with most of these sites being located in France, Spain, Germany, Scandinavia, and Great Britain. One time series from Turkey, one from Finland, and one from Bulgaria do not have a significant correlation with local summer VPD (Fig. 3). We note, however, that tree rings from southeastern Europe (e.g., Turkey, Bulgaria) may be more sensitive to spring VPD rather than summer VPD as demonstrated by a former study (Heinrich et al., 2013). In addition, we notice that there is no influence of the tree species used and no influence of the altitude of sampled trees on the correlations found (Fig. 3, Table 1, Balting et al., 2021). Based on these results and the relationship between δ18O and VPD variability depicted above, we can argue that δ18O in tree ring cellulose can be used as a reliable proxy to perform the reconstruction of VPD for the summer months (JJA).
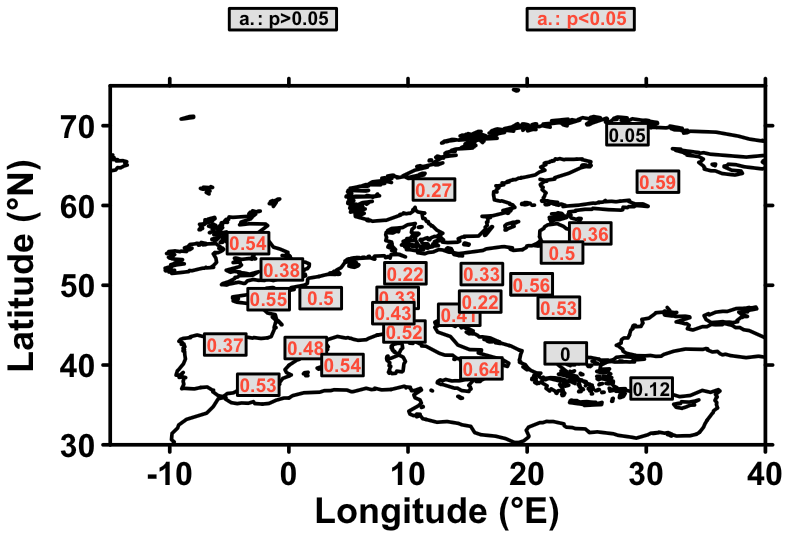
Figure 3Correlation of the δ18O time series with local summer VPD for the period 1900 to 1994. For each tree ring dataset, the correlation is computed with the time series from the closest grid point. The significance of correlations is calculated using a Student's t test for correlation with corrected degrees of freedom from time series as in McCarthy et al. (2015) and Michel et al. (2020). Significant correlations at the 95 % confidence level are highlighted in red (p < 0.05).
3.2 Validation statistics
Since we used a nesting approach in our study (Sect. 2.5), we made 13 successions of RF models over space in total (Sect. 2.5), each starting from time steps where at least one time series from the tree ring network becomes available (see Sect. 2.5). The S_{CE} scores (see Sect. 2.5) are shown in Fig. 4 for four selected time steps (1600–1699, 1700–1799, 1800–1899, and 1900–1999).
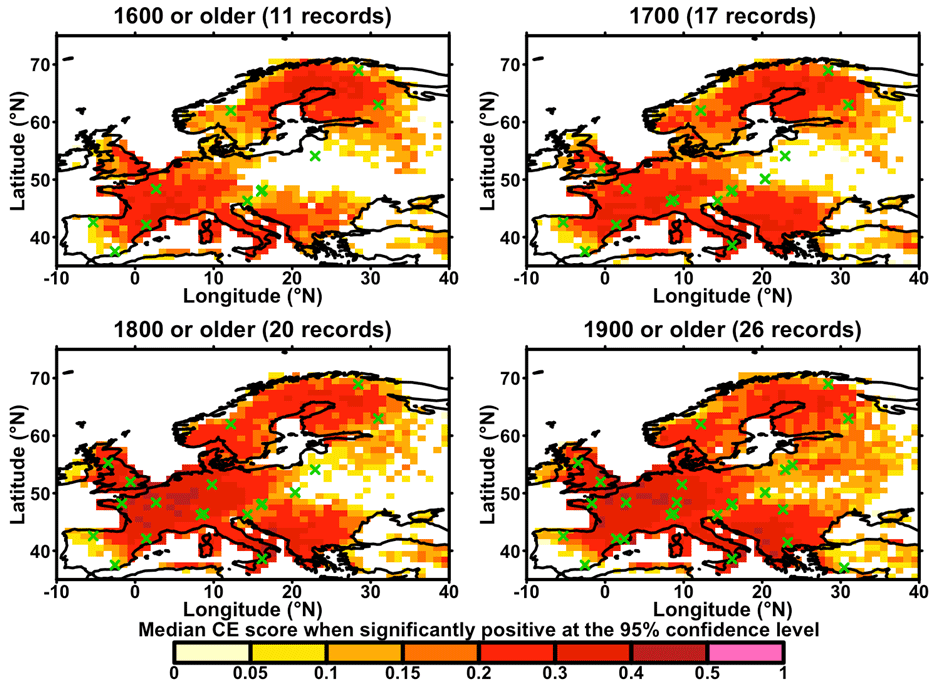
Figure 4The median Nash–Sutcliffe S_{CE} for four different time slices. The colored areas show the regions where the model setup has a suitable quality, which was tested with a one-sided Student's t test for the average of 30 S_{CE} scores obtained for testing samples (p < 0.05, Sect. 2.5). For the sake of graphical representation, for each time slice plotted here, the median S_{CE} scores were averaged over the corresponding nested time frames. Locations of available records for each time slice are given by green crosses (see Table 1).
For the first time step 1600 and older, S_{CE} scores indicate a satisfactory quality (Sect. 2.5) for the reconstruction of summer VPD for northeastern Spain, Italy, Greece, France, Germany, and large parts of Scandinavia (Fig. 4a). These regions coincide with the locations of the 11 available time series for this time frame. For 1700 or older, when our δ18O network has increased to 16 time series, the validation scores became higher, and the spatial coverage of grid points with a significantly robust reconstruction at the 95 % confidence level now expands to some parts of eastern Europe and the whole Scandinavian region (Fig. 4b). A further improvement of the S_{CE} values can be observed for the time span until 1800 (Fig. 4c), whereby the most noticeable feature is that Great Britain is now largely covered by grid points with a significantly robust reconstruction at the 95 % confidence level. This improvement is due to the fact that another time series from Scotland has been included in the analysis for this time slice. Finally, for the last time step (i.e., 1900–1994), for which all 26 δ18O time series are now available, an improvement in the spatial coverage of the reconstruction is found, in particular, a large gap in eastern Europe is now robustly covered by our reconstruction due to an additional time series from Romania, which became available from 1900 onwards (Fig. 4d). It can also be noted that adjacent regions of Europe, such as parts of Turkey, also have a suitable quality for reconstructing past VPD variability changes since a tree ring series is available in this region. The overall spatial strength of the network is in southern, western, and northern Europe, whereas eastern Europe can only be partially covered. Therefore, only those grid cells with a satisfactory reconstruction performance (where the mean S_{CE} scores are significantly positive at the 95 % confidence level) will be included in the following analyses. In addition to the validation scores, we also computed and provided statistical uncertainties (Fig. 5) in order to compute error bar estimates of the reconstruction (see Sect. 2.3). Overall, the validation statistics passed the conventional verification tests, and the obtained statistical test results indicate that the reconstruction model was statistically sound and can be used for the reconstruction of summer VPD values at the European scale.
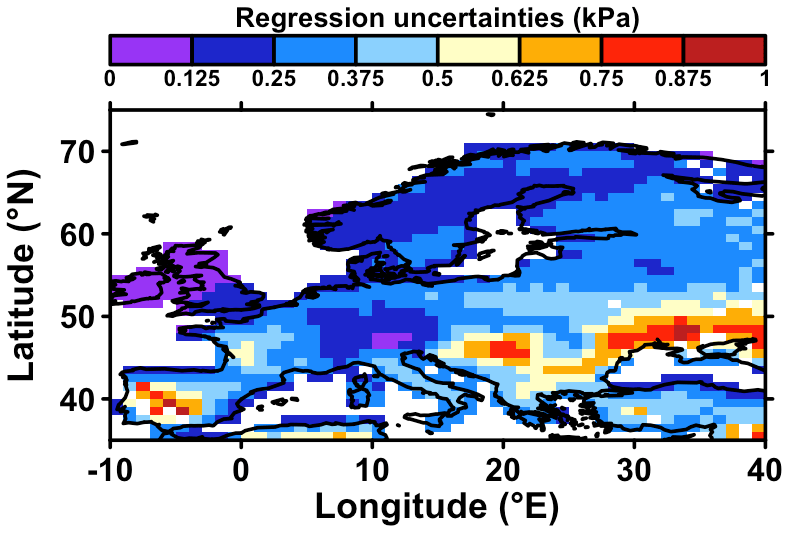
Figure 5Regression uncertainties for each grid cell. Uncertainties are calculated as the time-averaged 10 %–90 % range of individual reconstructions from each grid point (for the longest period with reconstruction skills, see Fig. 4).
3.3 Temporal variability of the European summer VPD reconstruction
The VPD reconstruction for the Mediterranean region shows the largest VPD values and higher variability compared to the other two regions (Fig. 6a, b). It is noticeable that at the beginning of the reconstruction period (1610–1650), the VPD values decrease ( kPa yr−1; 0.05 < p value < 0.01, where m is the linear regression slope), which is followed by a VPD increase leading to an almost constant VPD level until ∼ 1715. After this point, the VPD decreased steadily until 1761 when it remained at a similar level until 1773. This is followed by a short increase until ∼ 1790, after which VPD decreases again. The minimum VPD value is also reached during this period (VPD = 0.96 kPa for the year 1814). Around 1830, the VPD values started to increase again (m= 0.0003 kPa yr−1; 0.05 < p value < 0.01). Furthermore, the reconstructed VPD time series shows similar variations to those for central Europe, but they are most pronounced in the last 150 years. Low periods of variability are shown, for example, between the end of the 19th century and the beginning of the 20th century and for the 1960s and 1970s. In total, the 3 years with the lowest VPD z anomalies in this region are 1735, 1814, and 1876, whereas the years with the highest VPD are 1682, 1686, and 1945.
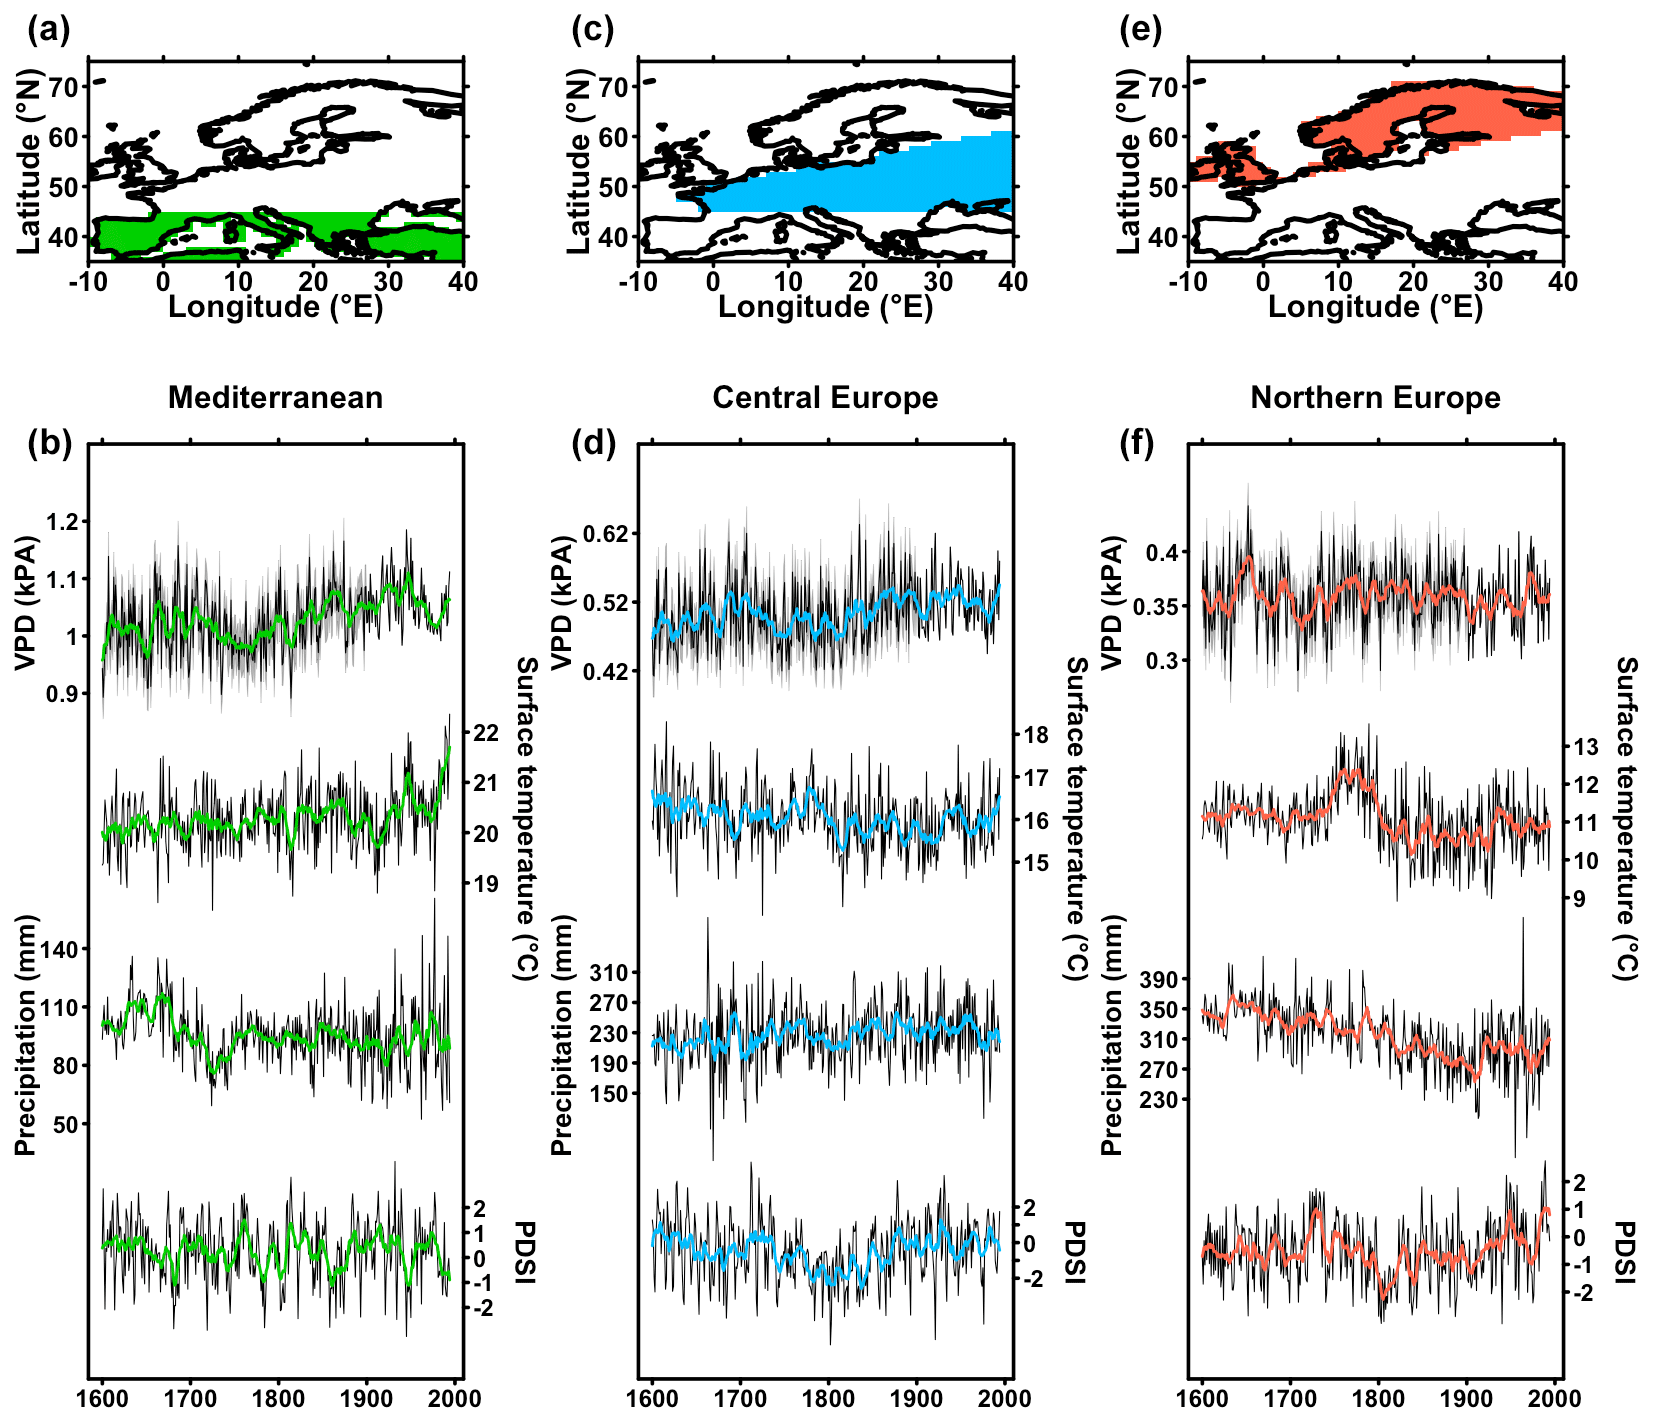
Figure 6Temporal variability of the VPD reconstruction. Maps (a, c, e) give the location of regions investigated: Mediterranean (a, green), central Europe (c, blue), and northern Europe (f, orange), following the IPCC AR6 definition (Iturbide et al., 2020). Area-averaged reconstructed time series (b, d, f) for (top to bottom): VPD (this study), surface temperature (Luterbacher et al., 2004), precipitation (Pauling et al., 2006), and PDSI (Cook et al., 2015) for the period 1600–1994, for the same three regions. For VPD time series in (b), (d), and (f), grey-shaded areas give the range of spatially averaged VPD uncertainties from Fig. 5 at the annual timescale, where values are spatiotemporally filtered based on reconstruction skills (Fig. 4).
The reconstructed VPD for Central Europe (Fig. 6c, d) shows that VPD increases from 1600 up to ∼ 1700 (m=0.0007 kPa yr−1; p value < 0.01). The maximum of the 30-year moving time series is reached in 1697 (VPD = 0.6398 kPa > 2.4 × σ, where σ is the standard deviation of the time series). This increase is followed by a downward trend of VPD in central Europe that ends in 1743 (m = −0.0014 kPa yr−1; 0.01 < p value < 0.05), when the minimum VPD value was recorded. The period 1740 to 1760 is characterized by very low VPD values and the lowest 30-year rolling VPD. From this time on, the rolling average VPD is characterized by a rising trend (m= 0.0002 kPa yr−1; p value < 0.01), but low values are reached between 1790 and 1830. Furthermore, the VPD reconstruction is characterized by a significant 60- to 80-year variability, where the lowest values are reached during the periods 1890 to 1920 and 1960 to 1980 (Fig. S3). In total, the 3 years with the lowest VPD in this region are 1814, 1838, and 1980, whereas the years with the highest VPD are 1687, 1707, and 1835.
The average VPD reconstruction for northern Europe (Fig. 6e, f) shows significant differences in variability and in the long-term mean. Northern Europe shows the lowest VPD of all three regions, which is due to the comparably low temperatures and high humidity in this area. The increase in VPD between 1620 and 1660 is significant (m = 0.0017 kPa yr−1; p value < 0.01), with the highest VPD value of the 400 years being reached in 1652 (VPD = 0.4619 kPa > 2.7 × σ). However, we note that the increase during 1675–1695 is not as long-lasting as the former increase from 1620 to 1660. The VPD values start to decrease again from the year 1700. The subsequent drop lasts until the 1720 to 1730 period, after which the time series shows further low-frequency variability and an upward tendency in the 30-year rolling average that lasts until the end of the 20th century (m= 0.00002 kPa yr−1; p value < 0.01). The 3 years with the lowest VPD in this region are 1632, 1674, and 1802, whereas the years with the highest VPD are 1652, 1959, and 1973.
3.4 Validation of the VPD reconstruction by comparison with other datasets
In order to test the feasibility of our VPD reconstruction, in the following two sub-sections we compare the spatiotemporal variability of our VPD reconstruction with other datasets available for the same time span. Time series from Fig. 6b, d, and f show some interesting similarities between our summer VPD reconstruction and former ones based on different climatic variables (e.g., precipitation, temperature, drought indicators) (Cook et al., 2015; Luterbacher et al., 2004; Pauling et al., 2006). For the overlap period of these reconstructions (1600–1994), we find consistent positive correlations with area-averaged reconstructed summer temperatures at 2 m (T2m, Luterbacher et al., 2004). The obtained correlations vary between r= 0.36 (p < 0.01) for the Mediterranean region, r= 0.31 (p < 0.01) for central Europe, and r= 0.38 (p < 0.01) for northern Europe (Fig. 7). When averaged over the same three regions, an opposite (negative) relationship is found between our VPD reconstruction and a summer precipitation reconstruction (Pauling et al., 2006), where correlations for spatially averaged time series are (p < 0.01) for the Mediterranean region, (p < 0.01) for central Europe, and (p < 0.01) for northern Europe (Fig. 7). The same results are found when we use a drought indicator, namely the Palmer Drought Severity Index (PDSI). In the case of PDSI, we find significant negative correlations for the three analyzed regions, namely (p < 0.01) for the Mediterranean region, (p < 0.01) for central Europe, and (p < 0.01) for northern Europe (Fig. 7). Interestingly, the Mediterranean region has highest correlations on average for T2m, whereas it has the lowest correlations for precipitation and PDSI.
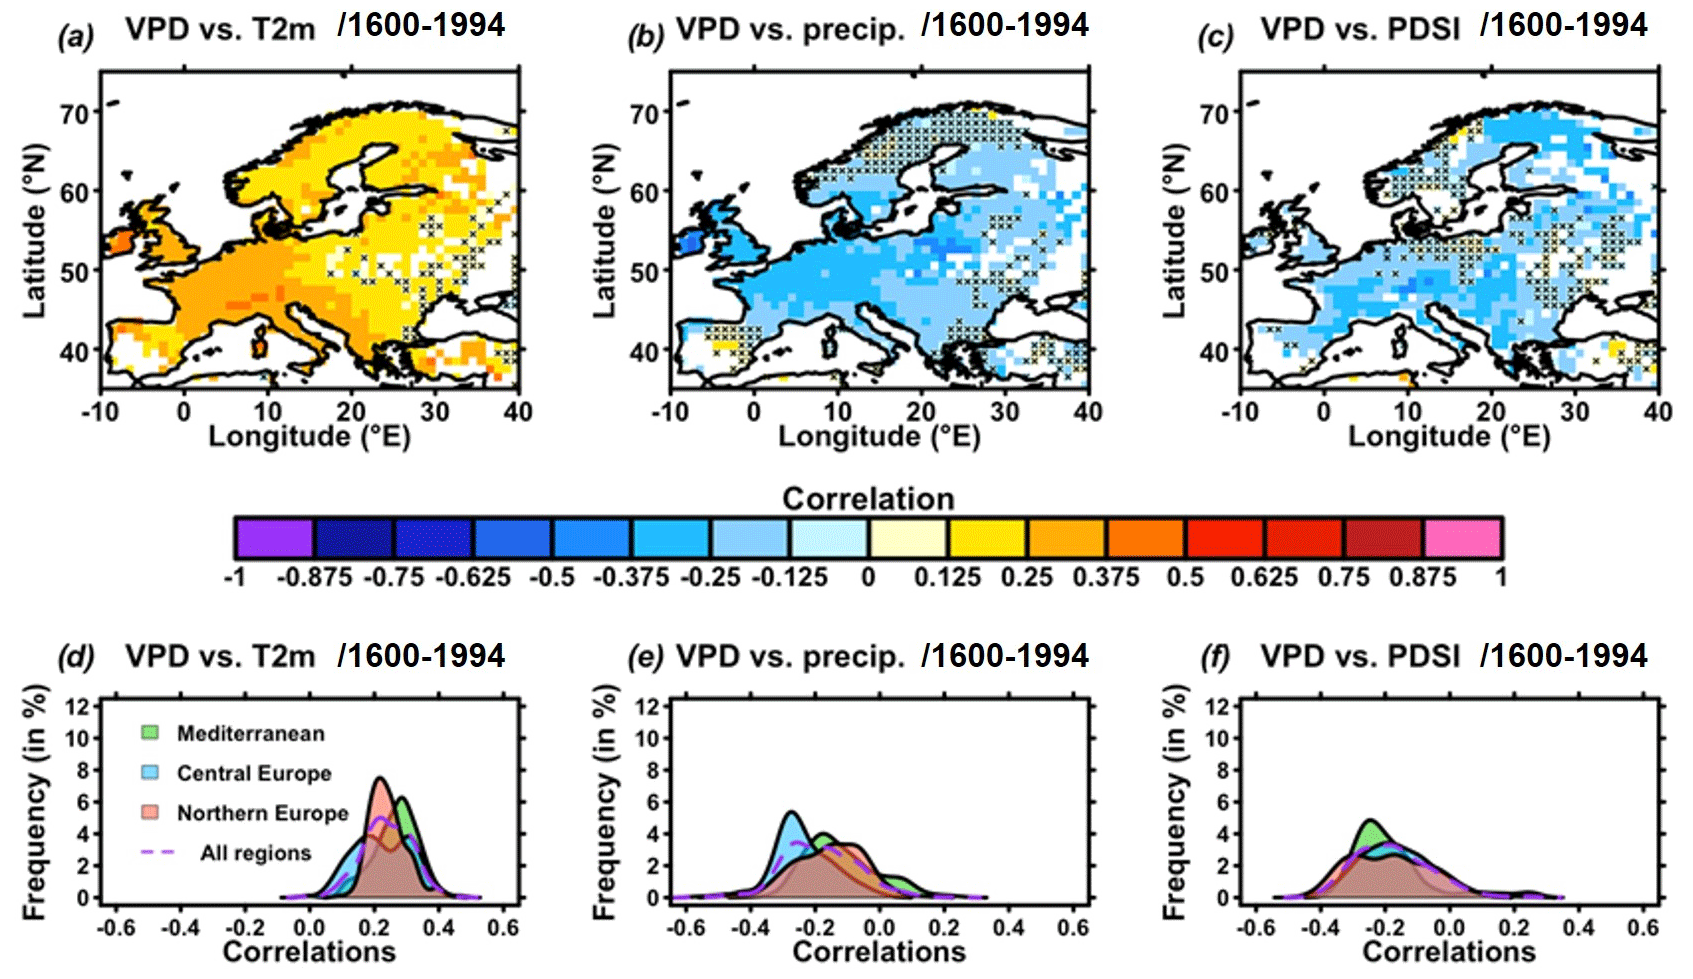
Figure 7Comparison with former climate field reconstructions. (a–c) Correlations between the VPD reconstruction from this study and other climate reconstructions: (a) temperature at 2 m (T2m) (Luterbacher et al., 2004), (b) precipitation (precip) (Pauling et al., 2006), and (c) Palmer Drought Severity Index (PDSI) (Cook et al., 2015) for the period 1600–1994. Black crosses indicate no significance at the 95 % confidence level. (d–f) Distribution of correlations from (a–c) for the same three variables, respectively, for the three regions investigated, i.e., Mediterranean (green), central Europe (blue), northern Europe (red), and all regions (purple dashed line), following IPCC AR6 (Iturbide et al., 2020; Fig. 5).
The spatial correlations with other (paleo)climate reconstructions (the temperature at 2 m (T2m; Luterbacher et al., 2004), precipitation (Pauling et al., 2006), and PDSI (Cook et al., 2015)) are given in Fig. 7a–c. It appears that for all three variables, significant correlations are found, with a focus on western and central Europe, which are the areas with the highest tree ring data coverage (Fig. 1, Table 1) and that show the highest S_{CE} validation scores (Fig. 4). Despite the relatively low correlation coefficients (lower or higher than ±0.2), the findings present a remarkable achievement considering the vast geographical scope (encompassing the entirety of Europe) and the extensive temporal range (spanning over 400 years) of the correlated datasets. Thus, the obtained significant correlations mean that there is a strong statistical relationship between the analyzed datasets, while the modest correlations suggest that they do not fully capture the complex relationship between these datasets. Therefore, the significant correlations found for most regions highlight the important accordance and consistency between the summer VPD reconstruction and former summer climate reconstructions (Cook et al., 2015; Luterbacher et al., 2004; Pauling et al., 2006).
3.5 Comparison of the temporal variability with other reconstructions
In this section, we compare the temporal variability of VPD with existing reconstructions of summer temperature (Luterbacher et al., 2004), precipitation (Pauling et al., 2006), and drought (PDSI) reconstruction (Cook et al., 2015) in Figs. 6, 7, and 8.
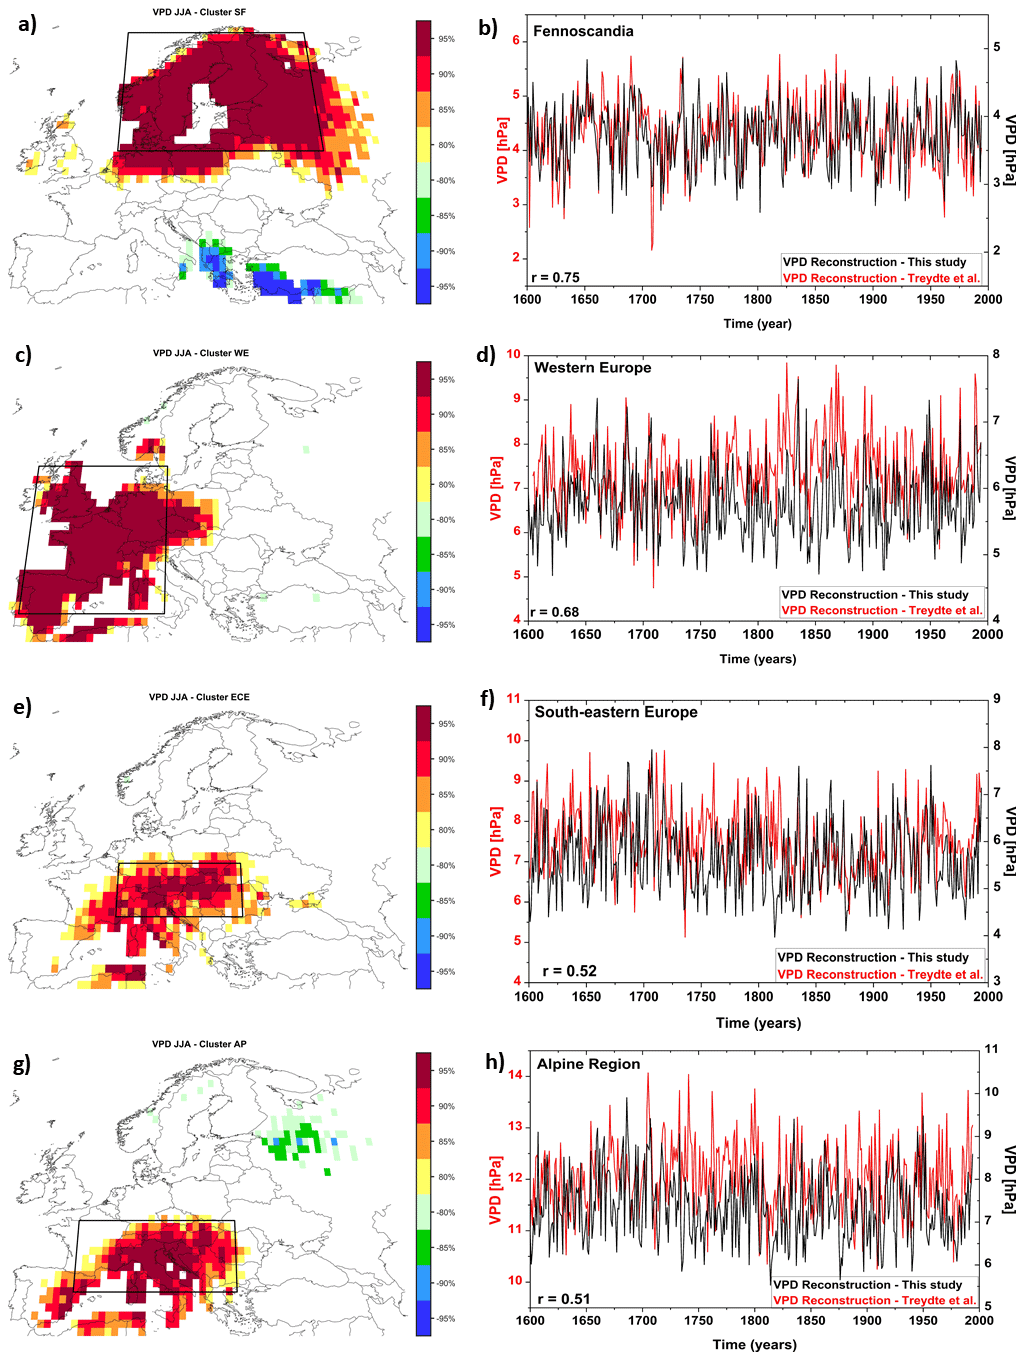
Figure 8(a) Stability maps between the gridded VPD reconstruction from this study and the reconstructed time series of VPD over southern Fennoscandia (Treydte et al., 2023). (b) The temporal evolution of the VPD time series averaged over the black box in (a) and the VPD time series over southern Fennoscandia (Treydte et al., 2023). Panel (c) is the same as (a) but for western Europe, panel (d) is the same as (b) but for western Europe, panel (e) is the same as (a) but for southeastern Europe, panel (f) is the same as (b) but for western southeastern Europe, panel (g) is the same as (a) but for the Alpine region, and panel (h) is the same as (b) but for the Alpine region. In (a), (c), (e), and (g) the regions where the correlation is stable, positive, and significant for at least 80 % of the 31-year moving window correlations are shaded with dark red (95 %), red (90 %), orange (85 %), and yellow (80 %). The corresponding regions where the correlation is stable but negative are shaded with dark blue (95 %), blue (90 %), green (85 %), and light green (80 %).
For northern Europe, the characteristics of VPD until 1700 show little resemblance with the reconstructions of precipitation and temperature (Fig. 6e, f). However, the PDSI indicates dry conditions for the time of the maximum VPD in 1652 (Fig. 6d). Furthermore, the decrease of VPD between 1700 and 1730 is shown as a wet period in the drought reconstruction, which could be a possible explanation for these low values. From 1730 to 1800, the observed strong temperature increase is only partly visible in VPD. A possible reason for this could be the concurrent increase in summer precipitation. Since the temperature and precipitation changes in this region have similar trends, it is difficult to detect the characteristics of the two variables in the VPD time series.
For central Europe, the increase of the VPD until 1700 cannot be explained by the temperature or precipitation reconstruction (Fig. 6d). The 30-year running means of both time series show diverging trends. Nevertheless, the reconstruction of the PDSI also shows a trend towards drier conditions from 1670 to 1690 (Fig. 6d). However, before the end of the 17th century, the data indicates a wetting trend. Afterwards, the periods of high and low temperature and precipitation match well with the corresponding periods of high and low VPD. For example, a simultaneous drop in temperature and precipitation between 1730 and 1745 is also present in the VPD time series. From 1800 onward, the VPD closely follows the pattern of temperature (Fig. S3). However, the variability of the VPD time series is also influenced by the precipitation variability. The precipitation shows strong interannual variability from the second half of the 19th century, but the magnitude is weaker than in the VPD or the temperature time series. The temperature, precipitation, and VPD reconstructions show similar patterns, it gets warmer, there is less precipitation, and the VPD increases in summer. The PDSI, on the other hand, shows a wetting trend from 1800 onwards. We suggest that this could be based on the accumulation processes of precipitation in the preceding months, which is represented by the PDSI (Alley, 1984). This could compensate for the increasing temperature and the decreasing precipitation in summer.
For the Mediterranean area, the summer of 1884 is an extreme event in the temperature time series, as it shows the second coldest temperatures for this region in the last 400 years (Fig. 6b). The variability of periods with high and low temperatures are almost identical to the corresponding periods of the VPD time series. During the period 1600–1730, the summer VPD reconstruction presents a high variability, with similar variability being observed for the precipitation reconstruction. After which the summer VPD reconstruction presents a slowly decreasing trend, similar to the temperature reconstruction. Since the decrease in precipitation is almost linear in the 30-year mean from 1850, we suggest that comparatively the variability of temperatures can be clearly observed in the VPD time series. A similar situation is also described by the drought reconstruction for the Mediterranean area (Fig. 6b). Thus, the reconstructed PDSI of Cook et al. (2015) shows wetter conditions towards the middle of the 18th century, which is complemented by the low VPD values for this period. Like the VPD and the temperature reconstructions, the PDSI shows drier conditions after the 1770s, intensifying after the onset around 1790. Furthermore, the year 1814 is also the year with the wettest conditions in the PDSI time series. After ∼ 1850, the anti-correlation between the temperature and VPD and the PDSI is again evident, meaning that variability is also visible.
In line with the recently published study of Treydte et al. (2023) dealing with the intensification of the atmospheric drying over Europe, in the following we also compare the temporal variability of our VPD reconstruction with the data from the aforementioned paper. The comparison is made only for particular regions since no gridded data are available for the Treydte et al. (2023) data. In the following, we analyze the relationship between the VPD reconstruction of Treydte et al. (2023) for different regions across Europe, identified based on principal component analysis (PCA), namely southern Fennoscandia, western Europe, eastern central Europe, and the Alps and Pyrenees (see Fig. 1 in Treydte et al., 2023). First, we compute the stability maps (Ionita et al., 2008; Nagavciuc et al., 2019) between the aforementioned time series and our gridded VPD reconstruction (Fig. 8, left column). As can be inferred from Fig. 8, the correlation between the time series for the four regions across Europe and our gridded summer VPD reconstruction is stable and significant throughout the analyzed period (i.e., 1600–1994). We chose the stability maps, instead of simple correlations, because we wanted to extract only the information for which the relationship between the analyzed variable stays stable in time. Based on the stability maps, we defined four indices by averaging the reconstructed VPD over the grid points where the correlation was stable and above the 90 % significance level (black squares in Fig. 8, right column). These four indices correspond to the same regions as the ones used in Treydte et al. (2023), with the only exception that ours are averaged over the gridded VPD reconstruction, while the others are based on a clustering algorithm. For southern Fennoscandia (Fennoscandia in our graph), the correlation between our reconstruction and the one from Treydte et al. (2023) is r = 0.75 (p < 0.001), indicating a very good agreement between the two time series. In addition, the interannual and the decadal variability of the two-time series is in good agreement. For western Europe the correlation between the two reconstructions is r = 0.68 (p < 0.001), also indicating a good agreement between the time series over this region.
In the case of southeastern Europe and the Alpine region, the correlation coefficients between the two VPD reconstructions are smaller compared to southern Fennoscandia and western Europe (r = 0.52, p < 0.01 for southeastern Europe and r = 0.51, p < 0.01 for the Alpine region). Nevertheless, the interannual and decadal variability is coherent in both reconstructions (e.g., prolonged periods with low or high VPD are similar in both time series). In general, the reconstruction of Treydte et al. (2023) has higher VPD values than our reconstruction, but as previously mentioned the interannual and the decadal variability is similar for both reconstructions. For example, both reconstructions indicate an increase in the VPD at the beginning of the 20th century over all analyzed regions and a period of relatively low VPD values starting in the 1970s (Fig. 8, right column). Some of the discrepancies, especially over the southeastern part of Europe and the Alpine region, might arise from the fact that our reconstruction is based on a network of 26 isotope records, while the one from Treydte et al. (2023) is based on 45 isotope records. Moreover, our indices are defined by averaging the VPD over the gridded reconstruction covering a larger region than the ones in Treydte et al. (2023).
3.6 Large-scale drivers of summer VPD over the last 400 years
Although for other paleoclimate reconstructions (e.g., precipitation, temperature, drought) a clear link has been established between the large-scale circulation and the variability of the respective paleoclimate variables (Nagavciuc et al., 2019; Casty et al., 2005; Jones et al., 2009; Steiger et al., 2018; Cook et al., 2022, among others), in the case of VPD not many studies are available that deal with analyzing the influence of large-scale circulation on the variability and trends of VPD. For example, in their study, Treydte et al. (2023) have inferred that the variability of VPD is influenced by the position of the jet stream and the phase of the NAO, but no analysis was actually performed to show that such a relationship actually exists. Therefore, in this study, we go a step forward by using our gridded VPD reconstruction together with a long-term paleo-reanalysis dataset (EKF400v2; Valler et al., 2022), and we analyze the couple modes of variability between summer VPD and the larger-scale atmospheric circulation (i.e., the geopotential height at 500 mb) over the last 400 years. The large-scale atmospheric circulation can significantly impact vapor pressure deficit (VPD) through its role in controlling humidity and temperature patterns. Persistent high-pressure systems have long been acknowledged for their significant role in generating heat waves, soil moisture deficits, and droughts at both global and regional scales (Bakke et al., 2023; Ionita et al., 2022; Kingston et al., 2015; Schubert et al., 2014). For instance, in regions affected by descending air masses (high-pressure systems), such as subtropical zones, VPD tends to be higher due to the associated warming and drying of the air. Conversely, in areas influenced by ascending air masses (low-pressure systems), such as the Intertropical Convergence Zone, increased moisture content often leads to lower VPD. Thus, the relationship between atmospheric circulation and VPD is crucial in understanding and predicting local water availability and plant stress. To effectively examine the connection between large-scale summer atmospheric circulation and summer VPD variability in Europe over the last 400 years, we employ a canonical correlation analysis (CCA) to compute the coupled modes of variability between summer geopotential height at 500 mb (Z500) and summer VPD. The initial 10 empirical orthogonal functions (EOFs) of Z500 during summer (JJA) account for approximately 85 % of the total variance, while the initial 10 EOFs of reconstructed summer VPD capture around 81 % of the total variance.
The first coupled mode of variability between summer Z500 and summer VPD reveals that an elongated high-pressure system extending from the central North Atlantic towards Fennoscandia, flanked by a cyclonic circulation over the southeastern part of Europe and over Greenland (Fig. 9a), corresponds to high VPD values (i.e., atmospheric dryness) over the western and central part of Europe, as well as over Fennoscandia, while low VPD values prevail over the southeastern part of Europe (Fig. 9c). There is a clear dipole-like variability in the VPD field between the central and western parts of Europe including Fennoscandia and the southeastern part of Europe. The anomalies in the VPD field follow the ones in the Z500 field, meaning that positive VPD values are associated with an anticyclonic circulation, while negative VPD values are associated with cyclonic circulation. The interannual variability of the normalized temporal components of the first CCA pairs for Z500 and VPD is shown in Fig. 9e. The two time series are significantly correlated (r = 0.84, p < 0.001). The significant positive correlation between the standardized amplitudes corresponding to CCA1 Z500 and VPD CCA1 (Fig. 9e) confirms the significant relationship between the summer VPD variability at the European scale and the prevailing large-scale atmospheric circulation. The two canonical time series present strong interannual variability over the period 1604–1994, with the highest amplitudes (towards higher pressure and atmospheric dryness) over the latter half of the 20th century. The increase in the summer Z500 in the second half of the 20th century is in line with previous studies (Bakke et al., 2023), which have shown that the geopotential height at 500 mb has increased significantly over large regions covering the North Sea and the western part of Europe form 1979 onwards.
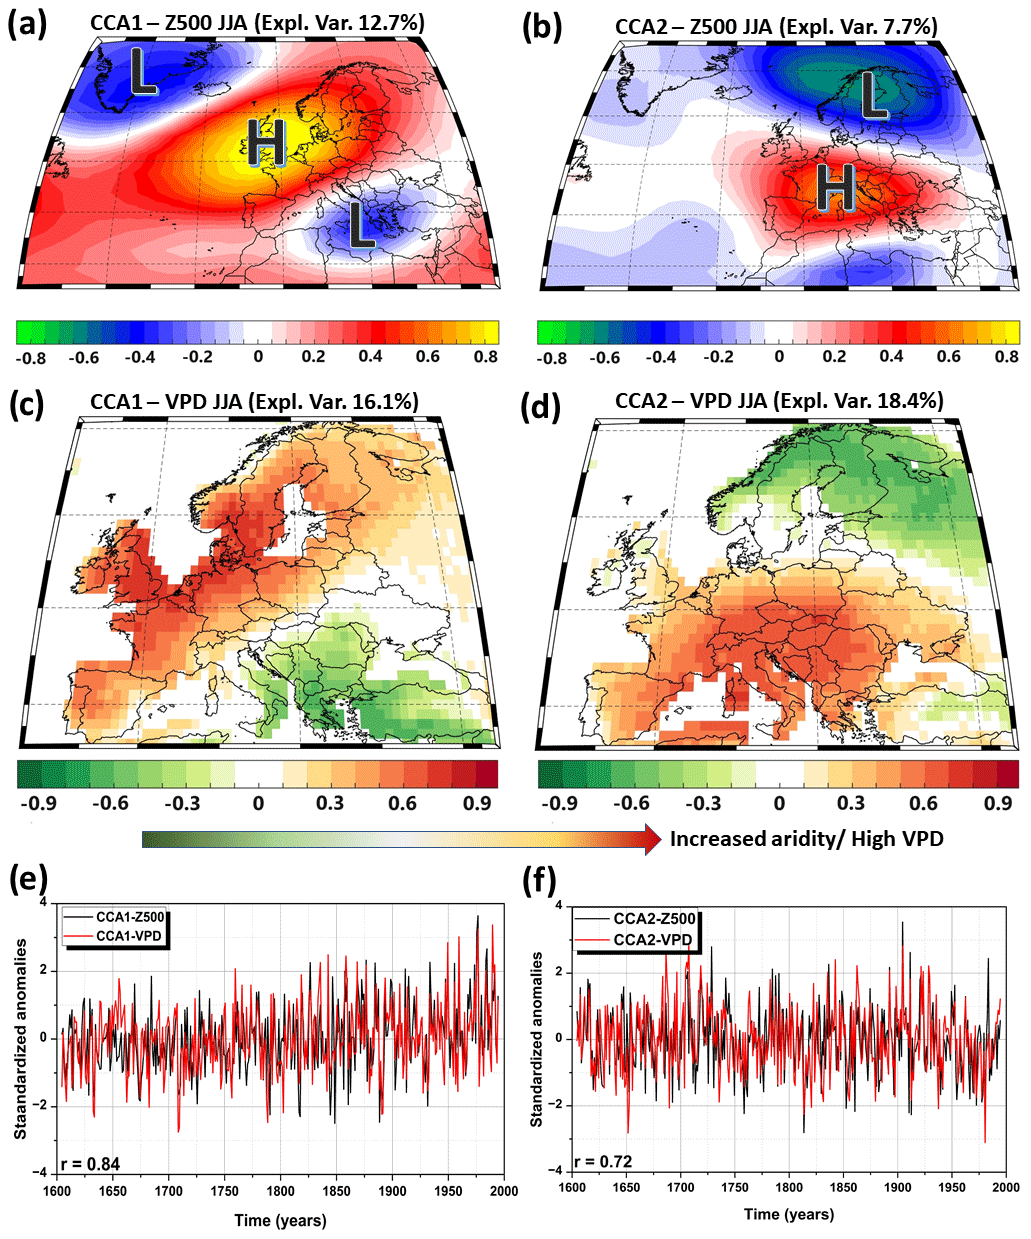
Figure 9The first coupled mode of variability (CCA1 – left column) and second coupled mode of variability (CCA2 – right column) between summer Z500 (a, b) and summer VPD (c, d). (e) The standardized amplitudes corresponding to CCA1 Z500 (black line) and CCA1 VPD (red line). (f) The standardized amplitudes corresponding to CCA2 Z500 (black line) and CCA2 VPD (red line).
The second coupled mode of variability between summer Z500 and summer VPD reveals that a high-pressure system centered over the southern and central part of Europe and a low-pressure system over the northern part of Europe (Fig. 9b) corresponds to high VPD values (i.e., atmospheric dryness) over the central and southern part of Europe, while low VPD values prevail over Fennoscandia and the British Isles (Fig. 9d). As in the case of CCA1, there is a clear dipole-like variability in the VPD field, but this time it is between the southern and northern parts of Europe. The interannual variability of the normalized temporal components of the first CCA pairs for Z500 and VPD is shown in Fig. 9f.
The two time series are significantly correlated (r = 0.72, p < 0.001). The two canonical time series also present strong interannual variability over the period 1604–1994. Two prolonged periods of low VPD (low Z500) can be observed over the southern part of Europe, one around the 1750s and the other one after the 1950s, while positive VPD values prevailed at the beginning of the 18th century and the beginning of the 20th century. The NW–SE dipole-like mode (CCA1) and the N–S mode (CCA) in the VPD field captured by the CCA analysis follow the patterns of drought variability over Europe over the observational records (Ionita et al., 2015; Kingston et al., 2015; Nagavciuc et al., 2022).
3.7 Extreme years in the VPD reconstruction and comparison of past or historical data
To illustrate the spatial variability of our VPD reconstruction, we selected three of the driest summers (1842, 1868, and 1835) and three of the wettest summers (1604, 1602, and 1747) when considering time frames with significantly positive S_{CE} scores at the 95 % confidence level for each grid point (Fig. 4). We compared their spatial variability (Fig. 10) with respect to other available reconstructions or documentary pieces of evidence at the European level to once again validate the occurrence of the extreme events in our reconstruction. Since VPD variability and mean state differ strongly for different latitudes, these six extreme years were selected using spatially averaged normalized VPD values (i.e., z anomalies). The year 1747 is part of a relatively wet period that corresponds to strongly decreasing PDSI (Cook et al., 2015; Ionita et al., 2021) for Europe on average, notably for the northernmost regions (Fig. 6f) as also suggested by Fig. 10f. Contrarily, the summer of 1835 is characterized by positive anomalies over southern, western, and central Europe, with the highest VPD anomalies over France, which is in concordance with the extremely hot summer conditions in France during that summer (Marusek, 2010). During the summer of 1835, 41 hot days and 11 very hot days were recorded in Paris, France (Marusek, 2010). Heat and dryness conditions were also registered in Belgium, England, and Switzerland in 1835 (Marusek, 2010), which is in concordance with our results (Fig. 10c). Summer 1868 is characterized by positive anomalies over the western, central eastern, and northern parts of Europe (Fig. 6a). Documentary data indicate a hot and dry summer in England (e.g., on 21 July 1835 a temperature of 34.1 °C was recorded in London) (Marusek, 2010).
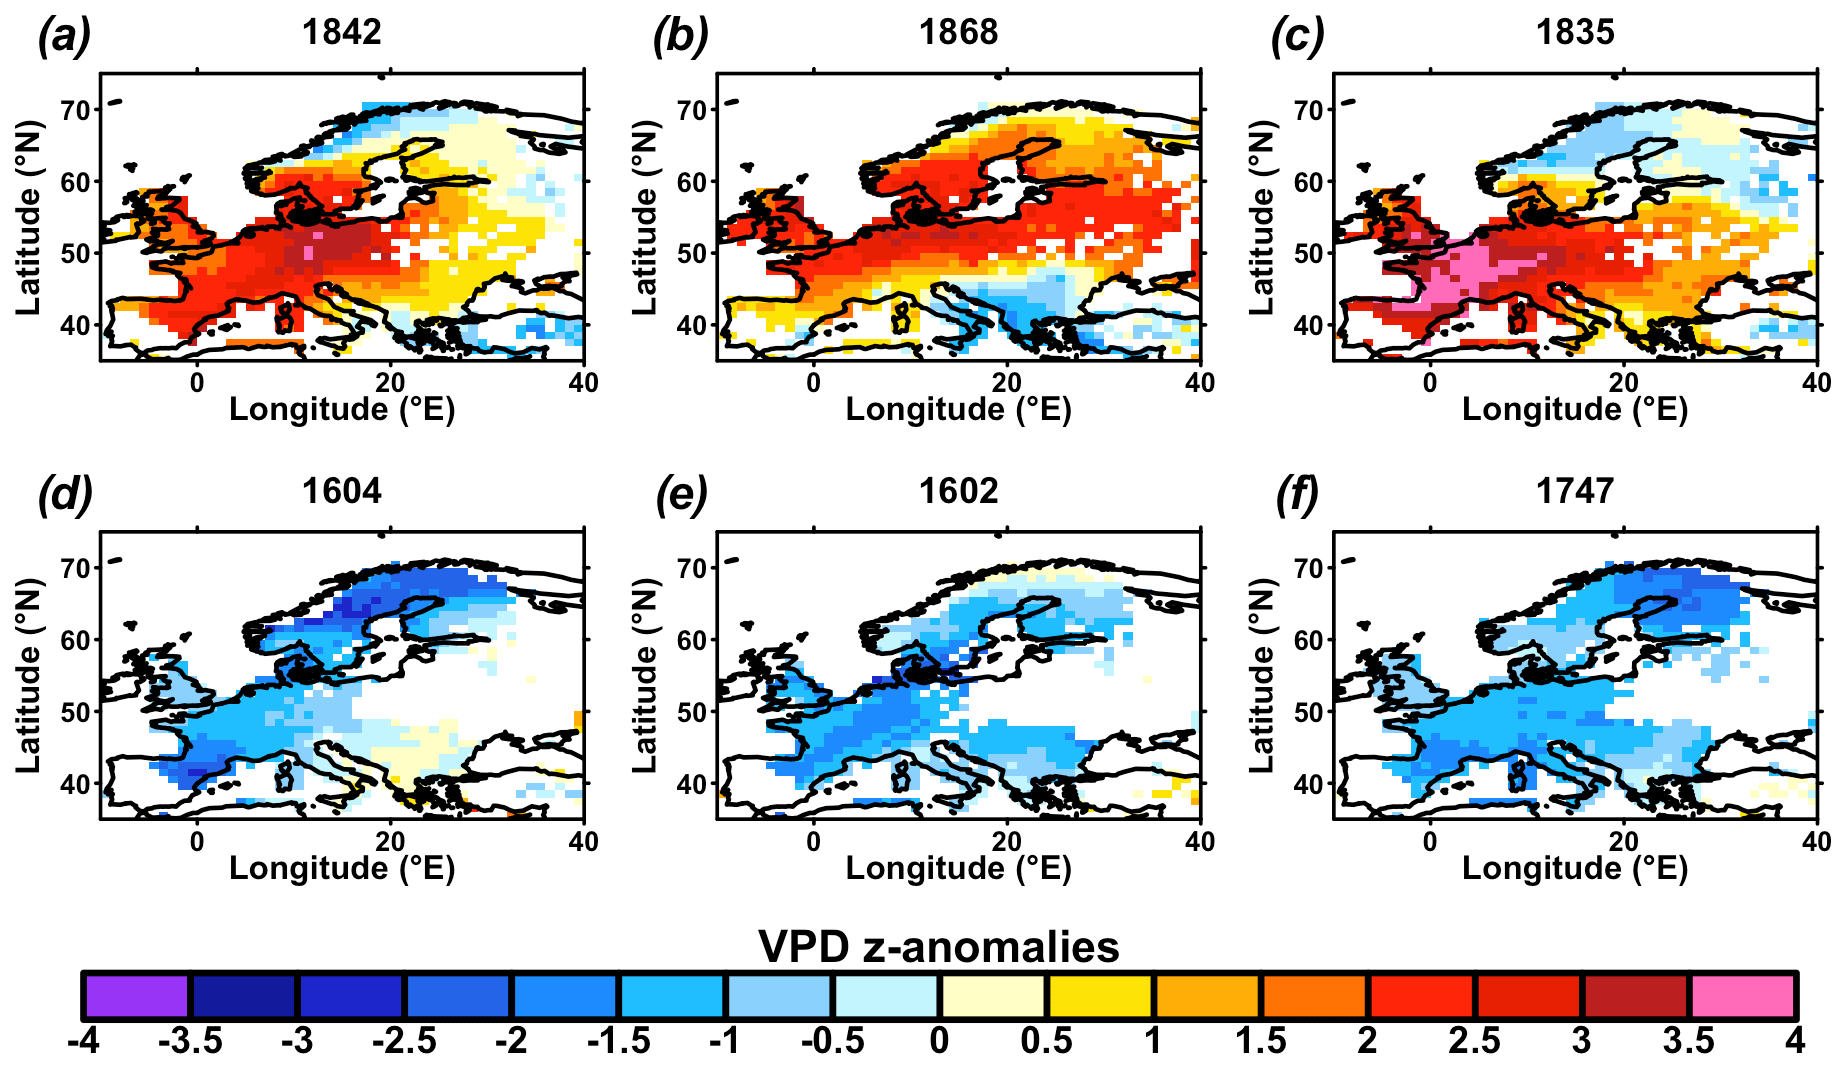
Figure 10Spatial pattern of VPD anomalies for selected years. Values of each grid cell are VPD z anomalies (standardized and centered) with respect to the whole period of study (1600–1994). The chosen years were selected as they are the three with the highest VPD z anomalies (a–c, a is the highest) and the three with lowest VPD z anomalies (d–f, d is the lowest) for preindustrial data (1600–1899). Time series only include years where S_{CE} scores are significantly positive at the 95 % confidence level (see Fig. 4).
Interestingly, none of the three cases with high VPD anomalies (Fig. 10a–c) overall shows spatially consistent positive values over the continent compared to low VPD cases (Fig. 10d–f). Strong positive anomalies appeared over the western and northern parts of Europe in 1868 (Fig. 10a) and western to central Europe in 1707 and 1835 (Fig. 10b and c). In all three cases, these large positive anomalies are accompanied by negative anomalies in other regions (in general northeastern and southeastern Europe, Fig. 10) and form a significant contrast over the continent. Oppositely, the three wettest years happened mainly as a large and spatially consistent set of negative VPD z anomalies, where only scattered positive values occurred in a few regions (Fig. 10d–f).
The δ18O network used in our study (Table 1, Fig. 1) is characterized by specific limitations that inevitably influence the quality of the reconstruction presented here. It is likely that the reconstruction may provide some level of sample sites over-representation in central and western Europe compared to the ones from southeastern, eastern, and northern Europe as shown in Fig. 1. These spatial distribution characteristics of sites can also be seen in the validation statistics, where the regions with a good sample density show higher validation scores (Sect. 3.2). Therefore, further time series from uncovered regions may help in improving the quality and the spatial extent of our reconstruction. Besides the δ18O climate signal, the observational or reanalysis data of VPD are given by the ensemble mean of 20CRV3 (Slivinski et al., 2019) for the period 1900 to 1994. Even though the quality and quantity of instrumental data available during this period are comparatively good, the ensemble mean can only represent the variability and diversity of the reanalysis with 80 ensemble members to a limited extent.
In our study, the reconstruction is based on the application of the RF algorithm calibrated and evaluated over the period 1900 to 1994. The model is therefore trained to represent exactly this period. Thus, when this model is applied to the previous years, we assume stationarity between the VPD variability and the proxy records, as is generally the case for climate reconstructions (Cook et al., 2015). Since the climate system is not stationary, the assumption of stationarity must be included as a potential source of error. However, the RF approach can represent nonlinearities, which is not possible with the classical approaches, for example, principal component regression (Cook et al., 2015). Therefore, we compared our reconstruction with other available observational, historical, and proxy-based reconstructed data in order to assess errors. While our δ18O VPD reconstruction provides valuable insights into past climate conditions, it is important to acknowledge the existence of other sources of paleoclimate reconstructions, which could potentially complement or refine our findings and represent a great potential for future studies.
Another potential limitation of our study can be related to the fact that we only used the δ18O record to reconstruct the summer VPD, and we did not take into account the potential of δ13C as a candidate for reconstructing VPD. This was mainly due to the fact that at the time when we wrote this paper, the δ13C network was not publicly available, and at this stage it is beyond the scope of our paper to make a δ13C-based reconstruction. Moreover, it seems that δ18O is preferred as a candidate for long-term paleo-reconstructions, especially over Europe (Freund et al., 2023; Nagavciuc et al., 2022; Treydte et al., 2023). Nevertheless, we acknowledge that for future studies one needs to test the potential of δ13C as a proxy indicator for paleoclimate reconstructions.
Finally, even if the nested reconstruction approach is used by default for reconstructions (Cook et al., 2007; Freund et al., 2019; Luterbacher et al., 2004; Pauling et al., 2006) to cover the longest possible time range, it is important to check the quality of the model for the respective time range. Therefore, we recommend considering the validation scores for the considered time periods that are also uploaded to the repository.
By acknowledging these limitations, we can better understand the uncertainties associated with paleoclimate reconstructions and avoid over-interpreting the data. This will help us to develop more robust and reliable paleoclimate records in the future.
Here, we present the first gridded reconstruction of the European summer VPD over the past 400 years, a dataset that was produced to cover a large knowledge gap about past European VPD variability. The validation statistics performed to obtain our summer VPD reconstruction passed all of the conventional verification tests (e.g., Nash–Sutcliffe model efficiency coefficient, S_{CE}), and the obtained statistical test results indicate that the reconstruction model was statistically robust. Thus, we can present the first gridded reconstructions over 400 years of the summer VPD at the European level. Our spatial reconstruction of summer VPD conditions over Europe based on tree ring δ18O records provides evidence of historical changes and a unique long-term context for recent trends and variability of the summer VPD. Moreover, our reconstruction helps to analyze the spatiotemporal variability of summer VPD in a long-term context emphasizing the local and regional impacts of the current climate change.
The obtained results indicate that the past variability of VPD is different for the three regions we investigated, namely northern Europe, central Europe, and the Mediterranean. Over the Mediterranean region much higher summer VPD values were recorded compared to the other two regions for the analyzed period. The lowest summer VPD values were found for northern Europe, which can be explained by lower temperatures and higher humidity in this area. Similar results were found for the variability of the summer VPD.
The comparison of our summer VPD reconstruction with other climate datasets reveals consistent positive correlations with summer temperatures but negative correlations with summer precipitation and a drought indicator in different European regions, demonstrating agreement with previous climate reconstructions, especially in western and central Europe over a 400-year period. Our reconstruction also shows statistically significant correlations with a recently published regional VPD reconstruction (Treydte et al., 2023). The correlations are higher over the northern and western parts of Europe and smaller over the southern part of Europe and the Alpine regions. Some of the discrepancies, especially over southern Europe and the Alpine region, might arise from the fact that our reconstruction is based on a network of 26 isotope records, while the one from Treydte et al. (2023) is based on 45 isotope records, and their reconstruction has a higher number of records, especially over the mountain regions. Some differences might appear also from the different techniques used to reconstruct the summer VPD, namely random forest (this study) versus fuzzy cluster analysis (Treydte et al., 2023). Moreover, we reconstructed the VPD on a gridded field covering all of Europe and made these 400 years of gridded VPD available to the general public for further analysis, while the study of Treydte et al. (2023) reconstructed clusters (i.e., time series) of VPD over different regions in Europe.
This paper also provides new insights into the relationship between summer VPD and large-scale atmospheric circulation, a relationship that has been neglected so far or at least not treated into a direct manner. Here we show that summer VPD has two preferred modes of variability, namely a NW–SE dipole-like mode and a N–S dipole-like mode. In general, high VPD values are associated with an anticyclonic circulation, while low VPD values are associated with cyclonic-like circulations. Since most of the climate simulations from the Coupled Model Intercomparison Project phase 6 (CMIP6, (Eyring et al., 2016)) indicate an increase in the anomalously high-pressure systems over Europe (Bakke et al., 2023), this needs to be taken into account when analyzing the trends and variability of VPD for the next few decades. Our summer VPD reconstruction was also validated by examining the occurrence of the extreme years, the extremely hot and dry summers coincide with high VPD anomalies, while the extremely wet summers coincide with low VPD anomalies. Interestingly, the high VPD anomaly years show spatial variability with large positive anomalies in specific regions, while the wettest years display consistent negative VPD anomalies over the continent.
Furthermore, the interdisciplinary use of the data should be emphasized, as VPD is a crucial parameter for many climatological processes. As a logical next step, the regional and temporal boundaries of the reconstruction can be extended by using more and longer δ18O time series from tree ring cellulose. It is also possible to disentangle the influence of solar events on the VPD on local, regional, and continental scales.
The gridded reconstructed summer VPD over the last 400 years at the European level is available here: https://doi.org/10.5281/zenodo.5958836 (Balting et al., 2022). The ISONET oxygen isotope data can be accessed at GFZ Data Services: https://doi.org/10.5880/GFZ.4.3.2023.001 (ISONET Project Members et al., 2023). The time series of the individual sample sites can be requested by the corresponding authors of the mentioned studies. The climate data from 20CRv3 are freely available. The postprocessing of the model and reanalysis of output data have been done with the Climate Data Operators (Schulzweida, 2019) and the corresponding Python binding. Furthermore, the reconstruction of the VPD has been done with a modified version of the ClimIndRec version 1.0 scripts (https://doi.org/10.5281/zenodo.5716236, Michel, 2019) in R (version 4.0.2). The required R packages (glmnet, pls, randomForest, ncdf4, and dependencies) are freely available.
The supplement related to this article is available online at: https://doi.org/10.5194/cp-20-573-2024-supplement.
DFB conceived the ideas and designed the methodology together with SLLM, MI, and VN. DFB analyzed the data and drafted and led the writing of the manuscript with significant input from SLLM, MI, VN, GH, MF, GHS, DNS, and GL. All authors contributed critically to the drafts and gave final approval for publication.
The contact author has declared that none of the authors has any competing interests.
Publisher’s note: Copernicus Publications remains neutral with regard to jurisdictional claims made in the text, published maps, institutional affiliations, or any other geographical representation in this paper. While Copernicus Publications makes every effort to include appropriate place names, the final responsibility lies with the authors.
All but four tree ring stable isotope chronologies were established within the project ISONET supported by the European Union (EVK2-CT-2002-00147 “ISONET”). We want to thank all ISONET Project Members (Gerhard Hans Schleser, Laia Andreu-Hayles, Zdzislaw Bednarz, Frank Berninger, Tatjana Boettger, Isabel Dorado-Liñán, Jan Esper, Michael Grabner, Emilia Gutiérrez, Gerhard Helle, Emmi Hilasvuori, Högne Jugner, Maarit Kalela-Brundin, Marek Krąpiec, Markus Leuenberger, Neil J. Loader, Valérie Masson-Delmotte, Sławomira Pawełczyk, Anna Pazdur, Rūtilė Pukienė, Katja T Rinne-Garmston, Antonio Saracino, Matthias Sauerer, Eloni Sonninen, Michel Stiévenard, Vincent R. Switsur, Elżbieta Szychowska-Krąpiec, Małgorzata Szczepanek, Luigi Todaro, Kerstin Treydte, Adomas Vitad, John S. Waterhouse, Martin Weigl-Kuska, Rupert Wimmer). The data from Turkey, Slovenia, and southwestern Germany were produced with the EU-funded project MILLENNIUM (GOCE 017008-2“MILLENNIUM”), with special thanks to Tom Levanic and Ramzi Touchan. The tree ring stable isotope chronologies from Bulgaria were established with the support of the German Research Foundation (DFG, HE3089-1, GR 1432/11-1) and in cooperation with the administration of Pirin National Park, Bulgaria.
This research has been supported by the PalEX Project (Alfred Wegener Institute Helmholtz Centre for Polar and Marine Research – Strategy Fund). Gerrit Lohmann and Monia Ionita were supported by Helmholtz funding through the joint program “Changing Earth – Sustaining our Future” (PoF IV) program of the AWI. Funding was received from the Helmholtz Climate Initiative – REKLIM. Viorica Nagavciuc was partially supported by a grant from the Ministry of Research, Innovation and Digitization, CNCS/CCCDI – UEFISCDI (project no. PNIII-P1-1.1-PD-2019-0469) within PNCDI III, and by a grant of the Ministry of Research, Innovation and Digitization, under the “Romania's National Recovery and Resilience Plan – Founded by EU-NextGenerationEU” program, project “Compound extreme events from a long-term perspective and their impact on forest growth dynamics (CExForD)” number 760074/23.05.2023, code 287/30.11.2022, within Pillar III, Component C9, Investment 8.
The article processing charges for this open-access publication were covered by the Alfred-Wegener-Institut Helmholtz-Zentrum für Polar- und Meeresforschung.
This paper was edited by Denis-Didier Rousseau and reviewed by three anonymous referees.
Ali, M., Prasad, R., Xiang, Y., and Yaseen, Z. M.: Complete ensemble empirical mode decomposition hybridized with random forest and kernel ridge regression model for monthly rainfall forecasts, J. Hydrol., 584, 124647, https://doi.org/10.1016/j.jhydrol.2020.124647, 2020.
Alley, W. M.: The Palmer Drought Severity Index: Limitations and Assumptions, J. Climate, 23, 1100–1109, https://doi.org/10.1175/1520-0450(1984)023<1100:TPDSIL>2.0.CO;2, 1984.
Andreu-Hayles, L., Ummenhofer, C. C., Barriendos, M., Schleser, G. H., Helle, G., Leuenberger, M., Gutiérrez, E., and Cook, E. R.: 400 Years of summer hydroclimate from stable isotopes in Iberian trees, Clim. Dynam., 49, 143–161, https://doi.org/10.1007/s00382-016-3332-z, 2017.
Bair, E. H., Abreu Calfa, A., Rittger, K., and Dozier, J.: Using machine learning for real-time estimates of snow water equivalent in the watersheds of Afghanistan, The Cryosphere, 12, 1579–1594, https://doi.org/10.5194/tc-12-1579-2018, 2018.
Bakke, S. J., Ionita, M., and Tallaksen, L. M.: Recent European drying and its link to prevailing large-scale atmospheric patterns, Sci. Rep., 13, 21921, https://doi.org/10.1038/s41598-023-48861-4, 2023.
Balting, D. F., Ionita, M., Wegmann, M., Helle, G., Schleser, G. H., Rimbu, N., Freund, M. B., Heinrich, I., Caldarescu, D., and Lohmann, G.: Large-scale climate signals of a European oxygen isotope network from tree rings, Clim. Past, 17, 1005–1023, https://doi.org/10.5194/cp-17-1005-2021, 2021.
Balting, D. F., Michel, S. L. L., Nagavciuc, V., Helle, G., Freund, M., Schleser, G. H., Steger, D. N., Lohmann, G., and Ionita, M.: A past and present perspective on the European summer vapour pressure deficit, Zenodo [data set], https://doi.org/10.5281/zenodo.5958836, 2022.
Barbour, M. M.: Stable oxygen isotope composition of plant tissue: A review, Funct. Plant Biol., 34, 83–94, https://doi.org/10.1071/FP06228, 2007.
Barbour, M. M., Roden, J. S., Farquhar, G. D., and Ehleringer, J. R.: Expressing leaf water and cellulose oxygen isotope ratios as enrichment above source water reveals evidence of a Péclet effect, Oecologia, 138, 426–435, https://doi.org/10.1007/s00442-003-1449-3, 2004.
Barkhordarian, A., Saatchi, S. S., Behrangi, A., Loikith, P. C., and Mechoso, C. R.: A Recent Systematic Increase in Vapor Pressure Deficit over Tropical South America, Sci. Rep., 9, 15331, https://doi.org/10.1038/s41598-019-51857-8, 2019.
Behrangi, A., Fetzer, E. J., and Granger, S. L.: Early detection of drought onset using near surface temperature and humidity observed from space, Int. J. Remote Sens., 37, 3911–3923, https://doi.org/10.1080/01431161.2016.1204478, 2016.
Belgiu, M. and Drăgu, L.: Random forest in remote sensing: A review of applications and future directions, ISPRS J. Photogramm., 114, 24–31, https://doi.org/10.1016/j.isprsjprs.2016.01.011, 2016.
Boettger, T., Haupt, M., Konller, K., Weise, S. M., Waterhouse, J. S., Rinne, T., Loader, N. J., Sonninen, E., Jungner, H., Masson-Delmotte, V., Stievenard, M., Guillemin, M.-T., Pierre, M., Pazdur, A., Leuenberger, M., Filot, M., Saurer, M., Reynolds, C. E., Helle, G., and Schleser, G. H.: Wood Cellulose Preparation Methods and Mass Spectrometric Analyses of δ13C, δ18O, and Nonexchangeable δ2H Values in Cellulose, Sugar, and Starch: An Interlaboratory Comparison, Anal. Chem., 79, 4603–4612, https://doi.org/10.1021/ac0700023, 2007.
Brázdil, R., Dobrovolný, P., Trnka, M., Kotyza, O., Řezníčková, L., Valášek, H., Zahradníček, P., and Štěpánek, P.: Droughts in the Czech Lands, 1090–2012 AD, Clim. Past, 9, 1985–2002, https://doi.org/10.5194/cp-9-1985-2013, 2013.
Breiman, L.: Random Forests, Mach. Learn., 45, 5–32, https://doi.org/10.1109/ICCECE51280.2021.9342376, 2001.
Brooks, C. E. P. and Glasspoole, J.: The drought of 1921 in the British Isles, Mon. Weather Rev., 50, 93–93, https://doi.org/10.1175/1520-0493(1922)50<93a:tdoitb>2.0.co;2, 1922.
Buckley, T. N.: How do stomata respond to water status?, New Phytol., 224, 21–36, https://doi.org/10.1111/nph.15899, 2019.
Casty, C., Wanner, H., Luterbacher, J., Esper, J., and Böhm, R.: Temperature and precipitation variability in the European Alps since 1500, Int. J. Climatol., 25, 1855–1880, https://doi.org/10.1002/joc.1216, 2005.
Churakova Sidorova, O. V., Corona, C., Fonti, M. V., Guillet, S., Saurer, M., Siegwolf, R. T. W., Stoffel, M., and Vaganov, E. A.: Recent atmospheric drying in Siberia is not unprecedented over the last 1,500 years, Sci. Rep., 10, 15024, https://doi.org/10.1038/s41598-020-71656-w, 2020.
Cook, B. I., Smerdon, J. E., Cook, E. R., Williams, A. P., Anchukaitis, K. J., Mankin, J. S., Allen, K., Andreu-Hayles, L., Ault, T. R., Belmecheri, S., Coats, S., Coulthard, B., Fosu, B., Grierson, P., Griffin, D., Herrera, D. A., Ionita, M., Lehner, F., Leland, C., Marvel, K., Morales, M. S., Mishra, V., Ngoma, J., Nguyen, H. T. T., O'Donnell, A., Palmer, J., Rao, M. P., Rodriguez-Caton, M., Seager, R., Stahle, D. W., Stevenson, S., Thapa, U. K., Varuolo-Clarke, A. M., and Wise, E. K.: Megadroughts in the Common Era and the Anthropocene, Nat. Rev. Earth Environ., 3, 741–757, https://doi.org/10.1038/s43017-022-00329-1, 2022.
Cook, E. R., Seager, R., Cane, M. A., and Stahle, D. W.: North American drought: Reconstructions, causes, and consequences, Earth Sci. Rev., 81, 93–134, https://doi.org/10.1016/j.earscirev.2006.12.002, 2007.
Cook, E. R., Seager, R., Kushnir, Y., Briffa, K. R., Büntgen, U., Frank, D., Krusic, P. J., Tegel, W., van der Schrier, G., Andreu-Hayles, L., Baillie, M., Baittinger, C., Bleicher, N., Bonde, N., Brown, D., Carrer, M., Cooper, R., Čufar, K., Dittmar, C., Esper, J., Griggs, C., Gunnarson, B., Günther, B., Gutierrez, E., Haneca, K., Helama, S., Herzig, F., Heussner, K.-U. U., Hofmann, J., Janda, P., Kontic, R., Köse, N., Kyncl, T., Levanič, T., Linderholm, H., Manning, S., Melvin, T. M., Miles, D., Neuwirth, B., Nicolussi, K., Nola, P., Panayotov, M., Popa, I., Rothe, A., Seftigen, K., Seim, A., Svarva, H., Svoboda, M., Thun, T., Timonen, M., Touchan, R., Trotsiuk, V., Trouet, V., Walder, F., Ważny, T., Wilson, R., and Zang, C.: Old World megadroughts and pluvials during the Common Era, Sci. Adv., 1, e1500561, https://doi.org/10.1126/sciadv.1500561, 2015.
Craig, H.: Isotopic standards for carbon and oxygen and correction factors for mass-spectrometric analysis of carbon dioxide, Geochim. Cosmochim. Ac., 12, 133–149, https://doi.org/10.1016/0016-7037(57)90024-8, 1957.
Dai, A.: Increasing drought under global warming in observations and models, Nat. Clim. Change, 3, 52–58, https://doi.org/10.1038/nclimate1633, 2013.
Davies, D. and Loader, N. J.: An evaluation of english oak earlywood vessel area as a climate proxy in the UK, Dendrochronologia, 64, 125777, https://doi.org/10.1016/j.dendro.2020.125777, 2020.
Delcroix, T., Michel, S. L. L., Swingedouw, D., Malaizé, B., Daniau, A.-L., Abarca-del-Rio, R., Caley, T., and Sémah, A.-M.: Clarifying the Role of ENSO on Easter Island Precipitation Changes: Potential Environmental Implications for the Last Millennium, Paleoceanoraphy and Paleoclimatology, 37, e2022PA004514, https://doi.org/10.1029/2022PA004514, 2022.
Etien, N., Daux, V., Masson-Delmotte, V., Stievenard, M., Bernard, V., Durost, S., Guillemin, M. T., Mestre, O., and Pierre, M.: A bi-proxy reconstruction of Fontainebleau (France) growing season temperature from A.D. 1596 to 2000, Clim. Past, 4, 91–106, https://doi.org/10.5194/cp-4-91-2008, 2008.
Eyring, V., Bony, S., Meehl, G. A., Senior, C. A., Stevens, B., Stouffer, R. J., and Taylor, K. E.: Overview of the Coupled Model Intercomparison Project Phase 6 (CMIP6) experimental design and organization, Geosci. Model Dev., 9, 1937–1958, https://doi.org/10.5194/gmd-9-1937-2016, 2016.
Ferrio, J. P. and Voltas, J.: Carbon and oxygen isotope ratios in wood constituents of Pinus halepensis as indicators of precipitation, temperature and vapour pressure deficit, Tellus B, 57, 164–173, https://doi.org/10.1111/j.1600-0889.2005.00137.x, 2005.
Fletcher, A. L., Sinclair, T. R., and Allen, L. H.: Transpiration responses to vapor pressure deficit in well watered “slow-wilting” and commercial soybean, Environ. Exp. Bot., 61, 145–151, https://doi.org/10.1016/j.envexpbot.2007.05.004, 2007.
Freund, M. B., Henley, B. J., Karoly, D. J., McGregor, H. V., Abram, N. J., and Dommenget, D.: Higher frequency of Central Pacific El Niño events in recent decades relative to past centuries, Nat. Geosci., 12, 450–455, https://doi.org/10.1038/s41561-019-0353-3, 2019.
Freund, M. B., Helle, G., Balting, D. F., Ballis, N., Schleser, G. H., and Cubasch, U.: European tree-ring isotopes indicate unusual recent hydroclimate, Commun. Earth Environ., 4, 26, https://doi.org/10.1038/s43247-022-00648-7, 2023.
Fritts, H. C.: Tree Rings and Climate, Academic Press, London, https://doi.org/10.1016/B978-0-12-268450-0.X5001-0, ISBN 978-0-12-268450-0, 1976.
Gagen, M., Battipaglia, G., Daux, V., Duffy, J., Dorado-Liñán, I., Hayles, L. A., Martínez-Sancho, E., McCarroll, D., Shestakova, T. A., and Treydte, K.: Climate Signals in Stable Isotope Tree-Ring Records BT – Stable Isotopes in Tree Rings: Inferring Physiological, Climatic and Environmental Responses, in: Stable Isotopes in Tree Rings. Tree Physiology, edited by: Siegwolf, R. T. W., Brooks, J. R., Roden, J., and Saurer, M., 537–579, Springer International Publishing, Cham, https://doi.org/10.1007/978-3-030-92698-4_19, 2022.
Glaser, R.: Klimageschichte Mitteleuropas: 1200 Jahre Wetter, Klima, Katastrophen, Primus Verlag, Darmstadt, ISBN 9783896786043, 2008.
González-González, B. D., Vázquez-Ruiz, R. A., and García-González, I.: Effects of climate on earlywood vessel formation of quercus robur and q. Pyrenaica at a site in the northwestern iberian peninsula, Can. J. Forest Res., 45, 698–709, https://doi.org/10.1139/cjfr-2014-0436, 2015.
Good, S. P., Noone, D., and Bowen, G.: Hydrologic connectivity constrains partitioning of global terrestrial water fluxes, Science, 349, 6244, https://doi.org/10.1126/science.aaa5931, 2015.
Grossiord, C., Buckley, T. N., Cernusak, L. A., Novick, K. A., Poulter, B., Siegwolf, R. T. W., Sperry, J. S., and McDowell, N. G.: Plant responses to rising vapor pressure deficit, New Phytol., 226, 1150–1566, https://doi.org/10.1111/nph.16485, 2020.
Hafner, P., McCarroll, D., Robertson, I., Loader, N. J., Gagen, M., Young, G. H. F., Bale, R. J., Sonninen, E., and Levanič, T.: A 520 year record of summer sunshine for the eastern European Alps based on stable carbon isotopes in larch tree rings, Clim. Dynam., 43, 971–980, https://doi.org/10.1007/s00382-013-1864-z, 2014.
Haupt, M., Weigl, M., Grabner, M., and Boettger, T.: A 400-year reconstruction of July relative air humidity for the Vienna region (eastern Austria) based on carbon and oxygen stable isotope ratios in tree-ring latewood cellulose of oaks (Quercus petraea Matt. Liebl.), Climatic Change, 105, 243–262, https://doi.org/10.1007/s10584-010-9862-1, 2011.
Heinrich, I., Touchan, R., Dorado Liñán, I., Vos, H., and Helle, G.: Winter-to-spring temperature dynamics in Turkey derived from tree rings since AD 1125, Clim. Dynam., 41, 1685–1701, https://doi.org/10.1007/s00382-013-1702-3, 2013.
Helama, S., Läänelaid, A., Raisio, J., Mäkelä, H. M., Hilasvuori, E., Jungner, H., and Sonninen, E.: Oak decline analyzed using intraannual radial growth indices, δ13C series and climate data from a rural hemiboreal landscape in southwesternmost Finland, Environ. Monit. Assess., 186, 4697–4708, https://doi.org/10.1007/s10661-014-3731-8, 2014.
Hersbach, H., Bell, B., Berrisford, P., Hirahara, S., Horányi, A., Muñoz-Sabater, J., Nicolas, J., Peubey, C., Radu, R., Schepers, D., Simmons, A., Soci, C., Abdalla, S., Abellan, X., Balsamo, G., Bechtold, P., Biavati, G., Bidlot, J., Bonavita, M., De Chiara, G., Dahlgren, P., Dee, D., Diamantakis, M., Dragani, R., Flemming, J., Forbes, R., Fuentes, M., Geer, A., Haimberger, L., Healy, S., Hogan, R. J., Hólm, E., Janisková, M., Keeley, S., Laloyaux, P., Lopez, P., Lupu, C., Radnoti, G., de Rosnay, P., Rozum, I., Vamborg, F., Villaume, S., and Thépaut, J.-N.: The ERA5 global reanalysis, Q. J. R. Meteor. Soc., 146, 1999–2049, https://doi.org/10.1002/qj.3803, 2020.
Hilasvuori, E., Berninger, F., Sonninen, E., Tuomenvirta, H., and Jungner, H.: Stability of climate signal in carbon and oxygen isotope records and ring width from Scots pine (Pinus sylvestris L.) in Finland, J. Quaternary Sci., 24, 469–480, https://doi.org/10.1002/jqs.1260, 2009.
Ionita, M., Lohmann, G., and Rimbu, N.: Prediction of spring Elbe discharge Based on stable teleconnections with winter global temperature and precipitation, J. Climate, 21, 6215–6226, https://doi.org/10.1175/2008JCLI2248.1, 2008.
Ionita, M., Boroneanṭ, C., and Chelcea, S.: Seasonal modes of dryness and wetness variability over Europe and their connections with large scale atmospheric circulation and global sea surface temperature, Clim. Dynam., 45, 2803–2829, 2015.
Ionita, M., Dima, M., Nagavciuc, V., Scholz, P., and Lohmann, G.: Past megadroughts in central Europe were longer, more severe and less warm than modern droughts, Commun. Earth Environ., 2, 61, https://doi.org/10.1038/s43247-021-00130-w, 2021.
Ionita, M., Nagavciuc, V., Scholz, P., and Dima, M.: Long-term drought intensification over Europe driven by the weakening trend of the Atlantic Meridional Overturning Circulation, J. Hydrol. Reg. Stud., 42, 101176, https://doi.org/10.1016/j.ejrh.2022.101176, 2022.
IPCC: Climate Change 2021: The Physical Science Basis. Contribution of Working Group I to the Sixth Assessment Report of the Intergovernmental Panel on Climate Change, edited by: Masson-Delmotte, V., Zhai, P., Pirani, A., Connors, S. L., Péan, C., Berger, S., Caud, N., Chen, Y., Goldfarb, L., Gomis, M. I., Huang, M., Leitzell, K., Lonnoy, E., Matthews, J. B. R., Maycock, T. K., Waterfield, T., Yelekçi, O., Yu, R., and Zhou, B., Cambridge University Press, Cambridge, United Kingdom and New York, NY, USA, 2391 pp., https://doi.org/10.1017/9781009157896, 2021a.
IPCC: Summary for Policymakers. In: Climate Change 2021: The Physical Science Basis. Contribution of Working Group I to the Sixth Assessment Report of the Intergovernmental Panel on Climate Change, edited by: Masson-Delmotte, V., Zhai, P., Pirani, A., Connors, S. L., Péan, C., Berger, S., Caud, N., Chen, Y., Goldfarb, L., Gomis, M. I., Huang, M., Leitzell, K., Lonnoy, E., Matthews, J. B. R., Maycock, T. K., Waterfield, T., Yelekçi, O., Yu, R., and Zhou, B., Cambridge University Press, Cambridge, United Kingdom and New York, NY, USA, 3−-32, https://doi.org/10.1017/9781009157896.001, 2021b.
ISONET Project Members, Schleser, G. H., Andreu-Hayles, L., Bednarz, Z., Berninger, F., Boettger, T., Dorado-Liñán, I., Esper, J., Grabner, M., Gutiérrez, E., Helle, G., Hilasvuori, E., Jugner, H., Kalela-Brundin, M., Krąpiec, M., Leuenberger, M., Loader, N. J., Masson-Delmotte, V., Pawełczyk, S., Pazdur, A., Pukienė, R., Rinne-Garmston, K. T., Saracino, A., Saurer, M., Sonninen, E., Stiévenard, M., Switsur, V. R. Szychowska-Krąpiec, E. Szczepanek, M., Todaro, L., Treydte, K., Vitas, A., Waterhouse, J. S., Weigl-Kuska, M., and Wimmer, R.: Stable oxygen isotope ratios of tree-ring cellulose from the site network of the EU-Project “ISONET”, GFZ Data Services [data set], https://doi.org/10.5880/GFZ.4.3.2023.001, 2023.
Iturbide, M., Gutiérrez, J. M., Alves, L. M., Bedia, J., Cerezo-Mota, R., Cimadevilla, E., Cofiño, A. S., Di Luca, A., Faria, S. H., Gorodetskaya, I. V., Hauser, M., Herrera, S., Hennessy, K., Hewitt, H. T., Jones, R. G., Krakovska, S., Manzanas, R., Martínez-Castro, D., Narisma, G. T., Nurhati, I. S., Pinto, I., Seneviratne, S. I., van den Hurk, B., and Vera, C. S.: An update of IPCC climate reference regions for subcontinental analysis of climate model data: definition and aggregated datasets, Earth Syst. Sci. Data, 12, 2959–2970, https://doi.org/10.5194/essd-12-2959-2020, 2020.
Jones, M. D., Dee, S., Anderson, L., Baker, A., Bowen, G., and Noone, D. C.: Water isotope systematics: Improving our palaeoclimate interpretations, Quaternary Sci. Rev., 131, 243–249, https://doi.org/10.1016/j.quascirev.2015.11.014, 2016.
Jones, P. D., Briffa, K. R., Osborn, T. J., Lough, J. M., Van Ommen, T. D., Vinther, B. M., Luterbacher, J., Wahl, E. R., Zwiers, F. W., Mann, M. E., Schmidt, G. A., Ammann, C. M., Buckley, B. M., Cobb, K. M., Esper, J., Goosse, H., Graham, N., Jansen, E., Kiefer, T., Kull, C., Küttel, M., Mosley-Thompson, E., Overpeck, J. T., Riedwyl, N., Schulz, M., Tudhope, A. W., Villalba, R., Wanner, H., Wolff, E., and Xoplaki, E.: High-resolution palaeoclimatology of the last millennium: A review of current status and future prospects, Holocene, 19, 3–49, https://doi.org/10.1177/0959683608098952, 2009.
Josse, J. and Husson, F.: missMDA: A Package for Handling Missing Values in Multivariate Data Analysis, J. Stat. Softw., 70, 1–31, https://doi.org/10.18637/jss.v070.i01, 2016.
Kahmen, A., Sachse, D., Arndt, S. K., Tu, K. P., Farrington, H., Vitousek, P. M., and Dawsona, T. E.: Cellulose δ18O is an index of leaf-to-air vapor pressure difference (VPD) in tropical plants, P. Natl. Acad. Sci. USA, 108, 1981–1986, https://doi.org/10.1073/pnas.1018906108, 2011.
Kingston, D. G., Stagge, J. H., Tallaksen, L. M., and Hannah, D. M.: European-scale drought: Understanding connections between atmospheric circulation and meteorological drought indices, J. Climate, 28, 505–516, https://doi.org/10.1175/JCLI-D-14-00001.1, 2015.
Labuhn, I., Daux, V., Pierre, M., Stievenard, M., Girardclos, O., Féron, A., Genty, D., and Masson-Delmotte, V., Mestre, O.: Tree age, site and climate controls on tree ring cellulose δ18O: A case study on oak trees from south-western France, Dendrochronologia, 32, 78–89, https://doi.org/10.1016/j.dendro.2013.11.001, 2014.
Labuhn, I., Daux, V., Girardclos, O., Stievenard, M., Pierre, M., and Masson-Delmotte, V.: French summer droughts since 1326 CE: a reconstruction based on tree ring cellulose δ18O, Clim. Past, 12, 1101–1117, https://doi.org/10.5194/cp-12-1101-2016, 2016.
Lawrence, M. G.: The relationship between relative humidity and the dewpoint temperature in moist air: A simple conversion and applications, B. Am. Meteorol. Soc., 86, 225–234, https://doi.org/10.1175/BAMS-86-2-225, 2005.
Leonelli, G., Coppola, A., Salvatore, M. C., Baroni, C., Battipaglia, G., Gentilesca, T., Ripullone, F., Borghetti, M., Conte, E., Tognetti, R., Marchetti, M., Lombardi, F., Brunetti, M., Maugeri, M., Pelfini, M., Cherubini, P., Provenzale, A., and Maggi, V.: Climate signals in a multispecies tree-ring network from central and southern Italy and reconstruction of the late summer temperatures since the early 1700s, Clim. Past, 13, 1451–1471, https://doi.org/10.5194/cp-13-1451-2017, 2017.
Li, J., Wang, Z., Lai, C., and Zhang, Z.: Tree-ring-width based streamflow reconstruction based on the random forest algorithm for the source region of the Yangtze River, China, Catena, 183, 104216, https://doi.org/10.1016/j.catena.2019.104216, 2019.
Lindgren, A., Lu, Z., Zhang, Q., and Hugelius, G.: Reconstructing Past Global Vegetation With Random Forest Machine Learning, Sacrificing the Dynamic Response for Robust Results, J. Adv. Model. Earth Sy., 13, e2020MS002200, https://doi.org/10.1029/2020MS002200, 2021.
Liu, X., Zhang, X., Zhao, L., Xu, G., Wang, L., Sun, W., Zhang, Q., Wang, W., Zeng, X., and Wu, G.: Tree ring δ18O reveals no long‐term change of atmospheric water demand since 1800 in the northern Great Hinggan Mountains, China, China, J. Geophys. Res.-Atmos., 122, 6697–6712, 2017.
Locosselli, G. M., Brienen, R. J. W., de Souza Martins, V. T., Gloor, E., Boom, A., de Camargo, E. P., Saldiva, P. H. N., and Buckeridge, M. S.: Intra-annual oxygen isotopes in the tree rings record precipitation extremes and water reservoir levels in the Metropolitan Area of São Paulo, Brazil, Sci. Total Environ., 743, 140798, https://doi.org/10.1016/j.scitotenv.2020.140798, 2020.
Luterbacher, J., Dietrich, D., Xoplaki, E., Grosjean, M., and Wanner, H.: European Seasonal and Annual Temperature Variability, Trends, and Extremes since 1500, Science, 303, 1499–1503, https://doi.org/10.1126/science.1093877, 2004.
Marengo, J. A., Nobre, C. A., Tomasella, J., Oyama, M. D., de Oliveira, G. S., de Oliveira, R., Camargo, H., Alves, L. M., and Brown, I. F.: The drought of Amazonia in 2005, J. Climate, 21, 495–516, https://doi.org/10.1175/2007JCLI1600.1, 2008.
Marusek, J. A.: A Chronological Listing of Early Weather Events, breadandbutterscience, Report, http://www.breadandbutterscience.com/Weather.pdf (last access: 16 October 2023), 580, 2010.
Maxwell, A. E., Warner, T. A., and Fang, F.: Implementation of machine-learning classification in remote sensing: An applied review, Int. J. Remote Sens., 39, 2784–2817, https://doi.org/10.1080/01431161.2018.1433343, 2018.
McCarroll, D. and Loader, N. J.: Stable isotopes in tree rings, Quaternary Sci. Rev., 23, 771–801, https://doi.org/10.1016/j.quascirev.2003.06.017, 2004.
McCarthy, G. D., Haigh, I. D., Hirschi, J. J.-M., Grist, J. P., and Smeed, D. A.: Ocean impact on decadal Atlantic climate variability revealed by sea-level observations, Nature, 521, 508–510, https://doi.org/10.1038/nature14491, 2015.
Michel, S.: ClimIndRec 1.0, Zenodo [code], https://doi.org/10.5281/zenodo.5716236, 2019.
Michel, S., Swingedouw, D., Chavent, M., Ortega, P., Mignot, J., and Khodri, M.: Reconstructing climatic modes of variability from proxy records using ClimIndRec version 1.0, Geosci. Model Dev., 13, 841–858, https://doi.org/10.5194/gmd-13-841-2020, 2020.
Michel, S. L. L., Swingedouw, D., Ortega, P., Gastineau, G., Mignot, J., McCarthy, G., and Khodri, M.: Early warning signal for a tipping point suggested by a millennial Atlantic Multidecadal Variability reconstruction, Nat. Commun., 13, 5176, https://doi.org/10.1038/s41467-022-32704-3, 2022.
Mohr, C. H., Manga, M., Helle, G., Heinrich, I., Giese, L., and Korup, O.: Trees Talk Tremor Wood Anatomy and Content Reveal Contrasting Tree-Growth Responses to Earthquakes, J. Geophys. Res.-Biogeo., 126, e2021JG006385, https://doi.org/10.1029/2021JG006385, 2021.
Nagavciuc, V., Ionita, M., Per?oiu, A., Popa, I., Loader, N. J., and McCarroll, D.: Stable oxygen isotopes in Romanian oak tree rings record summer droughts and associated large-scale circulation patterns over Europe, Clim. Dynam., 52, 6557–6568, https://doi.org/10.1007/s00382-018-4530-7, 2019.
Nagavciuc, V., Ionita, M., Kern, Z., McCarroll, D., and Popa, I.: A ∼ 700 years perspective on the 21st century drying in the eastern part of Europe based on δ18O in tree ring cellulose, Commun. Earth Environ., 3, 277, https://doi.org/10.1038/s43247-022-00605-4, 2022.
Nash, J. E. and Sutcliffe, J. V.: River flow forecasting through conceptual models part I – A discussion of principles, J. Hydrol., 10, 282–290, https://doi.org/10.1016/0022-1694(70)90255-6, 1970.
Novick, K. A., Ficklin, D. L., Stoy, P. C., Williams, C. A., Bohrer, G., Oishi, A. C., Papuga, S. A., Blanken, P. D., Noormets, A., Sulman, B. N., Scott, R. L., Wang, L., and Phillips, R. P.: The increasing importance of atmospheric demand for ecosystem water and carbon fluxes, Nat. Clim. Change, 6, 1023–1027, https://doi.org/10.1038/nclimate3114, 2016.
Ortega, P., Lehner, F., Swingedouw, D., Masson-Delmotte, V., Raible, C. C., Casado, M., and Yiou, P.: A model-tested North Atlantic Oscillation reconstruction for the past millennium, Nature, 523, 71–74, https://doi.org/10.1038/nature14518, 2015.
Oshiro, T. M., Perez, P. S., and Baranauskas, J. A.: How Many Trees in a Random Forest?, in: Machine Learning and Data Mining in Pattern Recognition, edited by: Perner, P., MLDM 2012. Lecture Notes in Computer Science, 7376, Springer, Berlin, Heidelberg, https://doi.org/10.1007/978-3-642-31537-4_13, 2012
Pauling, A., Luterbacher, J., Casty, C., and Wanner, H.: Five hundred years of gridded high-resolution precipitation reconstructions over Europe and the connection to large-scale circulation, Clim. Dynam., 26, 387–405, https://doi.org/10.1007/s00382-005-0090-8, 2006.
Prasad, R., Ali, M., Kwan, P., and Khan, H.: Designing a multi-stage multivariate empirical mode decomposition coupled with ant colony optimization and random forest model to forecast monthly solar radiation, Appl. Energ., 236, 778–792, https://doi.org/10.1016/j.apenergy.2018.12.034, 2019.
Qu, Y., Zhu, Z., Chai, L., Liu, S., Montzka, C., Liu, J., Yang, X., Lu, Z., Jin, R., Li, X., Guo, Z., and Zheng, J.: Rebuilding a microwave soil moisture product using random forest adopting amsr-e/amsr2 brightness temperature and smap over the Qinghai–Tibet Plateau, China, Remote Sens., 11, 683, https://doi.org/10.3390/rs11060683, 2019.
Reichstein, M., Camps-Valls, G., Stevens, B., Jung, M., Denzler, J., Carvalhais, N., and Prabhat: Deep learning and process understanding for data-driven Earth system science, Nature, 566, 195–204, https://doi.org/10.1038/s41586-019-0912-1, 2019.
Restaino, C. M., Peterson, D. L., and Littell, J.: Increased water deficit decreases Douglas fir growth throughout western US forests, P. Natl. Acad. Sci. USA, 113, 9557–9562, https://doi.org/10.1073/pnas.1602384113, 2016.
Rinne, K. T., Loader, N. J., Switsur, V. R., and Waterhouse, J. S.: 400-year May–August precipitation reconstruction for Southern England using oxygen isotopes in tree rings, Quaternary Sci. Rev., 60, 13–25, https://doi.org/10.1016/j.quascirev.2012.10.048, 2013.
Roden, J., Lin, G., and Ehleringer, J. R.: A mechanistic model for interpretation of hydrogen and oxygen isotope ratios in tree-ring cellulose, Geochim. Cosmochim. Ac,, 64, 21–35, 2000.
Rodriguez-Galiano, V. F., Ghimire, B., Rogan, J., Chica-Olmo, M., and Rigol-Sanchez, J. P.: An assessment of the effectiveness of a random forest classifier for land-cover classification, ISPRS J. Photogramm. Remote Sens., 67, 93–104, https://doi.org/10.1016/j.isprsjprs.2011.11.002, 2012.
Roibu, C. C., Palaghianu, C., Nagavciuc, V., Ionita, M., Sfecla, V., Mursa, A., Crivellaro, A., Stirbu, M. I., Cotos, M. G., Popa, A., Sfecla, I., and Popa, I.: The Response of Beech (Fagus sylvatica L.) Populations to Climate in the Easternmost Sites of Its European Distribution, Plants, 11, 3310, https://doi.org/10.3390/plants11233310, 2022.
Running, S. W.: Environmental control of leaf water conductance in conifers, Can. J. Forest Res., 6, 104–112, https://doi.org/10.1139/x76-013, 1976.
Saurer, M., Borella, S., Schweingruber, F., and Siegwolf, R.: Stable carbon isotopes in tree rings of beech: Climatic versus site-related influences, Trees-Struct. Funct., 11, 291–297, https://doi.org/10.1007/s004680050087, 1997.
Saurer, M., Cherubini, P., Reynolds-Henne, C. E., Treydte, K. S., Anderson, W. T., and Siegwolf, R. T. W.: An investigation of the common signal in tree ring stable isotope chronologies at temperate sites, J. Geophys. Res.-Biogeo., 113, G0403, https://doi.org/10.1029/2008JG000689, 2008.
Saurer, M., Kress, A., Leuenberger, M., Rinne, K. T., Treydte, K. S., and Siegwolf, R. T. W.: Influence of atmospheric circulation patterns on the oxygen isotope ratio of tree rings in the Alpine region, J. Geophys. Res.-Atmos., 117, D05118, https://doi.org/10.1029/2011JD016861, 2012.
Saurer, M., Spahni, R., Frank, D. C., Joos, F., Leuenberger, M., Loader, N. J., Mccarroll, D., Gagen, M., Poulter, B., Siegwolf, R. T. W., Andreu-Hayles, L., Boettger, T., Dorado Liñán, I., Fairchild, I. J., Friedrich, M., Gutierrez, E., Haupt, M., Hilasvuori, E., Heinrich, I., Helle, G., Grudd, H., Jalkanen, R., Levanič, T., Linderholm, H. W., Robertson, I., Sonninen, E., Treydte, K., Waterhouse, J. S., Woodley, E. J., Wynn, P. M., and Young, G. H. F.: Spatial variability and temporal trends in water-use efficiency of European forests, Glob. Change Biol., 20, 3700–371, https://doi.org/10.1111/gcb.12717, 2014.
Schubert, S. D., Wang, H., Koster, R. D., Suarez, M. J., and Groisman, P. Y.: Northern Eurasian heat waves and droughts, J. Climate, 27, 3169–3207, https://doi.org/10.1175/JCLI-D-13-00360.1, 2014.
Schulzweida U.: CDO User Guide, Climate Data Operator, Version 2.3.0, https://code.mpimet.mpg.de/projects/cdo/embedded/cdo.pdf (last access: 16 October 2023), 2019.
Seager, R., Hooks, A., Williams, A. P., Cook, B., Nakamura, J., and Henderson, N.: Climatology, variability, and trends in the U.S. Vapor pressure deficit, an important fire-related meteorological quantity, J. Appl. Meteorol. Clim., 54, 1121–1141, https://doi.org/10.1175/JAMC-D-14-0321.1, 2015.
Siegwolf, R. T. W., Brooks, J. R., Roden, J., and Saurer, M. (Eds.): Stable Isotopes in Tree Rings Inferring Physiological, Climatic and Environmental Responses, in: Tree Physiology, Springer, Cham, Switzerland, https://doi.org/10.1007/978-3-030-92698-4, ISBN 978-3-030-92697-7, 2022.
Simmons, A. J., Willett, K. M., Jones, P. D., Thorne, P. W., and Dee, D. P.: Low-frequency variations in surface atmospheric humidity, temperature, and precipitation: Inferences from reanalyses and monthly gridded observational data sets, J. Geophys. Res.-Atmos., 115, D01110, https://doi.org/10.1029/2009JD012442, 2010.
Slivinski, L. C., Compo, G. P., Whitaker, J. S., Sardeshmukh, P. D., Giese, B. S., McColl, C., Allan, R., Yin, X., Vose, R., Titchner, H., Kennedy, J., Spencer, L. J., Ashcroft, L., Brönnimann, S., Brunet, M., Camuffo, D., Cornes, R., Cram, T. A., Crouthamel, R., Domínguez-Castro, F., Freeman, J. E., Gergis, J., Hawkins, E., Jones, P. D., Jourdain, S., Kaplan, A., Kubota, H., Blancq, F. Le, Lee, T. C., Lorrey, A., Luterbacher, J., Maugeri, M., Mock, C. J., Moore, G. W. W. K. K., Przybylak, R., Pudmenzky, C., Reason, C., Slonosky, V. C., Smith, C. A., Tinz, B., Trewin, B., Valente, M. A., Wang, X. L., Wilkinson, C., Wood, K., and Wyszyński, P.: Towards a more reliable historical reanalysis: Improvements for version 3 of the Twentieth Century Reanalysis system, Q. J. Roy. Meteor. Soc., 145, 2876–2908, https://doi.org/10.1002/qj.3598, 2019.
Steiger, N. J., Smerdon, J. E., Cook, E. R., and Cook, B. I.: A reconstruction of global hydroclimate and dynamical variables over the Common Era, Sci. Data, 5, 1–15, https://doi.org/10.1038/sdata.2018.86, 2018.
Sternberg, L. and DeNiro, M. J.: Isotopic composition of cellulose from C3, C4, and CAM plants growing near one another, Science, 220, 947–949, https://doi.org/10.1126/science.220.4600.947, 1983.
Treydte, K., Schleser, G. H., Esper, J., Andreu, L., Bednarz, Z., Berninger, F., Böttger, T., D`Allessandro, C. D., Etien, N., Filot, M., Frank, D., Grabner, M., Gutierrez, E., Haupt, M., Helle, G., Hilasvuori, E., Jungner, H., Kalela-Brundin, M., Leuenberger, M., Loader, N., Masson-Delmotte, V., Pazdur, A., Planells, O., Pukiene, R., Reynolds, C., Rinne, K., Saurer, M., Sonninen, E., Stievenard, M., Switsur, R., Szczepanek, M., Todaro, L., Waterhouse, J., Weigl, M., and Wimmer, R.: Climate signals in the European isotope network ISONET, Tree rings Archaeol, Climatol. Ecol. TRACE, 5, 138–147, 2007a.
Treydte, K., Frank, D., Esper, J., Andreu, L., Bednarz, Z., Berninger, F., Boettger, T., D'Alessandro, C. M., Etien, N., Filot, M., Grabner, M., Guillemin, M. T., Gutierrez, E., Haupt, M., Helle, G., Hilasvuori, E., Jungner, H., Kalela-Brundin, M., Krapiec, M., Leuenberger, M., Loader, N. J., Masson-Delmotte, V., Pazdur, A., Pawelczyk, S., Pierre, M., Planells, O., Pukiene, R., Reynolds-Henne, C. E., Rinne, K. T., Saracino, A., Saurer, M., Sonninen, E., Stievenard, M., Switsur, V. R., Szczepanek, M., Szychowska-Krapiec, E., Todaro, L., Waterhouse, J. S., Weigl, M., and Schleser, G. H.: Signal strength and climate calibration of a European tree-ring isotope network, Geophys. Res. Lett., 34, L24302, https://doi.org/10.1029/2007GL031106, 2007b.
Treydte, K., Liu, L., Padrón, R. S., Martínez-Sancho, E., Babst, F., Frank, D. C., Gessler, A., Kahmen, A., Poulter, B., Seneviratne, S. I., Stegehuis, A. I., Wilson, R., Andreu-Hayles, L., Bale, R., Bednarz, Z., Boettger, T., Berninger, F., Büntgen, U., Daux, V., Dorado-Liñán, I., Esper, J., Friedrich, M., Gagen, M., Grabner, M., Grudd, H., Gunnarsson, B. E., Gutiérrez, E., Hafner, P., Haupt, M., Hilasvuori, E., Heinrich, I., Helle, G., Jalkanen, R., Jungner, H., Kalela-Brundin, M., Kessler, A., Kirchhefer, A., Klesse, S., Krapiec, M., Levanič, T., Leuenberger, M., Linderholm, H. W., McCarroll, D., Masson-Delmotte, V., Pawelczyk, S., Pazdur, A., Planells, O., Pukiene, R., Rinne-Garmston, K. T., Robertson, I., Saracino, A., Saurer, M., Schleser, G. H., Seftigen, K., Siegwolf, R. T. W., Sonninen, E., Stievenard, M., Szychowska-Krapiec, E., Szymaszek, M., Todaro, L., Waterhouse, J. S., Weigl-Kuska, M., Weigt, R. B., Wimmer, R., Woodley, E. J., Vitas, A., Young, G., and Loader, N. J.: Recent human-induced atmospheric drying across Europe unprecedented in the last 400 years, Nat. Geosci., 17, 58–65, https://doi.org/10.1038/s41561-023-01335-8, 2023.
Trigo, R. M., Vaquero, J. M., Alcoforado, M. J., Barriendos, M., Taborda, J., García-Herrera, R., and Luterbacher, J.: Iberia in 1816, the year without a summer, Int. J. Climatol., 29, 99–115, https://doi.org/10.1002/joc.1693, 2009.
Tyralis, H., Papacharalampous, G., and Langousis, A.: A brief review of random forests for water scientists and practitioners and their recent history in water resources, Water-Switzerland, 11, 910, https://doi.org/10.3390/w11050910, 2019.
Valler, V., Franke, J., Brugnara, Y., and Brönnimann, S.: An updated global atmospheric paleo-reanalysis covering the last 400 years, Geosci. Data J., 9, 89–107, https://doi.org/10.1002/gdj3.121, 2022.
Vitas, A.: Tree-ring chronology of Scots pine (Pinus sylvestris L.) for Lithuania, Balt. For., 14, 110–115, https://www.dendrochronology-lt.com/publikacijos/2008-11.pdf (last access: 16 October 2023), 2008.
Wang, J., Yang, B., Ljungqvist, F. C., Luterbacher, J., Osborn, T. J., Briffa, K. R., and Zorita, E.: Internal and external forcing of multidecadal Atlantic climate variability over the past 1,200 years, Nat. Geosci., 10, 512–517, https://doi.org/10.1038/ngeo2962, 2017.
Willett, K. M., Dunn, R. J. H., Thorne, P. W., Bell, S., de Podesta, M., Parker, D. E., Jones, P. D., and Williams Jr., C. N.: HadISDH land surface multi-variable humidity and temperature record for climate monitoring, Clim. Past, 10, 1983–2006, https://doi.org/10.5194/cp-10-1983-2014, 2014.
Williams, A. P., Allen, C. D., Macalady, A. K., Griffin, D., Woodhouse, C. A., Meko, D. M., Swetnam, T. W., Rauscher, S. A., Seager, R., Grissino-Mayer, H. D., Dean, J. S., Cook, E. R., Gangodagamage, C., Cai, M., and Mcdowell, N. G.: Temperature as a potent driver of regional forest drought stress and tree mortality, Nat. Clim. Change, 3, 292–297, https://doi.org/10.1038/nclimate1693, 2013.
WMO: Technical Regulations Basic Documents No. 2 Volume II – Meteorological Service for International Air Navigation, WMO-No. 49, 206, https://library.wmo.int/records/item/35795-technical-regulations-volume-ii-meteorological-service-for-international-air-navigation (last access: 16 October 2023), 2018.
Yang, J., Jiang, L., Luojus, K., Pan, J., Lemmetyinen, J., Takala, M., and Wu, S.: Snow depth estimation and historical data reconstruction over China based on a random forest machine learning approach, The Cryosphere, 14, 1763–1778, https://doi.org/10.5194/tc-14-1763-2020, 2020.
Yuan, W., Zheng, Y., Piao, S., Ciais, P., Lombardozzi, D., Wang, Y., Ryu, Y., Chen, G., Dong, W., Hu, Z., Jain, A. K., Jiang, C., Kato, E., Li, S., Lienert, S., Liu, S., Nabel, J. E. M. S., Qin, Z., Quine, T., Sitch, S., Smith, W. K., Wang, F., Wu, C., Xiao, Z., and Yang, S.: Increased atmospheric vapor pressure deficit reduces global vegetation growth, Sci. Adv., 5, eaax1396, https://doi.org/10.1126/sciadv.aax1396, 2019.
Zhan, Y., Luo, Y., Deng, X., Grieneisen, M. L., Zhang, M., and Di, B.: Spatiotemporal prediction of daily ambient ozone levels across China using random forest for human exposure assessment, Environ. Pollut., 233, 464–473, https://doi.org/10.1016/j.envpol.2017.10.029, 2018.
Zhang, Q., Ficklin, D. L., Manzoni, S., Wang, L., Way, D., Phillips, R. P., and Novick, K. A.: Response of ecosystem intrinsic water use efficiency and gross primary productivity to rising vapor pressure deficit, Environ. Res. Lett., 14, 074023, https://doi.org/10.1088/1748-9326/ab2603, 2019.
Zhao, C., Liu, B., Piao, S., Wang, X., Lobell, D. B., Huang, Y., Huang, M., Yao, Y., Bassu, S., Ciais, P., Durand, J. L., Elliott, J., Ewert, F., Janssens, I. A., Li, T., Lin, E., Liu, Q., Martre, P., Müller, C., Peng, S., Peñuelas, J., Ruane, A. C., Wallach, D., Wang, T., Wu, D., Liu, Z., Zhu, Y., Zhu, Z., and Asseng, S.: Temperature increase reduces global yields of major crops in four independent estimates, P. Natl. Acad. Sci. USA, 114, 9326–9331, https://doi.org/10.1073/pnas.1701762114, 2017.