the Creative Commons Attribution 4.0 License.
the Creative Commons Attribution 4.0 License.
 | 05 Jan 2024
A comparison of South Pacific Antarctic sea ice and atmospheric circulation reconstructions since 1900
Quentin Dalaiden
Gemma K. O'Connor
The recent changes and record lows in Antarctic sea ice extent illustrate the need for longer estimates beyond the short satellite observation period commencing around 1979. However, Antarctic sea ice extent reconstructions since 1900 based on paleo-records and those generated based on instrumental observations from the Southern Hemisphere midlatitudes are markedly different, especially prior to 1979. Here, these reconstructions are examined with the goal of understanding the relative strengths and limitations of each reconstruction better so that researchers using the various datasets can interpret them appropriately.
Overall, it is found that the different spatial and temporal resolutions of each dataset play a secondary role to the inherent connections each reconstruction has with its implied atmospheric circulation. Five Southern Hemisphere pressure reconstructions spanning the 20th century are thus examined further. There are different variabilities and trends poleward of 60∘ S between proxy-based and station-based 20th century pressure reconstructions, which are connected to the disagreement between the Antarctic sea ice extent reconstructions examined here. Importantly, reconstructions based on only coral records provide the best agreement between the early pressure reconstructions, suggesting that a contributing role of tropical variability is present in the station-based pressure (and therefore sea ice) reconstructions. In contrast, ice-core-only reconstructions provide a local, high-latitude constraint that creates differences between the proxy-based and station-based reconstructions near Antarctica. Our results reveal the greatest consistencies and inconsistencies in available datasets and highlight the need to better understand the relative roles of the tropics versus high latitudes in historical sea ice variability around Antarctica.
- Article
(17436 KB) - Full-text XML
- BibTeX
- EndNote


The climate of Antarctica is very complex and highly variable in space and time, influenced by unique processes over the Southern Ocean, the surrounding sea ice, and the continent itself (Jones et al., 2016; Goyal et al., 2021; Raphael et al., 2016; Holland et al., 2022; Blanchard-Wrigglesworth et al., 2021). Although geographically remote from other continents in the Southern Hemisphere, it is also strongly modulated by large-scale patterns of climate variability, including teleconnections from the tropical oceans, in particular in West Antarctica (Li et al., 2021; Lachlan-Cope and Connolley, 2006; Ding et al., 2011). Some of the more pronounced and unique changes in Antarctic climate include a rapid acceleration and thinning of outlet glaciers in the Amundsen Sea embayment (near West Antarctica) (Rignot et al., 2013, 2019; Bamber et al., 2009; Smith et al., 2020), a strengthening of the atmospheric circulation (in particular in austral summer) since 1980 linked to stratospheric ozone depletion (Polvani et al., 2011; Banerjee et al., 2020), and record low total Antarctic sea ice extent in 2017 (Turner et al., 2017), 2022 (Turner et al., 2022; Wang et al., 2022), and 2023 following multiple decades of slow equatorward growth in the sea ice edge from 1979–2016 (Parkinson, 2019; Hobbs et al., 2016).
While the high degree of interannual variability makes it challenging to fully understand these processes and changes, knowledge of them is also compromised by the comparatively temporally short length of instrumental observations (Jones et al., 2016). The majority of Antarctic meteorological measurements of temperature, pressure, and wind extend back until the International Geophysical Year (1957–1958), giving roughly only 60 years of continuous measurements for much of the continent (although most are not located in the interior of the ice sheet) (Turner et al., 2004, 2020). The observational record for Antarctic sea ice is even shorter – beginning in late 1978 when modern satellites provided continuous measurements of the sea ice concentration surrounding the continent (Meier et al., 2021; Parkinson, 2019).
Given the large year-to-year variability and the short observational records in Antarctica, other approaches must be employed to gain a longer-term context – a necessary step to better understand the potential uniqueness and possible mechanisms for these changes both now and into the future. One common approach is to produce reconstructions of past climate prior to direct observational measurements. For Antarctica, these reconstructions generally come from two main approaches. The first approach relies on paleoclimate records such as proxies from ice cores (typically the water isotopic content or snow accumulation) or ocean sediments to provide estimates of climate back centuries to millennia (Thomas et al., 2017, 2019; Steig et al., 2013; Stenni et al., 2017). These paleoclimate data can be used directly to provide reconstructions of past climate if there is a strong physical relationship between the paleoclimate data and some aspect of observed climate; they can also be assimilated with climate model simulations to provide a more spatially complete reconstruction of climate across Antarctica (Dalaiden et al., 2021a; O'Connor et al., 2021a, 2023a). The second approach is based on instrumental observations in regions away from Antarctica through statistical models connecting the Antarctic climate with the climate across the Southern Hemisphere (Fogt et al., 2016a, b, 2019, 2022a; Fogt and Connolly, 2021). Assuming these relationships are stationary in time (Clark and Fogt, 2019), this approach creates reconstructions throughout the length of other Southern Hemisphere climate observations (most dating back to the early 20th century or before) based on the relationship during the period of their overlap with Antarctic climate observations.
The proxy-based and instrumental-based approaches have different strengths and weaknesses. Paleo-based reconstructions can provide historical changes on longer timescales and in key regions distant from stations; however, they are often limited to annual resolution and are associated with uncertainties in the precise climate signals recorded. Station-based reconstructions can produce sub-annual resolutions with direct observations of climate but are restricted temporally and spatially by station availability. Additionally, paleo-based reconstructions have the advantage of relying on measures of Antarctic climate variability that are located closer to the Southern Ocean, whereas station-based reconstructions largely rely on data from the Southern Hemisphere midlatitude land masses. These differences can lead to different estimates of Antarctic climate in the early 20th century (Fogt et al., 2022b). In particular, one key area of differences suggested in earlier work between these various reconstructions was in the South Pacific and Atlantic Ocean stretching from the Ross Sea east to the Weddell Sea – regions of strong trends from observations (or reanalyses) in sea ice concentration and extent as well as sea level pressure (Fig. 1). Recently, Fogt et al. (2022b) discussed this area as a key region where further analysis is needed of the similarities and differences between the reconstructions to better understand their utility. This paper will therefore extend the preliminary analysis of Fogt et al. (2022b) to analyze differences in (primarily the West Antarctic annual mean) sea ice reconstructions, with a particular focus on the role of the atmospheric circulation.
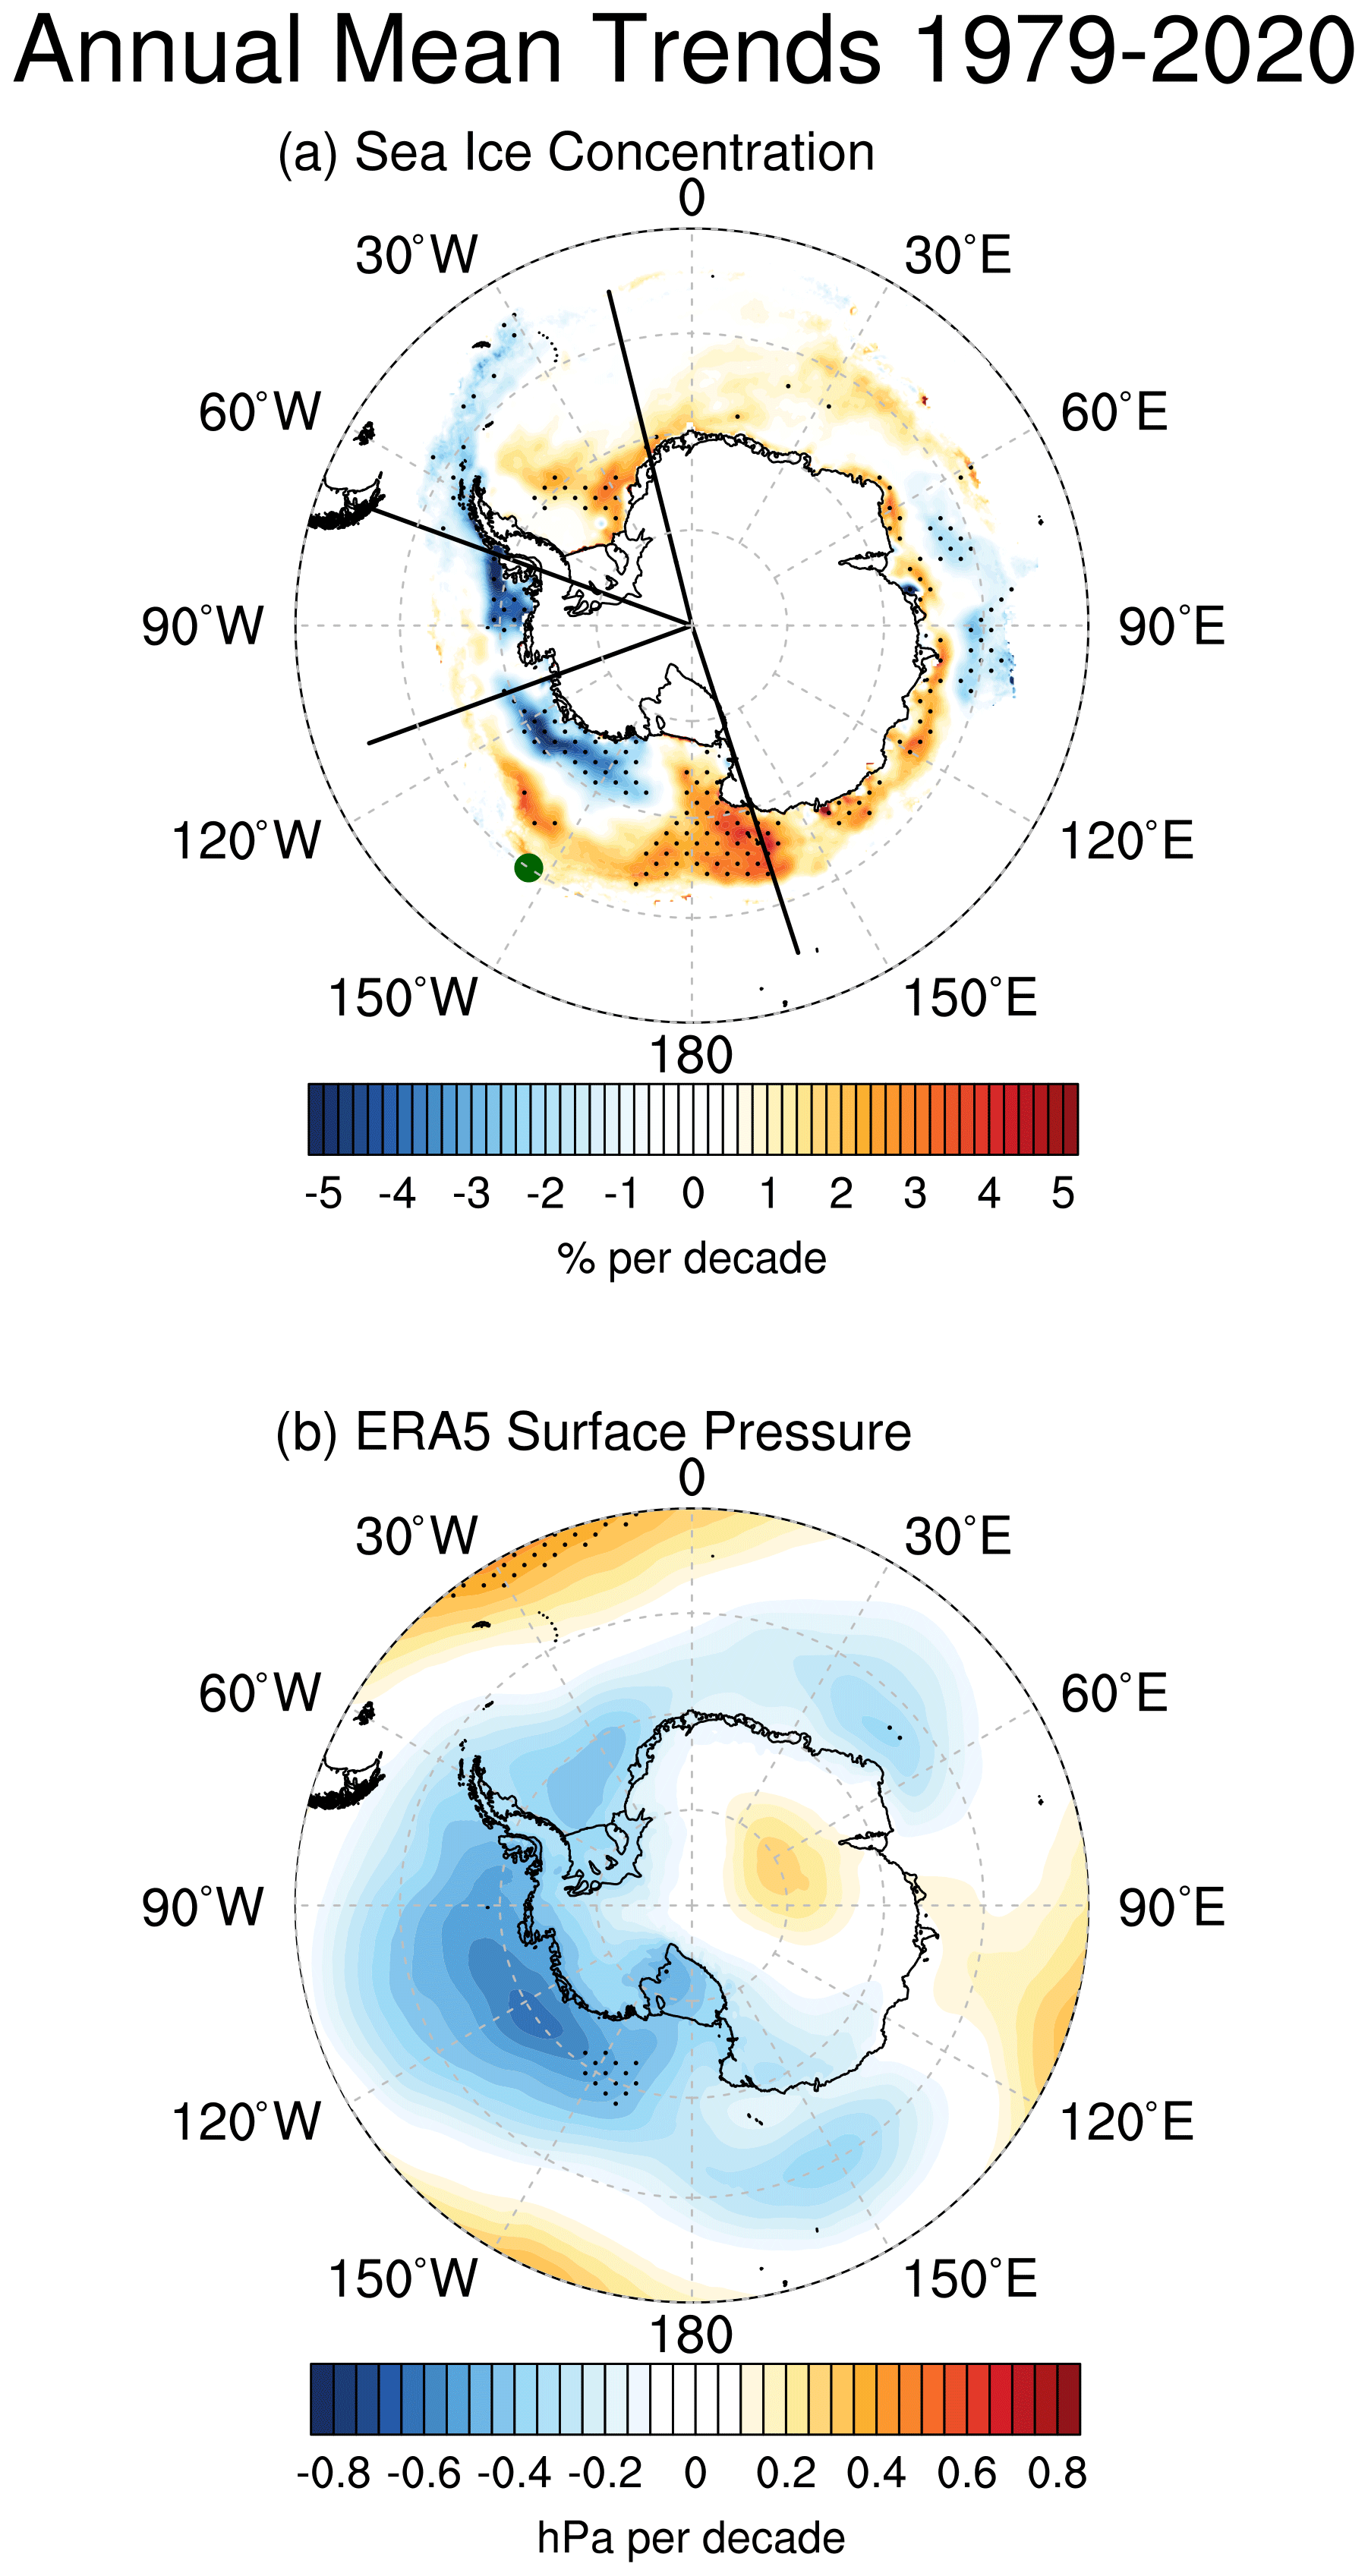
Figure 1(a) Annual mean sea ice concentration trends (% per decade) over 1979–2020. The solid black lines denote the sea ice sector boundaries (Raphael and Hobbs, 2014). The dark green dot marks the location of the ice edge approximated by the Thomas and Abram (2016) reconstruction. (b) Annual mean ERA5 surface pressure trends (hPa per decade). In both plots, trends statistically different from zero at p<0.05 are stippled.
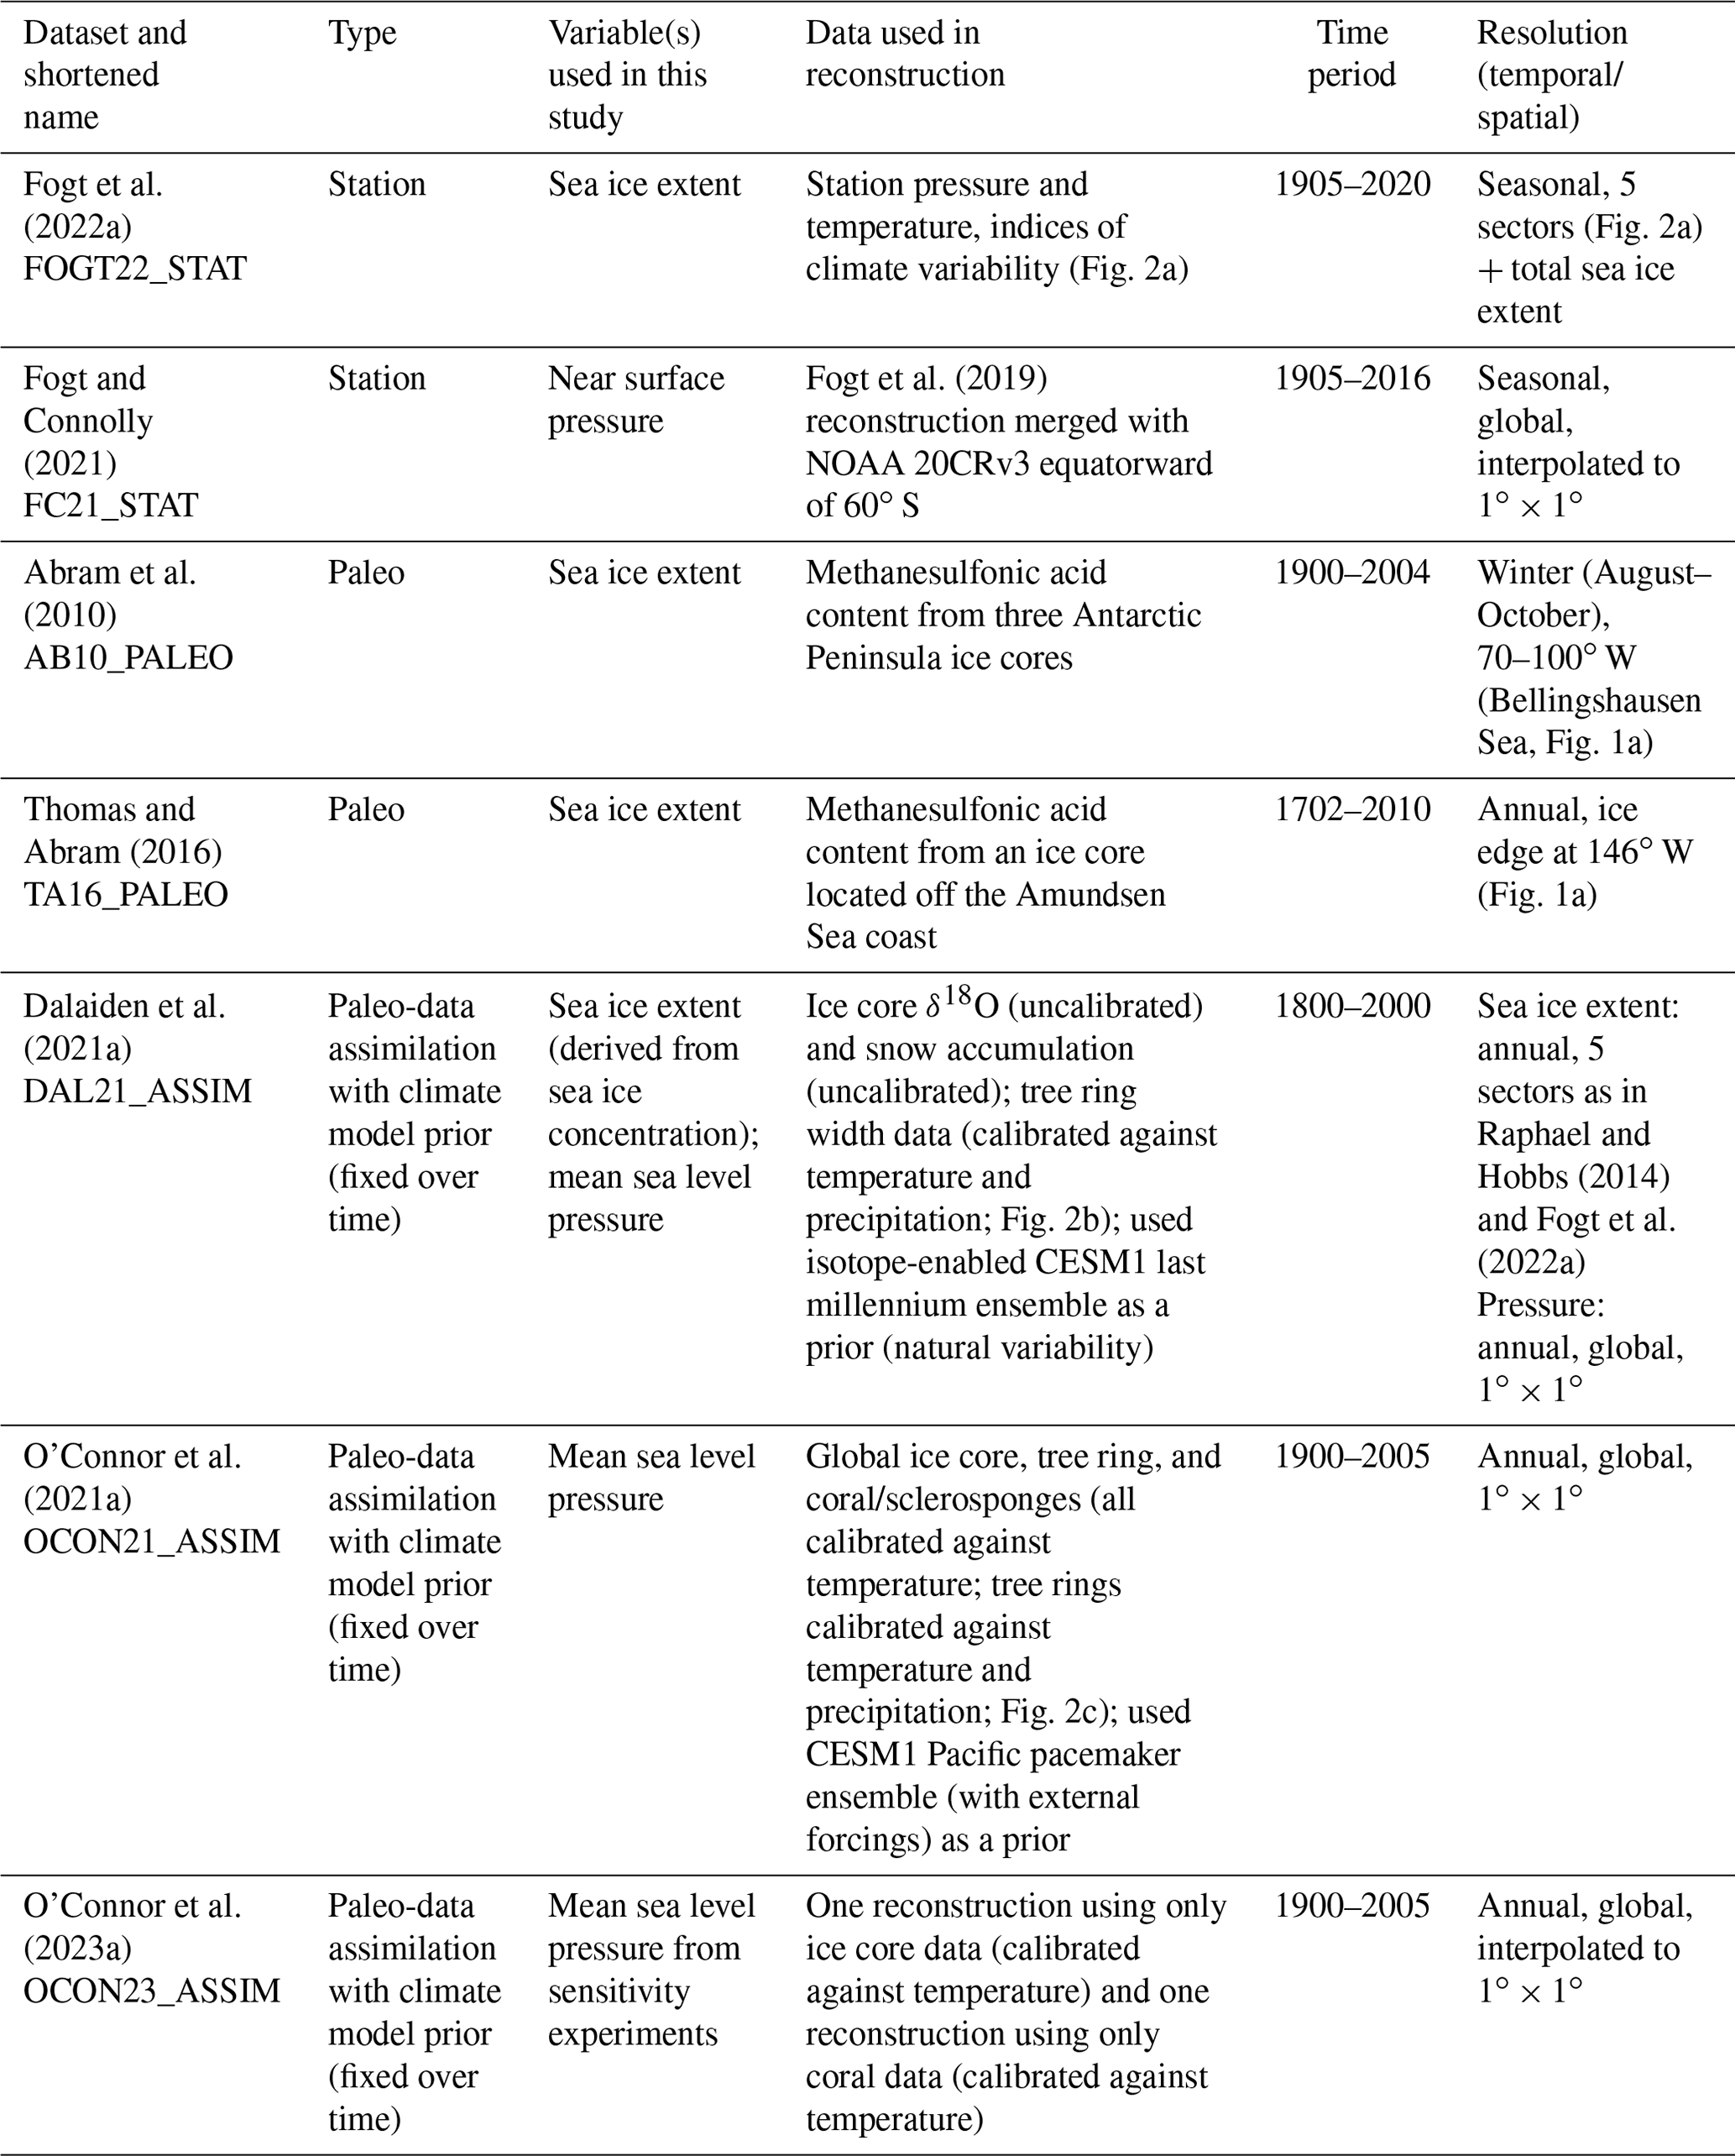
For station-based reconstructions, we use the Fogt et al. (2022a) seasonal sea ice extent reconstructions and the Fogt and Connolly (2021) merged pressure reconstructions. We also investigate three proxy-based reconstructions for sea ice extent and two proxy-based reconstructions for atmospheric pressure. Table 1 provides further information on the reconstructions compared in this paper, while Fig. 2 shows the locations of data used in three separate reconstructions.
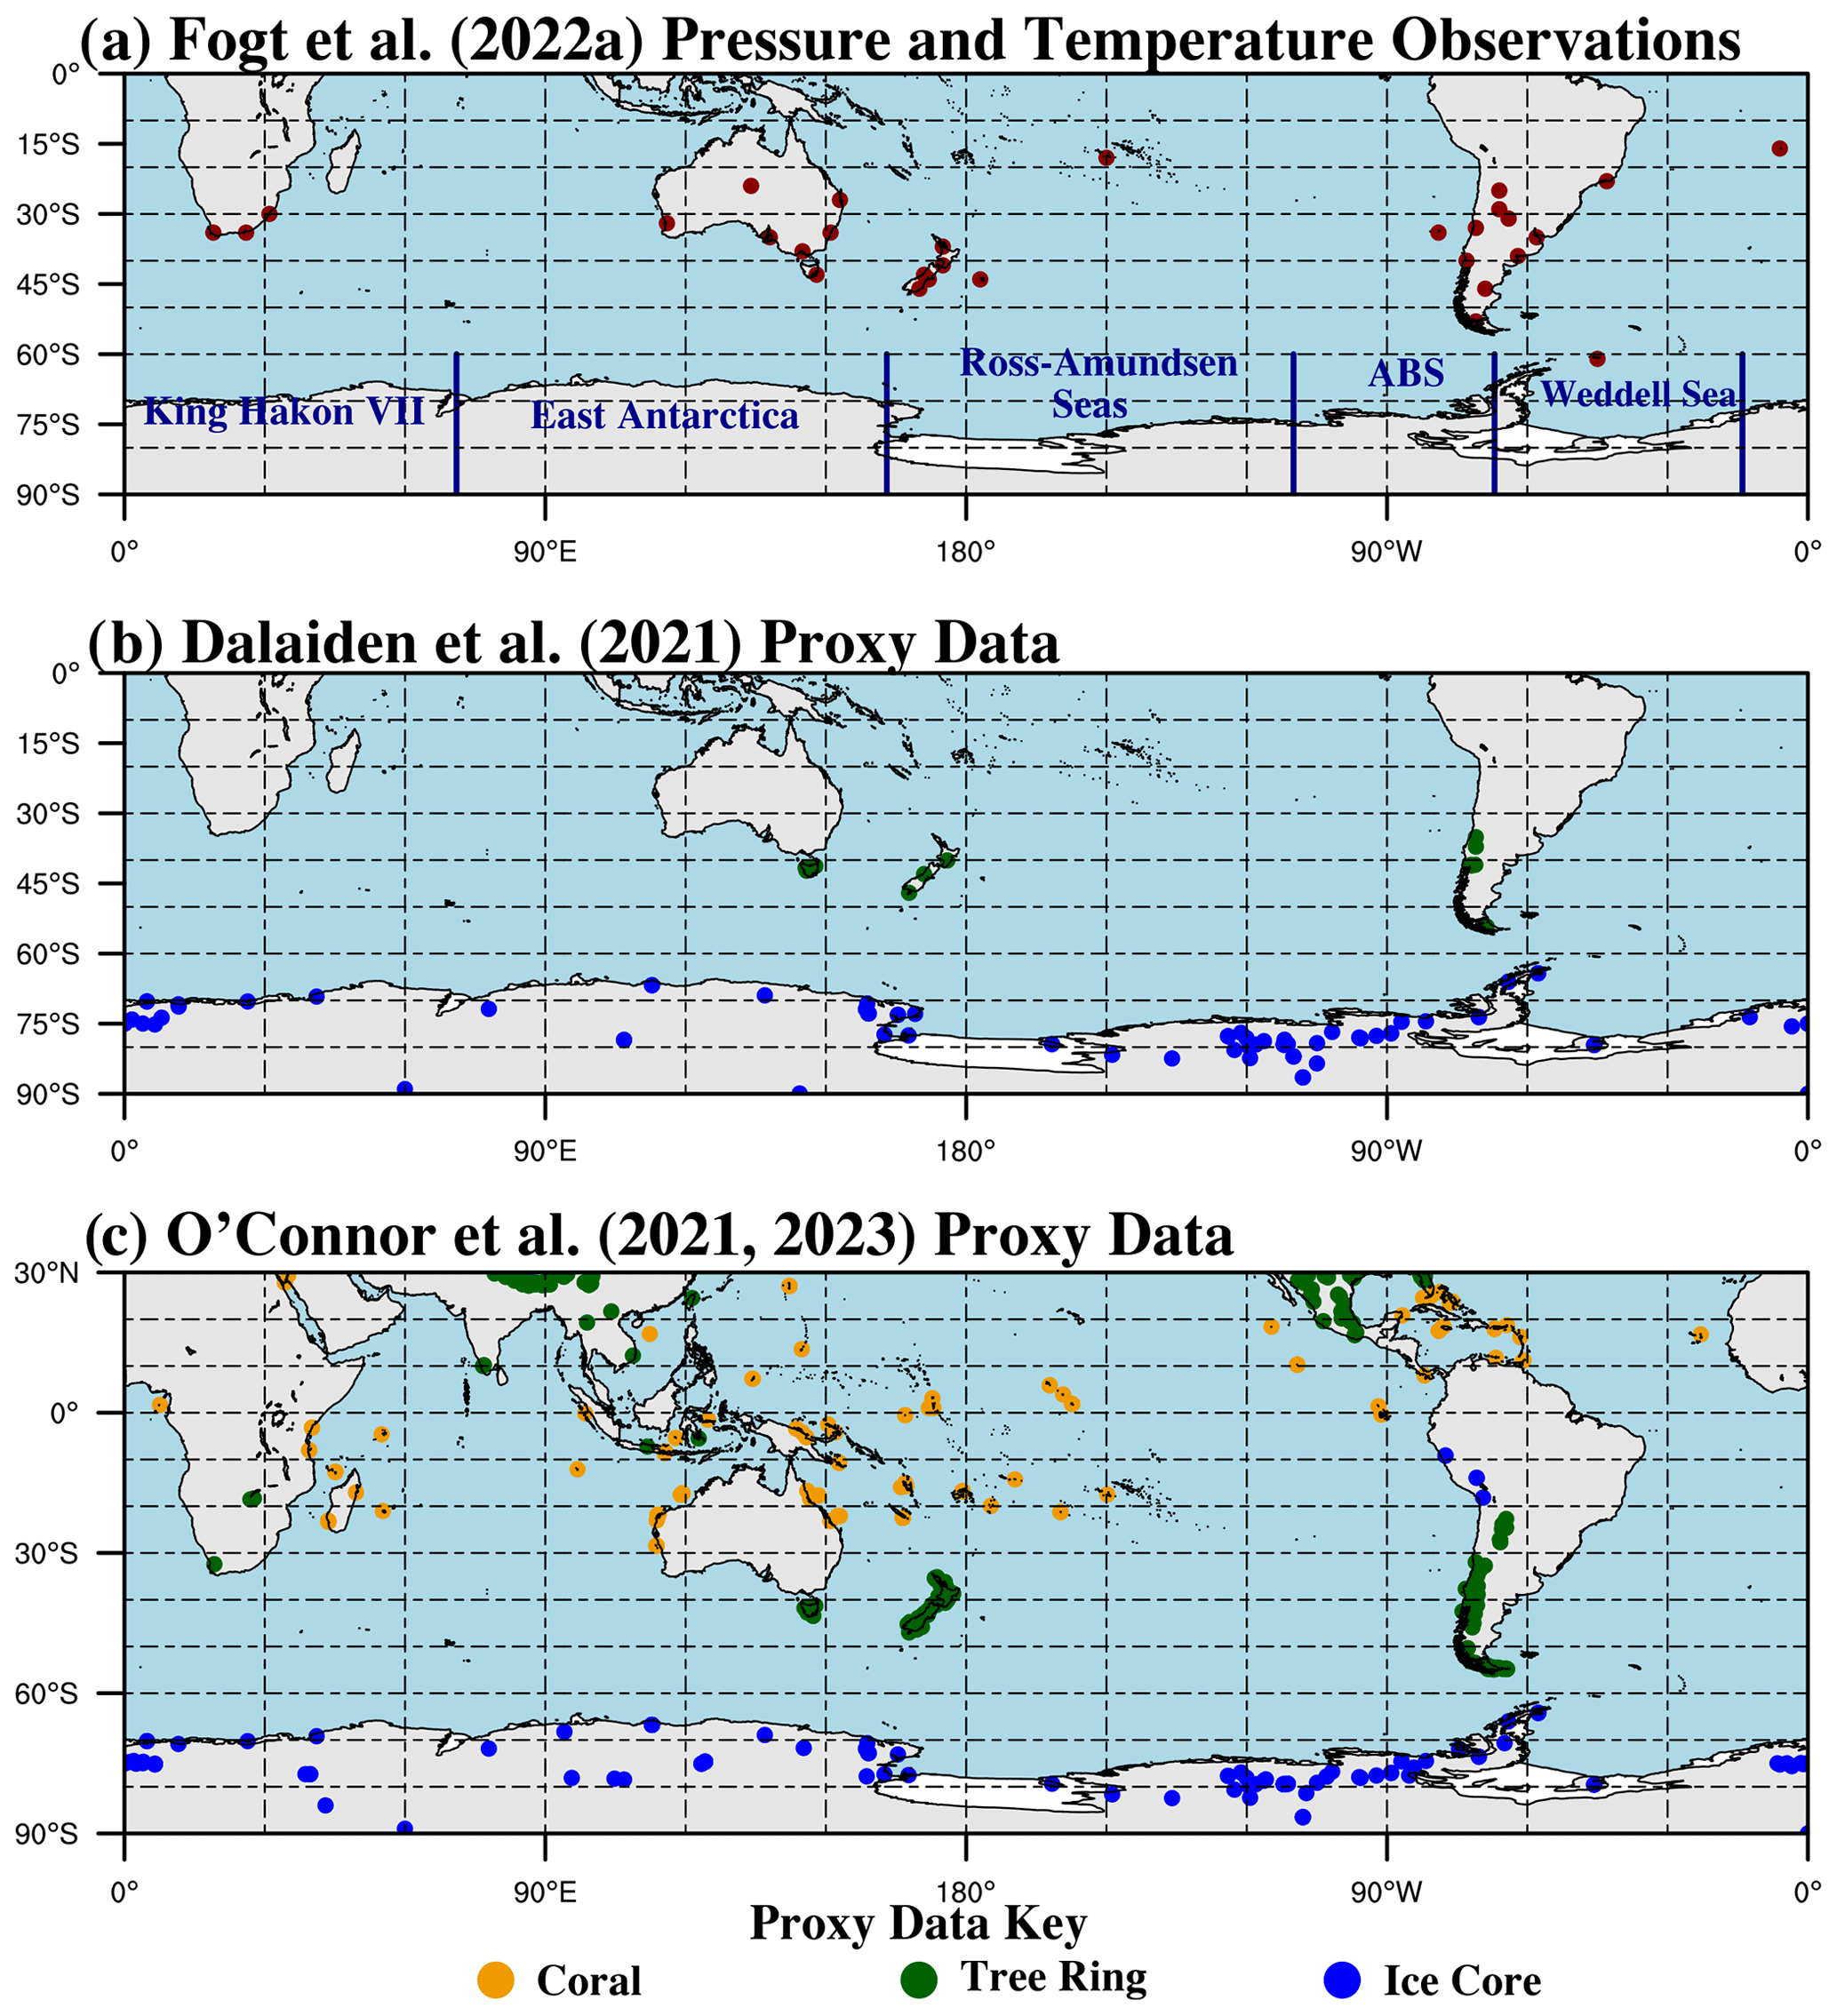
Figure 2Map of (a) temperature and pressure observations used in the Fogt et al. (2022a) seasonal sea ice reconstructions (the same pressure stations were used in the Fogt et al., 2019, and Fogt and Connolly, 2021, pressure reconstruction). (b) Proxy data locations used in the Dalaiden et al. (2021a) pressure and sea ice reconstructions. (c) Proxy data locations used in the O'Connor et al. (2021a, 2023a) pressure reconstructions. The Fogt et al. (2022a) seasonal sea ice reconstructions used only a subset of the available observations and also indices of atmospheric and oceanic variability in their reconstructions, depending on the sea ice sector being reconstructed (Table 1), as depicted in (a) (ABS: Amundsen–Bellingshausen Sea). For (b), the ice core locations are a combination of the δ18O and the surface accumulation measurements. For (c), the coral proxies also include sclerosponges. Although the O'Connor et al. (2021a, 2023a) assimilated proxy data span the entire globe, only the data south of 30∘ N are shown as these have the strongest influence on the reconstruction near Antarctica.
Table 1Details of the various reconstruction datasets used in this study.
2.1 Station and sea ice observations
Monthly mean atmospheric pressure and temperature observations across the Southern Hemisphere used in the Fogt et al. (2019) pressure and Fogt et al. (2022a) sea ice reconstruction (Fig. 2a) are primarily obtained from the University Corporation for Atmospheric Research (UCAR) Research Data Archive dataset ds570.0 (https://rda.ucar.edu/datasets/ds570.0/, last access: 4 December 2023). A few stations from this dataset have been patched and merged with nearby stations to provide the most complete and continuous observational record, following Fogt et al. (2022a). Some other station data have been corrected independently, as discussed in Fogt et al. (2022a).
A few Antarctic pressure observations (Turner et al., 2004) are used to evaluate the pressure variability throughout the 20th century. We combine the Byrd station data (year-round, 1957–1970) with automatic weather station (AWS) data to provide the longest possible estimate in West Antarctica. The combination of the Byrd temperature record has been completed and analyzed in detail in earlier work (Bromwich et al., 2013), but the implications of the merged pressure record have not yet been investigated. Similarly, we use the longest Antarctic Peninsula station (Faraday–Vernadsky, 1947–present) to represent conditions there. In the southern Weddell Sea sector, we merge the pressure observations from the various locations of Halley station (1957–present), as these are less influenced than temperature measurements at each site that shows discontinuities (King et al., 2021). None of these stations are included as predictor data in the Fogt et al. (2016a, b, 2017, 2019) pressure reconstructions. For the longest possible estimate, we also use observations from Orcadas stating in 1903 (Zazulie et al., 2010) – the observations from this station were directly included in the Fogt et al. (2019) spatial pressure reconstruction.
We also make use of the South Orkney fast ice duration time series from Murphy et al. (1995, 2014) as a long-term observationally based estimate of historical sea ice conditions in the Weddell Sea. This dataset was not used in any of the sea ice reconstructions evaluated here, so it serves as an independent dataset to compare historical sea ice variations in the Weddell Sea.
Observed sea ice concentration, from which sea ice extent (SIE) is calculated, is obtained from the Nimbus-7 Scanning Multichannel Microwave Radiometer (SMMR) and Defense Meteorological Satellite Program (DMSP) Special Sensor Microwave Imager – Special Sensor Microwave Imager/Sounder (SSM/I-SSMIS). We specifically use the Climate Data Record (CDR) daily concentration fields from the National Oceanic and Atmospheric Administration/National Snow and Ice Data Center (NOAA/NSIDC) Climate Data Record of Passive Microwave Sea Ice Concentration Version 4 (https://nsidc.org/data/g02202, last access: 16 November 2023) (Meier et al., 2021). The CDR algorithm output combines ice concentration estimates from the National Aeronautics and Space Administration (NASA) Team algorithm and the NASA Bootstrap algorithm, which are available on a 25 km × 25 km polar stereographic grid. Sea ice extent is calculated as the cumulative area of grid cells with at least 15 % sea ice concentration; monthly, seasonal, and annual means are calculated from the daily sea ice concentration data. Patching of a short temporal discontinuity of the sea ice observations between December 1987 and January 1988 was done as in Fogt et al. (2022a). Longitude bounds for the sea ice sectors used in this study follow Raphael and Hobbs (2014), specifically defined as the Amundsen–Bellingshausen Sea (250–290∘ E), Weddell Sea (290–346∘ E), and Ross–Amundsen Sea (162–250∘ E); see Figs. 1 and 2a for boundaries.
2.2 Station-based reconstructions
We use the best-fit reconstruction from the Fogt et al. (2022a) seasonal sea ice extent reconstructions (hereafter FOGT22_STAT), conducted separately for the Raphael and Hobbs (2014) sectors as well as for the total extent as the station-based sea ice extent reconstruction. To get the annual mean, the four seasons were averaged together each year.
The seasonal spatially complete pressure reconstructions of Fogt et al. (2019) span the region poleward of 60∘ S at 100 km resolution and are a kriging interpolation of individual Antarctic station reconstructions from Fogt et al. (2016a, b). The Fogt et al. (2019) seasonal Antarctic pressure reconstruction has been merged with the National Oceanic and Atmospheric Administration (NOAA) 20th century reanalysis version 3 data (Slivinski et al., 2019) equatorward of 60∘ S, as discussed in Fogt and Connolly (2021) (hereafter FC21_STAT), which we use for comparison in this study. We similarly average the F21_STAT over the four seasons to calculate the annual mean for comparison.
2.3 Paleo-based reconstructions
While there are a few ocean-sediment-derived sea ice extent reconstructions near the Antarctic Peninsula relevant to this study, Thomas et al. (2019) note that the poorer temporal resolution and lack of calibration of most marine sediments create challenges when combining and comparing them to ice-core-derived sea ice reconstructions. We therefore employ two main ice-core-based reconstructions of sea ice extent, as in Fogt et al. (2022b). Abram et al. (2010), which ends in 2004 (Table 1), used three ice cores from the Antarctic Peninsula to reconstruct the winter sea ice extent from 70–100∘ W in the Bellingshausen Sea (outlined in Fig. 1a) – hereafter AB10_PALEO. Further west, Thomas and Abram (2016) provide a reconstruction (hereafter TA16_PALEO) with annual resolution of the sea ice extent in the Ross Sea (marked in Fig. 1a). Both AB10_PALEO and TA16_PALEO reconstructed the sea ice extent based on the methanesulfonic acid (MSA) content – an indicator related to the algal blooms occurring during the ice break-up periods – from different Antarctic ice cores by calibrating them against sea ice extent from satellite observations.
2.4 Reconstructions based on paleo-data assimilation
As mentioned earlier, multiple ice core, tree ring, and coral proxy records can be assimilated within Earth system model simulations to provide annual mean gridded estimates of not only sea ice extent and concentration, but also atmospheric pressure. We employ two such estimates of previous Antarctic climate in this study – those of Dalaiden et al. (2021a) and O'Connor et al. (2021a, 2023a; no sea ice reconstruction), which both use proxy measurements but different data assimilation filters and different Earth system model simulations as the data assimilation “prior” (the initial guess that is updated with proxy data) (Table 1). Although no sea ice or atmospheric pressure observations are directly assimilated, the data assimilation relies on the covariance between the climate in the proxy locations and sea ice concentration or sea level pressure based on covariance patterns in the data assimilation prior (Widmann et al., 2010; Goosse et al., 2010; Hakim et al., 2016). The temporal variability thus only comes from proxy records, which are spatially interpolated during data assimilation. Therefore, the final reconstruction is dynamically consistent through all the reconstructed climate variables. For Dalaiden et al. (2021a) (hereafter DAL21_ASSIM), we use the sea ice concentration, extent, and sea level pressure datasets generated using the isotope-enabled Community Earth System Model version 1 (CESM1) last millennium ensemble as the prior (Brady et al., 2019) and based on Southern Hemisphere ice cores and tree rings (Fig. 2b). The sea ice extent from DAL21_ASSIM was calculated using the Raphael and Hobbs (2014) boundaries to compare with FOGT_STAT. We further use the O'Connor et al. (2021a) pressure dataset (hereafter OCON21_ASSIM) generated using the CESM1 tropical Pacific pacemaker ensemble of simulations (Schneider and Deser, 2018) as the data assimilation prior, as this ensemble best represents historical external forcing and Pacific variability relative to other simulations (for more details see O'Connor et al., 2021a). The OCON21_ASSIM dataset includes a global proxy database of ice cores, corals, and tree rings, synthesized by the PAGES2k working group (Fig. 2c) (PAGES2k Consortium et al., 2017), with additional snow accumulation records (Thomas et al., 2017; as in Dalaiden et al., 2021a). It is worth mentioning that the prior used in the DAL21_ASSIM and OCON21_ASSIM reconstructions is fixed over time (i.e., each reconstructed year is based on the same prior), but while the prior used in the OCON21_ASSIM reconstruction includes the anthropogenic forcing, the reconstruction of DAL21_ASSIM solely relies on the natural climate variability as in Hakim et al. (2016) and Steiger et al. (2018). Therefore, since the prior remains constant over time, the temporal variability of the reconstruction only arises from the proxies. The comparison between the DAL21_ASSIM reconstruction and the OCON21_ASSIM reconstruction reveals the roles of different filtering methods, proxy databases, and atmospheric forcings used to form the climate model priors. O'Connor et al. (2023a) (hereafter OCON23_ASSIM) provide additional single-proxy reconstructions using the same configuration as OCON21_ASSIM but based only on the assimilation of ice core or coral records. The comparison between these sensitivity experiments with OCON21_ASSIM allows a better understanding of the possible role of certain proxy data in the resulting reconstruction.
3.1 Comparison of Antarctic sea ice extent reconstructions
As alluded to in the Introduction and Fogt et al. (2022a, b), there are substantial sea ice extent differences between FOGT_STAT reconstructions and those based on paleo-data, including from data-assimilation-based reconstructions. To investigate these differences further, the various time series of standardized (to place on the same scale) annual mean sea ice extent anomalies from the Ross–Amundsen Sea sector east to the Weddell Sea (see Fig. 1 for sector boundaries) are plotted in Fig. 3. Not surprisingly, the correlations with observations (color-coded numbers at the top right of each panel in Fig. 3) are the highest for the FOGT_STAT reconstructions (p<0.01), as these reconstructions were specifically statistically calibrated to provide the best match to the observations. However, the correlations of the paleo-based reconstructions (including the DAL21_ASSIM reconstruction which is not directly calibrated to sea ice observations) are also uniformly positive.
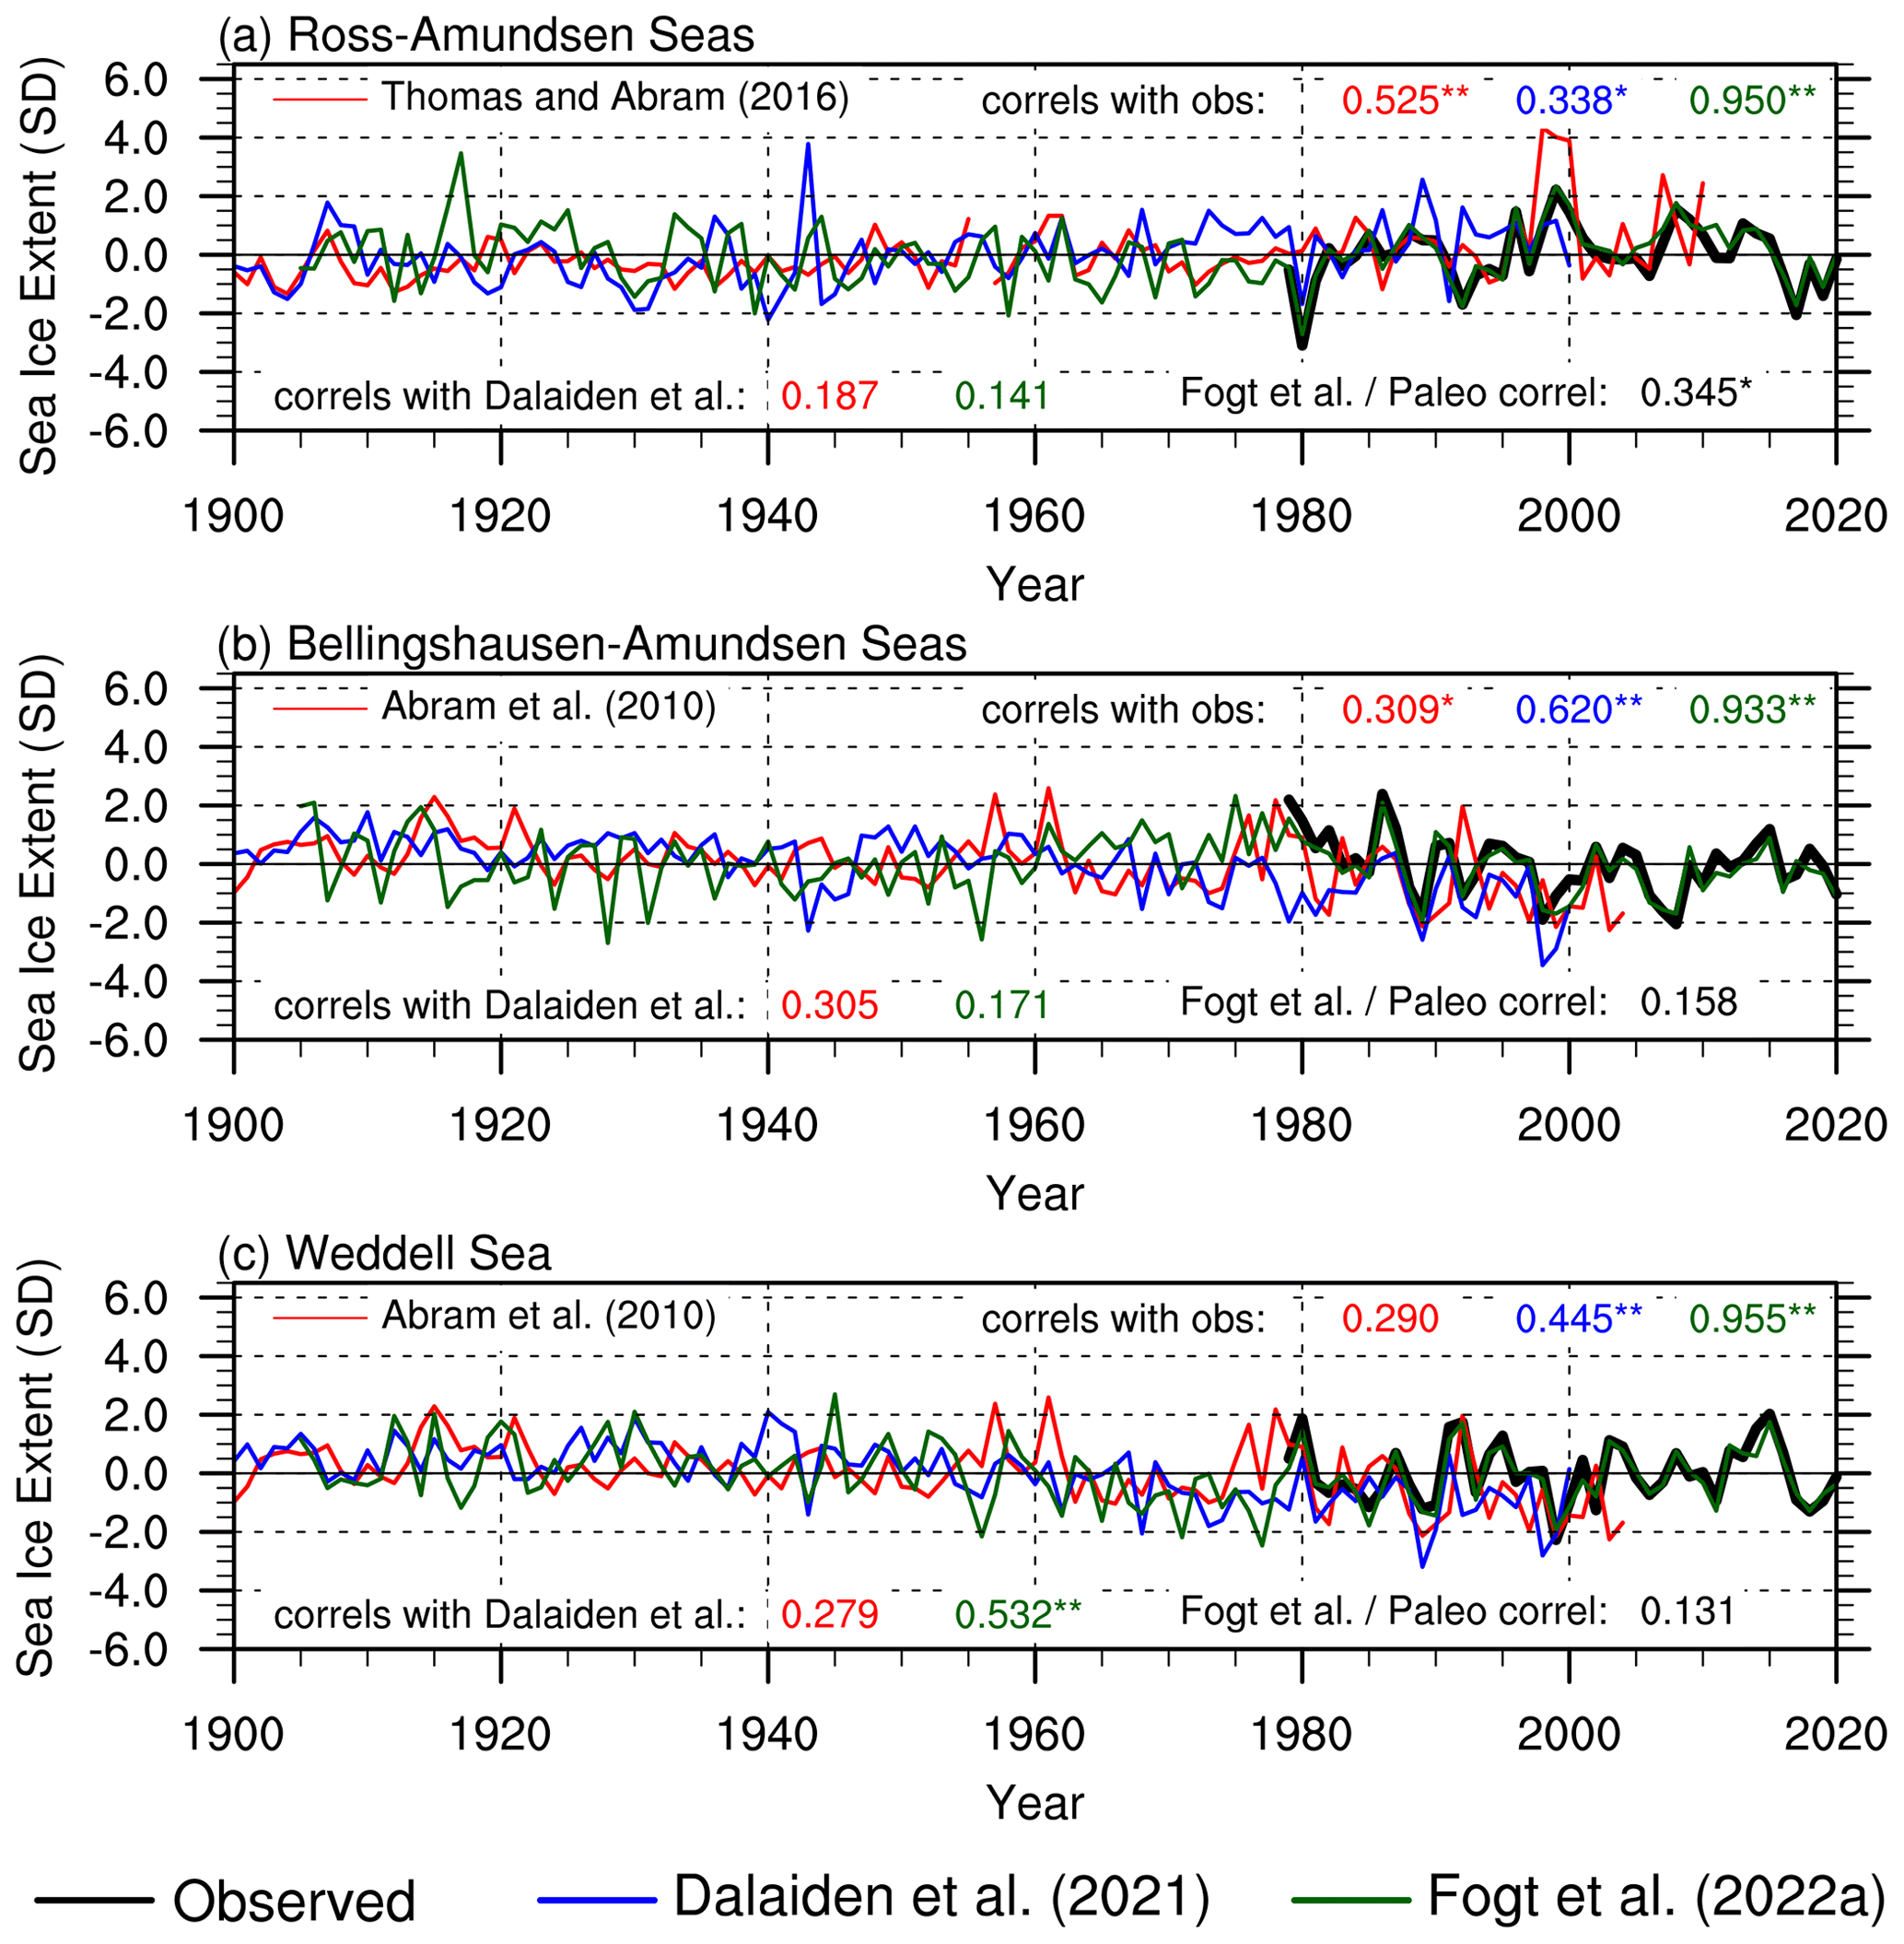
Figure 3Annual mean sea ice extent time series from various reconstructions approximately related to the Raphael and Hobbs (2014) sea ice boundaries in Fig. 1 for the (a) Ross–Amundsen Sea, (b) Bellingshausen–Amundsen Sea, and (c) Weddell Sea; paleo-based reconstructions are given in red and labeled separately for each panel. The correlations with satellite observations (in black) during the period of overlap are given at the top of each panel, with the colors denoting the individual time series as given in the legend. At the bottom, correlations with the Dalaiden et al. (2021a) and Fogt et al. (2022a) reconstructions are similarly provided. In each case, after adjusting the sample size by the lag-1 correlation as needed, correlations significantly different from zero at p<0.05 and p<0.01 are marked with an asterisk (*) and double asterisk (), respectively.
In contrast, the cross-correlations between the various sea ice extent reconstructions (text at the bottom of each panel in Fig. 3) are much weaker overall (numbers at the bottom of each plot), often falling below 0.30 (from 1905–2020, p<0.05). The weak cross-correlations suggest that the interannual variability in the DAL21_ASSIM estimates and those directly from ice cores (both TA16_PALEO and AB10_PALEO) differ substantially. Part of this difference could be from a larger number of ice cores included in the DAL21_ASSIM reconstruction, smoothing out the non-climatic noise (Fig. 2b, Table 1). There is slightly better agreement between the reconstructions in the Weddell Sea, particularly for the FOGT_STAT and DAL21_ASSIM estimates (Fig. 3c, r=0.532, p<0.01).
While it is straightforward to plot the time series together as in Fig. 3, understanding the differences between them, especially prior to 1979, is much more complex, as the various reconstructions were created with markedly distinct and incongruent methods (Table 1) and data (Fig. 2). First, the various temporal resolutions of each reconstruction may result in differences: the FOGT_STAT reconstructions in Fig. 3 are averages of seasonal reconstruction, and even though the paleo-based reconstructions often represent the annual mean, they may be biased slightly to a particular time in the year affected primarily by the accumulation at the ice core site(s) from which the paleo-based reconstructions were generated. To understand if the relationships improve seasonally, Fig. 4 investigates the reconstruction agreement for each sector (by column) and each season (rows).
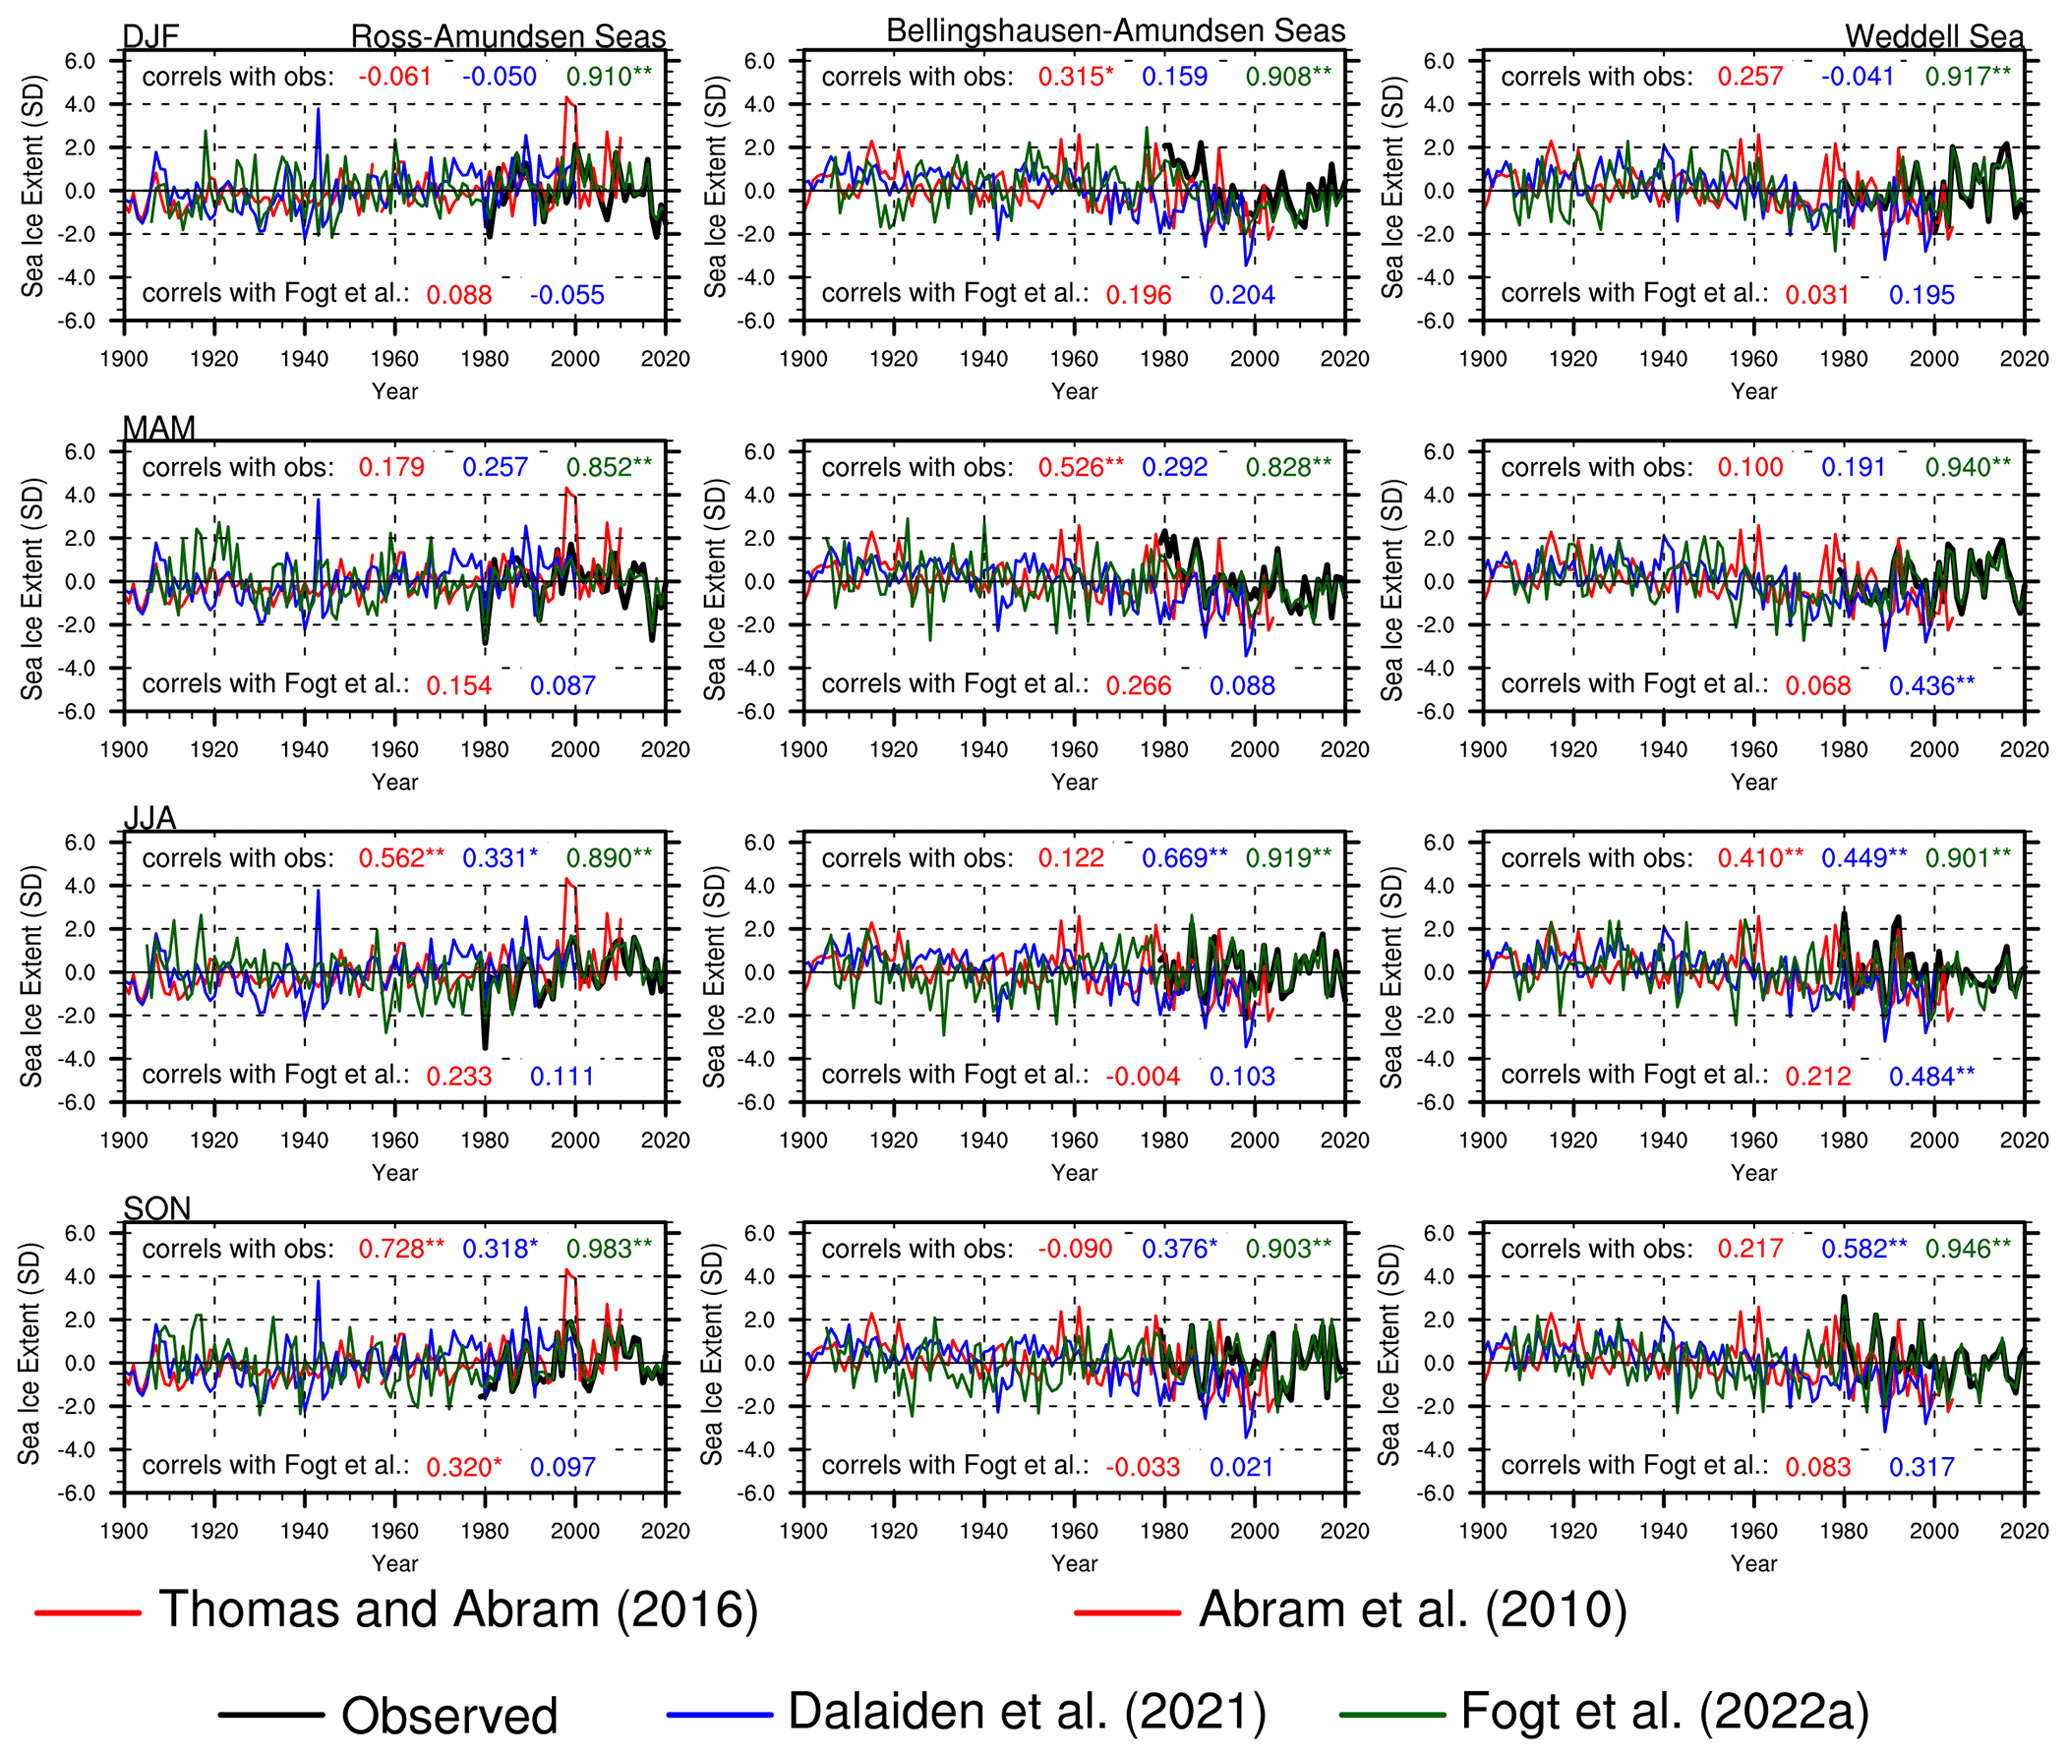
Figure 4As in Fig. 3, but with the seasonal mean observations and reconstructions of Fogt et al. (2022a) with the annual mean paleo-based reconstructions. The Thomas and Abram (2016) paleo-based reconstruction is used for the Ross–Amundsen sector (left column panels), while the Abram et al. (2010) reconstruction is used for the other two sectors (middle and right column panels). The correlations are color-coded following the legend. Correlations with observations are given at the top of each panel, and correlations with seasonally varying Fogt et al. (2022a) reconstructions are given at the bottom of each panel.
In contrast to the annual mean data in Fig. 3, there are frequent negative correlations between the various datasets and the observations (numbers at the top of each panel in Fig. 4) as well as between the paleo-based reconstructions and those from FOGT_STAT (numbers at the bottom of each panel in Fig. 4). For the Ross–Amundsen sector, TA16_PALEO most closely aligns with the austral winter (JJA) and austral spring (SON) seasons, near the seasonal maximum sea ice extent. The seasonal relationships of the AB10_PALEO reconstruction are a bit more nuanced: it has considerably higher correlations in MAM with observations in the Bellingshausen–Amundsen sector (r=0.526, p<0.01) but the weakest correlations in this season in the Weddell sector (r=0.10, p>0.05).
For the DAL21_ASSIM reconstruction, the relationships with observations are weakest in austral summer (Fig. 4, top row) for all sectors and generally the highest during the second half of the year (Fig. 4, bottom two rows). Similarly, the correlations between the FOGT_STAT reconstruction and DAL21_ASSIM are typically highest in JJA.
While the comparisons in Fig. 4 reveal that the agreement between the various reconstructions is not uniform throughout the year, the various spatial footprints of the reconstructions can also create differences between the reconstructions. In particular, while ice-core-based reconstructions can provide information directly over the continent on longer timescales, their connections to Antarctic climate are geographically limited (Table 1), restricted to the prominent pathway of tracers from the ocean–ice boundary near the ice edge to their deposition at the ice core site (Thomas et al., 2019). In contrast, both the FOGT_STAT and DAL21_ASSIM reconstructions represent the cumulative sea ice area > 15 % in specific geographic boundaries (Figs. 1a and 2a). To investigate the role the various spatial configurations may play in the differences between the reconstructions, each annual mean reconstruction was correlated through time with the full spatial field of annual mean sea ice concentration satellite observations (at each grid point separately); these correlations are plotted in Fig. 5, with correlations statistically different from zero at p<0.05 stippled. In Fig. 5, the correlation of the observed sea ice extent series for each sector with the satellite sea ice concentration field is provided in the far left column for comparison of the maximum expected correlation pattern and magnitude.
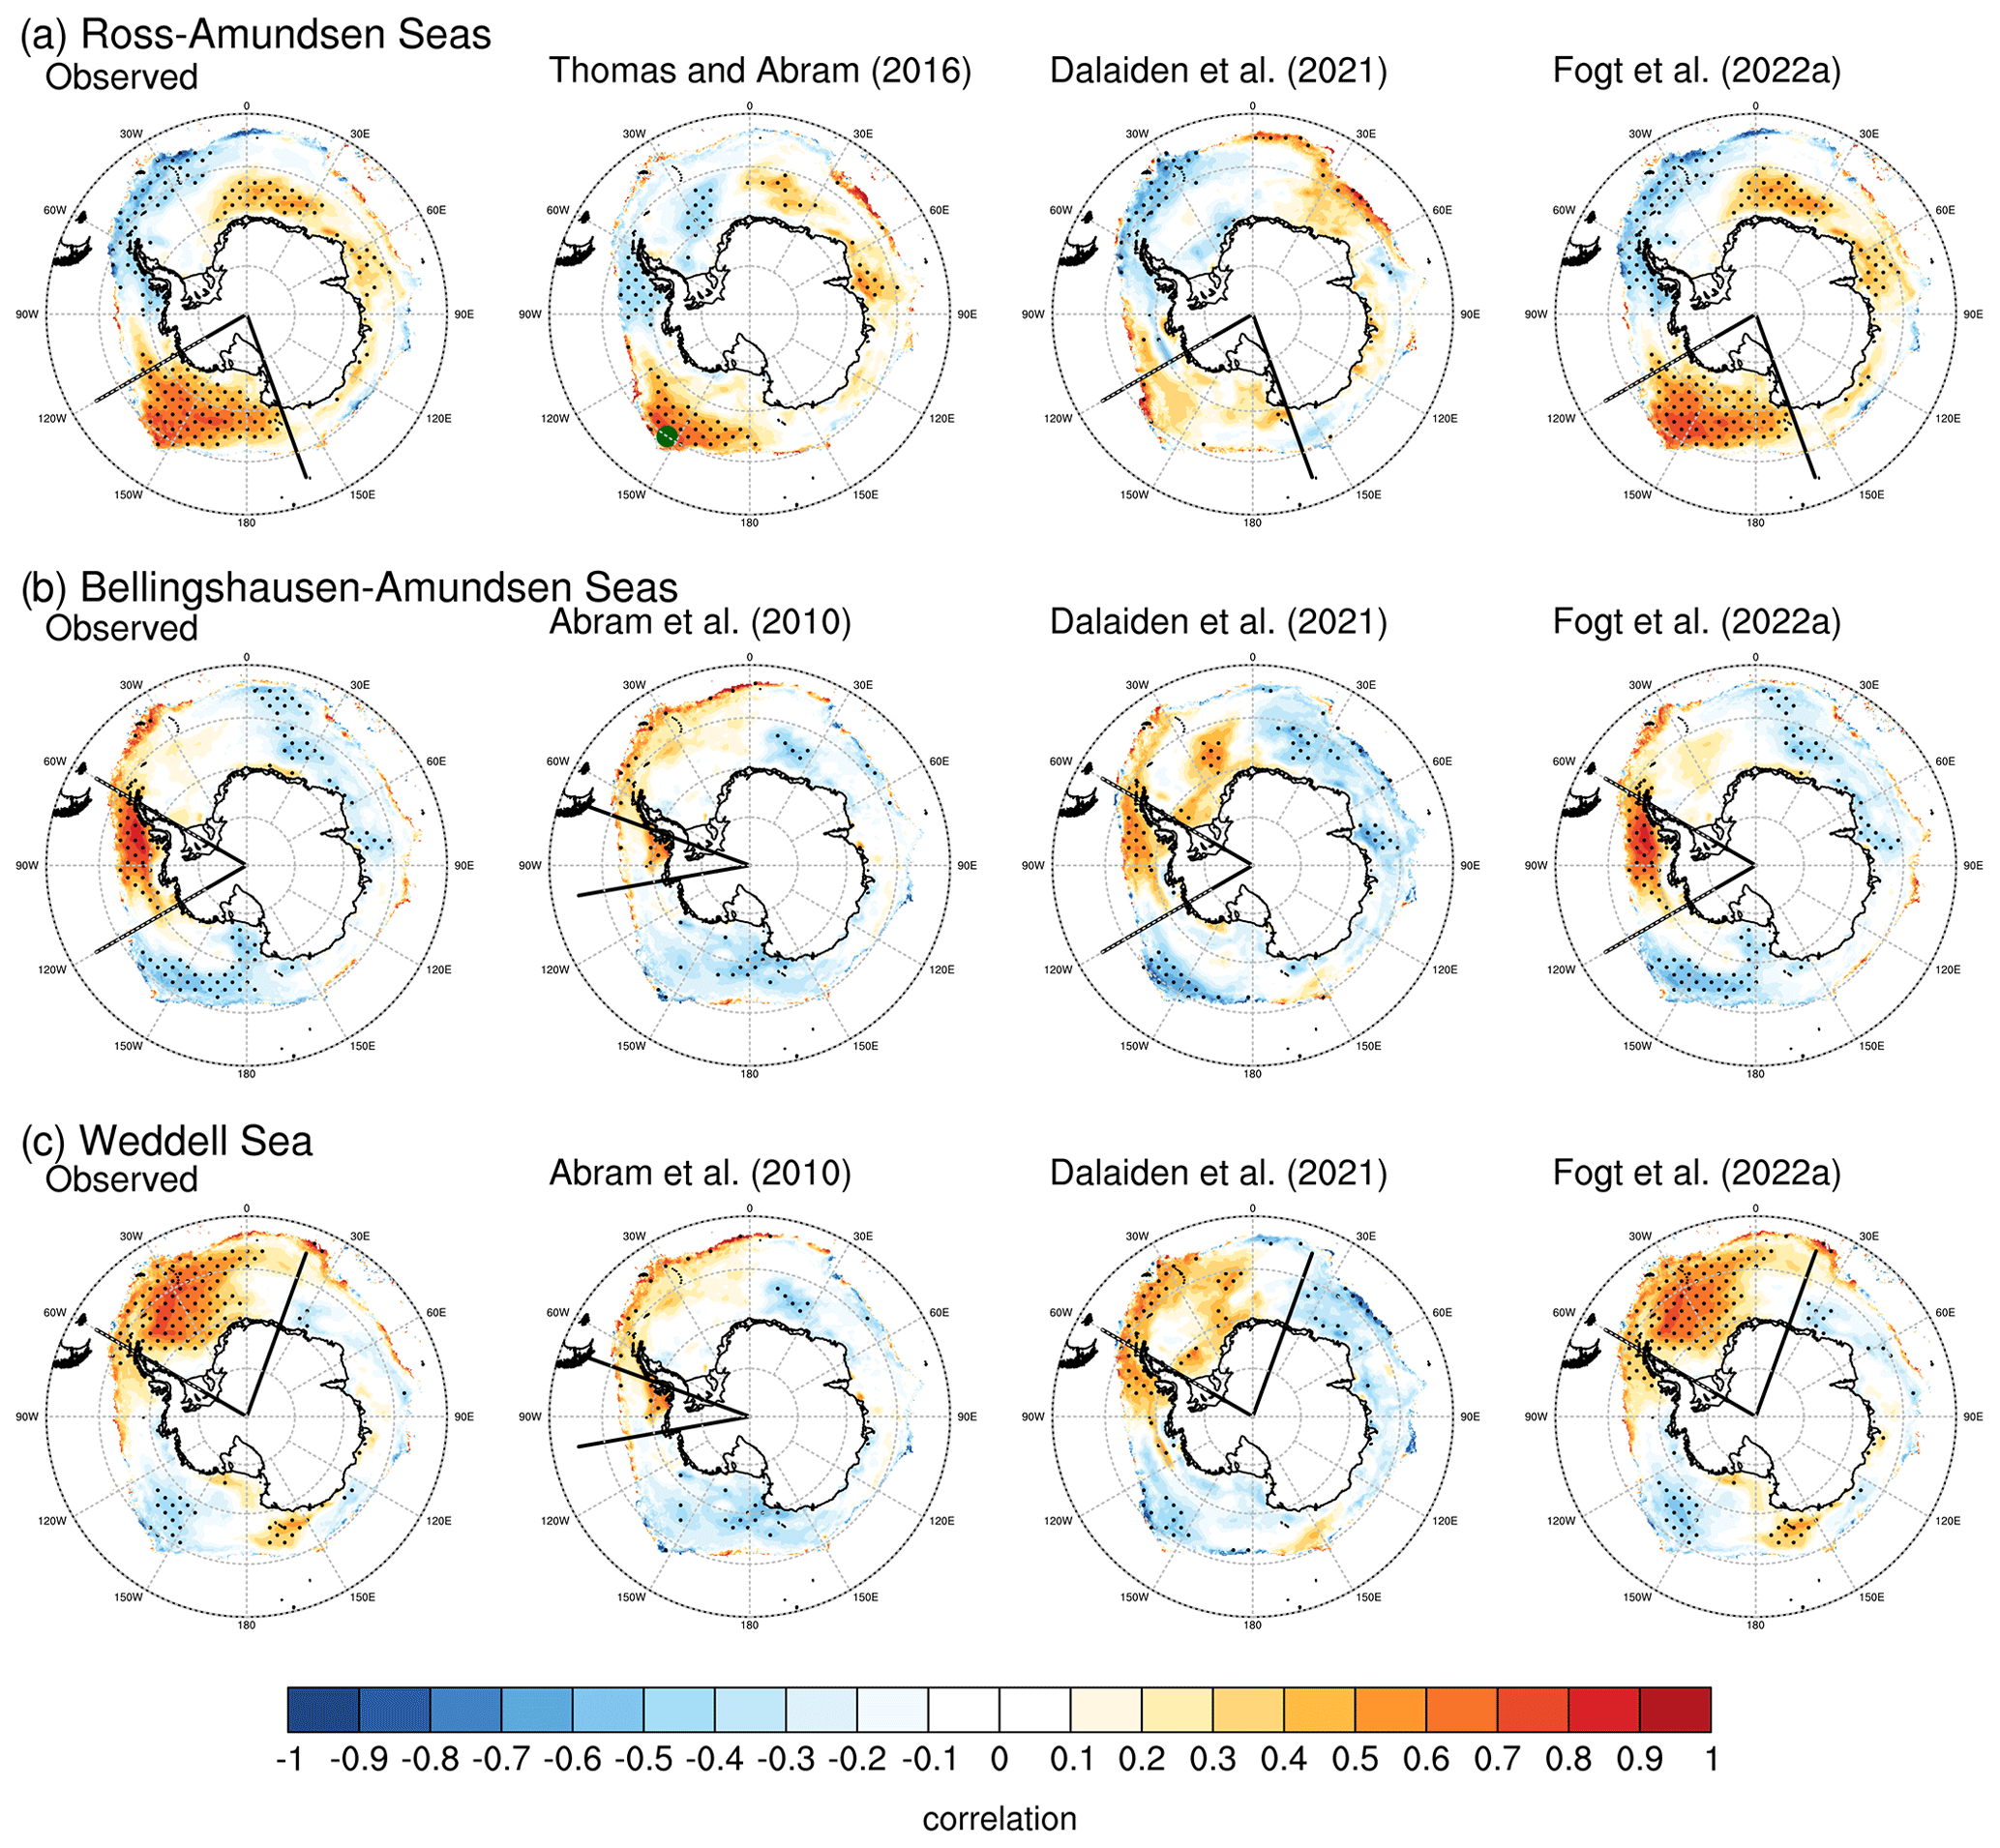
Figure 5Correlations (1979 to the end of series) of annual mean sea ice extent time series with the observed annual mean sea ice concentration field, separated by the Raphael and Hobbs (2014) sectors, as in Fig. 3. The solid lines (or markers for Thomas and Abram, 2016) represent the longitudinal boundaries of the observations or reconstructions for each sector (Table 1). In each row, correlations of the observed sea ice extent time series with the sea ice concentration are given for reference. (a) Ross–Amundsen Sea, (b) Bellingshausen–Amundsen Sea, (c) Weddell Sea.
In the Ross–Amundsen sector (Fig. 5, top row), the TA16_PALEO and FOGT_STAT reconstructions represent the observed pattern well, although as expected the region of positive correlations with the TA16_PALEO is smaller and confined closer to the ice edge – their reconstruction is an estimate of the ice edge at a point in the Ross Sea (Fig. 1, Table 1). While the DAL21_ASSIM spatial correlation field is notably weaker, it is important to remember that unlike the other sea ice extent estimates examined here, this reconstruction was not calibrated to sea ice observations. Nonetheless, it still maintains a similar spatial pattern of positive and negative correlations to the other datasets, suggesting that its geographic representation is broadly similar to other datasets.
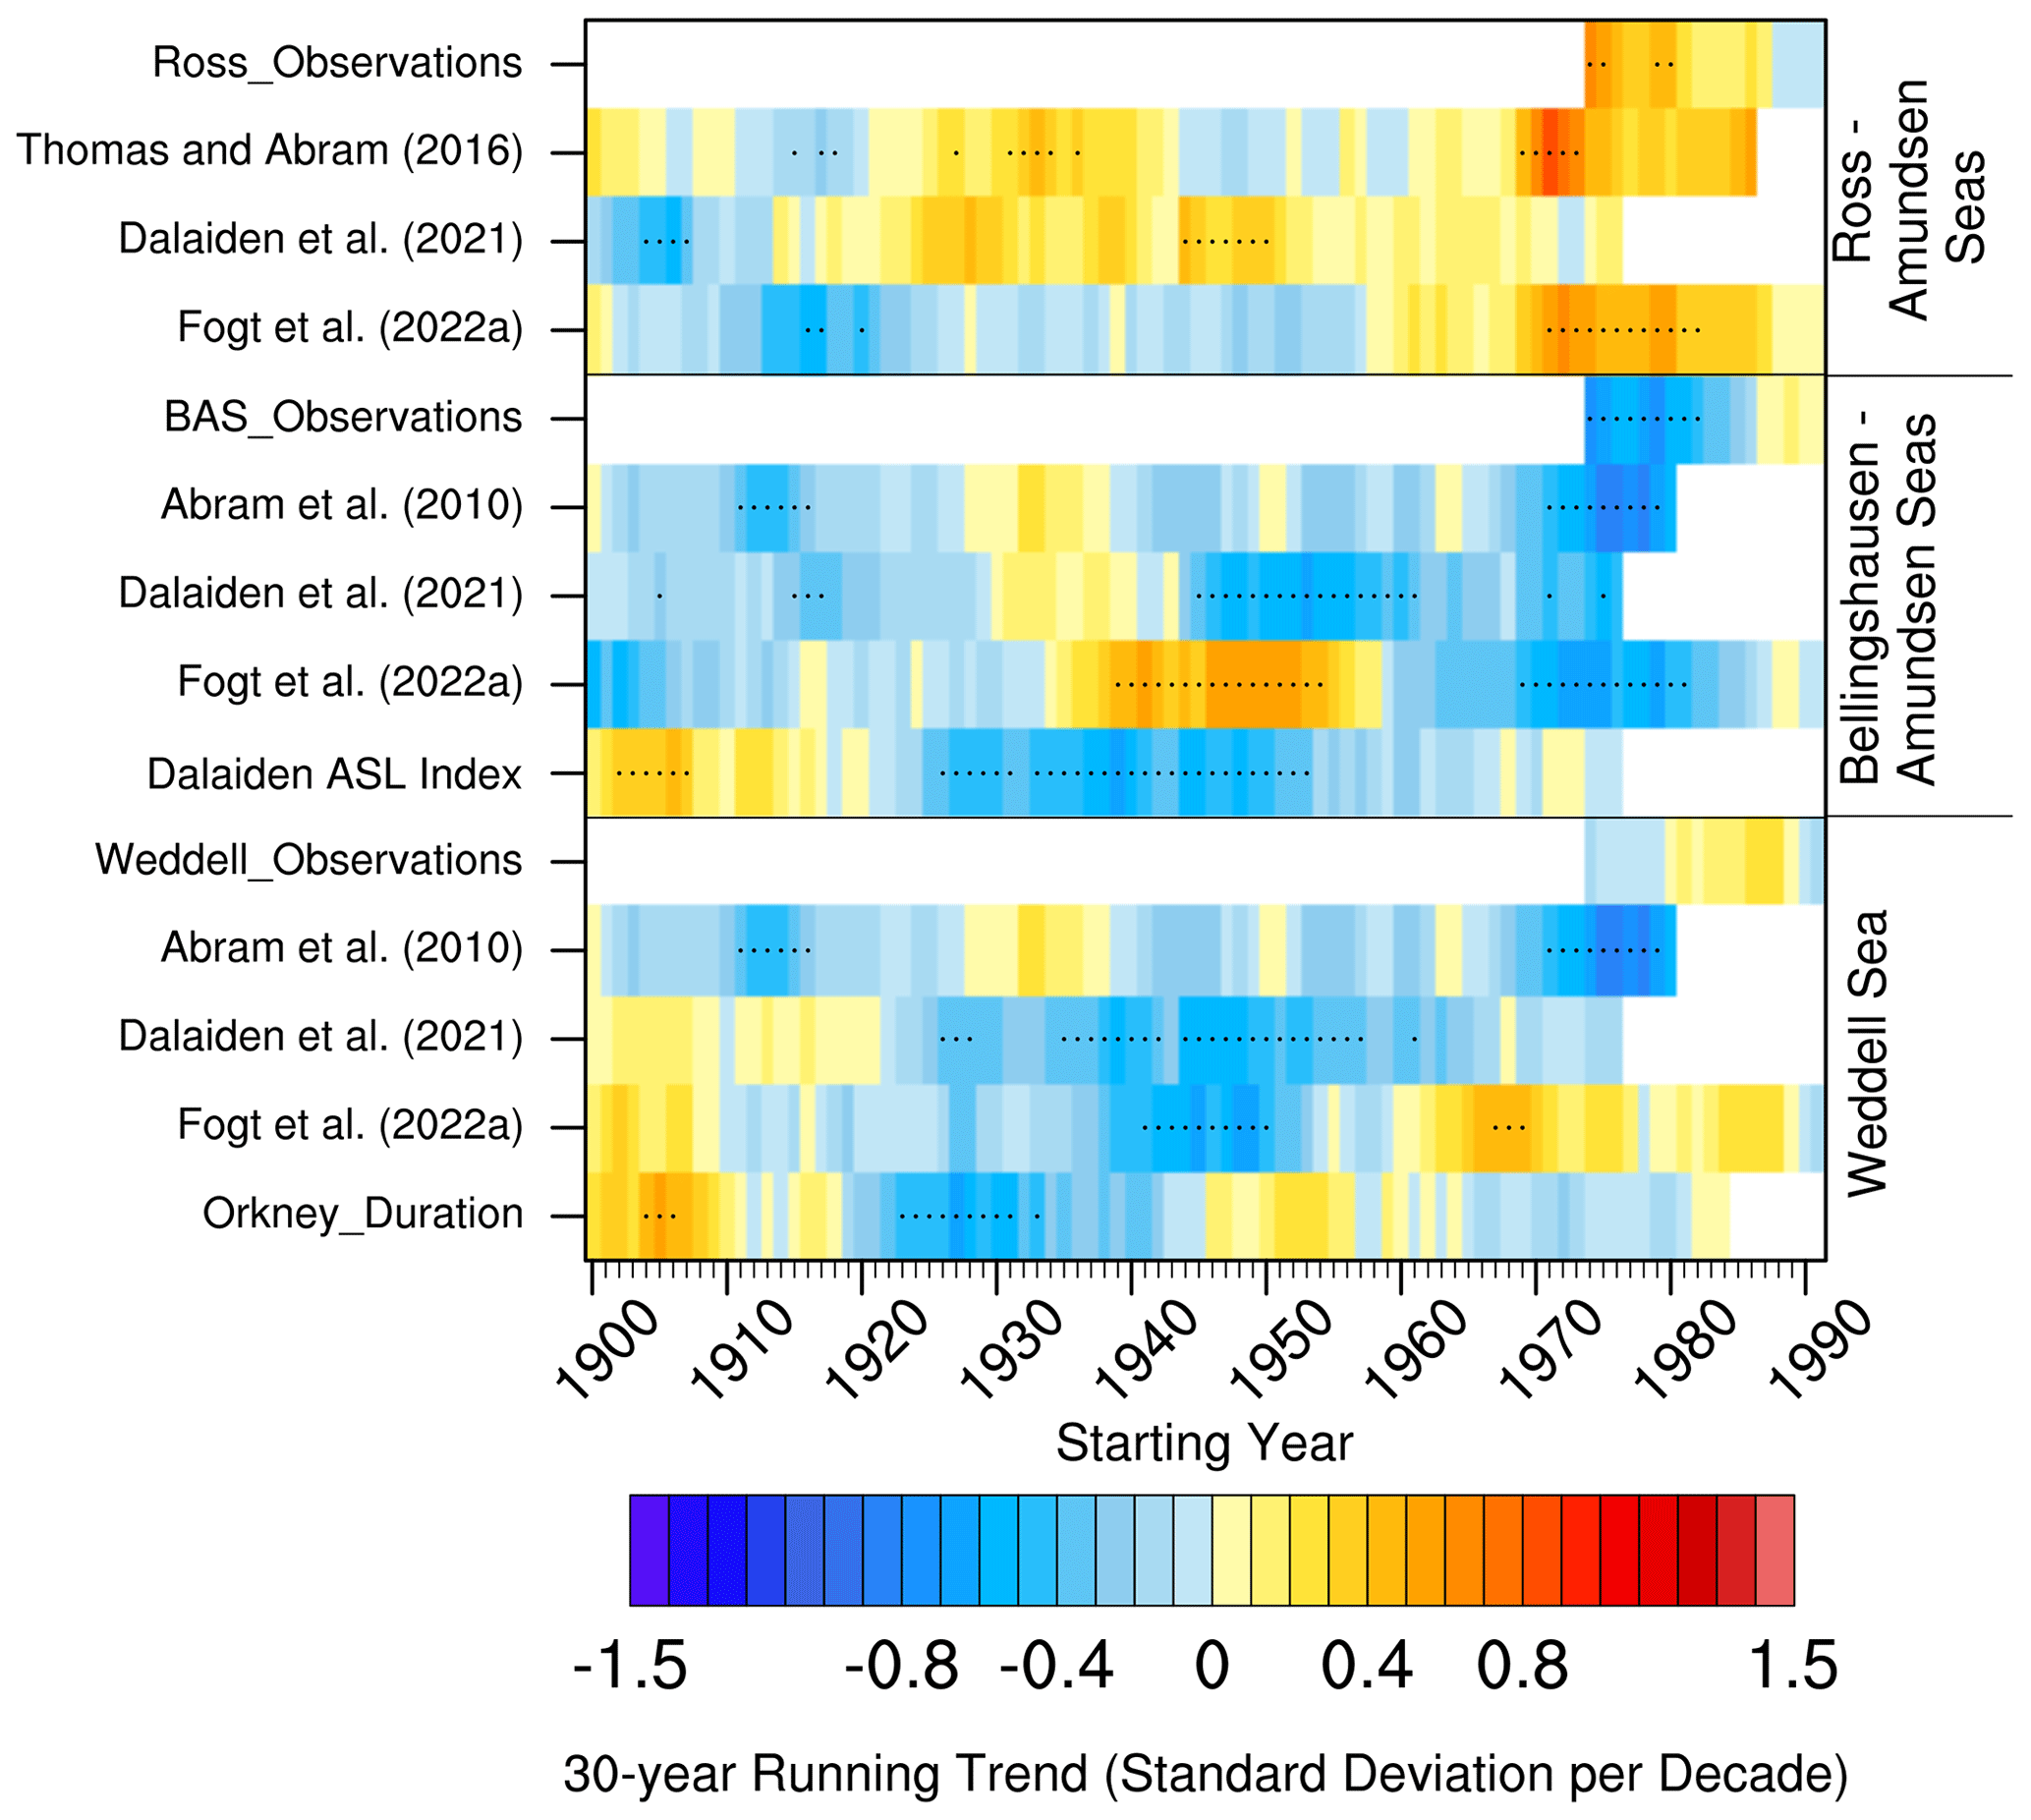
Figure 630-year running trends (standard deviations per decade) of the annual mean sea ice extent time series in Fig. 3. Individual 30-year trends that are statistically different from zero at p<0.05 are stippled. For the Weddell Sea, the fast ice duration at the Orkney islands from Murphy et al. (1995) is also provided. For the Bellingshausen–Amundsen Sea region, the ASL index from Dalaiden et al. (2021a), defined as the annual mean 500 hPa geopotential height from 60–75∘ S, 170∘ E–70∘ W, is also shown. Trends are only calculated if 25 years or more are available in each 30-year window.
The AB10_PALEO reconstruction shows a much weaker pattern of correlations than the other estimates in the Bellingshausen–Amundsen and Weddell sectors (middle and bottom rows of Fig. 5), while the DAL21_ASSIM estimates align much better with observations in these sectors. The AB10_PALEO relationships with the sea ice concentrations only modestly improve seasonally (not shown). Together, this suggests that the spatial (and, to a lesser extent, seasonal) limitation of the ice conditions represented by the AB10_PALEO reconstruction is an important contributing factor of its differences with the other sea ice extent estimates examined here. From Fig. 5, the AB10_PALEO reconstruction has significant correlations at the far equatorward sea ice edge, stretching from the Bellingshausen Sea eastward across the Antarctic Peninsula to the Weddell Sea, different from the 70–100∘ W region originally suggested. This different spatial relationship in the annual mean (compared to the originally published August–October) also explains why it has correlations with sea ice observations from both the Bellingshausen–Amundsen and Weddell sectors (Figs. 3 and 4), albeit much weaker than other reconstructions. This spatial relationship is to be expected as it is only based on three Antarctic Peninsula ice cores (Table 1) compared to the array of ice cores used in DAL21_ASSIM (Fig. 2b)
The time series in Figs. 3 and 4 suggest that while there are notable differences in the interannual variability in the various reconstructions, there are also differences in longer-term changes and especially the trends through time. Figure 6 investigates these discrepancies through the use of 30-year running trends, similar to that done in Fogt et al. (2022b), but including the Weddell sector and other data sources.
One clear pattern in the satellite-observed trends discussed in the Introduction and shown in Fig. 1a is the opposing nature of positive sea ice extent trends (equatorward movement of the ice edge) in the Ross Sea and negative sea ice extent trends in the Bellingshausen–Amundsen sector (Fig. 6). These trends reverse and weaken after the 2016 sudden decline (Fig. 6; Fogt et al., 2022a) but still demonstrate opposite behavior, strongly tied to the atmospheric circulation around the Amundsen Sea low (Hosking et al., 2013; Raphael et al., 2016; Holland and Kwok, 2012). While the various reconstructions capture the observed trends (including their statistical significance), there are marked differences in the signs of the trends prior to the satellite observations around 1979. In particular, paleo-based sea ice extent estimates generally indicate that the observed trends are part of a long-term continuous trend of the same sign throughout much of the 20th century; this story is also consistent in the Weddell sector, as the paleo-based reconstructions only show statistically significant trends prior to 1979 that are the same sign as the observed trends after 1979. In contrast, the FOGT_STAT reconstructions show a pronounced shift in the trend sign and magnitude through time. The FOGT_STAT sea ice reconstruction trends are characterized by statistically significant positive trends in the middle 20th century in the Bellingshausen–Amundsen sector (opposite to the decreases after 1979 there) and statistically significant negative trends in the Ross Sea in the early 20th century, with a prolonged period of weaker negative trends throughout the 20th century, opposite to the strong positive trends in the satellite observations starting in 1979 (Fig. 6). In the Weddell sector, where there is better agreement between the FOGT_STAT and DAL21_ASSIM estimates (Figs. 3–5), the trends align better through time. Moreover, these trends and their temporal changes in both significance and sign are broadly aligned with the South Orkney fast ice duration dataset of Murphy et al. (1995), with positive trends in the first portion of the 20th century that change to negative trends through much of the middle 20th century, to weak trends during the satellite observation period.
While the seasonal and spatial differences between the various reconstructions evaluated in Figs. 2–5 undoubtedly play a role (especially for the AB10_PALEO reconstruction), Fig. 6 suggests that changes in the underlying implied atmospheric circulation are also playing a role. In observations (Fig. 1a), the differing sea ice extent trends in the Bellingshausen and Ross Sea are largely tied to the atmospheric circulation around the Amundsen Sea low and implied sea ice drift changes (Holland and Kwok, 2012; Holland, 2014). Although there are no long-term direct observations, the ASL index extracted from the pressure field in DAL21_ASSIM reconstructions shows changes through time that are nearly opposite to the FOGT_STAT reconstructions for the Bellingshausen–Amundsen sector, potentially confirming that underlying atmospheric circulation changes are a dominant contribution to the different sea ice changes.
While reconstruction uncertainty will always play a role in differences between various historical estimates, the comparisons of the various sea ice reconstructions thus far suggest that (a) the AB10_PALEO is primarily different from other reconstructions because of its different spatial footprint; (b) the methodology used to create the reconstructions or their temporal resolution does not play a consistent role, as correlations between the proxy-based reconstructions as well as with the station-based reconstructions vary considerably; and (c) the atmospheric circulation associated with the sea ice reconstructions appears to be a dominant mechanism for differences between them. To investigate this further, the role of implied changes in the atmospheric circulation underlying the proxy-based and station-based reconstructions is therefore the focus for the remainder of this paper.
3.2 Connection to the atmospheric circulation changes
Since 20th century atmospheric reanalyses have been shown to have long-term artificial pressure trends throughout the early and middle 20th century (Schneider and Fogt, 2018; Fogt et al., 2020), our analysis of the relationship between sea ice extent and the atmospheric circulation is focused on other estimates. In particular, we examine pressure reconstructions generated using proxy data assimilation with various climate model priors and proxy datasets, including the DAL21_ASSIM and O'Connor et al. (2021a, 2023a) datasets (Table 1), as well as a station-based estimate, FC21_STAT; Fig. 7 displays the correlations for the Weddell sector sea ice extent from (top rows) DAL21_ASSIM and (bottom rows) FOGT_STAT with three gridded pressure datasets. The gridded pressure datasets are grouped by columns and further broken into the pre-satellite sea ice observation period of 1905–1978 (top rows of each section) and satellite-era sea ice observation period (1979–2000). Overall the patterns are quite similar in each of the panels, reflecting the broad similarities of the sea ice reconstructions in the Weddell sector (Figs. 3–5). Here, the sea ice extent reconstructions show a strong positive correlation with pressure over the Antarctic continent that changes to negative correlations with pressure in the Pacific Ocean from the midlatitudes and equatorward, including South America. For both the DAL21_ASSIM and OCON21_ASSIM pressure datasets, regardless of the sea ice extent estimate (top or bottom half of Fig. 7), these relationships exist in a similar fashion throughout time, suggesting that the Weddell sea ice maintains a similar relationship with pressure across the entire Southern Hemisphere from data-assimilation-based products. However, for the FC21_STAT pressure dataset, the relationship with Weddell sea ice extent, regardless of the sea ice extent estimate (DAL21_ASSIM or FOGT_STAT), shows a change in sign poleward of 60∘ S in 1905–1978 (right column in Fig. 7). While the trends in the Weddell sea ice extent change less dramatically through time than in the Ross, Amundsen, and Bellingshausen sectors (Fig. 6), there are still changes in the sea ice extent trends in the Weddell sector in the FOGT_STAT reconstruction, with perhaps too strongly positive sea ice extent trends at the end of the 20th century (compared to observations) juxtaposed by negative sea ice extent trends in the middle 20th century (Fig. 6). If the statistical relationship between the atmospheric circulation and sea ice extent changed in time (Fig. 7, right column), this could be linked (at least statistically and perhaps incorrectly) to the changes in the sea ice extent trends displayed in the FOGT_STAT reconstructions but not in the paleo-reconstructions (Fig. 6).
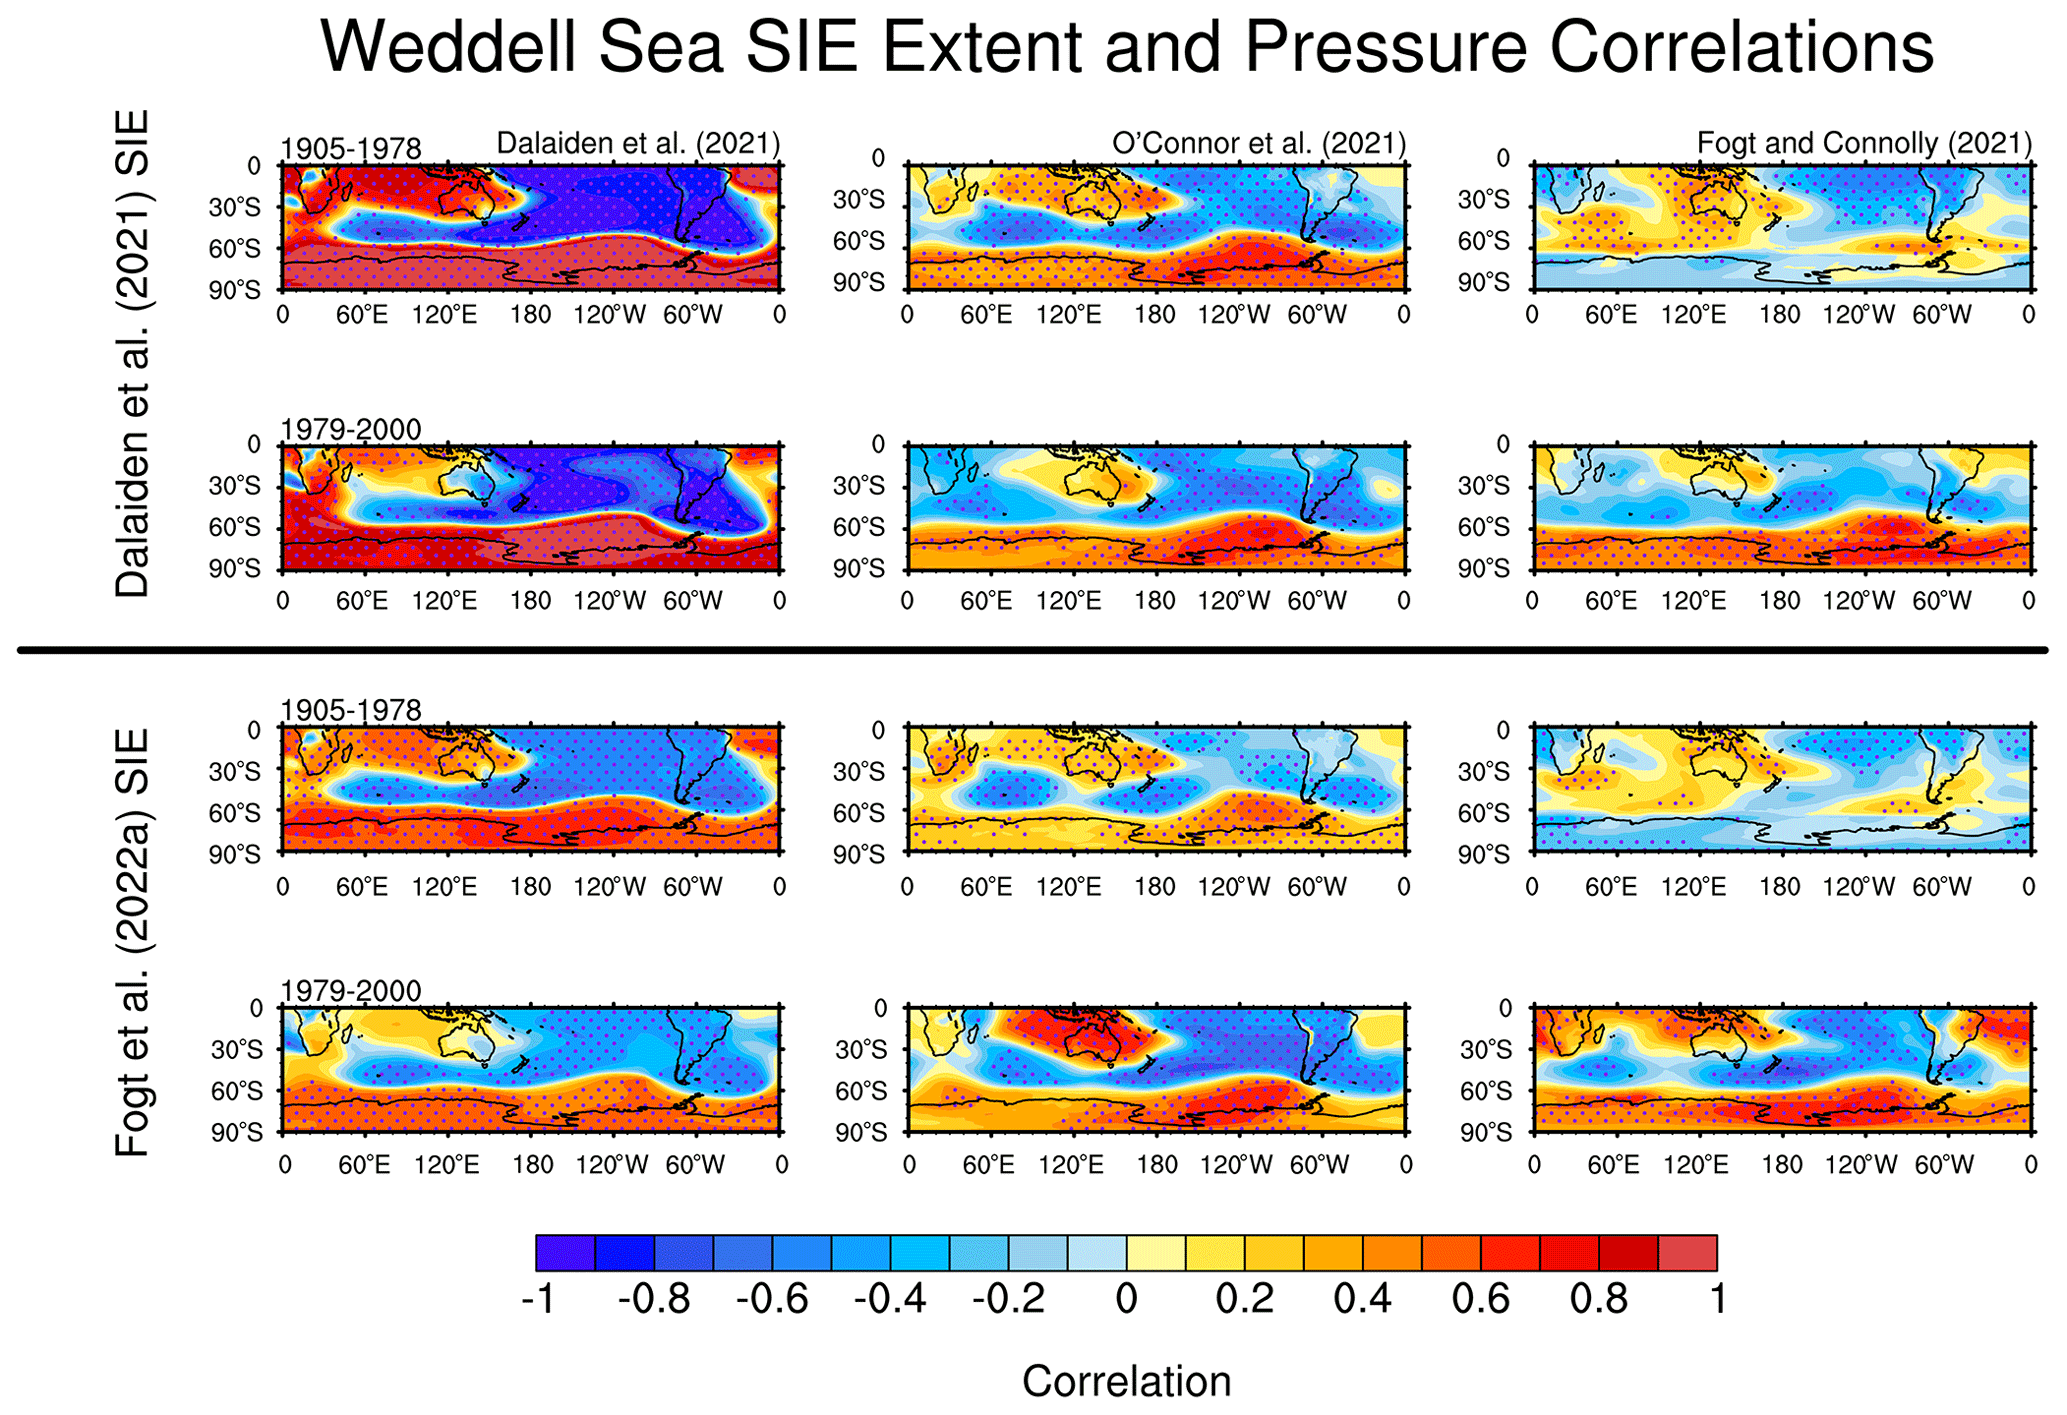
Figure 7Annual mean correlations of (top half) Dalaiden et al. (2021a) and (bottom half) Fogt et al. (2022a) sea ice extent correlations for the Weddell Sea with three 20th century spatially complete pressure reconstructions (columns). In each half, the top row represents correlations in the pre-satellite period of 1905–1978, and the bottom row is for 1979–2000. The pressure reconstructions are from (left column panels) Dalaiden et al. (2021a), (middle column panels) O'Connor et al. (2021a), and (right column panels) Fogt and Connolly (2021). Correlations statistically different from zero at p<0.05 are stippled.
Interestingly, when examining the correlation of sea ice extent reconstructions in the Ross–Amundsen sector (Fig. 8), this sea ice–pressure relationship across the various datasets is only apparent for the DAL21_ASSIM pressure dataset. For the DAL21_ASSIM sea ice extent estimate (Fig. 8, left column), the pressure relationships are maintained throughout time and are even stronger in the 1905–1978 period for the DAL21_ASSIM pressure estimate. As in the Weddell sector, the correlation pattern of the DAL21_ASSIM sea ice extent estimate with the FC21_STAT pressure dataset in the Ross–Amundsen sector again changes through time poleward of 60∘ S over the Antarctic continent, from overall weakly positive and insignificant correlations from 1905–1978 to statistically significant (p<0.05) negative correlations after 1979 (Fig. 8, top two rows of rightmost column). A notable exception, however, is off the coast of West Antarctica in the vicinity of the Amundsen Sea low, where correlations remain significantly (p<0.05) negative throughout time, highlighting the key role of this feature for regional sea ice variability (Hosking et al., 2013; Raphael et al., 2016). However, for the FOGT_STAT sea ice extent reconstructions (bottom two rows in Fig. 8), a different story emerges. The correlations, while of a generally similar sign, are weaker for all pressure datasets (columns in Fig. 8) in the 1905–1978 period compared to the 1979–2000 period. In particular, the statistically significant (p<0.05) negative correlations within the region of the Amundsen Sea low are maintained throughout time, especially in the FC21_STAT pressure dataset (Fig. 8, right column, bottom two rows); these are reduced, however, when using the DAL21_ASSIM pressure dataset with the FOGT_STAT sea ice extent reconstruction (Fig. 8, left column, bottom two rows).
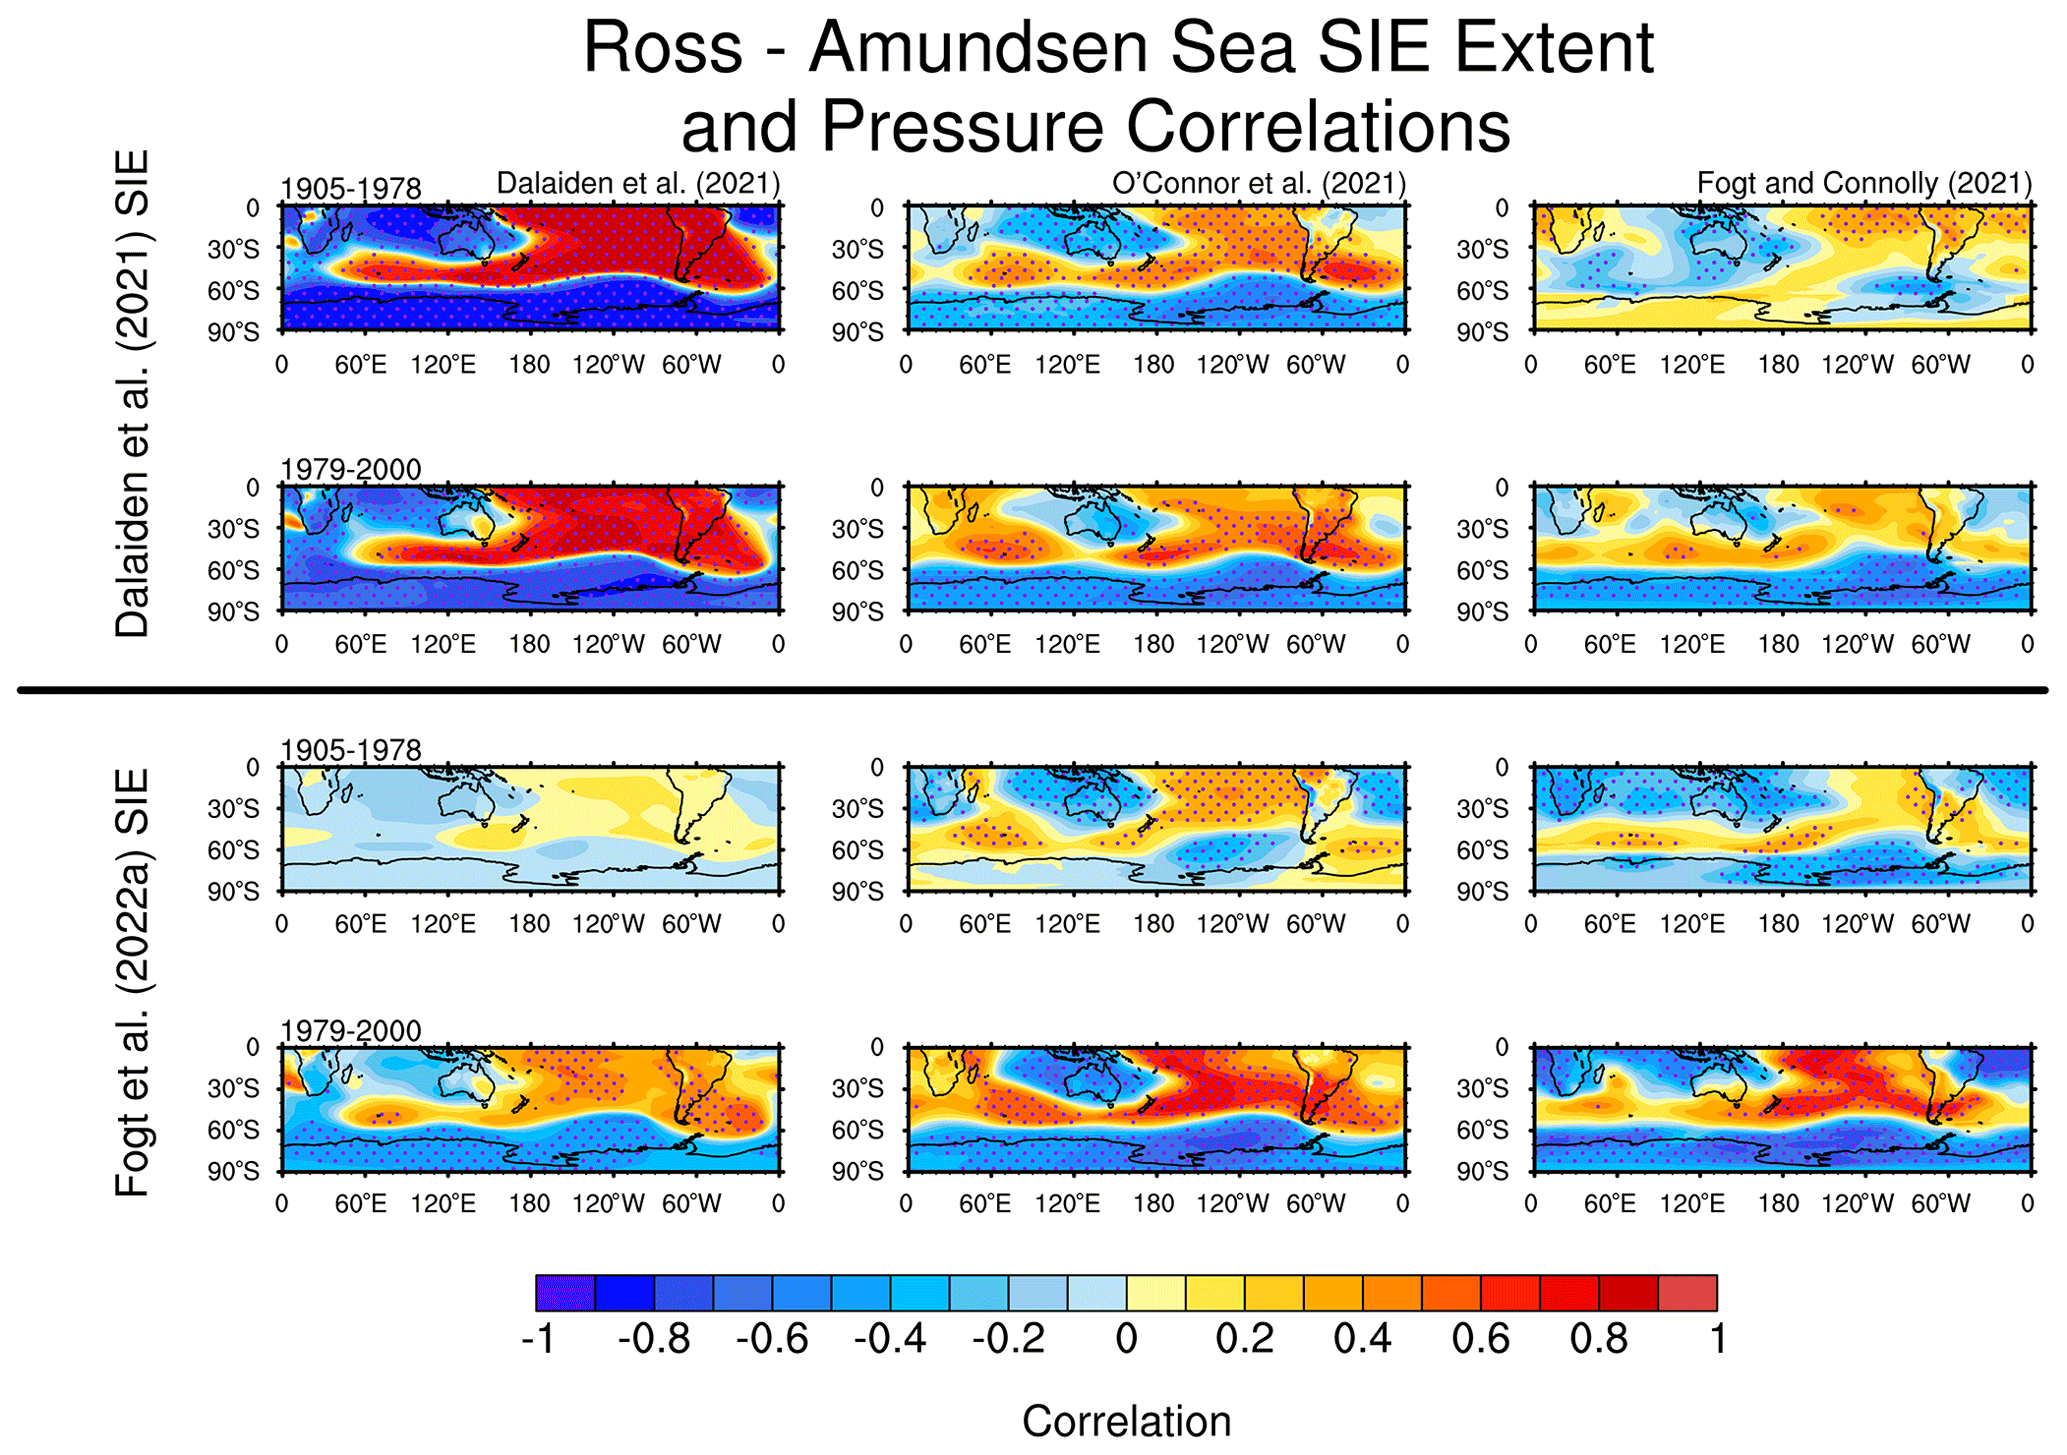
Figure 8As in Fig. 7, but for the sea ice extent reconstructions for the Ross–Amundsen Sea sector.
Are changes in time of the sea ice–pressure relationship in time in the Weddell sector from Fig. 7 a real feature, or is this an artifact of the reconstructions (sea ice extent, pressure, or both) generated by their limitations? While there are no direct spatially complete observations of sea ice or pressure throughout the full 20th century, the Weddell sector is one of the few places with longer historical observations of both pressure, afforded by the observations collected at Orcadas station (60.7∘ S, 44.7∘ W) since 1903 (Zazulie et al., 2010), and sea ice conditions, represented by the fast ice duration series around Orcadas from Murphy et al. (1995). The running correlations of these key observations with sea ice estimates are provided in Fig. 9 as the only observation-based investigation into the possible reality of a time-varying sea ice–pressure relationship within the Weddell Sea. In Fig. 9a, the annual mean FOGT_STAT Weddell sea ice extent reconstruction maintains a statistically significant (p<0.05) positive relationship throughout time with the South Orkney fast ice (SOFI) record (solid lines, Fig. 9a). Although usually not statistically significant, both FOGT_STAT SOFI durations similarly change sign through time with the pressure at Orcadas station (dashed lines in Fig. 9a), which is consistent with the Weddell SIE-gridded pressure correlation change through time presented in the right column of Fig. 7. While the Weddell sea ice extent estimate from DAL21_ASSIM is also positively correlated through time with the SOFI duration (solid blue line, Fig. 9b; only significant at p<0.05 for 30-year windows in the early 20th century), the Orcadas observed pressure and Weddell sea ice extent estimate from DAL21_ASSIM have no statistically significant correlations. There is therefore stronger support for changes in the relationship of high-latitude pressure and Weddell sea ice from the statistically generated sea ice and pressure reconstructions than there is from the paleo-based reconstructions, consistent with Fig. 7.
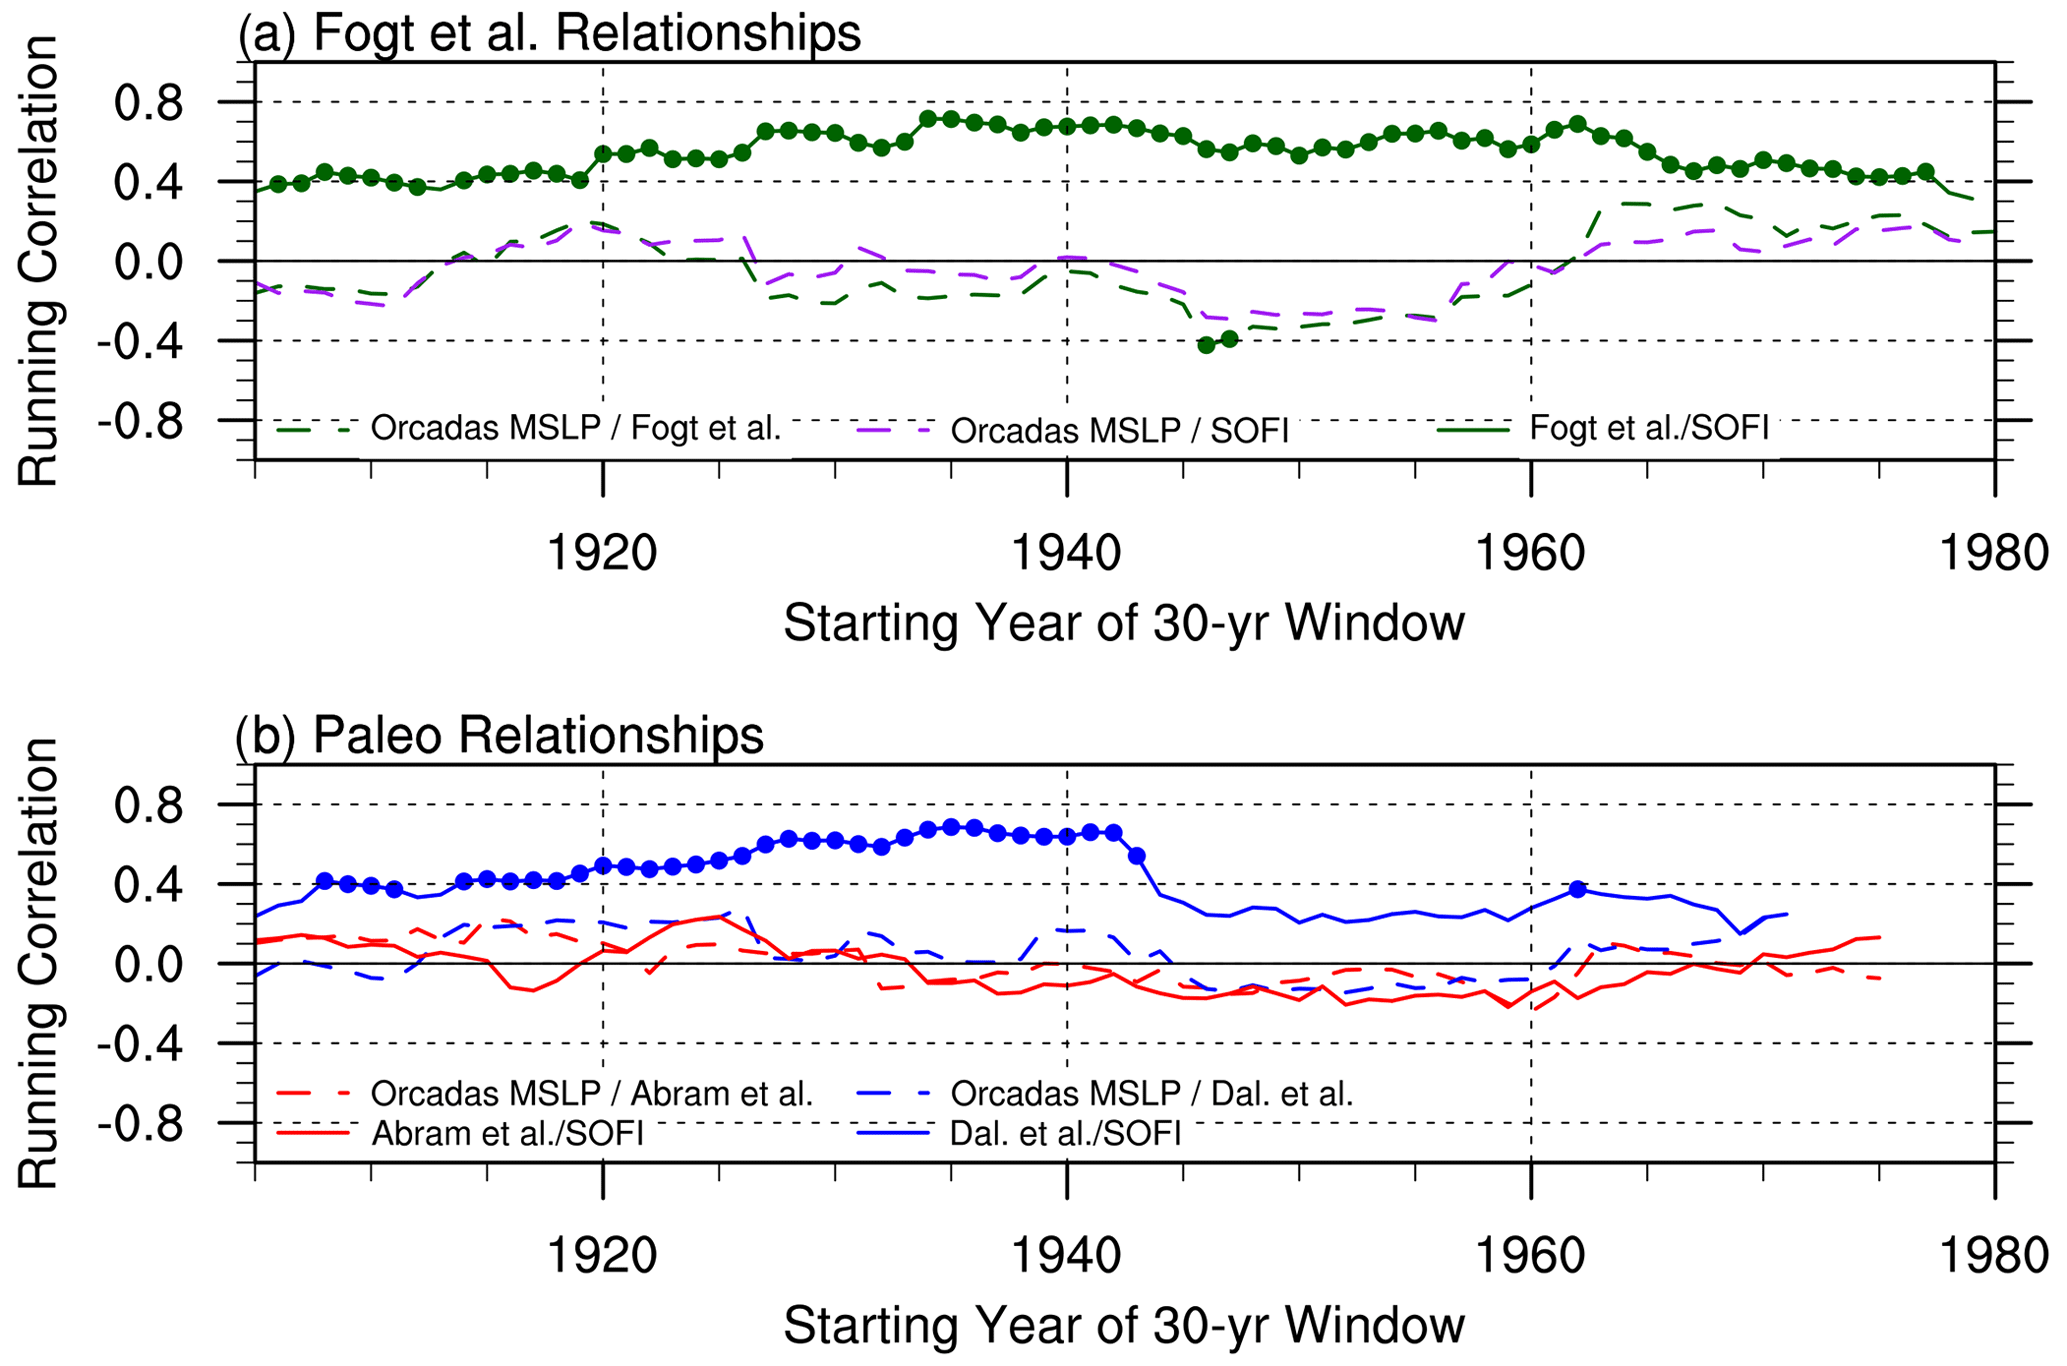
Figure 9The 30-year running correlations between pairs of South Orkney fast ice (SOFI) duration from Murphy et al. (1995, 2014), various sea ice extent estimates, or Orcadas station mean sea level pressure. Correlations significantly different from zero at p<0.05 are marked with a circle.
3.3 Differences in atmospheric pressure reconstructions
The connections of the various sea ice reconstructions with the atmospheric circulation in Figs. 7–9 suggest, just like with the sea ice, that there are also differences in the underlying atmospheric circulation from the FC21_STAT dataset and the DAL21_ASSIM and OCON21_ASSIM proxy data assimilation datasets. While some of these differences were discussed in O'Connor et al. (2021a), it is not clear how they may impact sea ice changes through time. To understand these differences better and the role they may play in the differences in the sea ice reconstructions, correlations between the various annual mean gridded pressure datasets in Table 1 are provided in Fig. 10.
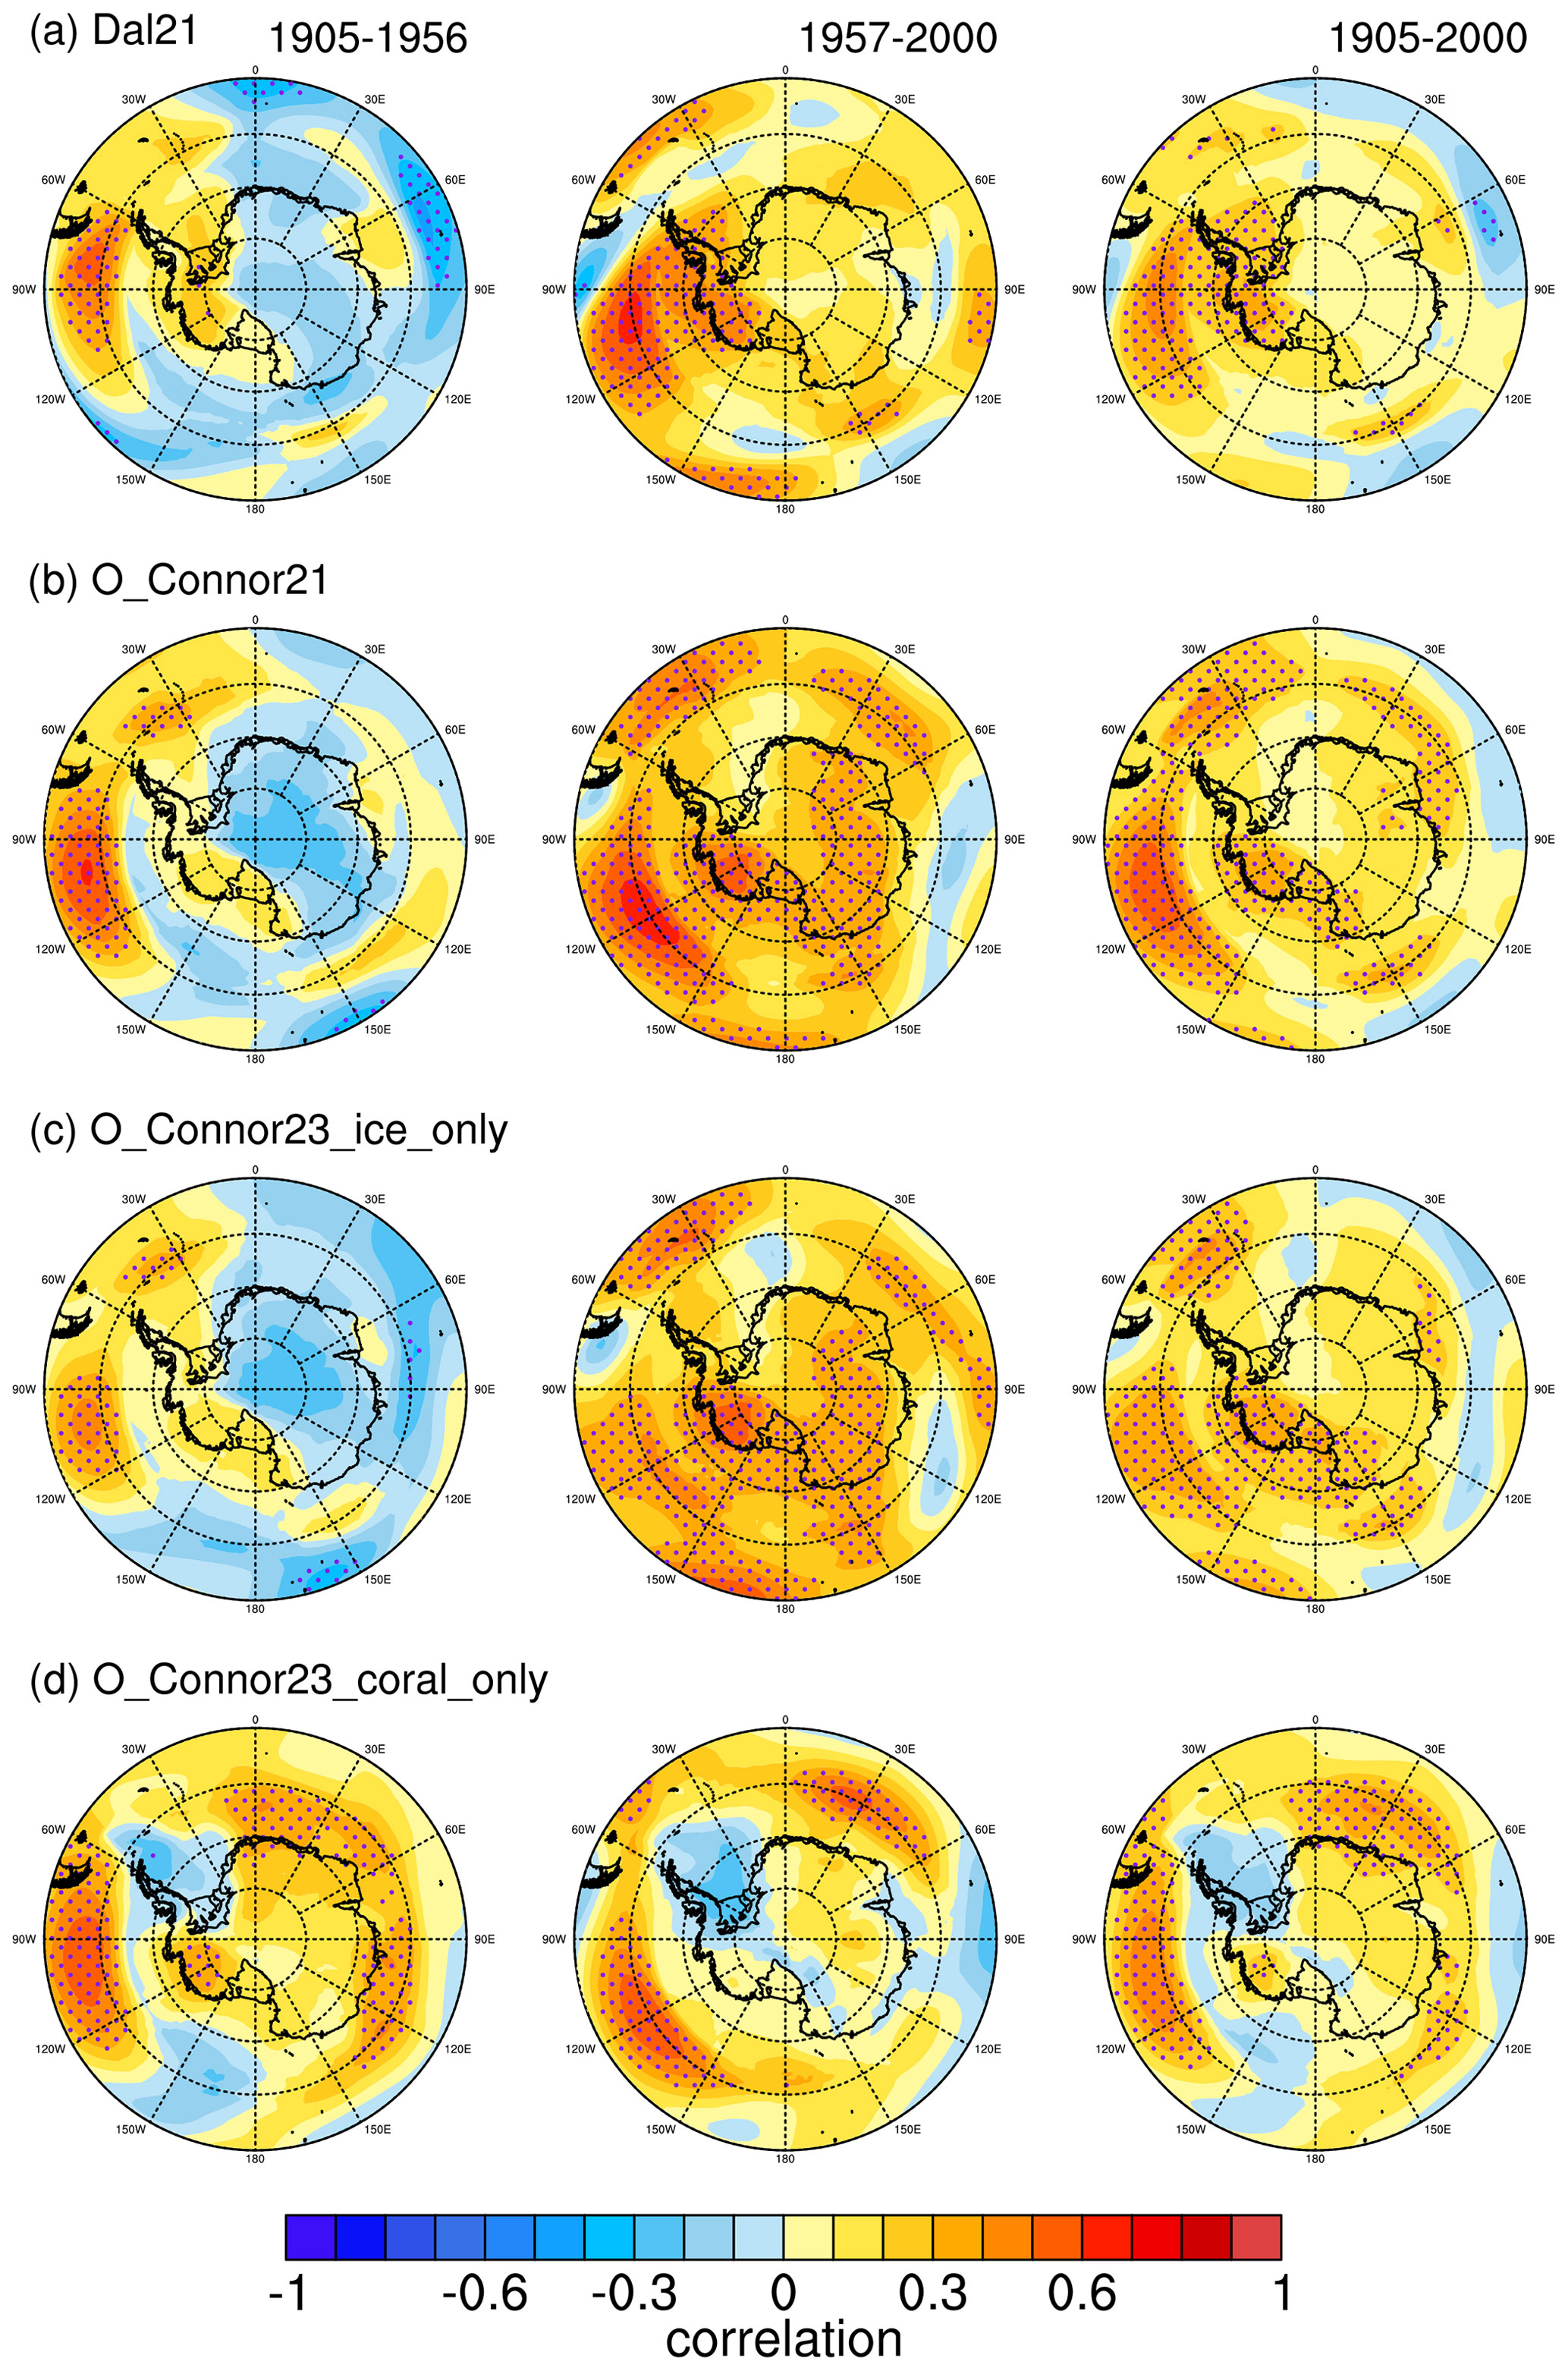
Figure 10Correlations of annual mean pressure at each grid point between the various paleo-based reconstructions with the Fogt and Connolly (2021) reconstruction. (a) Dalaiden et al. (2021a), (b) O'Connor et al. (2021a), and (c) O'Connor et al. (2023a) ice-core-based proxies only; (d) O'Connor et al. (2023a) coral-based proxies only. The columns denote three time periods: 1905–1956 (left column panels, prior to Antarctic data), 1957–2000 (middle column panels), and the full period of overlap 1905–2000 (right column panels). Correlations statistically different from zero at p<0.05 are stippled. All datasets were linearly detrended over the specific time period prior to calculating the correlations; further details on each dataset are provided in Table 1, and the proxy locations are given in Fig. 2.
Prior to the start of most Antarctic pressure observations, during the 1905–1956 time period (left column, Fig. 10), there are similar correlation patterns for the DAL21_ASSIM, OCON21_ASSIM, and the OCON23_ASSIM (ice core only) datasets, suggesting that the ice core data provide a strong constraint to the pressure variability in the paleo-assimilation reconstructions near Antarctica and that the inclusion of external forcing in the data assimilation prior (for the reconstructions from O'Connor et al., 2021a, 2023a) has minimal influence. Meanwhile, there are positive and even statistically significant (p<0.05) correlations between the OCON23_ASSIM (coral only) and FC21_STAT datasets (Fig. 10d, left column) in the early period. This suggests that tropical teleconnections, captured by the coral paleo-data, play an important role in the interannual variability in the FC21_STAT dataset. However, it is also clear the local ice core variability over Antarctica, which dominates the reconstructions in Fig. 10a–c, is opposite to that of the coral-based tropical variability (Fig. 10d), especially over East Antarctica, where tropical teleconnections to Antarctica are generally weaker (Li et al., 2021).
During 1957–2000, the agreement improves from 1905–1956 for all but the OCON23_ASSIM coral-only reconstructions (Fig. 10, middle column). This suggests that the FC21_STAT dataset aligns more with tropical variability in the early 20th century, which dominates its response, but more with ice-core-related variability in the latter half of the 20th century, which dominates the paleo-data assimilation reconstructions near Antarctica. Further, given the greater skill in the O'Connor et al. (2021a, 2023a) reconstructions relative to DAL21_ASSIM in the later period, this also suggests that including external forcing in the climate model prior is important.
Since there was some effect of seasonality on the relationship between the paleo-based and statistically based sea ice reconstructions in Fig. 4, we examine the correlations for each season in the 1905–1956 period in Fig. 11. For the pressure datasets, the change in seasonal skill in Fig. 11 is dampened compared to that for Antarctic sea ice extent in Fig. 4. There are more correlations statistically significant (p<0.05) for the DAL21_ASSIM dataset in DJF and SON, likely tied to when the skill of the FC21_STAT dataset is the highest. For the O'Connor et al. (2021a, 2023a) datasets (Fig. 11b–d), the agreement is slightly better over the Ross Sea and West Antarctica in winter. This improvement is due to contributions from both ice cores and corals, with the corals providing enhanced agreement off the coast and across East Antarctica (Fig. 11c and d). The ice-core-only reconstruction provides better agreement over West Antarctica in SON (Fig. 11d, right column). Another interesting feature, worthy of further study, is the opposite correlation in the Weddell Sea in MAM between the ice-core-only reconstruction (Fig. 11c, significantly positively correlated, p<0.05) and the coral-only reconstruction (Fig. 11d, significantly negatively correlated, p<0.05); the significant positive correlations over the Weddell Sea onto the Antarctic continent in MAM are also seen in the DAL21_ASSIM reconstruction, related to the ice core constraints (since this dataset does not assimilate coral proxies).
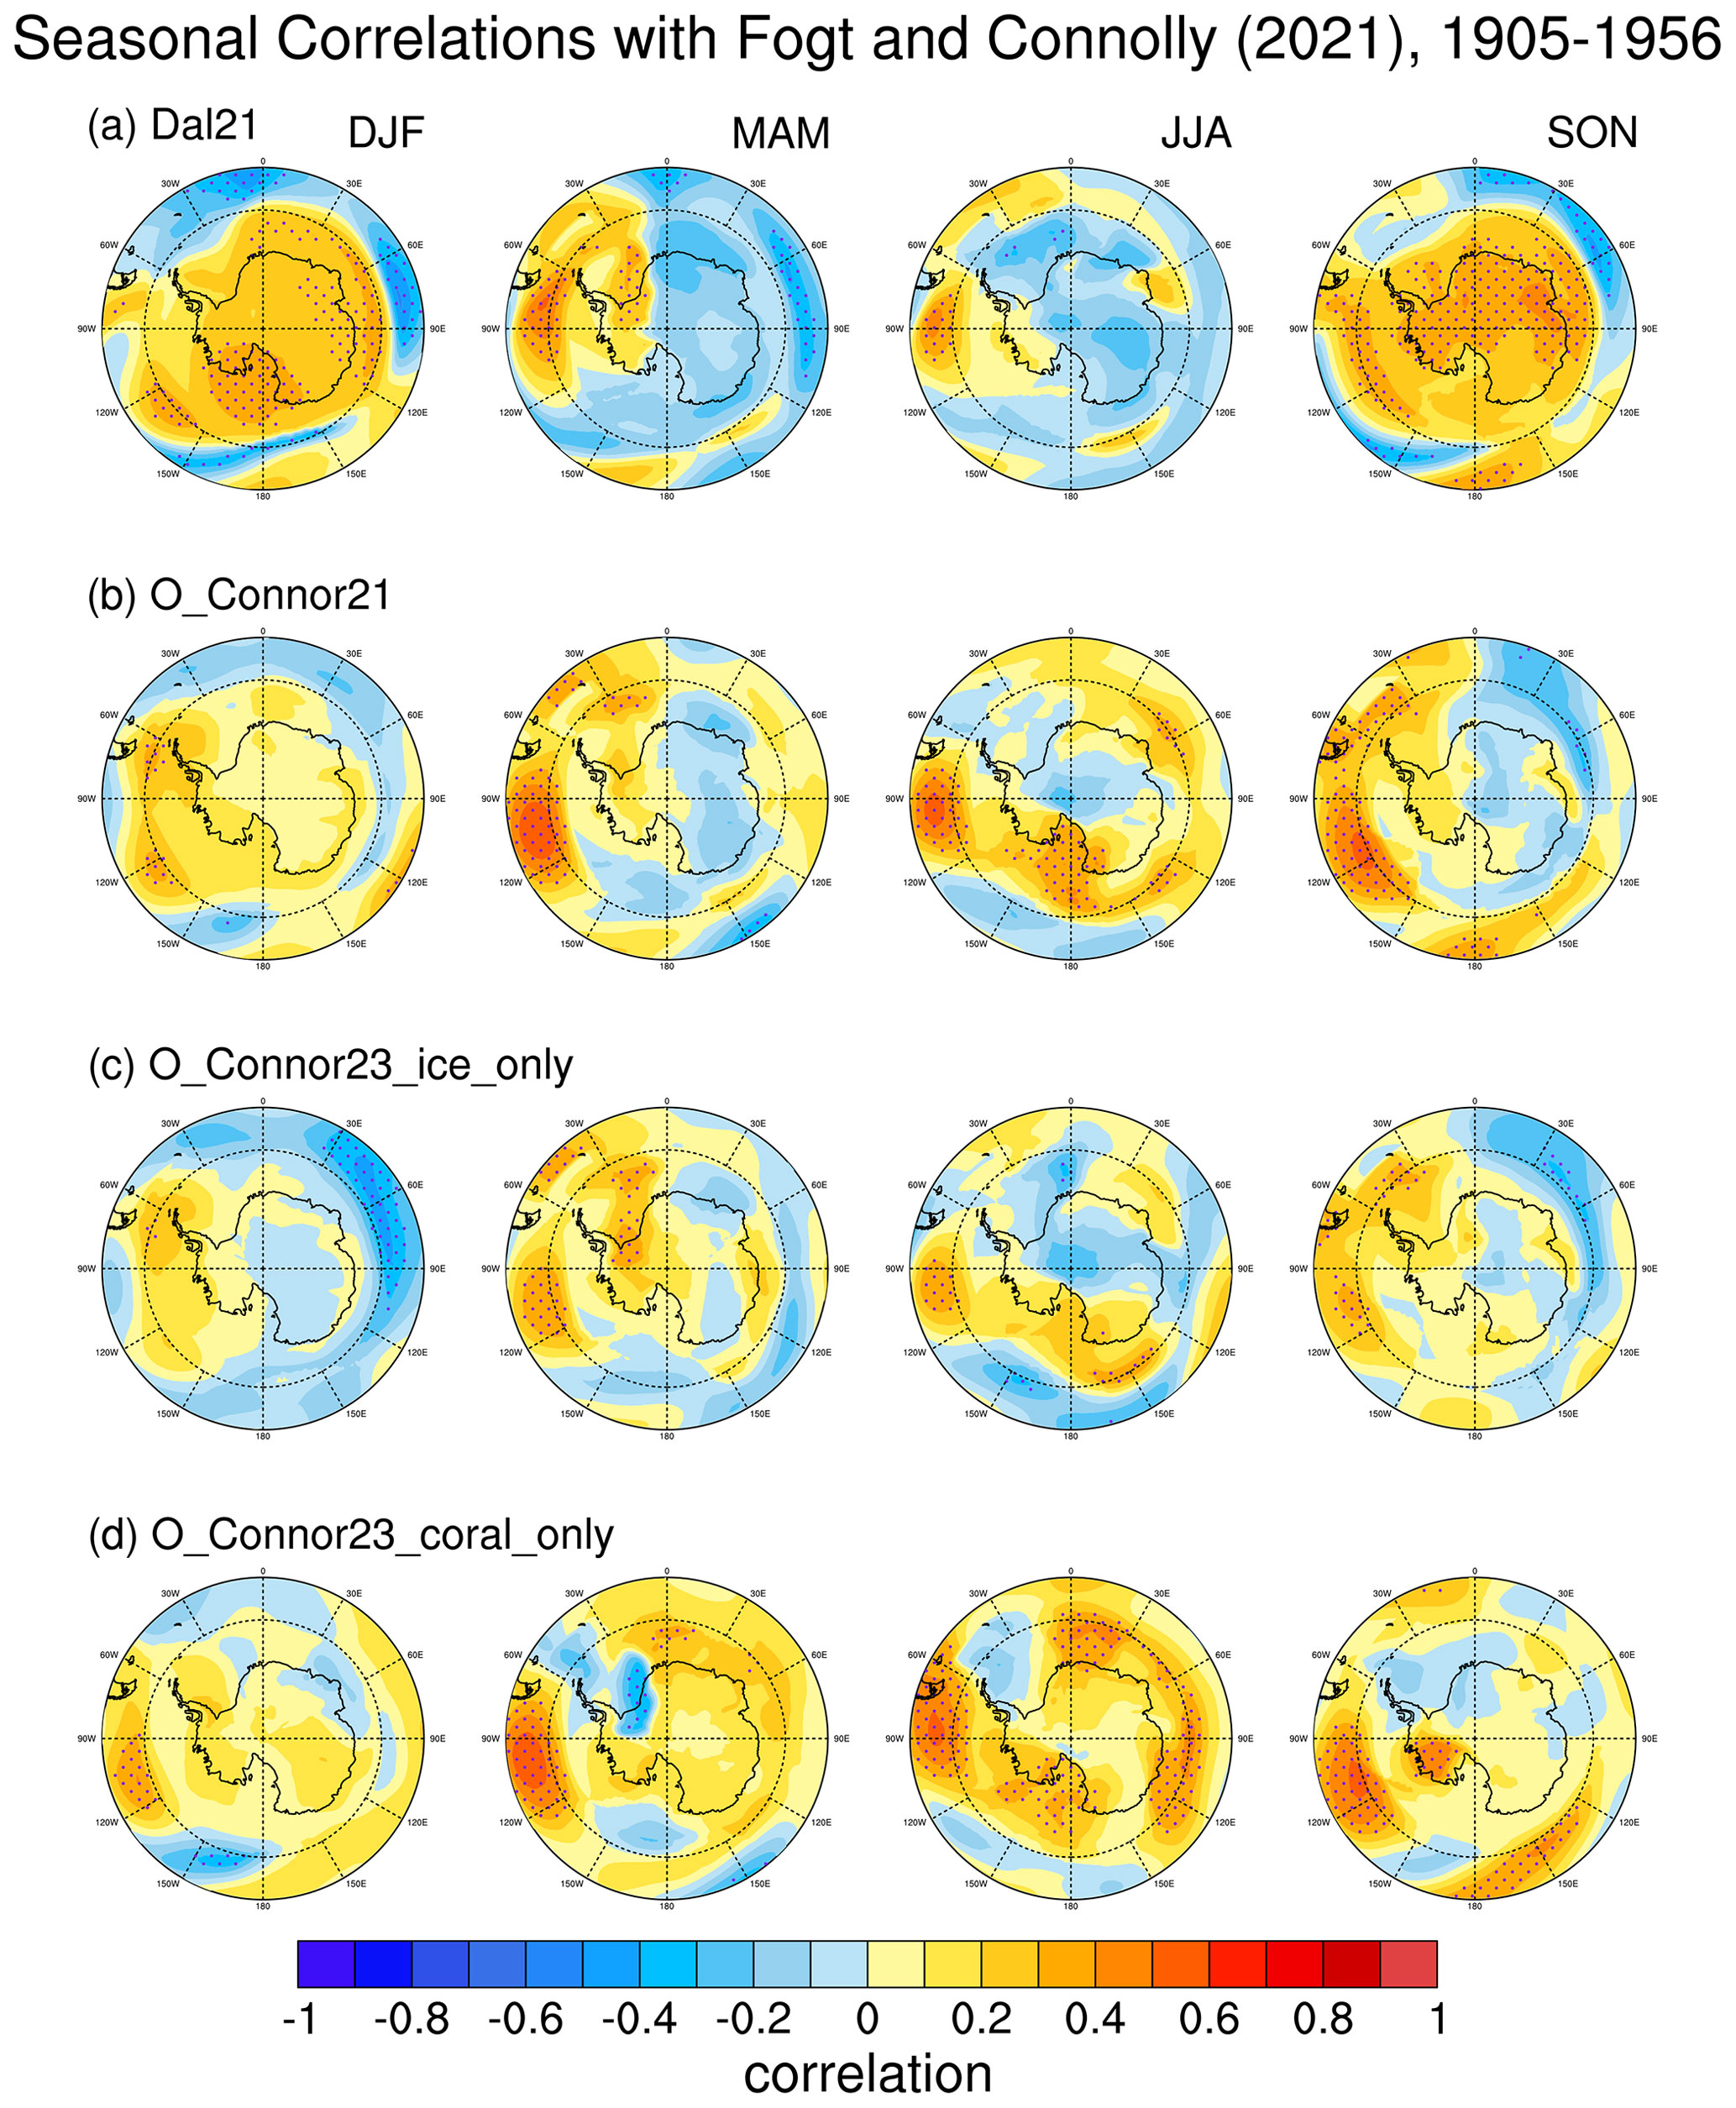
Figure 11As in Fig. 10, but for correlations of the annual mean pressure reconstructions with the seasonal mean reconstruction of Fogt and Connolly (2021) during 1905–1956. The columns, from left to right, represent DJF, MAM, JJA, and SON, respectively.
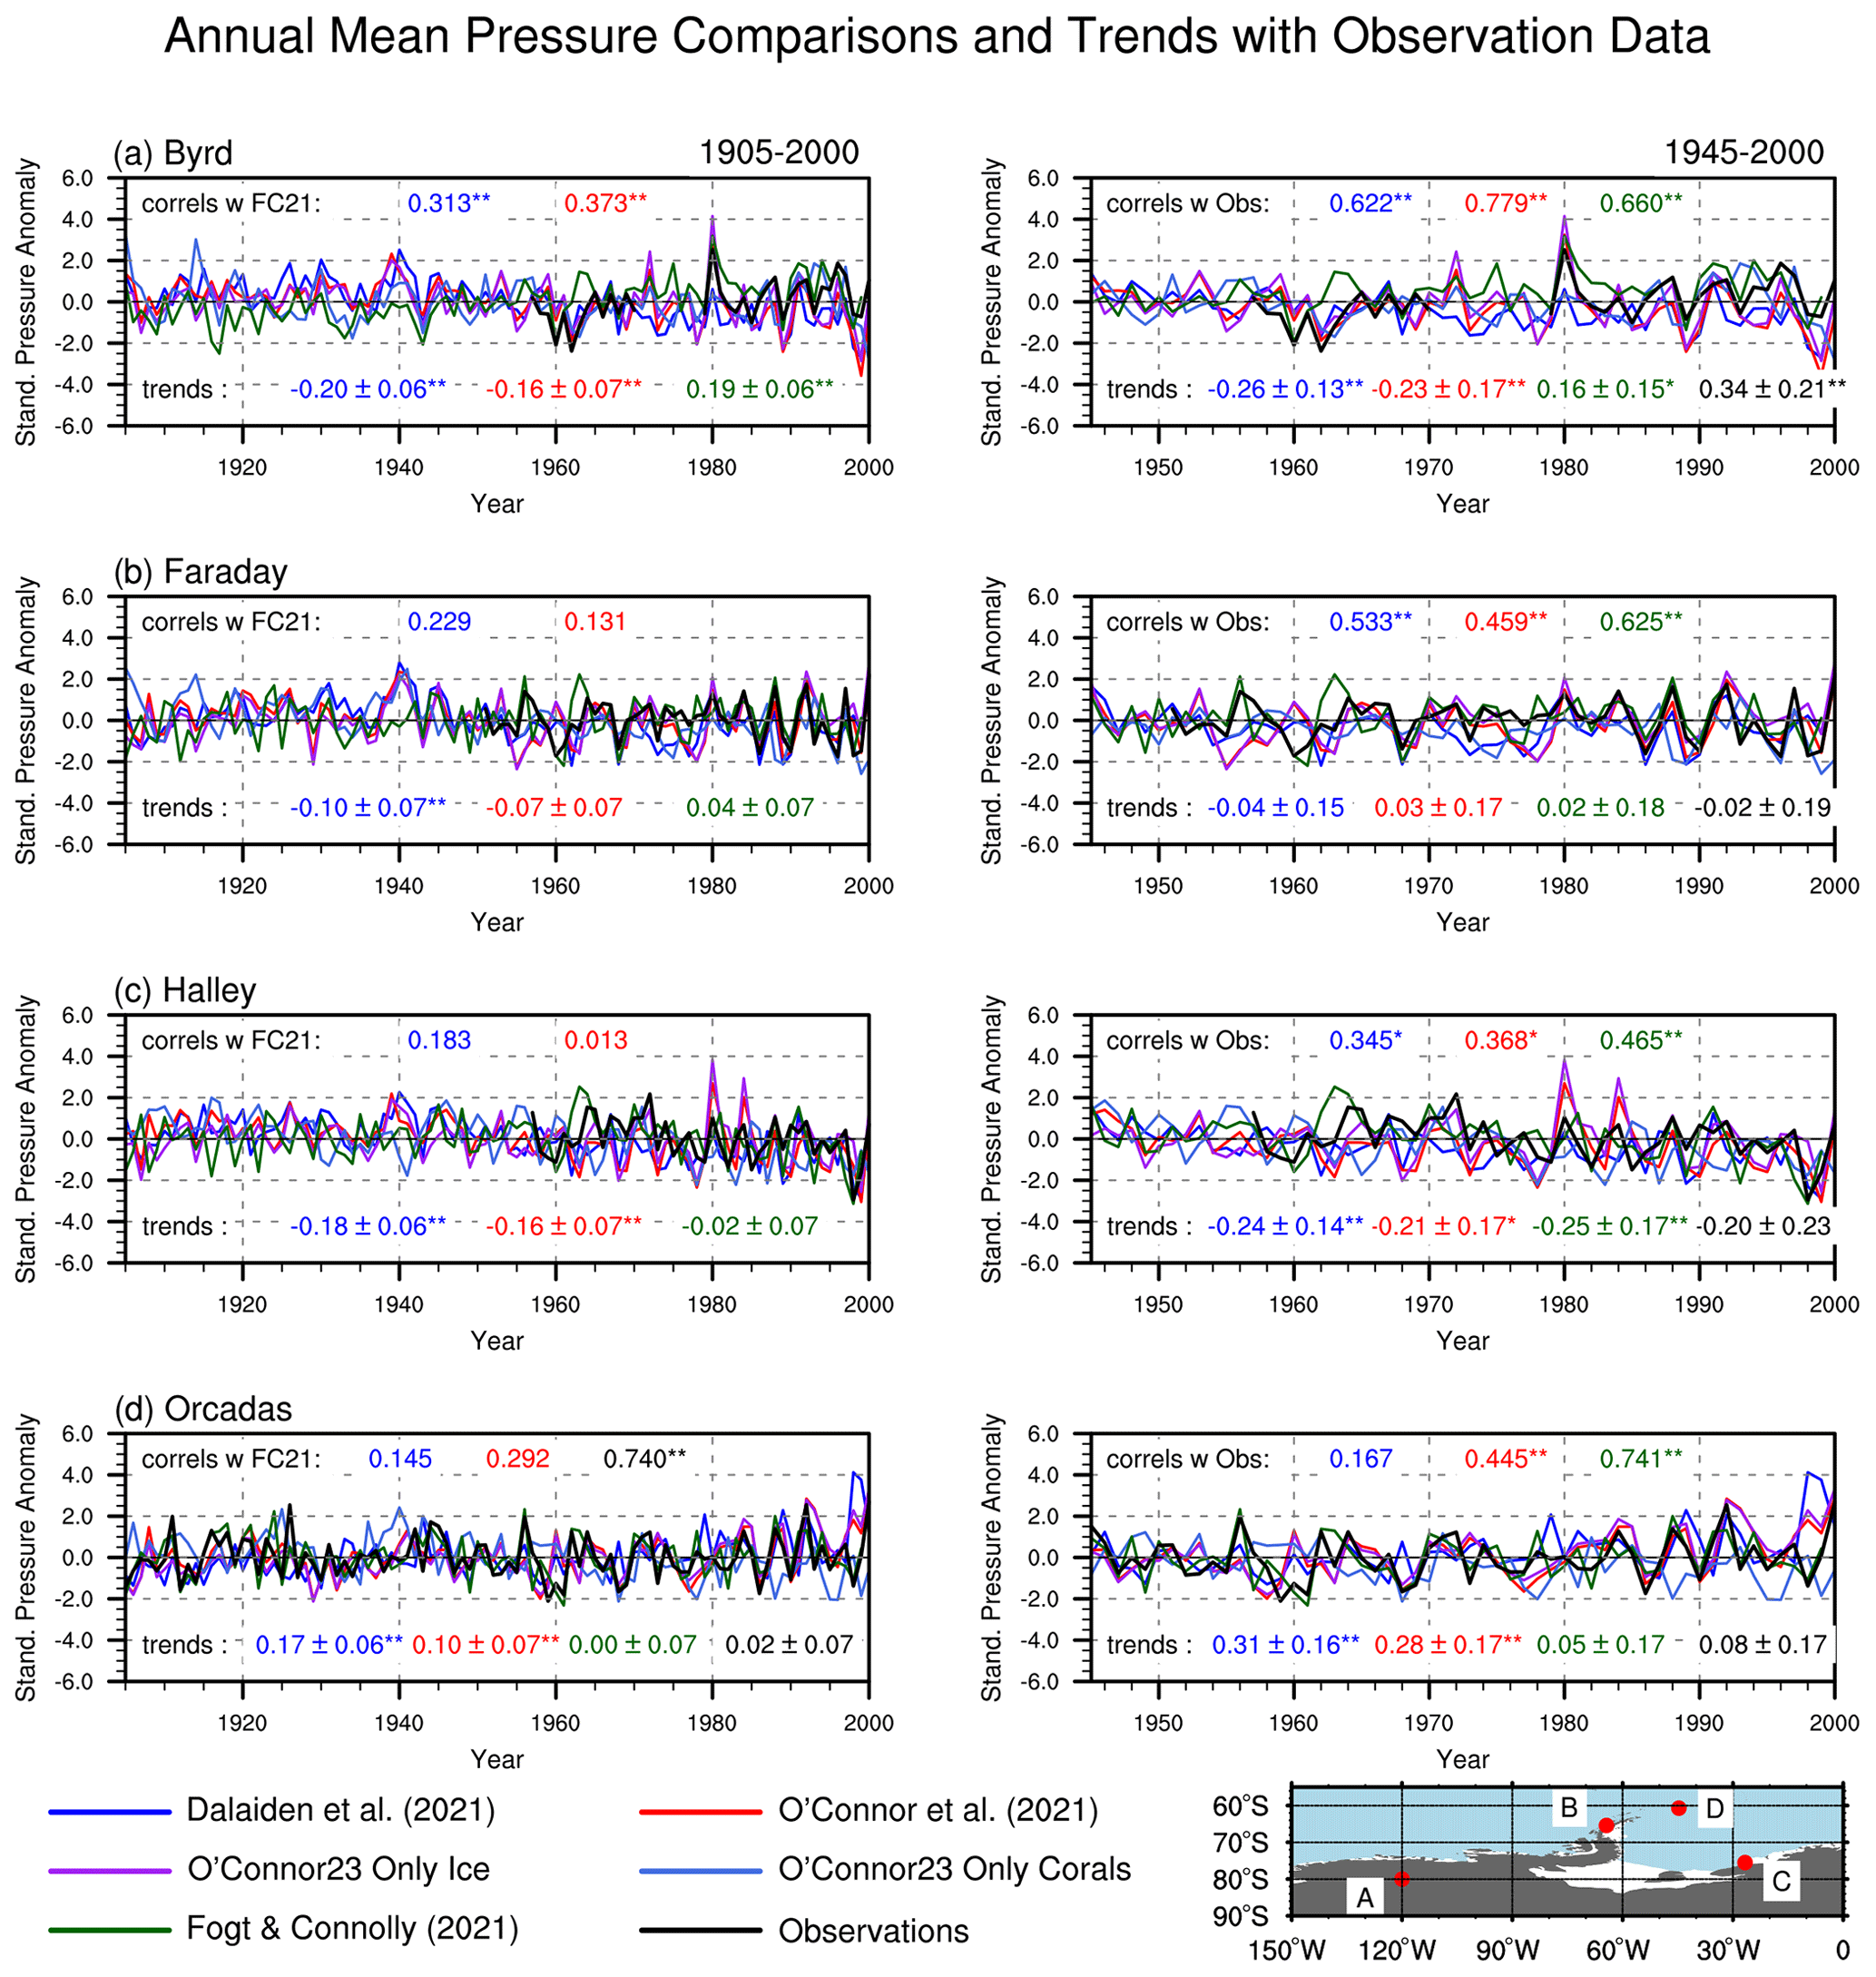
Figure 12Time series of standardized pressure anomalies at various locations given in the map at the bottom right (i.e., A = panel a). The observations, mostly starting around 1957 (1903 for Orcadas, panel d), are shown in black. For the left column, correlations given at the top of each panel are with the Fogt and Connolly (2021) dataset during 1905–2020, and trends at the bottom are calculated for the 1905–2020 period. For the right column panels, the correlations are with the observations, and both correlations and trends are calculated during 1945–2020. In all panels, correlations and trends are color-coded based on the time series color in the legend, with values significantly different from zero at p<0.05 and p<0.01 marked with an asterisk (*) and double asterisk (), respectively.
To further evaluate these datasets, annual mean comparisons with select observations are conducted in Fig. 12 using the grid points nearest to the station locations (for reference, a map of the stations is provided in the legend of Fig. 12). In the full period 1905–2000 (left column), correlations of the paleo-based datasets with the FC21_STAT dataset are generally near zero and only significant (here, p<0.01) over the West Antarctic continent at Byrd station (Fig. 12a). The correlations with the observations (right column in Fig. 12, near the start of data at Faraday), now most significant at p<0.01, are generally higher than with FC21_STAT, especially for the OCON21_ASSIM dataset. The inclusion of more proxy data in the OCON21_ASSIM dataset (Fig. 2c) and the inclusion of an anthropogenically forced prior (Table 1) likely lead to overall better agreement with the observations than for the DAL21_ASSIM dataset; however, both of these paleo-assimilation datasets use a moderately coarse-spatial-resolution prior that may limit their comparison at a single point. It is also important to note that while the FC21_STAT correlations are overall higher than the other reconstructions, this dataset is calibrated directly to these observations, and for Orcadas, direct observations (and not a reconstruction) are used.
The changes in the linear trends through time across the various datasets (given by the color-coded values at the bottom of each panel) are also noteworthy in Fig. 12. In the full time period (1905–2000, left column of Fig. 12), both the DAL21_ASSIM and OCON21_ASSIM datasets show statistically significant (p<0.01) pressure decreases at Byrd and Halley stations (Fig. 12a and c) but statistically significant (p<0.01) pressure increases at Orcadas (Fig. 12d). The FC21_STAT dataset, in strong contrast, shows significant (p<0.05) pressure increases at Byrd in both time periods (consistent with observations after 1957, Fig. 12a) and only significant (p<0.01) pressure decreases at Halley station after 1945 (Fig. 12c, right column). The much stronger and sometimes differently signed trends in the paleo-assimilation pressure reconstructions compared to the FC21_STAT dataset during 1905–2020, and even with most observations after 1945, are undoubtedly a strong contributor to the differences seen in the Antarctic sea ice extent reconstructions.
Both the Dalaiden et al. (2021a) and O'Connor et al. (2021a) studies focus on marked pressure decreases in the region of the Amundsen Sea low, which, as discussed earlier, has a strong role in regional sea ice conditions examined in this study (Hosking et al., 2013; Raphael et al., 2016; Holland and Kwok, 2012). It is much more challenging to investigate the reality of these long-term changes in this region, as there are no direct observations (the closest stations are represented by those in Fig. 12). Further, the FC21_STAT dataset shows the lowest skill (compared to the ERA-Interim reanalysis) spatially in this region (Fogt et al., 2019), consistent with the fact that even contemporary reanalyses show the greatest disparity (in terms of pressure correlations and trends) in this region as well (Fogt et al., 2018). Given the disparities in trends seen from observation locations in Fig. 12, it is not surprising that the datasets also have dramatically different trends in this region, which have similar implications for differences in sea ice extent trends. To visualize this in perspective, a full spatial comparison across the Southern Hemisphere of the pressure trends in the various datasets in three time periods, along with available observations, is provided in Fig. 13.
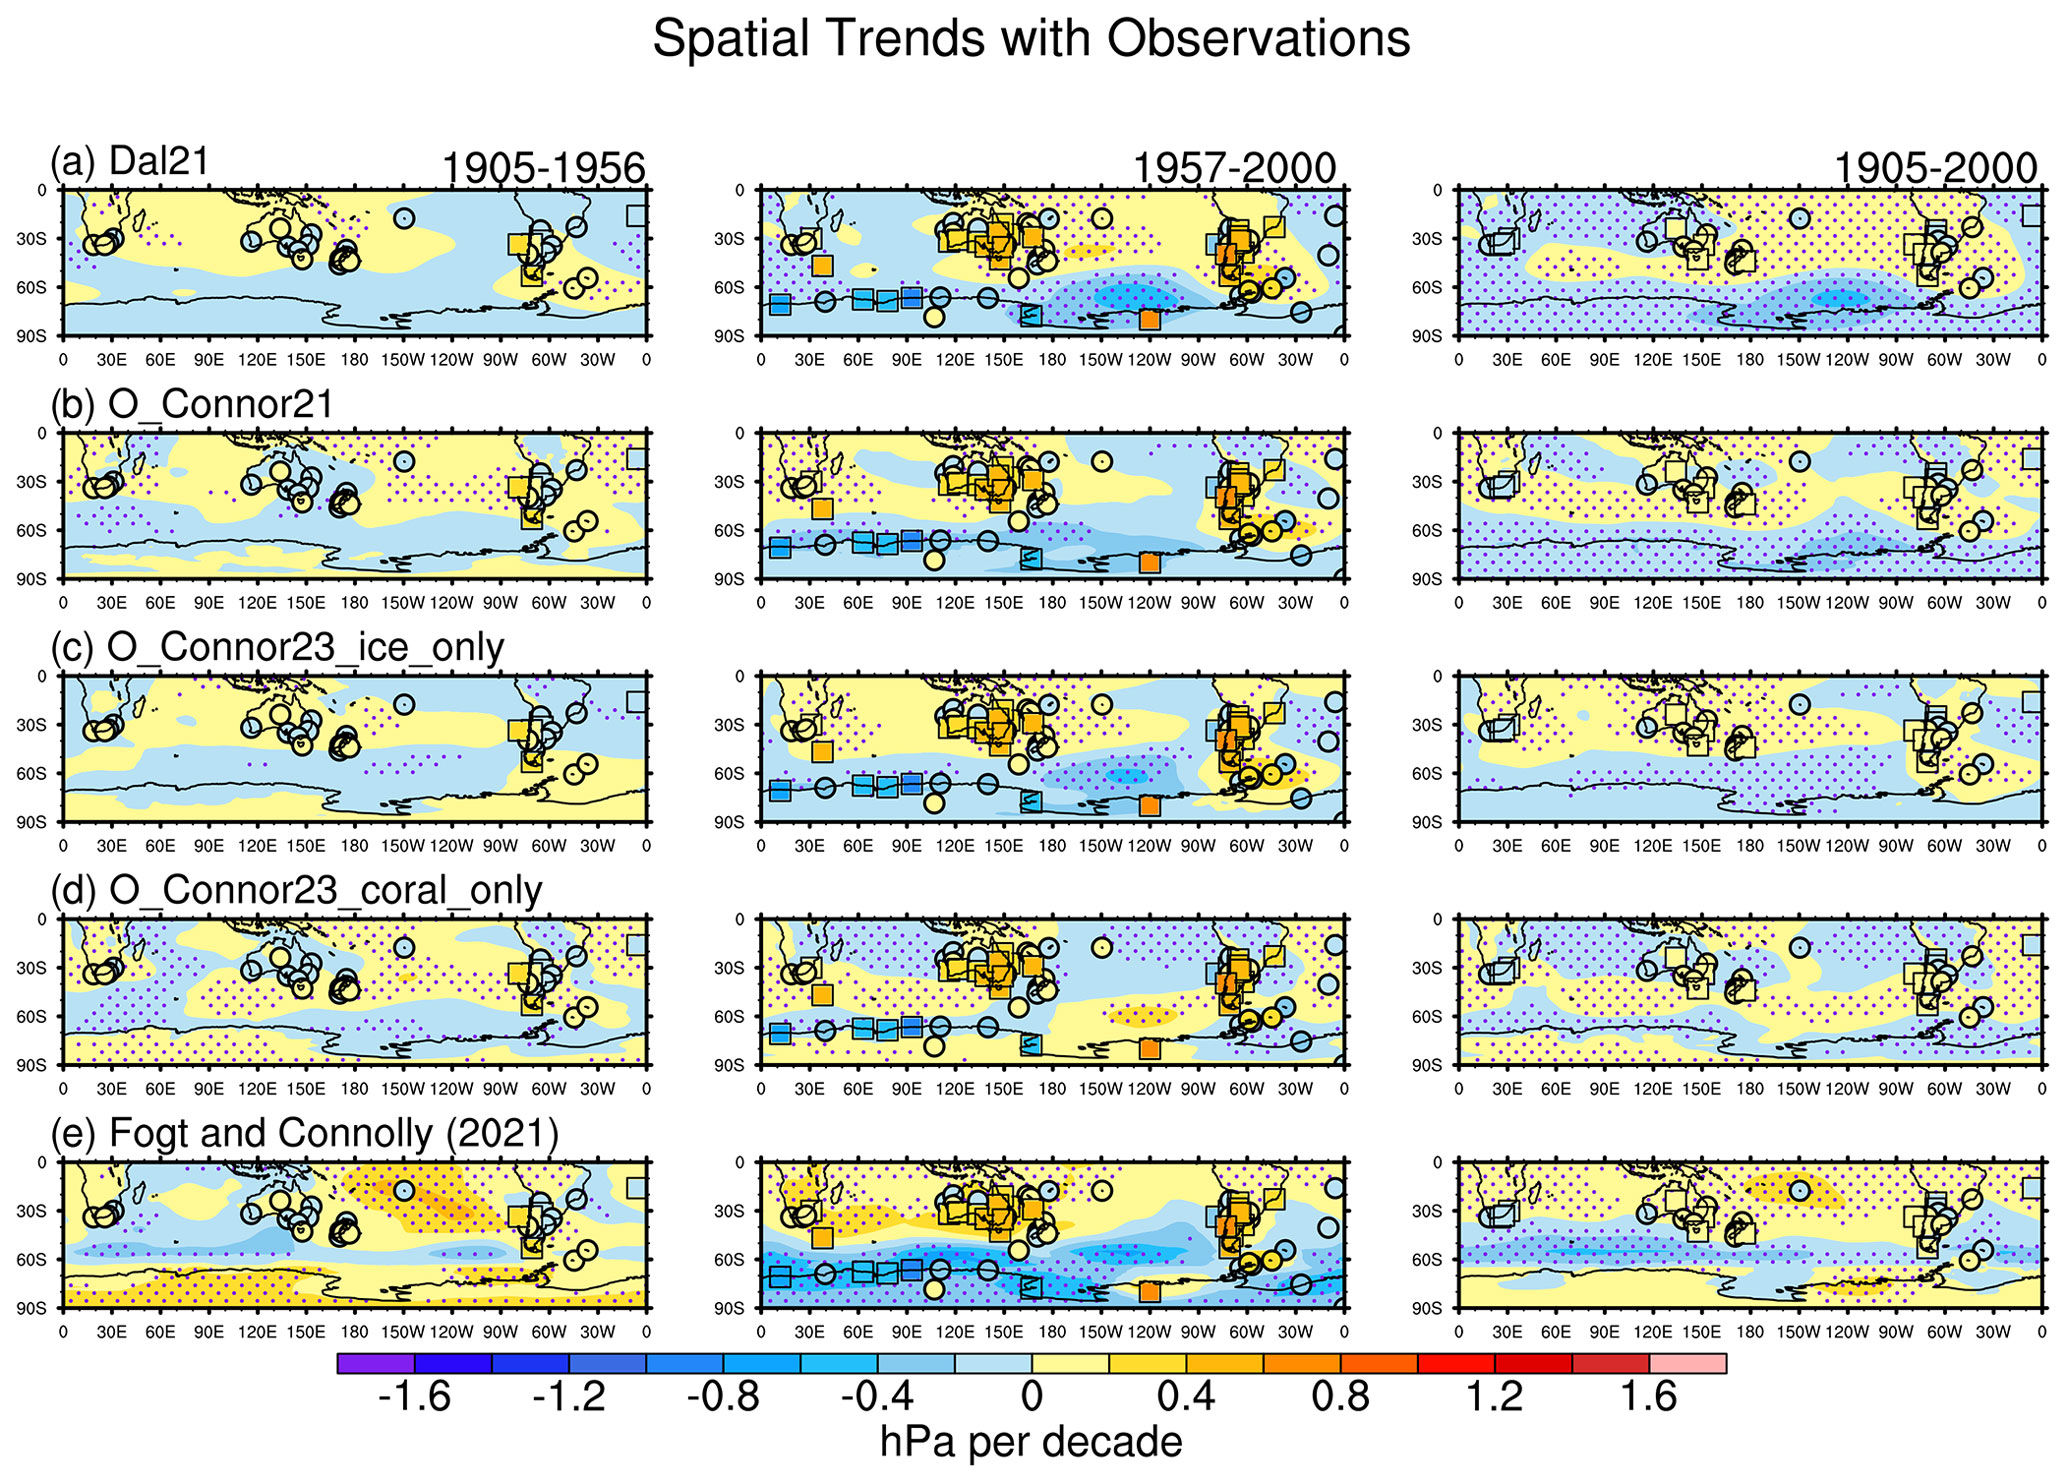
Figure 13Linear near-surface annual mean pressure trends (hPa per decade) for 1905–1956 (left column panels), 1957–2000 (middle column panels), and 1905–2000 (right column panels) for various datasets in each row: (a) Dalaiden et al. (2021a); (b) O'Connor et al. (2021a) proxy reconstruction; (c) O'Connor et al. (2023a) reconstruction with only ice core proxies; (d) O'Connor et al. (2023a) reconstruction with only coral proxies; (e) Fogt and Connolly (2021) station-based reconstruction. Trends from observation data, where available, are plotted using the same color scale on top of the gridded pressure trends. Stippling indicates gridded pressure trends significantly different from zero at p<0.05, and boxes indicate trends in observations significantly different from zero at p<0.05.
First, for the period of Antarctic observations (1957–2000, middle column of Fig. 13), observations indicate statistically significant (boxes, p<0.05) pressure decreases only over coastal East Antarctica, with insignificant positive annual mean trends over the East Antarctic plateau at Vostok (78.5∘ S, 106.9∘ E, the only observation plotted in central East Antarctica in Fig. 13), consistent with ERA5 surface pressure trends during 1979–2022 in Fig. 1b. At Byrd station in central West Antarctica, statistically significant positive trends (annual mean) are observed (also seen in Fig. 12a). The various datasets capture these patterns to differing degrees. Paleo-data assimilation datasets generally only have statistically significant negative trends along the Antarctic coastline, consistent with the positive annual mean SAM trend (Fogt and Marshall, 2020), but only capture positive trends in the Antarctic interior in the coral-only reconstruction (middle column Fig. 13a–d). Indeed, the coral-only reconstruction has positive pressure trends everywhere over Antarctica, except along the Antarctic Peninsula and Weddell Sea (Fig. 13d, middle column), and is therefore the only dataset to miss the observed significant negative pressure trends along the East Antarctic coastline. Meanwhile, the FC21_STAT dataset is the only one to have significant (p<0.05) negative, instead of the observed positive, pressure trends over the East Antarctic plateau, but it does capture a regional pressure increase in West Antarctica (Fig. 13e, middle column, Fig. 12). The DAL21_ASSIM dataset has a marked significant deepening of the Amundsen Sea low during 1957–2000 (Fig. 13a, middle column), which is largely driven by ice core paleo-data (Fig. 2b) and thus reduced in the OCON21_ASSIM dataset by the inclusion of coral data (Figs. 13b–d and 2c). This suggests that if the significant pressure increases over West Antarctica are correct, there might be a tropical signal, either internal or forced, to these positive trends (to be discussed in more detail later). In the midlatitudes during 1957–2000, the coral-only reconstruction (Fig. 13d) captures the pattern seen in observations the best (the FC21_STAT dataset is not independent of observations in these locations since it is merely the 20th century reanalysis north of 60∘ S, Table 1). It should be noted that there are large inconsistencies between observations at Tahiti in the central tropical Pacific and the 20CRv3, as discussed in FC21_STAT.
Figure 13 clearly demonstrates the difference in trends in 1905–1956 between the FC21_STAT dataset and those of DAL21_ASSIM and OCON21_ASSIM. Pressure trends over the Antarctic continent reverse in the FC21_STAT dataset (significantly positive in early 20th century, Fig. 13e left column, significantly negative in late 20th century, Fig. 13e right column), while they remain insignificant in most paleo-assimilation datasets. It is interesting, however, that the coral-only reconstruction from OCON23_ASSIM (Fig. 13d) also produces statistically significant positive trends over Antarctica in all time periods, consistent with the FC21_STAT dataset during 1905–1956 and aligning with the period when these two datasets agree the most (Figs. 11 and 12). Notably, this coral-only dataset agrees the best with observations in the midlatitudes during 1905–1956 (Fig. 13d, left column) and is quite similar to the pattern in the early 20th century from the full OCON21_ASSIM dataset in the midlatitudes (Fig. 13b, left column), suggesting a primary role of the coral records in constraining the solution in the midlatitudes.
The larger sample size afforded by the full time period from 1905–2000 yields more statistically significant trends across the Southern Hemisphere in the paleo-data assimilation datasets (Fig. 13a–d, right column) that are overall similar in structure to the trends in the paleo-based datasets during 1957–2000 (Fig. 13a–d, middle column). The coral-only dataset produces slightly better agreement with the midlatitude observations, capturing the significant negative trends over southern Africa that are also hinted at by insignificant negative pressure trends at Perth in southwestern Australia. In comparing the paleo-based with the station-based FC21_STAT datasets, the biggest differences are the trends poleward of 60∘ S, which are insignificant except for pressure increases (p<0.05) over West Antarctica in the FC21_STAT dataset due to the cancellation of different trends in the early and late 20th century in this dataset (Fig. 13e). Compared to the other sources of differences in the Antarctic sea ice reconstructions examined earlier, this connection to the implied changes (or lack thereof) in the atmospheric circulation in the 20th century are a dominant contributing factor to the differences in the linear trends among the Antarctic sea ice estimates seen in Fig. 2; this similar conclusion was reached in Fogt et al. (2022b) using a much more limited analysis.
While this study largely focuses on causes of the differences between various sea ice and pressure reconstructions, it is important to note that there are broad similarities as well, especially in the Weddell sector where cross-correlations are strongest, even stronger in some seasons than in the annual mean. Further, each of these datasets has their own limitations due to their methodology and assumptions made in their reconstruction procedure, as well as the fact that every reconstruction is only an estimate and is not without error. Nonetheless, the differences in the sea ice extent reconstruction trends (and, to a lesser degree, the interannual variability) largely appear to hinge on whether or not there was a change in the atmospheric circulation in the high southern latitudes (poleward of 60∘ S) in the 20th century. Paleo-assimilation reconstructions, constrained by ice core records over Antarctica, have similar pressure trends through time, which influence the proxy-based sea ice extent reconstructions. In contrast, station-based reconstructions of both pressure and Antarctic sea ice extent show trends that change through time, which reduces their similarities with proxy-based reconstructions (for both sea ice extent and pressure) in the early 20th century. Given that coral-only reconstructions from OCON23_ASSIM agree better with the FC21_STAT dataset in the early 20th century, it is possible that if there was indeed a reversal of atmospheric circulation trends, there was a tropical association with them. Nonetheless, the analysis here shows an important influence of the implied atmospheric circulation on Antarctic sea ice variations in both proxy-based and station-based sea ice extent reconstructions, consistent with findings from observations and models (Sun and Eisenman, 2021; Blanchard-Wrigglesworth et al., 2021).
In looking more closely at the analysis presented here, the limited observational data always present a challenge. In particular, in the vicinity of the Amundsen Sea low, Byrd station in West Antarctica (see map in Fig. 12) is the only observational record spanning over 30 years in the 150–90∘ W sector poleward of 60∘ S (not including the South Pole). Importantly, this merged observation record shows statistically significant (p<0.05) annual mean pressure increases from 1957–2000, while the positive pressure trends at Vostok station in East Antarctica are not significant. While there has been considerable work done to patch the temperature record at this station (Bromwich et al., 2013), there could be measurement-specific errors that lead to the statistically significant positive trend at this station in the observational dataset that may at least partially explain the regional differences in pressure (across West Antarctica and extending northward into the Amundsen and Bellingshausen Sea) between the paleo-data assimilation pressure datasets and those of FC21_STAT. However, the AWS in the later portion of the record is at a slightly higher elevation than the station observations in the earlier part of the data, which would generate negative pressure trends based on unadjusted instrument elevation changes, opposite to the positive annual mean trends seen here. There is also a strong seasonal pattern to the positive pressure trends over West Antarctica, as shown in Fogt et al. (2018). Further work is needed to investigate the Byrd pressure data source, as well as to employ historical data from ship logbooks and early expeditions (Edinburgh and Day, 2016; De La Mare, 2009; Fogt et al., 2020; Lorrey et al., 2022) to better understand possible atmospheric circulation shifts in the high southern latitudes prior to 1957. Additionally, each kind of observation (e.g., paleo or instrumental observations) has its own advantages and weaknesses. Combining these two sources of information could provide a more accurate reconstruction of historical surface climate changes.
The analysis presented in this paper has evaluated various sea ice extent reconstructions spanning the Ross Sea eastward to the Weddell Sea and pressure reconstructions across the entire Southern Hemisphere to explain the differences between the sea ice extent reconstructions. Overall, better agreement in the sea ice extent reconstructions was found in the Weddell Sea, despite possible changes in the relationship sea ice shared with the atmospheric pressure in this region throughout the 20th century. In the Ross and Bellingshausen seas, the agreement is weaker and appears to be more strongly tied to the atmospheric circulation. For the ice-core-based reconstructions studied here, the TA16_PALEO reconstruction is fairly consistent with other reconstructions in the Ross Sea, while the differing spatial and temporal representation of the AB10_PALEO reconstruction makes it challenging to effectively compare to other datasets. Overall, paleo-data assimilation and station-based pressure reconstructions give notably different trends from the Ross Sea east to the Weddell Sea throughout the 20th century, especially in the vicinity of the Amundsen Sea low, a semi-permanent pressure cell known to strongly modulate Antarctic sea ice in the Ross, Amundsen, and Bellingshausen Sea (Hosking et al., 2013; Raphael et al., 2016). There is often better agreement in OCON21_ASSIM reconstructions based solely on coral proxy data with the FC21_STAT reconstruction, especially in the early 20th century. This likely suggests that in signals from the tropics, which may or may not include external forcing, tropical variability governs the relationships within the FC21_STAT, while reconstructions based on ice cores provide a more local constraint to reconstructions near the Antarctic continent. In the latter half of the 20th century, the warming trend in the tropical Pacific can explain the pressure increases found in the coral-only reconstructions in the South Pacific; however, it is unclear how to reconcile that with the Amundsen Sea low deepening found in the ice-core-only reconstructions and all-proxy reconstructions. The relative contributions of the tropics, local internal variability, and external forcing to historical trends remain highly uncertain and deserve further investigation, in agreement with previous studies (e.g., Holland et al., 2022).
While this study has determined that many of the differences in Antarctic sea ice extent reconstructions are tied primarily to their connection to the underlying atmospheric circulation, it is not able to determine the validity of changes in the atmospheric circulation in the early to mid-20th century. Further data extraction from ship logbooks (Lorrey et al., 2022), new climate model simulations assimilating both paleo-data and observations, and isolated forcing simulations in coupled climate model simulations may help to understand this potential atmospheric circulation change. Nonetheless, this study has helped us to better understand the differences and relative strengths and limitations of not only the Antarctic sea ice reconstructions examined here, but also several pressure reconstructions. It is thus hoped that future users of these valuable datasets will exercise the necessary caution when analyzing them given the knowledge of the processes they represent well and other mechanisms that they may not reproduce as reliably.
The FOGT_STAT sea ice reconstructions can be obtained from the National Snow and Ice Data Center dataset G10039 (https://doi.org/10.7265/55X7-WE68) (Fogt et al., 2023). The Fogt et al. (2019) and Fogt and Connolly (2021) pressure reconstructions can be downloaded from Figshare (https://doi.org/10.6084/m9.figshare.c.6765447.v1, Fogt, 2023). Data for the DAL21_ASSIM sea ice extent and pressure reconstructions are available on Zenodo (https://doi.org/10.5281/ZENODO.4770178, Dalaiden et al., 2021b). The OCON21_ASSIM pressure reconstructions are available on Zenodo (https://doi.org/10.5281/ZENODO.5507606, O'Connor et al., 2021b), and the sensitivity reconstructions from OCON23_ASSIM can also be downloaded from Zenodo (https://doi.org/10.5281/ZENODO.8007655, O'Connor et al., 2023b).
RLF and QD designed the study. All authors contributed to writing and editing the paper, and RLF produced the figures.
The contact author has declared that none of the authors has any competing interests.
Publisher's note: Copernicus Publications remains neutral with regard to jurisdictional claims made in the text, published maps, institutional affiliations, or any other geographical representation in this paper. While Copernicus Publications makes every effort to include appropriate place names, the final responsibility lies with the authors.
Quentin Dalaiden is a research fellow within the F.R.S.-FNRS (Belgium).
This research has been supported by the Office of Polar Programs (grant no. 1744998).
This paper was edited by Christo Buizert and reviewed by two anonymous referees.
Abram, N. J., Thomas, E. R., McConnell, J. R., Mulvaney, R., Bracegirdle, T. J., Sime, L. C., and Aristarain, A. J.: Ice core evidence for a 20th century decline of sea ice in the Bellingshausen Sea, Antarctica, J. Geophys. Res., 115, D23101, https://doi.org/10.1029/2010JD014644, 2010.
Bamber, J. L., Riva, R. E. M., Vermeersen, B. L. A., and LeBrocq, A. M.: Reassessment of the Potential Sea-Level Rise from a Collapse of the West Antarctic Ice Sheet, Science, 324, 901–903, https://doi.org/10.1126/science.1169335, 2009.
Banerjee, A., Fyfe, J. C., Polvani, L. M., Waugh, D., and Chang, K.-L.: A pause in Southern Hemisphere circulation trends due to the Montreal Protocol, Nature, 579, 544–548, https://doi.org/10.1038/s41586-020-2120-4, 2020.
Blanchard-Wrigglesworth, E., Roach, L. A., Donohoe, A., and Ding, Q.: Impact of Winds and Southern Ocean SSTs on Antarctic Sea Ice Trends and Variability, J. Climate, 34, 949–965, https://doi.org/10.1175/JCLI-D-20-0386.1, 2021.
Brady, E., Stevenson, S., Bailey, D., Liu, Z., Noone, D., Nusbaumer, J., Otto-Bliesner, B. L., Tabor, C., Tomas, R., Wong, T., Zhang, J., and Zhu, J.: The Connected Isotopic Water Cycle in the Community Earth System Model Version 1, J. Adv. Model Earth Syst., 11, 2547–2566, https://doi.org/10.1029/2019MS001663, 2019.
Bromwich, D. H., Nicolas, J. P., Monaghan, A. J., Lazzara, M. A., Keller, L. M., Weidner, G. A., and Wilson, A. B.: Central West Antarctica among the most rapidly warming regions on Earth, Nat. Geosci., 6, 139–145, https://doi.org/10.1038/ngeo1671, 2013.
Clark, L. and Fogt, R.: Southern Hemisphere Pressure Relationships during the 20th Century – Implications for Climate Reconstructions and Model Evaluation, Geosciences, 9, 413, https://doi.org/10.3390/geosciences9100413, 2019.
Dalaiden, Q., Goosse, H., Rezsöhazy, J., and Thomas, E. R.: Reconstructing atmospheric circulation and sea-ice extent in the West Antarctic over the past 200 years using data assimilation, Clim. Dynam., 57, 3479–3503, https://doi.org/10.1007/s00382-021-05879-6, 2021a.
Dalaiden, Q., Goosse, H., Rezsohazy, J., and Thomas, E.: Reconstructing atmospheric circulation and sea-ice extent in the West Antarctic over the past 200 years using data assimilation, Zenodo [data set], https://doi.org/10.5281/ZENODO.4770178, 2021b.
De La Mare, W. K.: Changes in Antarctic sea-ice extent from direct historical observations and whaling records, Climatic Change, 92, 461–493, https://doi.org/10.1007/s10584-008-9473-2, 2009.
Ding, Q., Steig, E. J., Battisti, D. S., and Küttel, M.: Winter warming in West Antarctica caused by central tropical Pacific warming, Nat. Geosci., 4, 398–403, https://doi.org/10.1038/ngeo1129, 2011.
Edinburgh, T. and Day, J. J.: Estimating the extent of Antarctic summer sea ice during the Heroic Age of Antarctic Exploration, The Cryosphere, 10, 2721–2730, https://doi.org/10.5194/tc-10-2721-2016, 2016.
Fogt, R.: Antarctic Seasonal Pressure Reconstructions, figshare [data set], https://doi.org/10.6084/M9.FIGSHARE.C.6765447.V1, 2023.
Fogt, R. L. and Connolly, C. J.: Extratropical Southern Hemisphere Synchronous Pressure Variability in the Early Twentieth Century, J. Climate, 34, 5795–5811, https://doi.org/10.1175/JCLI-D-20-0498.1, 2021.
Fogt, R. L. and Marshall, G. J.: The Southern Annular Mode: Variability, trends, and climate impacts across the Southern Hemisphere, WIREs Clim. Change, 11, e652, https://doi.org/10.1002/wcc.652, 2020.
Fogt, R. L., Goergens, C. A., Jones, M. E., Witte, G. A., Lee, M. Y., and Jones, J. M.: Antarctic station-based seasonal pressure reconstructions since 1905: 1. Reconstruction evaluation: Antarctic Pressure Evaluation, J. Geophys. Res.-Atmos., 121, 2814–2835, https://doi.org/10.1002/2015JD024564, 2016a.
Fogt, R. L., Jones, J. M., Goergens, C. A., Jones, M. E., Witte, G. A., and Lee, M. Y.: Antarctic station-based seasonal pressure reconstructions since 1905: 2. Variability and trends during the twentieth century, J. Geophys. Res.-Atmos., 121, 2836–2856, https://doi.org/10.1002/2015JD024565, 2016b.
Fogt, R. L., Goergens, C. A., Jones, J. M., Schneider, D. P., Nicolas, J. P., Bromwich, D. H., and Dusselier, H. E.: A twentieth century perspective on summer Antarctic pressure change and variability and contributions from tropical SSTs and ozone depletion, Geophys. Res. Lett., 44, 9918–9927, https://doi.org/10.1002/2017GL075079, 2017.
Fogt, R. L., Clark, L. N., and Nicolas, J. P.: A New Monthly Pressure Dataset Poleward of 60∘ S since 1957, J. Climate, 31, 3865–3874, https://doi.org/10.1175/JCLI-D-17-0879.1, 2018.
Fogt, R. L., Schneider, D. P., Goergens, C. A., Jones, J. M., Clark, L. N., and Garberoglio, M. J.: Seasonal Antarctic pressure variability during the twentieth century from spatially complete reconstructions and CAM5 simulations, Clim. Dynam., 1435–1452, https://doi.org/10.1007/s00382-019-04674-8, 2019.
Fogt, R. L., Belak, C. P., Jones, J. M., Slivinski, L. C., and Compo, G. P.: An Assessment of Early 20th Century Antarctic Pressure Reconstructions using Historical Observations, Int. J. Climatol., E672–E689, https://doi.org/10.1002/joc.6718, 2020.
Fogt, R. L., Sleinkofer, A. M., Raphael, M. N., and Handcock, M. S.: A regime shift in seasonal total Antarctic sea ice extent in the twentieth century, Nat. Clim. Change, 12, 54–62, https://doi.org/10.1038/s41558-021-01254-9, 2022a.
Fogt, R. L., Dalaiden, Q., and Zarembka, M. S.: Understanding differences in Antarctic sea-ice-extent reconstructions in the Ross, Amundsen, and Bellingshausen seas since 1900, PAGES Mag., 30, 74–75, https://doi.org/10.22498/pages.30.2.74, 2022b.
Fogt, R. L., Raphael, M. N., and Handcock, M. S.: Seasonal Antarctic Sea Ice Extent Reconstructions, 1905–2020, Version 1, NSIDC [data set], https://doi.org/10.7265/55X7-WE68, 2023.
Goosse, H., Crespin, E., De Montety, A., Mann, M. E., Renssen, H., and Timmermann, A.: Reconstructing surface temperature changes over the past 600 years using climate model simulations with data assimilation, J. Geophys. Res., 115, D09108, https://doi.org/10.1029/2009JD012737, 2010.
Goyal, R., Jucker, M., Sen Gupta, A., and England, M. H.: Generation of the Amundsen Sea Low by Antarctic Orography, Geophys. Res. Lett., 48, e2020GL091487, https://doi.org/10.1029/2020GL091487, 2021.
Hakim, G. J., Emile-Geay, J., Steig, E. J., Noone, D., Anderson, D. M., Tardif, R., Steiger, N., and Perkins, W. A.: The last millennium climate reanalysis project: Framework and first results, J. Geophys. Res.-Atmos., 121, 6745–6764, https://doi.org/10.1002/2016JD024751, 2016.
Hobbs, W. R., Massom, R., Stammerjohn, S., Reid, P., Williams, G., and Meier, W.: A review of recent changes in Southern Ocean sea ice, their drivers and forcings, Global Planet. Change, 143, 228–250, https://doi.org/10.1016/j.gloplacha.2016.06.008, 2016.
Holland, P. R.: The seasonality of Antarctic sea ice trends, Geophys. Res. Lett., 41, 4230–4237, https://doi.org/10.1002/2014GL060172, 2014.
Holland, P. R. and Kwok, R.: Wind-driven trends in Antarctic sea-ice drift, Nat. Geosci., 5, 872–875, https://doi.org/10.1038/ngeo1627, 2012.
Holland, P. R., O'Connor, G. K., Bracegirdle, T. J., Dutrieux, P., Naughten, K. A., Steig, E. J., Schneider, D. P., Jenkins, A., and Smith, J. A.: Anthropogenic and internal drivers of wind changes over the Amundsen Sea, West Antarctica, during the 20th and 21st centuries, The Cryosphere, 16, 5085–5105, https://doi.org/10.5194/tc-16-5085-2022, 2022.
Hosking, J. S., Orr, A., Marshall, G. J., Turner, J., and Phillips, T.: The Influence of the Amundsen–Bellingshausen Seas Low on the Climate of West Antarctica and Its Representation in Coupled Climate Model Simulations, J. Climate, 26, 6633–6648, https://doi.org/10.1175/JCLI-D-12-00813.1, 2013.
Jones, J. M., Gille, S. T., Goosse, H., Abram, N. J., Canziani, P. O., Charman, D. J., Clem, K. R., Crosta, X., de Lavergne, C., Eisenman, I., England, M. H., Fogt, R. L., Frankcombe, L. M., Marshall, G. J., Masson-Delmotte, V., Morrison, A. K., Orsi, A. J., Raphael, M. N., Renwick, J. A., Schneider, D. P., Simpkins, G. R., Steig, E. J., Stenni, B., Swingedouw, D., and Vance, T. R.: Assessing recent trends in high-latitude Southern Hemisphere surface climate, Nat. Clim. Change, 6, 917–926, https://doi.org/10.1038/nclimate3103, 2016.
King, J. C., Turner, J., Colwell, S., Lu, H., Orr, A., Phillips, T., Hosking, J. S., and Marshall, G. J.: Inhomogeneity of the surface air temperature record from Halley, Antarctica, J. Climate, 4771–4783, https://doi.org/10.1175/JCLI-D-20-0748.1, 2021.
Lachlan-Cope, T. and Connolley, W.: Teleconnections between the tropical Pacific and the Amundsen-Bellinghausens Sea: Role of the El Niño/Southern Oscillation, J. Geophys. Res.-Atmos., 111, D23101, https://doi.org/10.1029/2005JD006386, 2006.
Li, X., Cai, W., Meehl, G. A., Chen, D., Yuan, X., Raphael, M., Holland, D. M., Ding, Q., Fogt, R. L., Markle, B. R., Wang, G., Bromwich, D. H., Turner, J., Xie, S.-P., Steig, E. J., Gille, S. T., Xiao, C., Wu, B., Lazzara, M. A., Chen, X., Stammerjohn, S., Holland, P. R., Holland, M. M., Cheng, X., Price, S. F., Wang, Z., Bitz, C. M., Shi, J., Gerber, E. P., Liang, X., Goosse, H., Yoo, C., Ding, M., Geng, L., Xin, M., Li, C., Dou, T., Liu, C., Sun, W., Wang, X., and Song, C.: Tropical teleconnection impacts on Antarctic climate changes, Nat. Rev. Earth Environ., 2, 680–698, https://doi.org/10.1038/s43017-021-00204-5, 2021.
Lorrey, A. M., Pearce, P. R., Allan, R., Wilkinson, C., Woolley, J.-M., Judd, E., Mackay, S., Rawhat, S., Slivinski, L., Wilkinson, S., Hawkins, E., Quesnel, P., and Compo, G. P.: Meteorological data rescue: Citizen science lessons learned from Southern Weather Discovery, Patterns, 3, 100495, https://doi.org/10.1016/j.patter.2022.100495, 2022.
Meier, W., Fetterer, F., Windnagel, A., and Stewart, S.: NOAA/NSIDC Climate Data Record of Passive Microwave Sea Ice Concentration, Version 4, NSIDC [data set], https://doi.org/10.7265/EFMZ-2T65, 2021.
Murphy, E. J., Clarke, A., Symon, C., and Priddle, J.: Temporal variation in Antarctic sea-ice: analysis of a long term fast-ice record from the South Orkney Islands, Deep-Sea Res. Pt. I, 42, 1045–1062, https://doi.org/10.1016/0967-0637(95)00057-D, 1995.
Murphy, E. J., Clarke, A., Abram, N. J., and Turner, J.: Variability of sea-ice in the northern Weddell Sea during the 20th century, J. Geophys. Res.-Oceans, 119, 4549–4572, https://doi.org/10.1002/2013JC009511, 2014.
O'Connor, G. K., Steig, E. J., and Hakim, G. J.: Strengthening Southern Hemisphere Westerlies and Amundsen Sea Low Deepening Over the 20th Century Revealed by Proxy-Data Assimilation, Geophys. Res. Lett., 48, e2021GL095999, https://doi.org/10.1029/2021GL095999, 2021a.
O'Connor, G. K., Steig, E. J., and Hakim, G. J.: Southern Hemisphere winds, pressure, and temperature over the 20th century from proxy-data assimilation, Zenodo [data set], https://doi.org/10.5281/ZENODO.5507606, 2021b.
O'Connor, G. K., Holland, P. R., Steig, E. J., Dutrieux, P., and Hakim, G. J.: Characteristics and rarity of the strong 1940s westerly wind event over the Amundsen Sea, West Antarctica, The Cryosphere, 17, 4399–4420, https://doi.org/10.5194/tc-17-4399-2023, 2023a.
O'Connor, G. K., Holland, P. R., Steig, E. J., Dutrieux, P., and Hakim, G. J.: 20th century winds, pressure, and temperature around Antarctica from single-proxy data assimilation, Zenodo [data set], https://doi.org/10.5281/ZENODO.8007655, 2023b.
PAGES2k Consortium, Emile-Geay, J., McKay, N. P., Kaufman, D. S., Von Gunten, L., Wang, J., Anchukaitis, K. J., Abram, N. J., Addison, J. A., Curran, M. A. J., Evans, M. N., Henley, B. J., Hao, Z., Martrat, B., McGregor, H. V., Neukom, R., Pederson, G. T., Stenni, B., Thirumalai, K., Werner, J. P., Xu, C., Divine, D. V., Dixon, B. C., Gergis, J., Mundo, I. A., Nakatsuka, T., Phipps, S. J., Routson, C. C., Steig, E. J., Tierney, J. E., Tyler, J. J., Allen, K. J., Bertler, N. A. N., Björklund, J., Chase, B. M., Chen, M.-T., Cook, E., De Jong, R., DeLong, K. L., Dixon, D. A., Ekaykin, A. A., Ersek, V., Filipsson, H. L., Francus, P., Freund, M. B., Frezzotti, M., Gaire, N. P., Gajewski, K., Ge, Q., Goosse, H., Gornostaeva, A., Grosjean, M., Horiuchi, K., Hormes, A., Husum, K., Isaksson, E., Kandasamy, S., Kawamura, K., Kilbourne, K. H., Koç, N., Leduc, G., Linderholm, H. W., Lorrey, A. M., Mikhalenko, V., Mortyn, P. G., Motoyama, H., Moy, A. D., Mulvaney, R., Munz, P. M., Nash, D. J., Oerter, H., Opel, T., Orsi, A. J., Ovchinnikov, D. V., Porter, T. J., Roop, H. A., Saenger, C., Sano, M., Sauchyn, D., Saunders, K. M., Seidenkrantz, M.-S., Severi, M., Shao, X., Sicre, M.-A., Sigl, M., Sinclair, K., St. George, S., St. Jacques, J.-M., Thamban, M., Kuwar Thapa, U., Thomas, E. R., Turney, C., Uemura, R., Viau, A. E., Vladimirova, D. O., Wahl, E. R., White, J. W. C., Yu, Z., and Zinke, J.: A global multiproxy database for temperature reconstructions of the Common Era, Sci. Data, 4, 170088, https://doi.org/10.1038/sdata.2017.88, 2017.
Parkinson, C. L.: A 40-y record reveals gradual Antarctic sea ice increases followed by decreases at rates far exceeding the rates seen in the Arctic, P. Natl. Acad. Sci. USA, 116, 14414–14423, https://doi.org/10.1073/pnas.1906556116, 2019.
Polvani, L. M., Waugh, D. W., Correa, G. J. P., and Son, S.-W.: Stratospheric Ozone Depletion: The Main Driver of Twentieth-Century Atmospheric Circulation Changes in the Southern Hemisphere, J. Climate, 24, 795–812, https://doi.org/10.1175/2010JCLI3772.1, 2011.
Raphael, M. N. and Hobbs, W.: The influence of the large-scale atmospheric circulation on Antarctic sea ice during ice advance and retreat seasons, Geophys. Res. Lett., 41, 5037–5045, https://doi.org/10.1002/2014GL060365, 2014.
Raphael, M. N., Marshall, G. J., Turner, J., Fogt, R. L., Schneider, D., Dixon, D. A., Hosking, J. S., Jones, J. M., and Hobbs, W. R.: The Amundsen Sea Low: Variability, Change, and Impact on Antarctic Climate, B. Am. Meteorol. Soc., 97, 111–121, https://doi.org/10.1175/BAMS-D-14-00018.1, 2016.
Rignot, E., Jacobs, S., Mouginot, J., and Scheuchl, B.: Ice-Shelf Melting Around Antarctica, Science, 341, 266–270, https://doi.org/10.1126/science.1235798, 2013.
Rignot, E., Mouginot, J., Scheuchl, B., van den Broeke, M., van Wessem, M. J., and Morlighem, M.: Four decades of Antarctic Ice Sheet mass balance from 1979–2017, P. Natl. Acad. Sci. USA, 116, 1095–1103, https://doi.org/10.1073/pnas.1812883116, 2019.
Schneider, D. P. and Deser, C.: Tropically driven and externally forced patterns of Antarctic sea ice change: reconciling observed and modeled trends, Clim. Dynam., 50, 4599–4618, https://doi.org/10.1007/s00382-017-3893-5, 2018.
Schneider, D. P. and Fogt, R. L.: Artifacts in Century-Length Atmospheric and Coupled Reanalyses Over Antarctica Due to Historical Data Availability, Geophys. Res. Lett., 45, 964–973, https://doi.org/10.1002/2017GL076226, 2018.
Slivinski, L. C., Compo, G. P., Whitaker, J. S., Sardeshmukh, P. D., Giese, B. S., McColl, C., Allan, R., Yin, X., Vose, R., Titchner, H., Kennedy, J., Spencer, L. J., Ashcroft, L., Brönnimann, S., Brunet, M., Camuffo, D., Cornes, R., Cram, T. A., Crouthamel, R., Domínguez-Castro, F., Freeman, J. E., Gergis, J., Hawkins, E., Jones, P. D., Jourdain, S., Kaplan, A., Kubota, H., Le Blancq, F., Lee, T., Lorrey, A., Luterbacher, J., Maugeri, M., Mock, C. J., Moore, G. W. K., Przybylak, R., Pudmenzky, C., Reason, C., Slonosky, V. C., Smith, C., Tinz, B., Trewin, B., Valente, M. A., Wang, X. L., Wilkinson, C., Wood, K., and Wyszyn'ski, P.: Towards a more reliable historical reanalysis: Improvements for version 3 of the Twentieth Century Reanalysis system, Q. J. Roy. Meteorol. Soc., 145, 2876–2908, https://doi.org/10.1002/qj.3598, 2019.
Smith, B., Fricker, H. A., Gardner, A. S., Medley, B., Nilsson, J., Paolo, F. S., Holschuh, N., Adusumilli, S., Brunt, K., Csatho, B., Harbeck, K., Markus, T., Neumann, T., Siegfried, M. R., and Zwally, H. J.: Pervasive ice sheet mass loss reflects competing ocean and atmosphere processes, Science, 368, 1239–1242, https://doi.org/10.1126/science.aaz5845, 2020.
Steig, E. J., Ding, Q., White, J. W. C., Küttel, M., Rupper, S. B., Neumann, T. A., Neff, P. D., Gallant, A. J. E., Mayewski, P. A., Taylor, K. C., Hoffmann, G., Dixon, D. A., Schoenemann, S. W., Markle, B. R., Fudge, T. J., Schneider, D. P., Schauer, A. J., Teel, R. P., Vaughn, B. H., Burgener, L., Williams, J., and Korotkikh, E.: Recent climate and ice-sheet changes in West Antarctica compared with the past 2,000 years, Nat. Geosci., 6, 372–375, https://doi.org/10.1038/ngeo1778, 2013.
Steiger, N. J., Smerdon, J. E., Cook, E. R., and Cook, B. I.: A reconstruction of global hydroclimate and dynamical variables over the Common Era, Sci. Data, 5, 180086, https://doi.org/10.1038/sdata.2018.86, 2018.
Stenni, B., Curran, M. A. J., Abram, N. J., Orsi, A., Goursaud, S., Masson-Delmotte, V., Neukom, R., Goosse, H., Divine, D., van Ommen, T., Steig, E. J., Dixon, D. A., Thomas, E. R., Bertler, N. A. N., Isaksson, E., Ekaykin, A., Werner, M., and Frezzotti, M.: Antarctic climate variability on regional and continental scales over the last 2000 years, Clim. Past, 13, 1609–1634, https://doi.org/10.5194/cp-13-1609-2017, 2017.
Sun, S. and Eisenman, I.: Observed Antarctic sea ice expansion reproduced in a climate model after correcting biases in sea ice drift velocity, Nat. Commun., 12, 1060, https://doi.org/10.1038/s41467-021-21412-z, 2021.
Thomas, E. R. and Abram, N. J.: Ice core reconstruction of sea ice change in the Amundsen-Ross Seas since 1702 A.D., Geophys. Res. Lett., 43, 5309–5317, https://doi.org/10.1002/2016GL068130, 2016.
Thomas, E. R., Van Wessem, J. M., Roberts, J., Isaksson, E., Schlosser, E., Fudge, T. J., Vallelonga, P., Medley, B., Lenaerts, J., Bertler, N., Van Den Broeke, M. R., Dixon, D. A., Frezzotti, M., Stenni, B., Curran, M., and Ekaykin, A. A.: Regional Antarctic snow accumulation over the past 1000 years, Clim. Past, 13, 1491–1513, https://doi.org/10.5194/cp-13-1491-2017, 2017.
Thomas, E. R., Allen, C. S., Etourneau, J., King, A. C. F., Severi, M., Winton, V. H. L., Mueller, J., Crosta, X., and Peck, V. L.: Antarctic Sea Ice Proxies from Marine and Ice Core Archives Suitable for Reconstructing Sea Ice over the Past 2000 Years, Geosciences, 9, 506, https://doi.org/10.3390/geosciences9120506, 2019.
Turner, J., Colwell, S. R., Marshall, G. J., Lachlan-Cope, T. A., Carleton, A. M., Jones, P. D., Lagun, V., Reid, P. A., and Iagovkina, S.: The SCAR READER project: Toward a high-quality database of mean Antarctic meteorological observations, J. Climate, 17, 2890–2898, https://doi.org/10.1175/1520-0442(2004)017<2890:TSRPTA>2.0.CO;2, 2004.
Turner, J., Phillips, T., Marshall, G. J., Hosking, J. S., Pope, J. O., Bracegirdle, T. J., and Deb, P.: Unprecedented springtime retreat of Antarctic sea ice in 2016: The 2016 Antarctic Sea Ice Retreat, Geophys. Res. Lett., 44, 6868–6875, https://doi.org/10.1002/2017GL073656, 2017.
Turner, J., Marshall, G. J., Clem, K., Colwell, S., Phillips, T., and Lu, H.: Antarctic temperature variability and change from station data, Int. J. Climatol., 40, 2986–3007, https://doi.org/10.1002/joc.6378, 2020.
Turner, J., Holmes, C., Caton Harrison, T., Phillips, T., Jena, B., Reeves-Francois, T., Fogt, R., Thomas, E. R., and Bajish, C. C.: Record Low Antarctic Sea Ice Cover in February 2022, Geophys. Res. Lett., 49, e2022GL098904, https://doi.org/10.1029/2022GL098904, 2022.
Wang, J., Luo, H., Yang, Q., Liu, J., Yu, L., Shi, Q., and Han, B.: An Unprecedented Record Low Antarctic Sea-ice Extent during Austral Summer 2022, Adv. Atmos. Sci., 39, 1591–1597, https://doi.org/10.1007/s00376-022-2087-1, 2022.
Widmann, M., Goosse, H., Van Der Schrier, G., Schnur, R., and Barkmeijer, J.: Using data assimilation to study extratropical Northern Hemisphere climate over the last millennium, Clim. Past, 6, 627–644, https://doi.org/10.5194/cp-6-627-2010, 2010.
Zazulie, N., Rusticucci, M., and Solomon, S.: Changes in Climate at High Southern Latitudes: A Unique Daily Record at Orcadas Spanning 1903–2008, J. Climate, 23, 189–196, https://doi.org/10.1175/2009JCLI3074.1, 2010.