the Creative Commons Attribution 4.0 License.
the Creative Commons Attribution 4.0 License.
Decoupling of δ18O from surface temperature in Antarctica in an ensemble of historical simulations
Sentia Goursaud Oger
Louise C. Sime
Max Holloway
Stable water isotopes recorded in Antarctic ice cores have traditionally been used to infer past surface air temperatures (SATs). During the historical period (1850 onward), observational data and good-quality ice core records overlap, yielding an opportunity to investigate key relationships between ice core stable water isotope (δ18O) measurements and the Antarctic climate. We present a new ensemble of climate model simulations covering 1851–2004 using the UK Met Office HadCM3 general circulation model equipped with stable water isotopes. Our ensemble captures observed historical SAT and precipitation trends and weak δ18O trends. The weak δ18O trends mean there is no significant relationship between SAT and δ18O over one-third of Antarctica, and also half of our considered ice core sites, though relationships are stronger when using regional averages. The strongest regional relationships occur in the West Antarctic Ice Sheet (WAIS) region. This decoupling between SAT and δ18O occurs primarily because of the impact of autumnal sea ice loss during the simulated warming. The warming and sea ice loss are associated with (i) changes in near-coastal air mass intrusions (synoptic effects) induced by changes in the large-scale circulation and/or sea ice; (ii) direct sea-ice-driven changes in moisture pathways (especially lengths) to Antarctica; and (iii) precipitation seasonality changes, again mostly driven by sea ice changes. Consequently, when reconstructing temperatures over these timescales, changes in sea ice need to be considered, both to determine the most appropriate SAT and δ18O relationship and to understand how uncertainties affect the inference of past temperature from ice core δ18O measurements.
- Article
(6885 KB) - Full-text XML
- BibTeX
- EndNote
Strong visible signs of Antarctic response to climate change have recently emerged. While a new sea ice cover minimum was recorded in February 2022 (Raphael and Handcock, 2022; Turner et al., 2022), with an extent of 1.97 million km2, this record was broken the following year with sea ice extent falling to 1.91 million km2 on 13 February 2023, associated with strong westerly winds and a 1.5 °C positive anomaly for Antarctic Peninsula air temperatures. The collapse of Antarctic ice shelves has similarly increased in frequency (Graham et al., 2022; Milillo et al., 2022; Wille et al., 2022). The consequent weakening of the buttressing force from the sea-ice-free areas and ice shelf collapse acts to accelerate Antarctic ice loss. Thus, the warming of Antarctica will have significant consequences for the global and regional mean sea level (Edwards et al., 2021; Seroussi et al., 2020; Parsons et al., 2020; Garbe et al., 2020) alongside consequences for Antarctic life and its environs (Golledge et al., 2019; Post et al., 2019), which require thought about adaptation (IPCC, 2022).
The relatively short satellite record (only since 1979) and the sparsity of in situ observational data from Antarctica mean that reconstruction of past temperature change is important for understanding natural variability and hence for our ability to detect anthropogenic climate change in Antarctica (Turner et al., 2004; Casado et al., 2023). Our understanding of pre-industrial climate change and its variability is mostly based on the reconstruction of temperature from proxy data (PAGES 2k Consortium, 2019). In Antarctica, stable water isotopes are the measurement most commonly used to reconstruct past surface air temperatures (SATs). This type of reconstruction is generally based on an empirical relationship between present-day (PD) surface snow water isotopes and surface air temperature (Dansgaard, 1953). The relationship between SAT and the ratio of heavy-water to light-water isotopes (expressed as δ18O) from Antarctic surface snow is usually assumed to be linear. When this linear relationship is used to estimate past SAT values from ice core water isotope measurements, it is sometimes referred as the “isotopic palaeothermometer” (Lorius et al., 1969; Masson et al., 2000).
The isotopic palaeothermometer approach has been successfully applied to deep ice cores to reconstruct past temperatures on long timescales (Jouzel et al., 2007; Lambert et al., 2008; Masson-Delmotte et al., 2010; Wolff et al., 2010). Casado et al. (2023) recently reconstructed the past 1000-year temperature record using an isotope-to-temperature conversion. This ice-core-based record was then used to show that the simulated temperature variability from the atmospheric general circulation models (AGCMs) run in the frame of the Coupled Model Intercomparison Project (CMIP) phases 5 (Taylor et al., 2012) and 6 (Eyring et al., 2016) is too low. The isotopic palaeothermometer relationship has been shown to vary spatially over the Antarctic continent (e.g. Sime et al., 2008, 2009a). Goosse et al. (2012), PAGES 2k-PMIP3 group (2015), and Neukom et al. (2018) show that noise and the spatial coverage of δ18O and other proxy data affect our understanding of these variations, while Goursaud et al. (2018, 2019) and others show smaller, or less reliable, changes in δ18O for a given temperature change in coastal regions (Isaksson and Karlén, 1994; Sime et al., 2008, 2009a; Abram et al., 2013; Thomas et al., 2013; Goursaud et al., 2017). Data to investigate SAT–δ18O relationships are sparse (Masson-Delmotte et al., 2008; Landais et al., 2017); nevertheless, the PAGES 2k Network Antarctica2k (A2k) helped to address this question of geographical variations in the SAT–δ18O relationship by defining regions and compiling the available δ18O data from ice cores (Stenni et al., 2017).
The geographical variability in the isotopic palaeothermometer is due to controls on δ18O rather than related to SAT. These other controls include changes related to atmospheric dynamics, such as changes in the synoptic and seasonal nature of precipitation (van Ommen and Morgan, 1997; Krinner and Werner, 2003; Jouzel et al., 2003; Sime et al., 2008; Servettaz et al., 2023b) and air mass sources (Landais et al., 2021); various impacts from changes in Antarctic ice sheet morphology (Holloway et al., 2016; Werner et al., 2018; Buizert et al., 2021; Goursaud et al., 2021); and sea ice variability (Holloway et al., 2018; Cauquoin et al., 2023). The stability of the SAT–δ18O relationship has thus been of much interest for more than 2 decades (Jouzel et al., 2003). Following Sime et al. (2008) and Sime et al. (2009a), the importance of changes in synoptic events in the context of the anthropogenic warming was recently explored by Wille et al. (2019) and Pohl et al. (2021), who confirm that the impact of synoptic changes on the SAT–δ18O relationship can be important for the past palaeothermometer during warm climates (Dalaiden et al., 2020).
AGCMs equipped with stable water isotopes are a key tool to investigate the climate processes driving temporal variability in the palaeothermometer relationship (e.g. Werner et al., 2001; Sime et al., 2008; Werner et al., 2018). For instance, AGCM isotopic studies have focused on the effects of external forcing on the SAT–δ18O relationship, including elevation and greenhouse gases across a range of timescales (e.g. Sime et al., 2009b; Werner et al., 2018; Goursaud et al., 2021). A major result is that, for differing timescales and driving mechanisms, different SAT–δ18O relationships can be obtained. This emphasises the importance of investigating the impact of atmospheric dynamical drivers, particularly changes in sea ice and precipitation seasonality during past warm periods in Antarctica (Sime et al., 2008, 2009b; Holloway et al., 2016). Only one AGM study has investigated the signature of stable water isotopes in historical simulations (Yoshimura et al., 2008). While the applicability of the Antarctic palaeothermometer relationship has been investigated across various timescales, it has not yet been thoroughly investigated over the historical period. Furthermore, it has not been investigated using transient historical (1851–2004) simulations.
Here, we run an ensemble of transient historical (1851–2004) simulations, using the stable-water-isotope-enabled coupled general circulation model, HadCM3. This ensemble provides a benchmark of historical precipitated stable water isotopes covering the whole continent and allows the SAT–δ18O relationship over the historical period to be investigated. Firstly, we examine trends in SAT, precipitation, and δ18O and compare these against observed trends. We then examine SAT–δ18O relationships, including regional patterns, and the question of model dependence. Finally, in order to understand the drivers of δ18O change, we perform a detrended composite analysis for cold- and warm-year ensembles and quantify the impact of seasonality changes in precipitation and δ18O. This analysis provides an understanding of SAT–δ18O variability and, in particular, the role of sea ice change in this relationship during the historical period.
2.1 Model and simulations
Here, we use the Hadley Centre atmosphere–ocean general circulation model (AOGCM), HadCM3, to run six transient historical simulations, HadCM3 is a version of the coupled atmosphere–ocean UK Met Office climate model (Pope et al., 2000; Gordon et al., 2000), which means that sea ice is prognostic.. The model is equipped with stable water isotopes (Tindall et al., 2009). Its horizontal resolution is 3.75°×2.5°, and there are 19 vertical levels (Pope et al., 2000; Gordon et al., 2000; Tindall et al., 2009).
The setup of the historical simulations is described in Schurer et al. (2014) and follows the recommendations of the third Paleoclimate Modelling Intercomparison Project (PMIP3; Schmidt et al., 2011). Each simulation is forced with time-varying orbital, solar, volcanic, land-use, and well-mixed greenhouse gas forcing. As above, sea ice is not prescribed but rather calculated by the model. Changes in orbital parameters were calculated following Berger (1978). Volcanic forcing is that described in Crowley et al. (2008). The solar forcing follows Shapiro et al. (2011). Changes in CO2, N2O, and CH4 were set following the PMIP3 standard (Schmidt et al., 2011). Changes in the abundances of six halocarbons were prescribed following Tett et al. (2007). Changes in land cover were prescribed by reclassifying the global land cover reconstruction developed by Pongratz et al. (2008). Each of our simulations were only altered by starting each simulation 1 year apart.
We analyse HadCM3 surface air temperature (SAT; °C), precipitation (P; mm per month), precipitation-weighted δ18O (δ18O), and sea ice extent (defined as the region of ice-covered ocean where the sea ice concentration is >15 %). HadCM3 provides a reasonable representation of Antarctic climate and δ18O (Appendix A and Turner et al., 2006; Tindall et al., 2009; Holloway et al., 2016).
2.2 Data and methods
We perform a model–data comparison using the Stenni et al. (2017) ice core data compiled by the PAGES A2k project by binning our model output, including δ18O, into 5-year-equivalent averages and compute anomalies relative to the 1960–1990 mean. In order to investigate the historical mean climate state and variability, we compute ensemble mean values covering the period 1851–2004 using monthly outputs. Trends over the whole period and for the last 50 years are calculated using linear regressions. Where we regress climate variables against δ18O, the linear regressions are computed using the stacked individual ensemble members rather than using the ensemble mean. This approach ensures that the ensemble variability is included in our linear regression statistics and increases the number of points on which the regressions are processed. Gradients from the linear regressions are provided with a plus/minus standard error. Results from linear relationships are stated only where they are significant, using a p-value ≤ 0.05.
Our historical SAT–δ18O linear relationship at the regional scale is compared with the regional slopes and correlation coefficients that we computed from the AGCM ECHAM6-wiso equipped with water stable isotopes (Cauquoin et al., 2019). The water stable module of this last generation of the model ECHAM was updated compared to its predecessor, especially (i) the supersaturation parameters; (ii) the kinetic fractionation at the evaporation over oceans, now assumed to be independent of the wind speed in order to better represent the d-excess versus deuterium relationship from the Antarctic Snow reported by Masson-Delmotte et al. (2008); and finally (iii) the sublimation processes now accounting for the isotopic content of snow over sea ice. Here, we use a simulation run at a T127L95 resolution ( horizontal resolution and 95 vertical levels) and nudged towards the ERA5 reanalyses (Hersbach et al., 2020) over the period 1979–2022 (Cauquoin and Werner, 2021).
Composites are used to interpret our results. Warm and cold (versus mean) annual composites results are defined using detrended annual area-weighted SAT. The years of the ensemble mean with SAT below (above) the mean minus (plus) 1 standard deviation constitute a cold (warm) ensemble.
To examine the impact of changing seasonality over the historical period, we isolate the impact of precipitation and δ18O seasonal changes, recorded in the ensemble mean, on the precipitation-weighted δ18O between the first 50 years of the simulation and the last 50 years of the simulations (see Liu and Battisti, 2015; Holloway et al., 2016; Sime et al., 2019). This is calculated as
The summations, with index j, are over the 12 months of the year. Variables with superscript “recent” indicate that they were extracted for the last 50 years of the simulation, whereas the variables without superscript indicate that the variables were extracted for the first 50 years of the simulation.
This section uses these model data and methods to examine trends in Antarctic SAT, precipitation, sea ice, and δ18O, including at the continental and regional scale; relationships between temperature versus δ18O, including their stability and model dependency; and, finally, the drivers of δ18O changes.
3.1 Trends in Antarctic SAT, precipitation, sea ice, and δ18O
We analyse our simulations against available observations and reanalysis data, e.g. the Climate Forecast System Reanalysis (CFSR) and the National Centers for Environmental Prediction reanalyses 2 (NCEP-2), at the Antarctic scale before evaluating regional-scale climate changes. This is followed by a comparison of simulated δ18O changes against the Stenni et al. (2017) ice core dataset. We note that all trends outlined below are similar regardless of whether we use the full historical period or the last 50 years of the ensemble simulations. Nevertheless, to permit the most direct comparison where possible, we have matched our calculations to the periods used by other authors.
3.1.1 Continental trends in climate
Our simulated SAT trend over Antarctica is 0.12±0.02 °C per decade over the last 50 years (Fig. 1). This is consistent with observations of 0.12±0.07 °C per decade over 1957–2006 (Steig et al., 2009) and 0.11±0.08 °C per decade over 1959–2012 (Nicolas and Bromwich, 2014). Our trend is lower than the 0.22±0.04 °C trend of Casado et al. (2023); however, this is itself dependent on their isotope-to-temperature reconstruction method. Over East Antarctica, our simulated historical SAT trend is weaker (0.10±0.02 °C per decade; r=0.59) than over West Antarctica (0.15±0.02 °C per decade; r=0.75). This compares with 0.10±0.07 °C per decade for the east and 0.17±0.06 °C per decade for the west calculated by Steig et al. (2009).
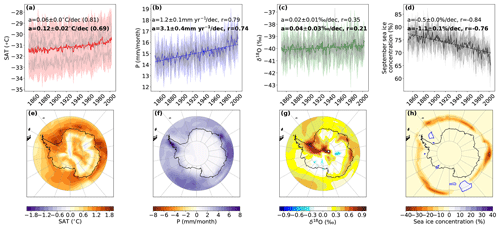
Figure 1Antarctic trends over the periods 1851–2004 and 1955–2004. Each column is associated to a climate variable: (a, e) surface air temperature (SAT in °C, in red), (b, f) precipitation (P in mm per month, in blue), (c, g) δ18O (in ‰, in green), and (d, h) sea ice concentration (SIC in %, in grey). Panels (a)–(d) display the time series of Antarctic surface-weighted averages over the period 1851–2004. Solid coloured lines represent the annual average of the ensemble mean, the coloured surfaces represent the annual standard deviations of the ensemble mean, the solid grey lines represent the simulations, and the dashed lines represent the linear regressions. The slopes (a) plus or minus the standard errors and the correlation coefficients (r) are given in the top right of the figures, with the first row corresponding to the whole historical period 1851–2004 and the second row, in bold, to the last 50 years 1955–2004. Panels (e)–(h) display the maps of anomalies over the period 1955–2004 against 1854–1904.
Our simulated historical precipitation trend over the last 50 years is 3.1 mm yr−1 per decade (Fig. 1), which lies between the admittedly wide Bromwich et al. (2011) reanalysis-based equivalent values of 0.4±1.8 mm yr−1 per decade from the Climate Forecast System Reanalysis (CFSR), and 7.1±1.5 mm yr−1 per decade from the National Centers for Environmental Prediction reanalysis 2 (NCEP-2) over 1979–2009. The HadCM3 results are also in agreement with Dalaiden et al. (2020), who show an increase in both West and East Antarctic Ice Sheet (WAIS and EAIS)-simulated precipitation.
Our HadCM3-simulated historical Antarctic September sea ice decrease is km2 per decade over the period 1851–2004 () and km2 per decade over the period 1954–2004 (r=0.67). This is consistent with the recent results of Shu et al. (2020), who calculated Antarctic September sea ice trends of −0.45 and km2 per decade during the period 1979–2005 from the Coupled Model Intercomparison Project (CMIP) 5 and 6 model results respectively. Whilst neither the Shu et al. (2020) nor our HadCM3 sea ice trends match the observed slope of km2 per decade (p=0.16) (Shu et al., 2020), they do agree with each other. It is also worth noting that, since 2016, Antarctic sea ice has begun losing significant area during both summer and winter.
The simulated historical changes in Antarctic-wide SAT and precipitation and sea ice thus seem in reasonable agreement with other model results and possibly also observations (though this is less clear). Trends, however, vary between regions.
3.1.2 Regional-scale trends
We now look at the simulated climate, using the Antarctic regions defined by the PAGES A2k community (see Fig. 2, regions defined by Stenni et al., 2017). Every Antarctic region shows a simulated increase in SAT over the historical period (1851–2004; Fig. 2), but these vary across the continent. Warming trends are strongest for the Peninsula and Dronning Maud Land regions (0.11 °C per decade and r≥0.8), closely followed by the WAIS and the Weddell coast regions (0.08 °C per decade and r≥0.8). The Plateau and the Indian coast show weaker warming trends of 0.04 and 0.05 °C per decade respectively (r=0.6 for both). These historical trends approximately match the Turner et al. (2020) results derived from station data.
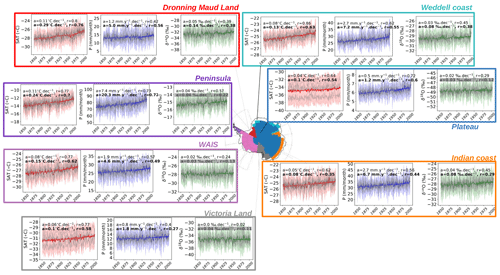
Figure 2Regional trends over the periods 1851–2005 and 1955–2005. Time series of surface-weighted averages of (a) surface air temperature (SAT in °C, in red), (b) precipitation (P in mm per month, in blue), (c) δ18O (in ‰, in green), and (d) sea ice concentration (SIC in %, in grey) over the period 1851–2005 for the different Antarctic regions as defined by Stenni et al. (2017). Solid coloured lines represent the annual average of the ensemble mean, the coloured surfaces represent the annual standard deviations of the ensemble mean, the solid grey lines represent the simulations, and the dashed lines represent the linear regressions. The slopes (a) and the correlation coefficients (r) are given in the top right of the figures. The first row reports the regional slope and correlation coefficient over the whole historical period, while the second row reports the regional slope and correlation coefficient over the last simulated years. Shaded grey rows correspond to non-significant relationships (p-value > 0.05).
Our simulated SAT trends resemble the Stenni et al. (2017) regional warming trends. Stenni et al. (2017) found cooling trends for the Plateau, the Weddell coast, and Victoria Land (from −0.13 to −0.05 °C per decade), where we found a small warming. They found a larger trend for the Peninsula (from 0.2 to 0.29 °C per decade), though, again, we point out that the Stenni et al. (2017) values, like the Casado et al. (2023) results, are partly dependent on isotope-to-temperature reconstruction methods. At the scale of station locations, Jones et al. (2019) also show the highest trends for the Peninsula.
Similarly to SAT, HadCM3 shows an increase in precipitation for all the Antarctic regions, both for the full historical period and for the last 50 years. Similarly to temperature, the Peninsula features the strongest trend of 7.8 mm yr−1 per decade over the historical period, whereas the Plateau and the Ross sections display weaker trends of 0.5 and 0.82 mm yr−1 per decade over the same period. Interestingly, Thomas et al. (2017) and Medley and Thomas (2019) found similar results. Whilst these results are from ice cores, they are not dependent on the interpretation of isotopes; instead, they mostly use profiles of density and layer counting from relevant age markers (e.g. chemical species, radio isotopes, biologically compounds).
For sea ice, HadCM3 simulates a sea ice decrease around all sectors of Antarctica, except for the Weddell sector (Table B1). Trends are largest in the Indian sector ( km2 per decade; ) and smallest in the Pacific sector ( km2 per decade; ). Whilst these results are not compatible with pre-2016 satellite observations, they are consistent with other climate simulations (Shu et al., 2020).
Despite the simulated increases in SAT and precipitation, δ18O simulated by HadCM3 shows a very weak trend of 0.04±0.003 ‰ per decade (r=0.21) over the last 50 years. Interestingly, Casado et al. (2023) provide a higher trend from 1950–2005 of 0.11±0.02 ‰ per decade, based on ice core data. Different reasons, which we are not able to elucidate so far, could explain that mismatch, inter alia, (i) a model discrepancy to resolve processes, (ii) the model resolution, (iii) the geographical distribution of the ice core locations, and (iv) the different methods for the SAT–δ18O calibration. Section 5 of this paper focuses on investigating and explaining the δ18O trends. Before this, we provide a brief overview of the regional picture.
At the regional scale, over the historical period, trends are small (Fig. 2). In terms of linear relationship, it is null for Victoria Land, while the gradient is the highest for the Weddell coast with a trend of 0.05 ‰ per decade (r=0.39) and the correlation coefficient is the highest (e.g. the strongest linear relationship) for the Peninsula with a trend of 0.04 ‰ per decade (r=0.57). Over the last 50 years, only three regions, the Indian, Weddell and Dronning Maud Land coastal regions, keep on displaying significant δ18O trends, which double or more compared to the historical period, with gradients of 0.08 ‰ per decade, 0.08 ‰ per decade, and 0.14 ‰ per decade respectively. Stenni et al. (2017) compiled δ18O trend statistics based on ice core anomalies using unweighted composites over the period 1900–2000, based on 5-year bins. They found only three regions with significant trends, which are the Indian coast, the Peninsula, and Dronning Maud Land, with gradients in the range of our results for the Indian coast and higher gradients for the Peninsula and Dronning Maud Land (mean trends of 0.15 ‰ per decade and 0.11 ‰ per decade respectively). Comparatively, Casado et al. (2023) calculated trends over windows varying between 35 and 60 years and using a persistence method. They found gradients with the same range of values, from 0.09 ‰ for the Indian coast to 0.19 ‰ for the Weddell coast, while they found significant relationships where we do not for time windows varying from 40 to 65 years. Note that, for most of the regions, the significance of our simulated relationships disappears for time windows shorter than 75 years (Appendix D). This could be explained either by the simulated anthropogenic variability being too low, as suggested by Casado et al. (2023), or by a change in the drivers on δ18O. The disparities between our results and the previous studies could be explained by the different time windows, the different methodologies, the lack of ice core data to make representative regional reconstructions, or a model discrepancy. While Casado et al. (2023) carefully investigated the impact of the data stack method and the time window on the δ18O reported trends, we suggest that an extended study could compare the statistical and dynamical methods on both ice core data and water-stable-isotope-enabled AGCM outputs to complete the analysis.
3.2 Temperature versus δ18O relationships
Given that much of ice core science is underpinned by the relationship between temperature and δ18O (Jouzel et al., 2003), and having discussed simulated SAT, precipitation, sea ice, and δ18O trends, we now investigate temperature versus δ18O relationships. Sime et al. (2008) demonstrate that there is no clear relationship between the spatial versus temporal SAT–δ18O gradients across Antarctica. We therefore focus on comparing the last 50 years of our simulations against the whole historical period. To enable a consideration of model dependency, we also compare our historical ensemble against a nudged ECHAM6-wiso simulation (Table 1).
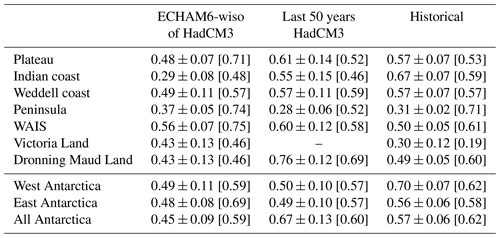
Table 1Historical SAT–δ18O relationships at the regional scale. Slope (in ‰ °C−1) plus or minus the standard error and the correlation coefficient (in brackets) of the surface-weighed average of surface air temperature against the surface-weighed average of δ18O for the Antarctic regions as defined in the PAGES Antarctica2k project (Stenni et al., 2017): the Plateau, the Indian coast, the Weddell coast, the Peninsula, the WAIS, Victoria Land, and Dronning Maud Land. These are simulated by the ECHAM6-wiso model (over the period 1979–2022, 44 points, “ECHAM6-wiso”), by HadCM3 over the last 50 years (1955–2004, 50 points, “last 50 years of HadCM3”), and by HadCM3 over the whole historical simulated period (1851–2004, 154 points, “historical HadCM3”) using the ensemble mean of the six simulations (see Materials and methods). All the relationships are significant (p-values < 0.05).
3.2.1 Antarctic-wide and regional-scale
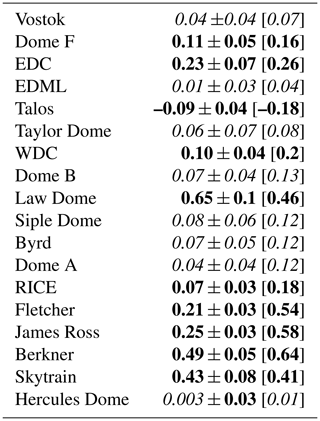
The simulated SAT–δ18O relationship, calculated using annual means on each grid point, is statistically significant over 66 % of Antarctica (Fig. 3). For the continent as a whole, we simulate a mean Antarctic SAT–δ18O gradient of 0.57±0.06 ‰ °C−1 (r=0.62) over the historical period, increasing to 0.67±0.13 (r=0.60) over the last 50 years of the simulation. The comparable numbers for an Antarctic-wide SAT–δ18O relationship in Casado et al. (2023) are 0.49 ‰ °C−1 to 0.69 ‰ °C−1. In our simulations, non-significant SAT–δ18O relationships occur in eastern Antarctica between 40 and 100° E; in all regions between 140 and 220° E covering the Wilkes coast, Victoria Land, and some parts of Queen Mary Land; and on the coast of Dronning Maud Land with some areas at 350–360° E joining the South Pole. Non-significant relationships were also reported in observations and model outputs. For instance, Goursaud et al. (2018) report no SAT–δ18O relationship at the annual scale over the coast of Dronning Maud Land, Victoria Land, some of the Indian coast, and the Peninsula. Results showing the absence of an SAT–δ18O relationship derived from firn/ice cores were also published (e.g. Goursaud et al., 2019; Bertler et al., 2011; Vega et al., 2016; Goursaud et al., 2017). More recently, Casado et al. (2023) also found no significant relationships, though possibly because of a lack of data, for some regions. For them, these regions were the Indian and Weddell coasts and Victoria Land (see section 3.3 for a discussion of why these regions do not show statistically significant temperature versus δ18O relationships.) In contrast, the Peninsula, part of the WAIS coast, and some parts of the Plateau show much stronger SAT–δ18O relationships. Indeed, some coastal areas are associated with the highest correlation coefficients, ranging between 0.15 and 0.45. The highest SAT–δ18O gradients in the Plateau region and south of the Filchner Ice Shelf can exceed 0.75 ‰ °C−1. Casado et al. (2023) also found the largest SAT–δ18O gradients in similar regions.
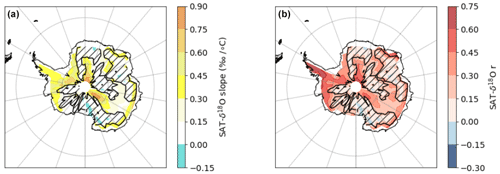
Figure 3Historical SAT–δ18O pattern. The SAT–δ18O slopes (a) and correlation coefficients (b) simulated by HadCM3 over the historical period at the interannual scale at each grid point. Gradients (in ‰ °C−1, A) and correlation coefficients (r) of the SAT–δ18O relationships at the interannual scale (151 points) at each Antarctic grid point and based on the stacked simulations. Regions with hashed black lines indicate the presence of no significant relationships (p-value ≥ 0.05).
This Antarctic-wide picture of geographical variability in the temperature versus δ18O relationship is reasonably consistent with previous studies covering parts of the historical period (Sime et al., 2009a; Stenni et al., 2017; Goursaud et al., 2019) and measurements from coastal firn cores (Isaksson and Karlén, 1994; Abram et al., 2013; Thomas et al., 2013; Goursaud et al., 2017). Interestingly, Guan et al. (2016, 2020) associate similar results (low or negative SAT–δ18O relationships) with higher source temperatures. Here, we suggest this is mainly driven by sea ice retreat (see Sect. 3.3).
3.2.2 Stability over the historical period and model dependency
Results from HadCM3 are similar for both the last 50 years and the whole historical period (Table 1): SAT–δ18O gradients vary between 0.3 ‰ °C−1 and 0.7 ‰ °C−1. The average difference is 0.07 ‰ °C−1. The only region with a statistically different result is Dronning Maud Land, with SAT–δ18O gradients of 0.76±0.12 ‰ °C−1 and 0.49±0.05 ‰ °C−1 over the last 50 years and the whole historical period respectively. Thus, for most of the continent, our HadCM3 results over the last 50 years and the whole historical period appear equivalent.
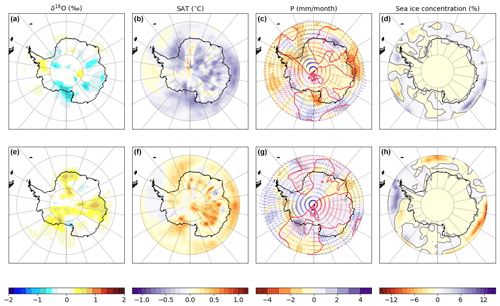
Figure 4Composite maps for cold (a–d) and warm (e–h) years. Maps of Antarctic (a, e) δ18O (in ‰), (b, f) surface air temperature (SAT in °C), (c, g) precipitation (P in mm per month), and (d, h) sea ice concentration (SIC in %) for years with surface air temperatures below (a–d) and above (e–h) 2 standard deviations in the ensemble mean over the period 1851–2004. Maps use the detrended ensemble mean (see Materials and methods). There are 8 years (out of the 155 simulated years) with SAT anomalies out of the plus or minus 2 standard deviations: 4 are above that range, and 4 are below that range. Panels (c) and (g) also show the wind field. Blue (red) arrows indicate southward (northward) winds, and regions of the southward winds are delimited using red contours.
Interestingly, the ECHAM6-wiso SAT–δ18O gradients calculated here are on average 2 times lower than those computed using the ECHAM5-wiso simulations nudged to ERA-interim over the period 1979–2013 and published in Stenni et al. (2017). Thus, the improvements to the ECHAM6 coding seem to bring HadCM3 and ECHAM into alignment (Table 1). We consider these new ECHAM6-wiso and HadCM3 values to likely be more accurate. We can note the small differences between HadCM3 and ECHAM6-wiso: ECHAM6-wiso simulates slightly stronger relationships with a mean correlation coefficient difference of 0.04, while gradients tend to be slightly higher in HadCM3 with a gradient difference of 0.13 ‰ °C−1. The only notable differences are for Dronning Maud Land and the Indian coast, with stronger relationships and higher gradients simulated by HadCM3. Thus, whilst it is unclear whether the nudging of ECHAM6-wiso towards ERA5 reanalysis, the model resolution, the model physics, or the difference in sea ice behaviours is the main reason for these discrepancies, it is clear that simulated temperature versus δ18O relationships have low but significant uncertainties. These need to be considered, both regionally and for the most relevant climate state, before undertaking any inferences of past temperatures using isotopes measured in ice cores.
3.3 Drivers of δ18O changes
We use two approaches to investigate the mechanisms driving simulated δ18O changes. Firstly, we separate and compare extremely warm and cold years for both annual (Fig. 4, Table C1) and seasonal (Fig. 5) data by generating annual and seasonal composites with mean annual Antarctic SAT anomalies greater than plus or minus 2 standard deviations from the mean respectively. Secondly, we isolate the impact of changing precipitation seasonality on δ18O, showing simple month values (Fig. 6) and also following the decomposition method used in Liu and Battisti (2015), Holloway et al. (2016), and Sime et al. (2019) (Fig. 7).
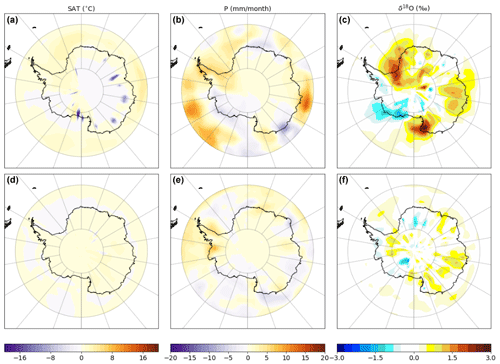
Figure 5Seasonal warm–cold changes. Differences between the warm and cold ensemble means for winter (i.e. June to August, a–c) and summer (i.e. from December to February, d–f) surface air temperature (a, d, SAT in °C), precipitation (b, f, P in mm per month), and precipitated δ18O (c, f, δ18O in ‰).

Figure 6Impact of climate seasonal changes. Seasonal differences in the precipitation (in %), the precipitated δ18O (in ‰), and the sea ice concentration (in %) between the first 50 simulated years and the last 50 simulated years. Light lines correspond to the member simulations, and the dark line corresponds to the ensemble mean.
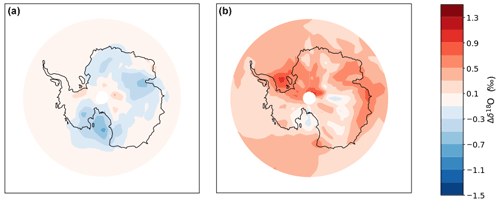
Figure 7The impact of seasonal changes on precipitation and on mean annual δ18O. δ18O changes (Δδ18O in ‰) due to changes in the seasonal cycle of precipitation (a) and due to changes in the seasonal cycle of δ18O (b) between the last 50 simulated years and the first 50 simulated years of the HadCM3 historical mean ensemble. See Materials and methods for details of the decomposition.
As expected, the spatial patterns of SAT and sea ice anomalies tend to vary together, with the pattern being approximately mirrored between cold and warm composites (Fig. 4, top and bottom panels respectively). Whilst fully isolating the drivers of δ18O is tricky, Figs. 4 to 7 suggest that the primary mechanism driving continental-scale SAT–δ18O decoupling in HadCM3 is the simulated loss of sea ice over the historical period (Fig. 5d and h).
The September average sea ice area across the warm composite is 5.8×10⁶ km2 less than in the cold composite. Given that this reduction occurs primarily during winter (Fig. 5c; there is almost no summertime sea ice around Antarctica), warmer years tend to receive relatively more precipitation during winter months compared to cold years, partially offsetting the warming signal in δ18O. This can be seen in Fig. 5, displaying seasonal anomalies (for winter, e.g. from June to August, and for summer, e.g. from December to February) in precipitation, δ18O, and sea ice between the warm and cold composites: the largest (smallest) precipitation and δ18O anomalies occur during the winter (summer) months. Precipitation anomalies peak in autumn and winter, whilst δ18O anomalies peak in winter and spring (Fig. 6), the latter coincident with the annual maximum sea ice extent and largest sea ice area anomalies. The relative increase in winter precipitation during warm years acts to reduce δ18O across Antarctica, compared to if the seasonality of precipitation remained unchanged. This is perhaps seen most clearly in Fig. 7, where Fig. 7a is predominantly blue, which indicates that precipitation seasonality changes are acting to decrease δ18O. The effect of changing seasonality is particularly large in the Indian, Dronning Maud Land, and Victoria Land (through the Wilkes Land) sectors, which are prone to air mass intrusions (Figs. 5c and 7a).
Although the reduction in sea ice area simulated in the warm composite and throughout the historical ensemble increases the proportion of winter precipitation, negatively influencing δ18O, less sea ice also shortens the distance between evaporation source and precipitation site, which has an opposing positive influence on δ18O. This effect is evident as negative sea ice anomalies adjacent to coastal regions with large positive δ18O anomalies in Fig. 7b and in Fig. 5c and f. Sea ice loss may also allow locally sourced precipitation to penetrate further inland into the Antarctic interior, which usually receives precipitation sourced from lower latitudes (Gao et al., 2024), and promote an increase in high-intensity precipitation events during cold seasons (e.g. Schlosser et al., 2004). Consequently, sea ice loss during the historical period leads to competing influences on δ18O and considerable spatial variability in SAT–δ18O relationships (Fig. 3a), with no significant relationship in several regions. Changes in the precipitation seasonality (Fig. 7a) reduce mean Antarctic δ18O by 0.16±0.19 ‰ and for the lowest changes by 0.11 ‰ over the Plateau and no changes over the Peninsula. Changes in the seasonal cycle of δ18O (Fig. 7b) are more spatially variable and largely sea-ice-driven, with a depletion up to −0.45 ‰ over the Plateau and Victoria Land and an enrichment from 0.1 ‰ to 1.0 ‰ in coastal regions.
These historical simulations indicate that Antarctic δ18O is highly sensitive to patterns of sea ice change, which influence atmospheric dynamics, air mass pathways and lengths, and water isotope evaporation and condensation temperatures. Our results are particularly sensitive to autumnal sea ice changes: the largest simulated reduction in sea ice occurs in autumn, coincident with the largest changes in δ18O (Fig. 5c). The dynamic processes behind the δ18O changes induced by sea ice extent are complex and multiple. Although the Southern Annular Mode, the leading mode of the atmospheric variability in the Southern Hemisphere, might explain some of these δ18O-simulated changes (Appendix G), a more comprehensive study might investigate the impact of the atmospheric circulation changes.
Results from six transient simulations over the historical period allow us to examine Antarctic precipitation-weighted δ18O and its relationship with Antarctic SAT. The ensemble features a rise in mean Antarctic SAT of 0.12±0.02 °C per decade over the last 50 years, consistent with previous studies (Steig et al., 2009; Nicolas and Bromwich, 2014). In agreement with observations, the associated simulated trend in the water isotope δ18O is weak ( ‰ per decade). Unlike SAT, the δ18O trend is weaker during the last 50 years compared to the complete historical period. This implies that, over the last 50 years of our ensemble, δ18O is influenced by processes other than SAT-related condensation temperature; i.e. ice and atmospheric processes oppose purely SAT and condensation temperature controls on δ18O.
Although the consequences of these competing effects vary spatially, they result in non-statistically significant relationships between SAT and δ18O for approximately one-third of the continent over the historical ensemble. Non-significant SAT–δ18O relationships occur across much of Antarctica between 40 and 100° E: the Wilkes coast, Victoria Land, part of Queen Mary Land, the coast of Dronning Maud Land, and areas of the South Pole region. Interestingly, we find similar but slightly weaker SAT–δ18O correlations and slightly higher gradients compared to ERA5-nudged ECHAM6-wiso simulations at the regional scale.
We suggest three processes that lead to weak SAT–δ18O relationships during the historical ensemble. Firstly, historical changes in near-coastal air mass intrusions, induced by changes in the large-scale circulation and/or changes in synoptic events, have an impact on both the moisture source and the precipitation regime. Secondly, changes in sea ice concentration impact moisture pathways to Antarctica. Thirdly, changes in precipitation seasonality, largely driven by sea ice changes, bias the relative impact of cold- vs. warm-season precipitation on precipitation-weighted δ18O. Fyke et al. (2017) show similar spatial patterns in Antarctic precipitation during the pre-industrial (Fyke et al., 2017, Fig. 2c), driven by the large-scale circulation and acting to regulate atmospheric moisture transport and regional sea ice variability (Fyke et al., 2017; Marshall et al., 2017; Raphael et al., 2019). Changes in Antarctic sea ice (Holloway et al., 2016) and moisture source changes (Landais et al., 2021) have also been proposed as responsible for driving the Last Interglacial δ18O peak. Additionally, Sime et al. (2008) show that (sea-ice-related) changes in the seasonal and synoptic distribution of Antarctic precipitation were jointly responsible for a partial decoupling between SAT and δ18O. These results support the role of environmental changes, particularly sea ice, generating significant variability in the Antarctic SAT–δ18O relationship.
In conclusion, the results from this isotope-enabled historical ensemble permit investigation of the SAT–δ18O relationship during the historical period and the mechanisms driving its spatial variability. Whilst we recognise the limitations, in terms of spatial resolution and a simplistic sea ice sub-model, of our chosen model, HadCM3, we value the ability to perform a several-member ensemble of >100-year simulations using a fully coupled isotope-enabled model.
For future work, higher-resolution and more physically advanced models could be used, alongside new tracer methods (Gao et al., 2024). Firn models could also be used to examine the interesting question of post-deposition effects, such as the redistribution of snow by the wind (Libois et al., 2014), snow–vapour exchanges (Casado et al., 2016; Ritter et al., 2016), and snow metamorphism (Casado et al., 2021), on historical δ18O. Finally, more stable water isotope records from Antarctic ice and firn core data are more than needed to evaluate models and to lead model–data investigations of past climates, comparing SAT–δ18O relationships from different water-stable-isotope-enabled models, in line with the work of the Stable Water Isotope Intercomparison Group 2 (SWING) (IPCC, 2022).
A1 Method
Here, we check that HadCM3 provides a reasonable representation of the Antarctic surface climate and δ18O.
Surface air temperature (SAT) output data from HadCM3 are evaluated against the AntAWS dataset (Wang et al., 2023), a compilation of Antarctic observations from 267 automatic weather stations (AWSs) operational between some parts of the period from 1980 to 2021. Surface mass balance (SMB) model output, calculated within the model code as precipitation minus evaporation (wind-related processes are not accounted for by HadCM3), are similarly evaluated against AnSMB (Wang et al., 2021), the most recent quality-controlled published SMB compilation extracted from stakes, snow pits, ice cores, ultrasonic sounders, and ground-penetrating radar. Finally, simulated δ18O values are evaluated using the updated database compiled by Goursaud et al. (2018); this combines all available firn, ice core, surface snow, and precipitation observations of Antarctic δ18O.
We show maps and scatter plots (model versus observed values) for SAT, SMB, and δ18O. The comparison helps establish if the model underestimates the real spatial heterogeneity across Antarctica. Mean climatological values (20-year averages or more, averaged over the ensemble wherever possible) were calculated at each model grid point and directly compared to the most equivalent observational climatological value (see paragraph above). The comparison uses output from a closest grid point comparison method.
A2 Results
A2.1 SAT
The evaluation by Turner et al. (2006) of the HadCM3 Antarctic climate, especially including near-surface air temperatures, mean sea level pressures, and geopotential heights, shows a large warm bias in the Antarctic interior associated with a low-biased modelled orographic height (the highest model grid point elevations do not reach 4000 m a.s.l.). This finding remains fully consistent with the newer Wang et al. (2021) observation datasets (Fig. A1). The minimum climatological Antarctic Plateau SAT value is −37.2 °C (Fig. A1a), considerably warmer than the AntAWS minimum of −64.6 °C (Fig. A1c). In regions where the observational temperature is above −30 °C, the model values of SAT match the observations better, although there remains a slightly underestimate (warm bias) in West Antarctica (Fig. A1b and top right of Fig. A1c). Altogether, although the warm bias in the Antarctic interior contributes to weakening the linear regression between the HadCM3 simulations and the observations (correlation coefficient of 0.76), the Antarctic mean simulated SAT is surprisingly good: the Antarctic mean climatological SAT is and in the observations and the HadCM3 model respectively.
A3 SMB
Consistent with previous studies, the SMB is slightly too low in the Antarctic interior in HadCM3 (Turner et al., 2006), suggesting that the warm bias in these regions does not affect the modelled SMB. The largest model SMB errors (dry and wet biases) occur near the coasts (Fig. A2b). The dry biases may be due to the coarse HadCM3 grid, altering a realistic orography and representation of the ascending air masses that provide precipitation to these coastal regions. The coarse model grid biases can be seen in Fig. A2c as a step representation of the black points compared to an expected linear regression. Turner et al. (2006) also attribute the wet coastal biases to an overly intense mean sea level pressure field gradient: stronger air flows than in the observations produce excess precipitation on the western side of the Antarctic Peninsula. These aspects reduce the linear regression correlation (correlation coefficient of 0.70). The Antarctic mean climatological SMB difference between the observations and HadCM3 is −29.7 mm per month.
A4 δ18O
The distribution of the simulated δ18O over Antarctica is similar to observations (Antarctic means of ‰ and ‰ in the observations and the HadCM3 simulations respectively, minimum values of −61.3 ‰ and −57.9 ‰ in the observations and the HadCM3 simulations respectively, and maximum values of −3.2 ‰ and −7.7 ‰ in the observations and the HadCM3 simulations respectively). Excessively depleted values occur in the Antarctic interior (Fig. A3). These are associated with the warm bias. Overly enriched values are observed over the Peninsula and the Weddell Sea coast, consistently with the wet bias in these regions. Nevertheless, the HadCM3 historical simulations do capture the δ18O observations relatively well, as shown by the strong relationship between the outputs and the observations (correlation coefficient of 0.84 and slope of 0.90±0.02 ‰ ‰−1).
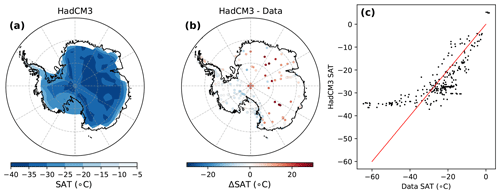
Figure A1Surface air temperature (SAT) evaluation: (a) map of the time-averaged HadCM3 SAT distribution over the Antarctic resulting from the ensemble mean for the historical period (in °C), (b) SAT difference between the time-averaged HadCM3 outputs from the ensemble mean for the historical period and the corresponding SAT observations (in °C), and (c) linear regression between the time-averaged HadCM3 outputs from the ensemble mean for the historical period and the corresponding SAT observations (black points). The red line is a 1:1 data–model slope.
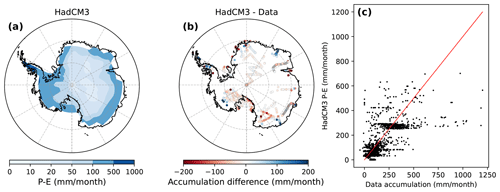
Figure A2Surface mass balance (SMB) evaluation: (a) map of the time-averaged HadCM3 precipitation minus evaporation (P−E) distribution over the Antarctic resulting from the ensemble mean for the historical period (in mm per month), (b) SMB difference between the time-averaged HadCM3 outputs from the ensemble mean for the historical period and the corresponding observations (in mm per month), and (c) linear regression between the time-averaged HadCM3 outputs from the ensemble mean for the historical period and the corresponding SMB observations (black points). The red line is a 1:1 data–model slope.
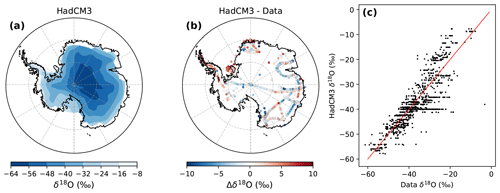
Figure A3δ18O evaluation: (a) map of the time-averaged HadCM3 δ18O distribution over the Antarctic resulting from the ensemble mean for the historical period (in ‰), (b) SMB difference between the time-averaged HadCM3 outputs from the ensemble mean for the historical period and the corresponding observations (in ‰), and (c) linear regression between the time-averaged HadCM3 outputs from the ensemble mean for the historical period and the corresponding δ18O observations (black points). The red line is a 1:1 data–model slope.
Table B1Regional surface air temperature trends (in °C per 100 years): A2k reconstructions over the last 100 years (Stenni et al., 2017), based on the ECHAM5-wiso model and scaled on the climate field reconstruction from Nicolas and Bromwich (2014) (“A2k lower bound” and “A2k upper bound”), and the HadCM3-simulated trends over the whole historical period (1851–2004). The relationships are significant.
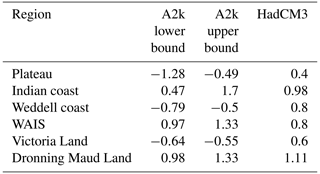
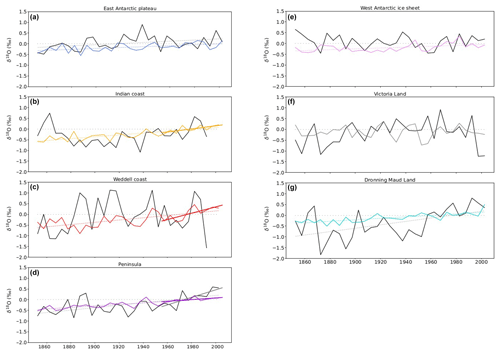
Figure B1Historical δ18O time series based on 5-year bins from ice core data and HadCM3. Time series of Antarctic surface-weighted averages of δ18O (in ‰) based on 5-year bin averages from ice core data (Stenni et al., 2017, solid black lines) and simulated by the HadCM3 model (ensemble mean, coloured lines) for each region of Antarctica as defined in the A2k project over the historical period 1851–2004. Dashed lines correspond to linear regressions.
Table C1Regional sea ice area trends: slope plus or minus the standard error of the slope (in 103 km2 yr−1). The correlation coefficients are given in parentheses. Only significant relationships are given. The sea ice regions are defined in terms of longitude as follows: the Indian sector is limited between 20 and 90° E. The Pacific sector is limited between 90 and 160° E. The Ross sector is limited between 160 and 230° E. The Bellingshausen–Amundsen sector is limited between 230 and 300° E. Finally, the Weddell sector is limited between 300 and 20° E.

Table D1Antarctic regional δ18O trends (Plateau, Indian Coast, Weddell Coast, Peninsula, WAIS, Victoria Land, and Dronning Maud Land, with region delimitations as defined in Stenni et al., 2017) simulated by the HadCM3 model using our historical mean ensemble using different time window lengths: the last 153, 100, 75, 60, 45, and 30 simulated years. The gradient and the standard error of the gradient are given for each linear relationship, associated with the correlation coefficient in brackets. Non-significant relationships are indicated by a dash.

The Southern Annular Mode (SAM) is the leading mode of atmospheric variability in the Southern Hemisphere (Thompson and Wallace, 2000). In particular, it describes the position and the strength of the polar jet position, the southern westerly belt, and the associated storm tracks. A positive (negative) phase of the SAM is associated with an intensified (weakened) poleward (northward) shift of the polar jet. The SAM is thus the preferred studied mode to investigate the Southern Hemisphere teleconnection with lower latitudes.
Here, we used the definition of the SAM index following the approach of Gong and Wang (1999) as the difference between the normalised monthly zonal mean sea level pressure between 40 and 65° S. Here, we used the period 1961–1990 as a reference interval.
where P40 and P65 are the monthly mean sea level pressure at 40 and 65° S, μ40 and μ65 are the mean of the monthly mean sea level pressure at 40 and 65° S over the reference interval 1961–1990, and σ40 and σ65 are the standard deviations of the monthly mean sea level pressure at 40 and 65° S over the reference interval 1961–1990.
We computed the linear regressions between the calculated SAM and our climate variables (Fig. G1): (i) the surface air temperature (SAT), (ii) the precipitation (P), and (iii) the precipitation-weighted δ18O (δ18O). These linear regressions were computed over the whole historical simulated period and for the recent period 1950–2004 at the annual scale. Note that, as in the main text of the paper, we computed these linear regressions using the stack of the ensemble members, resulting in 918 points for the historical period (1851–2004) and 324 points for the period 1950–2004.
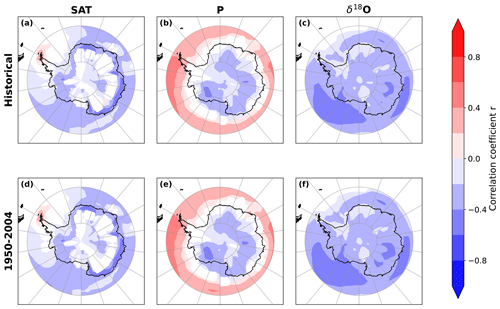
Figure G1Correlation coefficients between the Southern Annular Mode index and the surface air temperature (SAT, a, d), the precipitation (P, b, e), and the precipitation-weighted δ18O (c, e) simulated by the HadCM3 model at the annual scale for the historical period (1851–2004, a–c) and the 1950–2004 period (d–f). Only significant relationships are shown (p-value < 0.05).
Within the frame of the CMIP5 project, the ability of HadCM3 to reproduce the SAM was evaluated (Zheng et al., 2013). As for all the CMIP5 models, HadCM3 overestimates the SAM index variability (Zheng et al., 2013; Zhang et al., 2022). Nevertheless, it reproduces the decadal variability of the SAM index and displays the best correlation coefficient between the modelled and observed detrended SAM index (Zheng et al., 2013).
Previous studies reported, based on observations, that the main Antarctic continent is globally colder and drier while the SAM is in a positive phase, as the stronger southern westerly wind belt reduces the exchanges with warmer air masses from midlatitude regions, with the exception of the Peninsula (Clem et al., 2016). These effects are reproduced in our HadCM3 simulations, as shown by the correlation coefficient values between the SAM and the SAT that are positive over the northern Antarctic Peninsula but negative over the rest of the continent, especially in coastal areas (Fig. G1a and d).
Similarly, it was shown that there is less southward moisture advection towards the Antarctic interior in a positive phase of the SAM, reducing precipitations. In our simulations (Fig. G1b, e), this effect is enhanced over the Antarctic Plateau, Victoria Land, and Marie Byrd Land. Conversely, the Antarctic Peninsula receives more precipitation. However, the discrepancy in the HadCM3 orography disables the “shadow effect”, decreasing precipitation on the eastern part of the Peninsula due to the presence of mountains (Fogt and Marshall, 2020).
The link between water stable isotopes and the SAM is less settled. A couple of publications displayed a correlation between the water stable isotope content in ice cores and the SAM index, but no systematic method allowed an established link. For instance, Servettaz et al. (2023a) suggest some impacts of the SAM on the isotopic content of the Aurora Basin North ice core over the last millennium, although not on the whole length of the core. Also, Vega et al. (2016) suggest that, over the Fimbul Ice Shelf, the absence of correspondence between water stable isotopes and SAT might be explained by changes in atmospheric circulation, supported by a high correlation between d-excess measured in the KM and BI ice cores and the SAM index. Kino et al. (2021) showed the contribution of SAM over precipitation-weighted δ18O at the daily scale simulated by the MIROC5-iso model nudged toward the JRA-25 reanalyses over the period 1981–2010 at Dome Fuji. However, they warn that it does not prevail in all Antarctic locations of the Antarctic Plateau. For instance, Dome C is less sensitive to SAM compared to possible other teleconnection modes (Dreossi et al., 2024). In our simulations, the correlation coefficients between the SAM and precipitation-weighted δ18O are significant and negative over the whole continent (Fig. G1c and f) but remain weak, with a mean of over the historical period and for the period 1950–2004. Thus, from our simulations, we cannot establish a robust link between the SAM and the Antarctic precipitation-weighted δ18O.
However, studying the impact of the atmospheric circulation change on Antarctic precipitation-weighted δ18O should not boil down to the link with the SAM. For instance, only some El Niño–Southern Oscillation (ENSO)/SAM combinations (El Niño/negative SAM and La Niña/positive SAM) contribute to strengthening the Amundsen Sea Low (e.g. Wilson et al., 2016), as observed through the analysis of the Roosevelt Island Climate Evolution (RICE) δ18O (Emanuelsson et al., 2023). SAM-induced processes impacting Antarctic precipitation-weighted δ18O are also not trivial: SAM changes SAT and precipitation regimes but also the sea ice in a more complex manner (Fogt and Marshall, 2020). Other modes affect the Antarctic atmospheric circulation and might explain the δ18O changes, as for the Indian Ocean Dipole in phase with El Niño through the production of atmospheric rivers (Shields et al., 2022).
The code and the simulation outputs can be made available on request.
SGO and LCS co-designed the study. MH ran all simulations. SGO conducted all analyses and produced all figures. SGO and LCS co-wrote the first draft of the paper. All authors contributed to the final version of the paper.
The contact author has declared that none of the authors has any competing interests.
Publisher's note: Copernicus Publications remains neutral with regard to jurisdictional claims made in the text, published maps, institutional affiliations, or any other geographical representation in this paper. While Copernicus Publications makes every effort to include appropriate place names, the final responsibility lies with the authors.
This article is part of the special issue “Ice core science at the three poles (CP/TC inter-journal SI)”. It is not associated with a conference.
We thank Alexandre Cauquoin for providing the ECHAM6-wiso outputs used in this paper. This work has received support from the NERC National Capability International grant SURface FluxEs In AnTarctica (SURFEIT): NE/X009319/1. Louise C. Sime acknowledges additional support from DEEPICE: Understanding Deep Ice Core Proxies to Infer Past Antarctic Climate Dynamics, grant no. EU-H2020 G.N.955750; ANTSIE: ANTarctic Sea Ice Evolution from a novel biological archive, grant no. EU-H2020 G.N.864637; and TiPES: Tipping Points in the Earth System, grant no. EU-H2020 G.N.820970. Simulations were run and analysed on NERC's ARCHER2 and JASMIN platforms.
This research has been supported by the Natural Environment Research Council (grant nos. NE/X009319/1, EU-H2020 G.N.955750, EU-H2020 G.N.864637, and EU-H2020 G.N.820970).
This paper was edited by Alexey Ekaykin and reviewed by Mathieu Casado and one anonymous referee.
Abram, N. J., Mulvaney, R., Wolff, E. W., Triest, J., Kipfstuhl, S., Trusel, L. D., Vimeux, F., Fleet, L., and Arrowsmith, C.: Acceleration of snow melt in an Antarctic Peninsula ice core during the twentieth century, Nat. Geosci., 6, 404–411, 2013. a, b
Berger, A.: Long-term variations of daily insolation and Quaternary climatic changes, J. Atmos. Sci., 35, 2362–2367, 1978. a
Bertler, N., Mayewski, P., and Carter, L.: Cold conditions in Antarctica during the Little Ice Age – Implications for abrupt climate change mechanisms, Earth Planet. Sc. Lett., 308, 41–51, 2011. a
Bromwich, D. H., Nicolas, J. P., and Monaghan, A. J.: An assessment of precipitation changes over Antarctica and the Southern Ocean since 1989 in contemporary global reanalyses, J. Climate, 24, 4189–4209, 2011. a
Buizert, C., Fudge, T., Roberts, W. H., Steig, E. J., Sherriff-Tadano, S., Ritz, C., Lefebvre, E., Edwards, J., Kawamura, K., Oyabu, I., Motoyama, H., Kahle, E. C., Jones, T. R., Abe-Ouchi, Ay., Obase, T., Martin, C., Corr, H., Severinghaus, J. P., Beaudette, R., Epifanio, J. A., Brook, E. J., Martin, K., Chapellaz, J., Aoki, S., Nakazawa, T., Sowers, T. A., Alley, R. B., Ahn, J., Sigl, M., Severi, M., Dunbar, N. W., Svensson, A., Fegyveresi, J. M., He, C., Liu, Z., Zhu, J., Otto-Bliesner, B., Lipenkov, V. Y., Kageyama, M., and Schwander, J.: Antarctic surface temperature and elevation during the Last Glacial Maximum, Science, 372, 1097–1101, 2021. a
Casado, M., Landais, A., Masson-Delmotte, V., Genthon, C., Kerstel, E., Kassi, S., Arnaud, L., Picard, G., Prie, F., Cattani, O., Steen-Larsen, H.-C., Vignon, E., and Cermak, P.: Continuous measurements of isotopic composition of water vapour on the East Antarctic Plateau, Atmos. Chem. Phys., 16, 8521–8538, https://doi.org/10.5194/acp-16-8521-2016, 2016. a
Casado, M., Landais, A., Picard, G., Arnaud, L., Dreossi, G., Stenni, B., and Prie, F.: Water isotopic signature of surface snow metamorphism in Antarctica, Geophys. Res. Lett., 48, e2021GL093382, https://doi.org/10.1029/2021GL093382, 2021. a
Casado, M., Hébert, R., Faranda, D., and Landais, A.: The quandary of detecting the signature of climate change in Antarctica, Nat. Clim. Change, 13, 1082–1088, 2023. a, b, c, d, e, f, g, h, i, j, k
Cauquoin, A. and Werner, M.: High-resolution nudged isotope modeling with ECHAM6-wiso: Impacts of updated model physics and ERA5 reanalysis data, J. Adv. Model. Earth Syst., 13, e2021MS002532, https://doi.org/10.1029/2021MS002532, 2021. a
Cauquoin, A., Werner, M., and Lohmann, G.: Water isotopes – climate relationships for the mid-Holocene and preindustrial period simulated with an isotope-enabled version of MPI-ESM, Clim. Past, 15, 1913–1937, https://doi.org/10.5194/cp-15-1913-2019, 2019. a
Cauquoin, A., Abe-Ouchi, A., Obase, T., Chan, W.-L., Paul, A., and Werner, M.: Effects of Last Glacial Maximum (LGM) sea surface temperature and sea ice extent on the isotope–temperature slope at polar ice core sites, Clim. Past, 19, 1275–1294, https://doi.org/10.5194/cp-19-1275-2023, 2023. a
Clem, K. R., Renwick, J. A., McGregor, J., and Fogt, R. L.: The relative influence of ENSO and SAM on Antarctic Peninsula climate, J. Geophys. Res.-Atmos., 121, 9324–9341, 2016. a
Crowley, T. J., Zielinski, G., Vinther, B., Udisti, R., Kreutz, K., Cole-Dai, J., and Castellano, E.: Volcanism and the little ice age, PAGES News, 16, 22–23, 2008. a
Dalaiden, Q., Goosse, H., Lenaerts, J. T., Cavitte, M. G., and Henderson, N.: Future Antarctic snow accumulation trend is dominated by atmospheric synoptic-scale events, Commun. Earth Environ., 1, 62, https://doi.org/10.1038/s43247-020-00062-x, 2020. a, b
Dansgaard, W.: The abundance of 18O in atmospheric water and water vapour, Tellus, 5, 461–469, 1953. a
Dreossi, G., Masiol, M., Stenni, B., Zannoni, D., Scarchilli, C., Ciardini, V., Casado, M., Landais, A., Werner, M., Cauquoin, A., Casasanta, G., Del Guasta, M., Posocco, V., and Barbante, C.: A decade (2008–2017) of water stable isotope composition of precipitation at Concordia Station, East Antarctica, The Cryosphere, 18, 3911–3931, https://doi.org/10.5194/tc-18-3911-2024, 2024. a
Edwards, T. L., Nowicki, S., Marzeion, B., Hock, R., Goelzer, H., Seroussi, H., Jourdain, N. C., Slater, D. A., Turner, F. E., Smith, C. J., McKenna, C. M., Simon, E., Abe-Ouchi, A., Gregory, J. M., Larour, E., Lipscomb, W. H., Payne, A. J., Shepherd, A., Agosta, C., Alexander, P., Albrecht, T., Anderson, B., Asay-Davis, X., Aschwanden, A., Barthel, A., Bliss, A., Calov, R., Chambers, C., Champollion, N., Choi, Y., Cullather, R., Cuzzone, J., Dumas, C., Felikson, D., Fettweis, X., Fujita, K., Galton-Fenzi, B. K., Gladstone, R., Golledge, N. R., Greve, R., Hattermann, T., Hoffman, M. J., Humbert, A., Huss, M., Huybrechts, P., Immerzeel, W., Kleiner, T., Kraaijenbrink, P., Le clec'h, S., Lee, V., Leguy, G. R., Little, C. M., Lowry, D. P., Malles, J.-H., Martin, D. F., Maussion, F., Morlighem, M., O'Neill, J. F., Nias, I., Pattyn, F., Pelle, T., Price, S. F., Quiquet, A., Radić, V., Reese, R., Rounce, D. R., Rückamp, M., Sakai, A., Shafer, C., Schlegel, N.-J., Shannon, S., Smith, R. S., Straneo, F., Sun, S., Tarasov, L., Trusel, L. D., Van Breedam, J., van de Wal, R., van den Broeke, M., Winkelmann, R., Zekollari, H., Zhao, C., Zhang, T., and Zwinger, T.: Projected land ice contributions to twenty-first-century sea level rise, Nature, 593, 74–82, 2021. a
Emanuelsson, B. D., Renwick, J. A., Bertler, N. A., Baisden, W. T., and Thomas, E. R.: The role of large-scale drivers in the Amundsen Sea Low variability and associated changes in water isotopes from the Roosevelt Island ice core, Antarctica, Clim. Dynam., 60, 4145–4155, 2023. a
Eyring, V., Bony, S., Meehl, G. A., Senior, C. A., Stevens, B., Stouffer, R. J., and Taylor, K. E.: Overview of the Coupled Model Intercomparison Project Phase 6 (CMIP6) experimental design and organization, Geosci. Model Dev., 9, 1937–1958, https://doi.org/10.5194/gmd-9-1937-2016, 2016. a
Fogt, R. L. and Marshall, G. J.: The Southern Annular Mode: variability, trends, and climate impacts across the Southern Hemisphere, Wiley Interdisciplin. Rev.: Clim. Change, 11, e652, https://doi.org/10.1002/wcc.652, 2020. a, b
Fyke, J., Lenaerts, J. T. M., and Wang, H.: Basin-scale heterogeneity in Antarctic precipitation and its impact on surface mass variability, The Cryosphere, 11, 2595–2609, https://doi.org/10.5194/tc-11-2595-2017, 2017. a, b, c
Gao, Q., Sime, L. C., McLaren, A. J., Bracegirdle, T. J., Capron, E., Rhodes, R. H., Steen-Larsen, H. C., Shi, X., and Werner, M.: Evaporative controls on Antarctic precipitation: an ECHAM6 model study using innovative water tracer diagnostics, The Cryosphere, 18, 683–703, https://doi.org/10.5194/tc-18-683-2024, 2024. a, b
Garbe, J., Albrecht, T., Levermann, A., Donges, J. F., and Winkelmann, R.: The hysteresis of the Antarctic ice sheet, Nature, 585, 538–544, 2020. a
Golledge, N. R., Keller, E. D., Gomez, N., Naughten, K. A., Bernales, J., Trusel, L. D., and Edwards, T. L.: Global environmental consequences of twenty-first-century ice-sheet melt, Nature, 566, 65–72, 2019. a
Gong, D. and Wang, S.: Definition of Antarctic oscillation index, Geophys. Res. Lett., 26, 459–462, 1999. a
Goosse, H., Braida, M., Crosta, X., Mairesse, A., Masson-Delmotte, V., Mathiot, P., Neukom, R., Oerter, H., Philippon, G., Renssen, H., Stenni, B., van Ommen, T., and Verleyen, E.: Antarctic temperature changes during the last millennium: evaluation of simulations and reconstructions, Quaternary Sci. Rev., 55, 75–90, 2012. a
Gordon, C., Cooper, C., Senior, C. A., Banks, H., Gregory, J. M., Johns, T. C., Mitchell, J. F., and Wood, R. A.: The simulation of SST, sea ice extents and ocean heat transports in a version of the Hadley Centre coupled model without flux adjustments, Clim. Dynam., 16, 147–168, 2000. a, b
Goursaud, S., Masson-Delmotte, V., Favier, V., Preunkert, S., Fily, M., Gallée, H., Jourdain, B., Legrand, M., Magand, O., Minster, B., and Werner, M.: A 60-year ice-core record of regional climate from Adélie Land, coastal Antarctica, The Cryosphere, 11, 343–362, https://doi.org/10.5194/tc-11-343-2017, 2017. a, b, c
Goursaud, S., Masson-Delmotte, V., Favier, V., Orsi, A., and Werner, M.: Water stable isotope spatio-temporal variability in Antarctica in 1960–2013: observations and simulations from the ECHAM5-wiso atmospheric general circulation model, Clim. Past, 14, 923–946, https://doi.org/10.5194/cp-14-923-2018, 2018. a, b, c
Goursaud, S., Masson-Delmotte, V., Favier, V., Preunkert, S., Legrand, M., Minster, B., and Werner, M.: Challenges associated with the climatic interpretation of water stable isotope records from a highly resolved firn core from Adélie Land, coastal Antarctica, The Cryosphere, 13, 1297–1324, https://doi.org/10.5194/tc-13-1297-2019, 2019. a, b, c
Goursaud, S., Holloway, M., Sime, L., Wolff, E., Valdes, P., Steig, E. J., and Pauling, A.: Antarctic Ice Sheet elevation impacts on water isotope records during the Last Interglacial, Geophys. Res. Lett., 48, e2020GL091412, https://doi.org/10.1029/2020GL091412, 2021. a, b
Graham, A. G., Wåhlin, A., Hogan, K. A., Nitsche, F. O., Heywood, K. J., Totten, R. L., Smith, J. A., Hillenbrand, C.-D., Simkins, L. M., Anderson, J. B., Wellner, J. S., and Larter, R. D.: Rapid retreat of Thwaites Glacier in the pre-satellite era, Nat. Geosci., 15, 706–713, 2022. a
Guan, J., Liu, Z., Wen, X., Brady, E., Noone, D., Zhu, J., and Han, J.: Understanding the temporal slope of the temperature-water isotope relation during the deglaciation using isoCAM3: The slope equation, J. Geophys. Res.-Atmos., 121, 10342–10354, 2016. a
Guan, J., Liu, Z., and Chen, G.: Moisture Source Tagging Confirming the Polar Amplification Effect in Amplifying the Temperature-δ18O Temporal Slope Since the LGM, Atmosphere, 11, 610, https://doi.org/10.3390/atmos11060610, 2020. a
Hersbach, H., Bell, B., Berrisford, P., Hirahara, S., Horányi, A., Muñoz-Sabater, J., Nicolas, J., Peubey, C., Radu, R., Schepers, D., Simmons, A., Soci, C., Abdalla, S., Abellan, X., Balsamo, G., Bechtold, P., Biavati, G., Bidlot, J., Bonavita, M., De Chiara, M., Dahlgren, P., Dee, D., Diamantakis, M., Dragani, R., Flemming, J., Forbes, R., Fuentes, M., Geer, A., Haimberger, L., Healy, S., Hogan, R.J., Hólm, E., Janisková, M., Keeley, S., Laloyaux, P., Lopez, P., Lupu, C., Radnoti, G., de Rosnay, P., Rozum, I., Vamborg, F., Villaume, S., and Thépaut, J.-N.: The ERA5 global reanalysis, Q. J. Roy. Meteorol. Soc., 146, 1999–2049, 2020. a
Holloway, M. D., Sime, L., Singarayer, J. S., Tindall, J. C., Bunch, P., and Valdes, P. J.: Antarctic last interglacial isotope peak in response to sea ice retreat not ice-sheet collapse, Nat. Commun., 7, 1–9, 2016. a, b, c, d, e, f
Holloway, M. D., Sime, L., Singarayer, J. S., Tindall, J. C., and Valdes, P. J.: Simulating the 128-ka Antarctic Climate Response to Northern Hemisphere Ice Sheet Melting Using the Isotope-Enabled HadCM3, Geophys. Res. Lett., 45, 11921–11929, 2018. a
IPCC: Climate Change 2022: Impacts, Adaptation, and Vulnerability, in: Contribution of Working Group II to the Sixth Assessment Report of the Intergovernmental Panel on Climate Change, edited by: Pörtner, H.-O., Roberts, D. C., Tignor, M., Poloczanska, E. S., Mintenbeck, K., Alegría, A., Craig, M., Langsdorf, S., Löschke, S., Möller, V., Okem, A., and Rama, B., Cambridge University Press. Cambridge University Press, Cambridge, UK and New York, NY, USA, 3056 pp., https://doi.org/10.1017/9781009325844, 2022. a, b
Isaksson, E. and Karlén, W.: Spatial and temporal patterns in snow accumulation, western Dronning Maud Land, Antarctica, J. Glaciol., 40, 399–409, 1994. a, b
Jones, M. E., Bromwich, D. H., Nicolas, J. P., Carrasco, J., Plavcová, E., Zou, X., and Wang, S.-H.: Sixty years of widespread warming in the southern middle and high latitudes (1957–2016), J. Climate, 32, 6875–6898, 2019. a
Jouzel, J., Vimeux, F., Caillon, N., Delaygue, G., Hoffmann, G., Masson-Delmotte, V., and Parrenin, F.: Magnitude of isotope/temperature scaling for interpretation of central Antarctic ice cores, J. Geophys. Res.-Atmos., 108, 4361, https://doi.org/10.1029/2002JD002677, 2003. a, b, c
Jouzel, J., Masson-Delmotte, V., Cattani, O., Dreyfus, G., Falourd, S., Hoffmann, G., Minster, B., Nouet, J., Barnola, J.-M., Chappellaz, J., Fischer, H., Gallet, J. C., Johnsen, S., Leuenberger, M., Loulergue, L., Luethi, D., Oerter, H., Parrenin, F., Raisbeck, G., Raynaud, D., Schilt, A., Schwander, J., Selmo, E., Souchez, R., Spahni, R., Stauffer, B., Steffensen, J. P., Stenni, B., Stocker, T. F., Tison, J. L., Werner, M., and Wolff, E. W.: Orbital and millennial Antarctic climate variability over the past 800,000 years, Science, 317, 793–796, 2007. a
Kino, K., Okazaki, A., Cauquoin, A., and Yoshimura, K.: Contribution of the Southern Annular Mode to variations in water isotopes of daily precipitation at Dome Fuji, East Antarctica, J. Geophys. Res.-Atmos., 126, e2021JD035397, https://doi.org/10.1029/2021JD035397, 2021. a
Krinner, G. and Werner, M.: Impact of precipitation seasonality changes on isotopic signals in polar ice cores: a multi-model analysis, Earth Planet. Sc. Lett., 216, 525–538, 2003. a
Lambert, F., Delmonte, B., Petit, J.-R., Bigler, M., Kaufmann, P. R., Hutterli, M. A., Stocker, T. F., Ruth, U., Steffensen, J. P., and Maggi, V.: Dust-climate couplings over the past 800,000 years from the EPICA Dome C ice core, Nature, 452, 616–619, 2008. a
Landais, A., Casado, M., Prie, F., Magand, O., Arnaud, L., Ekaykin, A., Petit, J.-R., Picard, G., Fily, M., Minster, B., Touzeau, A., Goursaud, S., Masson-Delmotte, V., Jouzel, J., and Orsi, A.: Surface studies of water isotopes in Antarctica for quantitative interpretation of deep ice core data, Comptes Rendus Geoscience, 349, 139–150, 2017. a
Landais, A., Stenni, B., Masson-Delmotte, V., Jouzel, J., Cauquoin, A., Fourré, E., Minster, B., Selmo, E., Extier, T., Werner, M., Vimeux, F., Uemura, R., Crotti, I., and Grisart, A.: Interglacial Antarctic–Southern Ocean climate decoupling due to moisture source area shifts, Nat. Geosci., 14, 918–923, 2021. a, b
Libois, Q., Picard, G., Arnaud, L., Morin, S., and Brun, E.: Modeling the impact of snow drift on the decameter-scale variability of snow properties on the Antarctic Plateau, J. Geophys. Rese.-Atmos., 119, 11662–11681, 2014. a
Liu, X. and Battisti, D. S.: The influence of orbital forcing of tropical insolation on the climate and isotopic composition of precipitation in South America, J. Climate, 28, 4841–4862, 2015. a, b
Lorius, C., Merlivat, L., and Hagemann, R.: Variation in the mean deuterium content of precipitations in Antarctica, J. Geophys. Res., 74, 7027–7031, 1969. a
Marshall, G. J., Thompson, D. W., and van den Broeke, M. R.: The signature of Southern Hemisphere atmospheric circulation patterns in Antarctic precipitation, Geophys. Res. Lett., 44, 11580–11589 2017. a
Masson, V., Vimeux, F., Jouzel, J., Morgan, V., Delmotte, M., Ciais, P., Hammer, C., Johnsen, S., Lipenkov, V. Y., Mosley-Thompson, E., Petit, J. R., Steig, E. J., Stievenard, M., and Vaikmae, R.: Holocene climate variability in Antarctica based on 11 ice-core isotopic records, Quatern. Res., 54, 348–358, 2000. a
Masson-Delmotte, V., Hou, S., Ekaykin, A., Jouzel, J., Aristarain, A., Bernardo, R., Bromwich, D., Cattani, O., Delmotte, M., Falourd, S., Frezzotti, M., Gallée, H., Genoni, L., Isaksson, E., Landais, A., Helsen, M. M., Hoffmann, G., Lopez, J., Morgan, V., Motoyama, H., Noone, D., Oerter, H., Petit, J. R., Royer, A., Uemura, R., Schmidt, G. A., Schlosser, E., Simões, J. C., Steig, E. J., Stenni, B., Stievenard, M., van den Broeke, M. R., van de Wal, R. S. W., van de Berg, W. J., Vimeux, F., and White, J. W. C.: A review of Antarctic surface snow isotopic composition: Observations, atmospheric circulation, and isotopic modeling, J. Climate, 21, 3359–3387, 2008. a, b
Masson-Delmotte, V., Stenni, B., Pol, K., Braconnot, P., Cattani, O., Falourd, S., Kageyama, M., Jouzel, J., Landais, A., Minster, B., Barnola, J. M., Chappellaz, J. C., Krinner, G., Johnsen, S., Röthlisberger, R., Hansen, J., Mikolajewic, U., and Otto-Bliesner, B.: EPICA Dome C record of glacial and interglacial intensities, Quaternary Sci. Rev., 29, 113–128, 2010. a
Medley, B. and Thomas, E.: Increased snowfall over the Antarctic Ice Sheet mitigated twentieth-century sea-level rise, Nat. Clim. Change, 9, 34–39, 2019. a
Milillo, P., Rignot, E., Rizzoli, P., Scheuchl, B., Mouginot, J., Bueso-Bello, J. L., Prats-Iraola, P., and Dini, L.: Rapid glacier retreat rates observed in West Antarctica, Nat. Geosci., 15, 48–53, 2022. a
Neukom, R., Schurer, A. P., Steiger, N., and Hegerl, G. C.: Possible causes of data model discrepancy in the temperature history of the last Millennium, Sci. Rep., 8, 1–15, 2018. a
Nicolas, J. P. and Bromwich, D. H.: New reconstruction of Antarctic near-surface temperatures: Multidecadal trends and reliability of global reanalyses, J. Climate, 27, 8070–8093, 2014. a, b, c
PAGES 2k Consortium: Consistent multidecadal variability in global temperature reconstructions and simulations over the Common Era, Nat. Geosci., 12, 643–649, 2019. a
PAGES 2k-PMIP3 group: Continental-scale temperature variability in PMIP3 simulations and PAGES 2k regional temperature reconstructions over the past millennium, Clim. Past, 11, 1673–1699, https://doi.org/10.5194/cp-11-1673-2015, 2015. a
Parsons, L. A., Brennan, M. K., Wills, R. C., and Proistosescu, C.: Magnitudes and spatial patterns of interdecadal temperature variability in CMIP6, Geophys. Res. Lett., 47, e2019GL086588, https://doi.org/10.1029/2019GL086588, 2020. a
Pohl, B., Favier, V., Wille, J., Udy, D. G., Vance, T. R., Pergaud, J., Dutrievoz, N., Blanchet, J., Kittel, C., Amory, C., Krinner, G., and Codron, F.: Relationship between weather regimes and atmospheric rivers in East Antarctica, J. Geophys. Res.-Atmos., 126, e2021JD035294, https://doi.org/10.1029/2021JD035294, 2021. a
Pongratz, J., Reick, C., Raddatz, T., and Claussen, M.: A reconstruction of global agricultural areas and land cover for the last millennium, Global Biogeochem. Cy., 22, GB3018, https://doi.org/10.1029/2007GB003153, 2008. a
Pope, V., Gallani, M., Rowntree, P., and Stratton, R.: The impact of new physical parametrizations in the Hadley Centre climate model: HadAM3, Clim. Dynam., 16, 123–146, 2000. a, b
Post, E., Alley, R. B., Christensen, T. R., Macias-Fauria, M., Forbes, B. C., Gooseff, M. N., Iler, A., Kerby, J. T., Laidre, K. L., Mann, M. E., Olofsson, J., Stroeve, J. C., Ulmer, F., Virginia, R. A., and Wang, M.: The polar regions in a 2 °C warmer world, Sci. Adv., 5, eaaw9883, https://doi.org/10.1126/sciadv.aaw9883, 2019. a
Raphael, M. N. and Handcock, M. S.: A new record minimum for Antarctic sea ice, Nat. Rev. Earth Environ., 3, 215–216, 2022. a
Raphael, M. N., Holland, M. M., Landrum, L., and Hobbs, W. R.: Links between the Amundsen Sea Low and sea ice in the Ross Sea: seasonal and interannual relationships, Clim. Dynam., 52, 2333–2349, 2019. a
Ritter, F., Steen-Larsen, H. C., Werner, M., Masson-Delmotte, V., Orsi, A., Behrens, M., Birnbaum, G., Freitag, J., Risi, C., and Kipfstuhl, S.: Isotopic exchange on the diurnal scale between near-surface snow and lower atmospheric water vapor at Kohnen station, East Antarctica, The Cryosphere, 10, 1647–1663, https://doi.org/10.5194/tc-10-1647-2016, 2016. a
Schlosser, E., Reijmer, C., Oerter, H., and Graf, W.: The influence of precipitation origin on the δ18O–T relationship at Neumayer Station, Ekstrmisen, Antarctica, Ann. Glaciol., 39, 41–48, 2004. a
Schmidt, G. A., Jungclaus, J. H., Ammann, C. M., Bard, E., Braconnot, P., Crowley, T. J., Delaygue, G., Joos, F., Krivova, N. A., Muscheler, R., Otto-Bliesner, B. L., Pongratz, J., Shindell, D. T., Solanki, S. K., Steinhilber, F., and Vieira, L. E. A.: Climate forcing reconstructions for use in PMIP simulations of the last millennium (v1.0), Geosci. Model Dev., 4, 33–45, https://doi.org/10.5194/gmd-4-33-2011, 2011. a, b
Schurer, A. P., Tett, S. F., and Hegerl, G. C.: Small influence of solar variability on climate over the past millennium, Nat. Geosci., 7, 104–108, 2014. a
Seroussi, H., Nowicki, S., Payne, A. J., Goelzer, H., Lipscomb, W. H., Abe-Ouchi, A., Agosta, C., Albrecht, T., Asay-Davis, X., Barthel, A., Calov, R., Cullather, R., Dumas, C., Galton-Fenzi, B. K., Gladstone, R., Golledge, N. R., Gregory, J. M., Greve, R., Hattermann, T., Hoffman, M. J., Humbert, A., Huybrechts, P., Jourdain, N. C., Kleiner, T., Larour, E., Leguy, G. R., Lowry, D. P., Little, C. M., Morlighem, M., Pattyn, F., Pelle, T., Price, S. F., Quiquet, A., Reese, R., Schlegel, N.-J., Shepherd, A., Simon, E., Smith, R. S., Straneo, F., Sun, S., Trusel, L. D., Van Breedam, J., van de Wal, R. S. W., Winkelmann, R., Zhao, C., Zhang, T., and Zwinger, T.: ISMIP6 Antarctica: a multi-model ensemble of the Antarctic ice sheet evolution over the 21st century, The Cryosphere, 14, 3033–3070, https://doi.org/10.5194/tc-14-3033-2020, 2020. a
Servettaz, A. P. M., Orsi, A. J., Curran, M. A. J., Moy, A. D., Landais, A., McConnell, J. R., Popp, T. J., Le Meur, E., Faïn, X., and Chappellaz, J.: A 2000-year temperature reconstruction on the East Antarctic plateau from argon–nitrogen and water stable isotopes in the Aurora Basin North ice core, Clim. Past, 19, 1125–1152, https://doi.org/10.5194/cp-19-1125-2023, 2023a. a
Servettaz, A. P. M., Agosta, C., Kittel, C., and Orsi, A. J.: Control of the temperature signal in Antarctic proxies by snowfall dynamics, The Cryosphere, 17, 5373–5389, https://doi.org/10.5194/tc-17-5373-2023, 2023b. a
Shapiro, A., Schmutz, W., Rozanov, E., Schoell, M., Haberreiter, M., Shapiro, A., and Nyeki, S.: A new approach to the long-term reconstruction of the solar irradiance leads to large historical solar forcing, Astron. Astrophys., 529, A67, https://doi.org/10.1051/0004-6361/201016173, 2011. a
Shields, C. A., Wille, J. D., Marquardt Collow, A. B., Maclennan, M., and Gorodetskaya, I. V.: Evaluating uncertainty and modes of variability for Antarctic atmospheric rivers, Geophys. Res. Lett., 49, e2022GL099577, https://doi.org/10.1029/2022GL099577, 2022. a
Shu, Q., Wang, Q., Song, Z., Qiao, F., Zhao, J., Chu, M., and Li, X.: Assessment of sea ice extent in CMIP6 with comparison to observations and CMIP5, Geophys. Res. Lett., 47, e2020GL087965, https://doi.org/10.1029/2020GL087965, 2020. a, b, c, d
Sime, L., Tindall, J. C., Wolff, E. W., Connolley, W. M., and Valdes, P. J.: Antarctic isotopic thermometer during a CO2 forced warming event, J. Geophys. Res.-Atmos., 113, D24119, https://doi.org/0.1029/2008JD010395, 2008. a, b, c, d, e, f, g, h
Sime, L., Marshall, G. J., Mulvaney, R., and Thomas, E. R.: Interpreting temperature information from ice cores along the Antarctic Peninsula: ERA40 analysis, Geophys. Res. Lett., 36, L18801, https://doi.org/10.1029/2009GL038982, 2009a. a, b, c, d
Sime, L., Wolff, E., Oliver, K., and Tindall, J.: Evidence for warmer interglacials in East Antarctic ice cores, Nature, 462, 342–345, 2009b. a, b
Sime, L., Hopcroft, P. O., and Rhodes, R. H.: Impact of abrupt sea ice loss on Greenland water isotopes during the last glacial period, P. Natl. Acad. Sci. USA, 116, 4099–4104, 2019. a, b
Steig, E. J., Schneider, D. P., Rutherford, S. D., Mann, M. E., Comiso, J. C., and Shindell, D. T.: Warming of the Antarctic ice-sheet surface since the 1957 International Geophysical Year, Nature, 457, 459–462, 2009. a, b, c
Stenni, B., Curran, M. A. J., Abram, N. J., Orsi, A., Goursaud, S., Masson-Delmotte, V., Neukom, R., Goosse, H., Divine, D., van Ommen, T., Steig, E. J., Dixon, D. A., Thomas, E. R., Bertler, N. A. N., Isaksson, E., Ekaykin, A., Werner, M., and Frezzotti, M.: Antarctic climate variability on regional and continental scales over the last 2000 years, Clim. Past, 13, 1609–1634, https://doi.org/10.5194/cp-13-1609-2017, 2017. a, b, c, d, e, f, g, h, i, j, k, l, m, n, o
Taylor, K. E., Stouffer, R. J., and Meehl, G. A.: An overview of CMIP5 and the experiment design, B. Am. Meteorol. Soc., 93, 485–498, 2012. a
Tett, S. F., Betts, R., Crowley, T. J., Gregory, J., Johns, T. C., Jones, A., Osborn, T. J., Öström, E., Roberts, D. L., and Woodage, M. J.: The impact of natural and anthropogenic forcings on climate and hydrology since 1550, Clim. Dynam., 28, 3–34, 2007. a
Thomas, E. R., Bracegirdle, T. J., Turner, J., and Wolff, E. W.: A 308 year record of climate variability in West Antarctica, Geophys. Res. Lett., 40, 5492–5496, 2013. a, b
Thomas, E. R., van Wessem, J. M., Roberts, J., Isaksson, E., Schlosser, E., Fudge, T. J., Vallelonga, P., Medley, B., Lenaerts, J., Bertler, N., van den Broeke, M. R., Dixon, D. A., Frezzotti, M., Stenni, B., Curran, M., and Ekaykin, A. A.: Regional Antarctic snow accumulation over the past 1000 years, Clim. Past, 13, 1491–1513, https://doi.org/10.5194/cp-13-1491-2017, 2017. a
Thompson, D. W. and Wallace, J. M.: Annular modes in the extratropical circulation. Part I: Month-to-month variability, J. Climate, 13, 1000–1016, 2000. a
Tindall, J., Valdes, P., and Sime, L.: Stable water isotopes in HadCM3: Isotopic signature of El Niño–Southern Oscillation and the tropical amount effect, J. Geophys. Res.-Atmos., 114, D04111, https://doi.org/10.1029/2008JD010825, 2009. a, b, c
Turner, J., Colwell, S. R., Marshall, G. J., Lachlan-Cope, T. A., Carleton, A. M., Jones, P. D., Lagun, V., Reid, P. A., and Iagovkina, S.: The SCAR READER project: Toward a high-quality database of mean Antarctic meteorological observations, J. Climate, 17, 2890–2898, 2004. a
Turner, J., Connolley, W., Lachlan-Cope, T., and Marshall, G.: The performance of the Hadley Centre Climate Model (HadCM3) in high southern latitudes, Int. J. Climatol., 26, 91–112, 2006. a, b, c, d
Turner, J., Marshall, G. J., Clem, K., Colwell, S., Phillips, T., and Lu, H.: Antarctic temperature variability and change from station data, Int. J. Climatol., 40, 2986–3007, 2020. a
Turner, J., Holmes, C., Caton Harrison, T., Phillips, T., Jena, B., Reeves-Francois, T., Fogt, R., Thomas, E. R., and Bajish, C.: Record low Antarctic sea ice cover in February 2022, Geophys. Res. Lett., 49, e2022GL098904, https://doi.org/0.1029/2022GL098904, 2022. a
van Ommen, T. D. and Morgan, V.: Calibrating the ice core paleothermometer using seasonality, J. Geophys. Res.-Atmos., 102, 9351–9357, 1997. a
Vega, C. P., Schlosser, E., Divine, D. V., Kohler, J., Martma, T., Eichler, A., Schwikowski, M., and Isaksson, E.: Surface mass balance and water stable isotopes derived from firn cores on three ice rises, Fimbul Ice Shelf, Antarctica, The Cryosphere, 10, 2763–2777, https://doi.org/10.5194/tc-10-2763-2016, 2016. a, b
Wang, Y., Ding, M., Reijmer, C. H., Smeets, P. C. J. P., Hou, S., and Xiao, C.: The AntSMB dataset: a comprehensive compilation of surface mass balance field observations over the Antarctic Ice Sheet, Earth Syst. Sci. Data, 13, 3057–3074, https://doi.org/10.5194/essd-13-3057-2021, 2021. a, b
Wang, Y., Zhang, X., Ning, W., Lazzara, M. A., Ding, M., Reijmer, C. H., Smeets, P. C. J. P., Grigioni, P., Heil, P., Thomas, E. R., Mikolajczyk, D., Welhouse, L. J., Keller, L. M., Zhai, Z., Sun, Y., and Hou, S.: The AntAWS dataset: a compilation of Antarctic automatic weather station observations, Earth Syst. Sci. Data, 15, 411–429, https://doi.org/10.5194/essd-15-411-2023, 2023. a
Werner, M., Heimann, M., and Hoffmann, G.: Isotopic composition and origin of polar precipitation in present and glacial climate simulations, Tellus B, 53, 53–71, 2001. a
Werner, M., Jouzel, J., Masson-Delmotte, V., and Lohmann, G.: Reconciling glacial Antarctic water stable isotopes with ice sheet topography and the isotopic paleothermometer, Natu. Commun., 9, 1–10, 2018. a, b, c
Wille, J. D., Favier, V., Dufour, A., Gorodetskaya, I. V., Turner, J., Agosta, C., and Codron, F.: West Antarctic surface melt triggered by atmospheric rivers, Nat. Geosci., 12, 911–916, 2019. a
Wille, J. D., Favier, V., Jourdain, N. C., Kittel, C., Turton, J. V., Agosta, C., Gorodetskaya, I. V., Picard, G., Codron, F., Santos, C. L.-D., Amory, C., Fettweis, X., Blanchet, J., Jomelli, V., and Berchet, A.: Intense atmospheric rivers can weaken ice shelf stability at the Antarctic Peninsula, Commun. Earth Environ., 3, 90, https://doi.org/10.1038/s43247-022-00422-9, 2022. a
Wilson, A. B., Bromwich, D. H., and Hines, K. M.: Simulating the mutual forcing of anomalous high southern latitude atmospheric circulation by El Niño flavors and the Southern Annular Mode, J. Climate, 29, 2291–2309, 2016. a
Wolff, E., Barbante, C., Becagli, S., Bigler, M., Boutron, C., Castellano, E., De Angelis, M., Federer, U., Fischer, H., Fundel, F., Hansson, H., Hutterli, M., Jonsell, U., Karlin, T., Kaufmann, P., Lambert, F., Littot, G. C., Mulvaney, R., Röthlisberger, R., Ruth, U., Severi, M., Siggaard-Andersen, M. L., Sime, L. C., Steffensen, J. P., Stocker, T. F., Traversi, R., Twarloh, B., Udisti, R., Wagenbach, D., and Wegner, B.: Changes in environment over the last 800,000 years from chemical analysis of the EPICA Dome C ice core, Quaternary Sci. Rev., 29, 285–295, 2010. a
Yoshimura, K., Kanamitsu, M., Noone, D., and Oki, T.: Historical isotope simulation using reanalysis atmospheric data, J. Geophys. Res.-Atmos., 113, D19108, https://doi.org/10.1029/2008JD010074, 2008. a
Zhang, X., He, B., Liu, Y., Bao, Q., Zheng, F., Li, J., Hu, W., and Wu, G.: Evaluation of the seasonality and spatial aspects of the Southern Annular Mode in CMIP6 models, Int. J. Climatol., 42, 3820–3837, 2022. a
Zheng, F., Li, J., Clark, R. T., and Nnamchi, H. C.: Simulation and projection of the Southern Hemisphere annular mode in CMIP5 models, J. Climate, 26, 9860–9879, 2013. a, b, c
- Abstract
- Introduction
- Materials and methods
- Results
- Conclusions
- Appendix A: HadCM3 evaluation of Antarctic surface climate and δ18O
- Appendix B: Historical HadCM3/A2k δ18O comparison
- Appendix C: Regional sea ice trends
- Appendix D: Dependency of the time window on the HadCM3 δ18O trends
- Appendix E: Statistical description of the HadCM3 cold and warm ensembles
- Appendix F: δ18O–SAT gradients at ice core locations simulated by HadCM3
- Appendix G: Impact of the Southern Annular Mode
- Code and data availability
- Author contributions
- Competing interests
- Disclaimer
- Special issue statement
- Acknowledgements
- Financial support
- Review statement
- References


