the Creative Commons Attribution 4.0 License.
the Creative Commons Attribution 4.0 License.
Can machine-learning algorithms improve upon classical palaeoenvironmental reconstruction models?
Peng Sun
Philip B. Holden
H. John B. Birks
Classical palaeoenvironmental reconstruction models often incorporate biological ideas and commonly assume that the taxa comprising a fossil assemblage exhibit unimodal response functions of the environmental variable of interest. In contrast, machine-learning approaches do not rely upon any biological assumptions but instead need training with large data sets to extract some understanding of the relationships between biological assemblages and their environment. To explore the relative merits of these two approaches, we have developed a two-layered machine-learning reconstruction model MEMLM (Multi Ensemble Machine Learning Model). The first layer applies three different ensemble machine-learning models (random forests, extra random trees, and LightGBM), trained on the modern taxon assemblage and associated environmental data to make reconstructions based on the three different models, while the second layer uses multiple linear regression to integrate these three reconstructions into a consensus reconstruction. We considered three versions of the model: (1) a standard version of MEMLM, which uses only taxon abundance data; (2) MEMLMe, which uses only dimensionally reduced assemblage information, using a natural language-processing model (GloVe), to detect associations between taxa across the training data set; and (3) MEMLMc which incorporates both raw taxon abundance and dimensionally reduced summary (GloVe) data. We trained these MEMLM model variants with three high-quality diatom and pollen training sets and compared their reconstruction performance with three weighted-averaging (WA) approaches (WA-Cla for classical deshrinking, WA-Inv for inverse deshrinking, and WA-PLS for partial least squares). In general, the MEMLM approaches, even when trained on only dimensionally reduced assemblage data, performed substantially better than the WA approaches in the larger training sets, as judged by cross-validatory prediction error. When applied to fossil data, MEMLM variants sometimes generated qualitatively different palaeoenvironmental reconstructions from each other and from reconstructions based on WA approaches. We applied a statistical significance test to all the reconstructions. This successfully identified each incidence for which the reconstruction is not robust with respect to the model choice. We found that machine-learning approaches could outperform classical approaches but could sometimes fail badly in the reconstruction, despite showing high performance under cross-validation, likely indicating problems when extrapolation occurs. We found that the classical approaches are generally more robust, although they could also generate reconstructions which have modest statistical significance and therefore may be unreliable. Given these conclusions, we consider that cross-validation is not a sufficient measure of transfer function performance, and we recommend that the results of statistical significance tests are provided alongside the downcore reconstructions based on fossil assemblages.
- Article
(9147 KB) - Full-text XML
- BibTeX
- EndNote
The distribution and abundance of taxa are interrelated with the environment (Ovaskainen et al., 2017). By considering environmental variability across space instead of through time, the palaeoenvironment can be reconstructed by applying modern taxon–environment relationships to the fossil record (e.g. Battarbee et al., 2005; Cleator et al., 2020; Turner et al., 2020).
With the development of palaeoecological research, large training data sets for environmental reconstruction have been compiled in recent years (e.g. Harrison, 2019; Bush et al., 2021). Data assimilation has long been a focus of Earth science and ecology, and the integration of larger data sets provides more comprehensive training information (e.g. Christin et al., 2019; de la Houssaye et al., 2019; Bush et al., 2021). For large data sets, machine-learning methods have strong advantages and may be appropriate to extract the non-linear relationships between taxon compositional information and the environment and to integrate a variety of sources of data (e.g. Helama et al., 2009; Aguirre-Gutierrez et al., 2021; Wei et al., 2021b).
In recent years, machine learning has been applied to a wide range of applications in palaeoecology (Hais et al., 2015; Jordan et al., 2016). Wei et al. (2021b) reconstructed palaeoclimate using five different machine-learning methods based on digital leaf physiognomic data and integrated the predictions by averaging. Hais et al. (2015) predicted the Pleistocene biota distributions in palaeoclimate using machine learning. Huang et al. (2020) used one series of palaeoclimate sequences to predict the climate in another period. These studies show that machine learning has strong versatility and effectiveness and suggest it could be more widely applied.
Machine-learning approaches are not based upon any biological assumptions, which may weaken their performance relative to the mathematically simpler classical approaches that do. For instance, weighted-averaging (WA) approaches are based upon the simple but realistic assumption that taxa have a unimodal response to the environmental variable of interest (ter Braak and Barendregt, 1986). The absence of any such prior understanding is likely to place additional demands on the minimum adequate size of a modern training set. Moreover, it may weaken the ability of machine learning to operate under extrapolation, which is critically important when applying any reconstruction approach to past taxon assemblages that lack modern analogues. To address these questions, we have developed the Multi Ensemble Machine Learning Model (MEMLM) to apply in a systematic comparison with classical WA reconstruction approaches.
The benefit of machine learning lies in its robust data mining and information extraction capabilities, especially when applied to large data sets. Data mining involves discovering patterns, trends, and correlations hidden within extensive data sets. Information extraction, on the other hand, focuses on extracting insights from unstructured data, typically relying on natural language processing and encoding techniques to understand and analyse relationships within unstructured data. An associated problem is that when a sample size is limited, machine learning is more likely to learn the noise component and generate prediction errors due to over-fitting (Yeom et al., 2018; Syam and Kaul, 2021). This suggests that an ensemble-learning method, which integrates models with potentially different biases, may improve the prediction performance (Wei et al., 2021b). Ensemble learning was developed to address these issues (Zhou, 2012) and is the motivation for the ensemble-learning approach we present, namely the Multi Ensemble Machine Learning Model (MEMLM).
We build MEMLM from three different machine-learning ensemble models of random forests, extra random trees, and LightGBM. We then combine these three models into a single-consensus model which we treat as our “best” machine-learning approach. Classical studies have integrated different ecological approaches by calculating the mean of their predictions (Norberg et al., 2019). An arithmetic mean gives equal weight to each model, even though the models may have different advantages in different applications (Schulte and Hinckley, 1985; Zhou, 2012). In MEMLM, we weight each model according to its predictive power under cross-validation.
Most classical models give equal weight to different taxa, which may reduce their prediction potential and smooth the reconstruction (e.g. Brooks and Birks, 2001; Heiri et al., 2003; Battarbee et al., 2005; Wei et al., 2021a). In WA-PLS (weighted-averaging partial least squares), tolerance down-weighting can be applied to assign weights to each taxon in reconstructing the environment that depends upon the breadth of the taxon's environmental niche (Liu et al., 2020). Bayesian approaches such as BUMPER (Holden et al., 2017) are built on classical assumptions and are highly constrained by taxa with low environmental tolerances, especially when characterised with high confidence. In machine-learning ensemble models, each taxon has a different predicted contribution which is used to weight its contribution to the ensemble.
We developed three versions of MEMLM: the standard version, which only considers raw taxon abundance data; MEMLMe, which only uses dimensionally reduced assemblage data; and MEMLMc, which uses both. The motivation for the dimensional reduction is to explore whether considering known associations between taxa can improve the palaeoenvironmental reconstructions. For this, we use the natural language-processing model GloVe (Pennington et al., 2014), which calculates the relationships between co-occurring words in the same sentence. GloVe is a form of dimension reduction which assigns vectors (also called embedding) to each word according to the word connection relationships, so that each sentence can be represented as a superposition of the word embedded within that sentence. In taxon assemblages, there are analogous co-occurrence relationships between taxa which we hypothesise convey information on their ecological functioning. We therefore use GloVe to generate embedding vectors by considering the frequency of co-occurring taxon pairs across the training set. We then concatenate the embedding vectors of each sample to represent the assemblage.
In summary, there are several aspects to the question of whether machine-learning algorithms can improve upon classical reconstruction methods. Our strategy to address these has three components.
-
There are many ensemble machine-learning algorithms, and there is no reason to prefer any of these a priori. To address this, we apply three widely used approaches of random forests, extra random trees, and LightGBM. We combine these into a single-consensus reconstruction to simplify comparisons and provide the “best possible” reconstruction.
-
Natural language-processing models are a widely used dimensional reduction approaches in machine learning, and we apply one such method, GloVe, to supplement the ensemble machine learning trained on raw count data. We explore whether this approach can usefully encode assemblage information to either (i) improve the reconstructions based only on raw count data, which is unlikely, given that dimension reduction does not provide additional information, but not ruling out the possibility that data transformation can assist the learning or (ii) replace the raw count data, increasing numerical efficiency and potentially providing information on ecological functioning.
-
It is not sufficient that a reconstruction approach performs well on a training set. It must also be statistically robust when applied to independent core data, which likely lies outside the high-dimensional space of the training set. We cannot assume that machine learning and classical approaches perform equally well under extrapolation. Therefore, we do not only apply conventional tests of cross-validated RMSEP, regression slope, and R2, derived solely from the training set, but we also consider the statistical significance of core reconstructions, applying the technique of Telford and Birks (2011).
We apply MEMLM to high-quality pollen and diatom training sets to generate downcore reconstructions. We calculate training set cross-validation metrics, and we quantify the statistical significance and robustness of the core reconstructions. We compare these performance metrics with those of classical WA approaches to evaluate whether, and under what circumstances, machine-learning approaches might be able to outperform classical WA-based reconstruction approaches.
2.1 MEMLM
MEMLM combines a series of modules (Fig. 1). In this section, we introduce the functions of each module and the data-processing approach. There are three model variants (MEMLM, MEMLMe, and MEMLMc), each of which takes different inputs (Fig. 1), which is the only difference in their construction. The scientific motivation for the three variants is to explore (i) whether machine-learning decision trees can extract all useful information (MEMLM) or, if not, (ii) whether GloVe can improve this (MEMLMc) and (iii) whether GloVe alone is sufficient to encode assemblage data (MEMLMe). Each variant is built using the same three machine-learning approaches (random forests, extra random trees, and LightGBM), which are combined into a single-consensus reconstruction model for each.
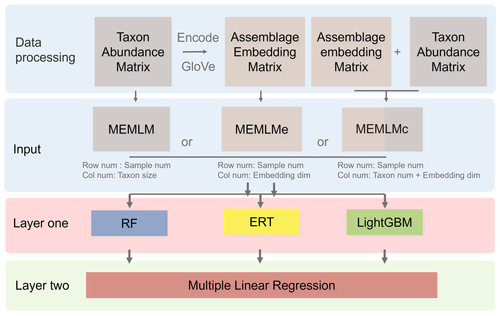
Figure 1Multi Ensemble Machine Learning Model (MEMLM) model framework. MEMLM has a modular building block architecture so that components can be easily changed. Raw num and Col num are the number of rows and columns in the input matrix; dim is the number of dimensions.
2.1.1 First layer
The input data comprise environmental data, together with either the taxon abundance matrix, the assemblage embedding matrix, or both matrices (see Sect. 2.2.3 for a description of the embedding algorithm).
We apply three ensemble machine-learning models to derive the mapping between taxon composition information and environmental factors.
-
Random forest (RF) is an ensemble machine-learning model composed of multiple decision trees. The overall model framework is determined based on the predictive power of each decision tree applied to the training data set under bootstrapping. Individual decision trees with better predictive performance are allocated higher weights, and the “forest” integrates the weighted result from each tree (Liaw and Wiener, 2002).
-
Extra random tree (ERT) is similar to RF, except that it uses the entire data set rather than a bootstrapped subset (Geurts et al., 2006).
-
LightGBM is based on the gradient-boosting decision tree. This also integrates decision trees, but LightGBM differs by applying “gradient boosting” to add new trees, building each new model on the residuals of the previous model to improve the prediction. It has the ability to merge sparse data sets to increase computational efficiency (Friedman, 2011; Ke et al., 2017).
2.1.2 Second layer (consensus reconstruction)
It is possible to improve prediction performance by integrating the prediction of multiple models into a consensus reconstruction (Yeom et al., 2018; Syam and Kaul, 2021). Averaging is widely used to integrate the output prediction of multiple models. However, the integration weight of each model is the same under averaging. MEMLM applies multiple linear regression to allocate an integration weight to each model rather than attaching each model with the same weight. The consensus reconstruction is derived as follows. The three upstream models are applied to reconstruct the training data set, and we then build a multiple linear regression model to fit the reconstructed values to the actual value in the training set. To fit the multiple linear regression model, we apply internal 5-fold cross-validation for each model separately and use the predictions from this cross-validation to fit regression weights. We then treat the consensus model as a single encapsulated model and perform 5-fold cross-validation, each time using 80 % of the training set. The total validation computation therefore comprises five internal cross-validations and one regression fit. This approach is designed to avoid the risk of over-fitting, while reducing the impact of low-performance models on the consensus reconstruction. In an exploratory analysis applied to the NIMBIOS data set, building models for each of 18 environment attributes demonstrated that the multiple linear regression approach reduced the root mean square error of prediction (RMSEP) relative to the individual reconstructions by an average of 8 % (Table A1). A consensus reconstruction based on the mean of the three ensemble approaches also improved predictive power but reduced the cross-validated RMSEP errors relative to the individual reconstructions by an average of 5 %. We note that while the consensus approach reduces RMSEP typically by 8 %, we show in Sect. 3.1 and Table 1 that such improvements are modest relative to the improvements from the machine learning itself. Weights of the linear models of MEMLM, MEMLMe, and MEMLMc based on the three training sets are provided in Table A2.
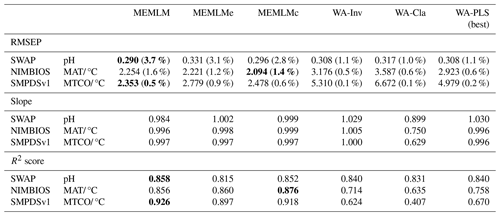
Table 1Cross-validated root mean square error of prediction (RMSEP), regression slope, and R2 score for the three training sets. All data are the means of five cross-validation exercises, which are also used to provide uncertainty estimates for RMSEP (error for RMSEP in parentheses expressed as a percentage of RMSEP). MEMLM uses the abundance matrix. MEMLMe uses the assemblage embedding matrix. MEMLMc uses the combined abundance and embedding matrices. WA-Cla is weighted averaging with a classical deshrinking regression, and WA-Inv is weighted averaging with an inverse deshrinking regression (Birks et al., 1990). WA-PLS is the best model (see Sect. 2.2.3). See Table A4 for other components. Bold highlights the model with the lowest RMSEP or highest R2 score. MAT is for mean annual temperature. MTCO is for mean temperature of the coldest month.
2.1.3 Embedding
The GloVe algorithm (Pennington et al., 2014) is a very widely used linguistic dimensional reduction approach. It uses co-occurrences of words in phrases to characterise numerically their meaning. In formal terms, GloVe is a row–column bilinear model of the form , fitted by weighted least squares to the log-transformed co-occurrence matrix derived from the primary data. GloVe is thereby very close to unconstrained ordination models used in ecology, except perhaps for the transformation to co-occurrences (ter Braak, 1988; ter Braak and te Beest, 2022). GloVe is trained on assemblages to map taxa onto vectors in feature space so that the assemblages can be described as linear combinations of the features.
It may be helpful to describe the motivation for this particular row–column model. In GloVe, words are represented as vectors in a high-dimensional space, where each dimension captures an aspect of meaning so that in this space the words that have similar meanings are located near to each other. To illustrate, in word vector space, we would expect the difference vectors queen−king and girl−boy to be similar, as they both reflect only a change in gender, with other dimensions of meaning (species, age, social status, etc.) remaining constant. Embedding reduces the dimensionality of a vocabulary from tens of thousands of words to hundreds of similar-meaning dimensions, known as features.
In ecology, co-existence among taxa can reflect the characteristics of the environment (Ovaskainen et al., 2017). We hypothesise that taxa within an assemblage have relationships that are analogous to words within a phrase so that in the feature space of ecological “meaning”, the vectorial representation of a taxon describes its ecological function. We apply GloVe to ecological assemblages. Instead of analysing co-occurrences of words within phrases, we analyse co-occurrences of taxa within assemblages. The objective is to extract ecological information by associating taxa with their ecosystem functioning.
The GloVe algorithm is fully detailed in Pennington et al. (2014), and here we introduce the underlying philosophy and illustrate it in the context of ecological functioning. Consider Pij, the conditional probability, that taxon j appears in the same assemblage as taxon i:
where Xij is the number of assemblages which contain both taxa i and j, and Xi is the number of assemblages containing taxon i. This probability does not necessarily indicate the strength of the relationship. Consider, for instance, that a high value may simply reflect that taxon j is common, and therefore it provides little information about the environment.
To determine associative relationships, GloVe considers the ratio where taxon k is some probe taxon used to differentiate the ecological functioning of i and j. If taxon k has a strong association with taxon i but not with taxon j, then . However, if all three taxa are either commonly found together or have no relationship (i.e. low but random co-occurrence) between each other, then , indicating that taxon k provides very little information to help distinguish the ecological functions of i and j. The value of can therefore inform us about the direction of difference vector i−j. For application to MEMLMc, the feature matrices are provided together with the raw taxon count data to provide richer training data for the ensemble-learning algorithms.
2.2 Assemblage data
For model training purposes, we use two large pollen data sets, SMPDSv1 (Harrison, 2019) and NIMBIOS (Bush et al., 2021), and the smaller diatom SWAP data set (Stevenson et al., 1991). The SMPDSv1 (Harrison, 2019) and SWAP (Stevenson et al., 1991) data sets record the percentage of each taxon in each sample, whereas the NIMBIOS data set uses integer counts. When constructing the co-occurrence matrix, whether the data are integer counts or percentages, we sum that data during co-occurrence. To demonstrate the palaeoenvironment reconstructions of each model, we apply (i) SWAP to reconstruct lake water pH from diatoms in a core from the Round Loch of Glenhead (RLGH) (Allott et al., 1992; Jones et al., 1989), (ii) SMPDSv1 to reconstruct mean temperature of the coldest month (MTCO) from pollen in the Villarquemado core (Harrison, 2020; Harrison et al., 2019), and (iii) NIMBIOS to reconstruct the mean annual temperature (MAT) from pollen in the Consuelo core (Urrego et al., 2010) and Llaviucu (Steinitz-Kannan et al., 1983; Colinvaux et al., 1988).
2.2.1 Training data sets
The SWAP training set (Stevenson et al., 1991) was developed as part of an international scientific effort directed at establishing and understanding the impacts of acid rain on freshwaters. It includes relative abundance data for 277 diatom taxa from 167 modern samples with clear identification criteria standards (Birks et al., 1990). We apply these data to reconstruct lake water pH.
The NIMBIOS data set (Bush et al., 2021) includes samples from 636 neotropical locations with various habitat types. There are 533 pollen types (some taxa can only be identified to family level) ranging from soil samples to mud–water interface samples from lakes. We use it to reconstruct the mean annual temperature (MAT).
The SMPDSv1 data set was developed as an environmental calibration data set to provide training data for palaeoclimate reconstructions (Harrison, 2019). SMPDSv1 contains the relative abundances of the 247 most important pollen taxa in 6458 terrestrial samples from Europe, northern Africa, the Middle East, and Eurasia and is compiled from multiple different published sources. We use it to reconstruct the mean temperature of the coldest month (MTCO).
2.2.2 Core data sets
We apply the SWAP training set to the RLGH and RLGH3 core data sets. RLGH is a fossil diatom data set from the Round Loch of Glenhead, Scotland, taken to explore anthropogenic acidification (Allott et al., 1992). The data set includes the relative abundances of 41 diatom taxa in 20 samples which span the industrial era. RLGH3 was sampled to explore natural acidification driven by weathering and soil development during the Holocene (Jones et al., 1989). This data set includes abundances for 225 diatom taxa in 101 samples.
We apply the NIMBIOS training set to the Consuelo and Llaviucu core data sets. The core from Lake Consuelo, Bolivia, is an 8.8 m sediment sequence which records the long-term evolution of a cloud forest in response to environmental changes over the last 46 300 years (Urrego et al., 2010). Lake Llaviucu is a temperature-sensitive lake in the Ecuadorian Andes (Steinitz-Kannan et al., 1983; Colinvaux et al., 1988). It lies behind a moraine in the system dated by Clapperton (1987) within the last glaciation (35 kyr). At nearly 37° S latitude, the lake is perched on the eastern face of the Cordillera Occidental and has been lifted 2200 m since deglaciation. It shows the possibility of the significant cooling of the tropical latitude rainforest near San Juan Bosco (Colinvaux et al., 1997).
We apply the SMPDSv1 training set to the Villarquemado core data set (Harrison et al., 2019; Wei et al., 2021a), a pollen record from the western Mediterranean basin spanning the interval from the last part of Marine Isotope Stage 6 (MIS-6) to the late Holocene. The fossil pollen data were assigned to the subset of pollen taxa recognised in the modern SMPDSv1 data set. There are 104 taxa represented in the final taxon list based on the 361 core samples.
2.3 Model parameters, performance, and validation metrics
2.3.1 Model parameters
We build the GloVe model using the PyTorch deep-learning frame (Paszke et al., 2019), which provides a set of tools and interfaces to implement, train, and deploy deep-learning models. In embedding training, we set the number of epochs (training loops) to 1000 and the number of embedding dimensions to 256. For the first layer, we build an ensemble of 1000 decision trees with parallel computing. MEMLM has an external interface so that these parameters can be easily changed for any third-party application.
We originally developed the GloVe analysis using the pre-packaged software “glove-python” (https://github.com/maciejkula/glove-python, last access: 17 October 2024) but subsequently re-wrote the GloVe algorithm from first principles. Cross-validation and downcore reconstructions from the two algorithms were not materially different, and so the statistical significance testing, which is highly expensive computationally and requires 1 month of parallel computing, was not repeated.
2.3.2 The prediction importance indicator for taxon weighting
The MEMLM models are ensembles based on the results of multiple decision trees. Each time a decision tree forks, the algorithm explores different ways to integrate each taxon's abundance to increase predictive power. The algorithm works through an internal cross-validation analysis to determine whether each predictor reduces the prediction errors in each decision tree and then summarises the results across all decision trees. The approach ascribes an importance index to each taxon which is normalised to a total of one across all taxa and provides a measure of that taxon's predictive power. The 10 most important taxa for each of the three machine-learning models are listed in Table A3. These are used in the inference of taxon importance for environmental reconstruction.
2.3.3 Uncertainty quantification
Uncertainty quantification is provided for all machine-learning reconstructions using IBM's UQ360 package (Ghosh et al., 2024). UQ360 utilises meta-models to estimate the uncertainty bounds of the preserved models, providing upper and lower limits on prediction errors. Specifically, it employs additional decision tree models to capture and re-estimate the prediction errors in the source models.
2.3.4 Cross-validation
The predictive powers of the MEMLM variants are compared with classical WA models (ter Braak and Barendregt, 1986) and WA-PLS (ter Braak and Juggins, 1993). We take the RMSEP, regression slope, and R2 score as performance evaluation indicators, using the scikit-learn package (Pedregosa et al., 2011). We use 5-fold cross-validation. We perform each cross-validation five times with random shuffling, allowing us to provide mean estimates for all validation metrics along with their standard deviations, which we provide for RMSEP. We note that spatial correlation and pseudo-replication within a training set can lead to overstated cross-validated performance statistics. These problems can be minimised by, for instance, removing sites that are geographically close and environmentally similar (Liu et al., 2020). However, we include all training-set sites in cross-validation, noting that our objective is to compare the relative performances of different approaches applied to the same training sets.
For the evaluation of the classical models, we use the rioja package in R (Juggins, 2017) with default settings. As the WA-PLS performance is sensitive to the number of components, we accept a higher PLS component only if it exhibits a 5 % improvement in RMSEP on the previous component (Birks, 1998), and we present results for the higher component.
2.3.5 Statistical significance of reconstructions
While cross-validation is a useful measure of predictive power which implicitly guards against over-fitting (Yates et al., 2023), it is likely to over-estimate predictive power in practice as fossil assemblages may lie outside the high-dimensional space of the modern training assemblages, for instance, by lacking close modern analogues. Telford and Birks (2011) developed an easily applied method for testing the robustness of a reconstruction of a specific sequence. The approach is to create an ensemble of transfer functions using the same biological assemblage as the training set but with randomised values of the environmental variable and calculating the proportion of variance in the fossil data explained by a single reconstruction. If the reconstructed variable is found to explain more of the variance than 95 % of the random reconstructions, then the reconstruction is deemed to be statistically significant. We apply this approach with the palaeoSig package in R (Telford and Trachsel, 2015) to all core reconstructions as an indicator of their robustness.
2.4 Computing hardware
In this study, the computing CPU is an Intel Core i7-4710MQ; the model is supported by the scikit-learn package (Pedregosa et al., 2011), a powerful machine-learning Python package, which incorporates the most widely used machine-learning algorithms and related data-processing and validation functions. MEMLM supports parallel computing; with more CPU cores, the computing time will decrease significantly. The computational time taken for 5-fold cross-validation of the MEMLMc model is 138 s (SWAP), 406 s (NIMBIOS), and 2834 s (SMPDsV1).
3.1 Cross-validation
Table 1 compares the cross-validated RMSEP for the three training sets and the six reconstruction approaches (see Fig. A1 for regression visualisation of predicted values against observed values). Regression slope and R2 score are also provided. All validation data are the means of five separate cross-validation exercises, which are also used to provide a percentage error estimate for RMSEP (in parentheses). WA-PLS is found to be the best-performing classical approach in all three training sets as evaluated by RMSEP, but in each case it is outperformed by MEMLM, which reduces RMSEP by 6 % (SWAP; 167 training samples and 277 taxa), 22 % (NIMBIOS; 636 training samples and 533 taxa), and 50 % (SMPDSv1; 6548 samples and 257 taxa). The benefits of machine-learning approaches clearly increase with increasing training set size.
MEMLMe is trained only on the embedded assemblage data from GloVe. The approach does not work well for the SWAP training set, but it significantly improves upon WA approaches when using the larger NIMBIOS and SMPDVs1 training sets, suggesting that when the training set is large enough, embedding is able to extract most of the predictive power of the assemblages. However, MEMLMe is consistently the worst-performing MEMLM variant (albeit generally better than the WA approaches), and so we do not use it in the reconstructions.
We performed additional cross-validation tests on MEMLMe to confirm that the embedding approach can encode useful information, noting that with an embedding dimension of 256 (comparable to the number of taxa in the training sets) we are not applying the approach under significant dimensional reduction. To explore this, we applied a range of embedding dimensions to the MEMLMe model of the richest data set, namely the 533 taxon in the NIMBIOS data set (Fig. A2a). This sensitivity analysis demonstrates that 30 dimensions are sufficient for MEMLMe to outperform WA-PLS (RMSEP 2.914 °C) in this training set. Figure A2b illustrates the learning power of increased training, with RMSEP increasing by around 0.4 °C as the number of training epochs is reduced from the 1000 we used to 40.
MEMLMc uses both the taxon abundance and the embedding matrices. These additional data do not significantly affect the predictive performance relative to MEMLM under cross-validation, suggesting that conventional ensemble machine-learning approaches are sufficient to encode adequately the assemblage information in training sets comprising a few hundred taxa. However, we retain this model for downcore reconstructions to explore whether the addition of embedding information can affect reconstructions in a way that is not captured by RMSEP.
3.2 Environmental reconstructions and comparisons
For each core, we compare the reconstructions from the models with lowest RMSEP, namely the MEMLM and MEMLMc machine-learning approaches and the best classical approach (Sect. 2.3.3), which is WA-PLS, when using one component for SWAP, and WA-PLS, when using two components for NIMBIOS and SMPDSv1. In the Appendix, Figs. A3 to A7 illustrate scatterplot matrices of all six reconstruction approaches, and Figs. A8 to A12 compare reconstructions for all six models through time. In each reconstruction, we additionally provide the statistical significance test results (Telford and Birks, 2011). A reconstruction is considered significant when that reconstruction explains more of the variance than 95 % of 1000 randomised reconstructions, based on the same training assemblage but with randomised environmental values.
3.2.1 pH reconstructions from RLGH using the SWAP training set
MEMLM and WA-PLS1 show similar trends of acidification, with pH declining from around 5.2 at about 1870 to around 4.8 at about 1980 (see Fig. 2). MEMLMc shows a similar trend but with reduced acidification relative to the other approaches. All three reconstructions are statistically significant, and with high explained variance, though WA-PLS1 explains more variance (58 %) than MEMLM (46 %) or MEMLMc (52 %.). The variance explained by the first principal component of the fossil core assemblages is 62 %, indicating that the reconstructed pH explains most of the dominant part of the variance in the fossil diatom assemblages.
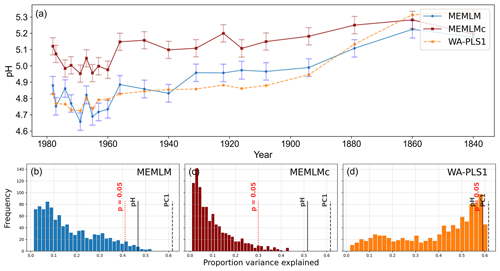
Figure 2(a) pH reconstruction for the RLGH core. (b, c, d) Statistical significance testing of MEMLM, MEMLMc, and WA-PLS1 reconstructions, respectively. MEMLM uncertainties are calculated using IBM UQ360 (Sect. 2.3.3). These compare with cross-validated RMSEP errors of 0.292 (MEMLM), 0.294 (MEMLMc), and 0.308 (WA-PLS1) for the pH units.
3.2.2 pH reconstruction from RLGH3 using the SWAP training set
All three methods provide reconstructions that show similar trends of lake water pH, with gradual acidification in the early record from around 5.6 to 5.2 pH, attributed to the development of organic soils (Jones et al., 1989) and then a rapid post-industrial acidification from around 5.2. to 4.8 pH. The three reconstructions also exhibit similar variability, previously attributed to loss of tree cover and peat erosion (Jones et al., 1989), further suggesting reconstruction robustness. Moreover, all three reconstructions are statistically significant, explaining between 23 % and 27 % of the core variance, which compares to the 32 % variance explained by the first principal component of the fossil assemblages (Fig. 3).
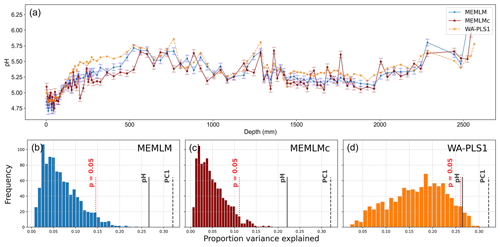
Figure 3(a) pH reconstruction for the RLGH3 core. (b, c, d) Statistical significance testing of MEMLM, MEMLMc, and WA-PLS1 reconstructions, respectively. MEMLM uncertainties are calculated using IBM UQ360 (Sect. 2.3.3). These compare with cross-validated RMSEP errors of 0.292 (MEMLM), 0.294 (MEMLMc), and 0.308 (WA-PLS1) for the pH units.
3.2.3 MAT reconstruction from Consuelo using the NIMBIOS training set
All three methods display similar trends, most notably reconstructing about a 4 °C warming from the Last Glacial Maximum at 21 ka to the start of the Holocene at 11 ka. The MEMLM approaches are more variable in general, although variability is largely synchronous between the three reconstruction approaches and may be associated with Dansgaard–Oeschger (D/O) events (Bond et al., 1993; Blunier and Brook, 2001). At 8 ka, WA-PLS2 displays a 10 °C cooling excursion which is not apparent in the MEMLM reconstructions. Although a cooling event at 8.2 ka is well known, the cooling reconstructed by WA-PLS2 seems excessive. All three methods are statistically significant and explain the core assemblage variance of between 27 % and 29 %, compared to 32 % explained by the first principal component (Fig. 4).
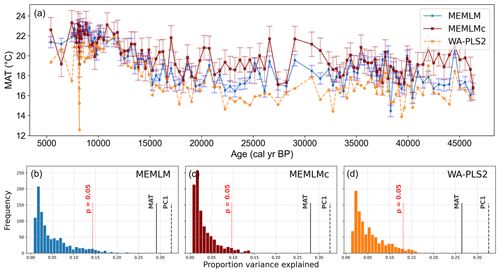
Figure 4(a) MAT reconstruction for the Consuelo core. (b, c, d) Statistical significance testing of MEMLM, MEMLMc, and WA-PLS2 reconstructions, respectively. MEMLM uncertainties are calculated using IBM UQ360 (Sect. 2.3.3). These compare with cross-validated RMSEP errors of 2.254 (MEMLM), 2.094 (MEMLMc), and 4.979 (WA-PLS2) °C.
3.2.4 MAT reconstruction from Llaviucu using the NIMBIOS training set
All three methods display similar overall trends with mid-Holocene warming, but each displays different centennial variability, which for the MEMLMc reconstruction is clearly unrealistic for the Holocene, with temperature excursions as large as 8 °C. Neither of the MEMLM approaches is statistically significant at the 95 % confidence level, so neither can be accepted as robust. The WA-PLS2 reconstruction is statistically significant, although it only explains 13 % of the core assemblage variance compared to the 28 % explained by the first principal component of the core data (Fig. 5).
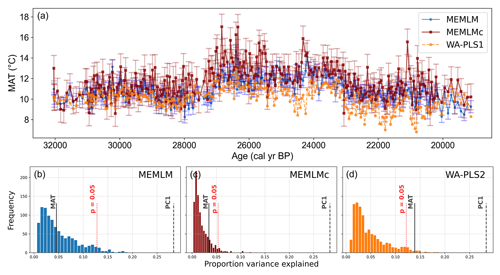
Figure 5(a) MAT reconstruction for the Llaviucu core. (b, c, d) Statistical significance testing of MEMLM, MEMLMc, and WA-PLS2 reconstructions, respectively. MEMLM uncertainties are calculated using IBM UQ360 (Sect. 2.3.3). These compare with cross-validated RMSEP errors of 2.254 (MEMLM), 2.094 (MEMLMc), and 4.979 (WA-PLS2) °C.
3.2.5 MTCO reconstruction from Villarquemado using the SMPDSv1 training set
All three approaches generate noisy reconstructions with high variability that is incoherent. It is difficult to discern any meaningful trends. None of the reconstructions, including WA-PLS2, is statistically significant. The low (17 %) variance associated with the first principal component suggests that the fossil assemblages are responding to multiple environmental factors with responses that are too complex to be captured by a single explanatory environmental variable (Fig. 6).
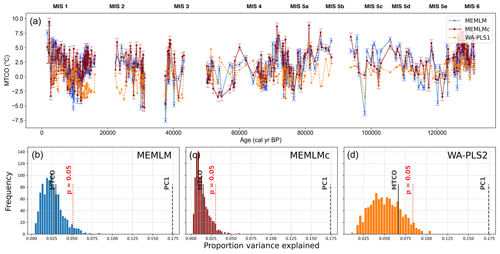
Figure 6(a) MTCO reconstruction for the Villarquemado core. (b, c, d) Statistical significance testing of MEMLM, MEMLMc, and WA-PLS2 reconstructions, respectively. MEMLM uncertainties are calculated using IBM UQ360 (Sect. 2.3.3). These compare with cross-validated RMSEP errors of 2.353 (MEMLM), 2.434 (MEMLMc), and 2.923 (WA-PLS2) °C.
We have developed three variants of a multi-model ensemble machine-learning algorithm, MEMLM. These each train three separate ensemble machine-learning algorithms (random forests, extremely random trees, and LightGBM) and combine them into a consensus reconstruction using multiple regression. The three approaches only differ in their input data. The simpler MEMLM takes only taxon abundance data. MEMLMe, built only upon the GloVe embedding matrix, does not perform as well as MEMLM. However, MEMLMe was found to be a useful reconstruction model, at least when applied to the larger NIMBIOS and SMPDSv1 training sets, and the embedding usefully summarises taxon assemblages with fewer than 50 dimensions. Our motivation for retaining 256 embedding dimensions in MEMLMe is that the focus of GloVe is on extracting semantic meaning. In linguistics, typically 200 dimensions of meaning are needed to encode fully a language. While we have shown that far fewer dimensions are sufficient to build a good reconstruction model, demonstrating the explanatory power of the most important embedding dimensions, there are progressive improvements in performance as dimensional size increases (Fig. A2). This demonstrates that less important dimensions can provide useful explanatory information and potentially additional understanding and interpretability.
The additional complexity of MEMLMc, which uses both taxon count and embedding, did not significantly affect the predictive performance relative to MEMLM under cross-validation, suggesting that conventional ensemble machine-learning approaches are sufficient to encode adequately ecological information in the relatively small data sets used in these palaeoclimate reconstructions. We note that the real power of embedding (dimension reduction) approaches is likely to be in their applications to much larger data sets when ecological relationships between 10 000 s of taxa and their environment are being considered.
We have focussed only on a comparison with weighted-averaging approaches, which are the most widely used reconstruction technique and simple to apply, well understood, and straightforward to interpret. The MEMLM approaches are found to perform better than classical weighted-averaging approaches under cross-validation. In the case of the smallest SWAP data set, the advantages are modest, but in the largest SMPDSv1 data set, RMSEP errors are reduced by a factor of 2 relative to the best-performing classical WA approach. These improvements in performance clearly validate the potential benefits of strong data-mining abilities of machine learning, suggesting these techniques have the potential to improve upon classical reconstruction approaches.
When applied to core reconstructions, MEMLM approaches generate considerably more variability than the WA-PLS reconstructions. While some elements of this additional variability might be realistic, especially considering that WA-PLS approaches are known to bias reconstructions towards the centre of their training data (Liu et al., 2020), the variability is not always coherent between different reconstruction approaches, and the magnitude of MEMLM variability is in some cases implausibly high, for example, by suggesting Holocene variability of up to 8 °C in the Ecuadorian Llaviucu core.
We performed significance testing on all core reconstructions and found that 5 of the 15 reconstructions are not statistically significant and therefore are not considered robust. Both MEMLM and MEMLMc approaches fail on the Llaviucu core, confirming our suspicion that the unrealistic variability is an artefact. All three approaches fail the statistical robustness test at Villarquemado, which is sensitive to multiple environmental factors and has responses which appear too complex to be captured by a single explanatory variable.
The shapes of the histograms of the proportion of variance explained in the RLGH and RLGH3 pH reconstructions based on diatom data and randomised modern SWAP training pH values in the significance testing are very different for WA-PLS1 and for MEMLM and MEMLMc (Figs. 2, 3). Such differences contrast with the more consistent histogram shape for the significance test results for the other sequences where the reconstructions are based on pollen data (Figs. 4–6). Machine-learning approaches generally fail badly when trained with randomised environmental data, as the histograms are left-skewed and explain little downcore variance (Figs. 2–6). In contrast, the WA-PLS1 pH reconstructions (Figs. 2, 3) based on diatom data explain a substantial amount of the downcore variance – even when the modern pH data are randomised (Figs. 2, 3). This may result from the short and dominant environmental gradient in the SWAP diatom–pH training data and the high inherent correlation and dominance of a relatively few abundant taxa within the modern and fossil diatom data. The pollen training data, however, used for the MAT or MTCO reconstructions of the other sequences (Figs. 4–6) are large (638 and 6458 samples) and hence cover longer and more complex environmental gradients than the pH training data (167 samples). It is also likely that the pollen data, both modern and fossil, are influenced by multiple environmental factors and not only MAT or MTCO.
In summary, while MEMLM can generate useful reconstructions, it should always be used in conjunction with statistical significance testing to confirm that the reconstructions are robust and potentially realistic and reliable. The additional complexities of incorporating embedding information in MEMLMc does not reduce RMSEP or spurious variability and neither does it improve statistical significance. However, MEMLMe demonstrates that embedding is useful, as it can summarise ecological assemblages using significantly fewer dimensions. Its benefits may be clearer in applications with much larger data sets and in applications beyond palaeoenvironmental reconstructions. The poor performance of MEMLM in some reconstructions may be due to extrapolation due to no-analogue fossil assemblages. All models are applied under the same extrapolation. The WA-PLS2 reconstructions exhibit higher statistical significance than MEMLM, although WA-PLS2 also fails to generate robust reconstructions at Villarquemado. We infer that the use of simpler WA models, which include a major biological assumption (unimodal environmental response) can be more powerful than the use of brute-force learning, despite reductions in RMSEP. We reiterate our recommendation that all reconstructions using any approach should be accompanied with statistical significance testing. Seemingly useful models may fail when applied under extrapolation or when the assemblage variance is only weakly dependent on the reconstructed environmental variable.
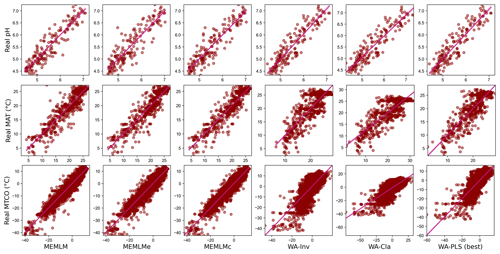
Figure A1Scatterplots of observed values against predicted values in three training sets. MEMLM uses the abundance matrix. MEMLMe uses the assemblage embedding matrix. MEMLMc uses the abundance and the assemblage embedding matrices. A component number of WA-PLS was selected for each training set as the lowest component that showed a 5 % improvement over the previous component (Table A4). WA-Cla is weighted averaging with a classical deshrinking regression, and WA-Inv is weighted averaging with an inverse deshrinking regression (Birks et al., 1990). The number of WA-PLS components is selected based on the method described in Sect. 2.3.3 (see Table S3 for the full results).
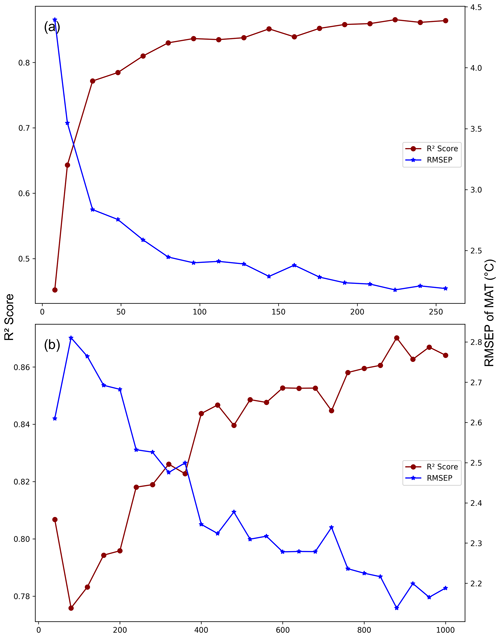
Figure A2MEMLMe prediction performance under different GloVe hyperparameter settings. (a) Fixed epoch = 1000 (set embedding dimensions from 8 to 256). (b) Fixed embedding dimensions = 256 (set epoch from 40 to 1000). The model is developed from the NIMBIOS set and trained on mean annual temperature (MAT).
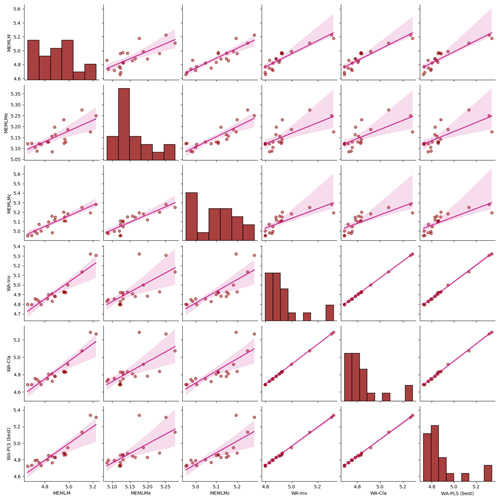
Figure A3Inter-regression of pH reconstructions for six different models for the Round Loch of Glenhead (RLGH) core.
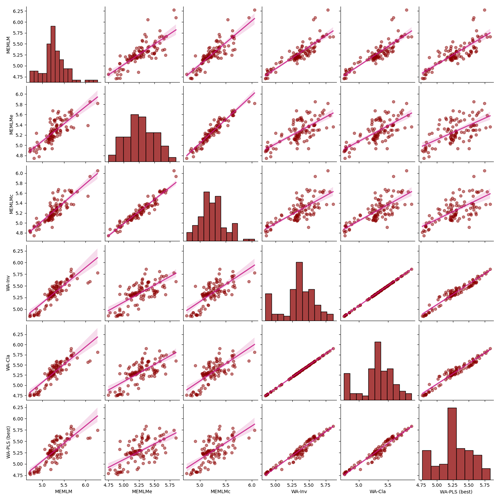
Figure A4Inter-regression of pH reconstructions for six different models for the Round Loch of Glenhead 3 (RLGH3) core.
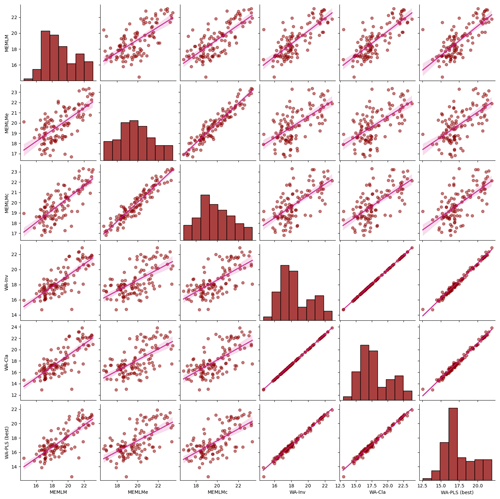
Figure A5Inter-regression of mean annual temperature (MAT) reconstructions for six different models for the Consuelo core.
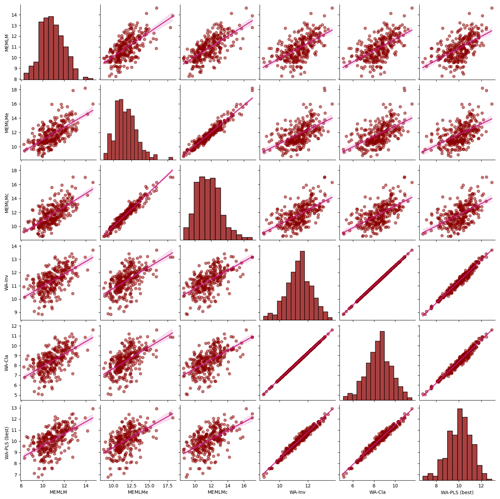
Figure A6Inter-regression of mean annual temperature (MAT) reconstructions for six different models for the Llaviucu core.
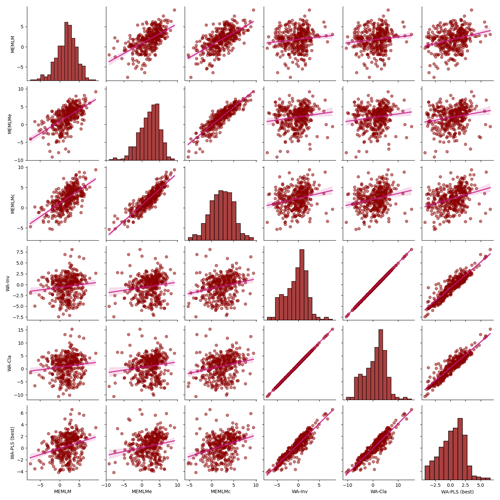
Figure A7Inter-regression of mean annual temperature (MAT) reconstructions for six different models for the Villarquemado core.

Figure A12Mean temperature of the coldest month (MTCO) based on six models for the Villarquemado core.
Table A1Root mean square error of prediction (RMSEP) and R2 values (based on cross-validation) of the 18 environment elements prediction of MEMLMc in the NIMBIOS data set. Mean is average of the prediction of the three downstream models. RF presents the random forest values; ERT presents the extra random tree results. Bold highlights the model with the best prediction performance.
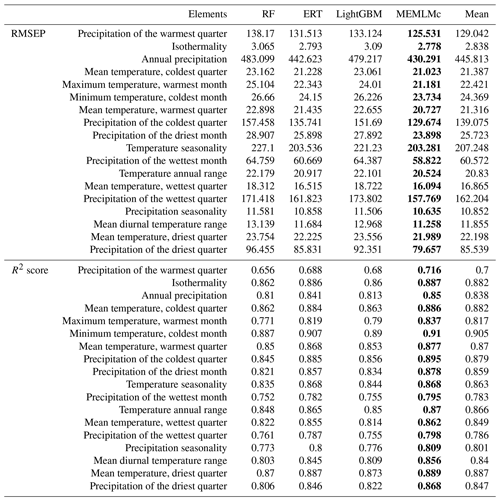
Table A2Weights of the linear models in MEMLM, MEMLMe, and MEMLMc for the three training sets.

RF – random forest; ERT – extra random tree; LightGBM – a gradient-boosting decision tree.
Table A3The weights of the 10 most important taxa for the environmental reconstructions in the SWAP, NIMBIOS, and SMPDSv1 training sets sorted by the random forest results. Diatom taxon codes follow Stevenson et al. (1991).
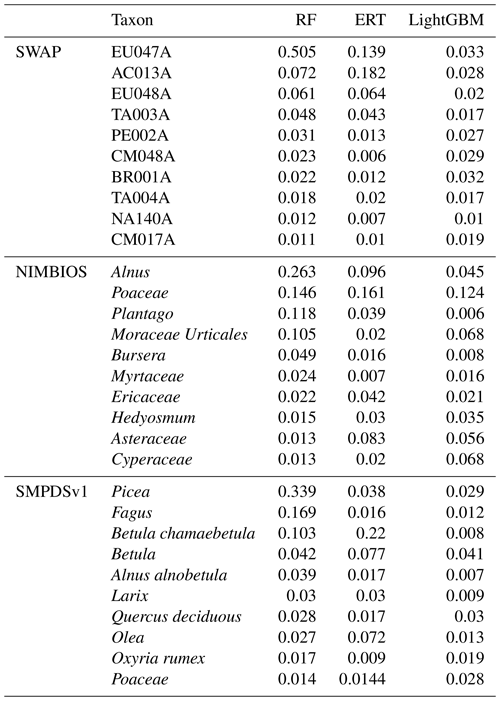
RF – random forest; ERT – extra random tree; LightGBM – a gradient-boosting decision tree.
Table A4RMSEP (based on cross-validation) of the first five components (Comp) in the weighted-averaging partial least squares (WA-PLS) of the three training sets. Bold highlights the best component, noting that we accept a higher PLS component only if it exhibits a 5 % improvement on the previous component (Birks, 1998).

All codes are available in GitHub. WA and WA-PLS use the rioja package (https://github.com/nsj3/rioja, Juggins, 2017). Telford and Birks (2011) statistical significance uses randomTF in the palaeoSig package (https://github.com/richardjtelford/palaeoSig, Telford and Trachsel, 2015). MEMLM is available at https://doi.org/10.5281/zenodo.13138593 (Sun, 2024).
All data sets can be found in the cited data sets and articles in the references, except the RLGH3 and Llaviucu core data. The latter were made available to us by Mark Bush.
PS conceptualised the application of GloVe to ecological assemblages. PS, PBH, and HJBB conceptualised the experimental design. PS developed the MEMLM model and performed all analyses and graphical visualisations. HJBB contributed assemblage data. PS and PBH wrote the paper, with reviewing and editing by HJBB.
The contact author has declared that none of the authors has any competing interests.
Publisher’s note: Copernicus Publications remains neutral with regard to jurisdictional claims made in the text, published maps, institutional affiliations, or any other geographical representation in this paper. While Copernicus Publications makes every effort to include appropriate place names, the final responsibility lies with the authors.
Peng Sun was funded by a doctoral scholarship from the China Scholarship Council (CSC; grant no. 202104910033). H. John B. Birks's participation has been possible thanks to the European Research Council under the European Union's Horizon 2020 Research and Innovation Programme (grant no. 74143) to the project “HOPE: Humans on Planet Earth – long-term impacts on biosphere dynamics”. We thank Mark Bush and Alex Correa-Metrio for generously providing the NIMBIOS modern pollen data and Llaviucu fossil pollen data and Graciela Gil Romera for generously providing the SMPDSv1 modern pollen data and Villarquemado fossil pollen data. We are grateful to Cajo ter Braak and Andrew Parnell for valuable comments that improved the paper. H. John B. Birks thanks Cathy Jenks for her invaluable help.
This research has been supported by the China Scholarship Council (grant no. 202104910033), by the H2020 European Research Council (grant no. 74143), and by the School of Environment, Earth and Ecosystem Sciences at the Open University, who paid the publication charges.
This paper was edited by Irina Rogozhina and reviewed by Cajo ter Braak and Andrew Parnell.
Aguirre-Gutiérrez, J., Rifai, S., Shenkin, A., Oliveras, I., Bentley, L. P., Svátek, M., Girardin, C. A. J., Both, S., Riutta, T., Berenguer, E., Kissling, W. D., Bauman, D., Raab, N., Moore, S., Farfan-Rios, W., Figueiredo, A. E. S., Reis, S. M., Ndong, J. E., Ondo, F. E., N'ssi Bengone, N., Mihindou, V., Moraes de Seixas, M. M., Adu-Bredu, S., Abernethy, K., Asner, G. P., Barlow, J., Burslem, D. F. R. P., Coomes, D. A., Cernusak, L. A., Dargie, G. C., Enquist, B. J., Ewers, R. M., Ferreira, J., Jeffery, K. J., Joly, C. A., Lewis, S. L., Marimon-Junior, B. H., Martin, R. E., Morandi, P. S., Phillips, O. L., Quesada, C. A., Salinas, N., Schwantes Marimon, B., Silman, M., Teh, Y. A., White, L. J. T., and Malhi, Y.: Pantropical modelling of canopy functional traits using Sentinel-2 remote sensing data, Remote Sens. Environ., 252, 112122, https://doi.org/10.1016/j.rse.2020.112122, 2021.
Allott, T. E. H., Harriman, R., and Battarbee, R. W.: Reversibility of lake acidification at the Round Loch of Glenhead, Galloway, Scotland, Environ. Pollut., 77, 219–225, https://doi.org/10.1016/0269-7491(92)90080-T, 1992.
Battarbee, R. W., Monteith, D. T., Juggins, S., Evans, C. D., Jenkins, A., and Simpson, G. L.: Reconstructing pre-acidification pH for an acidified Scottish loch: A comparison of palaeolimnological and modelling approaches, Environ. Pollut., 137, 135–149, https://doi.org/10.1016/j.envpol.2004.12.021, 2005.
Birks, H. J. B., ter Braak, C. J. F, Line, J. M., Juggins, S., and Stevenson, A. C.: Diatoms and pH reconstruction, Phil. Trans. R. Soc. Lond. B, 327, 263–278, https://doi.org/10.1098/rstb.1990.0062, 1990.
Birks, H. J. B.: Numerical tools in palaeolimnology – Progress, potentialities, and problems, J. Paleolimnol., 20, 307–332, https://doi.org/10.1023/A:1008038808690, 1998.
Blunier, T. and Brook, E. J.: Timing of millennial-scale climate change in Antarctica and Greenland during the Last Glacial period, Science, 291, 109–112, https://doi.org/10.1126/science.291.5501.109, 2001.
Bond, G., Broecker, W., Johnsen, S., McManus, J., Labeyrie, L., Jouzel, J., and Bonani, G.: Correlations between climate records from North Atlantic sediments and Greenland ice, Nature, 365, 143–147, https://doi.org/10.1038/365143a0, 1993.
Brooks, S. J. and Birks, H. J. B.: Chironomid-inferred air temperatures from Lateglacial and Holocene sites in north-west Europe: progress and problems, Quat. Sci. Rev., 20, 1723–1741, https://doi.org/10.1016/S0277-3791(01)00038-5, 2001.
Bush, M. B., Correa-Metrio, A., van Woesik, R., Collins, A., Hanselman, J., Martinez, P., and McMichael, C. N. H.: Modern pollen assemblages of the Neotropics, J. Biogeogr., 48, 231–241, https://doi.org/10.1111/jbi.13960, 2021.
Christin, S., Hervet, É., and Lecomte, N.: Applications for deep learning in ecology, Methods Ecol. Evol., 10, 1632–1644, https://doi.org/10.1111/2041-210X.13256, 2019.
Clapperton. C. M: Maximum extent of the late Wisconsin glaciation in the Ecuadorian Andes Quaternary of South America and Antarctic Peninsula, Balkema, Rotterdam, 165–180, ISBN 9781003079323, 1987.
Cleator, S. F., Harrison, S. P., Nichols, N. K., Prentice, I. C., and Roulstone, I.: A new multivariable benchmark for Last Glacial Maximum climate simulations, Clim. Past, 16, 699–712, https://doi.org/10.5194/cp-16-699-2020, 2020.
Colinvaux, P. A., Olson, K., and Liu, K. B.: Late-glacial and Holocene pollen diagrams from two endorheic lakes of the inter-Andean plateau of Ecuador, Rev. Palaeobot. Palynol., 55, 83–99, https://doi.org/10.1016/0034-6667(88)90055-3, 1988.
Colinvaux, P. A., Bush, M. B., Steinitz-Kannan, M., and Miller, M. C.: Glacial and Postglacial Pollen Records from the Ecuadorian Andes and Amazon, Quat. Res., 48, 69–78, https://doi.org/10.1006/qres.1997.1908, 1997.
de la Houssaye, B., Flaming, P. L., Nixon, Q., and Acton, G. D.: Machine learning and deep learning applications for international ocean discovery program geoscience research, SMU Data Sci. Rev., 2, 9, https://scholar.smu.edu/datasciencereview/vol2/iss3/9 (last access: 17 October 2024), 2019.
Friedman J. H.: Greedy function approximation: A gradient boosting machine, Ann. Statist, 29, 1189–1232, https://doi.org/10.1214/aos/1013203451, 2011.
Geurts, P., Ernst, D., and Wehenkel, L.: Extremely randomized trees, Mach. Learn., 63, 3–42, https://doi.org/10.1007/s10994-006-6226-1, 2006.
Ghosh, S., Liao, Q. V., Ramamurthy, K. N., Navratil, J., Sattigeri, P., Varshney, K. R., and Zhang, Y.: Uncertainty Quantification 360: A Holistic Toolkit for Quantifying and Communicating the Uncertainty of AI, https://doi.org/10.48550/arXiv.2106.01410, 2021.
Hais, M., Komprdová, K., Ermakov, N., and Chytrý, M.: Modelling the Last Glacial Maximum environments for a refugium of Pleistocene biota in the Russian Altai Mountains, Siberia, Palaeogeogr. Palaeoclimatol. Palaeoecol., 438, 135–145, https://doi.org/10.1016/j.palaeo.2015.07.037, 2015.
Harrison, S. P: Modern pollen data for climate reconstructions, version 1 (SMPDS), University of Reading, https://doi.org/10.17864/1947.194, 2019.
Harrison, S. P.: Climate reconstructions for the SMPDSv1 modern pollen data set, Zenodo [data set], https://doi.org/10.5281/zenodo.3605003, 2020.
Harrison, S. P., González-Sampériz, P., Gil-Romera, G.: Fossil pollen data for climate reconstructions from El Cañizar de Villarquemado, University of Reading, https://doi.org/10.17864/1947.219, 2019.
Heiri, O., Lotter, A. F., Hausmann, S., and Kienast, F.: A chironomid-based Holocene summer air temperature reconstruction from the Swiss Alps, Holocene, 13, 477–484, https://doi.org/10.1191/0959683603hl640ft, 2003.
Helama, S., Makarenko, N. G., Karimova, L. M., Kruglun, O. A., Timonen, M., Holopainen, J., Meriläinen, J., and Eronen, M.: Dendroclimatic transfer functions revisited: Little Ice Age and Medieval Warm Period summer temperatures reconstructed using artificial neural networks and linear algorithms, Ann. Geophys., 27, 1097–1111, https://doi.org/10.5194/angeo-27-1097-2009, 2009.
Holden, P. B., Birks, H. J. B., Brooks, S. J., Bush, M. B., Hwang, G. M., Matthews-Bird, F., Valencia, B. G., and van Woesik, R.: BUMPER v1.0: a Bayesian user-friendly model for palaeo-environmental reconstruction, Geosci. Model Dev., 10, 483–498, https://doi.org/10.5194/gmd-10-483-2017, 2017.
Huang, Y., Yang, L., and Fu, Z.: Reconstructing coupled time series in climate systems using three kinds of machine-learning methods, Earth Syst. Dynam., 11, 835–853, https://doi.org/10.5194/esd-11-835-2020, 2020.
Jones, V. J., Stevenson, A. C., and Battarbee, R. W.: Acidification of lakes in Galloway, south-west Scotland: a diatom and pollen study of the post-glacial history of the Round Loch of Glenhead, J. Ecol., 77, 1–22, https://doi.org/10.2307/2260912, 1989.
Jordan, G. J., Harrison, P. A., Worth, J. R. P., Williamson, G. J., and Kirkpatrick, J. B.: Palaeoendemic plants provide evidence for persistence of open, well-watered vegetation since the Cretaceous, Glob. Ecol. Biogeogr., 25, 127–140, https://doi.org/10.1111/geb.12389, 2016.
Juggins, S.: Rioja: analysis of Quaternary science data, CRAN [code], R package version (0.9–15.1), https://github.com/nsj3/rioja (last access: 17 October 2024), 2017.
Ke, G., Meng, Q., Finley, T., Wang, T., Chen, W., Ma, W., Ye, Q., and Liu, T.-Y.: LightGBM: A highly efficient gradient boosting decision tree, in: Advances in Neural Information Processing Systems, edited by: Guyon, I., Von Luxburg, U., Bengio, S., Wallach, H., Fergus, R., Vishwanathan, S., and Garnett, R., 30, https://papers.nips.cc/paper_files/paper/2017/file/6449f44a102fde848669bdd9eb6b76fa-Paper.pdf (last access: 17 October 2024), 2017.
Liaw, A. and Wiener, M.: Classification and regression by randomForest, R news, 2, 18–22, https://journal.r-project.org/articles/RN-2002-022/RN-2002-022.pdf (last access: 17 October 2024), 2002.
Liu, M., Prentice, I. C., ter Braak, C. J. F., and Harrison, S. P.: An improved statistical approach for reconstructing past climates from biotic assemblages, Proc. R. Soc. A, 476, 20200346, https://doi.org/10.1098/rspa.2020.0346, 2020.
Norberg, A., Abrego, N., Blanchet, F. G., Adler, F. R., Anderson, B. J., Anttila, J., Araújo, M. B., Dallas, T., Dunson, D., Elith, J., Foster, S. D., Fox, R., Franklin, J., Godsoe, W., Guisan, A., O'Hara, B., Hill, N. A., Holt, R. D., Hui, F. K. C., Husby, M., Kålås, J. A., Lehikoinen, A., Luoto, M., Mod, H. K., Newell, G., Renner, I., Roslin, T., Soininen, J., Thuiller, W., Vanhatalo, J., Warton, D., White, M., Zimmermann, N. E., Gravel, D., and Ovaskainen, O.: A comprehensive evaluation of predictive performance of 33 species distribution models at species and community levels, Ecol. Monogr., 89, e01370, https://doi.org/10.1002/ecm.1370, 2019.
Ovaskainen, O., Tikhonov, G., Norberg, A., Blanchet, F. G., Duan, L., Dunson, D., Roslin, T., and Abrego, N.: How to make more out of community data? A conceptual framework and its implementation as models and software, Ecol. Lett., 20, 561–576, https://onlinelibrary.wiley.com/doi/10.1111/ele.12757 (last access: 23 October 2024), 2017.
Paszke, A., Gross, S., Massa, F., Lerer, A., Bradbury, J., Chanan, G., Killeen, T., Lin, Z., Gimelshein, N., Antiga, L. and Desmaison, A., Andreas K., Edward Z. Y., Zachary D., Martin R., Alykhan T., Sasank C., Benoit S., Lu F., Junjie B., and Soumith C.: Pytorch: An imperative style, high-performance deep learning library, Adv. Neur. In., 32, 8024–8035, arXiv:1912.01703, 2019.
Pedregosa, F., Varoquaux, G., Gramfort, A., Michel, V., Thirion, B., Grisel, O., Blondel, M., Prettenhofer, P., Weiss, R., Dubourg, V., Vanderplas, J., Passos, A., Cournapeau, D., Brucher, M., Perrot, M., and Duchesnay, É.: Scikit-Learn: Machine Learning in Python, J. Mach. Learn. Res., 12, 2825–2830, 2011.
Pennington, J., Socher, R., and Manning, C.: GloVe: Global Vectors for Word Representation, in: Proceedings of the 2014 Conference on Empirical Methods in Natural Language Processing (EMNLP), 1532–1543, https://doi.org/10.3115/v1/D14-1162, 2014.
Schulte, P. J. and Hinckley, T. M.: A comparison of pressure-volume curve data-analysis techniques, J. Exp. Bot., 36, 1590– 1602, https://doi.org/10.1093/jxb/36.10.1590, 1985.
Steinitz-Kannan, M., Colinvaux P. A., and Kannan, R.: Limnological Studies in Ecuador 1. A survey of chemical and physical properties of Ecuadorian lakes, Arch. Hydrobiol., Suppl., 65, 61–105, 1983.
Stevenson, A. C, Juggins, S., Birks, H. J. B., Anderson, D. S., Anderson, N. J., Battarbee, R. W., Berge, F., Davis, R. B, Flower, R. J., and Haworth, E. Y.: The Surface Waters Acidification Project Palaeolimnology Programme: Modern Diatom/Lake-Water Chemistry Data-Set, UCL Environmental Change Research Centre, https://doi.org/10.1098/rstb.1990.0056, 1991.
Sun, P.: Schimasuperbra/MEMLM: Multi Ensemble Machine Learning Model (v1.0.0), Zenodo [code], https://doi.org/10.5281/zenodo.13138593, 2024.
Syam, N. and Kaul, R.: Overfitting and Regularization in Machine Learning Models in Machine Learning and Artificial Intelligence in Marketing and Sales, Emerald Publishing Limited, Bingley, 65–84, https://doi.org/10.1108/978-1-80043-880-420211004, 2021.
Telford, R. J. and Birks, H. J. B.: A novel method for assessing the statistical significance of quantitative reconstructions inferred from biotic assemblages, Quat. Sci. Rev., 30, 1272–1278, https://doi.org/10.1016/j.quascirev.2011.03.002, 2011.
Telford, R. J. and Trachsel, M.: palaeoSig: Significance Tests for Palaeoenvironmental Reconstructions, R Package Version 1.1-3, University of Bergen [code], Bergen, https://github.com/richardjtelford/palaeoSig (last access: 17 October 2024), 2015.
ter Braak, C. J. F.: Partial canonical correspondence analysis, in: Classification and Related Methods of Data Analysis, edited by: Bock, H. H., 551–558, Elsevier Science Publishers B.V. (North-Holland), http://edepot.wur.nl/241165 (last access: 17 October 2024), 1988.
ter Braak, C. J. F. and Barendregt, L. G.: Weighted averaging of species indicator values: Its efficiency in environmental calibration, Math Biosci., 78, 57–72, https://doi.org/10.1016/0025-5564(86)90031-3, 1986.
ter Braak, C. J. F. and te Beest, D. E.: Testing environmental effects on taxonomic composition with canonical correspondence analysis: alternative permutation tests are not equal, Environ. Ecol. Stats, 29, 849–868, https://doi.org/10.1007/s10651-022-00545-4, 2022.
ter Braak, C. J. F. and Juggins, S.: Weighted averaging partial least squares regression (WA-PLS): an improved method for reconstructing environmental variables from species assemblages, Hydrobiologia, 269, 485–502, https://doi.org/10.1007/BF00028046, 1993.
Turner, M. G., Wei, D., Prentice, I. C., and Harrison, S. P.: The impact of methodological decisions on climate reconstructions using WA-PLS, Quat. Res., 99, 341–356, https://doi.org/10.1017/qua.2020.44, 2020.
Urrego, D. H., Bush, M. B., and Silman, M. R.: A long history of cloud and forest migration from Lake Consuelo, Peru, Quat. Res., 73, 364–373, https://doi.org/10.1016/j.yqres.2009.10.005, 2010.
Wei, D., González-Sampériz, P., Gil-Romera, G., Harrison, S. P., and Prentice, I. C.: Seasonal temperature and moisture changes in interior semi-arid Spain from the last interglacial to the Late Holocene, Quat. Res., 101, 143–155, https://doi.org/10.1017/qua.2020.108, 2021a.
Wei, G., Peng, C., Zhu, Q., Zhou, X., and Yang, B.: Application of machine learning methods for paleoclimatic reconstructions from leaf traits, Int. J. Clim., 41, E3249–E3262, https://doi.org/10.1002/joc.6921, 2021b.
Yates, L. A., Aandahl, Z., Richards, S. A., and Brook, B. W.: Cross validation for model selection: A review with examples from ecology, Ecol. Monogr., 93, e1557, https://doi.org/10.1002/ecm.1557, 2023.
Yeom, S., Giacomelli, I., Fredrikson, M., and Jha, S.: Privacy Risk in Machine Learning: Analyzing the Connection to Overfitting, 2018 IEEE 31st Computer Security Foundations Symposium (CSF), 268–282, https://doi.org/10.1109/CSF.2018.00027, 2018.
Zhou, Z. H.: Ensemble Methods: Foundations and Algorithms, 236, CRC Press, New York, ISBN 9780429151095, 2012.


