the Creative Commons Attribution 4.0 License.
the Creative Commons Attribution 4.0 License.
 | 07 Aug 2024
Mid-Holocene climate at mid-latitudes: assessing the impact of Saharan greening
Gabriele Messori
Francesco S. R. Pausata
Shivangi Tiwari
M. Carmen Alvarez Castro
Qiong Zhang
During the first half of the Holocene (11 000 to 5000 years ago), the Northern Hemisphere experienced a strengthening of the monsoonal regime, with climate reconstructions robustly suggesting a greening of the Sahara region. Palaeoclimate archives also show that this so-called African humid period (AHP) was accompanied by changes in climate conditions at middle to high latitudes. However, inconsistencies still exist in reconstructions of the mid-Holocene (MH) climate at mid-latitudes, and model simulations provide limited support in reducing these discrepancies. In this paper, a set of simulations performed using a climate model are used to investigate the hitherto unexplored impact of Saharan greening on mid-latitude atmospheric circulation during the MH. Numerical simulations show Saharan greening has a year-round impact on the main circulation features in the Northern Hemisphere, especially during boreal summer (when the African monsoon develops). Key findings include a westward shift in the global Walker Circulation, leading to modifications in the North Atlantic jet stream in summer and the North Pacific jet stream in winter. Furthermore, Saharan greening modifies atmospheric synoptic circulation over the North Atlantic, enhancing the effect of orbital forcing on the transition of the North Atlantic Oscillation phase from predominantly positive to negative in winter and summer. Although the prescription of vegetation in the Sahara does not improve the proxy–model agreement, this study provides the first constraint on the influence of Saharan greening on northern mid-latitudes, opening new opportunities for understanding MH climate anomalies in regions such as North America and Eurasia.
- Article
(13016 KB) - Full-text XML
- BibTeX
- EndNote


During the early and middle Holocene (11 000 to 5000 years ago), the summer solstice occurred close to the perihelion of the Earth's orbit, which led to increased insolation during boreal summer and consequent modifications in climate seasonality. This period is often referred to as the “Holocene thermal optimum”, a time marked by notable climate and environmental changes in the tropics and at middle and high latitudes. The Northern Hemisphere experienced a reinforcement of the global monsoonal regime (Bosmans et al., 2012; Haug et al., 2001; Jiang et al., 2015; Wang et al., 2008; Wu and Tsai, 2021; Yuan et al., 2004; Zhao and Harrison, 2012). This monsoonal intensification was particularly evident in Africa, which led to the so-called African humid period (AHP) and the subsequent greening of the Sahara (Adkins et al., 2006; Claussen et al., 1999, 2017; Claussen and Gayler, 1997; Hoelzmann et al., 1998; Larrasoaña et al., 2013; Pausata et al., 2020; Tierney et al., 2011, 2017; Tierney and DeMenocal, 2013).
At mid-latitudes, palaeoclimate proxies suggest a complex climatic evolution, including gradual cooling in the northeastern Atlantic contrasted with warming in the western subtropical Atlantic, the eastern Mediterranean, and the northern Red Sea from the early to the middle Holocene (Andersson et al., 2010; Rimbu et al., 2003). These changes were accompanied by predominantly negative phases of the Arctic Oscillation and North Atlantic Oscillation (AO and NAO, respectively) (Nesje et al., 2001; Olsen et al., 2012; Rimbu et al., 2003). Proxy records further indicate region-specific climatic deviations from the pre-industrial climate: eastern North America and Scandinavia likely experienced warmer and drier conditions; western Europe likely had colder winters and warmer summers; central Europe probably experienced overall warming; the Mediterranean likely experienced colder and rainier conditions; and central Asia likely saw increased annual rainfall, warmer winters and colder summers (Fig. 1) (see e.g. Cronin et al., 2005; Bartlein et al., 2011; Scholz et al., 2012; Samartin et al., 2017; Davis et al., 2003). However, the interpretation of these climatic changes, particularly regarding temperature and precipitation patterns (as indicated by proxies), seems potentially inconsistent with the suggested changes in atmospheric circulation – for example, a drier eastern North America, warmer Scandinavia, and colder Mediterranean would be inconsistent with a positive-to-negative shift in the NAO/AO phase). Furthermore, differences exist in the estimation of both the timing and magnitude of the Holocene thermal maximum at middle to high latitudes (Cartapanis et al., 2022; Kaufman et al., 2004; Renssen et al., 2009).
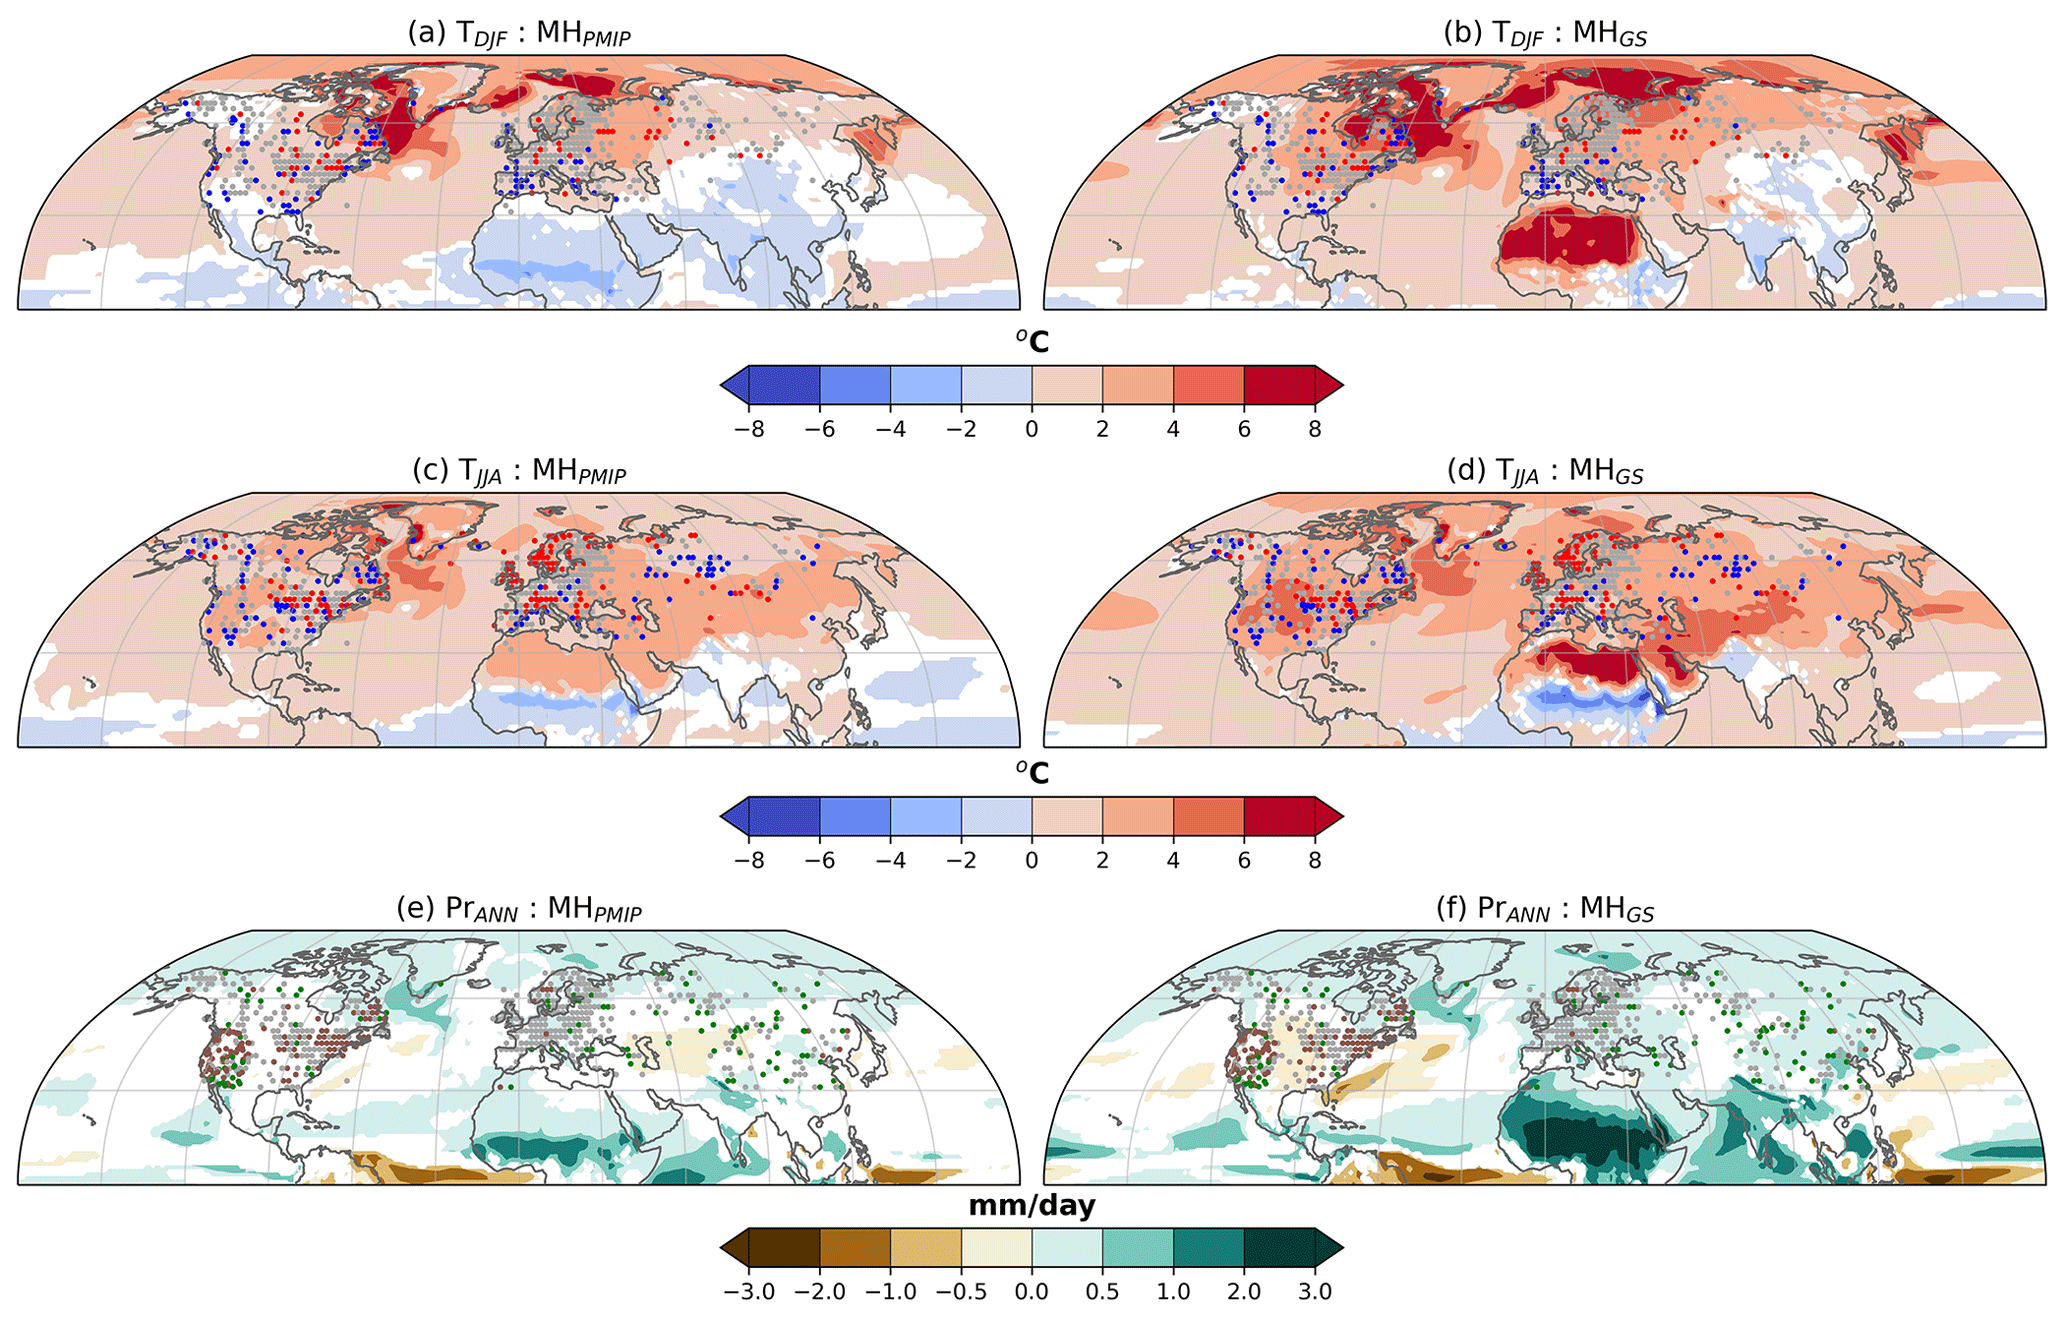
Figure 1Comparison of model and proxy reconstructions. Changes in winter temperature (a, b), summer temperature (c, d), and annual precipitation (e, f) between the MHPMIP and PI simulations (a, c, e) and between the green Sahara MH (MHGS) simulation and PI simulation (b, d, f). Coloured shading indicates anomalies that are significant at the 95 % confidence level based on a Student's t test. Filled dots represent proxy sites and their MH signature relative to the PI simulation. Red dots indicate a warmer signature, blue dots indicate a cooler signature, brown dots indicate a drier signature, green dots indicate a wetter signature, and grey dots indicate no change or an inconclusive signature. The model simulations and proxy reconstructions are described in Sect. 2. T: temperature. Pr: precipitation.
In this context, climate models struggle to constrain the climate conditions associated with the Holocene thermal optimum. In the northern monsoon regions, precipitation increases are generally underestimated, while summer warming at middle to high latitudes is overestimated (Bartlein et al., 2017; Harrison et al., 2014). To explain the limitations of climate models in representing the mid-Holocene climate, several studies have pointed to the role of the vegetation, along with other feedbacks at tropical and higher latitudes, in modulating the climate response to orbital forcing (Chandan and Peltier, 2020; Pausata et al., 2016; Swann et al., 2012, 2014). In particular, the remarkable greening of the Sahara influenced both regional and global climates during the mid-Holocene. Modelling studies have demonstrated that the resulting reduction in albedo and dust emission, along with enhanced water recycling associated with increased vegetation cover, were key factors in maintaining the intensified African monsoon regime during the AHP (Gaetani et al., 2017; Messori et al., 2019; Pausata et al., 2016; Tierney et al., 2017), reinforcing the global monsoon system, and modifying tropical-cyclone activity and variability in the El Niño–Southern Oscillation (Pausata et al., 2017b, a; Piao et al., 2020; Sun et al., 2019; Swann et al., 2014). However, while palaeoclimate modelling of Saharan greening has mainly focused on the impact in the tropics and subtropics, studies on climate responses at mid-latitudes are still limited.
The objective of this paper is to study the impact of Saharan greening on mid-latitude atmospheric circulation in the Northern Hemisphere and associated climate variability during the mid-Holocene (MH). To achieve this, a climate model is used to investigate the relevant underlying mechanisms. Moreover, a proxy–model agreement at mid-latitudes that considers a vegetated Sahara with reduced dust emissions is evaluated. This study focuses on the analysis of the winter season (December to February (DJF)) and summer season (June to August (JJA)) in the Northern Hemisphere.
In this paper, the climate experiments described in Pausata et al. (2016) are analysed. These simulations are conducted using version 3.1 of EC-Earth (EC-Earth3.1), an atmosphere–ocean coupled climate model (Hazeleger et al., 2010). The atmospheric model is based on the Integrated Forecast System (IFS cycle 36r4) (https://www.ecmwf.int/en/forecasts/documentation-and-support, last access: 31 July 2024), which includes the Hydrology-Tiled ECMWF Scheme for Surface Exchanges over Land (HTESSEL) land model (van den Hurk et al., 2000). The simulations are run at a T159 horizontal spectral resolution (∼ 1.125° (approximately 125 km)) with 62 vertical levels. The atmospheric component is coupled to version 2 of the Nucleus for European Modelling of the Ocean (NEMO; Madec, 2008) and version 3 of the Louvain-la-Neuve sea ice model (LIM3; Vancoppenolle et al., 2009) using the Ocean Atmosphere Sea Ice Soil version 3 (OASIS3) coupler (Valcke, 2013). The ocean component, NEMO, has a nominal horizontal resolution of 1° and 46 vertical levels.
A 700-year pre-industrial (PI) control simulation following the protocol of the fifth phase of the Coupled Model Intercomparison Project (CMIP5; Taylor et al., 2012) is conducted to provide the initial conditions for the MH simulations, which were run for about 300 years – climate equilibrium is reached after 100–200 years, depending on the experiment. For each experiment, data from the last 30 years are retained for analysis. The atmospheric dust concentration that corresponds to the PI conditions is prescribed in the PI simulation using the long-term monthly mean (1980–2015) from the Modern-Era Retrospective Analysis for Research and Applications Aerosol Reanalysis (MERRAero) product. This data set includes the radiative coupling of version 5 of the Goddard Earth Observing System (GEOS-5) climate model to the Goddard Chemistry Aerosol Radiation and Transport (GOCART) aerosol module and assimilates satellite retrievals of aerosol optical depth (AOD) from the MODIS sensor. Details on the MERRAero data set are available at https://gmao.gsfc.nasa.gov/reanalysis/merra/MERRAero/ (last access: 31 July 2024). In the analysed simulations, EC-Earth3.1 simulates the direct effect of dust on the atmospheric radiative balance, although it does not simulate the indirect effects on cloud formation and microphysics.
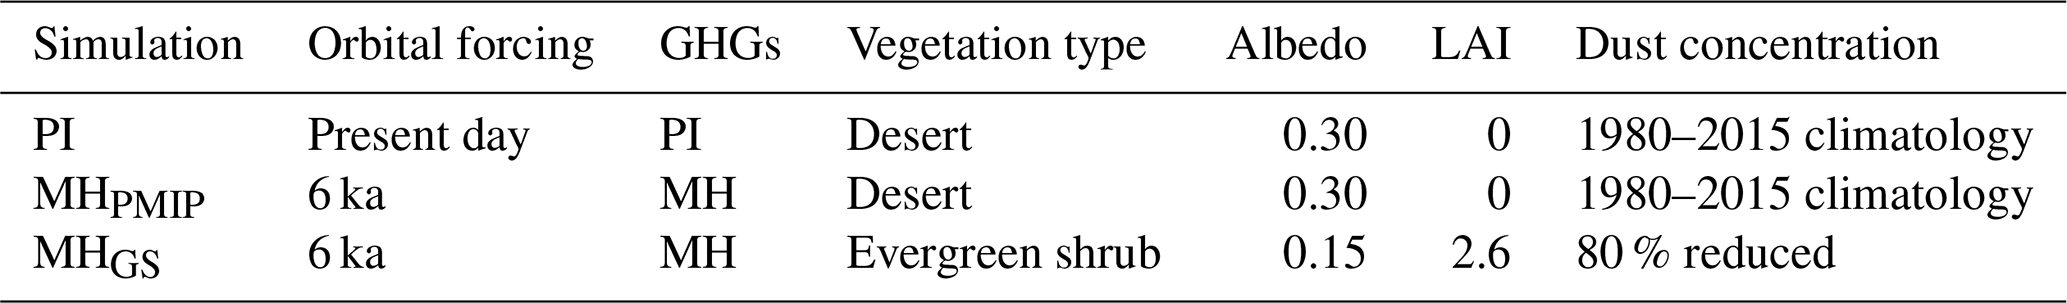
An MH simulation is run following the protocol of the third phase of the Paleoclimate Modelling Intercomparison Project (PMIP3) (MHPMIP). Orbital forcing is set to MH values (6000 years BP), and the solar constant, land cover, ice sheets, topography, and coastlines are set to PI conditions (as are the greenhouse gas concentrations), with the exception of the methane concentration, which is set at 650 ppb. An additional MH simulation is run using prescribed green Sahara (GS) conditions, i.e. a vegetated surface and reduced dust emissions in the Sahara–Sahel region (MHGS) (11–33° N, 15° W–35° E). Land cover in the Sahara is prescribed as evergreen shrubs with a leaf area index (LAI) of 2.6. This modification in land surface type corresponds to a change in surface albedo from 0.30 (desert) to 0.15 (shrub). Surface roughness and soil wetness are set to PI values. Dust emissions typical of the AHP are simulated by prescribing an 80 % reduction in dust concentration throughout the troposphere (up to 150 hPa) over a broad area around the Sahara region (see Fig. S1 in Gaetani et al., 2017). The inclusion of dust reduction in the experimental setup significantly influences the simulation of monsoonal dynamics, leading to an increase in accumulated precipitation of around 30 % compared to simulations with prescribed vegetation only (see Pausata et al., 2016). A comparable effect regarding dust reduction has been observed in other modelling studies by Thompson et al. (2019), Hopcroft and Valdes (2019), and Sagoo and Storelvmo (2017), confirming the relevance and comparability of the model's response to dust effects. Although this experimental design is highly idealised, it is firmly grounded in palaeoclimatic reconstructions for the MH from both dust (deMenocal et al., 2000; McGee et al., 2013) and pollen archives (Hély et al., 2014; Lézine et al., 2011). The experimental setup is summarised in Table 1.
Table 1Experimental setup. The vegetation type, surface albedo values, and LAI values pertain to the Sahara region. GHGs: greenhouse gases.
The climates in the MHPMIP and MHGS simulations are compared with multi-archival proxy reconstructions of continental seasonal temperatures and annual precipitation. To this end, statistically significant anomalies (MH minus PI) simulated by the model are compared with MH signatures indicated by a compilation of proxy records. This compilation not only builds upon data sets from Bartlein et al. (2011) and Hermann et al. (2018) but also enriches these data sets with 89 additional multi-archival, multi-proxy records, as listed in Table A1. To assess the agreement between the proxy data and model simulations, the MH signatures at each proxy site are assigned to categories, e.g. wetter/drier/no change, warmer/cooler/no change, and inconclusive. Proxy–model agreement is assessed using Cohen's weighted kappa index (κ), following DiNezio and Tierney (2013). Cohen's kappa index quantifies the agreement between climate variables from climate simulations and proxy reconstructions by evaluating the probability that the two data sets agree on the anomaly category (e.g. positive/negative/no change) at the proxy sites, excluding any agreement that occurs by chance alone. The index is calculated by constructing a data matrix that includes the number of sites where the two data sets exhibit agreement, partial disagreement (one indicates a positive or a negative anomaly, while the other indicates no change), and complete disagreement (one indicates a positive anomaly, while the other indicates a negative anomaly, or vice versa). This data matrix is then multiplied by a weight matrix to penalise complete disagreement more than partial disagreement. The resultant values for the index range from 0 to 1, where 0 indicates no agreement, 0.5 indicates partial agreement, and 1 indicates perfect agreement. Cohen's kappa index is calculated separately for four regions: Pacific Coast, North America (30–70° N, 180–100° W); Atlantic Coast, North America (30–70° N, 100–30° W); Europe and the Mediterranean (30–70° N, 20° W–50° E); and Asia (30–70° N, 50–180° E) (Fig. A1).
Part of the analysis on atmospheric circulation variability focuses on the North Atlantic region, as this relates to climate variability in both Eurasia and North America in the present climate. The main modes of variability in North Atlantic atmospheric circulation are extracted at monthly and daily timescales by applying principal component analysis (PCA) (Wilks, 2019) to the geopotential-height anomalies at 500 hPa over the domain (20–80° N, 80° W–30° E). In order to assess the modifications in the circulation patterns in the MH experiments relative to the PI simulation, all geopotential-height anomalies are computed with respect to the PI climatology. PCA is then applied to concatenated anomaly data from all three simulations – that is, the data matrix Z used to compute the covariance matrix, which is then used to find the eigenvectors and eigenvalues (Wilks, 2019), is defined as . Here, PI, MHPMIP, and MHGS are matrices, with latitude and longitude data (55 × 30 grid points) arranged in columns and time steps (30 × 3 and 30 × 92 for the monthly and daily analyses, respectively) arranged in rows.
The first empirical orthogonal function (EOF) and the associated expansion coefficient time series derived from the PCA of the monthly anomalies are used to represent the spatial pattern of the North Atlantic Oscillation (NAO) and its time evolution (the NAO index (NAOI)), respectively, as the NAO is acknowledged as the dominant mode of atmospheric circulation in the North Atlantic region (Hurrell et al., 2003). At the daily timescale, the first few PCA modes – specifically, the first seven modes in winter and the first eight modes in summer, accounting for 70 % of the circulation variability – are used to classify the weather variability affecting North America, the North Atlantic, and Europe. Because the selected EOFs show poor separation at the daily timescale, a rotation is applied (Wilks, 2019), and the rotated EOFs are used with a k-means classification algorithm (Wilks, 2019) to identify the four canonical weather regimes (WRs) characterising synoptic atmospheric variability in the North Atlantic (Michelangeli et al., 1995).
In order to facilitate the proxy–model comparison, all climate simulations are remapped to the 2° grid from the Bartlein et al. (2011) data set, which is the only proxy data set on a regular grid used in this study.
3.1 Climate response to Saharan greening in the Northern Hemisphere
In this section, the DJF and JJA climatological responses of near-surface temperature, precipitation, and atmospheric circulation are presented. The responses to the modifications in the orbital parameters alone, as well as in combination with prescribed Saharan greening, are quantified by comparing the differences between the MHPMIP and MHGS experiments against the PI simulation.
As a consequence of the changes in the orbital parameters, the Northern Hemisphere displays significantly warmer 2 m temperatures in both seasons and experiments (Figs. 1a–d and 2). The warming is significantly more pronounced when Saharan greening is prescribed; this is the case in both winter and summer (Figs. 1a–d and 2). In winter, the warming peaks in the Arctic region, presumably due to a loss of sea ice (Fig. 1a and b). Moreover, in the MHGS experiment, the reduced albedo associated with the vegetation cover increases radiative forcing in the Saharan region, resulting in a warming effect in the northern tropics (Figs. 1a–b and 2a). In summer, the Northern Hemisphere is uniformly warmer from the polar regions to the subtropics (Figs. 1c–d and 2b). Surface cooling associated with the intensification of the African monsoon is visible in northern Africa in both of the experiments and is more pronounced in the MHGS experiment (Fig. 1c and d) (see also Pausata et al., 2016; Gaetani et al., 2017).
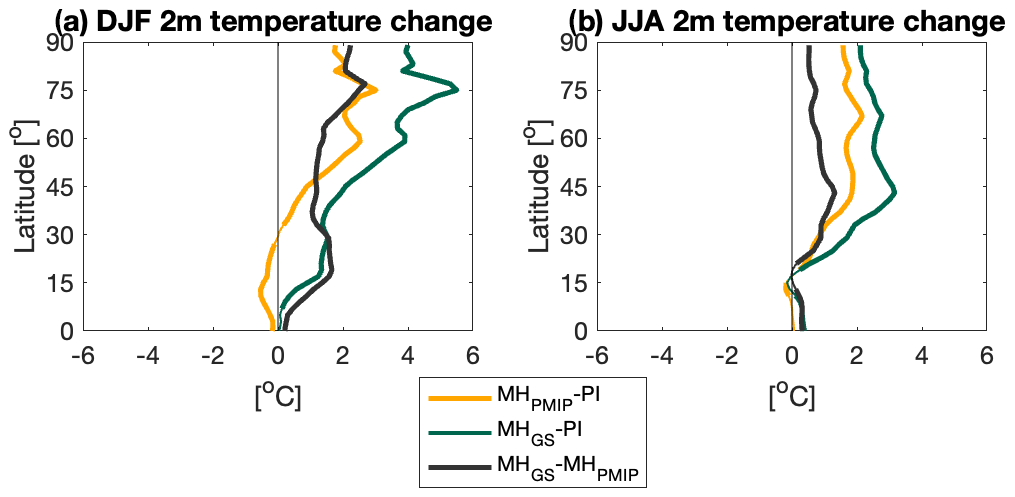
Figure 2Changes in the climatological latitudinal mean of 2 m temperature in the MHPMIP (yellow lines) and MHGS (green lines) simulations relative to the PI simulation, alongside changes in the MHGS simulation relative to the MHPMIP simulation (black lines), in boreal (a) winter and (b) summer. Thicker lines indicate anomalies that are significant at the 95 % confidence level based on a Student's t test.
Precipitation in the Northern Hemisphere at middle to high latitudes shows a significant increase in winter and summer in both of the MH experiments, with a significant intensification when Saharan greening is prescribed (Figs. 1e–f and 3). This precipitation response is associated with a slowing down of the westerly upper-tropospheric flow in the subtropics, along with a reinforcement at mid-latitudes (Fig. 4). Precipitation is also significantly enhanced in the northern tropics for both of the MH experiments, with a vegetated Sahara once again resulting in a further significant increase relative to the MHPMIP experiment (Figs. 1e–f and 3). In particular, both MH experiments show an intensification of the boreal-summer monsoonal regime, which is accompanied by a northward shift in the precipitation belt (Figs. 1e–f and 3).
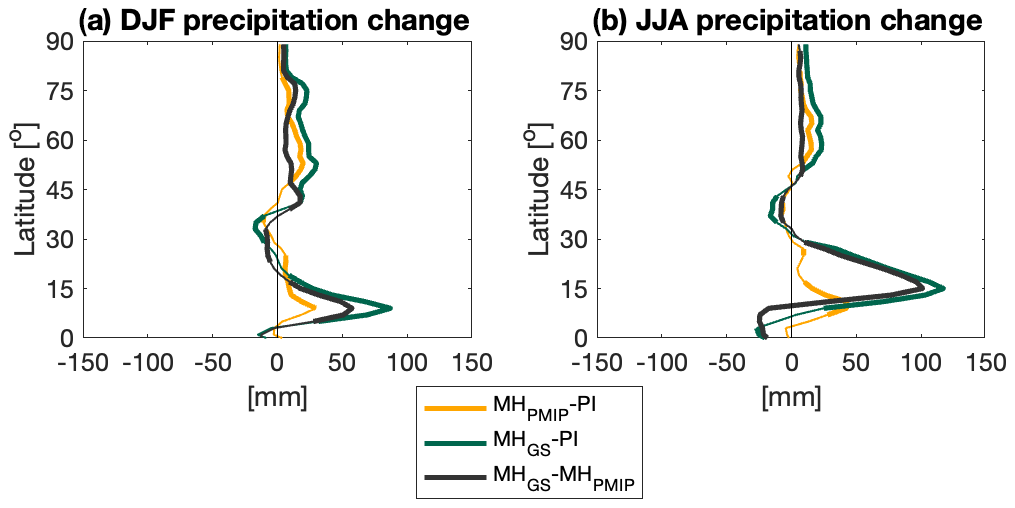
Figure 3Changes in the climatological latitudinal mean of precipitation in the MHPMIP (yellow lines) and MHGS (green lines) simulations relative to the PI simulation, alongside changes in the MHGS simulation relative to the MHPMIP simulation (black lines), in boreal (a) winter and (b) summer. Thicker lines indicate anomalies that are significant at the 95 % confidence level based on a Student's t test.
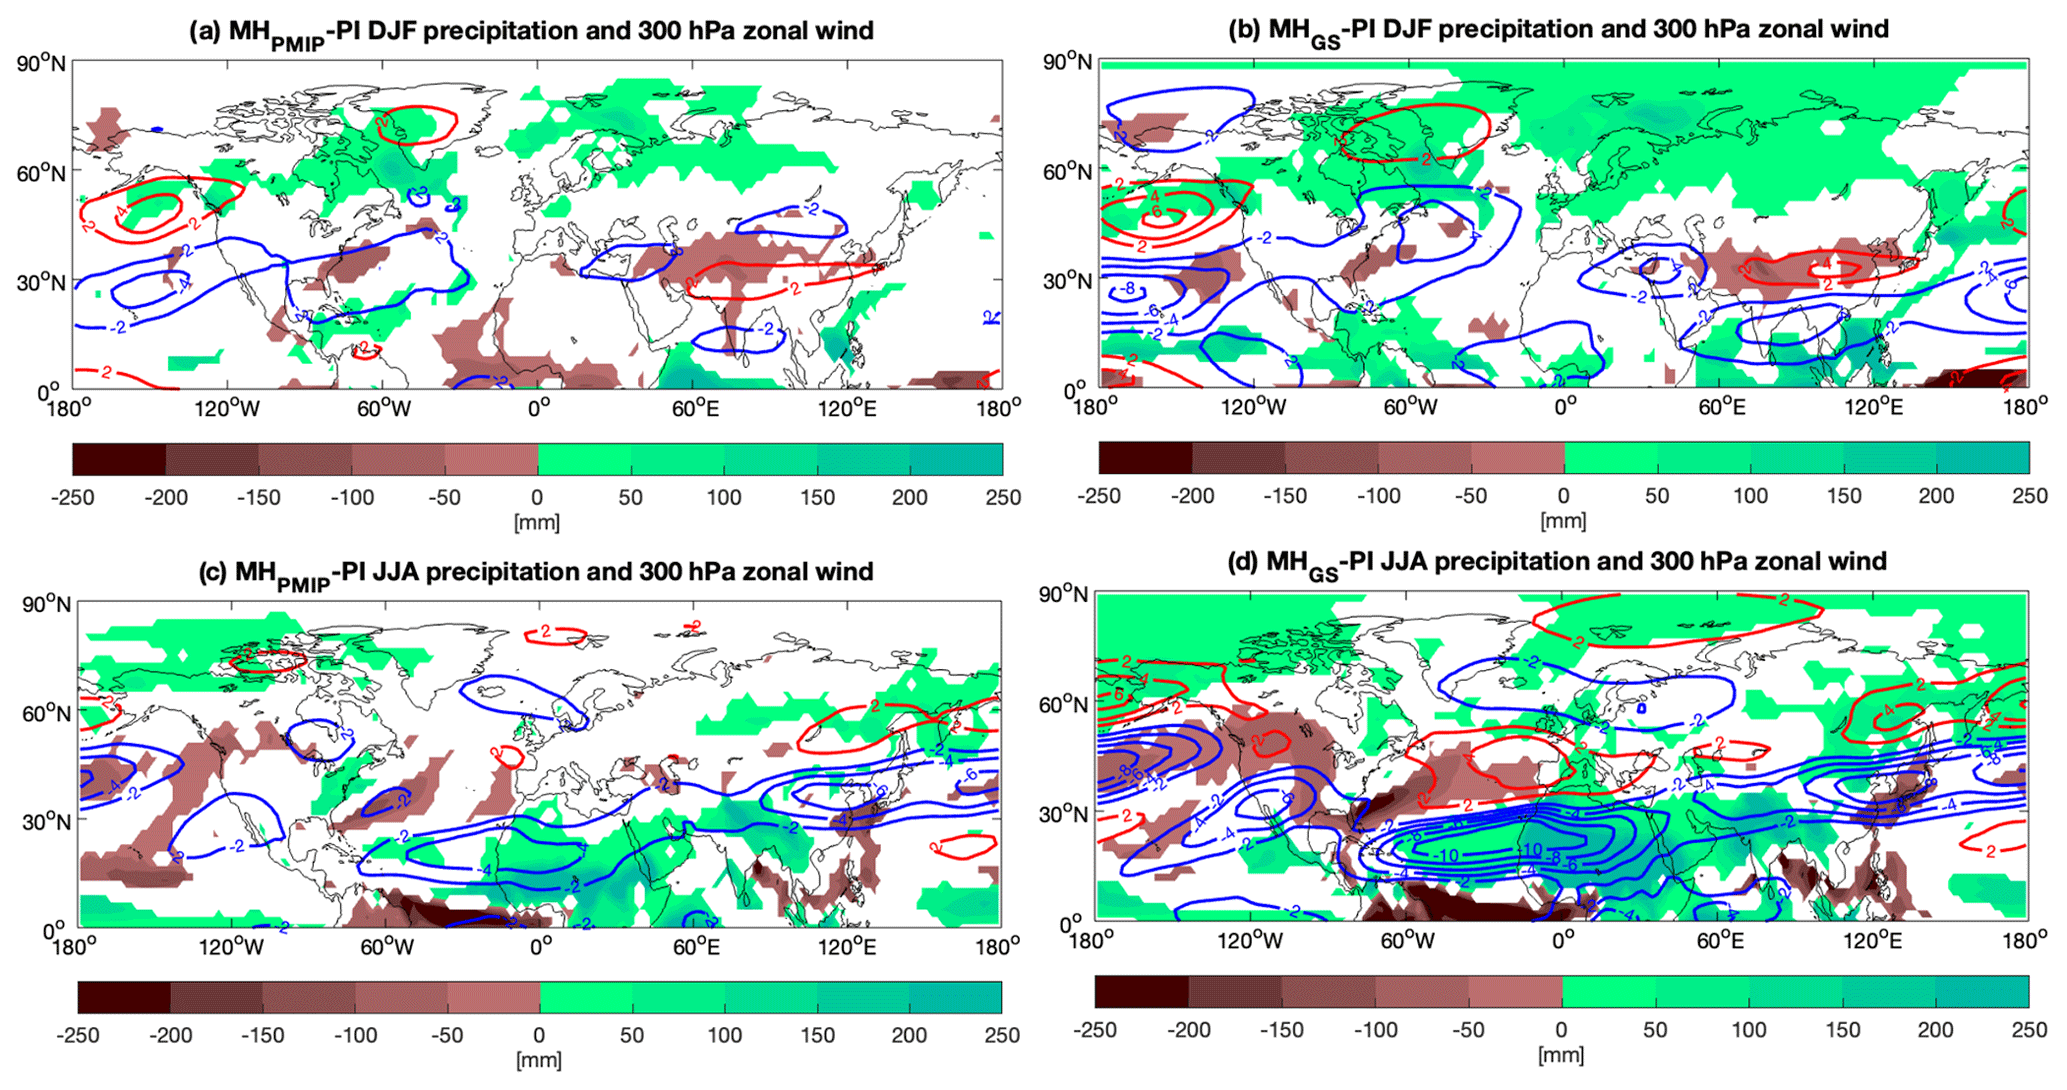
Figure 4Changes in precipitation (mm d−1) in the (a, c) MHPMIP and (b, d) MHGS simulations with respect to the PI simulation in (a, b) winter and (c, d) summer. Only areas with statistically significant precipitation anomalies, estimated using a Student's t test at the 95 % confidence level, are shown. Red and blue contours indicate positive and negative change, respectively, in the zonal wind velocity at 300 hPa (m s−1).
The winter precipitation response in the MH experiments is characterised by significant dry anomalies in central Asia and significant wet anomalies at high latitudes in North America and Eurasia, which are scattered in the MHPMIP simulation and widespread in the MHGS experiment (Fig. 4a and b). The presence of vegetated Sahara also compensates for the dry anomalies simulated in northern tropical Africa in the MHPMIP experiment (Fig. 4a and b). The meridional profile of the westerly upper-tropospheric flow to the west of the North American continent (corresponding to the end of the North Pacific storm track) shows an intensification and a zonalisation of the jet stream in both MH simulations with respect to the PI experiment (Fig. 5a), suggesting modifications in the location and magnitude of the storm track that affect the North American west coast. In the North Atlantic, to the west of the Eurasian continent, both MH simulations show a slight weakening of the westerly wind at the mid-latitudes, accompanied by a slight intensification at the subpolar latitudes (Fig. 5b), suggesting possible modifications in the circulation pattern over the North Atlantic. However, the prescribed vegetation in the Sahara does not significantly influence the winter dynamics of the jet stream beyond the changes induced by the orbital parameters alone. At a global scale, the dynamical signature of the MH experiments in winter is marked by a westward shift in the Walker circulation, as shown by the changes in the velocity potential and divergent wind in the upper troposphere (Fig. 6a and b).
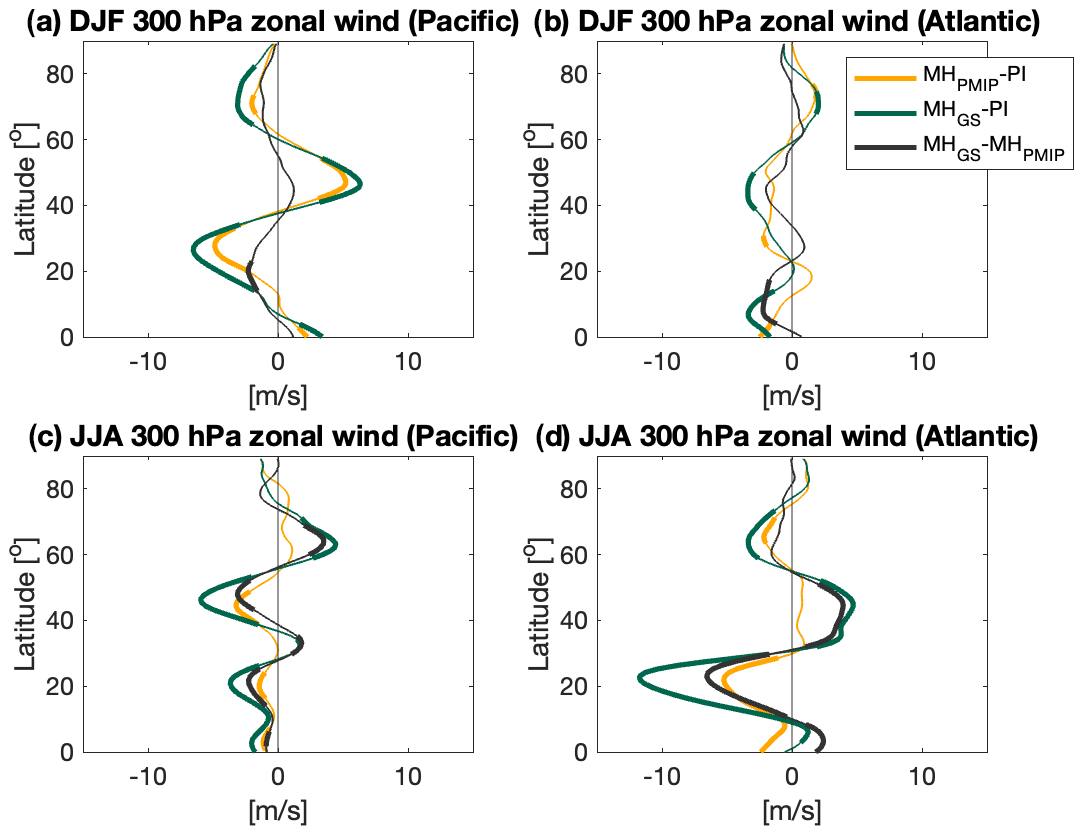
Figure 5Changes in the climatological latitudinal mean of zonal wind at 300 hPa in the MHPMIP (yellow lines) and MHGS (green lines) simulations with respect to the PI simulation, alongside changes in the MHGS simulation with respect to the MHPMIP simulation (black lines), at (a, c) 150° W (North Pacific) and (b, d) 30° W (North indicate anomalies that are significant at the 95 % confidence level based on a Student's t test.
In summer, both MH experiments show wet anomalies in the monsoonal region, as well as in the tropical North Atlantic and equatorial Pacific (Fig. 4c and d). The response is stronger in the MHGS simulation due to the effect of Saharan greening on the African monsoon (Fig. 4c and d). Moreover, in the MHGS experiment, a significant drying effect at subtropical latitudes is simulated in the North Pacific, North America, and the North Atlantic (Fig. 4d). The meridional profile of the westerly upper-tropospheric flow shows significant changes in the MHGS simulation compared to the PI and MHPMIP experiments. Specifically, to the west of the North American continent, there is a significant weakening of the mid-latitude westerlies, accompanied by an intensification at the subpolar latitudes (Fig. 5c). This suggests a northward shift in the jet stream and modifications in the location and intensity of the storm track affecting the North American west coast when Saharan greening is prescribed. To the west of the Eurasian continent, there is significant reinforcement and a southward shift in the subpolar jet stream (Fig. 5d), indicating a shift in the location and magnitude of the North Atlantic storm track. As in the winter season, the global Walker circulation shows a westward shift in summer (Fig. 6c and d). The MHGS experiment not only shows a stronger response, which may be expected, but also shows an atmospheric bridge in the upper troposphere, characterised by easterly anomalies in the divergent wind. This bridge connects a divergence anomaly in the Indian Ocean with a convergence anomaly in the tropical North Atlantic, as shown by the negative and positive velocity potential anomalies (Fig. 6d). This feature is reflected in the simulated merging of the mid-latitude and subtropical jet streams in the North Atlantic (Figs. 5d and 4d), suggesting a potential mechanism connecting the reinforcement of the monsoonal regime with modifications in the mid-latitude circulation.
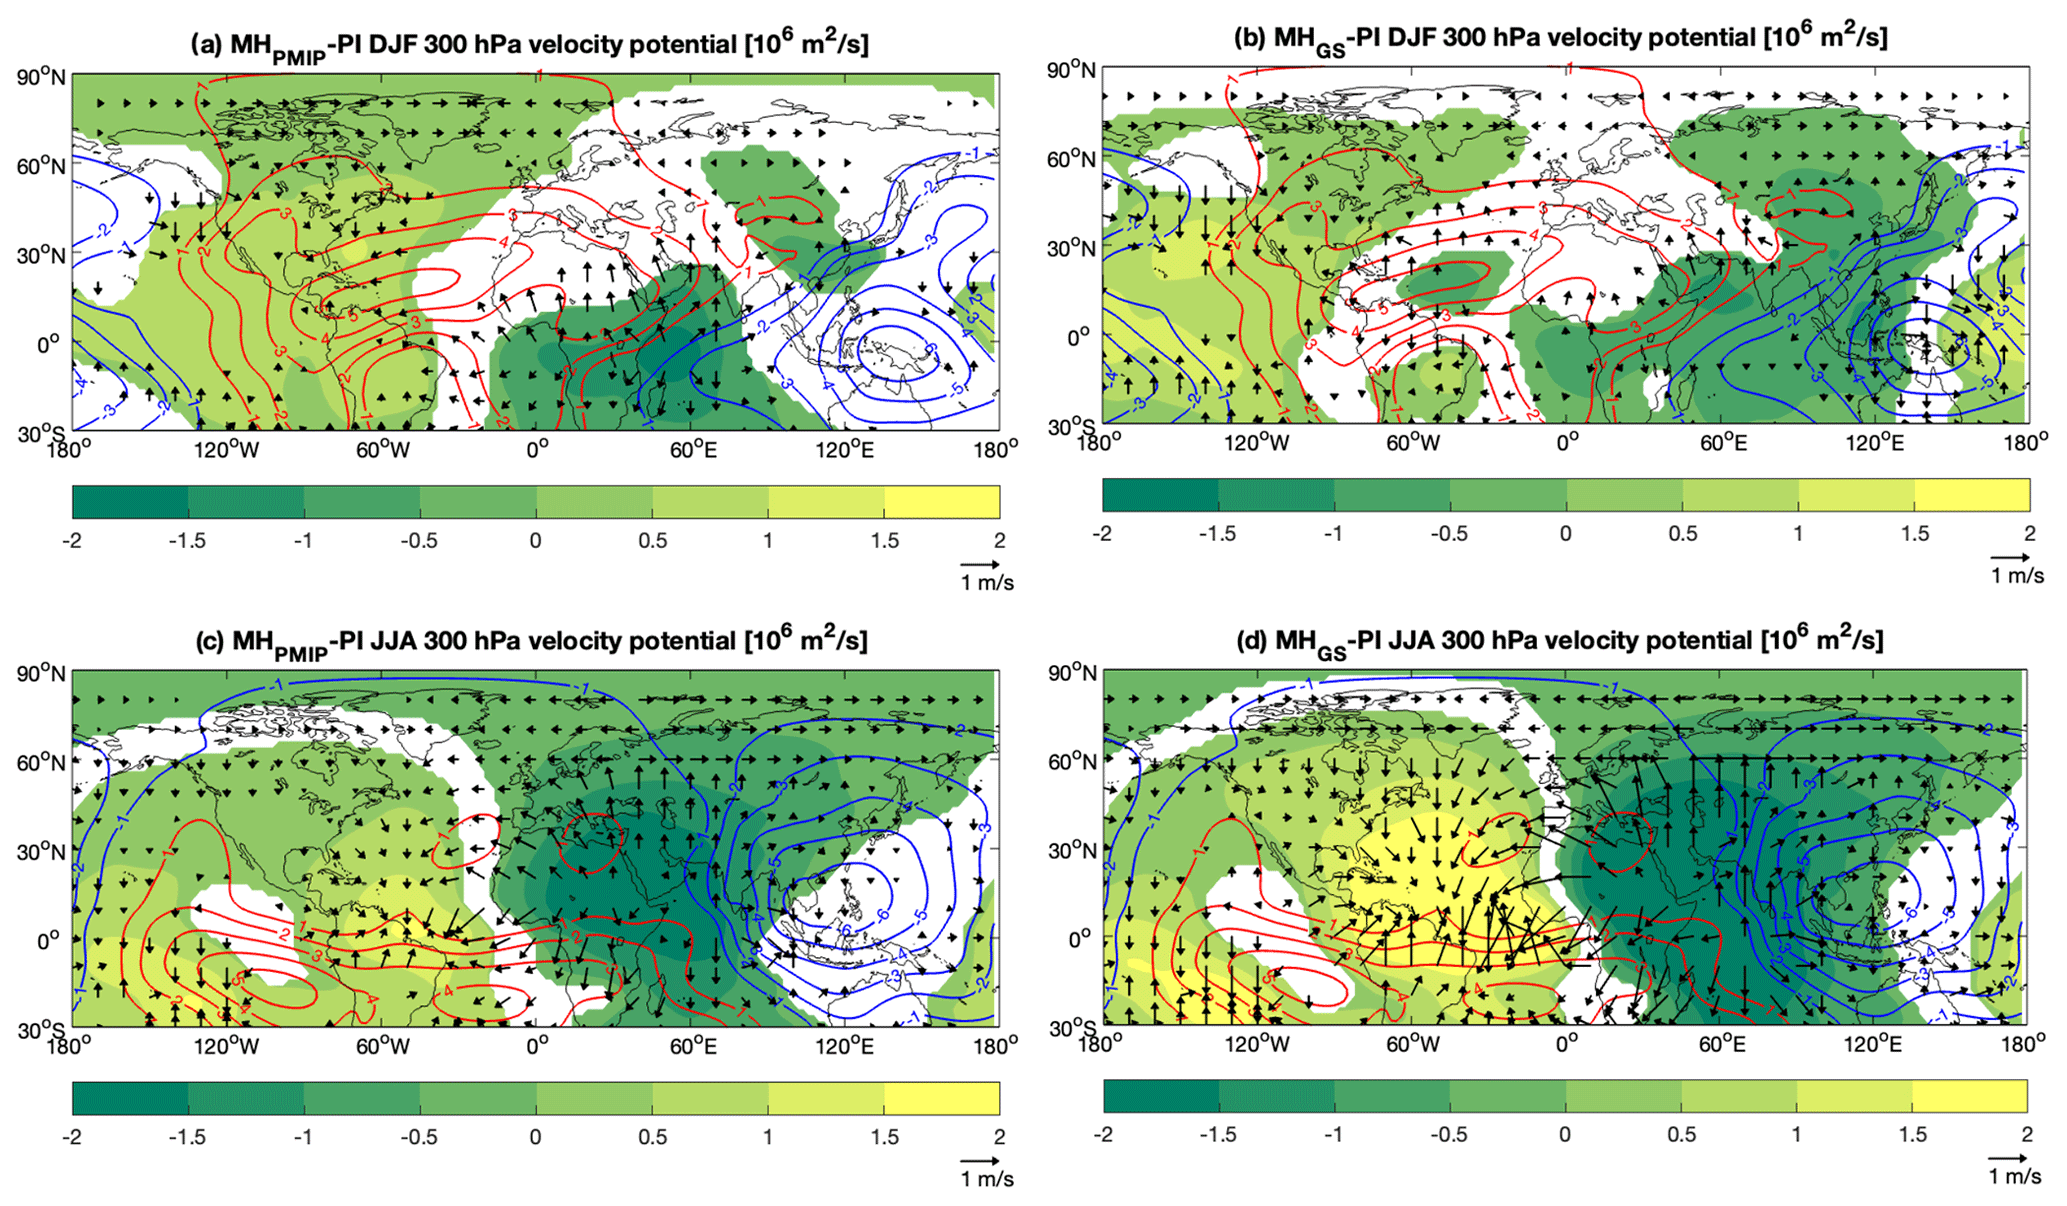
Figure 6Changes in the velocity potential (coloured areas) and divergent wind at 300 hPa (vectors) in the MHPMIP and MHGS simulations in (a, b) DJF and (c, d) JJA with respect to the PI simulation. Red and blue contours indicate the climatological pattern of the velocity potential in the PI simulation. Only locations and vectors with statistically significant velocity potential and divergent-wind anomalies, assessed using a Student's t test at the 95 % confidence level, are shown.
3.2 Changes in the North Atlantic Oscillation
The NAO is the main mode of atmospheric variability influencing climate patterns in the North Atlantic, Europe, and North America (Ambaum et al., 2001; Chartrand and Pausata, 2020; Hurrell et al., 2003). In this section, changes in NAO variability in the MH experiments are examined with respect to the PI simulation.
In winter, the NAO pattern identified in the model simulations reflects the canonical pattern described in the literature, with a strong meridional geopotential dipole in the North Atlantic accounting for 28 % of the total variability (Ambaum et al., 2001; Hurrell et al., 2003) (Fig. A2a). In the PI simulation, the NAOI is characterised by a distribution skewed towards positive values (Fig. 7a). The NAO positive phase in the PI simulation is associated with warm anomalies in central and northern Europe, as well as on the east coast of North America, and cold anomalies in northern Africa (Fig. 8a). Moreover, this phase correlates with dry conditions in southern Europe and wetter conditions in Scandinavia (Fig. 8b). Consistent with previous findings (e.g. Nesje et al., 2001; Rimbu et al., 2003; Olsen et al., 2012), changes in orbital parameters and Saharan greening lead to a shift in the NAOI phase towards negative values in the MHGS experiment (Fig. 7a). A Kolmogorov–Smirnov test confirms that these shifts in the NAOI distributions in both the MHPMIP and MHGS experiments are statistically significant compared to the PI simulation (p<0.02). However, the difference in the NAOI distributions between the MHGS and MHPMIP experiments is weakly significant (p<0.11). Circulation and surface anomaly patterns associated with the NAO positive phase in the MHPMIP (not shown) and MHGS experiments (Fig. 8c and d) are very similar. The tendency towards a predominantly neutral-to-negative NAO phase in the MH simulations is expected to result in colder winters in central and northern Europe and eastern North America, warmer conditions in northern Africa, wetter conditions in southern Europe, and drier conditions in eastern North America and Scandinavia (Fig. 8c and d). In particular, the thermal and rainfall anomalies are more pronounced when Saharan greening is taken into account; this is due to the larger difference in the shift in the NAO phase relative to the PI period.
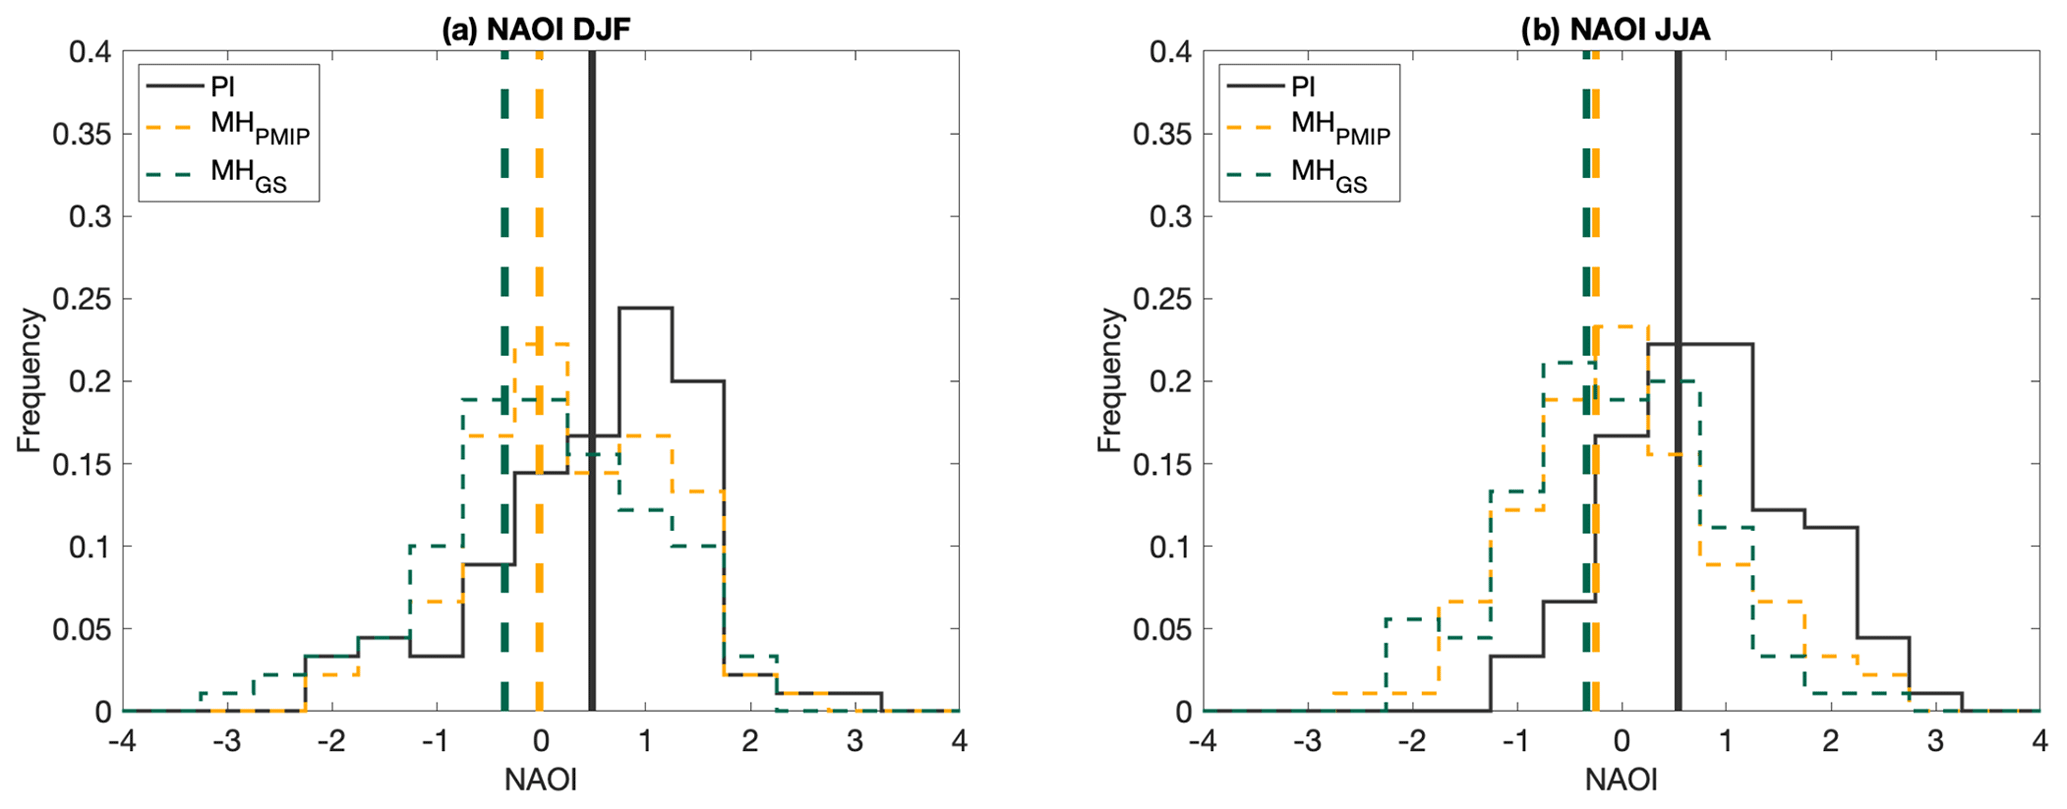
Figure 7Distributions of the NAOI in the PI simulation (solid line) and in the MHPMIP and MHGS experiments (dashed lines) in (a) winter and (b) summer. The vertical lines indicate the medians of the distributions.
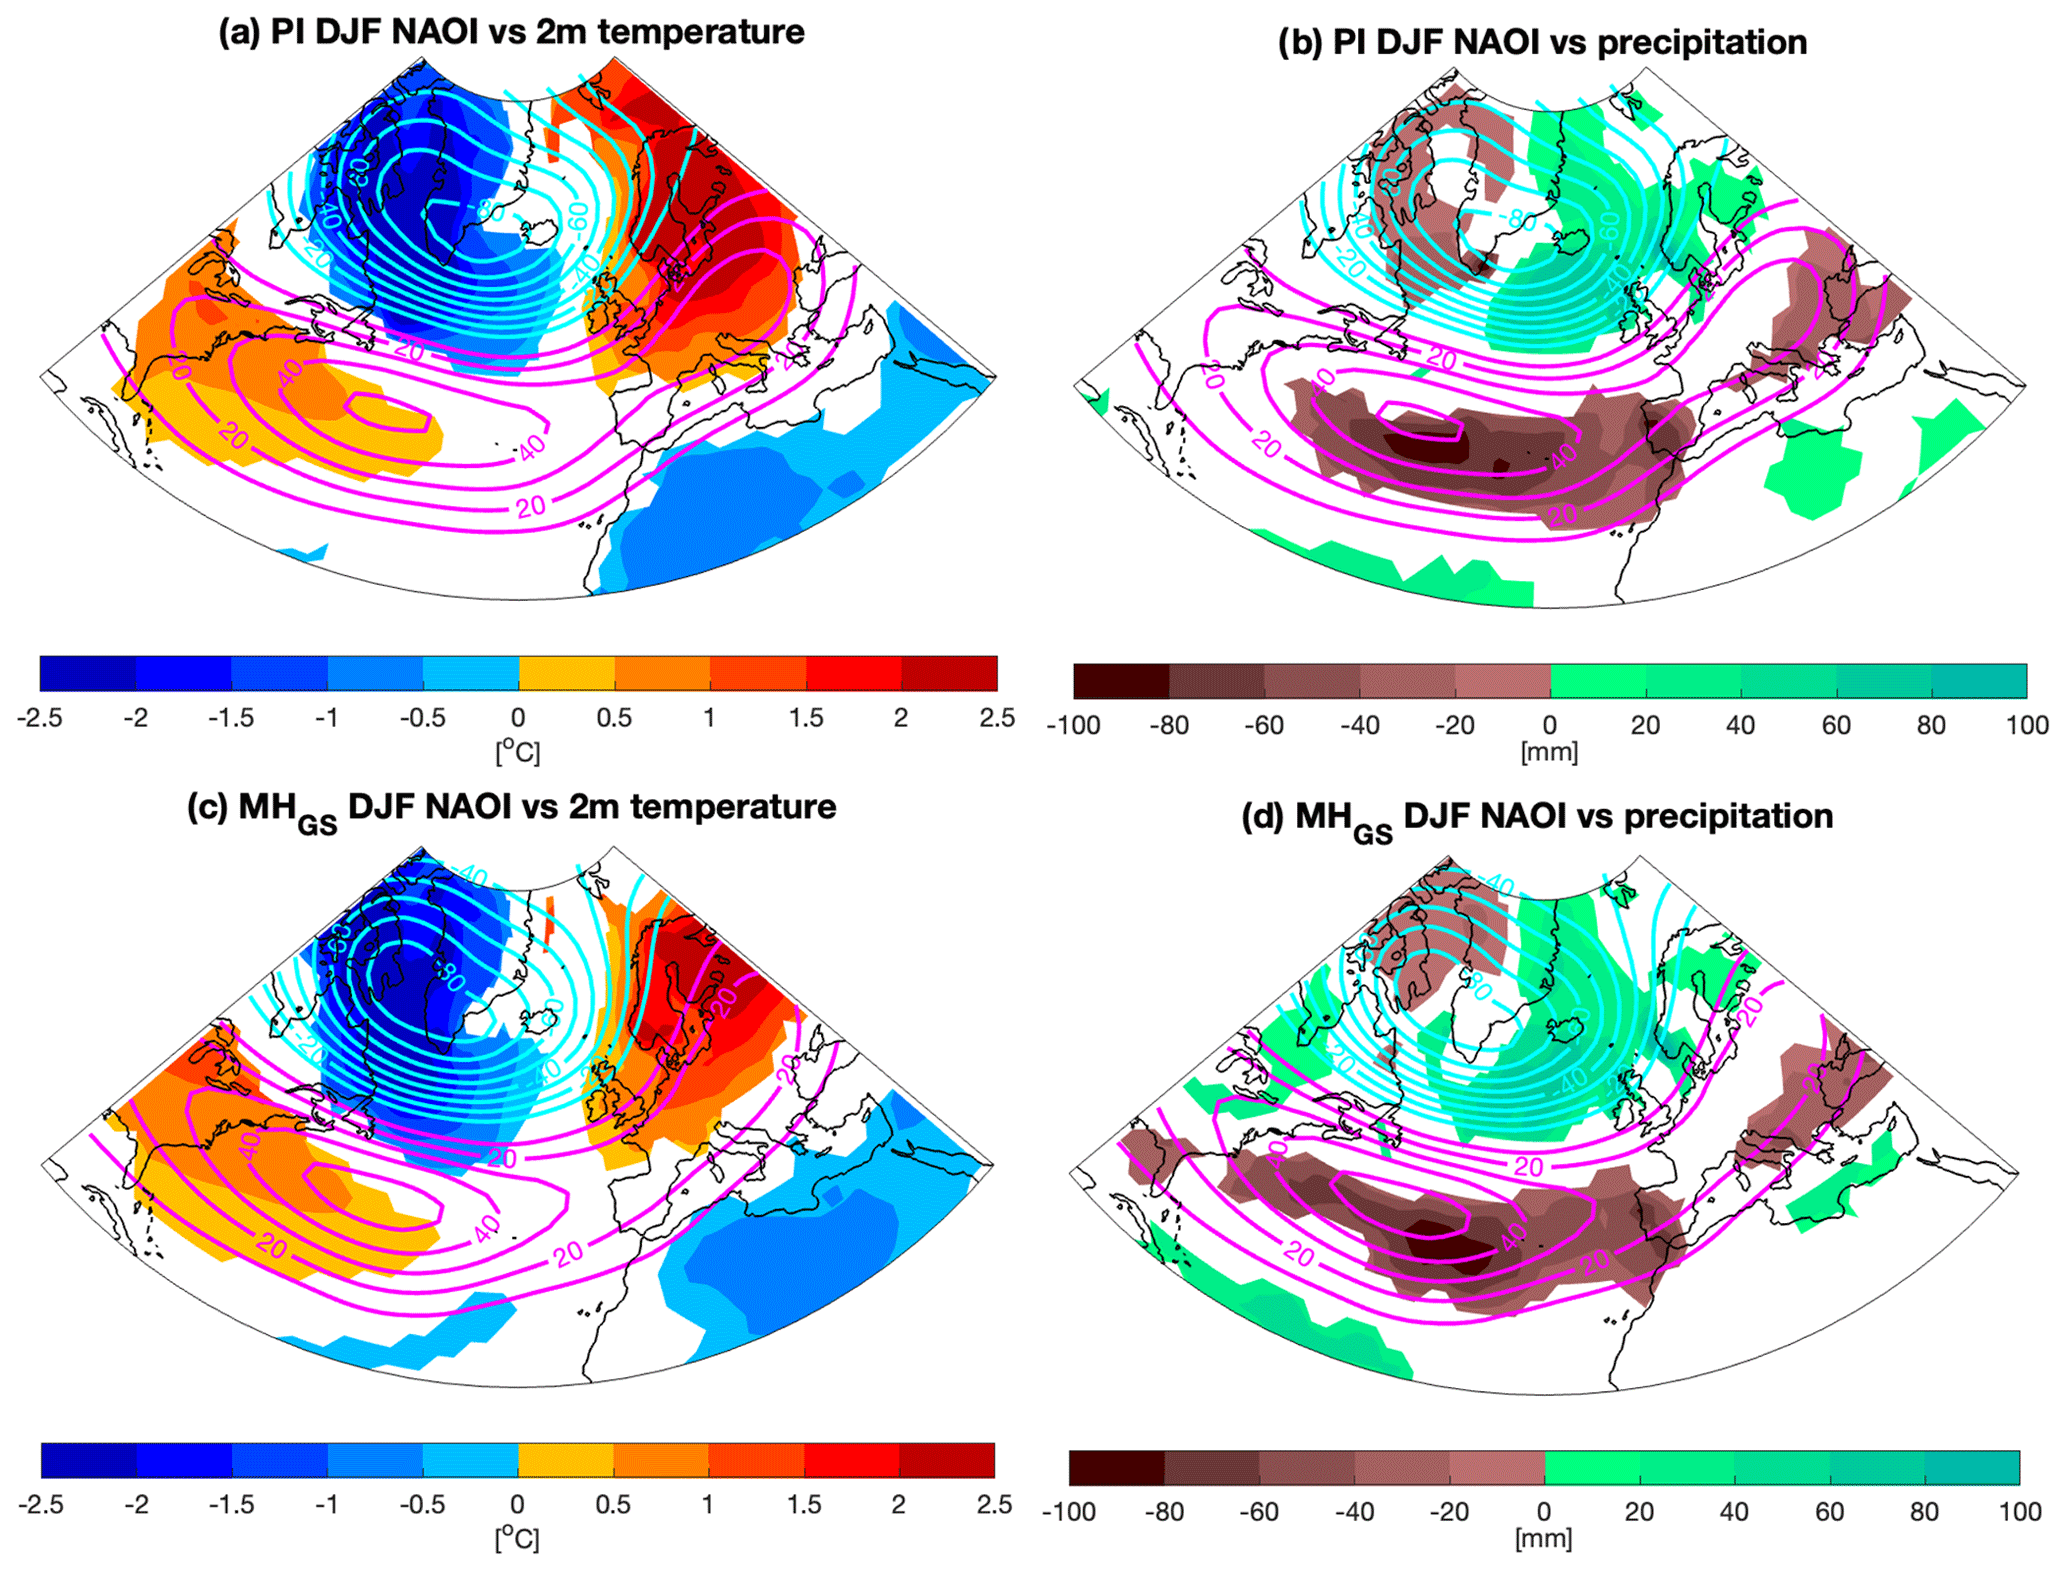
Figure 8Winter NAO patterns (contours) and associated thermal and rainfall anomalies (coloured areas) obtained by regressing geopotential height at 500 hPa (m), (a, c) 2 m temperature, and (b, d) precipitation onto the NAOI in the (a, b) PI and (c, d) MHGS simulations. Only significant anomalies in 2 m temperature and precipitation, assessed using a Student's t test at the 95 % confidence level, are shown.
In summer, the modelled NAO pattern reflects the canonical summer NAO pattern, which is characterised by weaker and less geographically extended anomalies compared to its winter counterpart, along with a northward shift in the meridional dipole (Bladé et al., 2012; Folland et al., 2009), accounting for 23 % of the total variability (Fig. A2b). In the PI simulation, the NAOI is characterised by a predominantly positive phase (Fig. 7b), which is associated with warm summers in western Europe and eastern North America and cold summers in the eastern Mediterranean and the North Atlantic, accompanied by dry conditions in northern Europe and wet conditions in the western Mediterranean (Fig. 9a and b). The predominant NAO phase turns negative when the orbital parameters are changed (Fig. 7b). The phase shift is statistically significant in both the MHPMIP and MHGS experiments compared to the PI simulation, as verified by a Kolmogorov–Smirnov test (p<0.01). However, it is noteworthy that Saharan greening does not introduce significant differences to this phase shift (p<0.49). Accordingly, a predominantly negative NAO phase results in warmer summers in the eastern Mediterranean and northern Africa and leads to wetter summers in northern Europe (Fig. 9c and d).
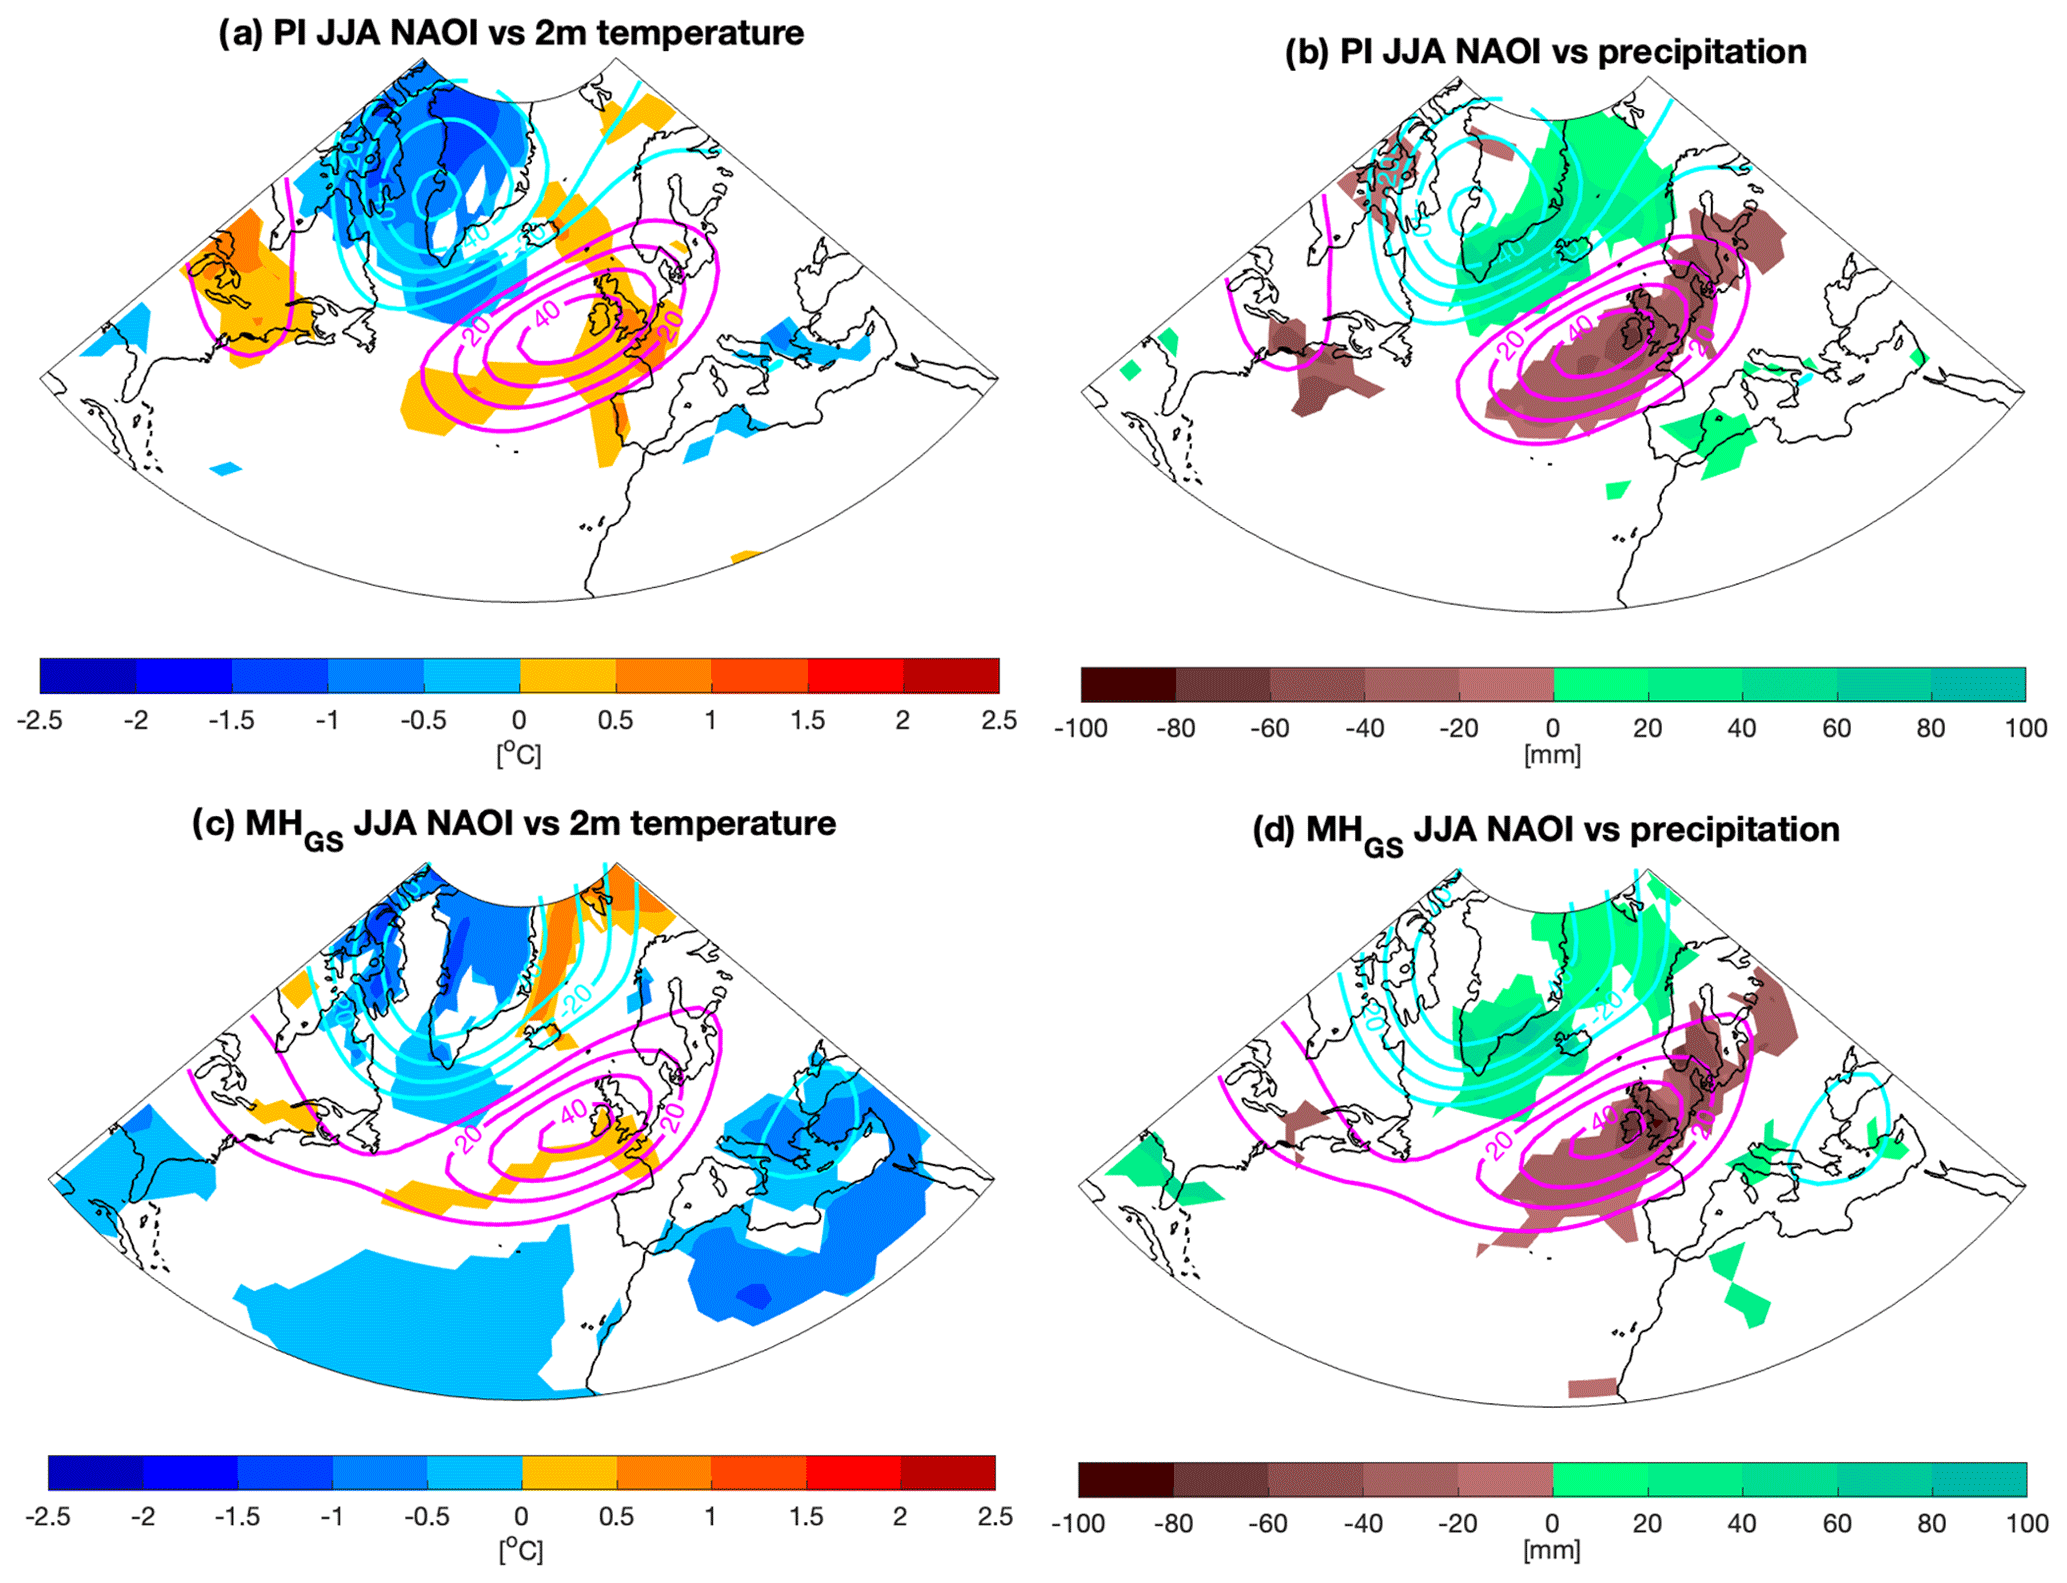
Figure 9Summer NAO patterns (contours) and associated thermal and rainfall anomalies (coloured areas) obtained by regressing geopotential height at 500 hPa (m), (a, c) 2 m temperature, and (b, d) precipitation onto the NAOI in the (a, b) PI and (c, d) MHGS simulations. Only significant anomalies in 2 m temperature and precipitation, assessed using a Student's t test at the 95 % confidence level, are shown.
3.3 North Atlantic weather regimes
The modifications in atmospheric circulation variability over North America, the North Atlantic, and Europe are explored at the synoptic timescale through the analysis of North Atlantic WRs (Hochman et al., 2021; Michelangeli et al., 1995) for the PI simulation and the MH experiments. Although year-round definitions of North Atlantic WRs exist (Grams et al., 2017; Hochman et al., 2021), they are often defined separately for the summer and winter seasons, and this is the approach adopted in this paper.
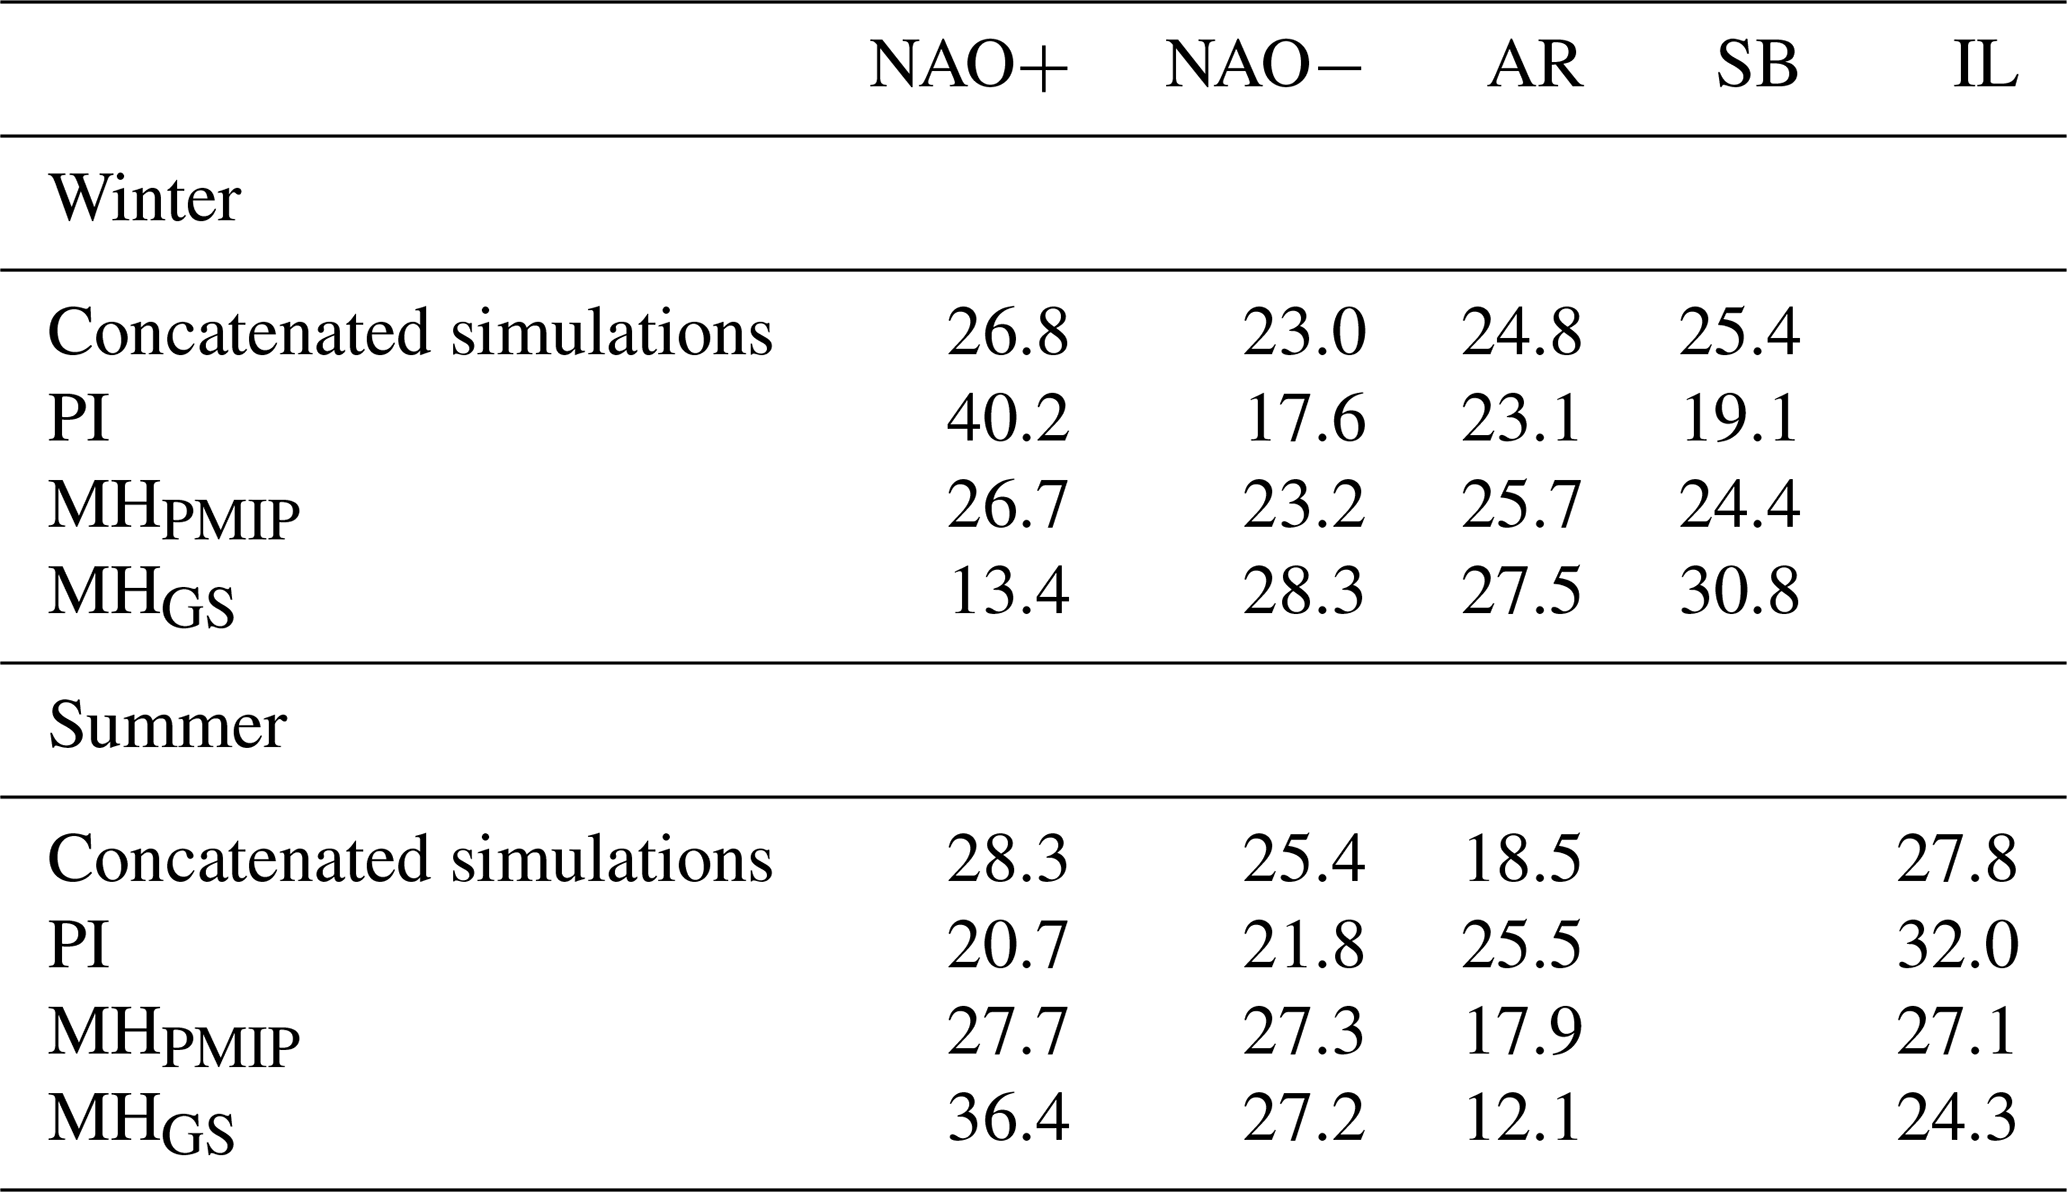
Model simulations show that winter synoptic circulation is characterised by the four canonical WRs described in the literature (Cassou et al., 2004). The occurrences of these WRs are relatively uniform. Two WRs are associated with the NAO's positive and negative phases (NAO+ and NAO−), accounting for approximately 50 % of the analysed days. The remaining 50 % are associated with either a Scandinavian blocking (SB) pattern or an Atlantic ridge (AR) pattern (Table 2 and Fig. A3). It is highlighted that NAO+ and NAO−, defined by clustering the daily variability, do not show the spatial symmetry typically associated with the NAO's positive and negative phases, which are defined as the first EOF of interannual variability (see Figs. A2a and A3a–b). Consistent with the analysis of the monthly NAO and previous research (Nesje et al., 2001; Rimbu et al., 2003; Olsen et al., 2012), modifications in the orbital parameters lead to a reduction in the occurrence of NAO+, which becomes residual in the MHGS experiment with respect to the PI simulation, and an increase in the frequency of NAO− from the PI simulation to the MHGS experiment (Table 2). However, the increase in NAO− does not fully offset the decrease in NAO+, resulting in increased AR and SB frequencies, with SB becoming the dominant WR (30.8 %) in the MHGS experiment (Table 2). The changes in the occurrence of WRs show a monotonic behaviour from the PI simulation to the MH experiments, with more pronounced changes observed in the MHGS experiment compared to the MHPMIP experiment (Table 2), suggesting that the effect of Saharan greening on atmospheric circulation and the associated thermal and rainfall anomalies amplifies the changes driven solely by orbital forcing. Therefore, the modifications in WR dynamics are only discussed in detail for the MHGS experiment.
Table 2WR occurrence in the PI and MH simulations, expressed as percentages. The regimes are as follows. NAO+ is the positive phase of the North Atlantic Oscillation. NAO− is the negative phase of the North Atlantic Oscillation. AR: Atlantic ridge. SB: Scandinavian blocking. IL: Icelandic Low.
The NAO+ circulation pattern dominating winter circulation in the PI simulation is associated with warm and wet anomalies in central and western Europe and southern Scandinavia; cold and dry anomalies in North America and northern Scandinavia; and dry anomalies in the eastern Mediterranean (Figs. 10a and 11a). In the MHGS experiment, the large reduction in the occurrence of the NAO+ pattern is partially offset by the increased occurrence of NAO−, leading to cold anomalies in Scandinavia and eastern North America and resulting in warm anomalies in polar North America, the western Mediterranean, and northern Africa. It also results in wet anomalies over polar North America and central and eastern Europe and dry anomalies in the Mediterranean (Figs. 10d and 11d). The increased occurrence of SB in the MHGS experiment indicates reinforced cold anomalies in polar North America, Europe, and the Mediterranean; warm anomalies in northern Scandinavia and eastern North America; dry anomalies in western and northern central Europe and polar North America; and wet anomalies in the Mediterranean (Figs. 10f and 11f).
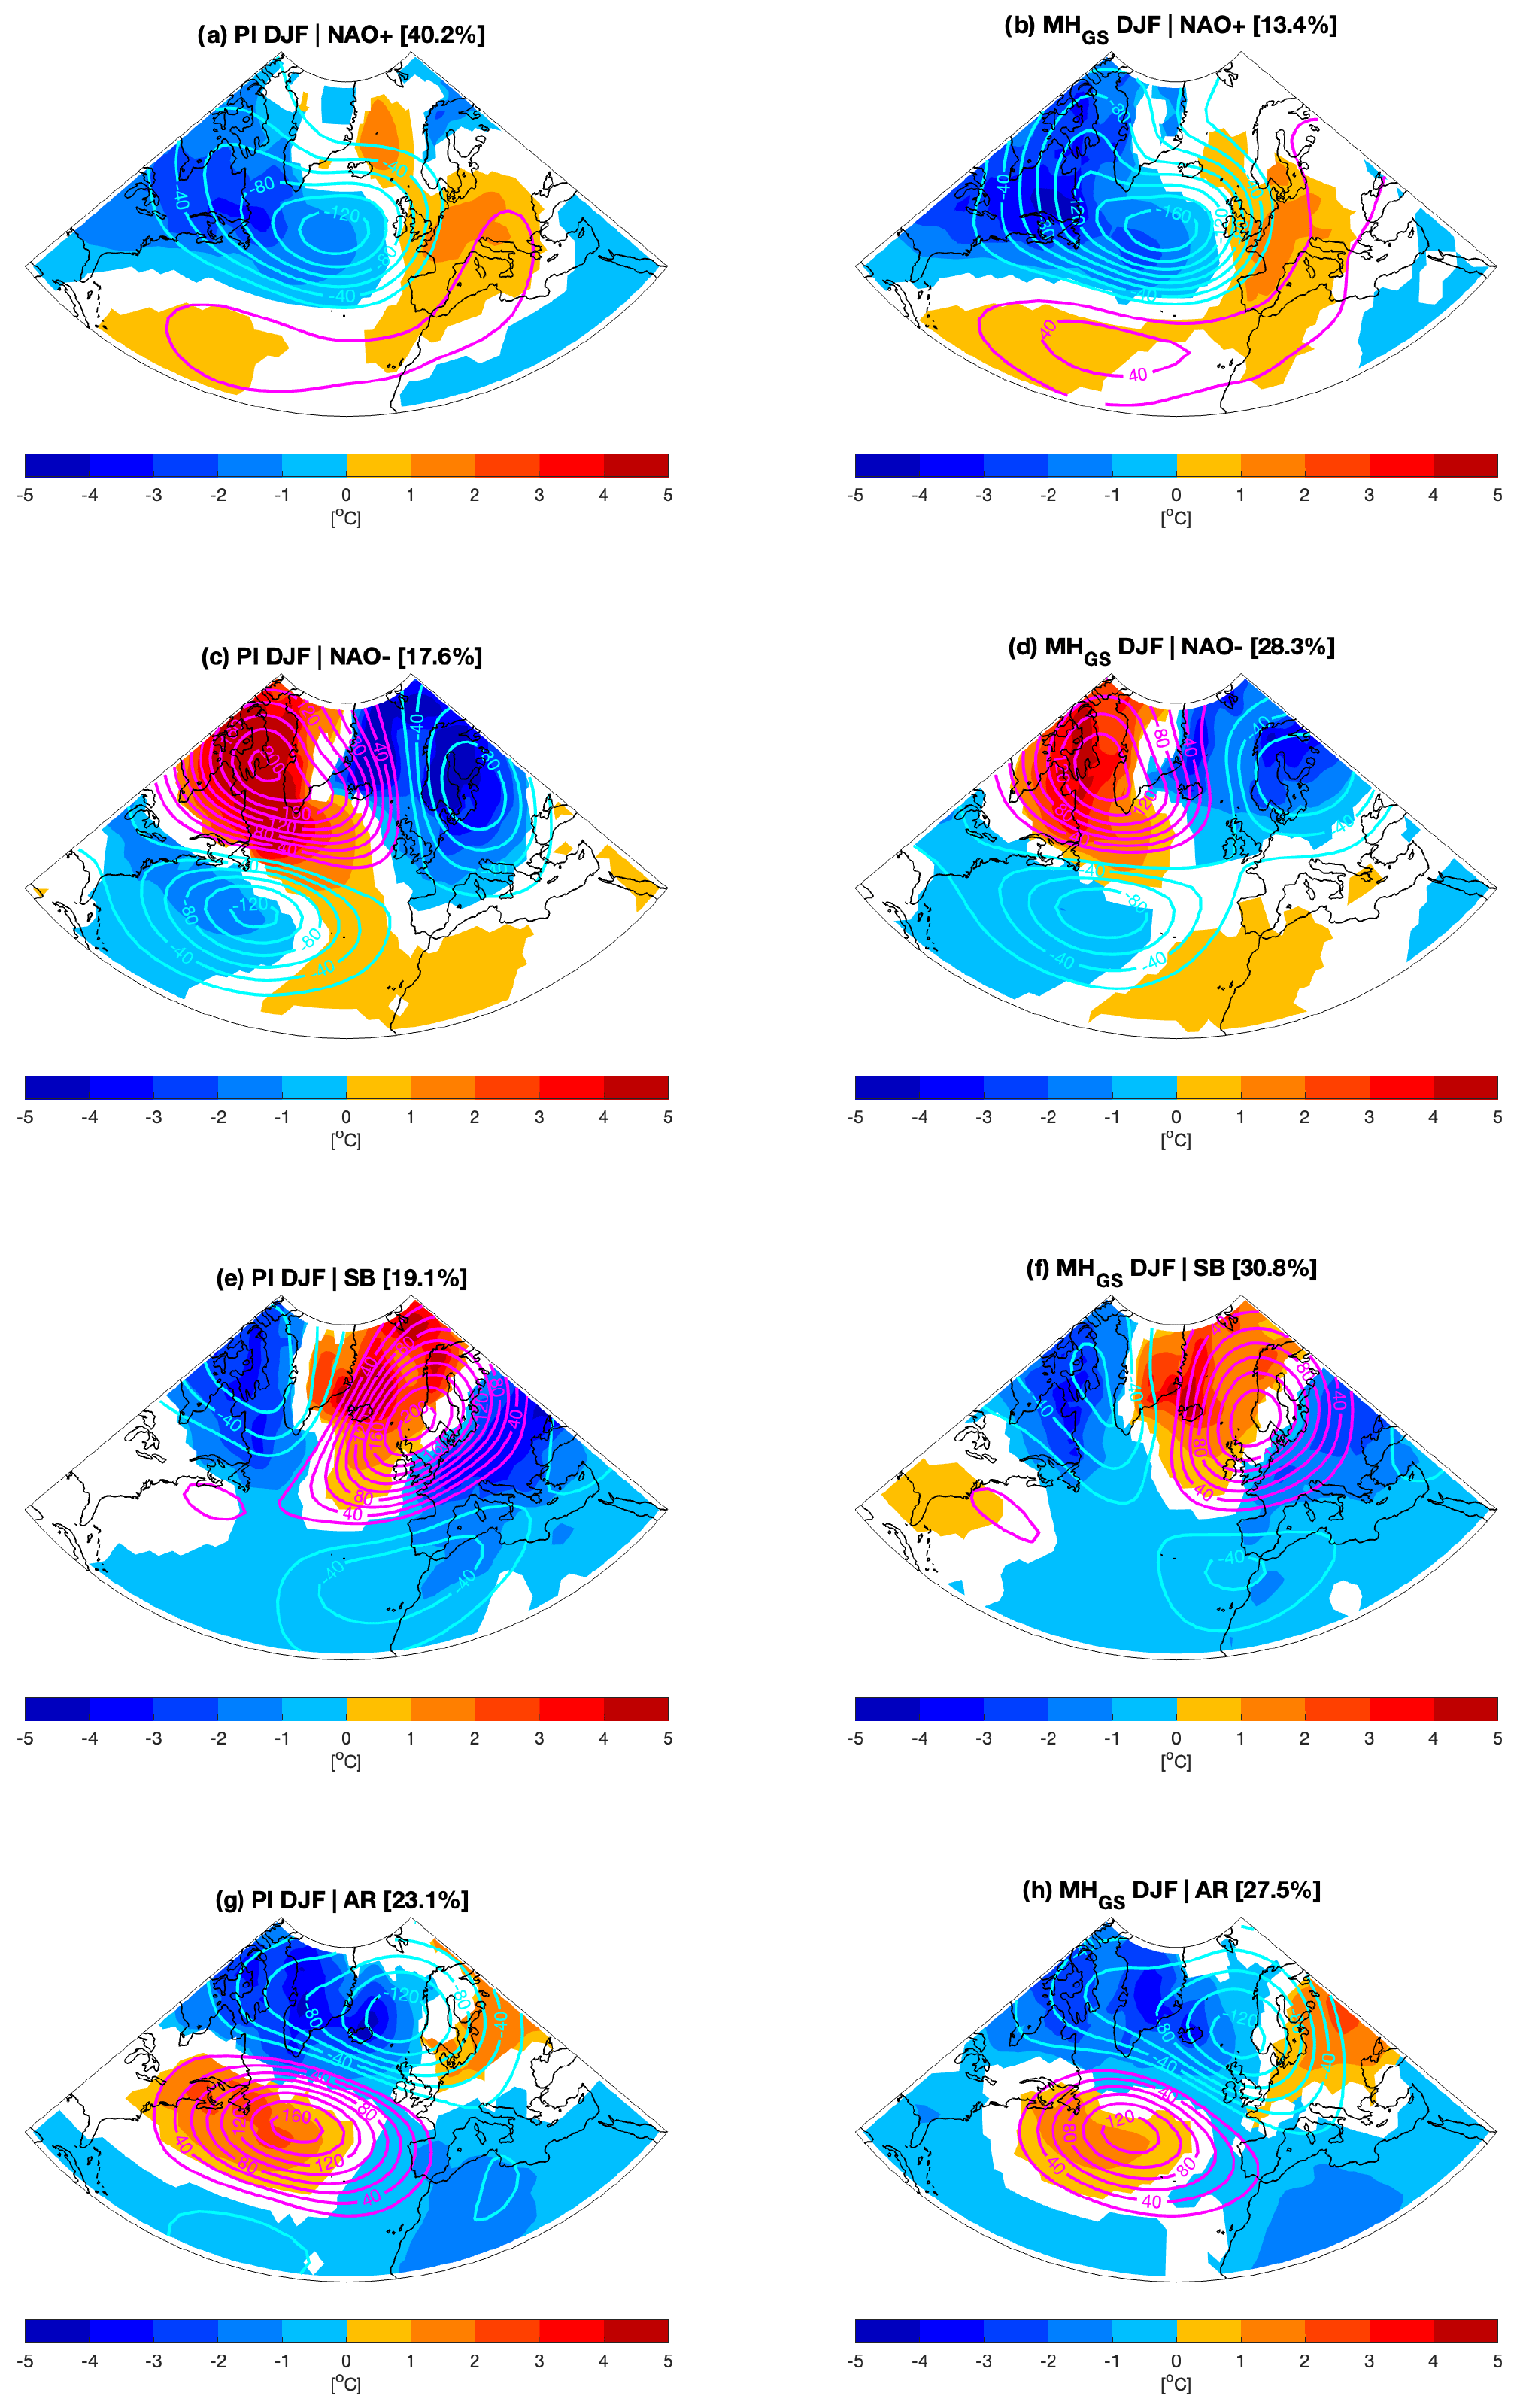
Figure 10Panels (a), (c), (e), and (g) show winter North Atlantic WRs and associated thermal anomalies, defined with respect to the climatology in the PI simulation. Panels (b), (d), (f), and (h) show the same information but for the MHGS simulation. North Atlantic WRs are presented as geopotential-height anomalies at 500 hPa (m); thermal anomalies are presented as anomalies in 2 m temperature (°C). Only significant anomalies in 2 m temperature, assessed using a Student's t test at the 95 % confidence level, are shown.
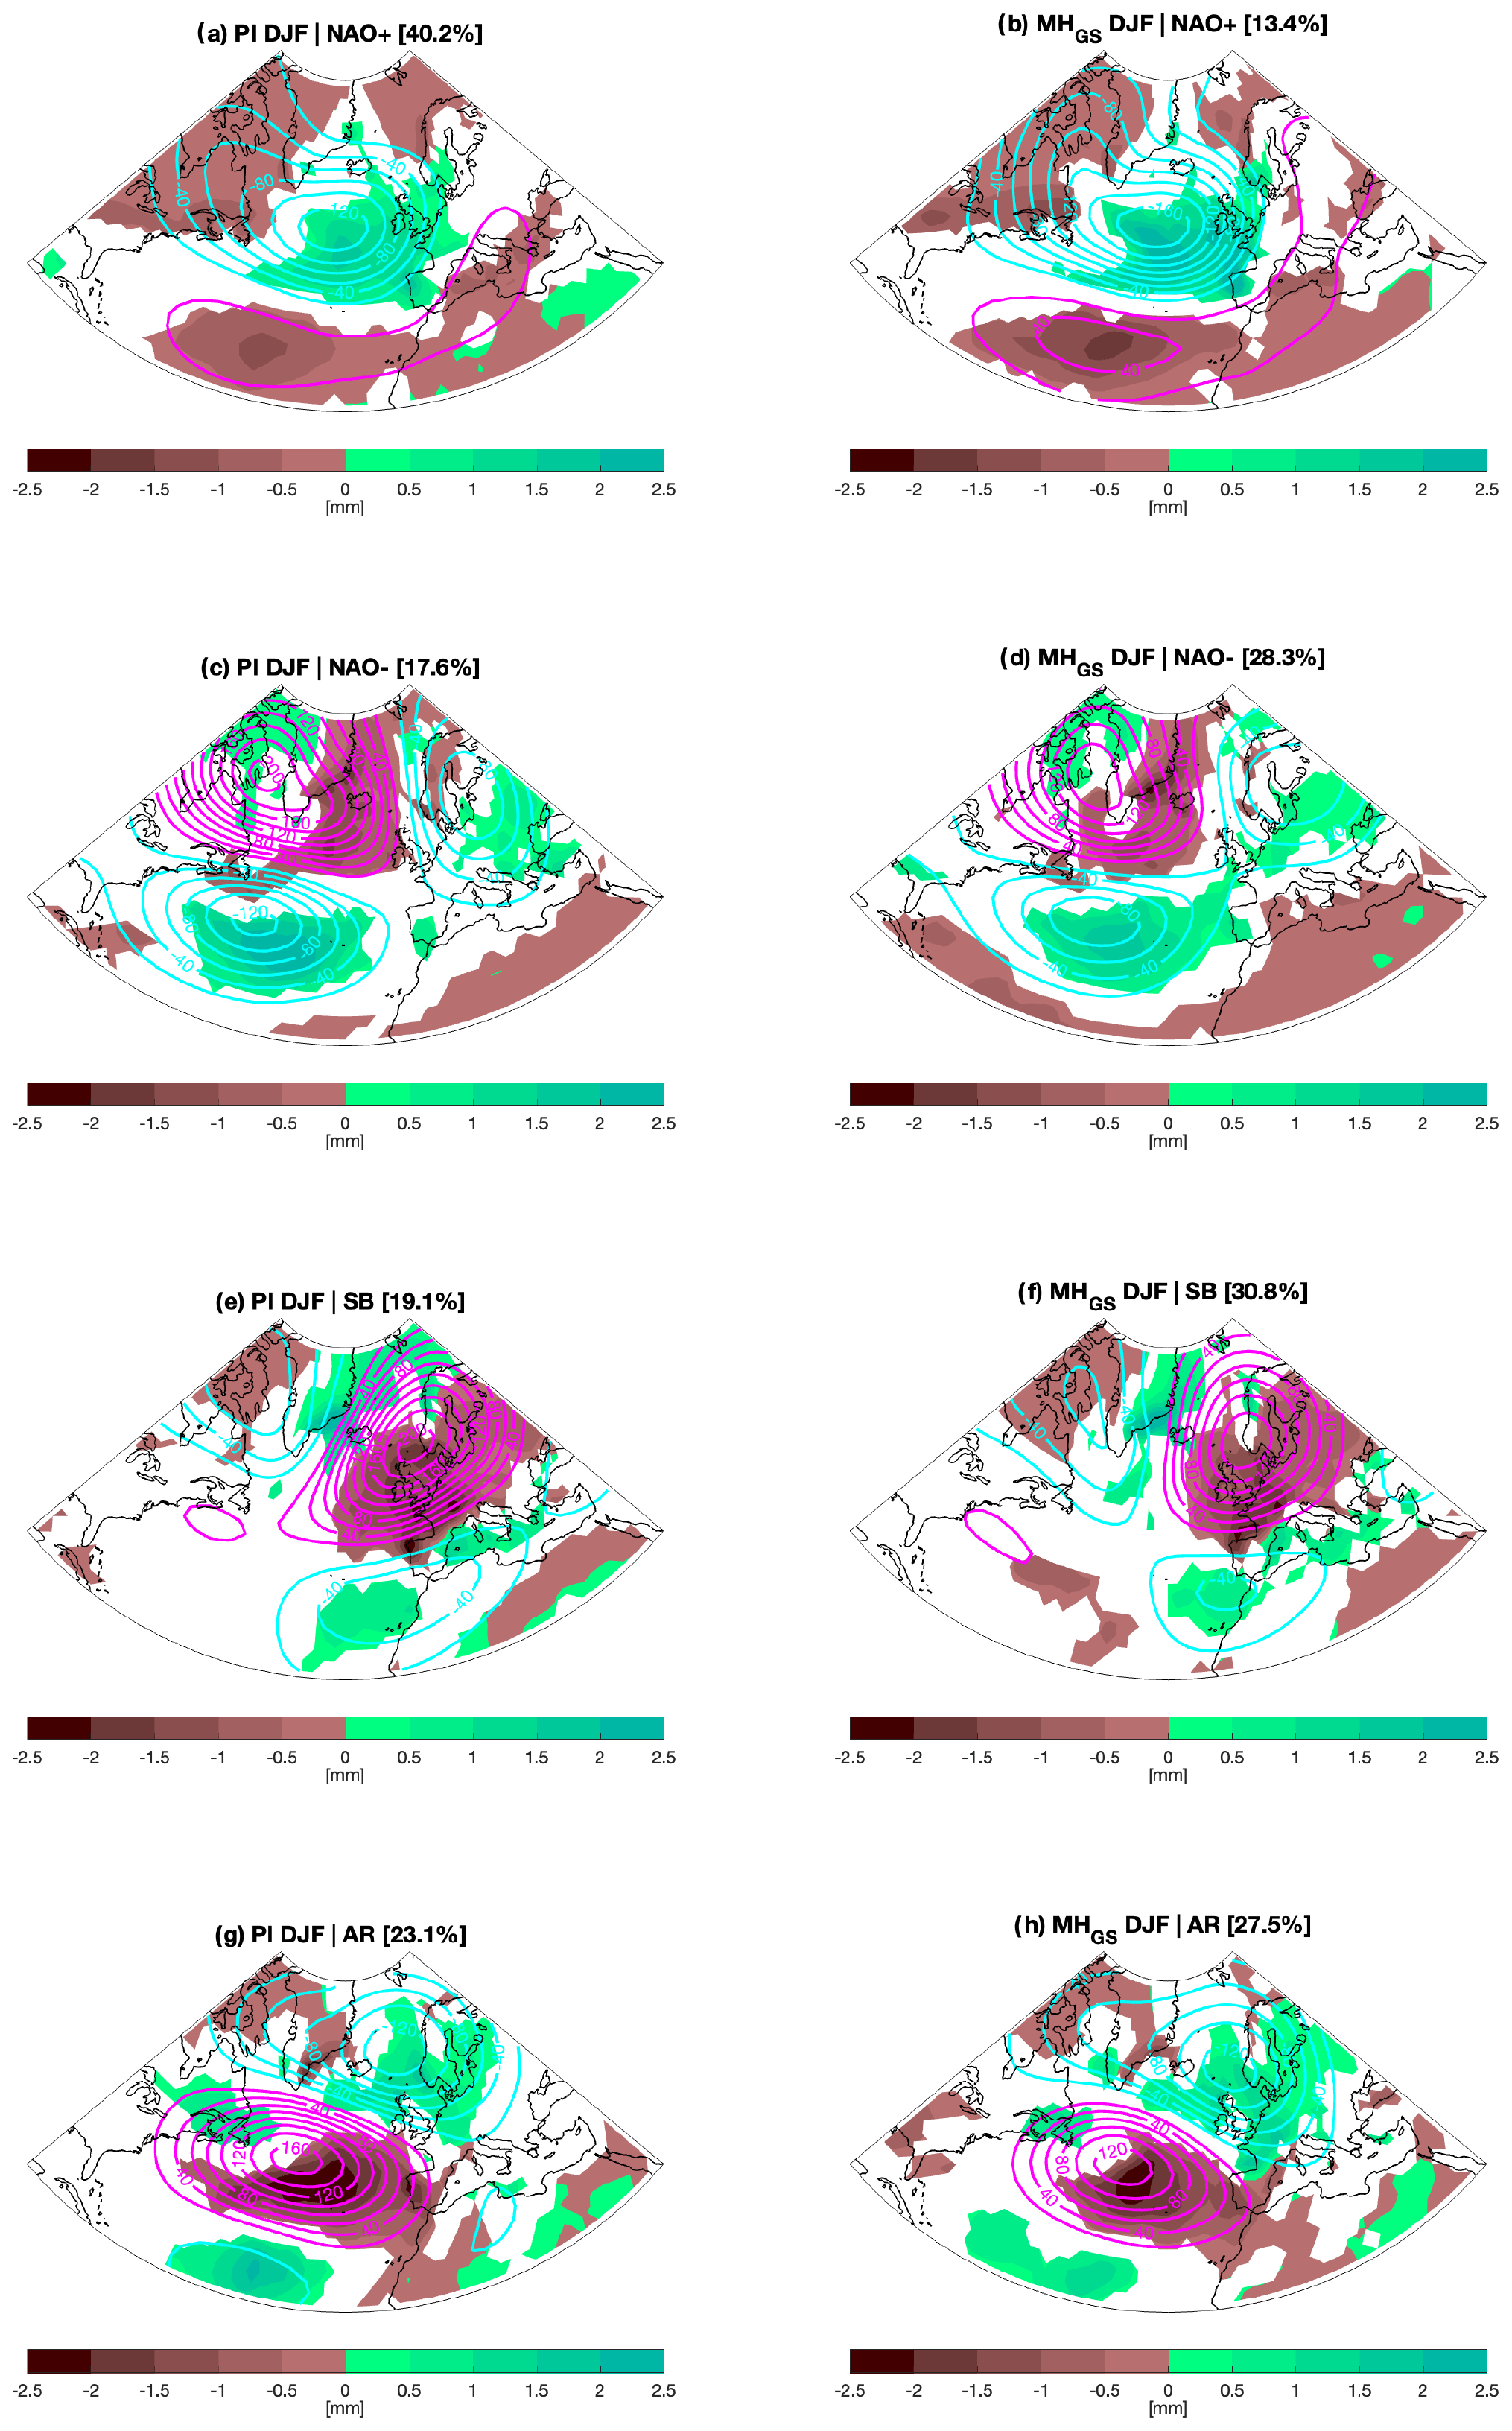
Figure 11Panels (a), (c), (e), and (g) show winter North Atlantic WRs and associated rainfall anomalies, defined with respect to the climatology in the PI simulation. Panels (b), (d), (f), and (h) show the same information but for the MHGS simulation. North Atlantic WRs are presented as geopotential-height anomalies at 500 hPa (m); rainfall anomalies are presented as anomalies in precipitation (mm). Only significant anomalies in precipitation, assessed using a Student's t test at the 95 % confidence level, are shown.
Consistent with the literature, summer synoptic circulation simulated by EC-Earth3.1 is characterised by NAO+, NAO−, the AR, and the Icelandic Low (IL) (Cassou et al., 2005) (Fig. A4). NAO+, NAO−, and the IL show similar frequencies, characterising atmospheric circulation in more than 80 % of the analysed daily fields, while the occurrence of the AR is much lower (Table 2). Notably, the summer NAO+ and NAO− do not display symmetrically opposite circulation patterns, unlike the positive and negative phases of the NAO, which are defined as the first EOF of interannual variability (see Figs. A2b and A4a–b). Modifications in the orbital parameters in the MH experiments lead to an increased occurrence of both NAO+ and NAO− with respect to the PI simulation, along with a decrease in the IL and AR frequencies, making the NAO the dominant pattern of synoptic variability in the MHGS experiment (63.6 % of the analysed daily fields are associated with NAO WRs; Table 2). The discrepancy between the increased occurrence of both NAO+ and NAO− WRs and the shift towards a negative phase in the monthly NAO can be explained by the differences in the spatial patterns discussed above. While NAO− matches the negative phase of the monthly NAO well (see Figs. A2b and A4a), NAO+ does not display a symmetric counterpart, with the high-pressure centre of action shifted over the Scandinavian Peninsula (see Fig. A4b). This discrepancy is more a matter of terminology than a physical inconsistency. The predominance of NAO+ and NAO− WRs results in warm anomalies affecting southern and northern Europe and eastern North America when Saharan greening is prescribed (Fig. 12b and d). Conversely, precipitation anomalies associated with the WR shift towards an NAO− circulation pattern primarily affect Europe, with no significant impact on North America. Specifically, NAO+ is associated with dry anomalies in Scandinavia and the eastern Mediterranean, while NAO− leads to dry anomalies in southern Europe and the Mediterranean, accompanied by wet anomalies in western Europe and southern Scandinavia (Fig. 13b and d).
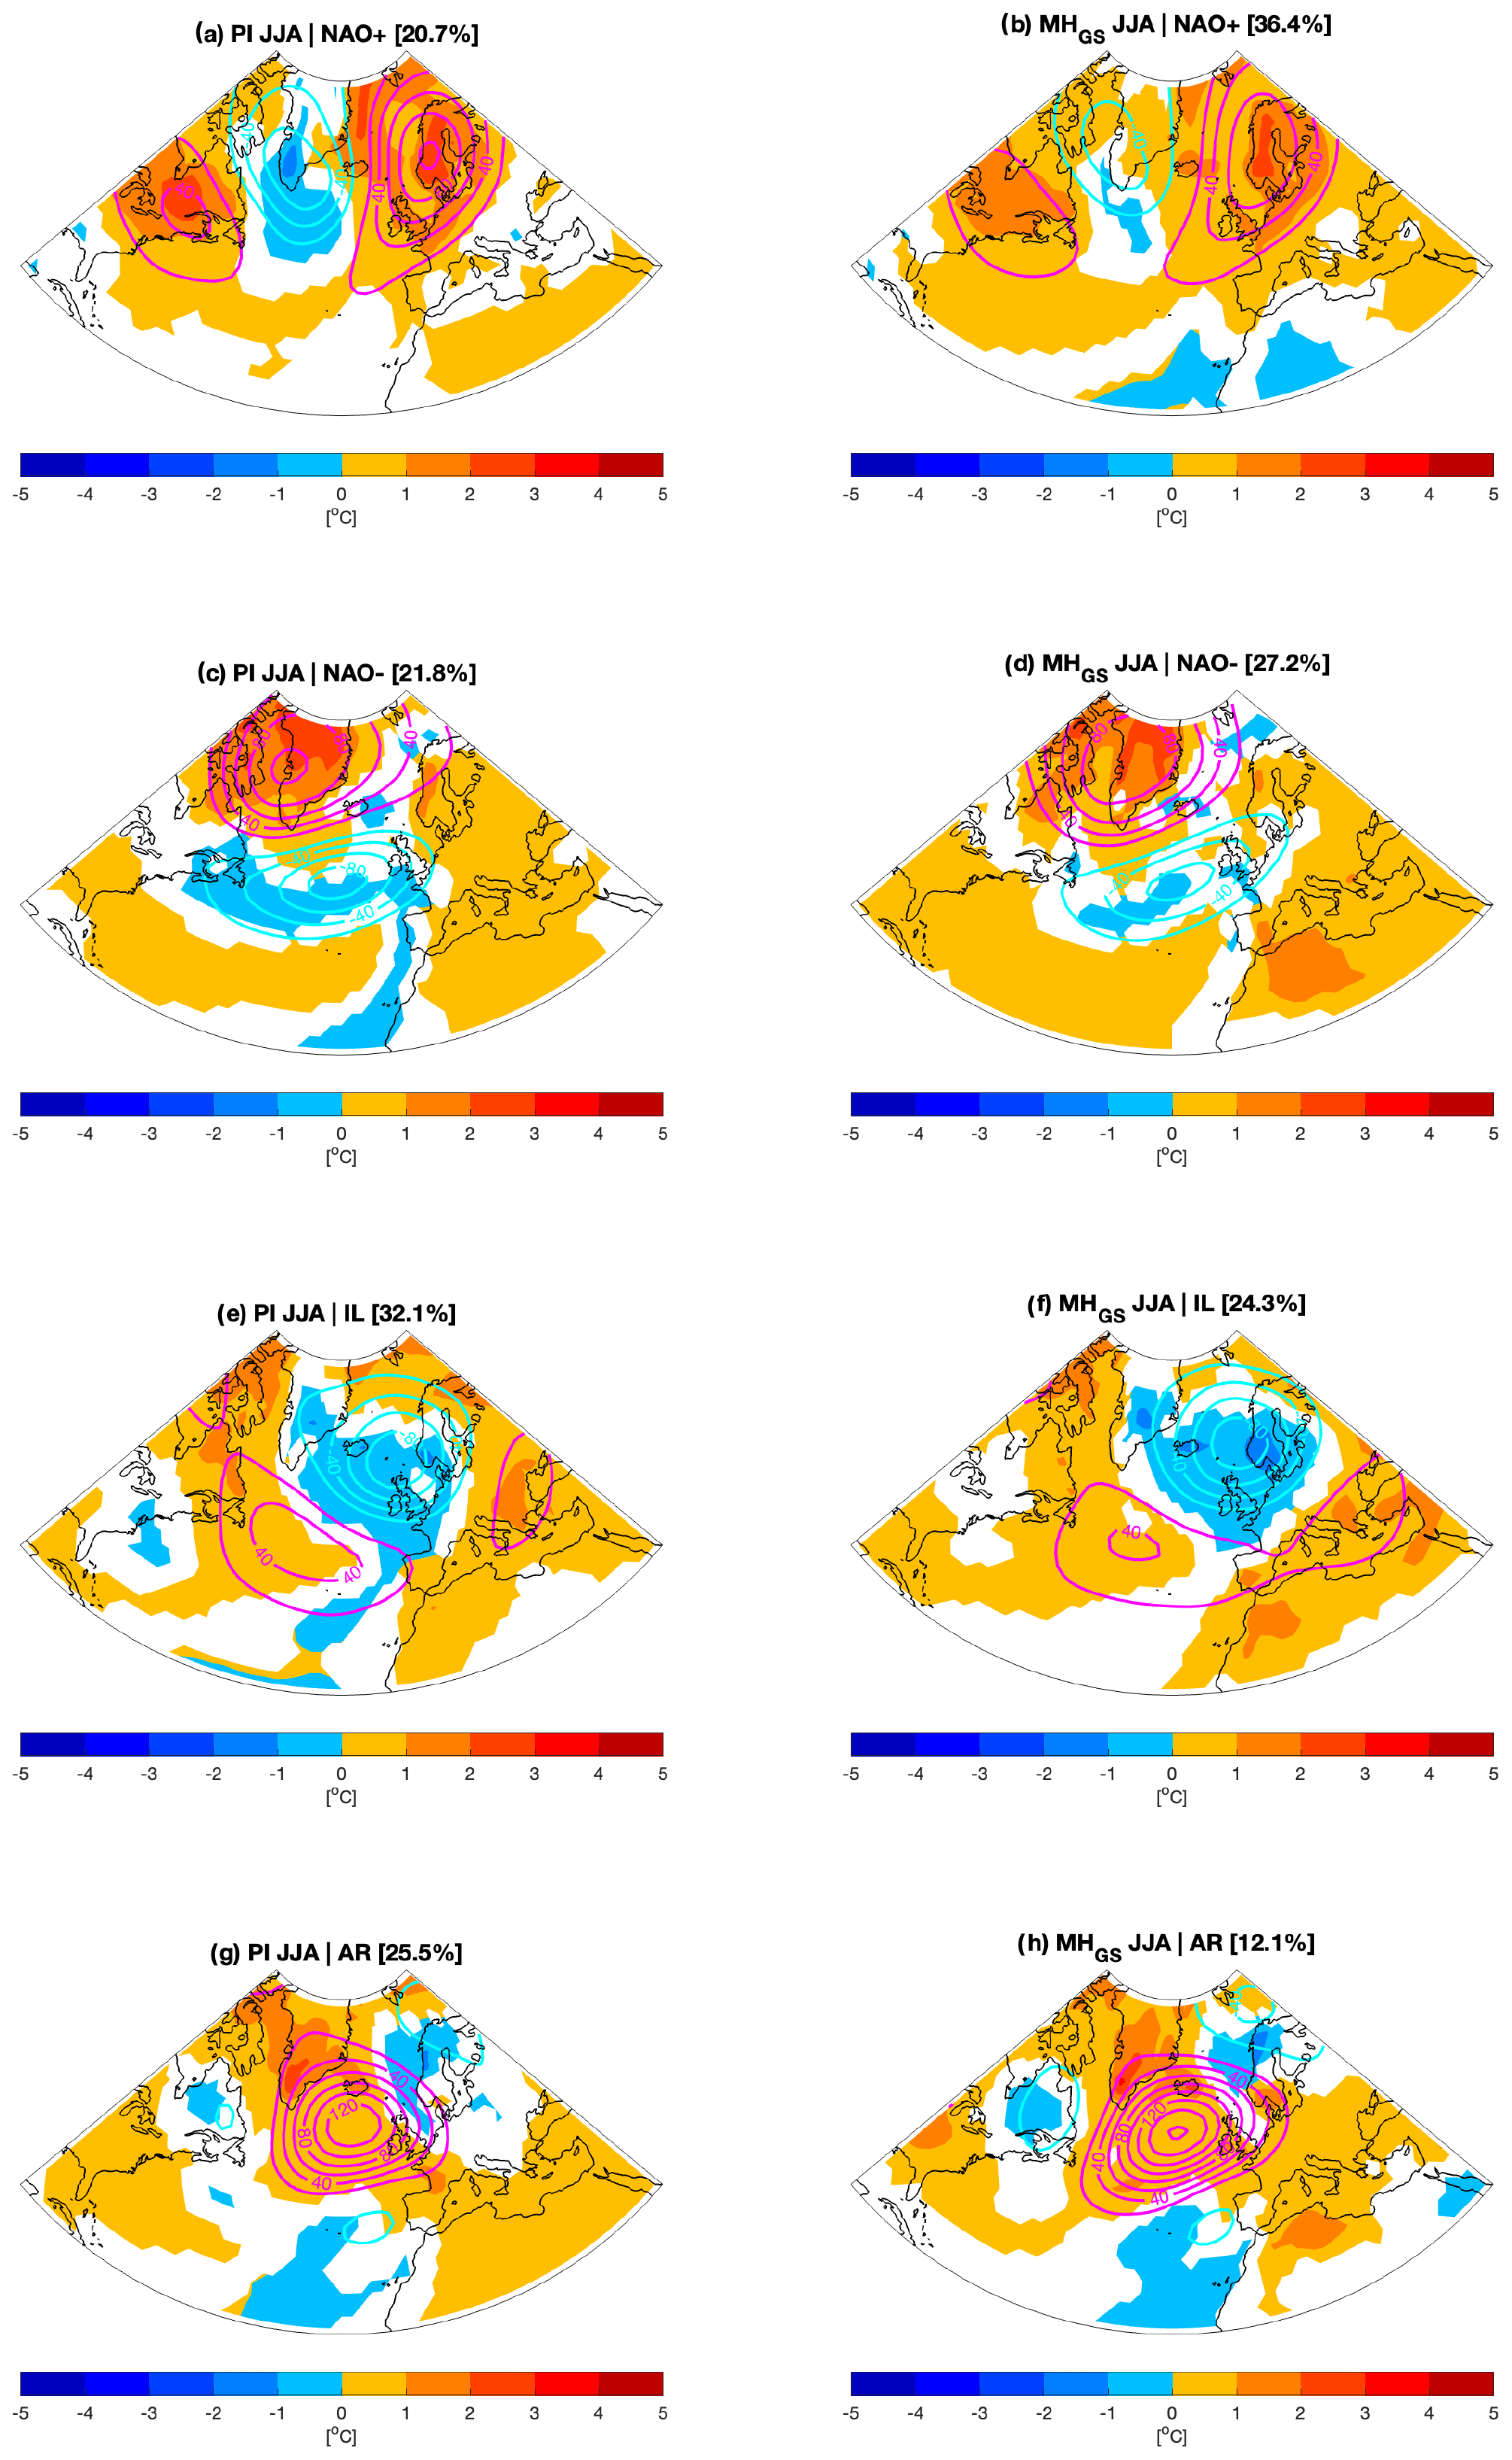
Figure 12Panels (a), (c), (e), and (g) show summer North Atlantic WRs and associated thermal anomalies, defined with respect to the climatology in the PI simulation. Panels (b), (d), (f), and (h) show the same information but for the MHGS simulation. North Atlantic WRs are presented as geopotential-height anomalies at 500 hPa (m); thermal anomalies are presented as 2 m temperature anomalies (°C). Only significant anomalies in 2 m temperature, assessed using a Student's t test at the 95 % confidence level, are shown.
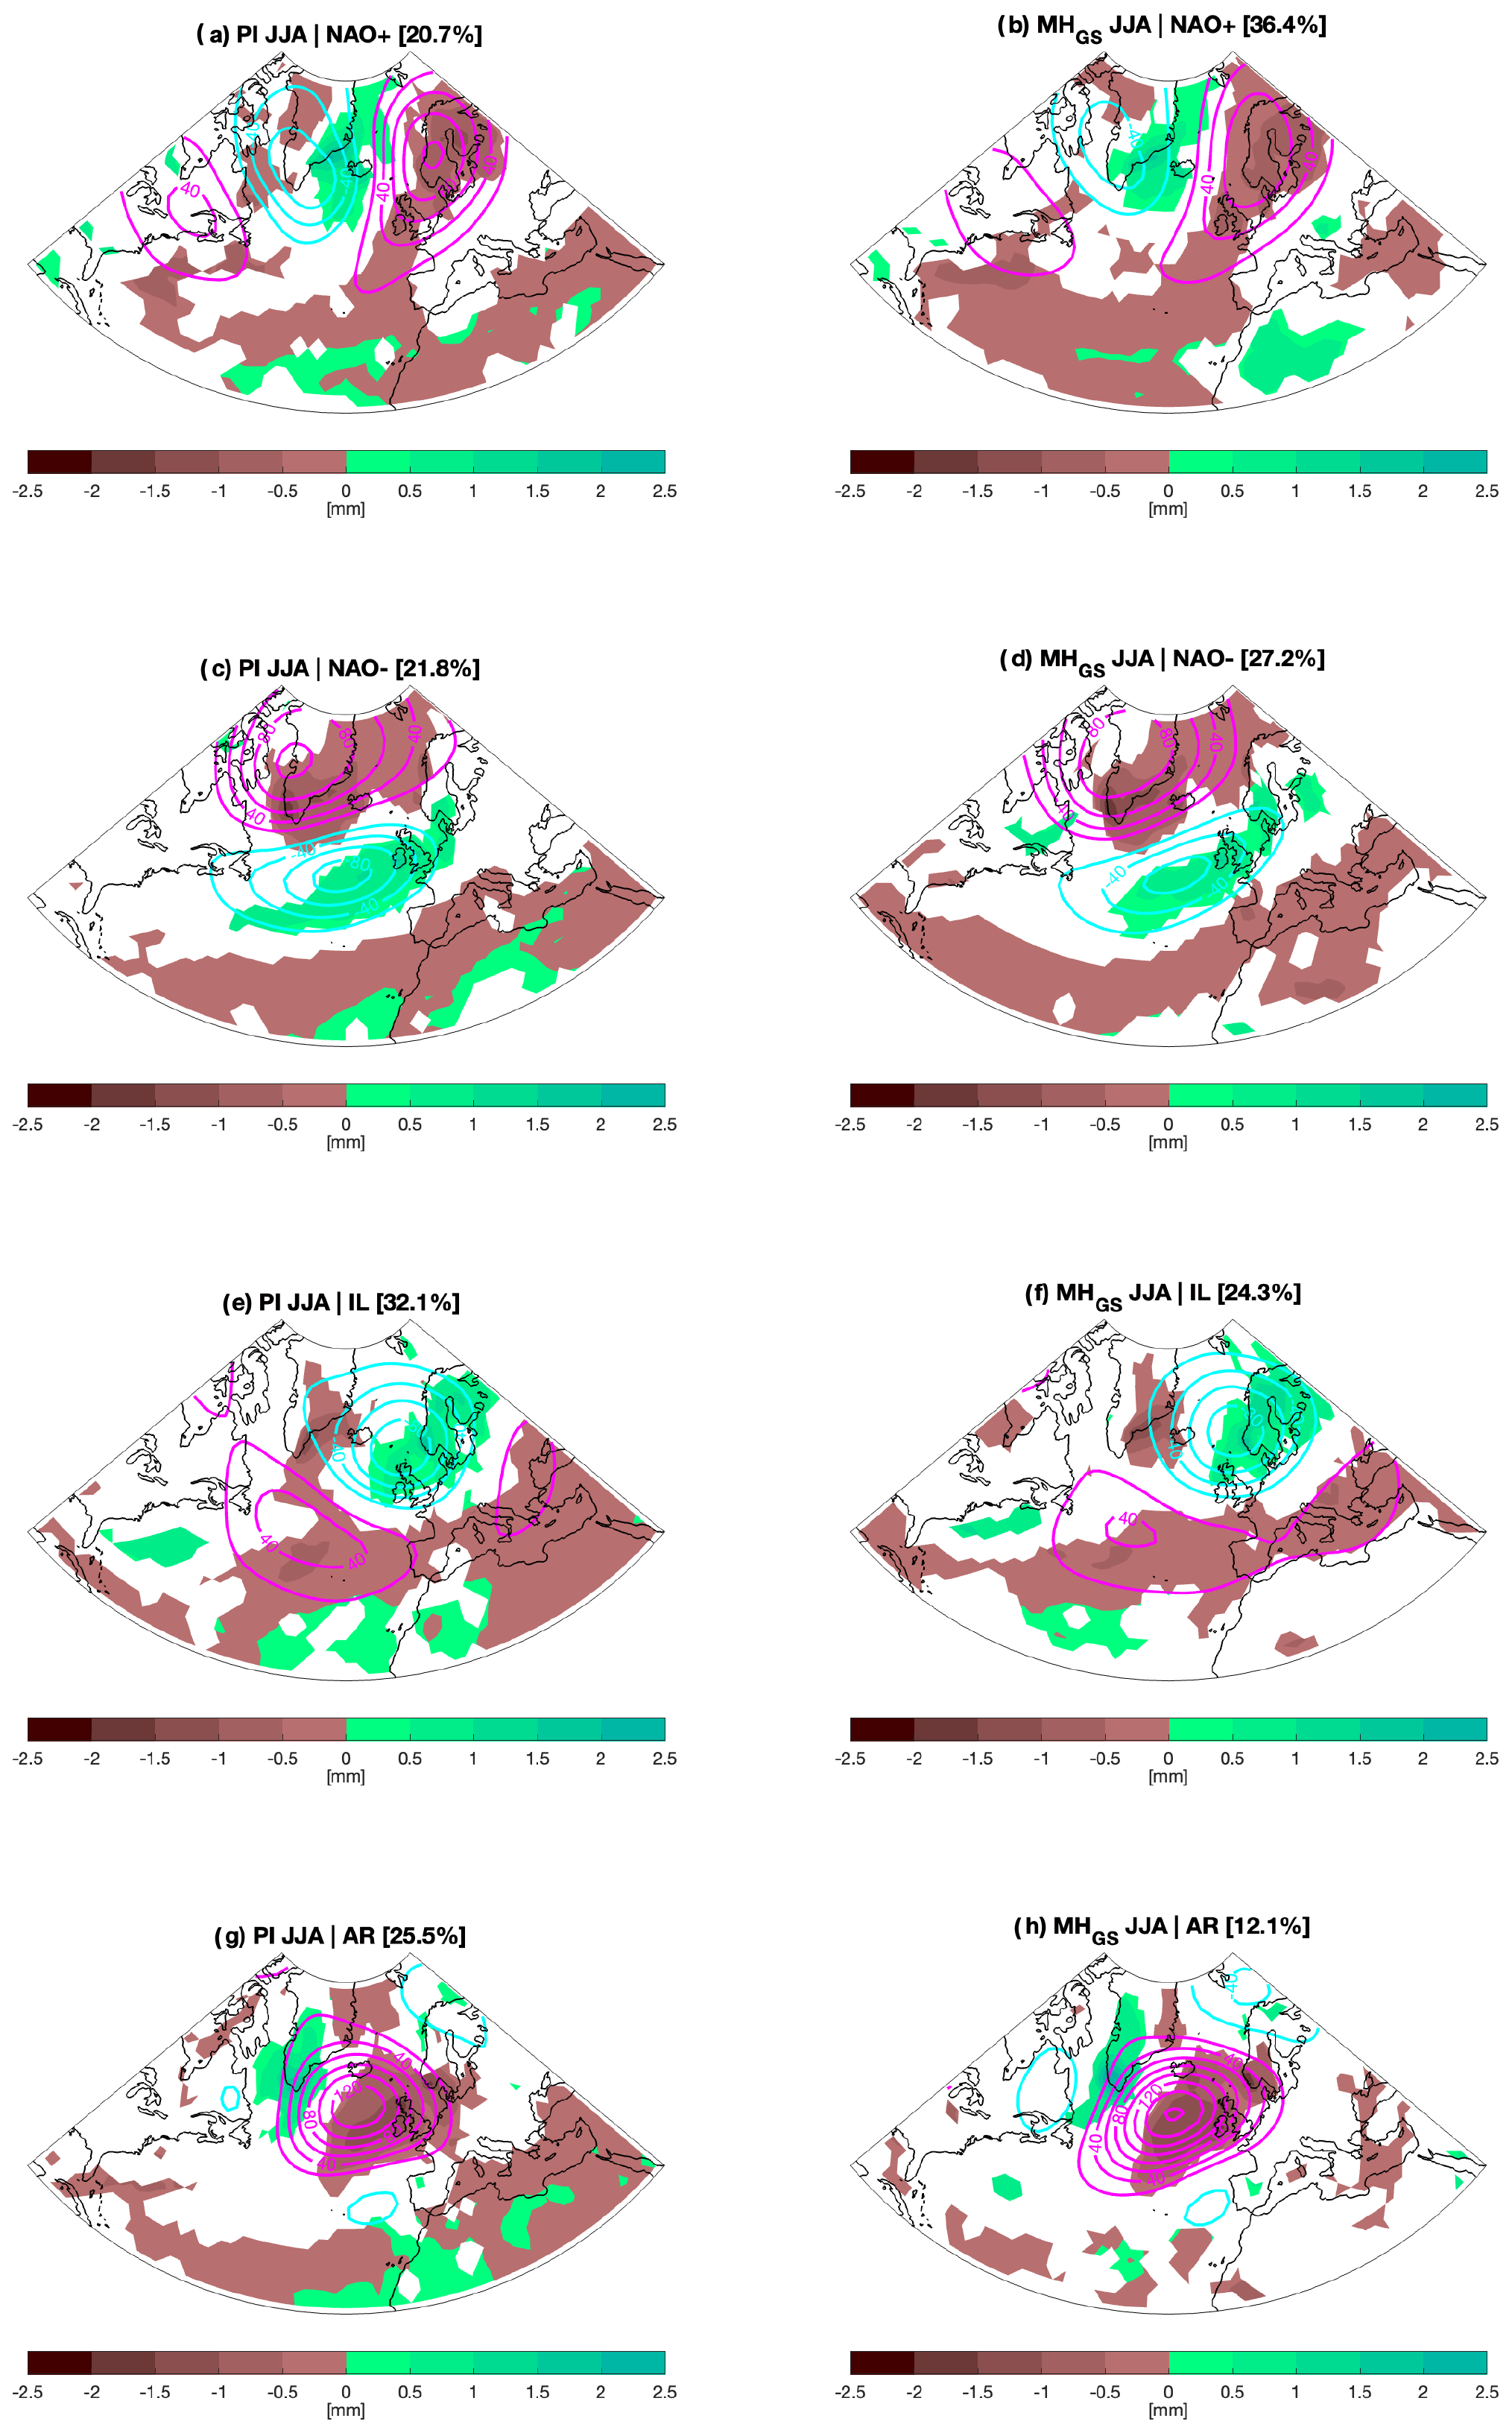
Figure 13Panels (a), (c), (e), and (g) show summer North Atlantic WRs and associated rainfall anomalies, defined with respect to the climatology in the PI simulation. Panels (b), (d), (f), and (h) show the same information but for the MHGS simulation. North Atlantic WRs are presented as geopotential-height anomalies at 500 hPa (m); rainfall anomalies are presented as anomalies in precipitation (mm). Only significant anomalies in precipitation, assessed using a Student's t test at the 95 % confidence level, are shown.
Cohen's kappa index (κ) is used to quantify qualitative agreement between two data sets, with values ranging from −1 (complete disagreement) to 1 (perfect agreement). Here, the index indicates generally low agreement between proxy reconstructions and model outputs over the mid-latitudes (Table 3). Notably, the agreement for summertime temperatures is particularly low, with κ values very close to 0 across all regions. For wintertime temperatures, κ values range from 0 to 0.158, indicating very low agreement, with the exception of the MHPMIP simulation across Asia (κ= 0.158). Annual precipitation shows slightly higher κ values, peaking at 0.28 for the MHGS simulation across Asia. In all cases but one (annual precipitation over Asia), the MHPMIP simulation shows higher κ values compared to the MHGS simulation.
Table 3Cohen's kappa index for region-wise proxy–model comparison, following DiNezio and Tierney (2013).
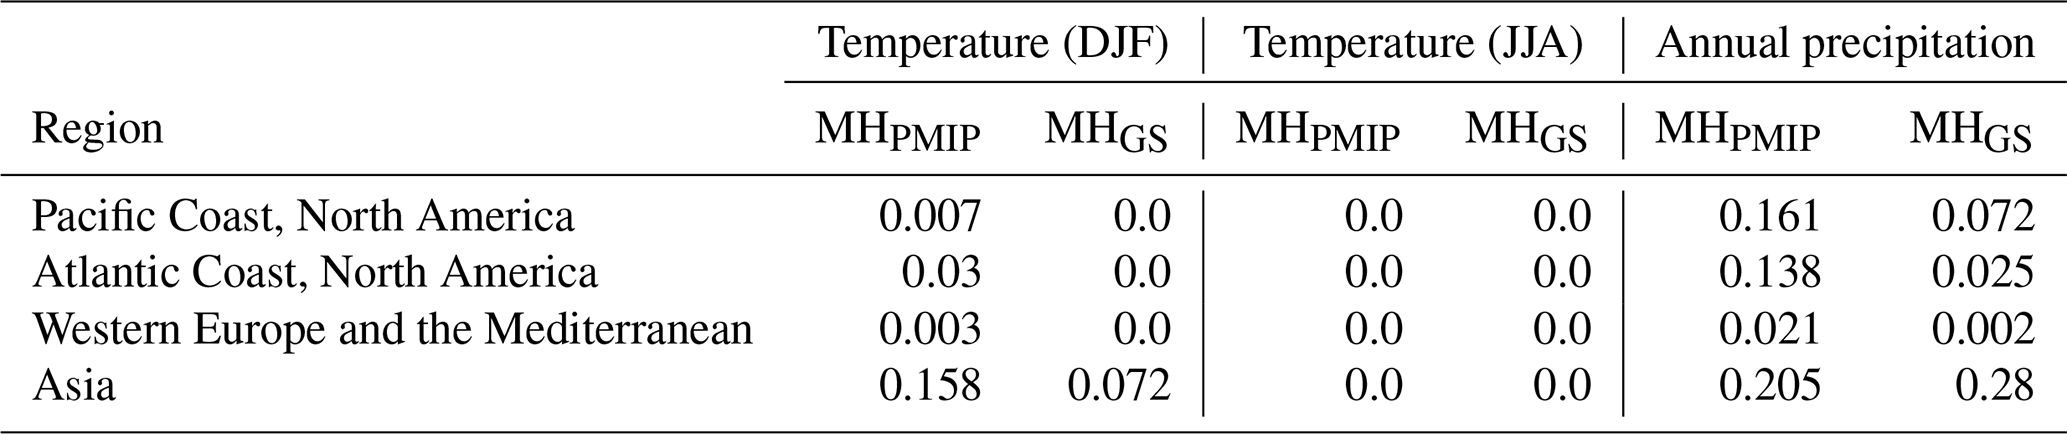
A closer inspection of the proxy–model comparison reveals several factors contributing to the low agreement between summer temperatures. Firstly, the proxy reconstructions lack a spatially coherent large-scale pattern across the selected mid-latitude regions, with some coherence found only in certain subregions, such as Scandinavia. Secondly, both the MHPMIP and MHGS simulations indicate a strong mid-latitude warming signature, contrasting with the cooling shown in several reconstructions in North America and northern Asia. This suggests that the model may simulate an overly homogenous warming signal, while proxies indicate localised increases in temperatures. More importantly, the lack of coherent regional temperature signatures in the proxy reconstructions suggests that low proxy–model agreement may not be exclusively due to model deficiencies. For annual precipitation, consistent regional signatures emerge over North America and Asia. North American proxies suggest a drier MH in the west and east but wetter conditions in the southwest. While the MHPMIP and MHGS simulations capture the slightly wet conditions in the southwest, they fail to simulate the drying patterns reconstructed elsewhere. In Asia, minor drying patterns from ∼ 45 to ∼ 100° E in the MHPMIP simulation are replaced by more extensive wet conditions in the MHGS simulation, leading to an improvement in the κ value for the region.
The overall low proxy–model agreement is further complicated by the numerous inconclusive MH proxy records (defined in Sect. 2 as records without a robust estimation of change or indicating no change) and the lack of consistent regional proxy signatures, except in specific subregions. This raises questions about the nature of MH climate anomalies – either the mid-latitudes lack coherent seasonal-temperature patterns (unlike the tropics and high latitudes), suggesting limitations in the model's ability to capture regional climate nuances, or coherent climate signals indeed exist, and improvement in proxy–model agreements depends more on resolving discrepancies between proxies than on solely making model improvements. In summary, the inclusion of a vegetated Sahara in the model leads to improved agreement across Asia for precipitation and a realistic representation of drying patterns in North America, albeit with some spatial inaccuracies. This suggests that the MHGS simulation more effectively captures precipitation patterns than seasonal-temperature patterns across the mid-latitudes.
In this study, a set of atmosphere–ocean coupled climate model simulations are analysed to explore the impact of Saharan greening on mid-latitude atmospheric circulation and climate conditions in the Northern Hemisphere during the MH. Specifically, two MH simulations are performed – one with prescribed vegetation cover and reduced dust emissions in the Sahara region and one without – and compared to a PI control experiment. The climatological response in the Northern Hemisphere mid-latitudes is analysed, along with modifications in the teleconnection patterns and synoptic variability in the North Atlantic. To the authors' knowledge, this is the first study attempting to assess MH climate modifications, including Saharan greening, at mid-latitudes through the modelling of atmospheric circulation variability at synoptic to interannual timescales.
The MH experiments show significant changes in both surface temperature and precipitation at middle to high latitudes with respect to the PI control simulation. The warming observed at middle to high latitudes is attributed to increased summer insolation, leading to decreased sea ice, with a sustained effect into winter, known as the “summer remnant effect of insolation” (Yin and Berger, 2012). The increase in precipitation aligns with a significant reshaping of large-scale circulation in the upper and middle troposphere, including a westward shift in the global Walker Circulation and modifications in the westerly flow. Notably, these shifts result in altered surface climates in North America and Eurasia. The responses of temperature, precipitation, and atmospheric dynamics are more pronounced in the MHGS simulation, indicating the significant influence of Saharan greening on climate in the Northern Hemisphere. There is extensive literature on tropical–extratropical interactions triggered by tropical forcings like the Indian monsoon and the El Niño–Southern Oscillation (e.g. Hoskins and Ambrizzi, 1993; Rodwell and Hoskins, 1996). More recently, the African monsoon has been identified as a possible source of tropical–extratropical teleconnections (Gaetani et al., 2011; Nakanishi et al., 2021), reinforcing the hypothesis that the strengthening of deep convection in northern Africa associated with Saharan greening could lead to climate impacts in the extratropics. Moreover, the fact that warm anomalies are more pronounced in the MHGS simulation than in the MHPMIP simulation suggests drivers other than insolation may could have amplified the warming. In particular, the prominent warming simulated in the North Atlantic when vegetation is prescribed in the Sahara raises the possibility of modifications in ocean circulation – for example, Zhang et al. (2021) observed a strengthening of the Atlantic Meridional Overturning Circulation in response to the simulation of Saharan greening). Such changes could potentially feed back on the atmosphere. Consequently, further studies investigating potential changes in ocean circulation associated with Saharan greening would be valuable for a better understanding of the widespread warming observed at middle to high latitudes.
Analysis of interannual variability in simulated mid-tropospheric circulation over the North Atlantic shows a significant shift from a predominantly positive NAO phase in the PI experiment to a predominantly neutral-to-negative phase in the MH experiments in both winter and summer. The impact is stronger when Saharan vegetation is prescribed, particularly in winter. The simulated changes in the NAO phase are in agreement with the existing literature (e.g. Nesje et al., 2001; Rimbu et al., 2003; Olsen et al., 2012). However, while the simulated positive-to-negative shift in the monthly NAO is consistent with reconstructions of overall colder and drier conditions in North America, it does not explain the reconstructed thermal anomalies in Europe, particularly the warmer conditions observed in Scandinavia.
In this regard, analysis of North Atlantic WR dynamics helps reconcile this discrepancy. The spatial patterns of the NAO WRs at the synoptic timescale, particularly the summer NAO+ and winter NAO−, show centres of action located over Scandinavia, differing from the interannual NAO patterns. In addition, it is shown that simulated Saharan greening drives modifications in the occurrence of other modes of synoptic variability. The increased frequency of SB in winter and NAO+ in summer, characterised by warm anomalies over Scandinavia, aligns with the warmer conditions found in proxy records in the region and suggests a link to Saharan greening. The circulation anomalies associated with SB in winter and NAO+ in summer are consistent with those suggested by Mauri et al. (2014); this explains the MH thermal and precipitation anomalies in northern Europe, i.e. stronger westerly and southerly flows towards Scandinavia in winter and summer.
The proxy–model comparison, while revealing limited agreement due to regional inconsistencies in proxy records, suggests that, where coherent climate reconstructions exist, changes driven by Saharan greening in large-scale circulation offer plausible explanations regarding the proxy evidence, especially with respect to precipitation. This points to new opportunities for understanding the MH climate across the mid-latitudes. Furthermore, it should be noted that the simulation setup is highly idealised; it was initially tailored to enhance the representation of MH precipitation in the Sahara and improve the regional proxy–model agreement. While this approach has yielded insights into specific climate impacts, such as those associated with Sahara greening, the broader applicability to global mid-Holocene climate scenarios is limited. To improve the global proxy–model agreement, this approach would benefit from more refined MH climate modelling strategies, such as prescribing more realistic vegetation across latitudes and considering the seasonal vegetation cycle (see, for example, Swann et al., 2014), which could better account for the nuanced large- and local-scale climate feedbacks that are critical for understanding past climates.
Table A1List of the locations, coordinates, and references pertaining to the proxy records used for the quantification of the proxy–model agreement.
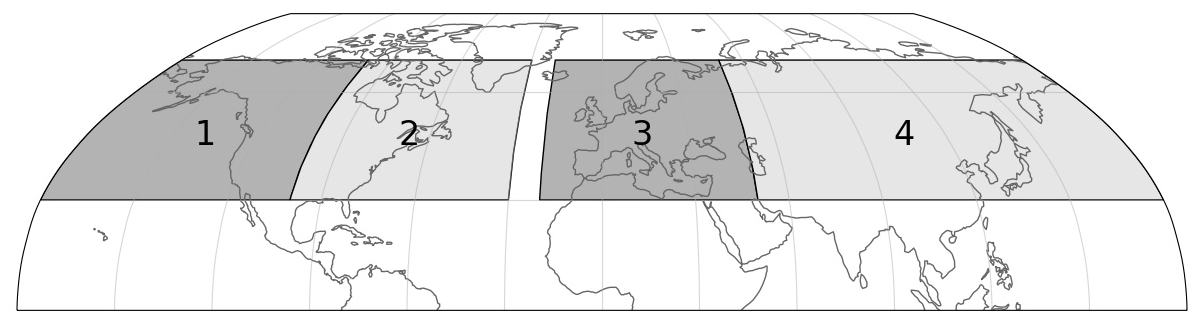
Figure A1Regions used for the Cohen's kappa index calculations. (1) Pacific Coast, North America (30–70° N, 180–100° W). (2) Atlantic Coast, North America (30–70° N, 100–30° W). (3) Europe and the Mediterranean (30–70° N, 20° W–50° E). (4) Asia (30–70° N, 50–180° E).
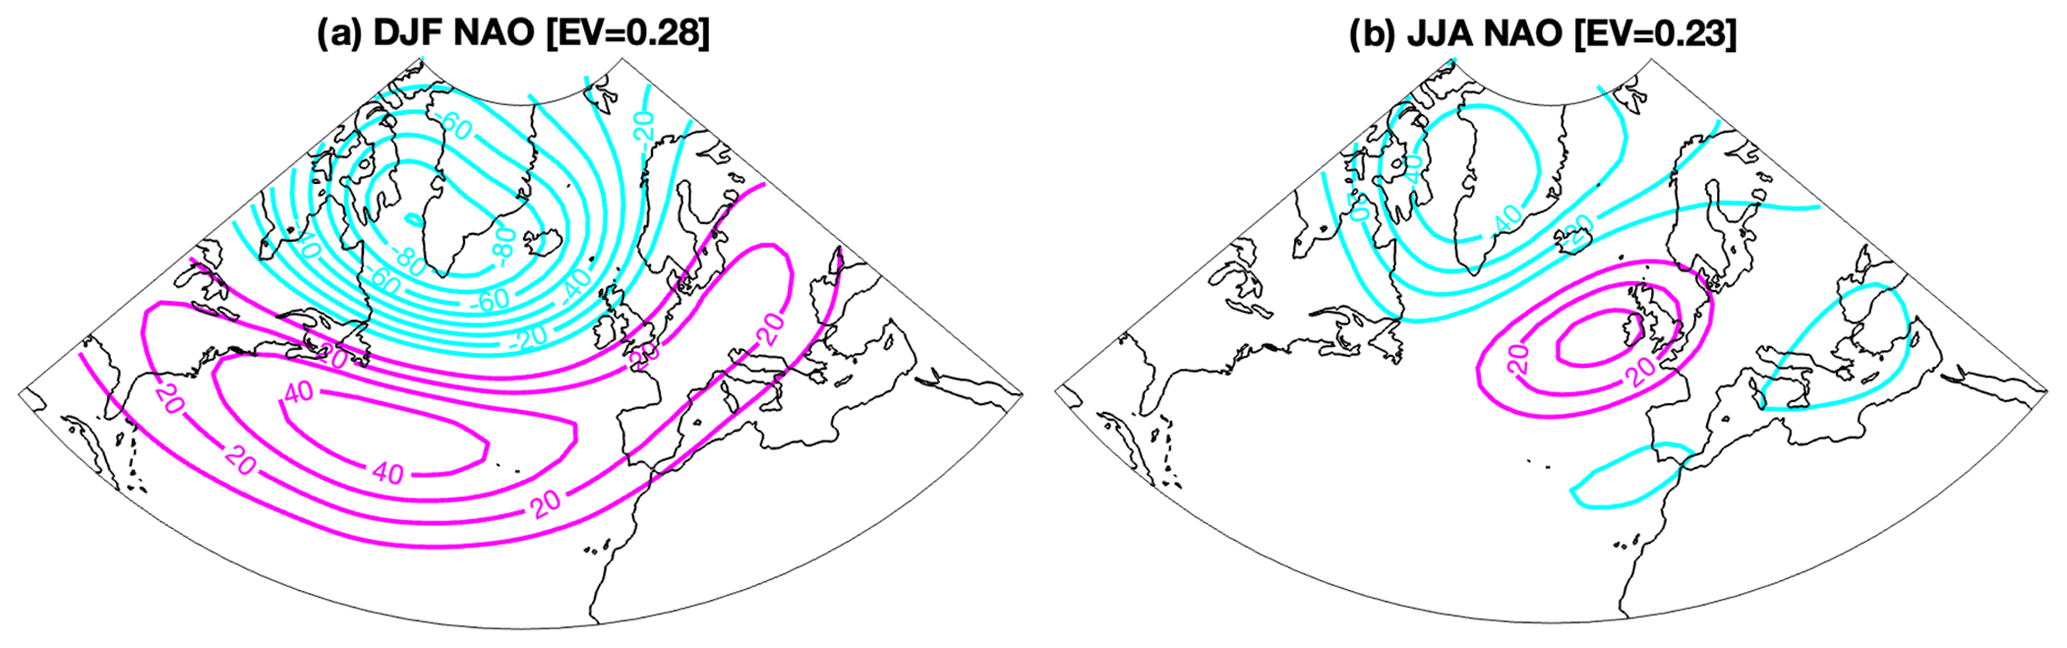
Figure A2NAO anomaly patterns in (a) winter and (c) summer obtained by regressing geopotential height at 500 hPa (m) onto the NAOI.
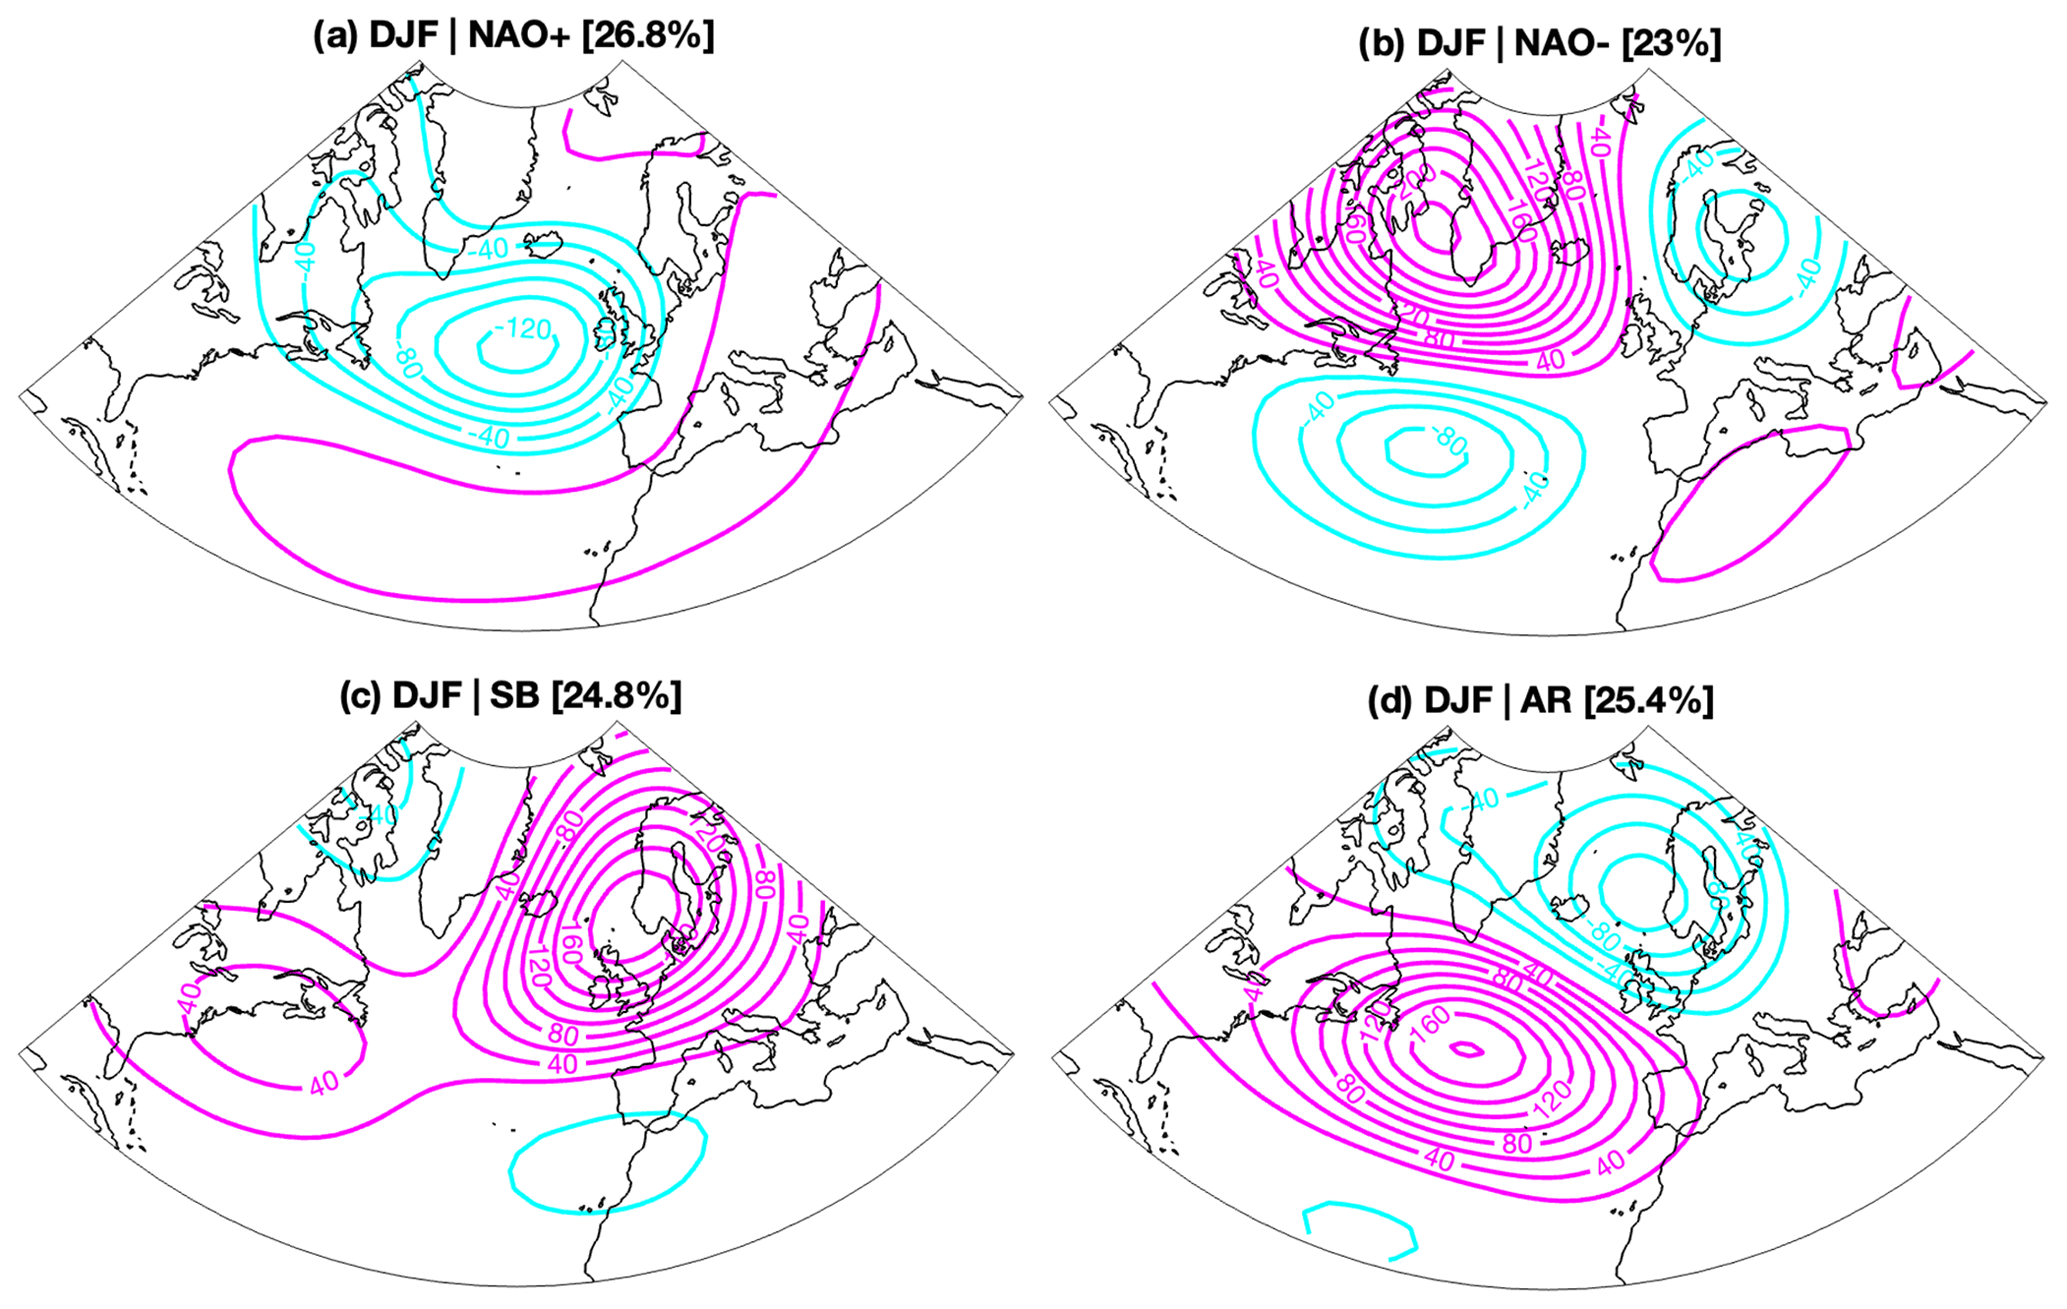
Figure A3Winter North Atlantic WRs, defined as anomalies in geopotential height at 500 hPa (m) with respect to the climatology.
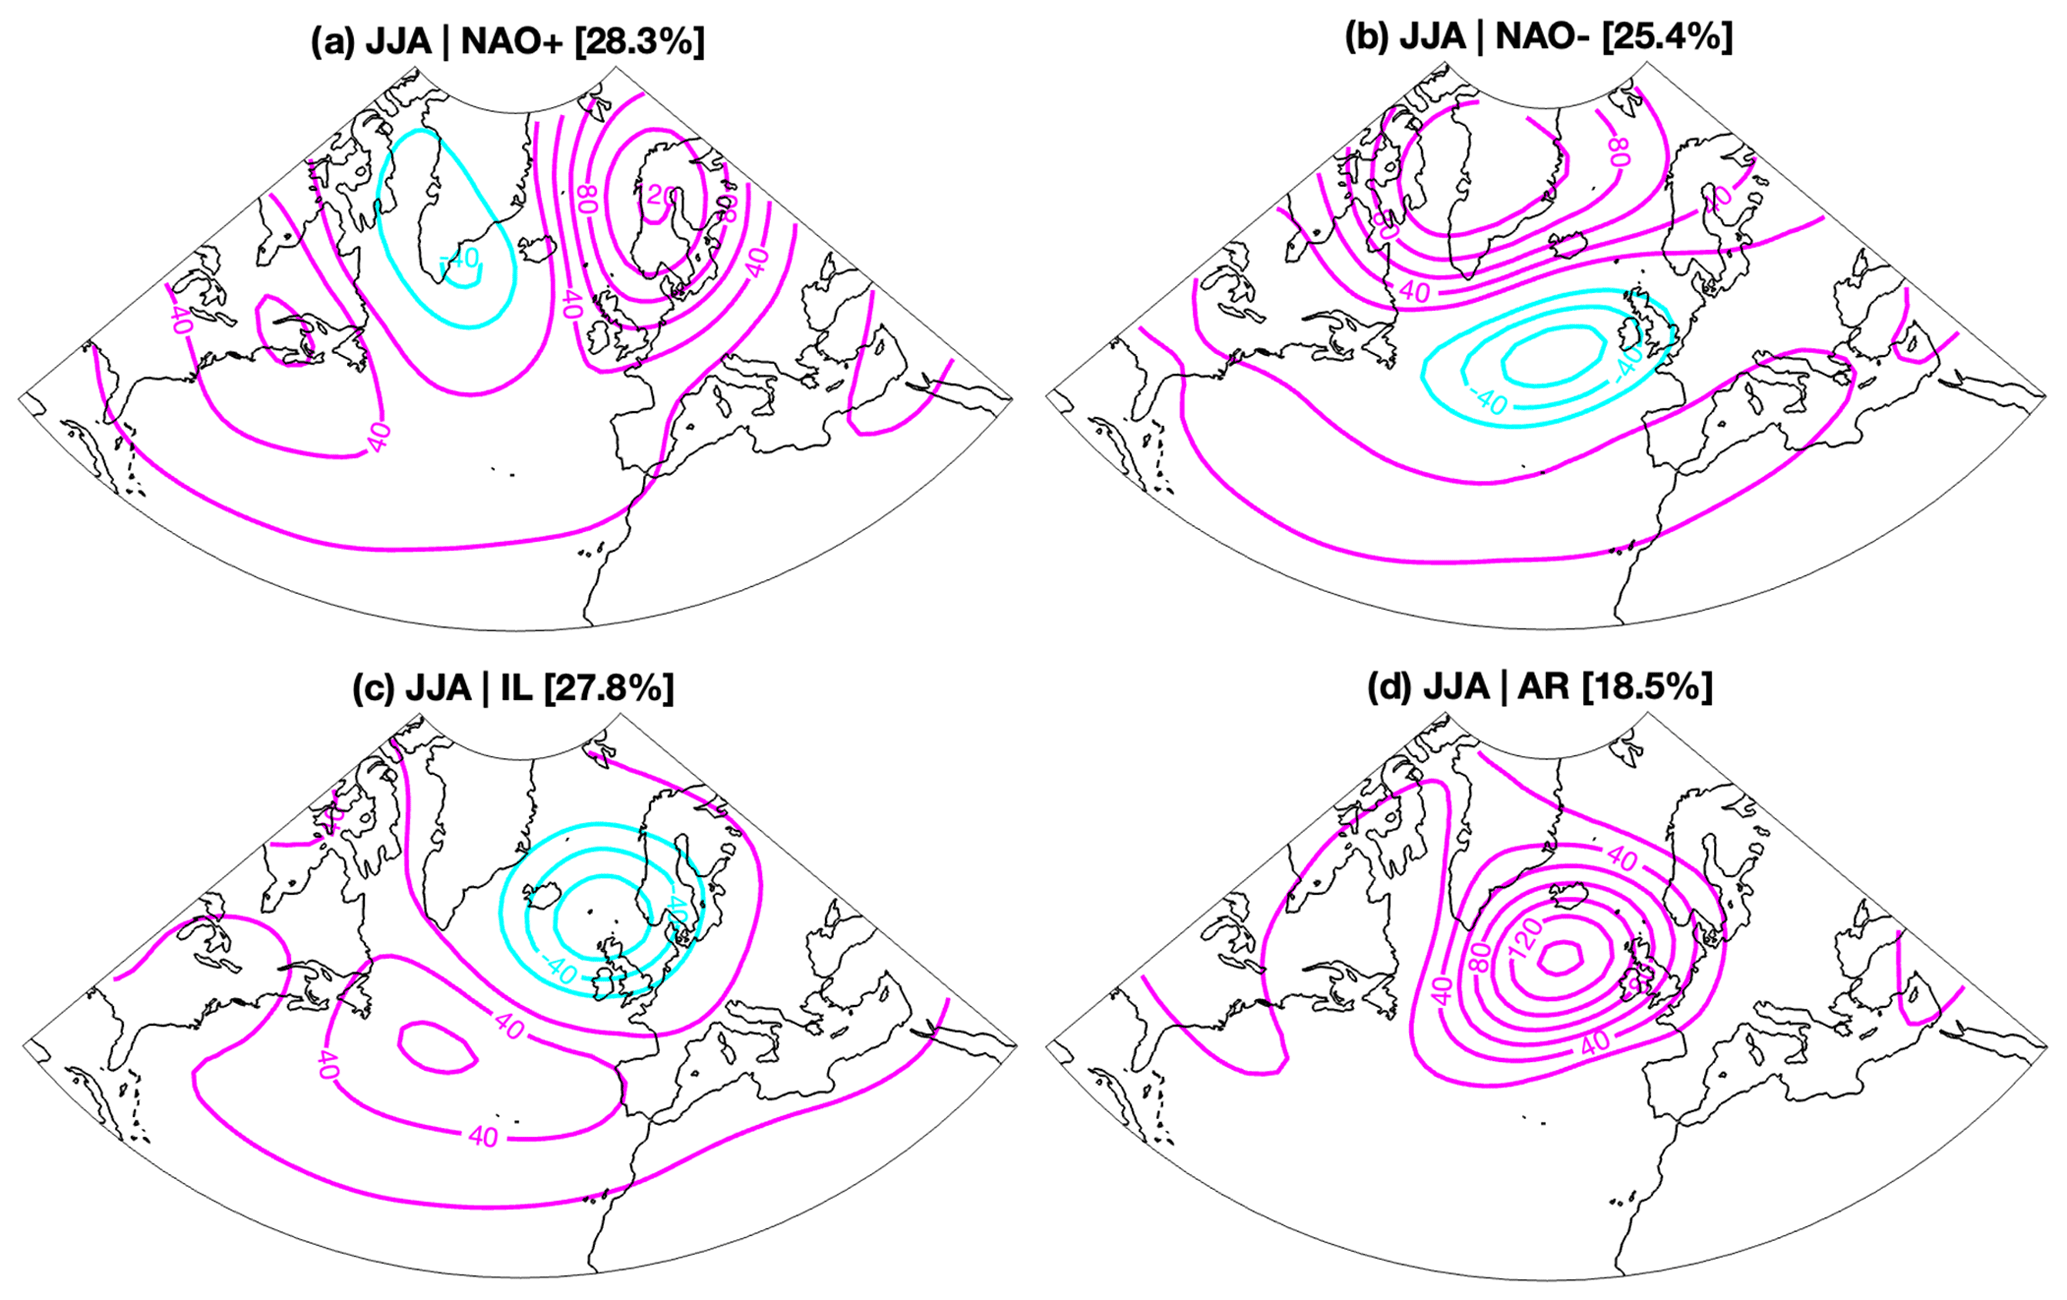
Figure A4Summer North Atlantic WRs, defined as anomalies in geopotential height at 500 hPa (m) with respect to the climatology.
All data and code are available upon request.
MG, GM, and FSRP conceived the study. MG analysed the model simulations and wrote the paper. ST performed the proxy–model comparison and wrote the related section. MCAC and MG performed the WR classification. QZ ran the simulations. All authors commented on the paper.
The contact author has declared that none of the authors has any competing interests.
Publisher’s note: Copernicus Publications remains neutral with regard to jurisdictional claims made in the text, published maps, institutional affiliations, or any other geographical representation in this paper. While Copernicus Publications makes every effort to include appropriate place names, the final responsibility lies with the authors.
The authors thank Sandy Harrison for the useful discussions and the two anonymous reviewers for their constructive comments. Marco Gaetani acknowledges support from the International Meteorological Institute based at the Department of Meteorology at Stockholm University. Gabriele Messori acknowledges support from the Department of Earth Sciences at Uppsala University. The EC-Earth simulations and data processing were performed using the ECMWF's computing and archive facilities at the National Academic Infrastructure for Supercomputing in Sweden (NAISS) and the Swedish National Infrastructure for Computing (SNIC) at the NSC; these activities were partially funded by the Swedish Research Council through grant agreements (grant nos. 2022-06725 and 2018-05973).
This research has been supported by the project “Dipartimenti di Eccellenza 2023–2027” (funded by the Italian Ministry of Education, University and Research at IUSS Pavia); the Natural Sciences and Engineering Research Council of Canada (grant no. RGPIN-2018-04,981); the Fonds de recherche du Québec – Nature et technologies (grant nos. ALLRP 577112-22 and 2023-NC-324826); and the Swedish Research Council (Vetenskapsrådet) (grant nos. 2017-04232 and 2022-03617).
This paper was edited by Martin Claussen and reviewed by two anonymous referees.
Adkins, J., deMenocal, P., and Eshel, G.: The “African humid period” and the record of marine upwelling from excess 230Th in Ocean Drilling Program Hole 658C, Paleoceanography, 21, 1–14, https://doi.org/10.1029/2005PA001200, 2006.
Ambaum, M. H. P., Hoskins, B. J., and Stephenson, D. B.: Arctic Oscillation or North Atlantic Oscillation?, J. Climate, 14, 3495–3507, https://doi.org/10.1175/1520-0442(2001)014<3495:AOONAO>2.0.CO;2, 2001.
Andersson, C., Pausata, F. S. R., Jansen, E., Risebrobakken, B., and Telford, R. J.: Holocene trends in the foraminifer record from the Norwegian Sea and the North Atlantic Ocean, Clim. Past, 6, 179–193, https://doi.org/10.5194/cp-6-179-2010, 2010.
Andreev, A. A., Tarasov, P. A., Ilyashuk, B. P., Ilyashuk E. A., Cremer, H., Hermichen, W.-D., Wischer, F., and Hubberten, H.-W.: Holocene environmental history recorded in Lake Lyadhej-To sediments, Polar Urals, Russia, Palaeogeogr. Palaeoclim., 223, 181–203, https://doi.org/10.1016/j.palaeo.2005.04.004, 2005.
Axford, Y., Losee, S., Briner, J. P., Francis, D. R., Langdon, P. G., and Walker, I. R.: Holocene temperature history at the western Greenland Ice Sheet margin reconstructed from lake sediments, Quaternary Sci. Rev., 59, 87–100, https://doi.org/10.1016/j.quascirev.2012.10.024, 2013.
Bartlein, P. J., Harrison, S. P., Brewer, S., Connor, S., Davis, B. A. S., Gajewski, K., Guiot, J., Harrison-Prentice, T. I., Henderson, A., Peyron, O., Prentice, I. C., Scholze, M., Seppä, H., Shuman, B., Sugita, S., Thompson, R. S., Viau, A. E., Williams, J., and Wu, H.: Pollen-based continental climate reconstructions at 6 and 21 ka: A global synthesis, Clim. Dynam., 37, 775–802, https://doi.org/10.1007/s00382-010-0904-1, 2011.
Bartlein, P. J., Harrison, S. P., and Izumi, K.: Underlying causes of Eurasian midcontinental aridity in simulations of mid-Holocene climate, Geophys. Res. Lett., 44, 9020–9028, https://doi.org/10.1002/2017GL074476, 2017.
Berner, K. S., Koç, N., Divine, D., Godtliebsen, F., and Moros, M.: A decadal-scale Holocene sea surface temperature record from the subpolar North Atlantic constructed using diatoms and statistics and its relation to other climate parameters, Paleoceanography, 23, PA2210, https://doi.org/10.1029/2006PA001339, 2008.
Bjune, A., Birks, H. J. B., and Seppä, H.: Holocene vegetation and climate history on a continental-oceanic transect in northern Fennoscandia based on pollen and plant macrofossils, Boreas, 33, 211–223, 2004.
Bjune, A. E., Bakke, J., Nesje, A., and Birks, H. J. B.: Holocene mean July temperature and winter precipitation in western Norway inferred from palynological and glaciological lake-sediment proxies, Holocene, 15, 177–189, 2005.
Bladé, I., Liebmann, B., Fortuny, D., and van Oldenborgh, G. J.: Observed and simulated impacts of the summer NAO in Europe: Implications for projected drying in the Mediterranean region, Clim. Dynam., 39, 709–727, https://doi.org/10.1007/s00382-011-1195-x, 2012.
Bosmans, J. H. C., Drijfhout, S. S., Tuenter, E., Lourens, L. J., Hilgen, F. J., and Weber, S. L.: Monsoonal response to mid-holocene orbital forcing in a high resolution GCM, Clim. Past, 8, 723–740, https://doi.org/10.5194/cp-8-723-2012, 2012.
Bunbury, J. and Gajewski, K.: Postglacial climates inferred from a lake at treeline, southwest Yukon Territory, Canada, Quaternary Sci. Rev., 28, 354–369, 2009.
Calvo, E., Grimalt, J., and Jansen, E.: High resolution U37K sea surface temperature reconstruction in the Norwegian Sea during the Holocene, Quaternary Sci. Rev., 21, 1385–1394, 2002.
Cartapanis, O., Jonkers, L., Moffa-Sanchez, P., Jaccard, S. L., and de Vernal, A.: Complex spatio-temporal structure of the Holocene Thermal Maximum, Nat. Commun., 13, 5662, https://doi.org/10.1038/s41467-022-33362-1, 2022.
Cassou, C., Terray, L., Hurrell, J. W., and Deser, C.: North Atlantic Winter Climate Regimes: Spatial Asymmetry, Stationarity with Time, and Oceanic Forcing, J. Climate, 17, 1055–1068, https://doi.org/10.1175/1520-0442(2004)017<1055:NAWCRS>2.0.CO;2, 2004.
Cassou, C., Terray, L., and Phillips, A. S.: Tropical Atlantic influence on European heat waves, J. Climate, 18, 2805–2811, https://doi.org/10.1175/JCLI3506.1, 2005.
Chandan, D. and Peltier, W. R.: African Humid Period Precipitation Sustained by Robust Vegetation, Soil, and Lake Feedbacks, Geophys. Res. Lett., 47, e2020GL088728, https://doi.org/10.1029/2020GL088728, 2020.
Chartrand, J. and Pausata, F. S. R.: Impacts of the North Atlantic Oscillation on winter precipitations and storm track variability in southeast Canada and the northeast United States, Weather Clim. Dynam., 1, 731–744, https://doi.org/10.5194/wcd-1-731-2020, 2020.
Chen, F., Yu, Z., Yang, M., Ito, E., Wang, S., Madsen, D. B., Huang, X., Zhao, Y., Sato, T., Birks, H. J. B., Boomer, I., Chen, J., An, C., and Wünnemann, B.: Holocene moisture evolution in arid central Asia and its out-of-phase relationship with Asian monsoon history, Quaternary Sci. Rev., 27, 351–364, 2008. https://doi.org/10.1016/j.quascirev.2007.10.017.
Claussen, M. and Gayler, V.: The Greening of the Sahara during the Mid-Holocene: Results of an Interactive Atmosphere-Biome Model, Global Ecol. Biogeogr., 6, 369–377, 1997.
Claussen, M., Kubatzki, C., Brovkin, V., Ganopolski, A., Hoelzmann, P., and Pachur, H.-J.: Simulation of an abrupt change in Saharan vegetation in the Mid-Holocene, Geophys. Res. Lett., 26, 2037–2040, https://doi.org/10.1029/1999GL900494, 1999.
Claussen, M., Dallmeyer, A., and Bader, J.: Theory and modeling of the African humid period and the green Sahara, in: Oxford Research Encyclopedia of Climate Science, Oxford University Press, https://doi.org/10.1093/acrefore/9780190228620.013.532, 2017.
Cronin, T. M., Thunell, R., Dwyer, G. S., Saenger, C., Mann, M. E., Vann, C., and Seal, I. R.: Multiproxy evidence of Holocene climate variability from estuarine sediments, eastern North America, Paleoceanography, 20, PA4006, https://doi.org/10.1029/2005PA001145, 2005.
Clegg, B. F., Clarke, G. H., Chipman, M. L., Chou, M., Walker, I. R., Tinner, W., and Hu, F. S.: Six millennia of summer temperature variation based on midge analysis of lake sediments from Alaska, Quaternary Sci. Rev., 29, 3308–3316, https://doi.org/10.1016/j.quascirev.2010.08.001, 2010.
Clegg, B. F., Kelly, R., Clarke, G. H., Walker, I. R., and Hu, F. S.: Nonlinear response of summer temperature to Holocene insolation forcing in Alaska, P. Natl. Acad. Sci. USA, 108, 19299–19304, 2011.
Cwynar, L. C. and Spear, R. W.: Reversion of forest to tundra in the central Yukon, Ecology, 72, 202–212, 1991.
Cwynar, L. C. and Spear, R. W.: Paleovegetation and paleoclimatic changes in the Yukon at 6 ka BP, Geogr. Phys. Quatern., 49, 29–35, 1995.
Czymzik, M., Brauer, A., Dulski, P., Plessen, B., Naumann, R., von Grafenstein, U., and Scheffler, R.: Orbital and solar forcing of shifts in Mid- to Late Holocene flood intensity from varved sediments of pre-alpine Lake Ammersee (southern Germany), Quaternary Sci. Rev., 61, 96–110, https://doi.org/10.1016/j.quascirev.2012.11.010, 2013.
Davis, B. A. S., Brewer, S., Stevenson, A. C., and Guiot, J.: The temperature of Europe during the Holocene reconstructed from pollen data, Quaternary Sci. Rev., 22, 1701–1716, https://doi.org/10.1016/S0277-3791(03)00173-2, 2003.
deMenocal, P., Ortiz, J., Guilderson, T., Adkins, J., Sarnthein, M., Baker, L., and Yarusinsky, M.: Abrupt onset and termination of the African Humid Period: rapid climate responses to gradual insolation forcing, Quaternary Sci. Rev., 19, 347–361, https://doi.org/10.1016/S0277-3791(99)00081-5, 2000.
DiNezio, P. N. and Tierney, J. E.: The effect of sea level on glacial Indo-Pacific climate, Nat. Geosci., 6, 485–491, https://doi.org/10.1038/ngeo1823, 2013.
Emeis, K.-C., Struck, U., Blanz, T., Kohly, A., and Voß, M.: Salinity changes in the central Baltic Sea (NW Europe) over the last 10,000 years, Holocene, 13, 411–421, 2003.
Fallu, M.-A., Pienitz, R., Walker, I. R., and Lavoie, M.: Paleolimnology of a shrub-tundra lake and response of aquatic and terrestrial indicators to climatic change in arctic Québec, Canada, Palaeogeogr. Palaeoclim., 215, 183–203, 2005.
Finsinger, W., Tinner, W., Conedera, M., and Ammann, B.: Early to mid-Holocene climate change at Lago dell'Accesa (central Italy): climate signal or anthropogenic bias?, J. Quaternary Sci., 25, 1239–1247, 2010.
Folland, C. K., Knight, J., Linderholm, H. W., Fereday, D., Ineson, S., and Hurrell, J. W.: The Summer North Atlantic Oscillation: Past, Present, and Future, J. Climate, 22, 1082–1103, https://doi.org/10.1175/2008JCLI2459.1, 2009.
Gaetani, M., Pohl, B., Douville, H., and Fontaine, B.: West African Monsoon influence on the summer Euro-Atlantic circulation, Geophys. Res. Lett., 38, 2011GL047150, https://doi.org/10.1029/2011GL047150, 2011.
Gaetani, M., Messori, G., Zhang, Q., Flamant, C., and Pausata, F. S. R.: Understanding the mechanisms behind the northward extension of the West African monsoon during the mid-holocene, J. Climate, 30, 7621–7642, https://doi.org/10.1175/JCLI-D-16-0299.1, 2017.
Grams, C. M., Beerli, R., Pfenninger, S., Staffell, I., and Wernli, H.: Balancing Europe's wind-power output through spatial deployment informed by weather regimes, Nat. Clim. Change, 7, 557–562, https://doi.org/10.1038/nclimate3338, 2017.
Harrison, S. P., Bartlein, P. J., Brewer, S., Prentice, I. C., Boyd, M., Hessler, I., Holmgren, K., Izumi, K., and Willis, K.: Climate model benchmarking with glacial and mid-Holocene climates, Clim. Dynam., 43, 671–688, https://doi.org/10.1007/s00382-013-1922-6, 2014.
Haug, G. H., Hughen, K. A., Sigman, D. M., Peterson, L. C., and Röhl, U.: Southward Migration of the Intertropical Convergence Zone Through the Holocene, Science, 293, 1304–1308, https://doi.org/10.1126/science.1059725, 2001.
Hazeleger, W., Severijns, C., Semmler, T., Ştefănescu, S., Yang, S., Wang, X., Wyser, K., Dutra, E., Baldasano, J. M., Bintanja, R., Bougeault, P., Caballero, R., Ekman, A. M. L., Christensen, J. H., van den Hurk, B., Jimenez, P., Jones, C., Kållberg, P., Koenigk, T., McGrath, R., Miranda, P., van Noije, T., Palmer, T., Parodi, J. A., Schmith, T., Selten, F., Storelvmo, T., Sterl, A., Tapamo, H., Vancoppenolle, M., Viterbo, P., and Willén, U.: EC-Earth, A Seamless earth-System Prediction Approach in Action, B. Am. Meteorol. Soc., 91, 1357–1364, https://doi.org/10.1175/2010BAMS2877.1, 2010.
Heiri, O., Lotter, A. F., Hausmann, S., and Kienast, F.: A chironomid-based Holocene summer air temperature reconstruction from the Swiss Alps, Holocene, 13, 477–484, 2003.
Helama, S., Seppä, H., Bjune, A. E., and Birks, H. J. B.: Fusing pollen-stratigraphic and dendroclimatic proxy data to reconstruct summer temperature variability during the past 7.5 ka in subarctic Fennoscandia, J. Paleolimnol., 48, 275–286, 2012.
Hély, C., Lézine, A.-M., and contributors, A.: Holocene changes in African vegetation: tradeoff between climate and water availability, Clim. Past, 10, 681–686, https://doi.org/10.5194/cp-10-681-2014, 2014.
Hermann, N. W., Oster, J. L., and Ibarra, D. E.: Spatial patterns and driving mechanisms of mid-Holocene hydroclimate in western North America: Mid-Holocene Hydroclimate In Western North America, J. Quaternary Sci., 33, 421–434, https://doi.org/10.1002/jqs.3023, 2018.
Hochman, A., Messori, G., Quinting, J. F., Pinto, J. G., and Grams, C. M.: Do Atlantic-European Weather Regimes Physically Exist?, Geophys. Res. Lett., 48, 1–10, https://doi.org/10.1029/2021GL095574, 2021.
Hoelzmann, P., Jolly, D., Harrison, S. P., Laarif, F., Bonnefille, R., and Pachur, H.-J.: Mid-Holocene land-surface conditions in northern Africa and the Arabian Peninsula: A data set for the analysis of biogeophysical feedbacks in the climate system, Global Biogeochem. Cy., 12, 35–51, https://doi.org/10.1029/97GB02733, 1998.
Hopcroft, P. O. and Valdes, P. J.: On the Role of Dust-Climate Feedbacks During the Mid-Holocene, Geophys. Res. Lett., 46, 1612–1621, https://doi.org/10.1029/2018GL080483, 2019.
Hoskins, B. J. and Ambrizzi, T.: Rossby Wave Propagation on a Realistic Longitudinally Varying Flow, J. Atmos. Sci., 50, 1661–1671, https://doi.org/10.1175/1520-0469(1993)050<1661:RWPOAR>2.0.CO;2, 1993.
Hurrell, J. W., Kushnir, Y., Ottersen, G., and Visbeck, M.: An overview of the North Atlantic Oscillation, in: Geophysical Monograph Series, vol. 134, 35 pp., https://doi.org/10.1029/134GM01, 2003.
Ilyashuk, E. A., Ilyashuk, B. P., Hammarlund, D., and Larocque, I.: Holocene climatic and environmental changes inferred from midge records (Diptera: Chironomidae, Chaoboridae, Ceratopogonidae) at Lake Berkut, southern Kola Peninsula, Russia, Holocene, 15, 897–914, 2005.
Jiang, D., Tian, Z., and Lang, X.: Mid-Holocene global monsoon area and precipitation from PMIP simulations, Clim. Dynam., 44, 2493–2512, https://doi.org/10.1007/s00382-014-2175-8, 2015.
Jones, V. J., Solovieva, N., Self, A. E., McGowan, S., Rosén, P., Salonen, J. S., Seppä, H., Väliranta, M., Parrott E., and Brooks, S. J.: The influence of Holocene tree-line advance and retreat on an arctic lake ecosystem: a multi-proxy study from Kharinei Lake, North Eastern European Russia, J. Paleolimnol., 46, 123–137, https://doi.org/10.1007/s10933-011-9528-7, 2011.
Justwan, A., Koç, N., and Jennings, A. E.: Evolution of the Irminger and East Icelandic Current systems through the Holocene, revealed by diatom-based sea surface temperature reconstructions, Quaternary Sci. Rev., 27, 1571–1582, 2008.
Kaufman, D. S., Ager, T. A., Anderson, N. J., Anderson, P. M., Andrews, J. T., Bartlein, P. J., Brubaker, L. B., Coats, L. L., Cwynar, L. C., Duvall, M. L., Dyke, A. S., Edwards, M. E., Eisner, W. R., Gajewski, K., Geirsdóttir, A., Hu, F. S., Jennings, A. E., Kaplan, M. R., Kerwin, M. W., Lozhkin, A. V., MacDonald, G. M., Miller, G. H., Mock, C. J., Oswald, W. W., Otto-Bliesner, B. L., Porinchu, D. F., Rühland, K., Smol, J. P., Steig, E. J., and Wolfe, B. B.: Holocene thermal maximum in the western Arctic (0–180° W), Quaternary Sci. Rev., 23, 529–560, https://doi.org/10.1016/j.quascirev.2003.09.007, 2004.
Kaislahti Tillman, P., Holzkämper, S., Kuhry, P., Sannel, A. B. K., Loader, N. J., and Robertson, I.: Long-term climate variability in continental subarctic Canada: A 6200-year record derived from stable isotopes in peat, Palaeogeogr. Palaeoclim., 298, 235–246, https://doi.org/10.1016/j.palaeo.2010.09.029, 2010.
Kerwin, M. W., Overpeck, J. T., Webb, R. S., and Anderson, K. H.: Pollen-based summer temperature reconstructions for the eastern Canadian boreal forest, subarctic, and Arctic, Quaternary Sci. Rev., 23, 1901–1924, 2004.
Larrasoaña, J. C., Roberts, A. P., and Rohling, E. J.: Dynamics of Green Sahara Periods and Their Role in Hominin Evolution, PLoS One, 8, e76514, https://doi.org/10.1371/journal.pone.0076514, 2013.
Ledu, D., Rochon, A., de Vernal, A., and St-Onge, G.: Holocene paleoceanography of the northwest passage, Canadian Arctic Archipelago, Quaternary Sci. Rev., 29, 3468–3488, 2010.
Lézine, A.-M., Hély, C., Grenier, C., Braconnot, P., and Krinner, G.: Sahara and Sahel vulnerability to climate changes, lessons from Holocene hydrological data, Quaternary Sci. Rev., 30, 3001–3012, https://doi.org/10.1016/j.quascirev.2011.07.006, 2011.
Madec, G.: NEMO ocean engine. Note du Pole de modelisation 27, Institut Pierre-Simon Laplace, 396 pp., 2008.
Mauri, A., Davis, B. A. S., Collins, P. M., and Kaplan, J. O.: The influence of atmospheric circulation on the mid-Holocene climate of Europe: a data–model comparison, Clim. Past, 10, 1925–1938, https://doi.org/10.5194/cp-10-1925-2014, 2014.
McGee, D., DeMenocal, P. B., Winckler, G., Stuut, J. B. W., and Bradtmiller, L. I.: The magnitude, timing and abruptness of changes in North African dust deposition over the last 20,000yr, Earth Planet. Sc. Lett., 371–372, 163–176, https://doi.org/10.1016/j.epsl.2013.03.054, 2013.
Messori, G., Gaetani, M., Zhang, Q., Zhang, Q., and Pausata, F. S. R.: The water cycle of the mid-Holocene West African monsoon: The role of vegetation and dust emission changes, Int. J. Climatol., 39, 1927–1939, https://doi.org/10.1002/joc.5924, 2019.
Michelangeli, P., Vautard, R., and Legras, B.: Weather regimes: Recurrence and quasi stationarity, J. Atmos. Sci., 52, 1237–1256, https://doi.org/10.1175/1520-0469(1995)052<1237:WRRAQS>2.0.CO;2, 1995.
Michels, A., Laird, K. R., Wilson, S. E., Thomson, D., Leavitt, P. R., Oglesby, R. J., and Cumming, B. F.: Multidecadal to millennial-scale shifts in drought conditions on the Canadian prairies over the past six millennia: implications for future drought assessment, Glob. Change Biol., 13, 1295–1307, https://doi.org/10.1111/j.1365-2486.2007.01367.x, 2007.
Nakanishi, T., Tachibana, Y., and Ando, Y.: Possible semi-circumglobal teleconnection across Eurasia driven by deep convection over the Sahel, Clim. Dynam., 57, 2287–2299, https://doi.org/10.1007/s00382-021-05804-x, 2021.
Neil, K., Gajewski, K., and Betts, M.: Human-ecosystem interactions in relation to Holocene environmental change in Port Joli Harbour, southwestern Nova Scotia, Canada, Quaternary Res., 81, 203–212, https://doi.org/10.1016/j.yqres.2014.01.001, 2014.
Nesje, A., Matthews, J. A., Dahl, S. O., Berrisford, M. S., and Andersson, C.: Holocene glacier fluctuations of Flatebreen and winter-precipitation changes in the Jostedalsbreen region, western Norvay, based on glaciolacustrine sediment records, Holocene, 11, 267–280, https://doi.org/10.1191/095968301669980885, 2001.
Olsen, J., Anderson, N. J., and Knudsen, M. F.: Variability of the North Atlantic Oscillation over the past 5,200 years, Nat. Geosci., 5, 808–812, https://doi.org/10.1038/ngeo1589, 2012.
Pausata, F. S. R., Messori, G., and Zhang, Q.: Impacts of dust reduction on the northward expansion of the African monsoon during the Green Sahara period, Earth Planet. Sc. Lett., 434, 298–307, https://doi.org/10.1016/j.epsl.2015.11.049, 2016.
Pausata, F. S. R., Zhang, Q., Muschitiello, F., Lu, Z., Chafik, L., Niedermeyer, E. M., Stager, J. C., Cobb, K. M., and Liu, Z.: Greening of the Sahara suppressed ENSO activity during the mid-Holocene, Nat. Commun., 8, 16020, https://doi.org/10.1038/ncomms16020, 2017a.
Pausata, F. S. R., Emanuel, K. A., Chiacchio, M., Diro, G. T., Zhang, Q., Sushama, L., Stager, J. C., and Donnelly, J. P.: Tropical cyclone activity enhanced by Sahara greening and reduced dust emissions during the African Humid Period, P. Natl. Acad. Sci. USA, 114, 6221–6226, https://doi.org/10.1073/pnas.1619111114, 2017b.
Pausata, F. S. R., Gaetani, M., Messori, G., Berg, A., Maia de Souza, D., Sage, R. F., and DeMenocal, P. B.: The Greening of the Sahara: Past Changes and Future Implications, One Earth, 2, 235–250, https://doi.org/10.1016/j.oneear.2020.03.002, 2020.
Piao, J., Chen, W., Wang, L., Pausata, F. S. R., and Zhang, Q.: Northward extension of the East Asian summer monsoon during the mid-Holocene, Global Planet. Change, 184, 103046, https://doi.org/10.1016/j.gloplacha.2019.103046, 2020.
Renssen, H., Seppä, H., Heiri, O., Roche, D. M., Goosse, H., and Fichefet, T.: The spatial and temporal complexity of the Holocene thermal maximum, Nat. Geosci., 2, 411–414, https://doi.org/10.1038/ngeo513, 2009.
Rimbu, N., Lohmann, G., Kim, J.-H., Arz, H. W., and Schneider, R.: Arctic/North Atlantic Oscillation signature in Holocene sea surface temperature trends as obtained from alkenone data, Geophys. Res. Lett., 30, 2000–2003, https://doi.org/10.1029/2002GL016570, 2003.
Rodrigues, T., Grimalt, J. O., Abrantes, F. G., Flores, J. A., and Lebreiro, S. M.: Holocene interdependences of changes in sea surface temperature, productivity, and fluvial inputs in the Iberian continental shelf (Tagus mud patch), Geochem. Geophy. Geosy., 10, Q07U06, https://doi.org/10.1029/2008GC002367, 2009.
Rodwell, M. J. and Hoskins, B. J.: Monsoons and the dynamics of deserts, Q. J. Roy. Meteor. Soc., 122, 1385–1404, https://doi.org/10.1256/smsqj.53407, 1996.
Rosén, P., Segerström, U., Eriksson, L., Renberg, I., and Birks, H. J. B.: Holocene climatic change reconstructed from diatoms, chironomids, pollen and near-infrared spectroscopy at an alpine lake (Sjuodjijaure) in northern Sweden, The Holocene, 11, 551-562, https://doi.org/10.1191/095968301680223503, 2001.
Sagoo, N. and Storelvmo, T.: Testing the sensitivity of past climates to the indirect effects of dust, Geophys. Res. Lett., 44, 5807–5817, https://doi.org/10.1002/2017GL072584, 2017.
Samartin, S., Heiri, O., Joos, F., Renssen, H., Franke, J., Brönnimann, S., and Tinner, W.: Warm Mediterranean mid-Holocene summers inferred from fossil midge assemblages, Nat. Geosci., 10, 207–212, https://doi.org/10.1038/ngeo2891, 2017.
Scholz, D., Frisia, S., Borsato, A., Spötl, C., Fohlmeister, J., Mudelsee, M., Miorandi, R., and Mangini, A.: Holocene climate variability in north-eastern Italy: potential influence of the NAO and solar activity recorded by speleothem data, Clim. Past, 8, 1367–1383, https://doi.org/10.5194/cp-8-1367-2012, 2012.
Seppä, H., MacDonald, G. M., Birks, H. J. B., Gervais, B. R., and Snyder, J. A.: Late-Quaternary summer temperature changes in the northern-European tree-line region, Quaternary Res., 69, 404–412, 2008.
Seppä, H., Bjune, A. E., Telford, R. J., Birks, H. J. B., and Veski, S.: Last nine-thousand years of temperature variability in Northern Europe, Clim. Past, 5, 523–535, https://doi.org/10.5194/cp-5-523-2009, 2009.
Sharifi, A., Pourmand, A., Canuel, E. A., Ferer-Tyler, E., Peterson, L. C., Aichner, B., Feakins, S. J., Daryaee, T., Djamali, M., Naderi Beni, A., Lahijani, H. A. K., and Swart, P. K.: Abrupt climate variability since the last deglaciation based on a high-resolution, multi-proxy peat record from NW Iran: The hand that rocked the Cradle of Civilization?, Quaternary Sci. Rev., 123, 215–230, https://doi.org/10.1016/j.quascirev.2015.07.006, 2015.
Shuman, B. N. and Marsicek, J.: The structure of Holocene climate change in mid-latitude North America, Quaternary Sci. Rev., 141, 38–51, 2016.
Smith, L. M., Andrews, J. T., Castañeda, I. S., Kristjánsdóttir, G. B., Jennings, A. E., and Sveinbjörnsdóttir, Á. E.: Temperature reconstructions for SW and N Iceland waters over the last 10calka based on δ18O records from planktic and benthic Foraminifera, Quaternary Sci. Rev., 24, 1723–1740, https://doi.org/10.1016/j.quascirev.2004.07.025, 2005.
Solovieva, N., Tarasov, P. E., and MacDonald, G.: Quantitative reconstruction of Holocene climate from the Chuna Lake pollen record, Kola Peninsula, northwest Russia, The Holocene, 15, 141–148, https://doi.org/10.1191/0959683605hl793rr, 2005.
Steinman, B. A., Pompeani, D. P., Abbott, M. B., Ortiz, J. D., Stansell, N. D., Finkenbinder, M. S., Mihindukulasooriya, L. N., and Hillman, A. L.: Oxygen isotope records of Holocene climate variability in the Pacific Northwest, Quaternary Sci. Rev., 142, 40–60, https://doi.org/10.1016/j.quascirev.2016.04.012, 2016.
Sun, A., Feng, Z., Ran, M., and Zhang, C.: Pollen-recorded bioclimatic variations of the last ∼ 22,600 years retrieved from Achit Nuur core in the western Mongolian Plateau, Quatern. Int., 311, 36–43, 2013.
Sun, W., Wang, B., Zhang, Q., Pausata, F. S. R., Chen, D., Lu, G., Yan, M., Ning, L., and Liu, J.: Northern Hemisphere Land Monsoon Precipitation Increased by the Green Sahara During Middle Holocene, Geophys. Res. Lett., 46, 9870–9879, https://doi.org/10.1029/2019GL082116, 2019.
Swann, A. L. S., Fung, I. Y., and Chiang, J. C. H.: Mid-latitude afforestation shifts general circulation and tropical precipitation, P. Natl. Acad. Sci. USA, 109, 712–716, https://doi.org/10.1073/pnas.1116706108, 2012.
Swann, A. L. S., Fung, I. Y., Liu, Y., and Chiang, J. C. H.: Remote Vegetation Feedbacks and the Mid-Holocene Green Sahara, J. Climate, 27, 4857–4870, https://doi.org/10.1175/JCLI-D-13-00690.1, 2014.
Taylor, K. E., Stouffer, R. J., and Meehl, G. A.: An Overview of CMIP5 and the Experiment Design, B. Am. Meteorol. Soc., 93, 485–498, https://doi.org/10.1175/BAMS-D-11-00094.1, 2012.
Thompson, A. J., Skinner, C. B., Poulsen, C. J., and Zhu, J.: Modulation of Mid-Holocene African Rainfall by Dust Aerosol Direct and Indirect Effects, Geophys. Res. Lett., 46, 3917–3926, https://doi.org/10.1029/2018GL081225, 2019.
Tierney, J. E. and DeMenocal, P. B.: Abrupt Shifts in Horn of Africa Hydroclimate Since the Last Glacial Maximum, Science, 342, 843–846, https://doi.org/10.1126/science.1240411, 2013.
Tierney, J. E., Lewis, S. C., Cook, B. I., LeGrande, A. N., and Schmidt, G. A.: Model, proxy and isotopic perspectives on the East African Humid Period, Earth Planet. Sc. Lett., 307, 103–112, https://doi.org/10.1016/j.epsl.2011.04.038, 2011.
Tierney, J. E., Pausata, F. S. R., and DeMenocal, P. B.: Rainfall regimes of the Green Sahara, Sci. Adv., 3, 1–9, https://doi.org/10.1126/sciadv.1601503, 2017.
Valcke, S.: The OASIS3 coupler: a European climate modelling community software, Geosci. Model Dev., 6, 373–388, https://doi.org/10.5194/gmd-6-373-2013, 2013.
Vancoppenolle, M., Fichefet, T., Goosse, H., Bouillon, S., Madec, G., and Maqueda, M. A. M.: Simulating the mass balance and salinity of Arctic and Antarctic sea ice. 1. Model description and validation, Ocean Model., 27, 33–53, https://doi.org/10.1016/j.ocemod.2008.10.005, 2009.
van den Hurk, B. J. J. M., Viterbo, P., Beljaars, A. C. M., and Betts, A. K.: Offline validation of the ERA40 surface scheme. ECMWF Tech Memo 295, ECMWF, Reading, 42 pp., https://doi.org/10.21957/9aoaspz8, 2000.
Velle, G., Brooks, S. J., Birks, H. J. B., and Willassen, E.: Chironomids as a tool for inferring Holocene climate: an assessment based on six sites in southern Scandinavia, Quaternary Sci. Rev., 24, 1429–1462, 2005.
Wang, Y., Cheng, H., Edwards, R. L., Kong, X., Shao, X., Chen, S., Wu, J., Jiang, X., Wang, X., and An, Z.: Millennial- and orbital-scale changes in the East Asian monsoon over the past 224,000 years, Nature, 451, 1090–1093, https://doi.org/10.1038/nature06692, 2008.
Wilks, D. S.: Statistical Methods in the Atmospheric Sciences, 4th edn., Elsevier, 818 pp., https://doi.org/10.1016/C2017-0-03921-6, 2019.
Wu, C.-H. and Tsai, P.-C.: Impact of orbitally-driven seasonal insolation changes on Afro-Asian summer monsoons through the Holocene, Commun. Earth Environ., 2, 4, https://doi.org/10.1038/s43247-020-00073-8, 2021.
Yin, Q. Z. and Berger, A.: Individual contribution of insolation and CO2 to the interglacial climates of the past 800,000 years, Clim. Dynam., 38, 709–724, https://doi.org/10.1007/s00382-011-1013-5, 2012.
Yuan, D., Cheng, H., Edwards, R. L., Dykoski, C. A., Kelly, M. J., Zhang, M., Qing, J., Lin, Y., Wang, Y., Wu, J., Dorale, J. A., An, Z., and Cai, Y.: Timing, Duration, and Transitions of the Last Interglacial Asian Monsoon, Science, 304, 575–578, https://doi.org/10.1126/science.1091220, 2004.
Zabenskie, S. and Gajewski, K.: Post-Glacial climatic change on Boothia Peninsula, Nunavut, Canada, Quaternary Res., 68, 261–270, 2007.
Zhang, M., Liu, Y., Zhang, J., and Wen, Q.: AMOC and Climate Responses to Dust Reduction and Greening of the Sahara during the Mid-Holocene, J. Climate, 34, 4893–4912, https://doi.org/10.1175/JCLI-D-20-0628.1, 2021.
Zhao, Y. and Harrison, S. P.: Mid-Holocene monsoons: a multi-model analysis of the inter-hemispheric differences in the responses to orbital forcing and ocean feedbacks, Clim. Dynam., 39, 1457–1487, https://doi.org/10.1007/s00382-011-1193-z, 2012.