the Creative Commons Attribution 4.0 License.
the Creative Commons Attribution 4.0 License.
 | 25 Jul 2024
Response of coastal California hydroclimate to the Paleocene–Eocene Thermal Maximum
Xiaodong Zhang
Brett J. Tipple
Jiang Zhu
William D. Rush
Christian A. Shields
Joseph B. Novak
James C. Zachos
The effects of anthropogenic warming on the hydroclimate of California are becoming more pronounced with the increased frequency of multi-year droughts and flooding. As a past analog for the future, the Paleocene–Eocene Thermal Maximum (PETM) is a unique natural experiment for assessing global and regional hydroclimate sensitivity to greenhouse gas warming. Globally, extensive evidence (i.e., observations and climate models with high pCO2) demonstrates hydrological intensification with significant variability from region to region (i.e., drier or wetter, greater frequency, and/or intensity of extreme events). Central California (paleolatitude ∼ 42° N), roughly at the boundary between dry subtropical highs and mid-latitude low-pressure systems, would have been particularly susceptible to shifts in atmospheric circulation and precipitation patterns/intensity. Here, we present new observations and climate model output on regional/local hydroclimate responses in central California during the PETM. Our findings, based on multi-proxy evidence within the context of model outputs, suggest a transition to an overall drier climate punctuated by increased precipitation during summer months along central coastal California during the PETM.
- Article
(2167 KB) - Full-text XML
-
Supplement
(6896 KB) - BibTeX
- EndNote


Global warming of a few degrees Celsius over the next century is projected to intensify the hydrological cycle on a range of temporal and spatial scales, manifested primarily by amplified wet–dry cycles (Held and Soden, 2006; Douville et al., 2021). Indeed, just over the last few decades, there has been an increasing frequency in the severity of extremes characterized by compound heat waves and intense drought (Büntgen et al., 2021; Williams et al., 2020; Zscheischler and Lehner, 2022) and/or heavy precipitation and flooding (Liu et al., 2020; Risser and Wehner, 2017). As greenhouse-gas-driven warming continues, such precipitation extremes (wet or dry) are expected to intensify (Stevenson et al., 2022). This is particularly so for California, which receives much of its rainfall from winter systems fueled by atmospheric rivers (ARs), the frequency of which are forecast to decline as the systems shift northward (Simon Wang et al., 2017). The decline in winter precipitation, along with warming, will create more intense droughts even as the potential for extreme precipitation events increases (Vogel et al., 2020; Swain et al., 2018).
Climate model predictions for the intensification of the hydrological cycle are supported by case studies of extreme warming events of the deep past (Carmichael et al., 2017). In particular, the Paleocene–Eocene Thermal Maximum (PETM) has emerged as a unique natural experiment for assessing global and regional hydroclimate sensitivity to greenhouse gas warming (Zachos et al., 2008). Extensive evidence exists for a major mode shift in the local/regional precipitation patterns and intensity (Pagani et al., 2006; Slotnick et al., 2012; Schmitz and Pujalte, 2003; Sluijs and Brinkhuis, 2009; Smith et al., 2007; Handley et al., 2012; Kozdon et al., 2020), including enhanced erosion and extreme flooding in fluvial sections (e.g., Pyrenees and Bighorn Basin) and increased weathering and sediment fluxes to coastal basins (e.g., Bass River, Wilson Lake, mid-Atlantic coast, and Mead Stream, Aotearoa / New Zealand), along with other observations (John et al., 2008; Nicolo et al., 2010; Stassen et al., 2012; Self-Trail et al., 2017; Wing et al., 2005; Kraus and Riggins, 2007; Foreman, 2014).
These observations of regional hydroclimate serve as the basis for climate model experiments forced with proxy-based estimates of ΔpCO2 for the PETM (i.e., 3×–6× pre-industrial) (Kiehl and Shields, 2013; Carmichael et al., 2016; Zhu et al., 2020). Using such estimates, model simulations show an overall increase in poleward meridional water vapor transport as manifested by a net increase in the evaporation of subtropical regions balanced by higher precipitation of tropical/high latitudes characterizing the “wet-gets-wetter and dry-gets-drier” hydrological response. The latest simulations using high-resolution climate models display several key regional responses, including increased frequency of extreme precipitation events, especially the coastal regions where atmospheric rivers (ARs) are common (Rush et al., 2021). Indeed, observations of high-energy flooding events in SW Europe (i.e., the Pyrenees) during the PETM (Schmitz and Pujalte, 2003) can be explained by increased frequency of North Atlantic ARs contributing landfall in that region. Pacific AR activity as simulated for the PETM also becomes more intense but less frequent along the central California coast by shifting northward with the storm tracks (Shields et al., 2021), not unlike the projections for California in the future (Shields and Kiehl, 2016; Massoud et al., 2019). This pattern is consistent with warming scenarios in general which have weakened zonal wind belts (i.e., the westerlies) that are shifting poleward (Abell et al., 2021; Douville et al., 2021).
Testing the theoretical response of extreme global warming on Pacific ARs and impacts on seasonal precipitation along North America's western coast in general is challenging and still limited by the lack of observations. Here we constrain the regional hydroclimate response along the central California coast during the PETM using several independent proxies (i.e., clay mineralogy, grain size distribution, δ13Corg stratigraphy, and leaf wax δ2Hn-alkane isotope records) which are either directly or indirectly sensitive to shifts in precipitation patterns/intensity. These proxies are then compared against Earth system model simulations of the greenhouse-gas-forced changes in regional precipitation (i.e., pattern/intensity). The new records complement data from a previous study (John et al., 2008) and, along with the latest climate modeling experiments, provide a unique case study of the sensitivity of regional hydroclimate to major greenhouse warming.
2.1 Site location
The studied outcrop section, Lodo Gulch, is part of the late Paleocene–early Eocene Lodo Formation located in the Panoche Hills of central California (Fig. 1). During the late Paleocene, the section was situated at a paleolatitude of ∼ 42° N, roughly at the boundary between the dry subtropical highs and mid-latitude low-pressure systems. The Lodo Formation is comprised primarily of siltstone with a relatively low abundance of calcareous microfossils truncated by thin glauconitic sand layers (Brabb, 1983). Depositional facies are consistent with a neritic–bathyal setting along the outer shelf (John et al., 2008).
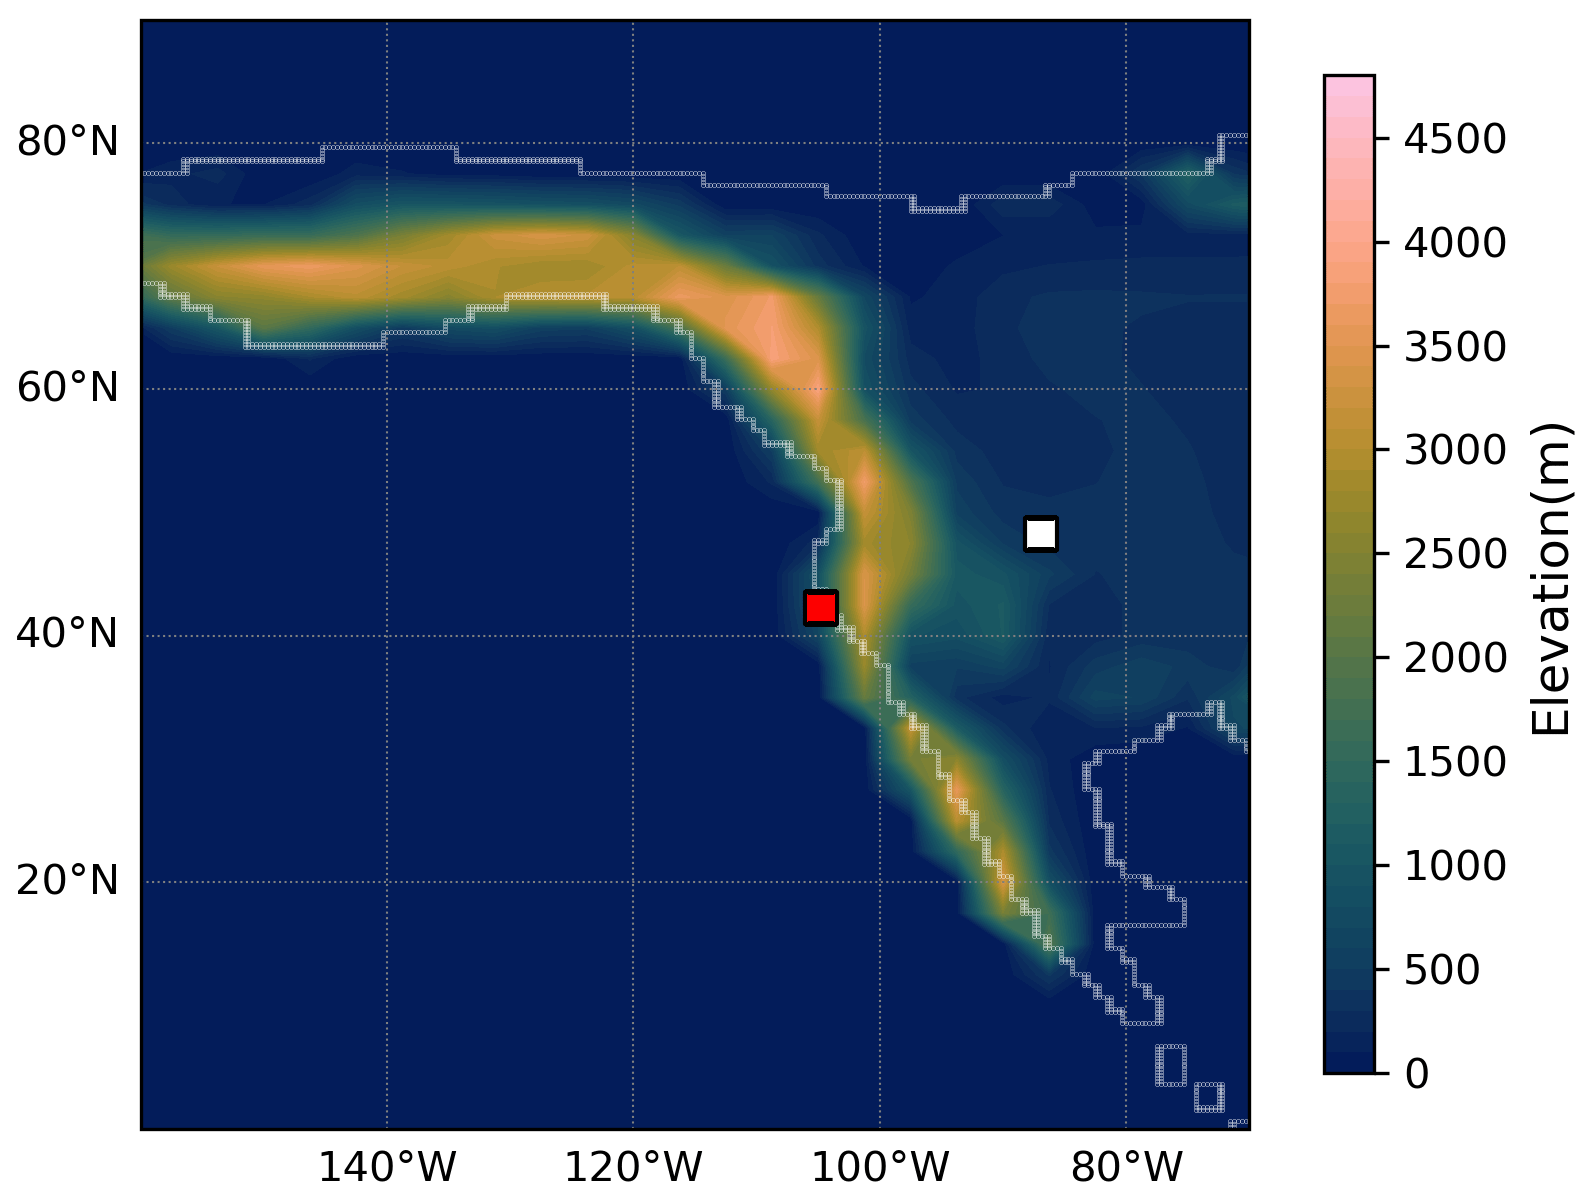
Figure 1Paleogeography and location of the Lodo Gulch section (red square) along the central California coast and Bighorn Basin (white square) in the North America continent for reference at 56 Ma. Late Paleocene–early Eocene topography boundary of North America was adapted from Lunt et al. (2017).
2.2 Methods
2.2.1 Bulk organic stable carbon isotopes
Sediment samples used for this study include those originally collected (ca. 28) by John et al. (2008). In addition, new samples (ca. 27) were collected from the upper Paleocene for organic C isotopic analyses (δ13Corg) to better establish the pre-PETM baseline. Samples were analyzed in the UCSC (University of California, Santa Cruz) Stable Isotope Laboratory (SiL) using a Carlo Erba Instruments NC 2500 elemental analyzer coupled with a Thermo Scientific Delta Plus XP isotope ratio mass spectrometer (iRMS) via a Thermo Scientific ConFlo III. All samples were calibrated with VPDB (Vienna Pee Dee Belemnite) for δ13C and AIR (atmosphere N2) for δ15N against an in-house gelatin standard reference material (PUGel). The analytical reproducibility precision is ±0.1 ‰ for δ13C and ±0.2 ‰ for δ15N.
2.3 Grain size analyses
Particle size was measured by laser diffraction using a Beckman Coulter device with polarization intensity differential scatter (PIDS) housed at UCSC (see the Supplement). For each sample, 2 to 5 mg of bulk sediment was powdered and put through a 2 mm sieve following the protocols in Blott et al. (2004). A total of 39 samples was measured, each in duplicate or triplicate to ensure reproducibility.
2.4 Clay assemblages analyses
Sample preparation followed a slightly modified version of Kemp et al. (2016). Roughly 5 to 10 g of sediment was powdered with a mortar and pestle and then placed in a Calgon (sodium hexametaphosphate) solution on a shaker table for 72 h. Samples were sorted through a 63 µm sieve while collecting the fluid with the < 63 µm fraction. The collected fluid and suspended fine fraction (< 63 µm) were allowed to settle for a period determined by Stokes' law to keep < 2 µm size clay particles remaining in suspension. The fluid was then decanted and dried in the oven at 40 °C. Approximately 150 mg clay from each sample were used to prepared oriented mounts for X-ray diffraction (XRD) analysis. A total of 38 clay samples were prepared from the Lodo Formation. The sample residues were measured on a Philips 3040/60 X'Pert Pro X-ray diffraction instrument at UCSC. Clay species (i.e., smectite, illite, kaolinite, and chlorite) were identified based on the peak positions and intensities representing each clay mineral.
2.5 Leaf wax distribution and carbon/hydrogen isotopic composition
Sediment extraction, compound isolation, and compound-specific isotope measurements were conducted following Tipple et al. (2011). Briefly, the sediments were freeze-dried, powdered (∼ 500 g), and extracted with a dichloromethane (DCM) and methanol ratio (2:1; ) using a Soxhlet extractor. Total lipid extracts were concentrated and then separated by column chromatography using silica gel. N-alkanes were further purified from cyclic and branched alkanes using urea adduction following Wakeham and Pease (2004). N-alkane abundances were determined using a gas chromatograph (GC) with a flame ionization detector (FID). Isotope analyses were then performed using a GC coupled to an iRMS interfaced with a GC-C III combustion system or a high temperature conversion system for δ13C and δ2H analyses, respectively. A total of 59 samples was processed with a fused silica, DB-5 phase column (30 m × 0.25 mm internal diameter, 0.25 µm film thickness) with helium as the carrier at a flow of 1.5 mL min−1. The GC oven temperature program was 60–320 °C at 5 °C min−1 and isothermal for 30 min. A Thermo Trace mass spectrometer (MS) was used for detection with the mass spectrometry scanning from 50–800 or exclusively of 191, 217, 218, 370, 372, 386, and 400 for single-ion monitoring. Biomarkers were identified by the elution time and mass spectra of in-house petroleum standards with published biomarker distributions (Peters et al., 2005).
δ13C and δ2H values are expressed relative to Vienna Pee Dee Belemnite (VPDB) and Vienna Standard Mean Ocean Water (VSMOW). Individual n-alkane isotope ratios were corrected to n-alkane reference materials (for δ13C, C20, C25, C27, C30, and C38 of known isotopic ratio and for δ2H; “Mix A” from Arndt Schimmelmann, Indiana University) analyzed daily at several concentrations. In addition, H2 reference gas of known isotopic composition was pulsed between sample n-alkane peaks to confirm if the normalizations were appropriate. Standard deviations (SDs) of n-alkane reference materials were ±0.6 ‰ for δ13C and ±6 ‰ for δ2H.
2.6 Earth system models
Climate simulations from two models were used in this paper for (1) comparison with leaf wax proxy data and (2) extreme events analyses. (1) The water-isotope-enabled Community Earth System Model version 1.2 (iCESM1.2) simulates changes in climate and water isotopic composition during the PETM (Zhu et al., 2020) with a horizontal resolution of 1.9 × 2.5° in atmosphere and land and a nominal 1° in the ocean and sea ice components. Water isotope capabilities have been incorporated into all the components of the Community Earth System Model (CESM) 1.2 (Brady et al., 2019) which include the Community Atmosphere Model, version 5 (CAM5), for the atmosphere; the Parallel Ocean Program, version 2 (POP2), for the ocean; the Community Land Model, version 4 (CLM4), for the land; the River Transport Model (RTM) for river flow; and Community Ice Code, version 4, for sea ice. All simulations were run with the identical boundary conditions (including early Eocene paleogeography, land–sea mask, vegetation distribution, and pre-industrial (PI) non-CO2 greenhouse gas concentrations, soil properties, natural aerosol emissions, solar constant, and orbital parameters), following the DeepMIP protocol (Lunt et al., 2017), and differ only in atmospheric CO2 concentration. Crucially, the models with reduced latitudinal temperature gradients (e.g., Geophysical Fluid Dynamics Laboratory (GFDL) and CESM) more closely reproduce proxy-derived precipitation estimates and other key climate metrics (Cramwinckel et al., 2023). Increased climate sensitivity with warming and cloud feedback in CESM1.2 over earlier models improved water vapor sensitivity. (2) Using the same CESM1.2 framework, high-resolution (0.25°) simulations were conducted with forced sea surface temperatures (SSTs) and active atmosphere and land components (CAM5 and CLM4). RTM was run at 1° resolution, and forced SSTs were calculated from consistent 2° fully coupled PETM simulations (see details in Rush et al., 2021, and references therein). The much higher horizontal resolution in the atmosphere enables improved the simulation of the extreme events. Hourly, daily (CAM5), and monthly (iCESM1.2) temporal resolution precipitation outputs from both sets of climate simulations were utilized in this paper, with 100 years taken from the equilibrated iCESM1.2 simulations and 15 years from the forced SST high-resolution CAM5 simulations.
3.1 Bulk organic and n-alkane stable carbon isotopes
A carbon isotope excursion is present in both bulk organic (Fig. 2a) and carbonate-based δ13C records (John et al., 2008) across the P−E boundary, marking the PETM onset of the Lodo section. The terrestrial leaf wax n-alkane records all capture the carbon isotope excursion (CIE) with a pattern that roughly parallels the other published records (i.e., planktonic foraminifera) (John et al., 2008), though is much less noisy than the bulk δ13Corg record, which is not unexpected given the potentially variable composition of the bulk organic matter. The magnitude of the Δδ13Cn-alkane is roughly −4 ‰ (average of n-C27, n-C29, and n-C31) at the onset of the CIE, followed by a gradual recovery that is truncated at the disconformity between 20.3 and 23.5 m (coincides with nannofossil biozone boundary NP10 and NP11), thus marking the top of the PETM body (Fig. 2a). The disconformity coincides with a global sea level regression (John et al., 2008). Following the recovery, above the disconformity, the mean δ13Cn-alkane is depleted relative to the pre-PETM baseline, as observed in some other PETM sections (Cui et al., 2021; Garel et al., 2013; Hasegawa et al., 2006).
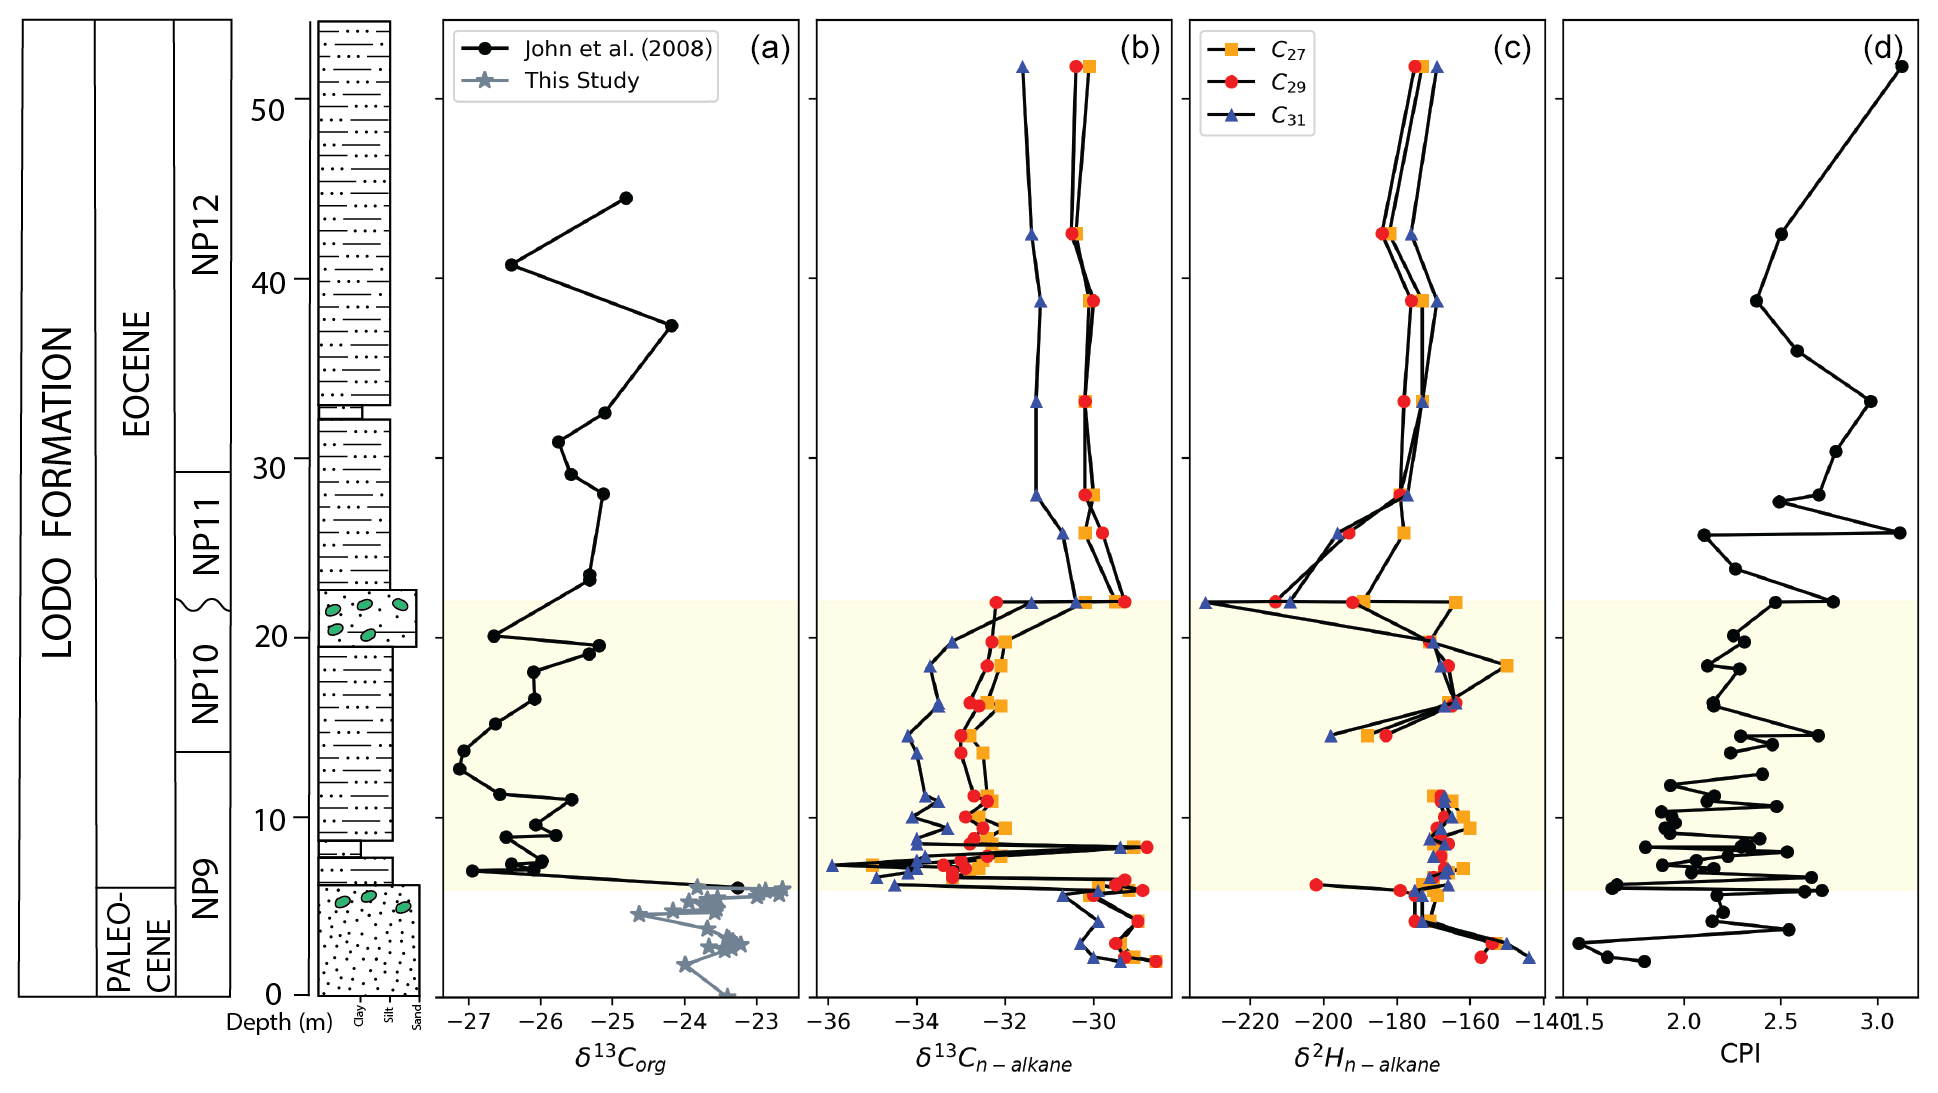
Figure 2Terrestrial higher plant leaf wax n-alkane δ13C and δ2H records for the Lodo Gulch section, central California. The shaded area represents the bounds of the CIE/PETM (a) bulk organic carbon isotope record. (b, c) Leaf-wax-compound-specific carbon/hydrogen isotope records in n-C27 (yellow square), n-C29 (red closed circle), n-C31 (blue triangle), and (d) n-alkane carbon preference indices (CPIs).
3.2 Hydrogen isotopes
The leaf wax δ2Hn-alkane values range from −150 to −213 ‰ over the entire sampled section that has an initial decrease of 25 ‰ (from −150 to −175 ‰ in C29) just prior to the CIE onset and then followed by a slight rise (∼ 6 ‰) right after the onset. The relatively invariable δ2Hn-alkane through the PETM is punctuated with two brief intervals of more negative values (−202 ‰ at 6.26 m and −213 ‰ at 22 m). The second larger anomaly coincides with the disconformity (related to local sea level regression). The post-PETM δ2Hn-alkane values are on average lower than for the upper Paleocene/PETM, although analytical errors may bias the values. Given the limited number of samples to establish a baseline for the upper Paleocene, the significance of the pre-CIE (and post-CIE) shifts/anomalies in δ2Hn-alkane should be considered with some caution. Several other sections do show pre-CIE shifts, both positive and negative, and typically an enrichment with the CIE (Handley et al., 2008, 2011; Jaramillo et al., 2010; Tipple et al., 2011). Such minor changes likely reflect unconstrained orbital influences on regional precipitation (Rush et al., 2021; Campbell et al., 2024), especially considering the variable direction of change from location to location.
3.3 Clay assemblage and grain size
Clay assemblages and particle grain size should to some extent be influenced by regional hydroclimate. At Lodo, the clay assemblages (Fig. 3) are dominated by smectite throughout. The minor clay components of illite and chlorite show several spikes relative to smectite within the lower (8 to 10 m) and upper CIE (∼ 19 m), whereas the ratio of kaolinite gradually increases (0.5 to 1.5) only over the upper portion of the CIE (10 to 20 m). A delayed rise in kaolinite has also been observed in a few other PETM sections, whereas some show an immediate rise (Tateo, 2020; Gibson et al., 2000). The smectite concentration and ratio remain high in the post-PETM interval. The late Paleocene, with a relatively coarse sand size, shows slight spikes of kaolinite associated with other minerals. Grain size, largely for silt and clay, shows a distinct shift toward finer fractions (i.e., clay) with the onset of the CIE (Fig. 3e).
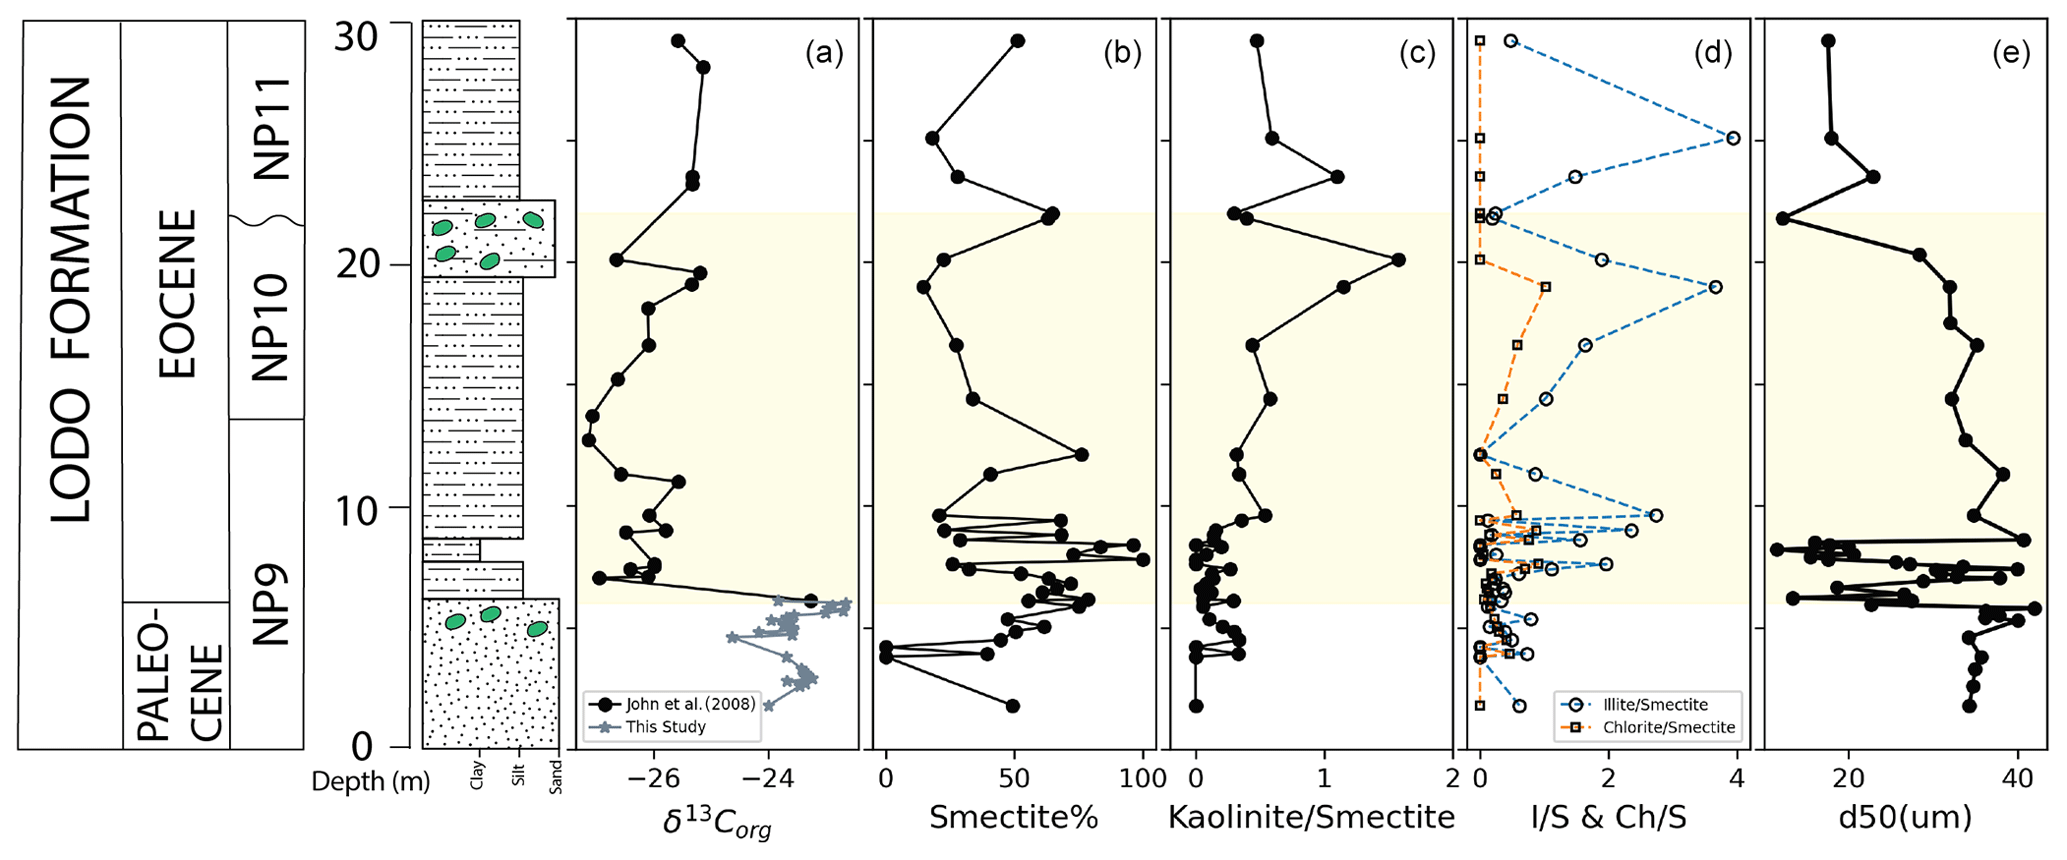
Figure 3Integrated C isotope and clay assemblage records for the Lodo Gulch section, central California. (a) Bulk organic carbon isotope. (b, c, d, e) Clay assemblage ratios. (e) The decreasing mean particle size (D50: 50 % of the total particle size in sediments) corresponds to CIE onset.
3.4 Earth system model simulations
We obtained and processed temperature and precipitation outputs from two community Earth system/climate models: the isotope-enabled iCESM1.2 and high-resolution CAM5 models (daily precipitation over 15 years) forced by a range of greenhouse conditions (1×, 3×, 6×, and 9× pCO2 pre-industrial), both with Eocene paleogeography. For comparisons with observations, we used the output from the 3× to 6× pCO2 simulations which best replicated the observed SSTs (ΔSST) for the pre-PETM and PETM (Zhu et al., 2020). Overall, monthly winter precipitation for the study region decreases (∼ 30 %) during the PETM in both simulations, with a slight increase in the summer (Figs. 4, 5). CAM5 output shows a modest decrease in the mean annual precipitation, with significant seasonal shifts during the PETM (Fig. 5a). Seasonal changes in the monthly averaged δ18O and δ2H from the mean monthly precipitation in iCESM1.2 of central California are consistent with CAM5. On average, the δ2Hprecip increases by ca. 5 ‰–10 ‰ from pre-PETM to PETM, especially in the winter/spring, with a smaller shift in summer/fall (1 ‰–2 ‰) (Fig. 4a, b, c). The extreme value index (ξ), a representation of the distribution of the exceedance right tail (see the Supplement), shows a small but statistically robust increase in the wet extremes of winter (December–February, DJF), with a significant increase in summer (June–August, JJA) during the PETM (Fig. 5b).
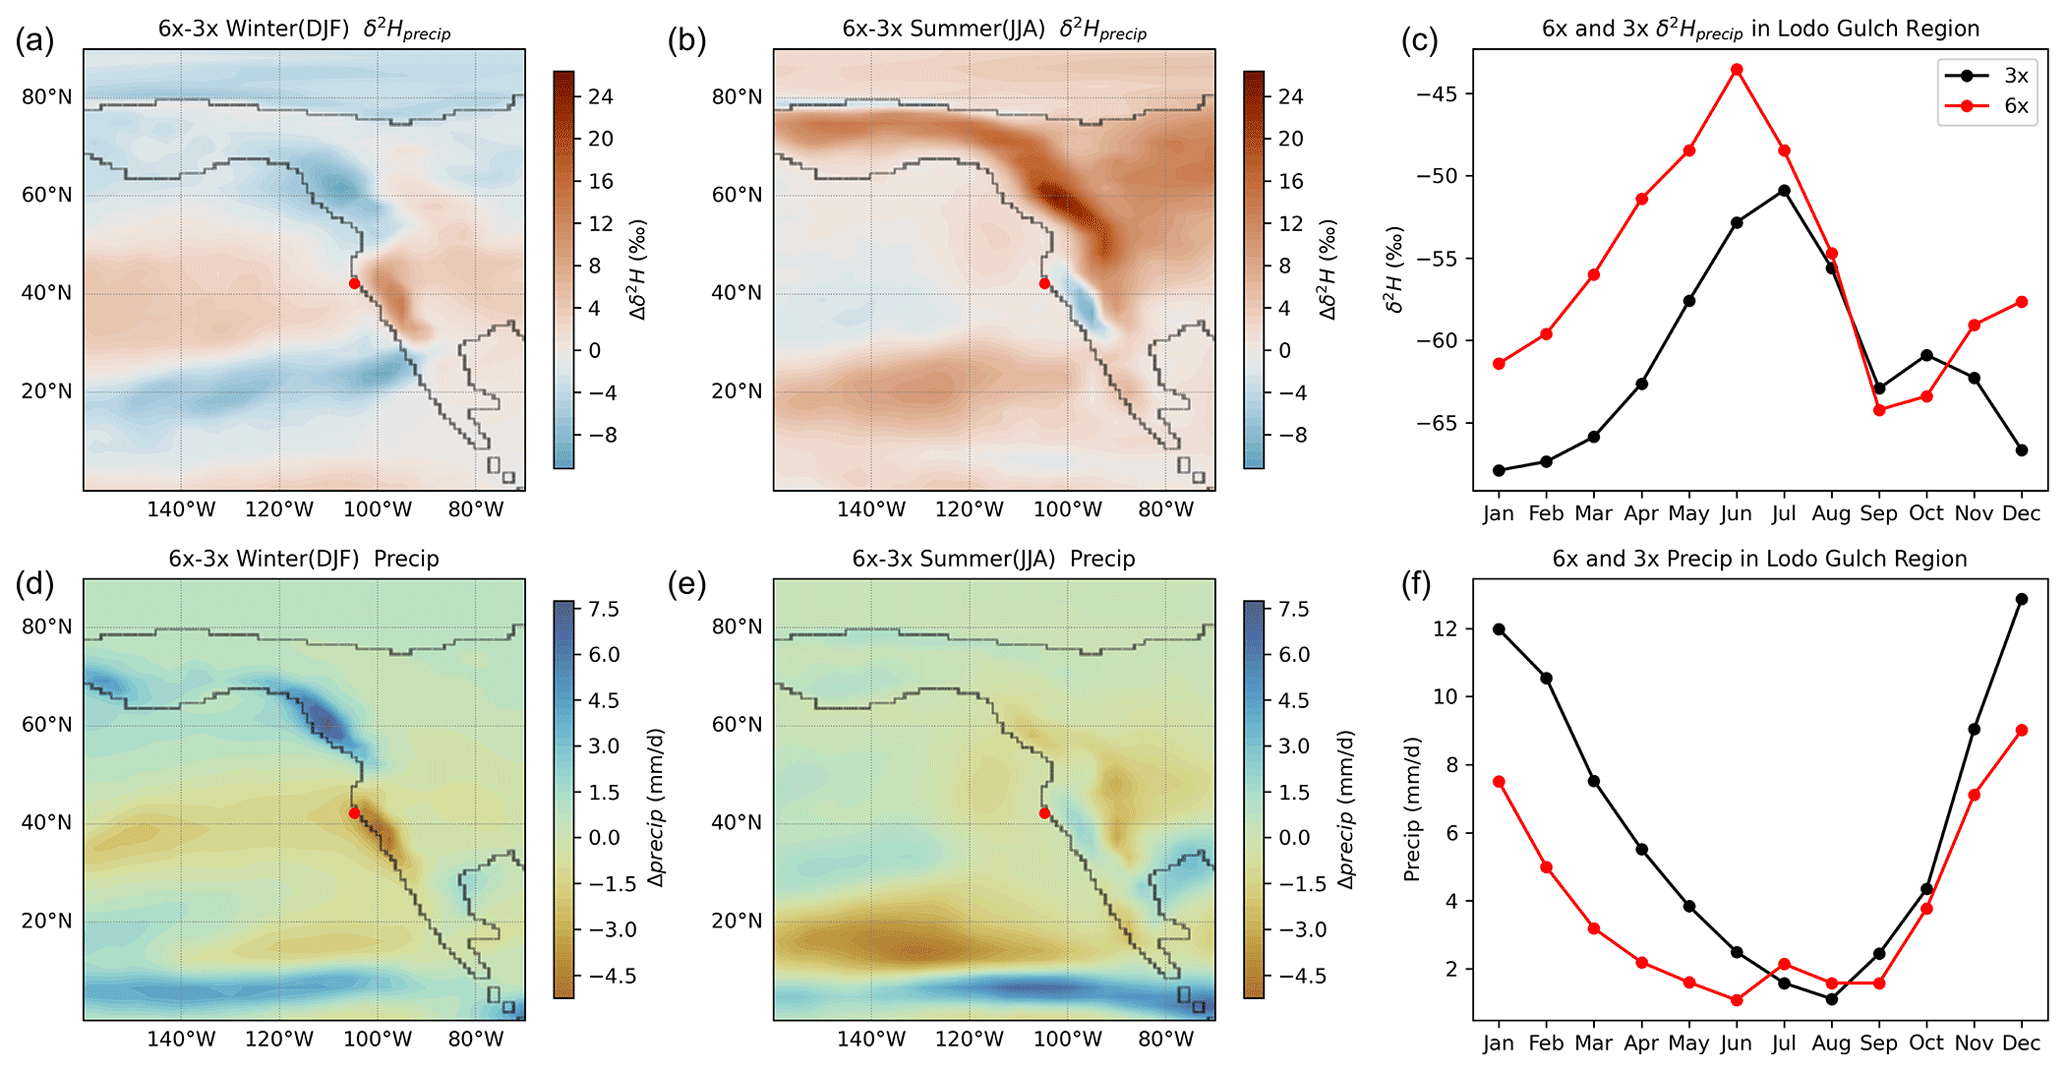
Figure 4Seasonal and monthly meteoric precipitation amounts (mm d−1) and H-isotopic composition for the North Pacific/western North America as simulated with the iCESM1.2 (Zhu et al., 2020) under pre-PETM (3× in black) and PETM (6× in red) pCO2 forcing. Panels (a) and (b) show Δδ2Hprecip between pre-PETM (3×) and PETM (6×) in winter (DJF) and summer (JJA). Panel (c) shows the annual seasonal cycle of δ2Hprecip for central California (pre-PETM in black; PETM in red). Mean daily precipitation rate difference for (d) winter and (e) summer between pre-PETM (3×) and PETM (6×). Panel (f) shows the annual seasonal cycle of daily precipitation rate for central California. Values represent the area-weighted average over 4° × 4° box bounding the study site.
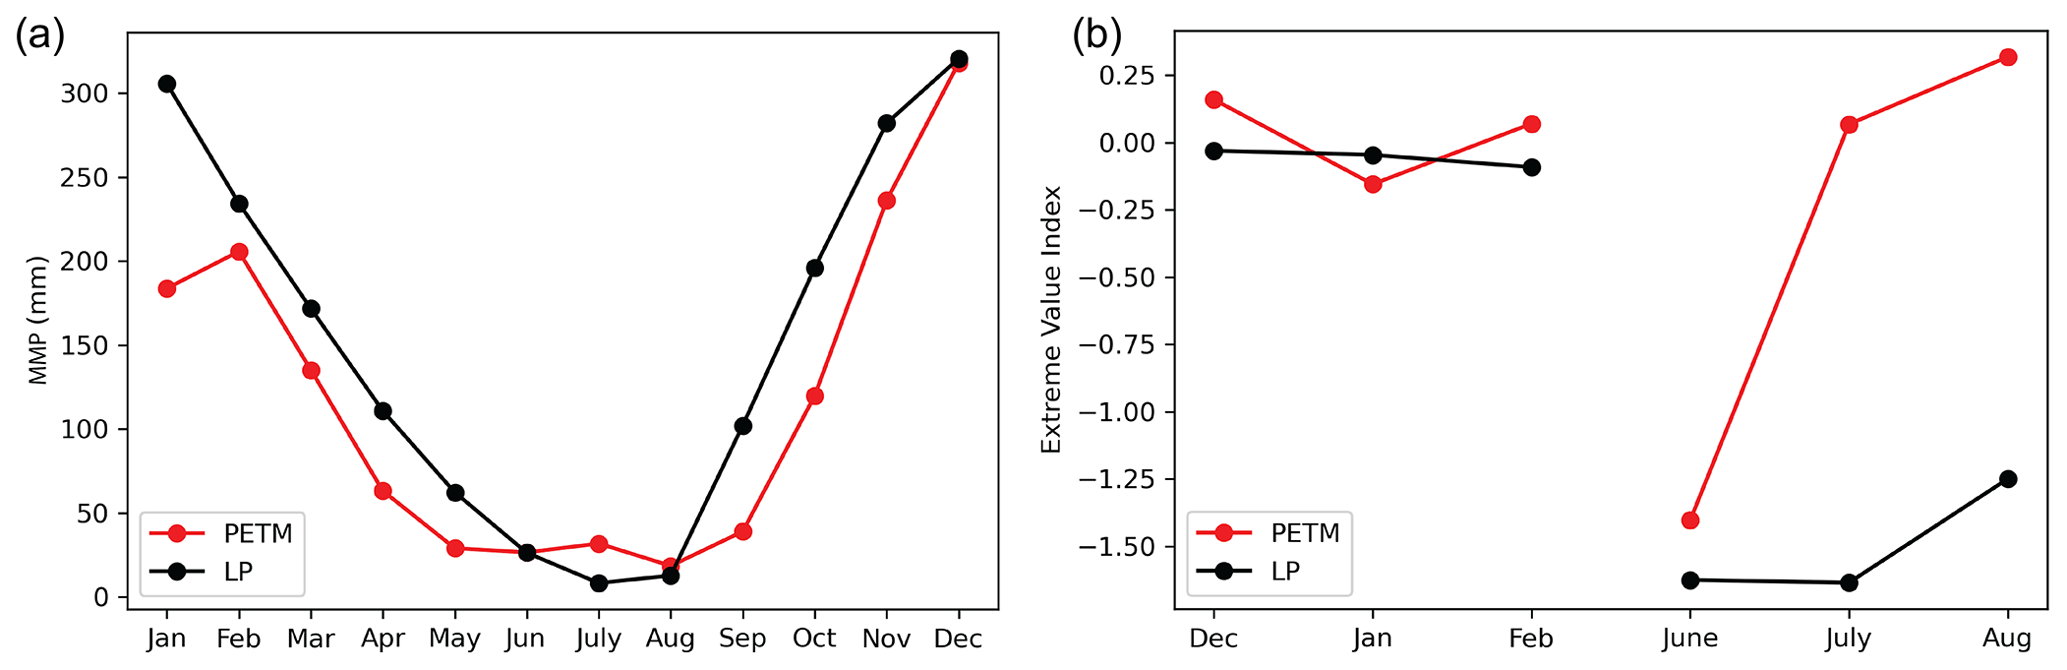
Figure 5High-resolution CAM5 model output (Shields et al., 2021) of (a) mean monthly precipitation for central California over 15 model years for the late Paleocene (LP) under low pCO2 (680 ppmv) and for the PETM under high pCO2 (1590 ppmv). (b) Extreme value index (ξ) comparison of mean monthly precipitation in winter and summer of the central California region based on the CAM5 precipitation outputs.
4.1 Hydroclimate response from model simulations
In all model simulations of the PETM forced with higher pCO2 (e.g., 3× to 6× pre-industrial), the hydrological cycle intensifies, as manifested by increases in global mean precipitation and meridional vapor transport (Kiehl and Shields, 2013; Kiehl et al., 2018; Carmichael et al., 2016; Zhu et al., 2020). Regionally however, the magnitude and even the sign of precipitation change can differ considerably from global means (Carmichael et al., 2016, 2017). This is most evident in the latest low- and high-resolution model simulations of the PETM (Zhu et al., 2020; Shields et al., 2021). For central California, the simulations yield an overall decline in the mean annual precipitation that is mainly due to a notable decline in winter precipitation with only a slight increase in summer (Fig. 4). This pattern is produced by both the water-isotope-enabled iCESM1.2 and the higher-resolution CAM5 with an overall shift to lower-amplitude seasonal cycles (i.e., drier winter/spring and a slightly wetter summer) (Figs. 4, 5). This seasonal wet–dry shift appears to be driven in part by a pronounced northward shift in atmospheric rivers (ARs) in winter along the North American Pacific coastline (Shields et al., 2021). As ARs deliver most of the winter precipitation to the mid-latitude Pacific coast, less frequent occurrences result in drier winters during the PETM. Moreover, the extreme value index (ξ) shows a small but statistically robust increase in winter (DJF) wet extremes, with a significant increase in the probability of summer (JJA) wet exceedance during PETM (Fig. 5b). The latter might be due to elevated tropical storm activity along the Pacific coast during PETM (Fig. S7; Kiehl et al., 2021).
4.2 Hydroclimate response from observations
4.2.1 Sedimentation rate, clay assemblages, and grain size distribution
Arguably, the collection of observations from Lodo (i.e., sediment flux, clay assemblages, and leaf wax δ2H isotopes), within limitations, appears to be mostly consistent with the model output. Starting with siliciclastic sedimentation, rates should be highly susceptible to a major shift in hydrologic conditions as changes in the seasonality of precipitation (along with vegetative cover) would impact rates of erosion and sediment transport. The coarse resolution of stratigraphic control at Lodo does limit the ability to constrain changes in sedimentation rates in detail. However, just considering the thickness of the CIE (∼ 10 m), one could argue for a shift toward higher seasonality of precipitation with overall drier conditions, as suggested by John et al. (2008).
The other constraints on regional precipitation would also support a shift toward drier conditions. For example, an increase in the relative abundance of kaolinite fluxes has been widely observed across the CIE onset in many PETM sections from mid- to high latitudes (Tateo, 2020; Gibson et al., 2000) and interpreted as evidence of a major mode shift in local hydroclimates. In contrast, the clay mineralogy (Fig. 3) for the Lodo Formation is dominated mainly by smectite at the onset of the PETM, consistent with seasonal wet/dry cycles under warm conditions (Gibson et al., 2000). A subtle increase in the could be interpreted as evidence of higher humidity (Gibson et al., 2000). However, the skewed grain size distribution of clay sediments at around 8 m, coinciding with illite/smectite peaks (Figs. 3e and S1), indicate higher fluvial velocity and increased erosion, as observed elsewhere (Chen et al., 2018; Foreman et al., 2012; Foreman, 2014). For example, along the mid-Atlantic margin it appears that the kaolinite might have been exhumed from local Cretaceous laterites (Lyons et al., 2019). The regionally enhanced physical weathering and erosion could be related to an increase in the frequency of episodic wet/dry extremes during the PETM, as simulated by models.
4.2.2 Precipitation and leaf wax δ2Hn-alkane
The Lodo leaf wax δ2Hn-alkane record is, at first glance, somewhat equivocal in terms of the response of local hydroclimate. In theory, terrestrial higher plant δ2Hn-alkane should provide insight into the changes in regional precipitation amounts/source, particularly for major mode shifts (Jaramillo et al., 2010; Pagani et al., 2006; Tipple et al., 2011). In some PETM records, δ2Hn-alkane significantly increases, consistent with the effects of higher T on water isotope fractionation. For example, in the Arctic, δ2Hn-alkane records show a positive excursion of 55 ‰ at CIE onset, consistent with higher T, a reduced meridional temperature gradient, and a decrease in isotope distillation during vapor transport (Pagani et al., 2006). However, there are notable exceptions. In some subtropical/mid-latitude sites, δ2Hn-alkane decreases (ca. ∼ 20 ‰) across the onset of PETM (Handley et al., 2008, 2011; Jaramillo et al., 2010; Tipple et al., 2011). In comparison, Lodo δ2Hn-alkane displays a comparatively muted response, showing a slight 2H enrichment in the main body PETM, followed by several anomalous shifts toward more negative values (Fig. 2c).
Given the robust evidence for mode shifts in hydroclimate elsewhere during the PETM, does the relatively stable Lodo δ2Hn-alkane record necessarily support a local/regional stable hydroclimate (i.e., in conflict with the modeling and other observations)? As H-isotope fractionation in plants is related to photosynthetic pathways, source water availability, and atmospheric humidity (Sachse et al., 2012; Tipple et al., 2015), it is possible that local shifts in meteoric water isotope composition were offset by another influencing factor(s). Regarding photosynthetic pathways, along the west coast of North America, no detailed records of vegetation response have been generated for the PETM. Still, for the late Paleocene and early Eocene intervals, Korasidis et al. (2022) found little deviation in the Köppen–Geiger climate type (i.e., Mediterranean) within the central California region. This evidence, along with the lack of change in the n-alkane average chain length (ACL) in the Lodo section (Fig. S5), would suggest no major changes in vegetation assemblages during the PETM. Another factor, a reworking of the Paleocene terrestrial organic matter (e.g., Tipple et al., 2011), could possibly dampen of isotopic n-alkane signals at Lodo, although the CPIs and the leaf wax carbon isotopes would suggest minimal reworking of the n-alkanes, as opposed to other coastal PETM sites where the evidence for reworking is robust (e.g., Lyons et al., 2019; Hollingsworth et al., 2024). As such, if we assume the δ2Hn-alkane record reflects only on changes in local meteoric waters, then the observed modest change in δ2Hn-alkane values at Lodo could be interpreted in several ways in terms of T-related changes on isotope fractionation that were offset by changes in the dominant season of precipitation and/or vapor sources and distance of transport. For example, a shift in precipitation between winter and late summer/fall could offset the effects of warming, assuming a shift from a proximal (north or central Pacific) to a more distal (Gulf of Mexico) source of vapor (Hu and Dominguez, 2015). At ground level, stronger evapotranspiration during biosynthesis can isotopically be offset by external water source availability (i.e., seasonal precipitation). Local/regional groundwater table variations caused by a hydrological change would also affect the source water use efficiency of plants since surface water tends to be more depleted in some perennial species after intense storms in the groundwater (Hou et al., 2008; Krishnan et al., 2014). Hydrogen isotope fractionation in plants can also be biased by seasonal shift in regional vegetation growth regime. For example, leaf wax lipids from terrestrial plants usually record hydrological conditions earlier in the season rather than fully integrating the entire growing season (Hou et al., 2008; Tipple et al., 2013). Finally, episodic extremes in precipitation may dominate the hydrogen isotopic composition of the leaf wax (Krishnan et al., 2014). If soil water is derived mainly from extreme events during the growth season, then the lack of a major shift in the Lodo δ2Hn-alkane record with the onset of the PETM could reflect a combination of more 2H-depleted precipitation delivered by seasonal storms offset by warming-induced 2H-enrichment in leaf water.
4.3 Comparison of leaf water and modeled δ2H
Assuming leaf wax δ2H is primarily influenced by local meteoric water, how does the seasonal distribution of precipitation influence the bulk signal? In iCESM1.2 simulations with increasing pCO2 (i.e., 3× to 6× pre-industrial) and SSTs, the seasonal shifts in δ2H of mean monthly precipitation from pre-PETM to PETM are significant. During the winter, as precipitation amounts decline, δ2Hprecip increases by 10 ‰ while decreasing by ∼ 1 ‰ to 5 ‰ during late summer/fall in central California (Fig. 4). To estimate how this seasonal change in δ2Hprecip and precipitation amount influences leaf water δ2H, we applied a leaf wax proxy model (see the Supplement) which computes the combined effects of changes in seasonal precipitation and growing season length. The model shows leaf water δ2H is enriched ca. 4 ‰ to 7 ‰ from pre-PETM to PETM. Arguably, this would be consistent with the minor ∼ 6 ‰ enrichment observed in the Lodo record at the onset of the PETM. We also examined other sites for comparison of the predicted leaf water differences from pre-PETM to PETM with the fossil leaf wax Δδ2H (see the Supplement) and find a similar pattern in other mid-latitude sites. Other factors to consider include precipitation source waters and a shift in a mixing endmember between proximal and distal sources of water in the coast. For example, with a summer shift in the source water from the Pacific to subtropics (i.e., summer monsoons), the effect of increasing distance and distillation would isotopically deplete vapor (Hu and Dominguez, 2015), thus offsetting the temperature-related enrichment of local δ2Hprecip. In addition, infrequent but high-intensity tropical cyclones during the PETM (Kiehl et al., 2021) would tend to deliver relatively depleted precipitation (i.e., a more negative δ2H) during summer months.
Finally, a related record that might indirectly reflect on precipitation amount (i.e., atmospheric humidity) is the magnitude of the CIE recorded by leaf wax δ13Cn-alkane. Recalcitrant higher plant leaf wax n-alkane carbon isotope ratios (n>25 with an odd-over-even preference) mainly reflect the carbon source (Diefendorf et al., 2010). However, photosynthetic carbon isotope fractionation (Δp) is sensitive to atmospheric pCO2 variations, generally increasing with rising concentrations assuming a constant photosynthetic fractionation factor and humidity (Diefendorf et al., 2010). The δ13Cn-alkane of Lodo section displays a sharp negative shift of ca. 4 ‰ (average of n-C27, n-C29, and n-C31) across the onset of CIE (Fig. 2b), which is consistent with global mean atmospheric CIE (Sluijs and Dickens, 2012) but generally smaller than observed in other leaf wax records (Handley et al., 2008, 2012; Jaramillo et al., 2010; Pagani et al., 2006; Tipple et al., 2011). The smaller δ13Cn-alkane CIE recorded in Lodo would be consistent with a reduction in local humidity which should reduce the magnitude of Δp during photosynthetic carbon fixation.
Many sections globally exhibit evidence, often striking, of significant shifts in local hydroclimate at the onset of the PETM consistent with model simulations (e.g., 2× CO2). These same models also simulate an overall decrease in winter precipitation for the central California coast due in large part to a reduction in AR frequency (Shields et al., 2021). While not as striking, the collection of observations from the central California Lodo Gulch section would support a modest reduction in precipitation (i.e., MAP, mean annual precipitation) during the PETM, along with the possibility of an increase in the frequency of extreme precipitation events. This transition toward greater aridity and precipitation extremes is not unlike the forecasts for much of California over the coming centuries due to anthropogenic warming.
Data tables of the clay assemblages, grain size, organic carbon isotopes, and leaf wax n-alkane stable isotopes is available in the Supplement.
The supplement related to this article is available online at: https://doi.org/10.5194/cp-20-1615-2024-supplement.
JCZ conceived the project design, acquired funding, and provided overall supervision. XZ conducted stable isotope measurements, clay mineralogy, grain size analyses, and iCESM/CAM5model output analyses. Leaf wax n-alkane carbon and hydrogen isotope measurements were performed by BJT. JBN conducted leaf wax proxy model experiments. CAS and WDR contributed to processing CAM model output. This paper was prepared by XZ, with all authors contributing to the review and editing of the paper.
The contact author has declared that none of the authors has any competing interests.
Publisher’s note: Copernicus Publications remains neutral with regard to jurisdictional claims made in the text, published maps, institutional affiliations, or any other geographical representation in this paper. While Copernicus Publications makes every effort to include appropriate place names, the final responsibility lies with the authors.
The authors thank Colin Carney (UCSC SIL) for technical support and acknowledge the contributions of Mark Pagani (deceased). All compound-specific isotope analyses were performed at the Yale Institute for Biospheric Studies Earth System Center. The CESM project is primarily supported by the National Science Foundation (NSF). This material is based upon work supported by the National Center for Atmospheric Research, which is a major facility sponsored by the NSF (cooperative agreement no. 1852977).
This research has been supported by the National Science Foundation to James C. Zachos (grant no. OCE 2103513) and Mark Pagani (grant nos. EAR 0628358 and OCE 0902993).
This paper was edited by Kathleen A. Wendt and reviewed by Emily Hollingsworth and Richard Pancost.
Abell, J. T., Winckler, G., Anderson, R. F., and Herbert, T. D.: Poleward and weakened westerlies during Pliocene warmth, Nature, 589, 70–75, https://doi.org/10.1038/s41586-020-03062-1, 2021.
Blott, S. J., Croft, D. J., Pye, K., Saye, S. E., and Wilson, H. E.: Particle size analysis by laser diffraction, Geological Society, London, Special Publications, 232, 63–73, 2004.
Brabb, E. E.: Studies in Tertiary stratigraphy of the California Coast Ranges, US Geological Survey Professional Paper series no. 1213, US Geological Survey, https://doi.org/10.3133/pp1213, 1983.
Brady, E., Stevenson, S., Bailey, D., Liu, Z., Noone, D., Nusbaumer, J., Otto-Bliesner, B. L., Tabor, C., Tomas, R., Wong, T., Zhang, J., and Zhu, J.: The Connected Isotopic Water Cycle in the Community Earth System Model Version 1, J. Adv. Model. Earth Sy., 11, 2547–2566, https://doi.org/10.1029/2019MS001663, 2019.
Büntgen, U., Urban, O., Krusic, P. J., Rybníček, M., Kolář, T., Kyncl, T., Ač, A., Koňasová, E., Čáslavský, J., Esper, J., Wagner, S., Saurer, M., Tegel, W., Dobrovolný, P., Cherubini, P., Reinig, F., and Trnka, M.: Recent European drought extremes beyond Common Era background variability, Nat. Geosci., 14, 190–196, https://doi.org/10.1038/s41561-021-00698-0, 2021.
Campbell, J., Poulsen, C. J., Zhu, J., Tierney, J. E., and Keeler, J.: CO2-driven and orbitally driven oxygen isotope variability in the Early Eocene, Clim. Past, 20, 495–522, https://doi.org/10.5194/cp-20-495-2024, 2024.
Carmichael, M. J., Lunt, D. J., Huber, M., Heinemann, M., Kiehl, J., LeGrande, A., Loptson, C. A., Roberts, C. D., Sagoo, N., Shields, C., Valdes, P. J., Winguth, A., Winguth, C., and Pancost, R. D.: A model–model and data–model comparison for the early Eocene hydrological cycle, Clim. Past, 12, 455–481, https://doi.org/10.5194/cp-12-455-2016, 2016.
Carmichael, M. J., Inglis, G. N., Badger, M. P. S., Naafs, B. D. A., Behrooz, L., Remmelzwaal, S., Monteiro, F. M., Rohrssen, M., Farnsworth, A., Buss, H. L., Dickson, A. J., Valdes, P. J., Lunt, D. J., and Pancost, R. D.: Hydrological and associated biogeochemical consequences of rapid global warming during the Paleocene-Eocene Thermal Maximum, Global Planet. Change, 157, 114–138, https://doi.org/10.1016/j.gloplacha.2017.07.014, 2017.
Cramwinckel, M. J., Burls, N. J., Fahad, A. A., Knapp, S., West, C. K., Reichgelt, T., Greenwood, D. R., Chan, W. L., Donnadieu, Y., Hutchinson, D. K., De Boer, A. M., Ladant, J., Morozova, P. A., Niezgodzki, I., Knorr, G., Steinig, S., Zhang, Z., Zhu, J., Feng, R., Lunt, D. J., Abe-Ouchi, A., and Inglis, G. N.: Global and zonal-mean hydrological response to early Eocene warmth, Paleoceanography and Paleoclimatology, 38, e2022PA004542, https://doi.org/10.1029/2022PA004542, 2023.
Chen, C., Guerit, L., Foreman, B. Z., Hassenruck-Gudipati, H. J., Adatte, T., Honegger, L., Perret, M., Sluijs, A., and Castelltort, S.: Estimating regional flood discharge during Palaeocene-Eocene global warming, Sci. Rep., 8, 1–8, https://doi.org/10.1038/s41598-018-31076-3, 2018.
Cui, Y., Diefendorf, A. F., Kump, L. R., Jiang, S., and Freeman, K. H.: Synchronous marine and terrestrial carbon cycle perturbation in the high arctic during the PETM, Paleoceanography and Paleoclimatology, 36, e2020PA003942, https://doi.org/10.1029/2020PA003942, 2021.
Diefendorf, A. F., Mueller, K. E., Wing, S. L., Koch, P. L., and Freeman, K. H.: Global patterns in leaf 13C discrimination and implications for studies of past and future climate, P. Natl. Acad. Sci. USA, 107, 5738–5743, https://doi.org/10.1073/pnas.0910513107, 2010.
Douville, H., Raghavan, K., Renwick, J., and Allan, R.: Water Cycle Changes, Intergovernmental Panel on Climate Change 2021 – The Physical Science Basis, 1055–1210, https://doi.org/10.1017/9781009157896.010, 2021.
Foreman, B. Z.: Climate-driven generation of a fluvial sheet sand body at the Paleocene–Eocene boundary in north-west Wyoming (USA), Basin Res., 26, 225–241, https://doi.org/10.1111/BRE.12027, 2014.
Foreman, B. Z., Heller, P. L., and Clementz, M. T.: Fluvial response to abrupt global warming at the Palaeocene/Eocene boundary, Nature, 491, 92–95, https://doi.org/10.1038/nature11513, 2012.
Garel, S., Schnyder, J., Jacob, J., Dupuis, C., Boussafir, M., and Le Milbeau, C.: Paleohydrological and paleoenvironmental changes recorded in terrestrial sediments of the Paleocene-Eocene boundary (Normandy, France), Palaeogeogr. Palaeocl., 376, 184–199, https://doi.org/10.1016/j.palaeo.2013.02.035, 2013.
Gibson, T. G., Bybell, L. M., and Mason, D. B.: Stratigraphic and climatic implications of clay mineral changes around the Paleocene/Eocene boundary of the northeastern US margin, Sediment. Geol., 134, 65–92, https://doi.org/10.1016/S0037-0738(00)00014-2, 2000.
Handley, L., Pearson, P. N., McMillan, I. K., and Pancost, R. D.: Large terrestrial and marine carbon and hydrogen isotope excursions in a new Paleocene/Eocene boundary section from Tanzania, Earth Planet. Sc. Lett., 275, 17–25, https://doi.org/10.1016/j.epsl.2008.07.030, 2008.
Handley, L., Crouch, E. M., and Pancost, R. D.: A New Zealand record of sea level rise and environmental change during the Paleocene-Eocene Thermal Maximum, Palaeogeogr. Palaeocl., 305, 185–200, https://doi.org/10.1016/j.palaeo.2011.03.001, 2011.
Handley, L., O'Halloran, A., Pearson, P. N., Hawkins, E., Nicholas, C. J., Schouten, S., McMillan, I. K., and Pancost, R. D.: Changes in the hydrological cycle in tropical East Africa during the Paleocene-Eocene Thermal Maximum, Palaeogeogr. Palaeocl., 329–330, 10–21, https://doi.org/10.1016/j.palaeo.2012.02.002, 2012.
Hasegawa, T., Yamamoto, S., and Pratt, L. M.: Data report: Stable carbon isotope fluctuation of long-chain n-alkanes from Leg 208 Hole 1263A across the Paleocene/Eocene boundary, in: Proceedings of the Ocean Drilling Program: Scientific Results 208, edited by: Kroon, D., Zachos, J. C., and Richter, C., Ocean Drilling Program, 11 pp., https://doi.org/10.2973/odp.proc.sr.208.202.2006, 2006.
Held, I. M. and Soden, B. J.: Robust Responses of the Hydrological Cycle to Global Warming, J. Climate, 19, 5686–5699, https://doi.org/10.1175/JCLI3990.1, 2006.
Hollingsworth, E. H., Elling, F. J., Badger, M. P. S., Pancost, R. D., Dickson, A. J., Rees-Owen, R. L., Papadomanolaki, N. M., Pearson, A., Sluijs, A., Freeman, K. H., Baczynski, A. A., Foster, G. L., Whiteside, J. H., and Inglis, G. N.: Spatial and Temporal Patterns in Petrogenic Organic Carbon Mobilization During the Paleocene-Eocene Thermal Maximum, Paleoceanography and Paleoclimatology, 39, e2023PA004773, https://doi.org/10.1029/2023PA004773, 2024.
Hou, J., D'Andrea, W. J., and Huang, Y.: Can sedimentary leaf waxes record ratios of continental precipitation? Field, model, and experimental assessments, Geochim. Cosmochim. Ac., 72, 3503–3517, https://doi.org/10.1016/j.gca.2008.04.030, 2008.
Hu, H. and Dominguez, F.: Evaluation of Oceanic and Terrestrial Sources of Moisture for the North American Monsoon Using Numerical Models and Precipitation Stable Isotopes, J. Hydrometeorol., 16, 19–35, https://doi.org/10.1175/JHM-D-14-0073.1, 2015.
Jaramillo, C., Ochoa, D., Contreras, L., Pagani, M., Carvajal-Ortiz, H., Pratt, L. M., Krishnan, S., Cardona, A., Romero, M., Quiroz, L., Rodriguez, G., Rueda, M. J., De La Parra, F., Morón, S., Green, W., Bayona, G., Montes, C., Quintero, O., Ramirez, R., Mora, G., Schouten, S., Bermudez, H., Navarrete, R., Parra, F., Alvarán, M., Osorno, J., Crowley, J. L., Valencia, V., and Vervoort, J.: Effects of rapid global warming at the paleocene-eocene boundary on neotropical vegetation, Science, 330, 957–961, https://doi.org/10.1126/science.1193833, 2010.
John, C. M., Bohaty, S. M., Zachos, J. C., Sluijs, A., Gibbs, S., Brinkhuis, H., and Bralower, T. J.: North American continental margin records of the Paleocene-Eocene thermal maximum: Implications for global carbon and hydrological cycling, Paleoceanography, 23, PA2217, https://doi.org/10.1029/2007PA001465, 2008.
Kemp, S. J., Ellis, M. A., Mounteney, I., and Kender, S.: Palaeoclimatic implications of high-resolution clay mineral assemblages preceding and across the onset of the Palaeocene–Eocene Thermal Maximum, North Sea Basin, Clay Miner., 51, 793–813, https://doi.org/10.1180/CLAYMIN.2016.051.5.08, 2016.
Kiehl, J. T. and Shields, C. A.: Sensitivity of the palaeocene-eocene thermal maximum climate to cloud properties, Philos. T. R. Soc. A, 371, 20130093, https://doi.org/10.1098/rsta.2013.0093, 2013.
Kiehl, J. T., Shields, C. A., Snyder, M. A., Zachos, J. C., and Rothstein, M.: Greenhouse- and orbital-forced climate extremes during the early Eocene, Philos. T. R. Soc. A, 376, 2130, https://doi.org/10.1098/RSTA.2017.0085, 2018.
Kiehl, J. T., Zarzycki, C. M., Shields, C. A., and Rothstein, M. V.: Simulated changes to tropical cyclones across the Paleocene-Eocene Thermal Maximum (PETM) boundary, Palaeogeogr. Palaeocl., 572, 110421, https://doi.org/10.1016/J.PALAEO.2021.110421, 2021.
Korasidis, V. A., Wing, S. L., Shields, C. A., and Kiehl, J. T.: Global Changes in Terrestrial Vegetation and Continental Climate During the Paleocene-Eocene Thermal Maximum, Paleoceanogr. Paleocl., 37, e2021PA004325, https://doi.org/10.1029/2021PA004325, 2022.
Kozdon, R., Penman, D. E., Kelly, D. C., Zachos, J. C., Fournelle, J. H., and Valley, J. W.: Enhanced Poleward Flux of Atmospheric Moisture to the Weddell Sea Region (ODP Site 690) During the Paleocene-Eocene Thermal Maximum, Paleoceanogr. Paleocl., 35, 1–14, https://doi.org/10.1029/2019pa003811, 2020.
Kraus, M. J. and Riggins, S.: Transient drying during the Paleocene-Eocene Thermal Maximum (PETM): Analysis of paleosols in the bighorn basin, Wyoming, Palaeogeogr. Palaeocl., 245, 444–461, https://doi.org/10.1016/j.palaeo.2006.09.011, 2007.
Krishnan, S., Pagani, M., Huber, M., and Sluijs, A.: High latitude hydrological changes during the Eocene Thermal Maximum 2, Earth Planet. Sc. Lett., 404, 167–177, https://doi.org/10.1016/j.epsl.2014.07.029, 2014.
Liu, B., Yan, Y., Zhu, C., Ma, S., and Li, J.: Record-Breaking Meiyu Rainfall Around the Yangtze River in 2020 Regulated by the Subseasonal Phase Transition of the North Atlantic Oscillation, Geophy.s Res. Lett., 47, e2020GL090342, https://doi.org/10.1029/2020GL090342, 2020.
Lunt, D. J., Huber, M., Anagnostou, E., Baatsen, M. L. J., Caballero, R., DeConto, R., Dijkstra, H. A., Donnadieu, Y., Evans, D., Feng, R., Foster, G. L., Gasson, E., von der Heydt, A. S., Hollis, C. J., Inglis, G. N., Jones, S. M., Kiehl, J., Kirtland Turner, S., Korty, R. L., Kozdon, R., Krishnan, S., Ladant, J.-B., Langebroek, P., Lear, C. H., LeGrande, A. N., Littler, K., Markwick, P., Otto-Bliesner, B., Pearson, P., Poulsen, C. J., Salzmann, U., Shields, C., Snell, K., Stärz, M., Super, J., Tabor, C., Tierney, J. E., Tourte, G. J. L., Tripati, A., Upchurch, G. R., Wade, B. S., Wing, S. L., Winguth, A. M. E., Wright, N. M., Zachos, J. C., and Zeebe, R. E.: The DeepMIP contribution to PMIP4: experimental design for model simulations of the EECO, PETM, and pre-PETM (version 1.0), Geosci. Model Dev., 10, 889–901, https://doi.org/10.5194/gmd-10-889-2017, 2017.
Lyons, S. L., Baczynski, A. A., Babila, T. L., Bralower, T. J., Hajek, E. A., Kump, L. R., Polites, E. G., Self-Trail, J. M., Trampush, S. M., Vornlocher, J. R., Zachos, J. C., and Freeman, K. H.: Palaeocene–Eocene Thermal Maximum prolonged by fossil carbon oxidation, Nat. Geosci., 12, 54–60, 2019.
Massoud, E. C., Espinoza, V., Guan, B., and Waliser, D. E.: Global Climate Model Ensemble Approaches for Future Projections of Atmospheric Rivers, Earths Future, 7, 1136–1151, https://doi.org/10.1029/2019EF001249, 2019.
Nicolo, M. J., Dickens, G. R., and Hollis, C. J.: South Pacific intermediate water oxygen depletion at the onset of the Paleocene-Eocene thermal maximum as depicted in New Zealand margin sections, Paleoceanography, 25, 1–12, https://doi.org/10.1029/2009PA001904, 2010.
Pagani, M., Pedentchouk, N., Huber, M., Sluijs, A., Schouten, S., Brinkhuis, H., Damsté, J. S. S., Dickens, G. R., Backman, J., Clemens, S., Cronin, T., Eynaud, F., Gattacceca, J., Jakobsson, M., Jordan, R., Kaminski, M., King, J., Koc, N., Martinez, N. C., McInroy, D., Moore, T. C., O'Regan, M., Onodera, J., Pälike, H., Rea, B., Rio, D., Sakamoto, T., Smith, D. C., St John, K. E. K., Suto, I., Suzuki, N., Takahashi, K., Watanabe, M., and Yamamoto, M.: Arctic hydrology during global warming at the Palaeocene/Eocene thermal maximum, Nature, 442, 671–675, https://doi.org/10.1038/nature05043, 2006.
Peters, K. E., Walters, C. C., and Moldowan, J. M.: The Biomarker Guide: II Biomarkers and Isotopes in Petroleum Systems and Earth History, 2nd Edn., Cambridge University Press, Cambridge, ISBN 9781107326040, https://doi.org/10.1017/CBO9781107326040, 2005.
Risser, M. D. and Wehner, M. F.: Attributable Human-Induced Changes in the Likelihood and Magnitude of the Observed Extreme Precipitation during Hurricane Harvey, Geophys. Res. Lett., 44, 12457–12464, https://doi.org/10.1002/2017GL075888, 2017.
Rush, W. D., Kiehl, J. T., Shields, C. A., and Zachos, J. C.: Increased frequency of extreme precipitation events in the North Atlantic during the PETM: Observations and theory, Palaeogeogr. Palaeocl., 568, 110289, https://doi.org/10.1016/j.palaeo.2021.110289, 2021.
Sachse, D., Billault, I., Bowen, G. J., Chikaraishi, Y., Dawson, T. E., Feakins, S. J., Freeman, K. H., Magill, C. R., McInerney, F. A., van der Meer, M. T. J., Polissar, P., Robins, R. J., Sachs, J. P., Schmidt, H.-L., Sessions, A. L., White, J. W. C., West, J. B., and Kahmen, A.: Molecular Paleohydrology: Interpreting the Hydrogen-Isotopic Composition of Lipid Biomarkers from Photosynthesizing Organisms, Annu. Rev. Earth Pl. Sc., 40, 221–249, https://doi.org/10.1146/annurev-earth-042711-105535, 2012.
Schmitz, B. and Pujalte, V.: Sea-level, humidity, and land-erosion records across the initial Eocene thermal maximum from a continental-marine transect in northern Spain, Geology, 31, 689–692, https://doi.org/10.1130/G19527.1, 2003.
Self-Trail, J. M., Robinson, M. M., Bralower, T. J., Sessa, J. A., Hajek, E. A., Kump, L. R., Trampush, S. M., Willard, D. A., Edwards, L. E., Powars, D. S., and Wandless, G. A.: Shallow marine response to global climate change during the Paleocene-Eocene Thermal Maximum, Salisbury Embayment, USA, Paleoceanography, 32, 710–728, https://doi.org/10.1002/2017PA003096, 2017.
Shields, C. A. and Kiehl, J. T. Atmospheric river landfall-latitude changes in future climate simulations, Geophys. Res. Lett., 43, 8775–8782, https://doi.org/10.1002/2016GL070470, 2016.
Shields, C. A., Kiehl, J. T., Rush, W., Rothstein, M., and Snyder, M. A.: Atmospheric rivers in high-resolution simulations of the Paleocene Eocene Thermal Maximum (PETM), Palaeogeogr. Palaeocl., 567, 110293, https://doi.org/10.1016/j.palaeo.2021.110293, 2021.
Simon Wang, S. Y., Yoon, J. H., Becker, E., and Gillies, R.: California from drought to deluge, Nat. Clim. Change, 7, 465–468, https://doi.org/10.1038/nclimate3330, 2017.
Slotnick, B. S., Dickens, G. R., Nicolo, M. J., Hollis, C. J., Crampton, J. S., Zachos, J. C., and Sluijs, A.: Large-amplitude variations in carbon cycling and terrestrial weathering during the latest Paleocene and earliest Eocene: The record at Mead Stream, New Zealand, J. Geol., 120, 487–505, https://doi.org/10.1086/666743, 2012.
Sluijs, A. and Brinkhuis, H.: A dynamic climate and ecosystem state during the Paleocene-Eocene Thermal Maximum: inferences from dinoflagellate cyst assemblages on the New Jersey Shelf, Biogeosciences, 6, 1755–1781, https://doi.org/10.5194/bg-6-1755-2009, 2009.
Sluijs, A. and Dickens, G. R.: Assessing offsets between the δ13C of sedimentary components and the global exogenic carbon pool across early Paleogene carbon cycle perturbations, Global Biogeochem. Cy., 26, GB4005, https://doi.org/10.1029/2011GB004224, 2012.
Smith, F. A., Wing, S. L., and Freeman, K. H.: Magnitude of the carbon isotope excursion at the Paleocene-Eocene thermal maximum: The role of plant community change, Earth Planet. Sc. Lett., 262, 50–65, https://doi.org/10.1016/j.epsl.2007.07.021, 2007.
Stassen, P., Thomas, E., and Speijer, R. P.: The progression of environmental changes during the onset of the Paleocene-Eocene thermal maximum (New Jersey coastal plain), Austrian J. Earth Sc., 105, 169–178, 2012.
Stevenson, S., Coats, S., Touma, D., Cole, J., Lehner, F., Fasullo, J., and Otto-Bliesner, B.: Twenty-first century hydroclimate: A continually changing baseline, with more frequent extremes, P. Natl. Acad. Sci. USA, 119, e2108124119, https://doi.org/10.1073/pnas.2108124119, 2022.
Swain, D. L., Langenbrunner, B., Neelin, J. D., and Hall, A.: Increasing precipitation volatility in twenty-first-century California, Nat. Clim. Change, 8, 427–433, https://doi.org/10.1038/s41558-018-0140-y, 2018.
Tateo, F.: Clay minerals at the paleocene–eocene thermal maximum: Interpretations, limits, and perspectives, Minerals, 10, 1–16, https://doi.org/10.3390/min10121073, 2020.
Tipple, B. J., Pagani, M., Krishnan, S., Dirghangi, S. S., Galeotti, S., Agnini, C., Giusberti, L., and Rio, D.: Coupled high-resolution marine and terrestrial records of carbon and hydrologic cycles variations during the Paleocene – Eocene Thermal Maximum (PETM), Earth Planet. Sc. Lett., 311, 82–92, https://doi.org/10.1016/j.epsl.2011.08.045, 2011.
Tipple, B. J., Berke, M. A., Doman, C. E., Khachaturyan, S., and Ehleringer, J. R.: Leaf-wax n-alkanes record the plant-water environment at leaf flush, P. Natl. Acad. Sci. USA, 110, 2659–2664, https://doi.org/10.1073/pnas.1213875110, 2013.
Tipple, B. J., Berke, M. A., Hambach, B., Roden, J. S., and Ehleringer, J. R.: Predicting leaf wax n-alkane ratios: controlled water source and humidity experiments with hydroponically grown trees confirm predictions of Craig–Gordon model, Plant Cell Environ., 38, 1035–1047, https://doi.org/10.1111/PCE.12457, 2015.
Vogel, M. M., Hauser, M., and Seneviratne, S. I.: Projected changes in hot, dry and wet extreme events' clusters in CMIP6 multi-model ensemble, Environ. Res. Lett., 15, 094021, https://doi.org/10.1088/1748-9326/ab90a7, 2020.
Wakeham, S. G. and Pease, T. K.: Lipid Analysis in Marine Particle and Sediment Samples A Laboratory Handbook, Skidaway Institute of Oceanography, University of Georgia, https://www.skio.uga.edu/research/technical-reports/ (last access: 3 October 2023), 2004.
Williams, A. P., Cook, E. R., Smerdon, J. E., Cook, B. I., Abatzoglou, J. T., Bolles, K., Baek, S. H., Badger, A. M., and Livneh, B.: Large contribution from anthropogenic warming to an emerging North American megadrought, Science, 368, 314–318, 2020.
Wing, S. L., Harrington, G. J., Smith, F. A., Bloch, J. I., Boyer, D. M., and Freeman, K. H.: Transient Floral Change and rapid global warming at the P/E boundary, Science, 310, 993–996, https://doi.org/10.1126/science.1116913, 2005.
Zachos, J. C., Dickens, G. R., and Zeebe, R. E.: An early Cenozoic perspective on greenhouse warming and carbon-cycle dynamics, Nature, 451, 279–283, https://doi.org/10.1038/nature06588, 2008.
Zhu, J., Poulsen, C. J., Otto-Bliesner, B. L., Liu, Z., Brady, E. C., and Noone, D. C.: Simulation of early Eocene water isotopes using an Earth system model and its implication for past climate reconstruction, Earth Planet. Sc. Lett., 537, 116164, https://doi.org/10.1016/j.epsl.2020.116164, 2020.
Zscheischler, J. and Lehner, F.: Attributing Compound Events to Anthropogenic Climate Change, B. Am. Meteorol. Soc., 103, E936–E953, https://doi.org/10.1175/BAMS-D-21-0116.1, 2022.