the Creative Commons Attribution 4.0 License.
the Creative Commons Attribution 4.0 License.
 | 15 Jan 2024
The Interdecadal Pacific Oscillation is responsible for the linkage of decadal changes in precipitation and moisture in arid central Asia and the humid Asian monsoon region during the last millennium
Hongna Xu
Huijun Wang
Reconstruction and observational studies imply a potential linkage of moisture and precipitation change in arid central Asia and monsoonal East Asia, in which the evolution of moisture and precipitation in central Asia is out of phase with that in northern China but in phase with that in southern China. In order to ascertain whether there is a robust linkage between the changes in climate in Asian arid regions and monsoon regions and to elucidate the underlying dynamic mechanisms, we analyzed the Last Millennium Reanalysis dataset and outputs from the Community Earth System Model Last Millennium Ensemble (CESM-LME). The results indicate a significant decadal linkage between precipitation changes in central Asia's arid region and the Asian monsoon region during the last millennium, which is primarily driven by the Interdecadal Pacific Oscillation (IPO). In spring, the positive IPO could enhance westerlies over the Mediterranean Sea and to its east, which could transport more water vapor and cause increased precipitation over central Asia. In summer, the positive IPO is accompanied by a weakened Asian monsoon and southward Asian subtropical westerly jet, which can lead to increased (decreased) summer precipitation over southern China (over northern China and South Asia). The IPO plays a dominant role in connecting the decadal variations in precipitation between arid central Asia and monsoonal Asia by modulating the precipitation of their respective major rainy seasons. Model results suggest that this decadal linkage stems entirely from the internal variability present in the CESM-LME control and all single-forcing simulations. Changes in external forcing factors do not alter this inherent linkage caused by the IPO. Moreover, based on analyses of the aridity index and soil moisture content, this relationship of precipitation variation also causes a similar decadal linkage of moisture changes in central Asia and monsoonal Asia. The differences in the multi-centennial-scale moisture and precipitation variations in the Asian arid region and the monsoon region between the Medieval Climate Anomaly and Little Ice Age are also likely caused by IPO-like sea surface temperature anomalies.
- Article
(12031 KB) - Full-text XML
-
Supplement
(5543 KB) - BibTeX
- EndNote


The climate of the middle- to low-latitude Asian continent is characterized by an arid central Asian region and a moist monsoonal region. The climate in central Asia is mainly controlled by westerlies as a result of its geographical location and blocking by plateaus and mountains to the southeast (Chen et al., 2010). The main rainy seasons are spring and winter, especially in southern central Asia (Aizen et al., 2001; Chen et al., 2011; Xu et al., 2020; Wang et al., 2022). By contrast, the climate in monsoonal Asia is mainly controlled by the East Asian monsoon and the South Asian monsoon. The main rainy season is summer as a result of the warm, moist East Asian summer monsoon (Ding and Chan, 2005) and the South Asian summer monsoon (Turner and Annamalai, 2012).
The Asian arid and monsoonal climates should be independent of each other due to the dominance of different systems. However, the reconstruction records suggest a strong linkage between them on a centennial scale. Chen et al. (2015) reviewed numerous reconstruction studies and indicated that the climate was relatively wetter in central Asia and southern China, whereas it was relatively drier in northern China during the Little Ice Age (LIA; 1400–1900 CE) (Fig. 1). During the earlier Medieval Climate Anomaly (MCA; 1000–1300 CE), the wet and dry changes were the opposite, with drier conditions in central Asia and southern China and wetter conditions in northern China.
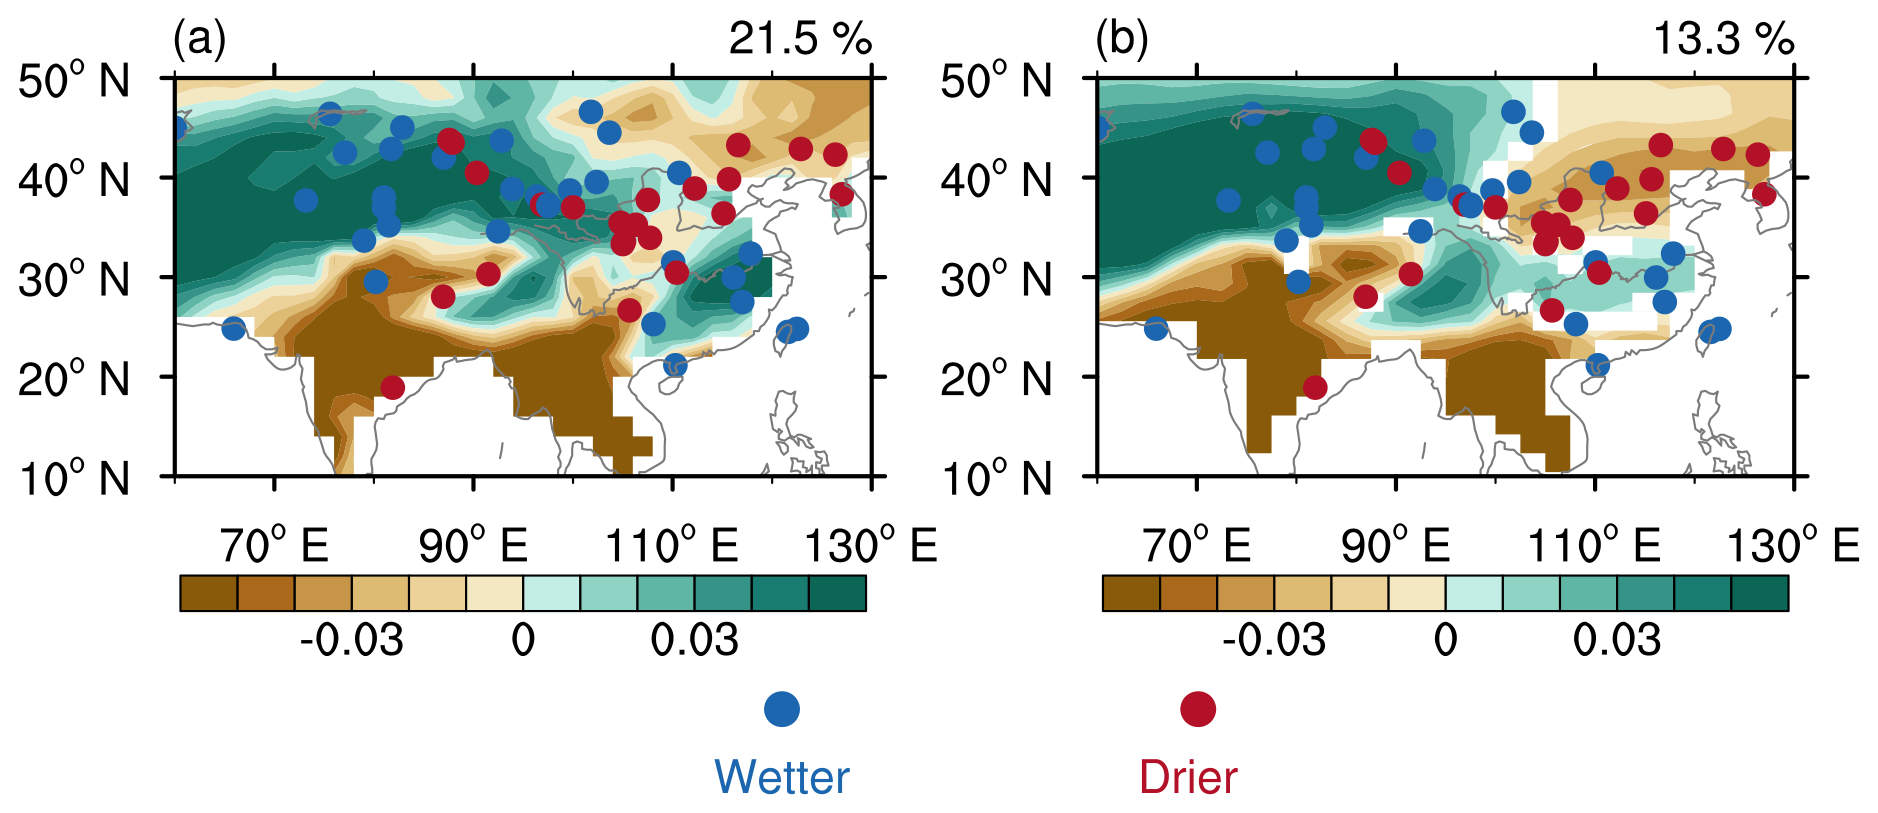
Figure 1The reconstructed and simulated first leading precipitation mode. (a) The first leading mode (EOF1) of the 9-year low-pass Lanczos-filtered annual precipitation for the time period 850–2000 in the Last Millennium Reanalysis (LMR) dataset. The explained variance is given at the top right. (b) The average EOF1 of the 9-year low-pass Lanczos-filtered annual precipitation in 12 CESM-LME all-forcing simulations for the time period 850–2005; the shading shows where at least two-thirds of the members agree on the sign of the average value. The average explained variance is given at the top right. The dots represent the reconstructed precipitation and moisture records modified from Chen et al. (2015); the blue (red) dots denote wetter (drier) conditions in the LIA than in the MCA.
Clues to the linkage between the climate of the Asian arid regions and the Asian monsoon regions can also be found based on the limited length of observational data from the modern era. Since the mid-20th century, central Asia has become wetter (Shi et al., 2007; Jiang et al., 2009; Chen et al., 2011; Huang et al., 2013). During the same period, southern China experienced more precipitation, whereas northern China received less precipitation and became drier (Ding et al., 2008; Zhao et al., 2010; Wang et al., 2013). Focusing on two different climatic regions, the precipitation observations during the period of 1960–2010 also show similar linkage (Huang et al., 2015). On a decadal scale, central Asia experienced more (less) summer precipitation, southern China received more (less) summer precipitation, and northern China received less (more) summer precipitation.
However, the reconstruction records of the last millennium and the 50-year observational data only cover fewer than two periods on the multi-centennial or interdecadal scale, respectively. It is not sufficient to demonstrate a significant relationship between the climate of the Asian arid regions and the Asian monsoon regions. The specific mechanisms behind this possible linkage are still not clear. In addition, modeling results also indicate that only one out of nine coupled models within the Paleoclimate Modeling Intercomparison Project Phase 3 (PMIP3) is able to reproduce the similar climatic linkage between the Asian arid and monsoonal regions during the MCA and LIA (Shi et al., 2016). Due to the limitations of data length on the timescales of interest and the large uncertainty in existing model results, further research is still needed to confirm whether there is an inherent connection between the arid regions and monsoon regions in Asia in terms of their dry–wet variations.
In this study, we first focus on the decadal scale and intend to analyze whether there is a robust linkage between the changes in precipitation pattern in arid regions and monsoon regions in Asia using the newly released Last Millennium Reanalysis (LMR) dataset (Tardif et al., 2019a; Anderson et al., 2019). Additionally, to further explore the possible mechanisms underlying the linkage and the potential impacts of different external forcing factors, the Community Earth System Model Last Millennium Ensemble (CESM-LME, Otto-Bliesner et al., 2016a) is also utilized because of its good performance in simulating Asian precipitation and the summer monsoon (e.g., Hu et al., 2023; Mishra and Aadhar, 2021; Shi et al., 2018) as well as the availability of multiple samples forced by different forcing factors. Thus, the aim of this study is to investigate the linkage between precipitation and moisture changes in arid central Asia and monsoonal Asia during the last millennium and its driving factors. The data and methods used in this study are described in detail in Sect. 2. The linkage between the changes in the precipitation and moisture pattern in arid regions and monsoon regions in Asia is examined, and its driving factors are analyzed in Sect. 3. Finally, a discussion and conclusions are presented in Sects. 4 and 5, respectively.
2.1 Reanalysis data and simulations
In this study, we used the reconstructed annual precipitation anomalies (relative to the climatological mean of 1951–1980) at a spatial resolution of 2∘ for the time period 850–2000 from the LMR Version 2.1 dataset (Tardif et al., 2019a; Anderson et al., 2019) to examine the possible linkage between the Asian arid and monsoonal regions. The proxy records assimilated in the LMR Version 2.1 dataset are from PAGES-2k (PAGES2k Consortium, 2017). The analyses based on LMR were started with the “grand mean”, which was an average of 20 LMR reconstructions contained in the aforementioned array. In addition, the reconstructed sea surface temperature (SST) anomalies from the LMR Version 2.1 dataset are also used to verify the model results.
In order to investigate the underlying mechanisms, we analyzed the monthly outputs of the CESM-LME project (Otto-Bliesner et al., 2016a). The CESM-LME simulations are performed using CESM 1.1, in which the atmospheric component is the Community Atmosphere Model Version 5 (CAM5) (Hurrell et al., 2013). The atmosphere and land (ocean and sea ice) components in the CESM-LME simulations have the same ∼ 2∘ (∼ 1∘) horizontal resolutions as CESM1.1. We analyzed a total of 35 CESM-LME simulations: one control simulation, 12 all-forcing simulations, and 22 single-forcing simulations. The single-forcing simulations included a subset of five simulations forced by volcanic eruptions, a subset of four simulations forced by solar activity, a subset of four simulations forced by ozone and aerosols, and three subsets of three simulations forced by greenhouse gases, land use and land cover, and the Earth's orbit, respectively. The subset of simulations forced by ozone and aerosols covered the time period 1850–2005, whereas the other simulations were available for the time period 850–2005. The analyses for the all-forcing simulations and the six subsets of single-forcing simulations were all based on the arithmetic mean of multiple members, which was the final step in the analyses.
In addition, we also referred to reconstructed moisture and precipitation changes (relative to the median of the entire last millennium) in the LIA and MCA summarized by Chen et al. (2015). The reconstructions synthesized by Chen et al. (2015) include 71 moisture and precipitation records derived from different types of proxy records (i.e., lake records, speleothem records, historical documents, tree-ring records, ice-core records, marine records, peat records, aeolian records, and river terraces). Based on these moisture and precipitation records, Fig. 3 in Chen et al. (2015) provides the wetness grades (i.e., the wetness was classified into dry, moderately dry, moderate, moderately wet, and wet) for the LIA and MCA at individual sites. A total of 55 moisture and precipitation records with different wetness grades between the LIA and MCA were selected in this study to explore the moisture and precipitation changes between these two periods.
2.2 Methods
Following Henley et al. (2015), we defined the Interdecadal Pacific Oscillation (IPO) index as the difference between the SST anomalies averaged over the central–eastern equatorial Pacific (10∘ S–10∘ N, 170∘ E–90∘ W) and the average of the SST anomalies over the western–central subtropical North Pacific (25–45∘ N, 140∘ E–145∘ W) as well as the western–central subtropical South Pacific (50–15∘ S, 150∘ E–160∘ W). The base period for calculating the IPO index was 1850–1900. To obtain the filtered version of the index, a 9-year low-pass Lanczos filter was used, coinciding with the other analyses in this study.
We used the aridity index (AI) to quantify the moisture condition of the terrestrial climate (Middleton and Thomas, 1997):
where P is the annual precipitation (units: mm d−1), representing the water supply to land, and PET is the annual potential evapotranspiration (units: mm d−1), which measures the atmospheric demand of water. A larger aridity index indicates that relatively more moisture remains in the land, whereas a smaller aridity index represents drier conditions. The outputs of the CESM-LME simulations for soil moisture (top 10 cm of soil; units: kg m−2) were also analyzed to examine the analyses based on the aridity index. Thus, the analyses related to moisture conditions in this study were based on both the aridity index and soil moisture content.
The Penman–Monteith algorithm (Penman, 1948; Monteith, 1965) is widely used to estimate potential evapotranspiration and is recommended as a standard method by the Food and Agriculture Organization of the United Nations (Allen et al., 1998):
where Rn is the net surface radiation (units: MJ m−2 d−1), and G is the soil heat flux density (units: MJ m−2 d−1); the difference between them represents the available energy. γ is the psychrometric constant (units: kPa ∘C−1), Tmean is the mean temperature (units: ∘C; i.e., the average of the 2 m daily maximum and daily minimum air temperatures), Δ is the slope vapor pressure curve (units: kPa ∘C−1) derived from Tmean, U is the 2 m wind speed (units: m s−1), es is the saturation vapor pressure (units: kPa) derived from the daily maximum and daily minimum air temperatures, and ea is the actual vapor pressure (units: kPa) calculated from es and the relative humidity.
Empirical orthogonal function (EOF) analysis was performed on the standardized annual precipitation to identify the first leading precipitation mode over the Asian continent. A 9-year low-pass Lanczos filter was applied to the standardized precipitation before EOF analysis to remove the variability on interannual and shorter timescales. The same analyses were also applied to the aridity index and the annual soil moisture content to obtain the first leading decadal moisture mode over the Asian continent. Linear regression and correlation analyses were applied to understand the root cause of the leading decadal precipitation and moisture modes, and their statistical significance was examined by a two-sided t test. Because of the low-pass Lanczos filter before linear regression and correlation analyses, the effective degree of freedom N* in the t test was calculated following Bretherton et al. (1999):
where ra (rb) is the autocorrelation at lag 1 for variable a (b), and N is the original length of the time series. A two-sided t test was also applied to examine the statistical significance of climate changes between the LIA and the MCA. In addition, the consistency of results derived from multiple members (i.e., analyses based on all-forcing simulations and the six subsets of single-forcing simulations) was examined by counting the percentage of members whose results' signs are the same as the arithmetic mean of multiple members. A power spectrum analysis was performed on the time series of the leading precipitation mode and the IPO index to obtain their dominant periodicity, the statistical significance of which was examined via the power spectrum of the mean red noise (Gilman et al., 1963).
In this study, winter, spring, summer, and autumn were defined as December–February, March–May, June–August, and September–November, respectively.
3.1 Reconstructed and simulated first leading precipitation mode
Based on the LMR data, the first leading mode (EOF1) of the decadal changes in Asian precipitation in the last millennium showed the same changes in precipitation in arid central Asia and southern China, which were the opposite of those in the South Asian monsoon region (including the southern Tibetan Plateau, the Indian Peninsula, and the Indo-China Peninsula) and most of northern China (Fig. 1a). This mode accounted for 21.5 % of the total variance of precipitation in Asia in the last millennium.
We also analyzed the outputs of the CESM-LME simulations. In the all-forcing simulations, most members reproduced similar first leading precipitation modes with the reconstruction for the time period 850–2005 (Supplement Fig. S1). Their ensemble pattern was also consistent with the reconstruction (Fig. 1b). The average explained variance was 13.3 % (ranging from 11.7 % to 14.8 %). These same patterns of changes in precipitation between the long-term simulations and the reconstruction suggest that, on the decadal scale, there is a robust linkage between the changes in precipitation pattern in arid regions and monsoon regions. This decadal linkage suggests that the evolution of precipitation in central Asia is out of phase with that in northern China and the South Asian monsoon region but in phase with that in southern China. The linkage between the arid central Asian region and the East Asian monsoon region is consistent with the relationship of changes in precipitation based on observational data for the last 60 years (Huang et al., 2015). Our analysis suggests that this observed relationship has persisted over the last millennium. Our results also indicated that the decadal changes in precipitation in the South Asian monsoon region are closely related to the changes in the arid central Asian region and the East Asian monsoon region.
3.2 Dominant role of the IPO
Many studies have shown that the SST anomaly is an important factor in modulating the decadal variability in precipitation over Asia (e.g., Chu et al., 2018; Huang et al., 2019). We therefore calculated the linear regression of the SST onto the time series of the leading precipitation mode. Figure 2a and c show that higher (lower) SSTs appeared over the central–eastern equatorial Pacific (the western–central parts of both the subtropical North Pacific and South Pacific) in the LMR and all-forcing simulations. The Pacific basin-wide SST anomalies resembled the positive pattern of the IPO (Power et al., 1999; Henley et al., 2015; Wang and Miao, 2018). The precipitation anomalies during the positive phases of the IPO showed positive anomalies in arid central Asia and southern China and negative anomalies in the South Asian monsoon region and most of northern China (Fig. 2b and d), resembling the leading decadal precipitation mode in the LMR and all-forcing simulations. It is therefore likely that the IPO dominated the decadal linkage between the changes in precipitation pattern in arid regions and monsoon regions in Asia.
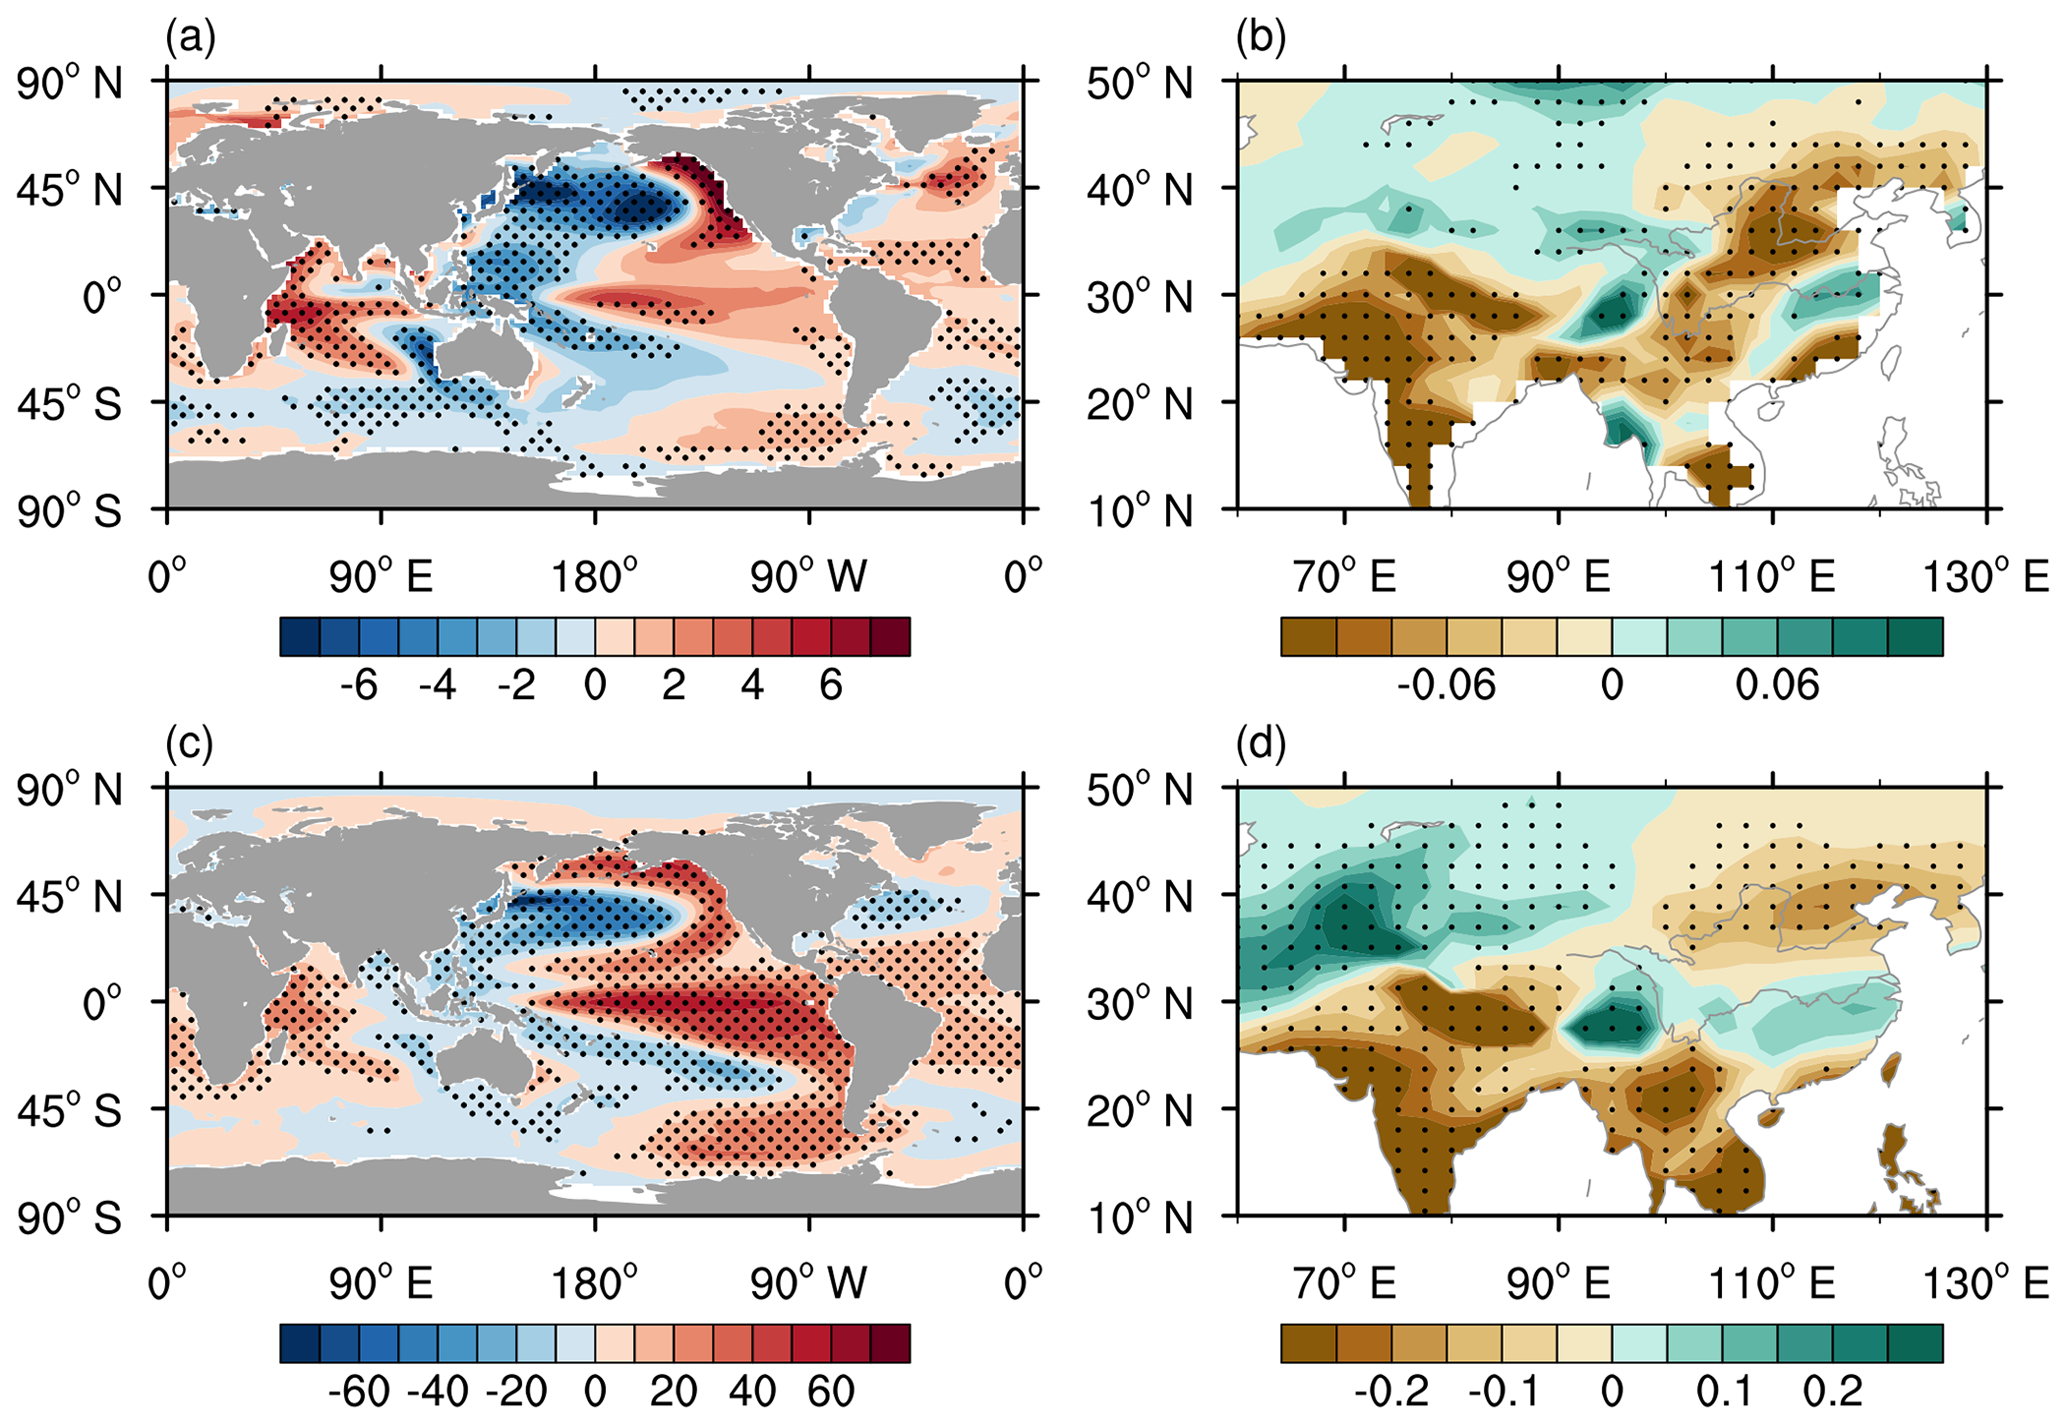
Figure 2The dominant role of the IPO. The reconstructed (a) annual SST anomalies (units: ∘C) regressed onto the time series of the leading decadal precipitation mode and (b) annual precipitation anomalies (units: mm d−1) regressed onto the time series of the IPO index in the LMR dataset. The dots in panels (a) and (b) show significant anomalies at the 95 % confidence level. (c) Annual SST anomalies (units: ∘C) regressed onto time series of the leading decadal precipitation mode and (d) annual precipitation anomalies (units: mm d−1) regressed onto the time series of the IPO index simulated by multiple members of the CESM-LME all-forcing runs. Dots in panels (c) and (d) show that at least two-thirds of the members simulate significant changes (at the 95 % significance level), and these significant changes agree on the sign of the average of multiple members.
We applied power spectrum analysis to explore the temporal characteristics of the first leading precipitation mode and the IPO. Both the leading precipitation mode and the IPO had a common frequency band of 10–20 years in the LMR and all-forcing simulations (Figs. S2–S4), indicating that the IPO dominated the linkage between the changes in precipitation pattern in arid regions and monsoon regions in Asia at decadal to bi-decadal scales during the last millennium. The consistency between the reconstruction and the simulations indicates the reliability of the simulations, which is the foundation of the following analyses on the relevant mechanism based on simulations.
3.3 Processes of the IPO modulating the leading precipitation pattern
Because there is a seasonal cycle in precipitation and the atmospheric circulation over Asia, especially over monsoonal Asia, we analyzed the seasonal changes in precipitation associated with the IPO. During the positive phases of the IPO, in arid central Asia, the precipitation in all four seasons increased and made a positive contribution to the increase in annual precipitation (Fig. 3). The precipitation anomalies were larger in spring and winter, especially in spring, in which the precipitation accounted for most of the annual precipitation (Fig. S5). The largest increase in spring precipitation was mainly in southern central Asia. In East Asia, summer precipitation increased (decreased) over southern (northern) China and autumn precipitation decreased over northern China, both contributing positively to the annual changes in precipitation. By contrast, spring and winter precipitation decreased over southern China, partly offsetting the positive contribution of summer precipitation to the increase in annual precipitation in this region. Precipitation in all four seasons decreased in most of the South Asian monsoon regions, contributing positively to the decrease in annual precipitation. Then, we analyzed the seasonal atmospheric circulation anomalies associated with the IPO to determine the processes by which the IPO modulated these seasonal changes in precipitation.
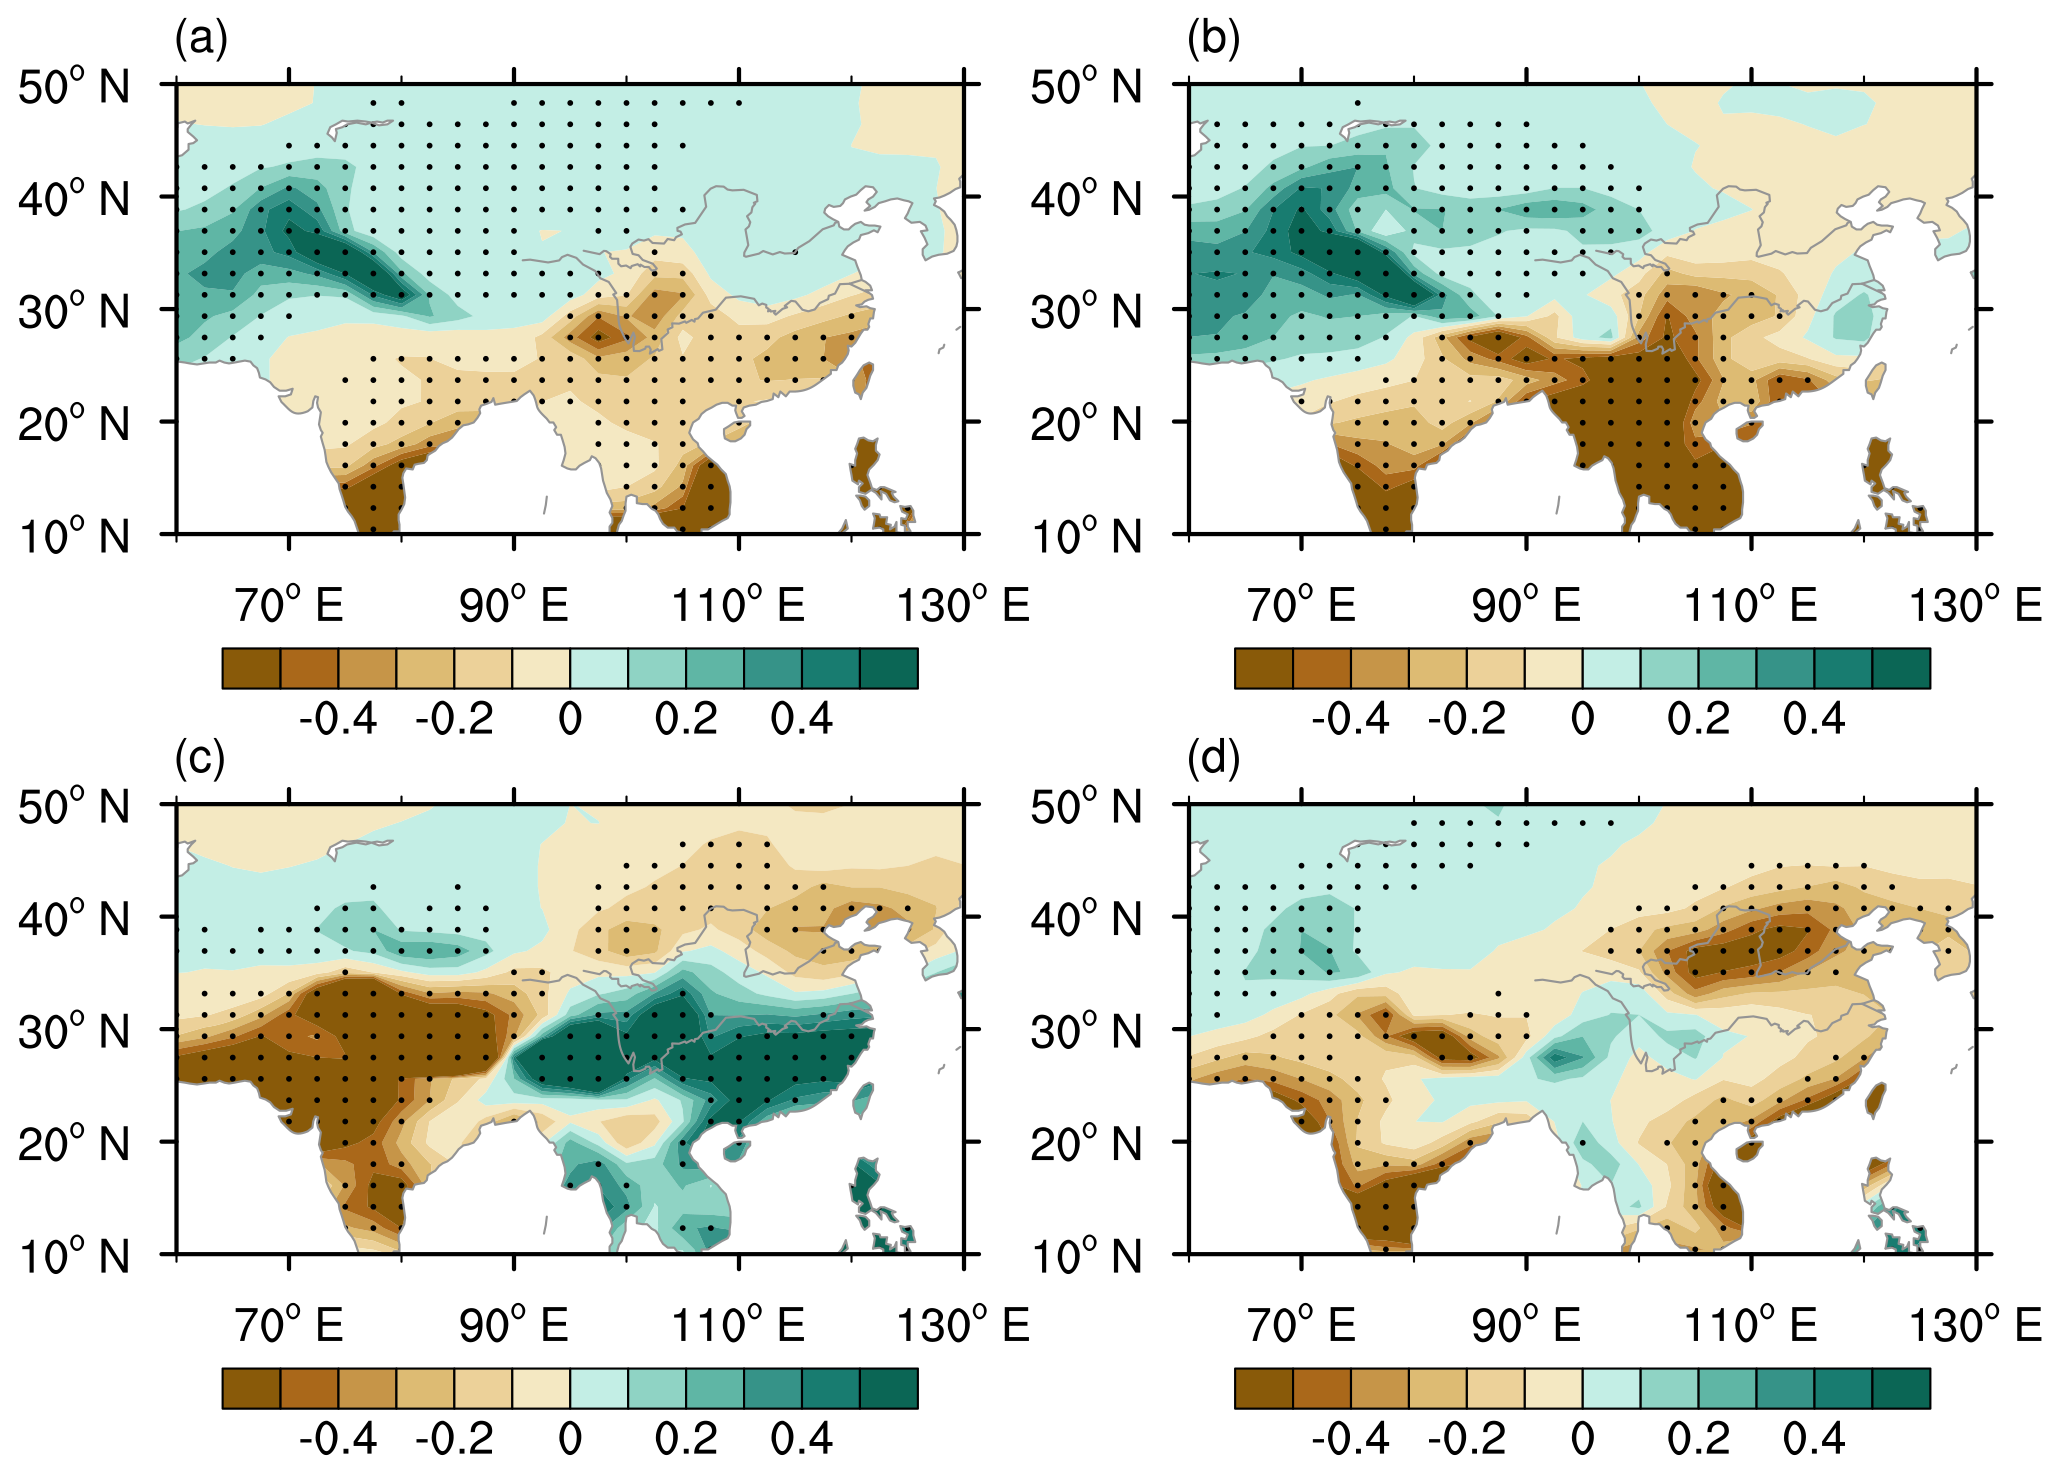
Figure 3Simulated seasonal precipitation anomalies during the positive phases of the IPO. Regressed maps of (a) winter, (b) spring, (c) summer, and (d) autumn precipitation anomalies (units: mm d−1) onto the time series of the IPO index simulated by multiple members of the CESM-LME all-forcing runs. Dots show that at least two-thirds of the members simulate significant changes (at the 95 % significance level), and these significant changes agree on the sign of the average of multiple members.
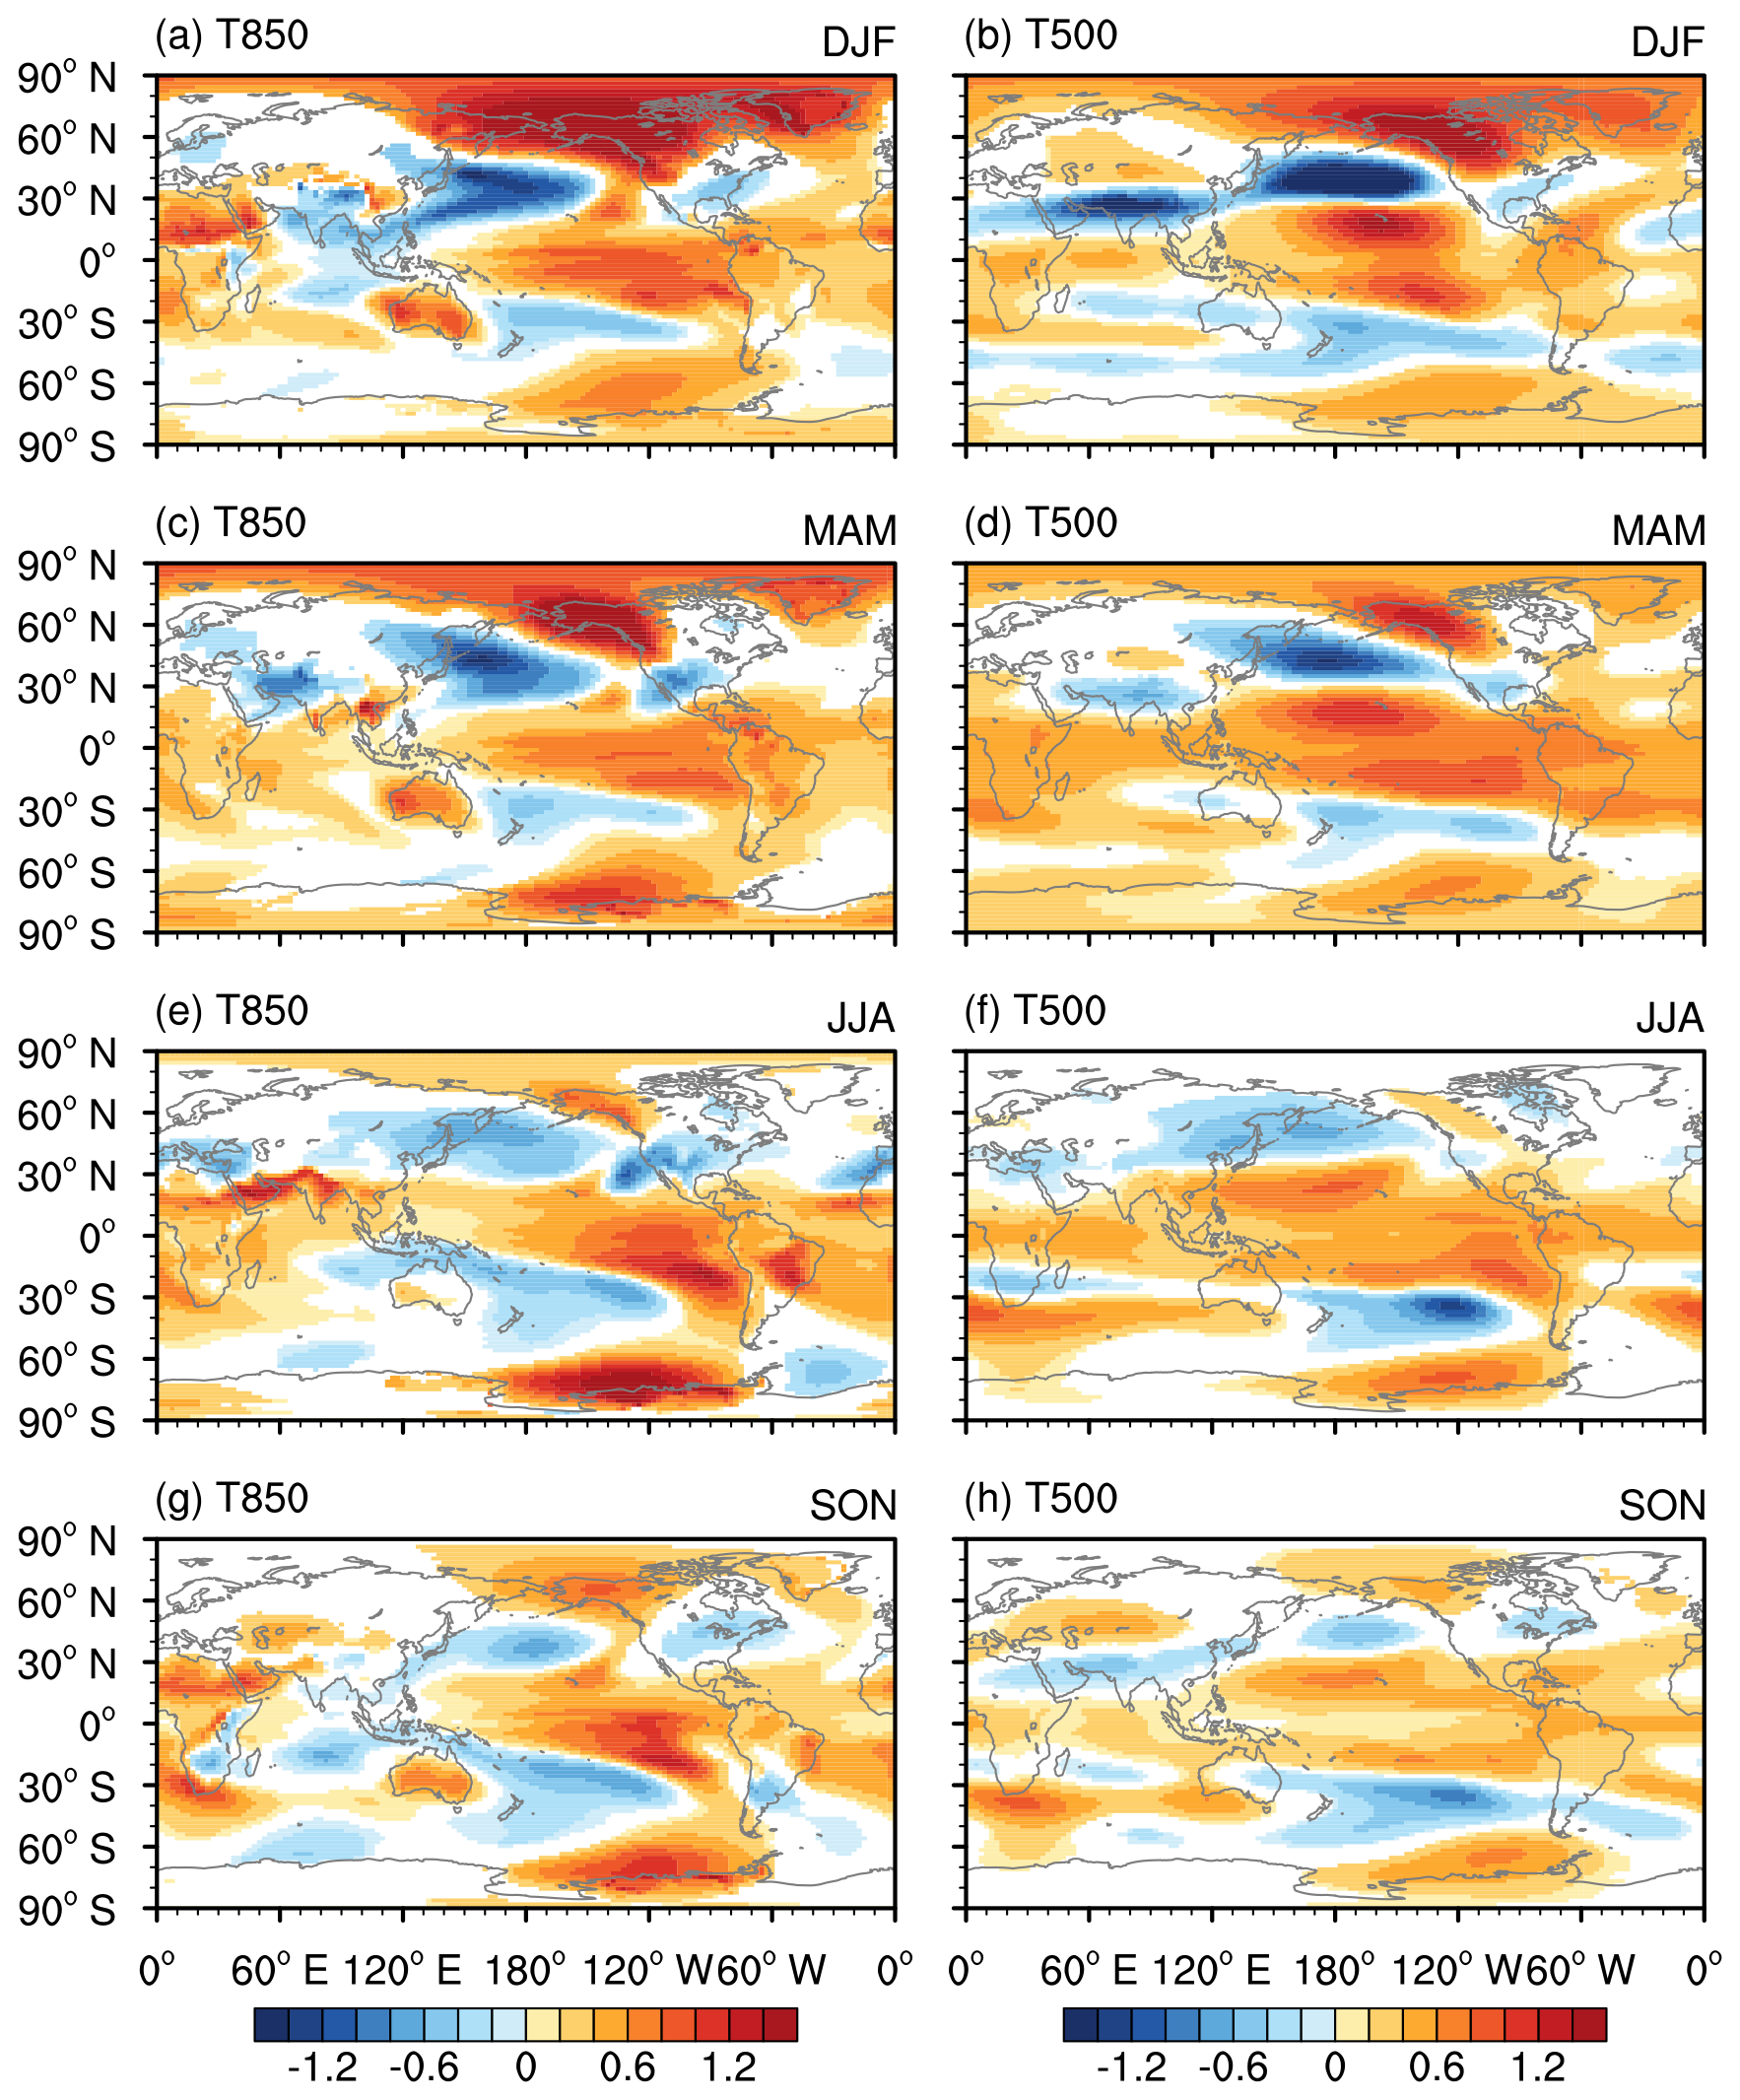
Figure 4Simulated seasonal temperature anomalies during the positive phases of the IPO. Regressed maps of 850 hPa temperature anomalies (units: ∘C) in (a) winter, (c) spring, (e) summer, and (g) autumn onto the time series of the IPO index simulated by multiple members of the CESM-LME all-forcing runs. (b) Winter, (d) spring, (f) summer, and (h) autumn for 500 hPa temperature anomalies (units: ∘C). Shading shows that at least two-thirds of the members simulate significant changes (at the 95 % significance level), and these significant changes agree on the sign of the average of multiple members.
3.3.1 Arid central Asia
In spring, warming appeared over the northern low and high latitudes, whereas cooling appeared over the northern midlatitudes, especially in the eastern hemisphere, corresponding to a positive phase of the IPO (Fig. 4c and d). The tropospheric temperature anomalies led to an enhanced (weakened) meridional temperature gradient over low (high) latitudes as the climatological temperature decreased from low to high latitudes. The anomalies in the temperature gradient contributed to enhanced westerlies over low latitudes and weakened westerlies over high latitudes via the thermal wind relation (Fig. 5c and d), indicating a southward shift of the midlatitude westerlies. The enhanced westerlies over the Mediterranean Sea and to its east transported more water vapor from the Mediterranean Sea to southern central Asia (Fig. 5a).
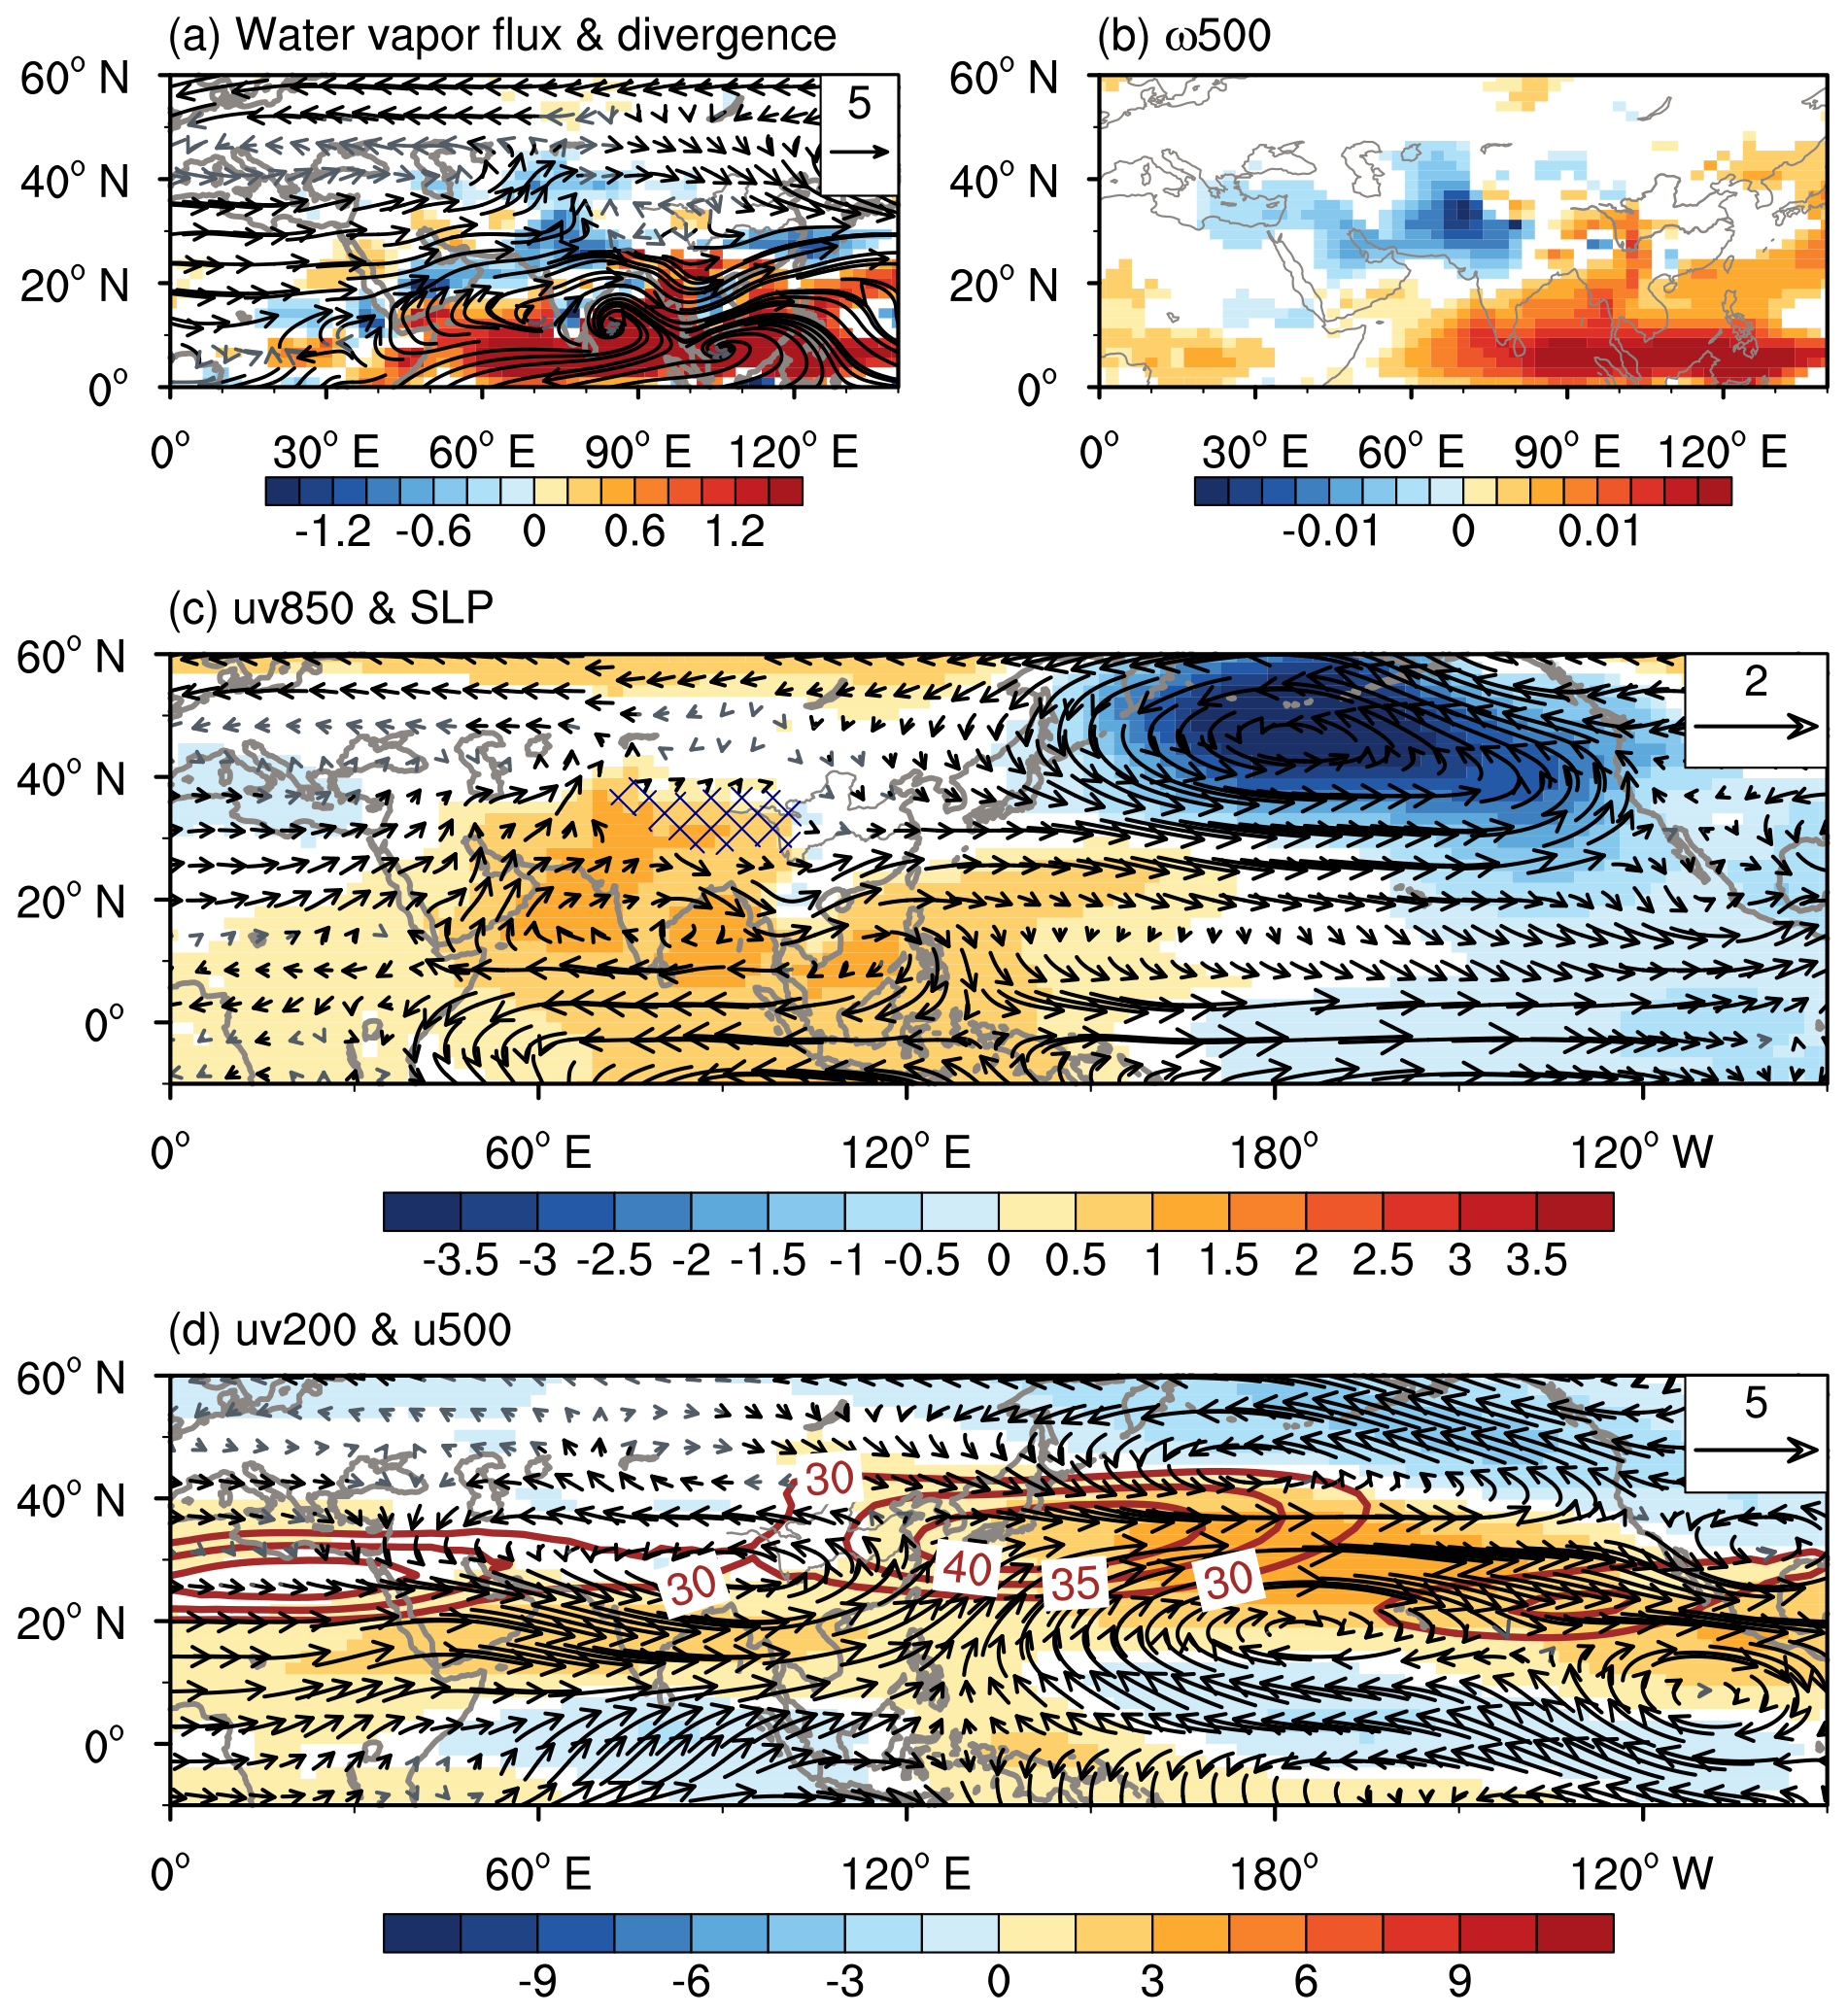
Figure 5Simulated spring atmospheric circulation anomalies during the positive phases of the IPO. Regressed maps of anomalous (a) vertically integrated water vapor flux from 1000 to 300 hPa (vectors; units: kg m−1 s−1) and its divergence (shading; units: 10−5 kg m−2 s−1), (b) 500 hPa vertical velocity (ω500) (units: Pa s−1), (c) 850 hPa wind (uv850) (vectors; units: m s−1) and SLP (shading; units: hPa), and (d) 200 hPa wind (uv200) (vectors; units: m s−1) and 500 hPa zonal wind (u500) (shading; units: m s−1) onto the time series of the IPO index simulated by the CESM-LME all-forcing runs. The blue hatched patterns in panel (c) indicate the region with an altitude > 3000 m. The brown contours in panel (d) are the climatological 200 hPa zonal wind (units: m s−1). The shading shows that at least two-thirds of the members simulate significant changes (at the 95 % significance level), and these significant changes agree on the sign of the average of multiple members. The black vectors show that for the zonal or meridional component, at least two-thirds of the members simulate significant changes (at the 95 % significance level), and these significant changes agree on the sign of the average.
Positive sea level pressure (SLP) anomalies appeared over the Indo-western Pacific warm pool and negative SLP anomalies appeared over the eastern tropical Pacific (Fig. 5c), consistent with the SST anomalies during positive IPO phases. The distribution of the SLP anomalies indicated a weakened Walker circulation over the Pacific Ocean, which further led to suppressed convection over the Maritime Continent (Li et al., 2022). The decreased latent heating associated with the decreased precipitation over the Maritime Continent can produce westward-propagating baroclinic Rossby wave trains (Jiang et al., 2021). This resulted in an anomalous low-level anticyclone and upper-level cyclone over the Indian subcontinent, both of which led to anomalous southerlies over central Asia (Fig. 5c and d). The anomalous southerlies induced warm advection and led to anomalous ascending motion in this region (Fig. 5b). In addition, the anomalous southerlies in the low troposphere could also transport more water vapor from low latitudes to central Asia (Fig. 5a). The enhanced transport of water vapor and the anomalous ascending motion both favored increased precipitation in spring over central Asia. In summary, the IPO affected the precipitation from westerly winds by modulating the midlatitude westerlies and the Walker circulation in the Pacific Ocean.
The circulation anomalies associated with the IPO in winter were similar to those in spring (Fig. S6), indicating that the processes by which the IPO modulated winter precipitation in central Asia were similar to those in spring.
3.3.2 Asian monsoon regions
In summer, higher (lower) SLPs appeared over most of the Asian continent (northern Pacific) during the positive phases of the IPO (Fig. 6c). This was the reverse of the climatological state, in which the SLP over most of the Asian continent was lower than that over the neighboring oceans. A weakened land–sea thermal contrast was therefore induced. The weakened land–sea thermal contrast led to a weakened Asian summer monsoon (ASM), featured by northerly anomalies at 850 hPa over the whole of monsoonal Asia (Fig. 6c). The northerly anomalies further led to weakened water vapor transport in this region (Fig. 6a).
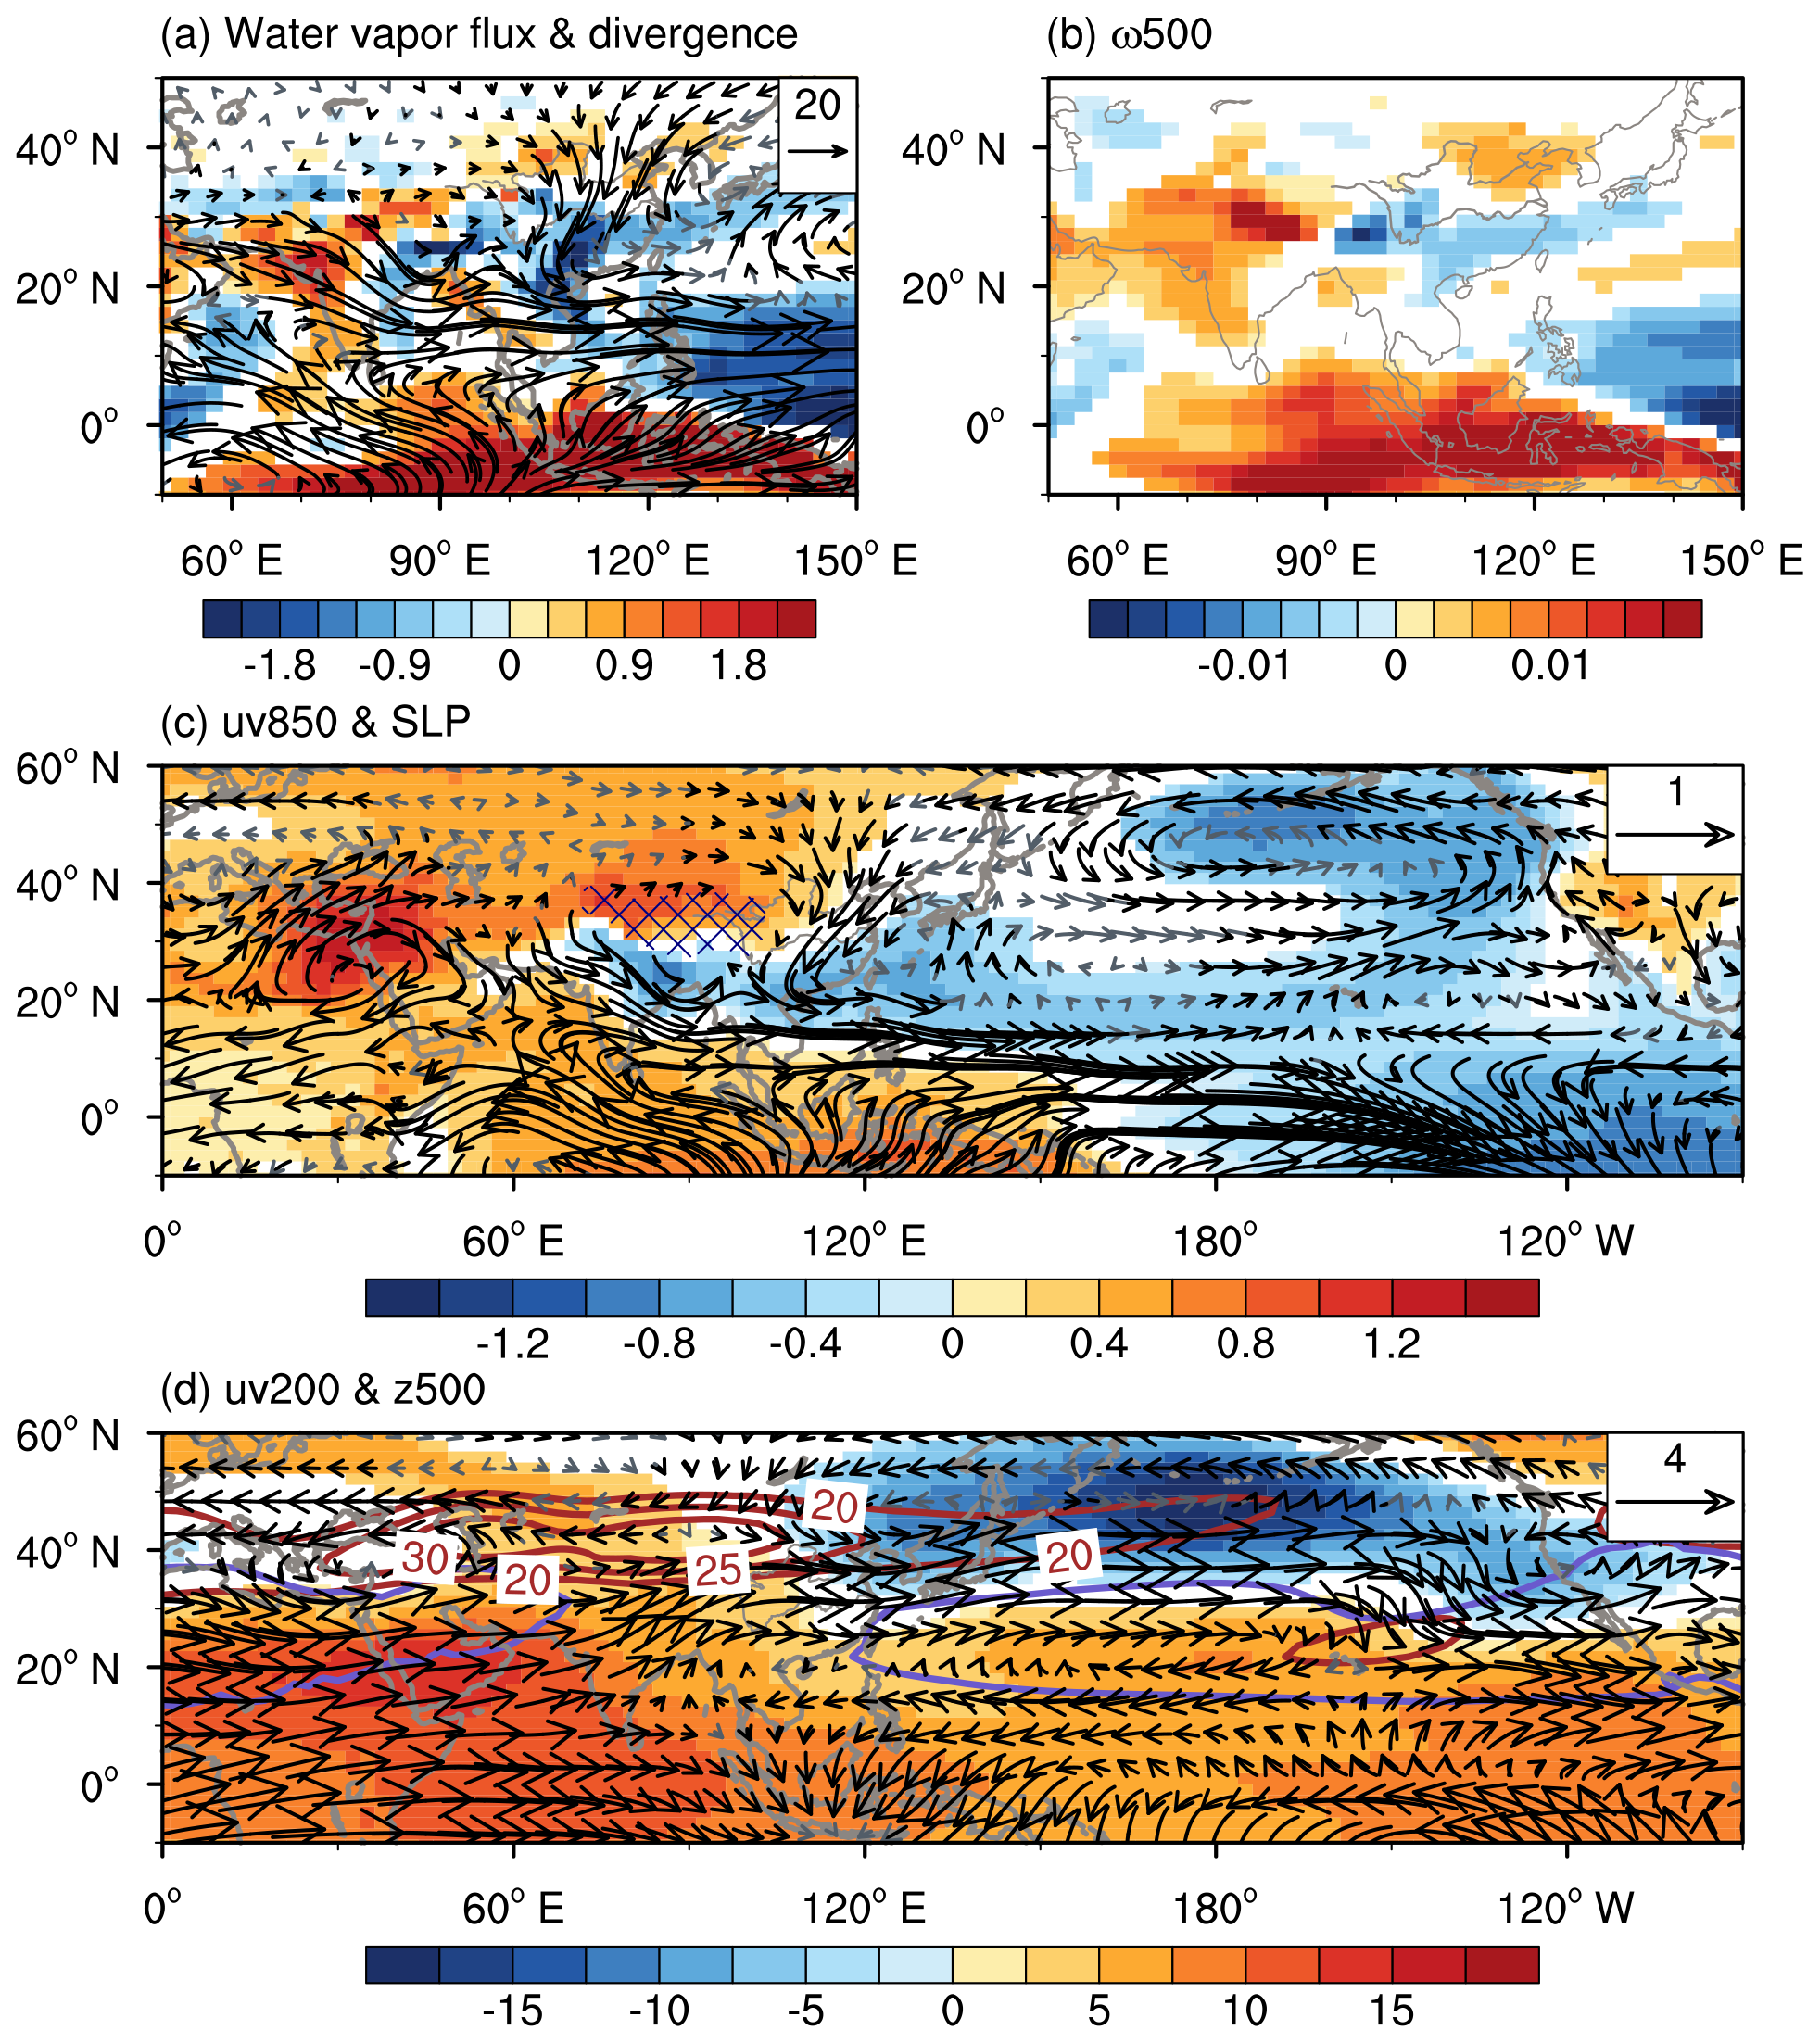
Figure 6Simulated summer atmospheric circulation anomalies during the positive phases of the IPO. Regressed maps of anomalous (a) vertically integrated water vapor flux from 1000 to 300 hPa (vectors; units: kg m−1 s−1) and its divergence (shading; units: 10−5 kg m−2 s−1), (b) 500 hPa vertical velocity (ω500) (units: Pa s−1), (c) 850 hPa wind (uv850) (vectors; units: m s−1) and SLP (shading; units: hPa), and (d) 200 hPa wind (uv200) (vectors; units: m s−1) and 500 hPa geopotential height (z500) (shading; units: m) onto the time series of the IPO index simulated by the CESM-LME all-forcing runs. The blue hatched patterns in panel (c) indicate the region with an altitude > 3000 m. The brown contours in panel (d) are the climatological 200 hPa zonal wind (units: m s−1). The purple line in panel (d) is the isoline with a value of 5860 m in the climatology state. The shading shows that at least two-thirds of the members simulate significant changes (at the 95 % significance level), and these significant changes agree on the sign of the average of multiple members. The black vectors show that for the zonal or meridional component, at least two-thirds of the members simulate significant changes (at the 95 % significance level), and these significant changes agree on the sign of the average.
Anomalies also appeared in the tropospheric temperature (Fig. 4e and f) and caused westerly (easterly) anomalies over the south (north) of the climatological Asian subtropical westerly jet at 200 hPa (Fig. 6d). The wind anomalies indicated a southward shift in the Asian subtropical westerly jet and associated secondary meridional–vertical circulation (Cressman, 1981; Ding, 2005; Zhang and Huang, 2011), which led to anomalous downward motion over northern China and anomalous upward motion over southern China (Fig. 6b) (Wang et al., 2013; Zhu et al., 2015). The western Pacific subtropical high shifted southeastward (Fig. 6d), which did not favor the transport of water vapor to northern China (Fig. 6a). These circulation anomalies all indicate a weakened ASM system (Webster and Yang, 1992; Wang, 2001). Precipitation over southern China therefore increased in summer, whereas precipitation over northern China and most of the South Asian monsoon regions decreased. In summary, the IPO affected monsoon precipitation by modulating the ASM system.
In autumn, negative anomalies in the 500 hPa geopotential height appeared over the Korean Peninsula (Fig. S7d), indicating a strengthened East Asian trough (EAT) during the positive phases of the IPO (Qin et al., 2018, 2020; Li et al., 2020). The strengthened EAT contributed to northerly anomalies over East Asia (Fig. S7c), which led to weakened water vapor transport in this region (Fig. S7a). The anomalous northerlies to the west of the strengthened EAT induced cold advection (Fig. S7c and S7d) and led to anomalous descending motion over northern China (Fig. S7b). Precipitation therefore decreased over northern China in autumn.
Consistent with the SST anomalies during the positive phases of the IPO, positive (negative) SLP anomalies appeared over the Indo-western Pacific warm pool (eastern tropical Pacific) in all four seasons (Figs. 5c, 6c, S6c, and S7c), indicating a weakened Walker circulation in the Pacific Ocean, which is in agreement with the results in Dong and Lu (2013) and Zhao et al. (2021). This weakened Walker circulation contributed to decreased precipitation over most of the South Asian monsoon regions (Krishnamurthy and Krishnamurthy, 2014; Li et al., 2021).
3.4 Decisive role of internal variability
Many studies have suggested that both external forcings and internal variability could affect the decadal variability of precipitation over Asia (e.g., Wang et al., 2013; Jin et al., 2019; Zhu et al., 2022). To identify the roles of internal variability and external forcing, Fig. 7 shows the first leading decadal precipitation modes of the control and single-forcing simulations. The decadal linkage between the changes in precipitation pattern in central Asia and monsoonal Asia in the all-forcing simulations also appeared in the control simulation (Fig. 7a), implying this decadal linkage was mainly caused by the internal variability. Nearly all the single-forcing simulations presented similar decadal linkage to all-forcing simulations, apart from the simulations forced by ozone and aerosols (Fig. 7b–g). This indicated that, during the last millennium, volcanic eruptions, solar activity, greenhouse gases, land use and land cover, and the Earth's orbit were unable to change the decadal linkage between the changes in precipitation pattern in arid regions and monsoon regions in Asia, which was dominated by the internal variability. Only in the ozone and aerosol forcing simulations, which covered the period of 1850–2005, did the decadal linkage of precipitation changes disappear. We further examined the results of other forcing simulations for the period of 1850–2005 (Fig. S8), and all the first decadal precipitation modes simulated by other forcing experiments still indicated similar decadal linkage to all-forcing last millennium simulations. This meant that since the industrial revolution, only the ozone and aerosol forcing factors have been able to change the dominant mode of the reverse variation of precipitation in East Asia from north to south and present stronger local climate effects. As noted by Wang et al. (2013), it may be that anthropogenic aerosols play a more important role in regulating precipitation in East Asia, which needs further analysis.
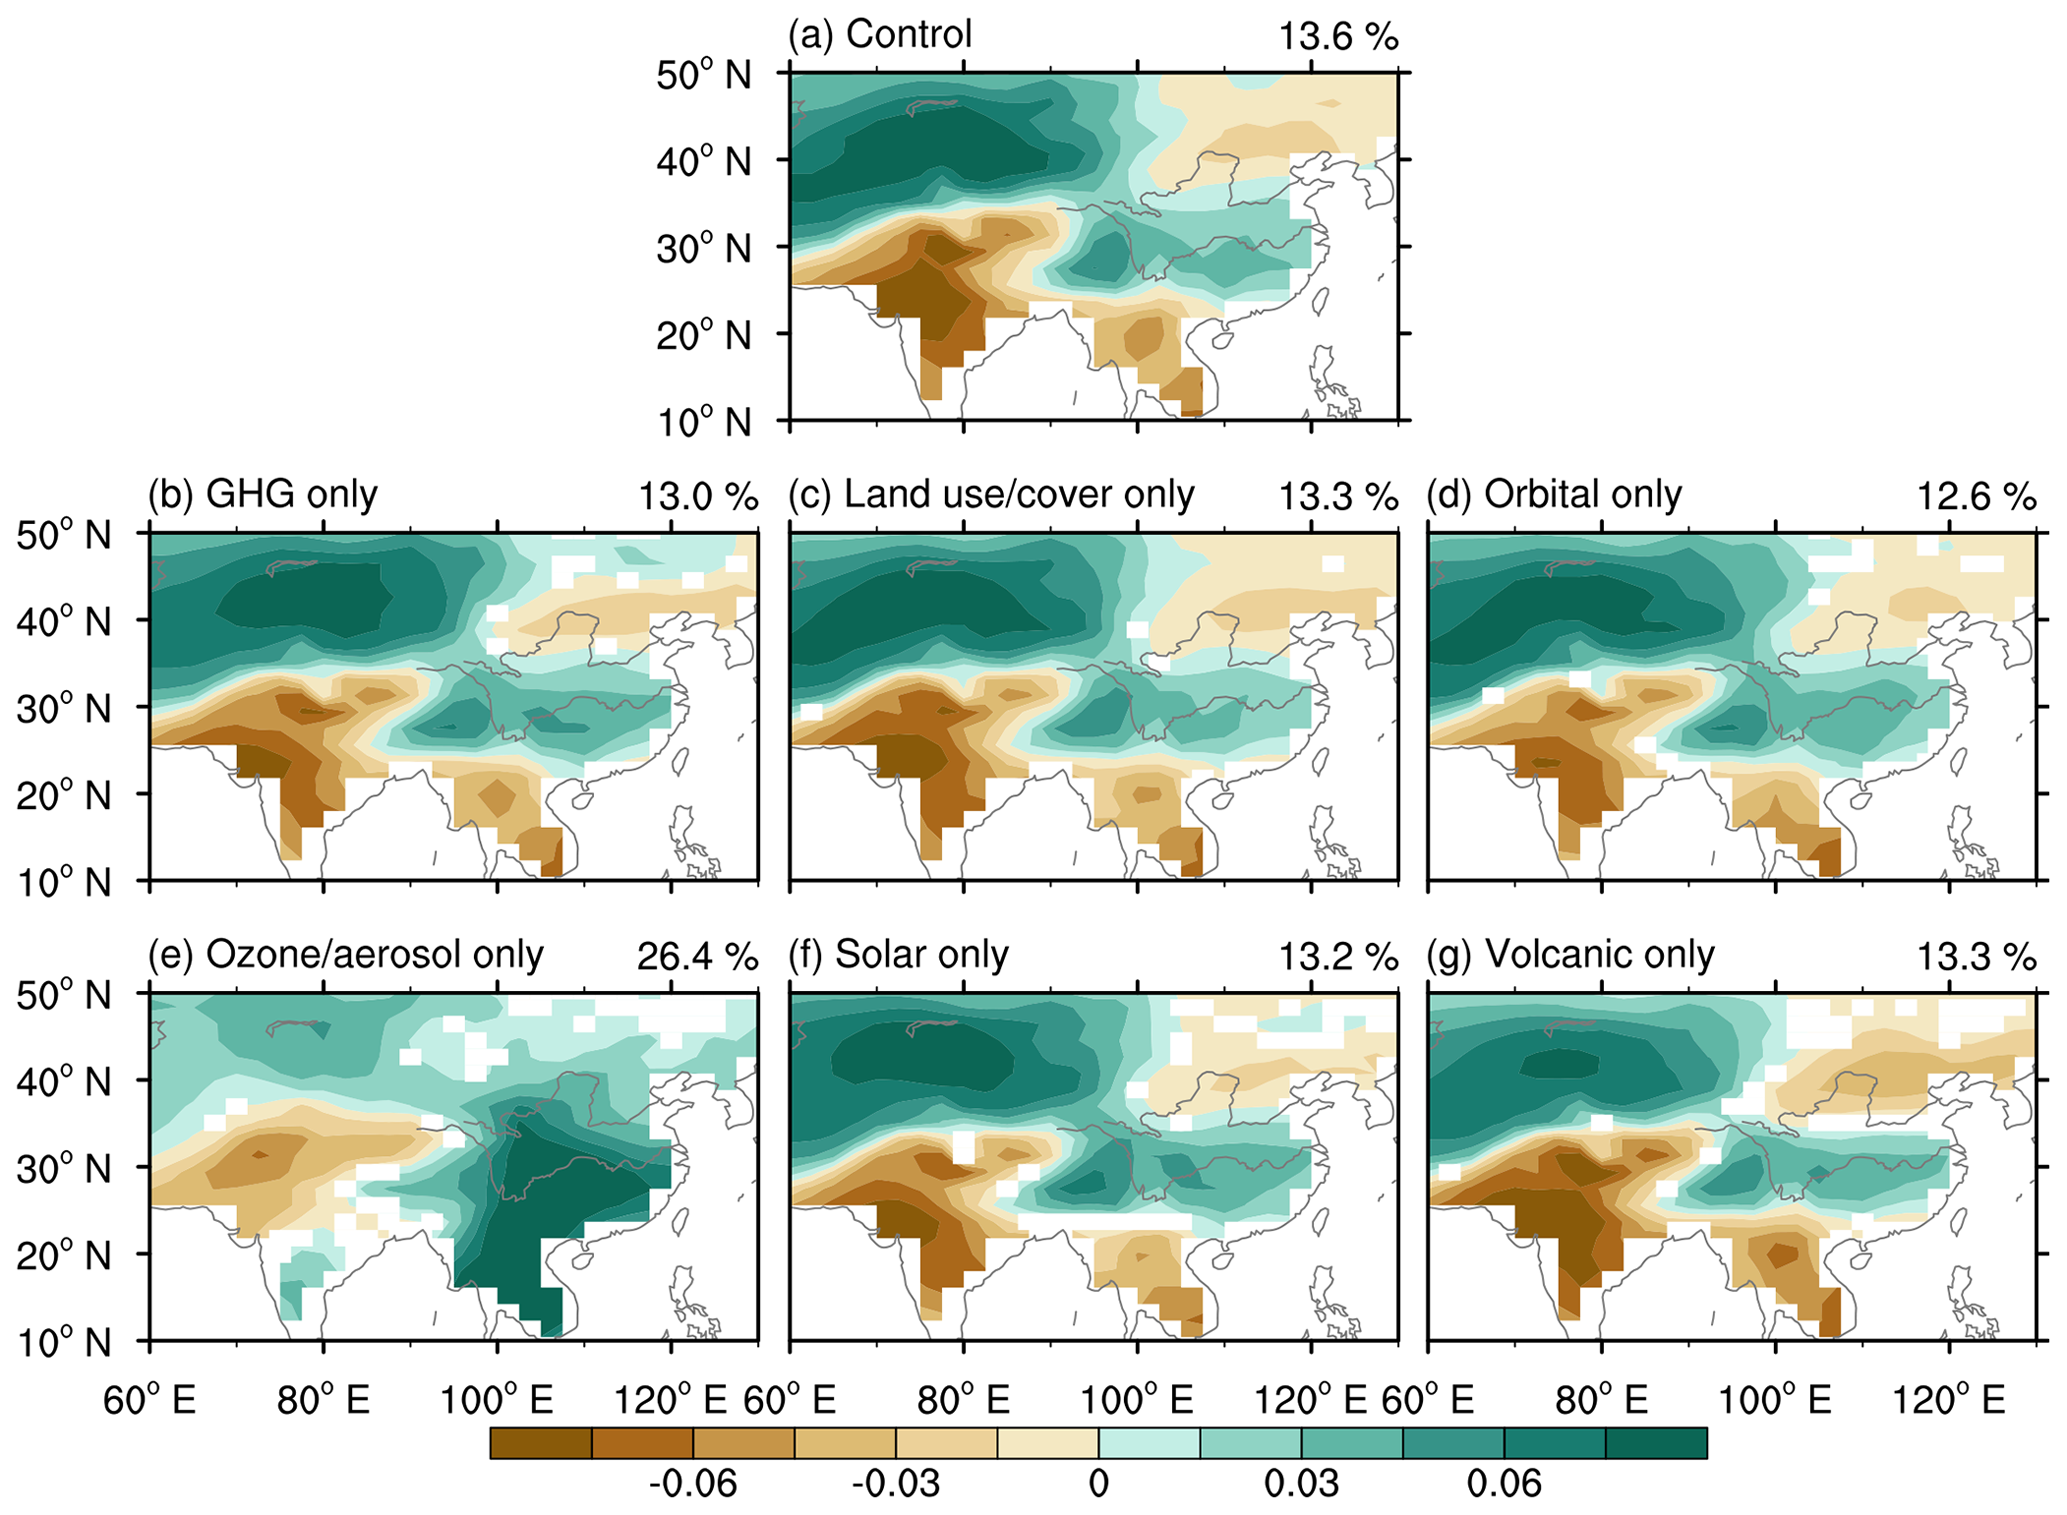
Figure 7The leading decadal precipitation mode for the time period 850–2005 in the control and single-forcing simulations, with the exception of the leading mode for the time period 1850–2005 in the experiment forced by ozone and aerosols. (a) EOF1 of the 9-year low-pass Lanczos-filtered annual precipitation in the control simulation. The explained variance is given at the top right. (b–g) The average EOF1 of the 9-year low-pass Lanczos-filtered annual precipitation in six subsets of the single-forcing simulations: a subset of three simulations forced by greenhouse gas (GHG) emissions, a subset of three simulations forced by land use and land cover, a subset of three simulations forced by the Earth's orbit, a subset of four simulations forced by ozone and aerosols, a subset of four simulations forced by solar activity, and a subset of five simulations forced by volcanic eruptions. The average explained variance is given at the top right. The shading in panels (b)–(g) shows where at least two-thirds of the members agree on the sign of the average of multiple members.
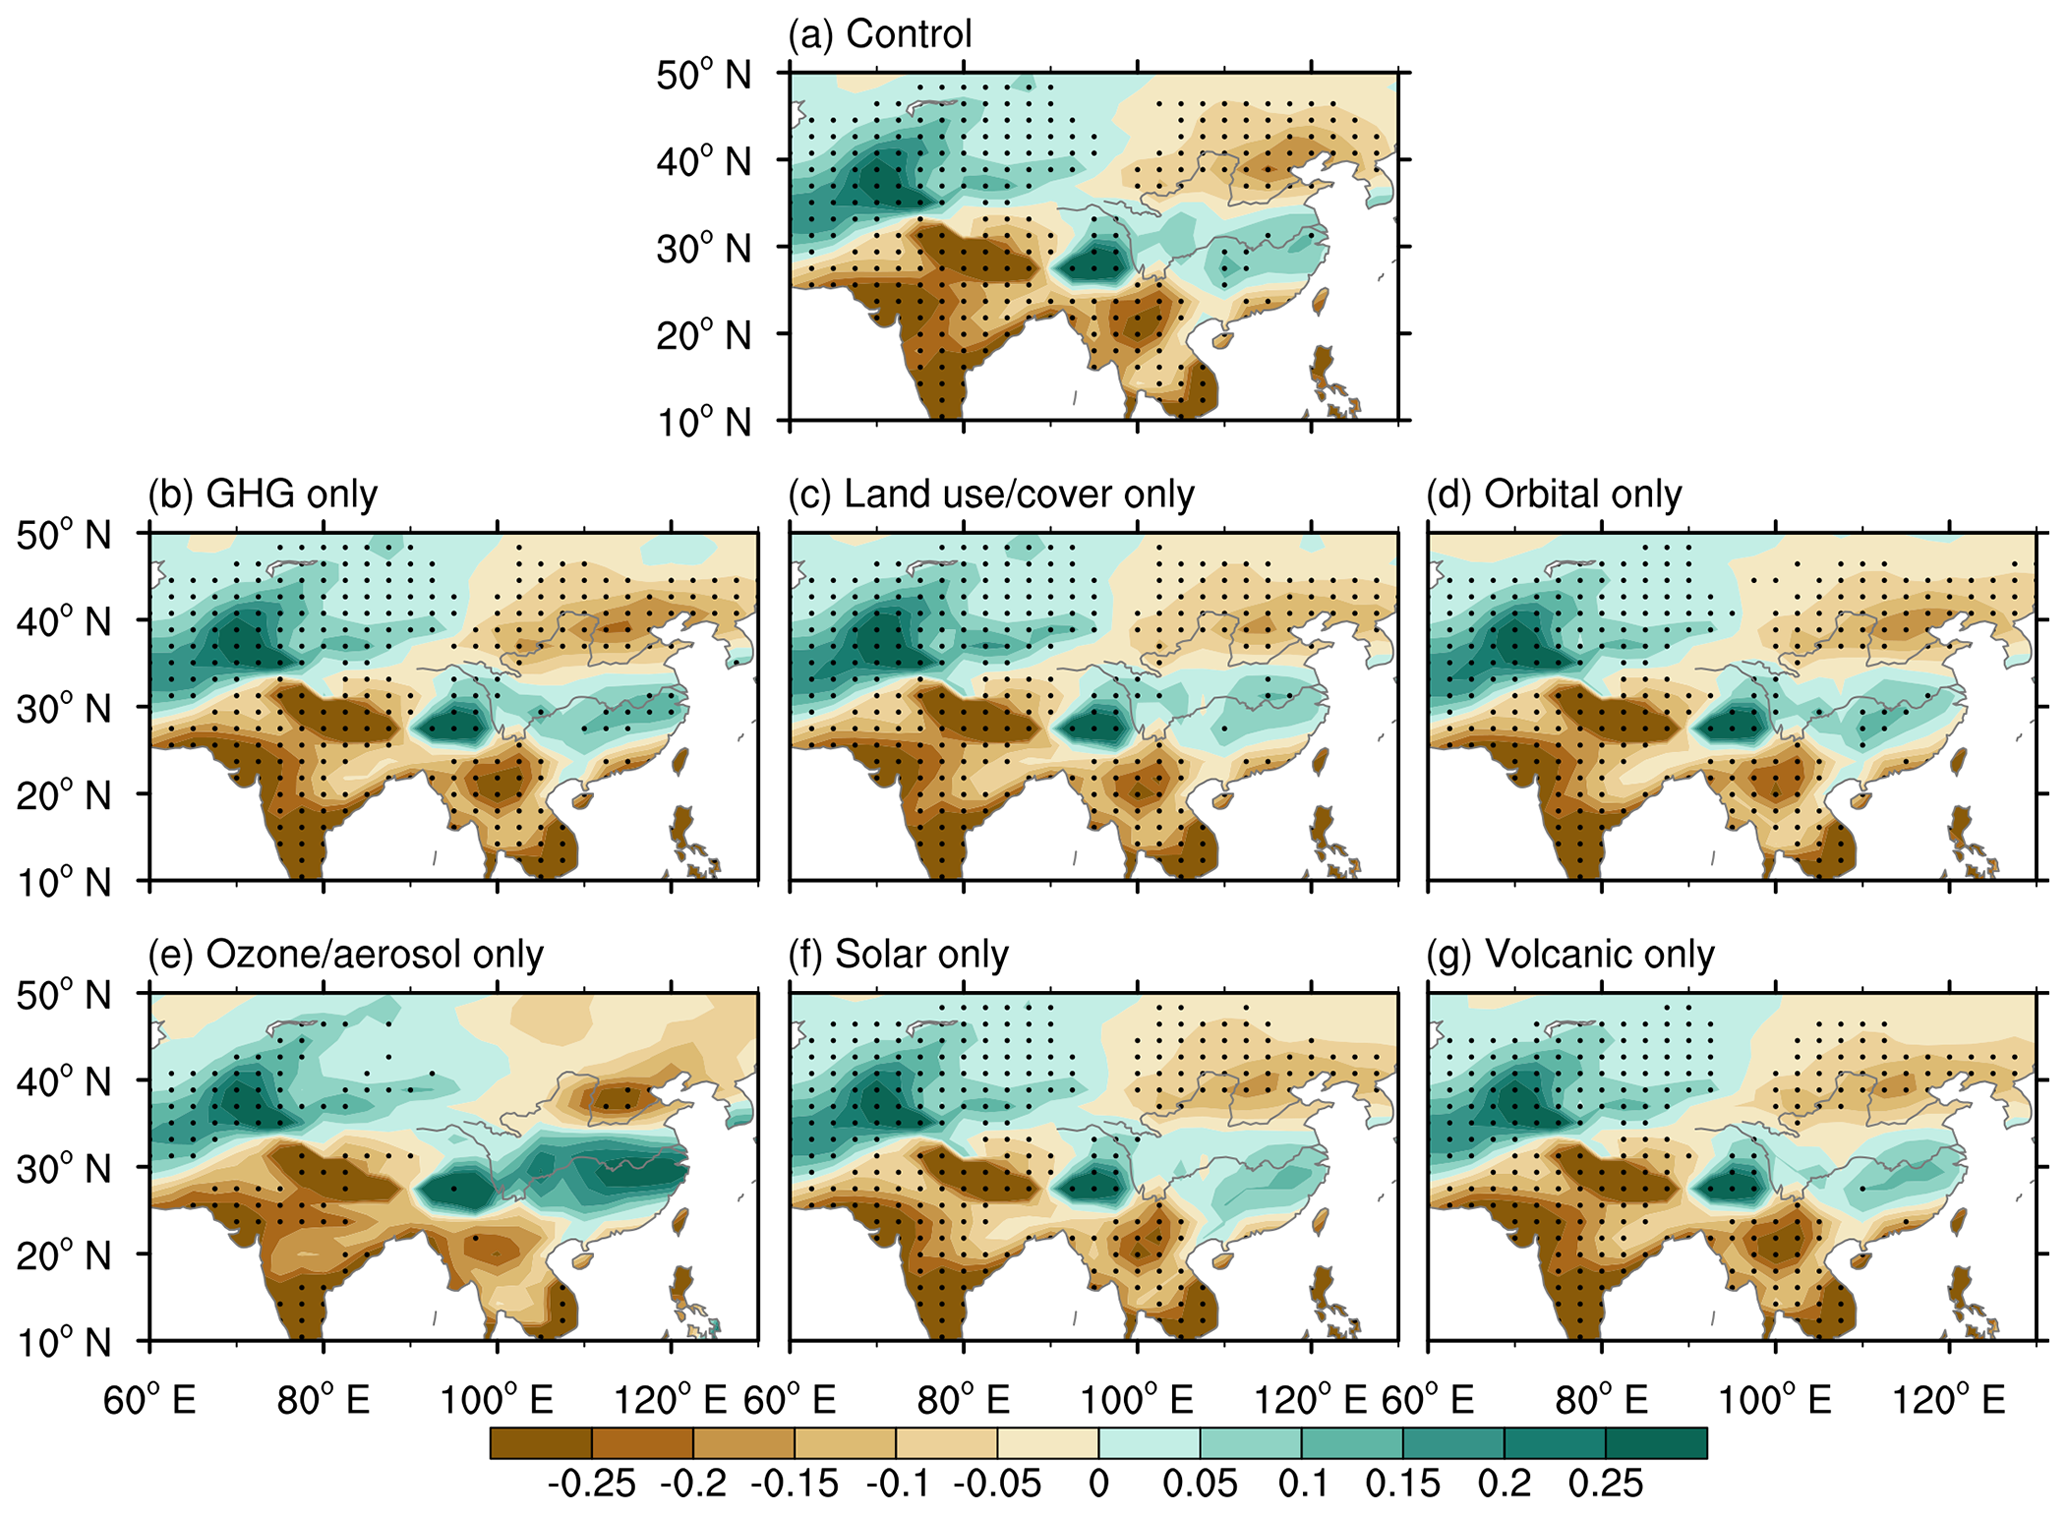
Figure 8Simulated precipitation anomalies during the positive phases of the IPO in the control and single-forcing simulations. (a) Precipitation anomalies (units: mm d−1) regressed onto the time series of the IPO index in the control run. (b–g) Precipitation anomalies (units: mm d−1) regressed onto the time series of the IPO index in six subsets of the single-forcing simulations. The dots in panel (a) show significant anomalies at the 95 % confidence level, and the dots in panels (b)–(g) indicate that at least two-thirds of the members simulate significant changes (at the 95 % significance level), and these significant changes agree on the sign of the average of multiple members.
Apart from the simulations forced by ozone and aerosols, the SST anomalies associated with the leading precipitation mode in the control and single-forcing simulations all showed a positive IPO pattern (Fig. S9), consistent with the all-forcing simulations. At the same time, the precipitation anomalies associated with the positive IPO in the control and single-forcing simulations all showed positive anomalies in arid central Asia and southern China and negative anomalies in the South Asian monsoon region and most of northern China (Fig. 8), also consistent with the all-forcing simulations. This suggested that these external forcing factors cannot change the dominant influence of IPO on Asian decadal precipitation and lead to the decadal linkage between the changes in precipitation pattern in arid regions and monsoon regions in Asia during the last millennium. It is therefore clear that the internal variability associated with the IPO had a decisive role in shaping the decadal linkage of precipitation changes.
In the ozone and aerosol forcing simulations, we can find positive precipitation anomalies in arid central Asia and southern China and negative precipitation anomalies in the South Asian monsoon region and most of northern China during the positive phases of the IPO (Fig. 8e). However, the changes in East Asian precipitation were no longer significant, which meant that the impacts of the IPO on East Asian precipitation in this experiment were weakened.
3.5 Simulated first leading moisture mode
Terrestrial moisture conditions are closely related to precipitation changes and could strongly affect terrestrial ecosystems. The terrestrial moisture condition is quantified by both the aridity index and soil moisture content here. Based on our analyses of the aridity index (Fig. 9a) and the soil moisture content (Fig. S10a), we found that EOF1 of the decadal changes in Asian moisture during the last millennium also showed the same changes in moisture in arid central Asia and southern China, which were the opposite of those in the South Asian monsoon region and most of northern China. This is consistent with the first leading precipitation mode, suggesting the important contribution of precipitation to the decadal linkage between the changes in moisture pattern in arid regions and monsoon regions in Asia. A similar first leading moisture mode was seen in all the experiments apart from those with only ozone and aerosol forcing (Figs. 9 and S10), indicating the decisive role of internal variability in the decadal linkage of moisture changes.
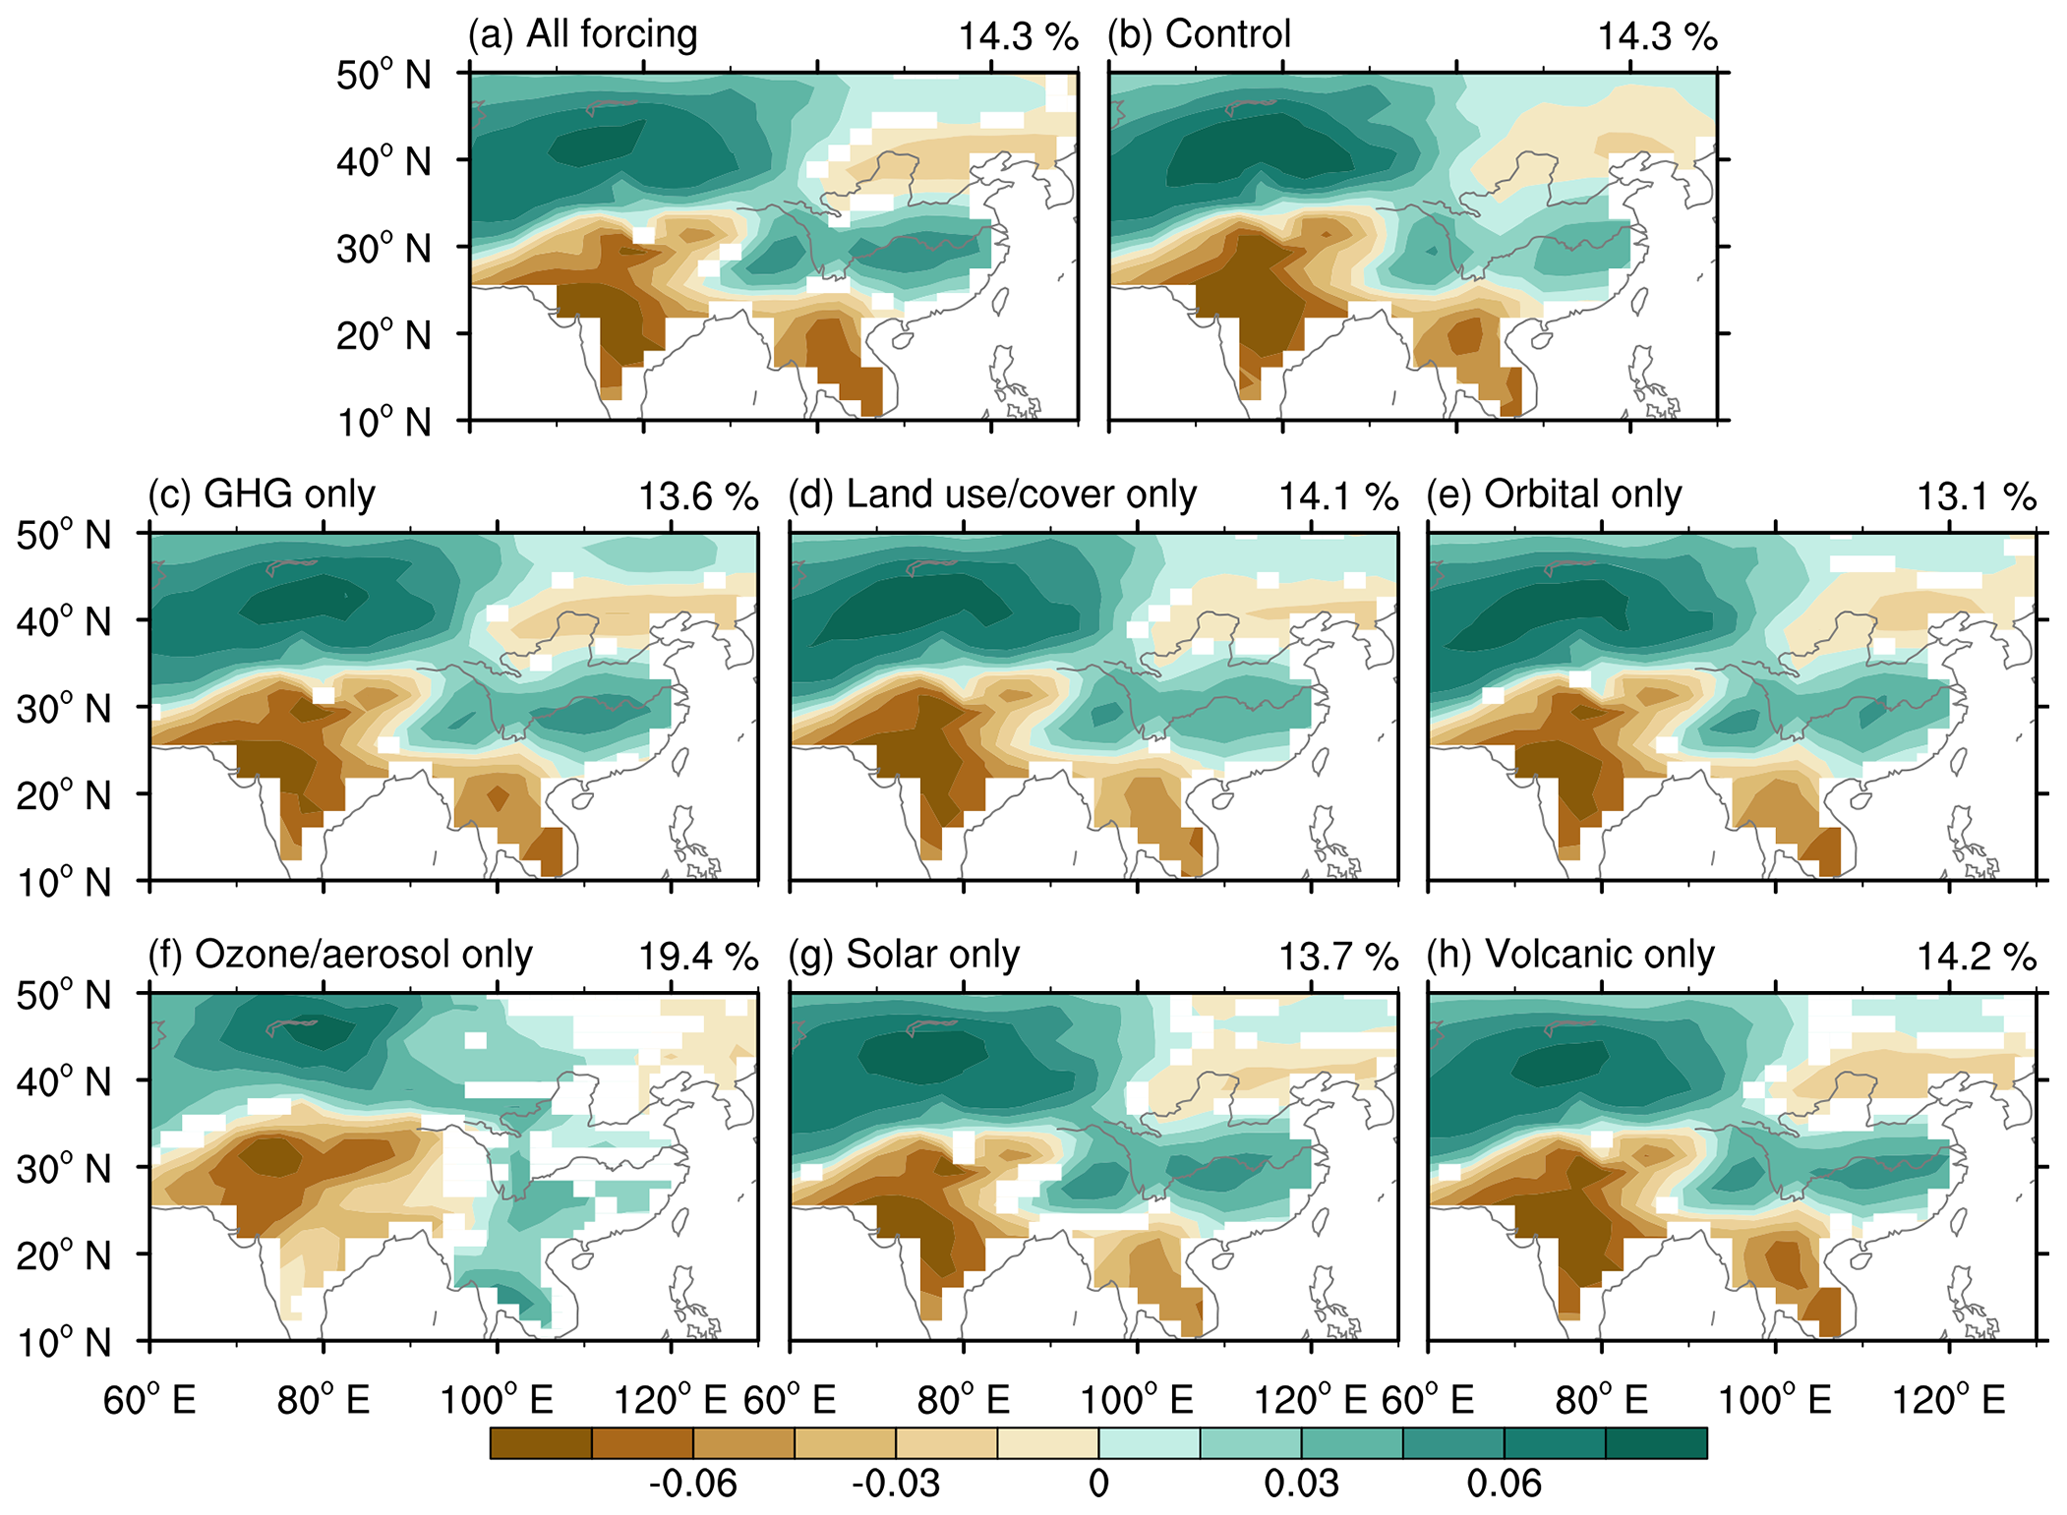
Figure 9The simulated leading decadal aridity index mode for the time period 850–2005 in all the experiments, with the exception of the leading mode for the time period 1850–2005 in the experiment forced by ozone and aerosols. (a) The average EOF1 of the 9-year low-pass Lanczos-filtered aridity index in the all-forcing simulations. The average explained variance is given at the top right. (b) EOF1 of the 9-year low-pass Lanczos-filtered aridity index in the control simulation. The explained variance is given at the top right. (c–h) The average EOF1 of the 9-year low-pass Lanczos-filtered aridity index in six subsets of the single-forcing simulations. The average explained variance is given at the top right. The shading in panels (a) and (c)–(h) shows where at least two-thirds of the members agree on the sign of the average of multiple members.
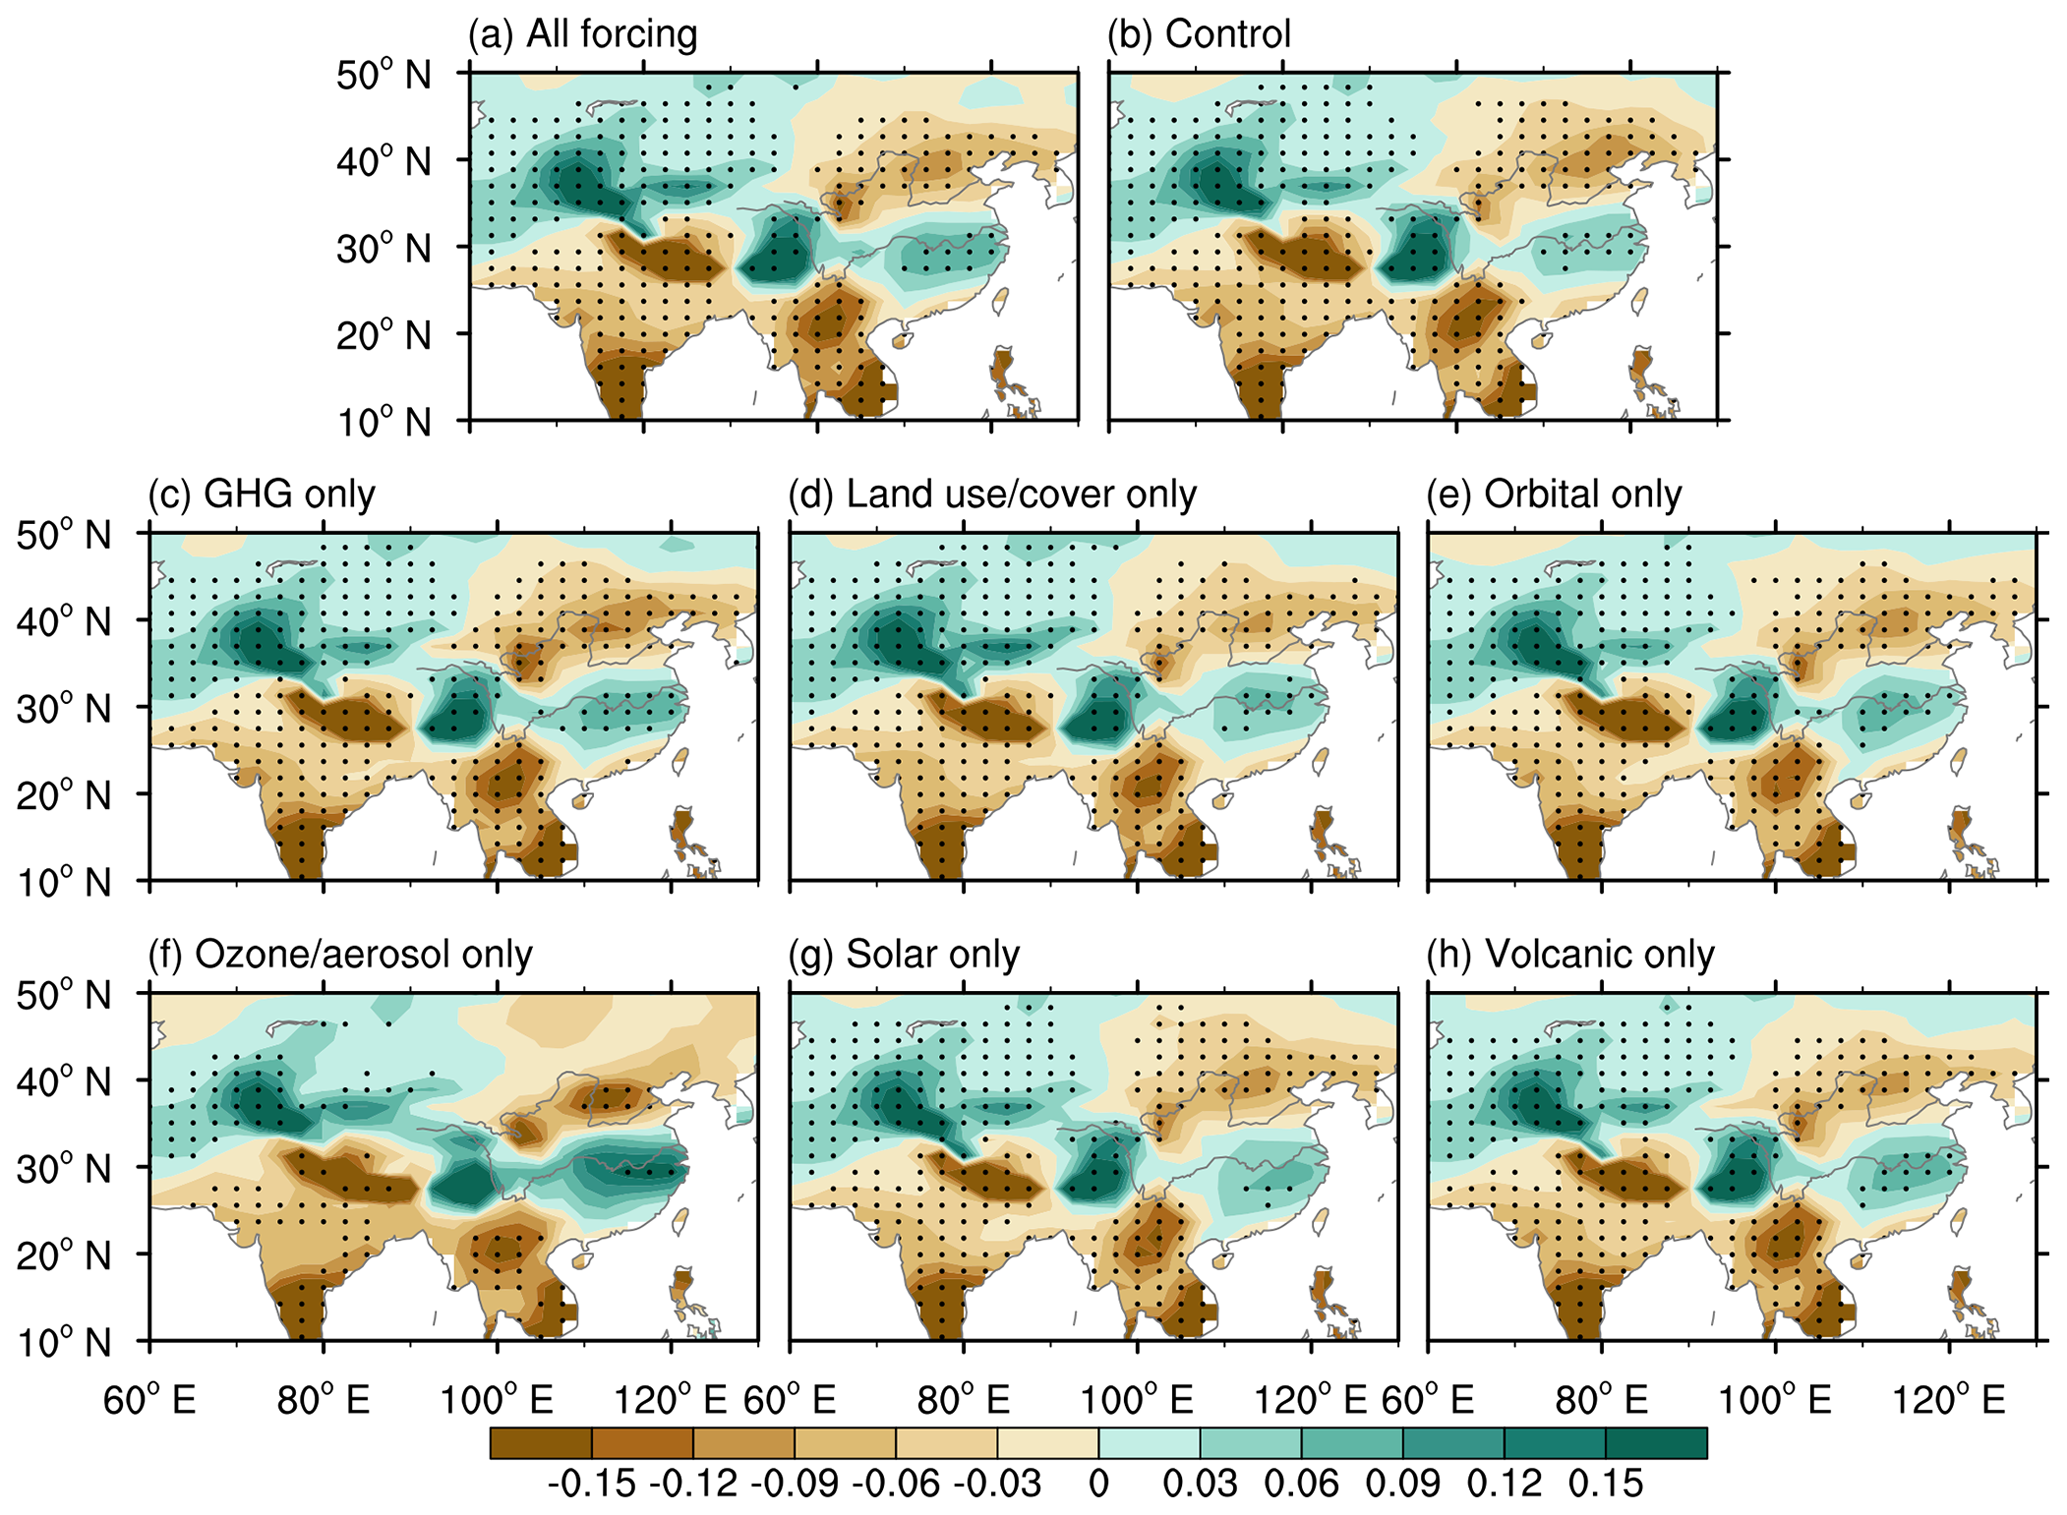
Figure 10Simulated aridity index anomalies during the positive phases of the IPO. The aridity index anomalies regressed onto the time series of the IPO index in the (a) all-forcing simulations, (b) control simulation, and (c–h) six subsets of the single-forcing simulations. The dots in panel (b) show significant anomalies at the 95 % confidence level, and the dots in panels (a) and (c)–(h) indicate that at least two-thirds of the members simulate significant changes (at the 95 % significance level), and these significant changes agree on the sign of the average of multiple members.
The SST anomalies associated with the leading moisture mode in all experiments, apart from those with only ozone and aerosol forcing, showed a positive IPO pattern (Figs. S11 and S12), indicating the dominant role of the IPO in the decadal linkage of moisture changes. The moisture anomalies associated with the positive IPO showed positive anomalies in arid central Asia and southern China and negative anomalies in the South Asian monsoon region and most of northern China in all the experiments (Figs. 10 and S13), consistent with the leading moisture mode. This further confirmed the aforementioned dominant role of the IPO. Therefore, the internal variability associated with the IPO also had a decisive role in shaping the decadal linkage between the changes in moisture pattern in arid regions and monsoon regions in Asia by regulating precipitation during the last millennium.
4.1 Limited impacts of external forcings on decadal precipitation linkage
As stated in Sect. 3.4, the spatial pattern of the leading decadal precipitation mode in all-forcing simulations also appears in the control and all single-forcing simulations, apart from the simulations forced by ozone and aerosols. This indicates the dominant role of internal variability in shaping the spatial pattern of the leading decadal precipitation mode during the last millennium. Moreover, this process could have been partially influenced by the impacts of ozone and aerosol forcing since the industrial revolution. During this period, ozone and aerosols played crucial roles in regulating the climate at midlatitudes in the Northern Hemisphere (Miao et al., 2022). However, the relative impact of internal variability and external forcings on the time variations of the leading decadal precipitation mode during the last millennium remains unclear. Thus, we calculated the correlations across the time series of the leading decadal precipitation mode (i.e., the principal components) simulated by 12 CESM-LME all-forcing simulations (Table S1 in the Supplement). Except for autocorrelations for each principal component, the other correlations range from −0.06 to 0.35, and only 13.6 % of correlations are significant at the 95 % confidence level. These relatively small correlations indicate that the impacts of external forcings on the time variations of the leading decadal precipitation mode are very weak. The several significant correlations suggest that, to a limited extent, the time variations of the leading decadal precipitation mode could be affected by external forcings (e.g., volcanic eruptions and solar radiation) (Ning et al., 2020; Xue et al., 2023). Therefore, internal variability played a dominant role in shaping the time variations of the leading decadal precipitation mode.
In summary, the impacts of external forcings on both the spatial pattern and time variations of the leading decadal precipitation mode are relatively weak, which indicates limited impacts of external forcings on the decadal linkage between precipitation changes in arid central Asia and humid monsoonal Asia during the last millennium. This is quite different from the dominating role of external forcings in regulating the variations of Asian precipitation at suborbital and longer timescales (Xu et al., 2023).
4.2 Centennial precipitation–moisture linkage
The features of the decadal linkage between moisture and precipitation changes in arid central Asia and humid monsoonal Asia during the last millennium have been investigated, and the dynamic mechanisms associated with the decadal linkage have been explored. Next, the potential linkage on the multi-centennial scale implied by reconstruction is discussed here. Between the LIA and MCA, on the multi-centennial scale, wetter (drier) conditions over arid central Asia and southern China (most of northern China) were reconstructed in Chen et al. (2015) (Fig. 11a). In addition, the changes in precipitation between the LIA and the MCA based on the LMR showed more (less) precipitation over eastern central Asia and southern China (the South Asian monsoon region and most of northern China) (Fig. 11a), consistent with the reconstructed changes in precipitation and moisture in Chen et al. (2015). These results suggest a robust centennial linkage of the changes in precipitation and moisture in central Asia and monsoonal Asia, similar to the decadal precipitation–moisture linkage.
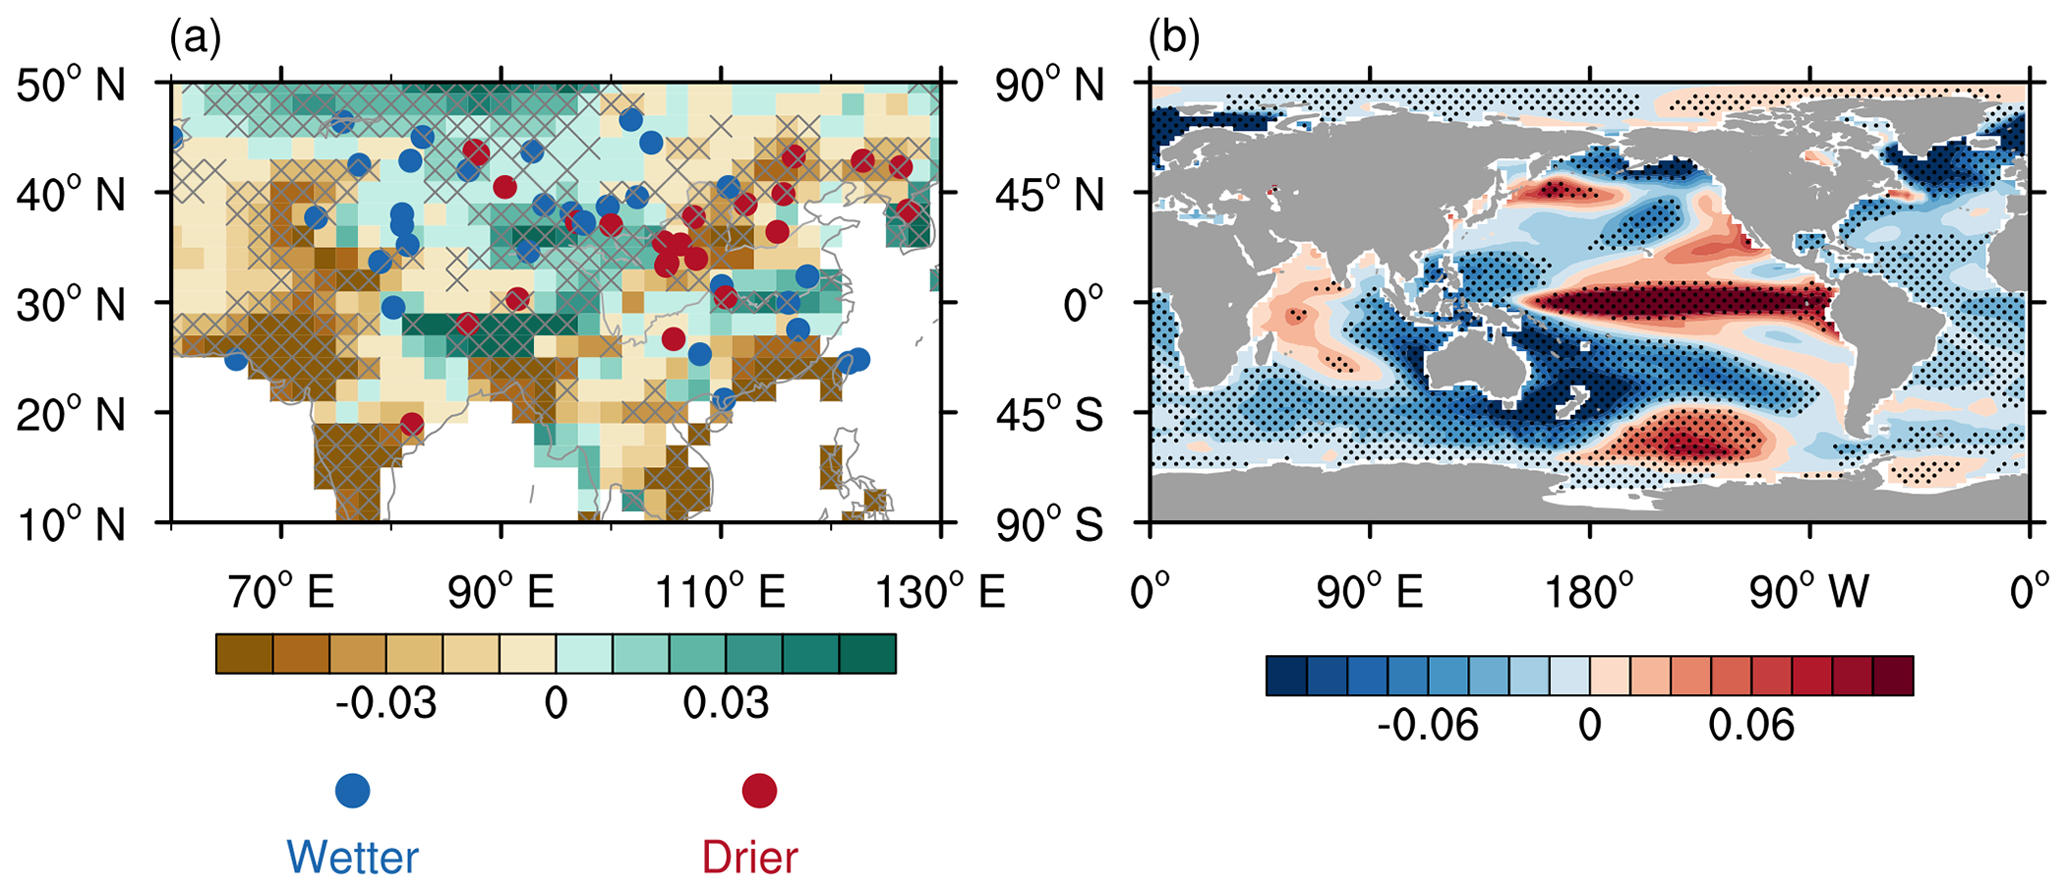
Figure 11Reconstructed changes in (a) precipitation (units: mm d−1) and (b) SST (units: ∘C) between the LIA and MCA in the LMR. The gray hatched patterns in panel (a) and black dots in panel (b) indicate significant anomalies at the 95 % confidence level. The dots in panel (a) represent the reconstructed precipitation and moisture records modified from Chen et al. (2015); the blue (red) dots denote wetter (drier) conditions in the LIA than in the MCA.
The reconstructed changes in the SST between the LIA and MCA showed higher (lower) SSTs over the central–eastern equatorial Pacific (the western–central parts of both the subtropical North Pacific and South Pacific) (Fig. 11b). According to the present study, the IPO-like condition may be the primary cause of the centennial linkage of changes in precipitation and moisture in central Asia and monsoonal Asia. However, most current models still cannot reproduce the evolution of the Pacific Decadal Oscillation (Wang and Miao, 2018). The CESM-LME simulations were also unable to produce the reconstructed centennial changes in SST between the LIA and MCA. Therefore, in the present study, we cannot directly obtain evidence of the aforementioned centennial linkage from the CESM-LME results. The failure of CESM-LME simulations to reproduce the centennial linkage further limits our understanding of the relative roles of the external forcings and internal variability in shaping the centennial linkage. Thus, further investigation is needed.
Based on the LMR dataset and CESM-LME all-forcing simulations, the first leading precipitation mode in Asia on a decadal scale during the last millennium showed the same changes in precipitation in arid central Asia and southern China, which were the opposite of those in the South Asian monsoon region and most of northern China. This mode indicated a robust linkage between the changes in precipitation pattern in arid regions and monsoon regions in Asia on a decadal scale, in which the evolution of precipitation in central Asia was out of phase with that of northern China and the South Asian monsoon regions and in phase with that of southern China.
Further analysis based on CESM-LME all-forcing, control, and all single-forcing simulations showed that the internal variability associated with the IPO played a dominant role in connecting the decadal variations in precipitation between arid central Asia and monsoonal Asia by modulating the precipitation of their respective major rainy seasons during the last millennium. In spring, the positive IPO could enhance westerlies over the Mediterranean Sea and to its east, which could transport more water vapor and cause increased precipitation over central Asia. In summer, the positive IPO is accompanied by a weakened Asian summer monsoon and southward Asian subtropical westerly jet, which further lead to increased (decreased) summer precipitation over southern China (over northern China and the South Asian monsoon region). In addition, the positive IPO can weaken the Pacific Walker circulation, which contributes to a precipitation decrease over South Asian monsoon regions in all four seasons.
In addition, this decadal linkage of precipitation variation also caused a similar decadal linkage of moisture changes in central Asia and monsoonal Asia during the last millennium.
The Last Millennium Reanalysis (LMR) Version 2.1 dataset used in this study is available at https://doi.org/10.25921/gn22-5866 (Tardif et al., 2019b). The Community Earth System Model Last Millennium Ensemble (CESM-LME) can be found at https://www.cesm.ucar.edu/community-projects/lme (Otto-Bliesner et al., 2016b).
The supplement related to this article is available online at: https://doi.org/10.5194/cp-20-107-2024-supplement.
TW designed the study; HX analyzed the dataset and plotted the figures; HX, TW, and HW all contributed to writing the paper and interpreting results. Funding was acquired by TW and HX.
The contact author has declared that none of the authors has any competing interests.
Publisher's note: Copernicus Publications remains neutral with regard to jurisdictional claims made in the text, published maps, institutional affiliations, or any other geographical representation in this paper. While Copernicus Publications makes every effort to include appropriate place names, the final responsibility lies with the authors.
We sincerely thank two anonymous reviewers and the editor for their valuable comments and suggestions, which helped to improve the quality of this paper significantly.
This research has been supported by the National Natural Science Foundation of China (grant no. 42221004), the National Key Research and Development Program of China (grant no. 2018YFA0606403), and the Postgraduate Research and Practice Innovation Program of Jiangsu Province (grant no. KYCX21_0944).
This paper was edited by Hans Linderholm and reviewed by two anonymous referees.
Aizen, E. M., Aizen, V. B., Melack, J. M., Nakamura, T., and Ohta, T.: Precipitation and atmospheric circulation patterns at mid-latitudes of Asia, Int. J. Climatol., 21, 535–556, https://doi.org/10.1002/joc.626, 2001.
Allen, R. G., Pereira, L. S., Raes, D., and Smith, M.: Crop evapotranspiration-guidelines for computing crop water requirements, Food and Agriculture Organization of the United Nations Irrigation and Drainage Paper 56, 1–326, ISBN 92-5-104219-5, 1998.
Anderson, D. M., Tardif, R., Horlick, K., Erb, M. P., Hakim, G. J., Noone, D., Perkins, W. A., and Steig, E.: Additions to the Last Millennium Reanalysis multi-proxy database, Data Sci. J., 18, 1–11, https://doi.org/10.5334/dsj-2019-002, 2019.
Bretherton, C. S., Widmann, M., Dymnikov, V. P., Wallace, J. M., and Bladé, I.: The effective number of spatial degrees of freedom of a time-varying field, J. Climate, 12, 1990–2009, https://doi.org/10.1175/1520-0442(1999)012<1990:tenosd>2.0.co;2, 1999.
Chen, F., Chen, J., Holmes, J., Boomer, I., Austin, P., Gates, J. B., Wang, N., Brooks, S. J., and Zhang, J.: Moisture changes over the last millennium in arid central Asia: a review, synthesis and comparison with monsoon region, Quaternary Sci. Rev., 29, 1055–1068, https://doi.org/10.1016/j.quascirev.2010.01.005, 2010.
Chen, F., Huang, W., Jin, L., Chen, J., and Wang, J.: Spatiotemporal precipitation variations in the arid Central Asia in the context of global warming, Sci. China Earth Sci., 54, 1812–1821, https://doi.org/10.1007/s11430-011-4333-8, 2011.
Chen, J., Chen, F., Feng, S., Huang, W., Liu, J., and Zhou, A.: Hydroclimatic changes in China and surroundings during the Medieval Climate Anomaly and Little Ice Age: spatial patterns and possible mechanisms, Quaternary Sci. Rev., 107, 98–111, https://doi.org/10.1016/j.quascirev.2014.10.012, 2015.
Chu, C., Yang, X.-Q., Sun, X., Yang, D., Jiang, Y., Feng, T., and Liang, J.: Effect of the tropical Pacific and Indian Ocean warming since the late 1970s on wintertime Northern Hemispheric atmospheric circulation and East Asian climate interdecadal changes, Clim. Dynam., 50, 3031–3048, https://doi.org/10.1007/s00382-017-3790-y, 2018.
Cressman, G. P.: Circulations of the west Pacific jet stream, Mon. Weather Rev., 109, 2450–2463, https://doi.org/10.1175/1520-0493(1981)109<2450:cotwpj>2.0.co;2, 1981.
Ding, Y.: Advanced synoptic meteorology, China Meteorological Press, Beijing, ISBN 978-7-5029-3926-7, 2005.
Ding, Y. and Chan, J. C. L.: The East Asian summer monsoon: an overview, Meteorol. Atmos. Phys., 89, 117–142, https://doi.org/10.1007/s00703-005-0125-z, 2005.
Ding, Y., Wang, Z., and Sun, Y.: Inter-decadal variation of the summer precipitation in East China and its association with decreasing Asian summer monsoon. Part I: Observed evidences, Int. J. Climatol., 28, 1139–1161, https://doi.org/10.1002/joc.1615, 2008.
Dong, B. and Lu, R.: Interdecadal enhancement of the walker circulation over the Tropical Pacific in the late 1990s, Adv. Atmos. Sci., 30, 247–262, https://doi.org/10.1007/s00376-012-2069-9, 2013.
Gilman, D. L., Fuglister, F. J., and Mitchell, J. M.: On the power spectrum of “red noise”, J. Atmos. Sci., 20, 182–184, https://doi.org/10.1175/1520-0469(1963)020<0182:otpson>2.0.co;2, 1963.
Henley, B. J., Gergis, J., Karoly, D. J., Power, S., Kennedy, J., and Folland, C. K.: A Tripole Index for the Interdecadal Pacific Oscillation, Clim. Dynam., 45, 3077–3090, https://doi.org/10.1007/s00382-015-2525-1, 2015.
Hu, Y., Sun, W., Liu, J., Chen, D., Ning, L., and Peng, Z.: Decadal variability of precipitation over the Tibetan Plateau modulated by the 11-year solar cycle over the past millennium, Front. Earth Sci., 11, 1137205, https://doi.org/10.3389/feart.2023.1137205, 2023.
Huang, J., Ma, J., Guan, X., Li, Y., and He, Y.: Progress in semi-arid climate change studies in China, Adv. Atmos. Sci., 36, 922–937, https://doi.org/10.1007/s00376-018-8200-9, 2019.
Huang, W., Chen, F., Feng, S., Chen, J., and Zhang, X.: Interannual precipitation variations in the mid-latitude Asia and their association with large-scale atmospheric circulation, Chinese Sci. Bull., 58, 3962–3968, https://doi.org/10.1007/s11434-013-5970-4, 2013.
Huang, W., Chen, J., Zhang, X., Feng, S., and Chen, F.: Definition of the core zone of the “westerlies-dominated climatic regime”, and its controlling factors during the instrumental period, Sci. China Earth Sci., 58, 676–684, https://doi.org/10.1007/s11430-015-5057-y, 2015.
Hurrell, J. W., Holland, M. M., Gent, P. R., Ghan, S., Kay, J. E., Kushner, P. J., Lamarque, J.-F., Large, W. G., Lawrence, D., Lindsay, K., Lipscomb, W. H., Long, M. C., Mahowald, N., Marsh, D. R., Neale, R. B., Rasch, P., Vavrus, S., Vertenstein, M., Bader, D., Collins, W. D., Hack, J. J., Kiehl, J., and Marshall, S.: The Community Earth System Model: A framework for collaborative research, B. Am. Meteorol. Soc., 94, 1339–1360, https://doi.org/10.1175/bams-d-12-00121.1, 2013.
Jiang, D., Su, M., Wei, R., and Bao, L.: Variation and projection of drought and wet conditions in Xinjiang, Chinese Journal of Atmospheric Sciences, 33, 90–98, https://doi.org/10.3878/j.issn.1006-9895.2009.01.08, 2009.
Jiang, J., Zhou, T., Chen, X., and Wu, B.: Central Asian precipitation shaped by the tropical Pacific Decadal Variability and the Atlantic Multidecadal Variability, J. Climate, 34, 7541–7553, https://doi.org/10.1175/jcli-d-20-0905.1, 2021.
Jin, C., Liu, J., Wang, B., Yan, M., and Ning, L.: Decadal variations of the East Asian summer monsoon forced by the 11-year insolation cycle, J. Climate, 32, 2735–2745, https://doi.org/10.1175/jcli-d-18-0288.1, 2019.
Krishnamurthy, L. and Krishnamurthy, V.: Influence of PDO on South Asian summer monsoon and monsoon–ENSO relation, Clim. Dynam., 42, 2397–2410, https://doi.org/10.1007/s00382-013-1856-z, 2014.
Li, B., Li, Y., Chen, Y., Zhang, B., and Shi, X.: Recent fall Eurasian cooling linked to North Pacific sea surface temperatures and a strengthening Siberian high, Nat. Commun., 11, 5202, https://doi.org/10.1038/s41467-020-19014-2, 2020.
Li, G., Gao, C., Lu, B., and Chen, H.: Inter-annual variability of spring precipitation over the Indo-China Peninsula and its asymmetric relationship with El Niño-Southern Oscillation, Clim. Dynam., 56, 2651–2665, https://doi.org/10.1007/s00382-020-05609-4, 2021.
Li, T., Wang, Y., Wang, B., Ting, M., Ding, Y., Sun, Y., He, C., and Yang, G.: Distinctive South and East Asian monsoon circulation responses to global warming, Sci. Bull., 67, 762–770, https://doi.org/10.1016/j.scib.2021.12.001, 2022.
Miao, J., Wang, T., and Jiang, D.: Ozone-aerosol and land use reversed temperature increase over some northern mid-latitude regions between the 20th century and the Little Ice Age based on the CESM-LME, Holocene, 32, 1251–1259, https://doi.org/10.1177/09596836211041734, 2022.
Middleton, N. J. and Thomas, D. S. G.: World atlas of desertification, 2nd edn, Edward Arnold, London, The United Kingdom, ISBN 0-340-69166-2, 1997.
Mishra, V. and Aadhar, S.: Famines and likelihood of consecutive megadroughts in India, npj Clim. Atmos. Sci., 4, 59, https://doi.org/10.1038/s41612-021-00219-1, 2021.
Monteith, J. L.: Evaporation and environment, Symposia of the Society for Experimental Biology, Swansea, 19, 205–234, https://repository.rothamsted.ac.uk/item/8v5v7/evaporation-and-environment (last access: 9 January 2024), 1965.
Ning, L., Chen, K., Liu, J., Liu, Z., Yan, M., Sun, W., Jin, C., and Shi, Z.: How do volcanic eruptions influence decadal megadroughts over eastern China?, J. Climate, 33, 8195–8207, https://doi.org/10.1175/JCLI-D-19-0394.1, 2020.
Otto-Bliesner, B. L., Brady, E. C., Fasullo, J., Jahn, A., Landrum, L., Stevenson, S., Rosenbloom, N., Mai, A., and Strand, G.: Climate variability and change since 850 CE: An ensemble approach with the Community Earth System Model, B. Am. Meteorol. Soc., 97, 735–754, https://doi.org/10.1175/bams-d-14-00233.1, 2016a.
Otto-Bliesner, B. L., Brady, E. C., Fasullo, J., Jahn, A., Landrum, L., Stevenson, S., Rosenbloom, N., Mai, A., and Strand, G.: CESM1 Last Millennium Ensemble, ESG [data set], https://www.cesm.ucar.edu/community-projects/lme (last access: 10 January 2023), 2016b.
PAGES2k Consortium: A global multiproxy database for temperature reconstructions of the Common Era, Sci. Data, 4, 170088, https://doi.org/10.1038/sdata.2017.88, 2017.
Penman, H. L.: Natural evaporation from open water, bare soil and grass, P. R. Soc. Lond. A, 193, 120–145, https://doi.org/10.1098/rspa.1948.0037, 1948.
Power, S., Casey, T., Folland, C., Colman, A., and Mehta, V.: Inter-decadal modulation of the impact of ENSO on Australia, Clim. Dynam., 15, 319–324, https://doi.org/10.1007/s003820050284, 1999.
Qin, M., Li, D., Dai, A., Hua, W., and Ma, H.: The influence of the Pacific Decadal Oscillation on North Central China precipitation during boreal autumn, Int. J. Climatol., 38, e821–e831, https://doi.org/10.1002/joc.5410, 2018.
Qin, M., Dai, A., Li, D., and Hua, W.: Understanding the inter-decadal variability of autumn precipitation over North Central China using model simulations, Int. J. Climatol., 40, 874–886, https://doi.org/10.1002/joc.6245, 2020.
Shi, J., Yan, Q., Jiang, D., Min, J., and Jiang, Y.: Precipitation variation over eastern China and arid central Asia during the past millennium and its possible mechanism: Perspectives from PMIP3 experiments, J. Geophys. Res.-Atmos., 121, 11989–12004, https://doi.org/10.1002/2016JD025126, 2016.
Shi, J., Yan, Q., and Wang, H.: Timescale dependence of the relationship between the East Asian summer monsoon strength and precipitation over eastern China in the last millennium, Clim. Past, 14, 577–591, https://doi.org/10.5194/cp-14-577-2018, 2018.
Shi, Y., Shen, Y., Kang, E., Li, D., Ding, Y., Zhang, G., and Hu, R.: Recent and Future climate change in Northwest China, Climatic Change, 80, 379–393, https://doi.org/10.1007/s10584-006-9121-7, 2007.
Tardif, R., Hakim, G. J., Perkins, W. A., Horlick, K. A., Erb, M. P., Emile-Geay, J., Anderson, D. M., Steig, E. J., and Noone, D.: Last Millennium Reanalysis with an expanded proxy database and seasonal proxy modeling, Clim. Past, 15, 1251–1273, https://doi.org/10.5194/cp-15-1251-2019, 2019a.
Tardif, R., Hakim, G. J., Perkins, W. A., Horlick, K. A., Erb, M. P., Emile-Geay, J., Anderson, D. M., Steig, E. J., and Noone, D.: NOAA/WDS Paleoclimatology – Last Millennium Reanalysis (LMR) Project Global Climate Reconstructions Version 2, NCEI [data set], https://doi.org/10.25921/gn22-5866, 2019b.
Turner, A. G. and Annamalai, H.: Climate change and the South Asian summer monsoon, Nat. Clim. Change, 2, 587–595, https://doi.org/10.1038/nclimate1495, 2012.
Wang, H. J.: The weakening of the Asian monsoon circulation after the end of 1970's, Adv. Atmos. Sci., 18, 376–386, https://doi.org/10.1007/BF02919316, 2001.
Wang, T. and Miao, J. P.: Twentieth-century Pacific Decadal Oscillation simulated by CMIP5 coupled models, Atmos. Ocean Sci. Lett., 11, 94–101, https://doi.org/10.1080/16742834.2017.1381548, 2018.
Wang, T., Wang, H. J., Otterå, O. H., Gao, Y. Q., Suo, L. L., Furevik, T., and Yu, L.: Anthropogenic agent implicated as a prime driver of shift in precipitation in eastern China in the late 1970s, Atmos. Chem. Phys., 13, 12433–12450, https://doi.org/10.5194/acp-13-12433-2013, 2013.
Wang, T., Xu, H., Jiang, D., and Yao, J.: Mechanisms of reduced mid-Holocene precipitation in arid Central Asia as simulated by PMIP3/4 models, J. Geophys. Res.-Atmos., 127, e2021JD036153, https://doi.org/10.1029/2021JD036153, 2022.
Webster, P. J. and Yang, S.: Monsoon and ENSO: Selectively interactive systems, Q. J. Roy. Meteor. Soc., 118, 877–926, https://doi.org/10.1002/qj.49711850705, 1992.
Xu, H., Wang, T., Wang, H., Miao, J., Chen, J., and Chen, S.: The PMIP3 simulated climate changes over arid Central Asia during the mid-Holocene and last glacial maximum, Acta Geol. Sin.-Engl., 94, 725–742, https://doi.org/10.1111/1755-6724.14542, 2020.
Xu, H., Wang, T., Wang, H., Chen, S., and Chen, J.: External forcings caused the tripole trend of Asian precipitation during the Holocene, J. Geophys. Res.-Atmos., 128, e2023JD039460, https://doi.org/10.1029/2023JD039460, 2023.
Xue, J., Ning, L., Liu, Z., Qin, Y., Chen, K., Yan, M., Liu, J., Wang, L., and Li, C.: The combined influences of solar radiation and PDO on precipitation over eastern China during the last millennium, Clim. Dynam., 60, 1137–1150, https://doi.org/10.1007/s00382-022-06372-4, 2023.
Zhang, Y. and Huang, D.: Has the East Asian westerly jet experienced a poleward displacement in recent decades?, Adv. Atmos. Sci., 28, 1259–1265, https://doi.org/10.1007/s00376-011-9185-9, 2011.
Zhao, P., Yang, S., and Yu, R.: Long-term changes in rainfall over eastern China and large-scale atmospheric circulation associated with recent global warming, J. Climate, 23, 1544–1562, https://doi.org/10.1175/2009jcli2660.1, 2010.
Zhao, X., Dong, B., and Lu, R.: Interdecadal weakening of the cross-equatorial flows over the Maritime Continent during the boreal summer in the mid-1990s: drivers and physical processes, Clim. Dynam., 57, 55–72, https://doi.org/10.1007/s00382-021-05692-1, 2021.
Zhu, J., Zhao, K., Wang, Y., Cui, Y., Liang, Y., Cheng, H., Edwards, R. L., Kong, X., Shao, X., Chen, S., and Pang, L.: Decadal modulation of East Asian summer monsoon variations by external forcing and internal variability, Quaternary Sci. Rev., 293, 107720, https://doi.org/10.1016/j.quascirev.2022.107720, 2022.
Zhu, Y., Wang, H., Ma, J., Wang, T., and Sun, J.: Contribution of the phase transition of Pacific Decadal Oscillation to the late 1990s' shift in East China summer rainfall, J. Geophys. Res.-Atmos., 120, 8817–8827, https://doi.org/10.1002/2015JD023545, 2015.