the Creative Commons Attribution 4.0 License.
the Creative Commons Attribution 4.0 License.
 | 29 Apr 2024
Stable isotope evidence for long-term stability of large-scale hydroclimate in the Neogene North American Great Plains
Livia Manser
Tyler Kukla
Jeremy K. C. Rugenstein
The Great Plains of North America host a stark climatic gradient, separating the humid and well-watered eastern US from the semi-arid and arid western US, and this gradient shapes the region's water availability, its ecosystems, and its economies. This climatic boundary is largely set by the influence of two competing atmospheric circulation systems that meet over the Great Plains – the wintertime westerlies bring dominantly dry air that gives way to moist, southerly air transported by the Great Plains low-level jet in the warmer months. Climate model simulations suggest that, as CO2 rises, this low-level jet will strengthen, leading to greater precipitation in the spring but less in the summer and, thus, no change in mean annual precipitation. Combined with rising temperatures that will increase potential evapotranspiration, semi-arid conditions will shift eastward, with potentially large consequences for the ecosystems and inhabitants of the Great Plains. We examine how hydroclimate in the Great Plains varied in the past in response to warmer global climate by studying the paleoclimate record within the Ogallala Formation, which underlies nearly the entire Great Plains and provides a spatially resolved record of hydroclimate during the globally warmer late Miocene. We use the stable isotopes of oxygen (δ18O) as preserved in authigenic carbonates hosted within the abundant paleosol and fluvial successions that comprise the Ogallala Formation as a record of past hydroclimate. Today, and coincident with the modern aridity gradient, there is a sharp meteoric water δ18O gradient with high (−6 ‰ to 0 ‰) δ18O in the southern Great Plains and low (−12 ‰ to −18 ‰) δ18O in the northern plains. We find that the spatial pattern of reconstructed late Miocene precipitation δ18O is indistinguishable from the spatial pattern of modern meteoric water δ18O. We use a recently developed vapor transport model to demonstrate that this δ18O spatial pattern requires air mass mixing over the Great Plains between dry westerly and moist southerly air masses in the late Miocene – consistent with today. Our results suggest that the spatial extents of these two atmospheric circulation systems have been largely unchanged since the late Miocene and any strengthening of the Great Plains low-level jet in response to warming has been isotopically masked by proportional increases in westerly moisture delivery. Our results hold implications for the sensitivity of Great Plains climate to changes in global temperature and CO2 and also for our understanding of the processes that drove Ogallala Formation deposition in the late Miocene.


The Great Plains of North America rise slowly in elevation from the wooded lowlands near sea level west of the Mississippi River to the greater than 4 km high “purple mountain majesties above the fruited plain” (Bates, 1911) that comprise the North American Cordillera. Though this region contains some of the flattest landscapes in the United States (Fonstad et al., 2007; Dobson and Campbell, 2014), these plains belie a remarkable climatic setting and geologic history which have conspired to shape the modern-day water resources, ecosystems, and economies of the Plains region. Boreal spring heralds the onset of the Great Plains low-level jet (GPLLJ), a primarily nocturnal, southerly jet responsible for transporting more than 30 % of the water vapor that enters the continental US every year (Helfand and Schubert, 1995). Interactions between the GPLLJ and midlatitude storm systems yield some of the largest and most intense convective systems on the planet (Song et al., 2019). These spring and summertime rains nurture the vast grasslands of the Plains, which return this moisture to the atmosphere via transpiration, often seeding additional precipitation on subsequent days and resulting in one of the tightest couplings between land and atmosphere anywhere on Earth (Koster, 2004). On multi-annual timescales, these same interactions – modified by long-term climatic oscillations such as the El Niño–Southern Oscillation or the North Atlantic Oscillation – are the proximal cause for the extensive floods and deep droughts that frequent this region (Byerle, 2003), perhaps best exemplified by the 1930s Dust Bowl (Schubert, 2004), an event which reshaped American governance and society and has been labeled the worst environmental catastrophe in US history (Egan, 2006).
Climatically, the Great Plains are characterized by a sharp aridity gradient with a more humid climate to the east and a more arid climate to the west (Fig. 1). This aridity gradient spans the 100th meridian and marks a dramatic change in the long-term patterns of precipitation, vegetation, and, consequently, agriculture and human development (Powell, 1879, 1890; Webb, 1931; Seager et al., 2018b). A convenient measure of aridity is the aridity index (AI), which is the ratio of precipitation (P) to potential evapotranspiration (PET): conditions are considered arid – or water-limited – if P PET is less than 1. The Great Plains today straddle the transition between the wet, eastern US (AI > 1) and the water-limited western US (AI < 1) (Seager et al., 2018b). Consequently, regions to the east are more densely populated and farms rely on rainfed agricultural practices; to the west, settlement is more limited and agriculture relies extensively on groundwater withdrawals or irrigation diversions.

Figure 1(a) Extent of the continuous Ogallala Formation (thick black outline), with new sites presented in this study (squares) and sites compiled from the PATCH Lab (circles) (Kukla et al., 2022a). Shading is elevation (m). (b) Map of average annual precipitation (mm) from the Global Precipitation Climatology Project (Meyer-Christoffer et al., 2011). (c) Aridity index (AI), which is calculated as P PET. P as in panel (b); PET is from the Global Land Evaporation Amsterdam Model (GLEAM) (Miralles et al., 2011; Martens et al., 2017). (d) Interpolated distribution of δ18O of modern meteoric waters, derived from rivers and streams, groundwater, tap water, spring water, and precipitation δ18O measurements and compiled from Waterisotopes.org (Waterisotopes Database, 2019). Thick black outline in all panels is the areal extent of the continuous Ogallala Formation.
This groundwater – sourced from the Ogallala Aquifer (black polygon outlined in Fig. 1) and replenished by spring and summertime rains – is hosted in the Ogallala Formation, a nearly continuous formation that underlies the Plains from southwest Texas and southeast New Mexico into the southern part of South Dakota, making it one of the largest and most laterally continuous sedimentary formations in North America. Comprised of sediments shed off the Rockies, the Ogallala Formation has been interpreted as a series of alluvial or telescoping megafans (Seni, 1980; Willett et al., 2018; Korus and Joeckel, 2023a) that prograded towards the east and completely buried the pre-existing erosional landscape that, in the southern Great Plains, is cut into Triassic and Permian bedrock, and, in the northern Great Plains, lies on the White River or Arikaree Group. In places, the Ogallala Formation is overlain by alluvial and/or eolian deposits, and, particularly in the southern Great Plains, there is frequently a prominent calcium carbonate caprock that separates the Ogallala from overlying sedimentary units (Gustavson and Winkler, 1988). Deposition began in the middle Miocene and ended in the late Miocene or earliest Pliocene. However, precisely why the Great Plains experienced a prolonged period of deposition, followed by a period of incision that continues to the present day, remains uncertain, with most studies attributing this period of deposition to dynamic topography effects associated with the passage of the Farallon Plate beneath the Great Plains (Moucha et al., 2009; Karlstrom et al., 2011; Willett et al., 2018).
During this time, substantial ecological changes occurred, largely yielding the pre-anthropogenic landscape that characterized the Quaternary Great Plains. Though grasslands were likely present before the middle Miocene, they continued expanding throughout the Plains during the cooling following the peak of mid-Miocene warmth (Jacobs et al., 1999; Stromberg, 2005; Strömberg and McInerney, 2011). These predominantly C3 grasslands were progressively replaced by C4 grasslands starting in the latest Miocene and continuing through the Pliocene (Fox and Koch, 2003, 2004). Largely coincident with these changes, large mammal diversity gradually declined on the Plains from its peak during the middle Miocene to a relative low in the Quaternary (Janis et al., 2000; Fritz et al., 2016). Since cessation of Ogallala deposition, a combination of base-level fall and uplift along the Front Range led to incision of the major Plains rivers through the Ogallala Formation (McMillan et al., 2002; Duller et al., 2012), leaving the former Ogallala landscape abandoned and perched above the major Plains valleys (Willett et al., 2018). Today, much of the Ogallala Formation is visible as a prominent escarpment protected by the indurated nature of its many calcic-rich sediments; dotting much of the length of this escarpment are wind turbines powered, to no small extent, by the exceptionally predictable and windy Great Plains low-level jet.
This combination of climate and geology has helped to promote development and agriculture on the Plains, with Ogallala Aquifer water supplying any deficit due to insufficient rainfall. However, the aquifer remains critically overdrawn in many places; further, anthropogenically driven increases in atmospheric CO2 and associated changes in global climate may affect water availability on the Plains. Indeed, this area appears to be exceptionally sensitive to even small changes in climate and land cover due to the tight coupling between land and atmosphere in this region (Koster, 2004; de Noblet-Ducoudre et al., 2012; Laguë et al., 2019). Thus, small changes in precipitation and/or PET may shift the precise location of the “climatological 100th meridian” (i.e., the approximate location of the boundary between arid and wet ecosystems) with important consequences for ecosystems and agricultural systems. Further, global climate model (GCM) simulations tend to predict only a small change in summer precipitation, though a large shift in the seasonality of that precipitation is driven by dynamical shifts in the westerly jet and the GPLLJ (Cook et al., 2008; Bukovsky et al., 2017; Zhou et al., 2021a). Combined with rising temperatures, this negligible change in summer precipitation implies that the arid conditions characteristic of the western Great Plains may expand eastward with global warming as increases in PET outpace increases in P over the Plains (Seager et al., 2018b; Overpeck and Udall, 2020). However, models still struggle to properly simulate the GPLLJ and its associated precipitation-bearing convective systems. Changes in the interactions between vegetation, soil moisture, and rainfall at higher atmospheric CO2 remain similarly difficult to model (Bukovsky et al., 2017; Zhou et al., 2021a). Further, paleoclimate data indicate that, in general, warmer periods have actually been wetter and/or greener (Caves et al., 2016; Burls and Fedorov, 2017; Ibarra et al., 2018; Feng et al., 2022), in conflict with many model predictions of drier future conditions (e.g., Scheff, 2018). As a consequence, there is substantial uncertainty regarding how aridity on the Plains – and the interactions between the GPLLJ, precipitation, and vegetation – will change as atmospheric CO2 rises and global temperature increases.
In this contribution, we take advantage of the remarkable spatial extent of Neogene sediments afforded by the Ogallala Formation to understand how changes in global climate impacted the Plains during periods of higher atmospheric CO2 and warmer global temperatures. Mid-Miocene global temperatures were 7–8 °C warmer than today and atmospheric CO2 levels were around 500 ppm or higher (Herbert et al., 2016; Steinthorsdottir et al., 2021; CenCO2PIP Consortium, 2023). Since the mid-Miocene, temperature and atmospheric CO2 have gradually declined, establishing the bipolar glaciation that characterizes Quaternary climate. The Neogene therefore provides an opportunity to answer the question of how aridity has changed on the Plains and whether the climatological 100th meridian shifted eastward in the past as global climate models suggest for the future. The spatial extent of the Ogallala also permits us to examine the mechanisms by which any shifts in aridity may have occurred due to, for example, shifts in the distribution of precipitation as a result of strengthening or weakening of the GPLLJ in a warmer climate. Further, any shifts in climate may point towards the mechanisms that generated the sediment that formed the Ogallala Formation, permitting distinctions between climatically or tectonically controlled generation of the Ogallala Formation (i.e., Molnar and England, 1990; Zhang et al., 2001).
To answer these questions, we rely on the stable isotopes of authigenic carbonates – a material that is particularly abundant within the fluvial and paleosol facies of the Ogallala Formation and which is thought to record precipitation δ18O. Precipitation oxygen isotopes (δ18Op) are sensitive to the moisture source and rainout history of air masses that reach a given location. Because of this sensitivity, spatially resolved datasets of carbonate oxygen isotopes (δ18Oc) interpreted to track δ18Op have been successfully used to constrain how large-scale hydroclimate has changed in response to atmospheric and orographic forcing through time (Fox and Koch, 2004; Mix et al., 2011; McDermott et al., 2011; Kocsis et al., 2014; Caves et al., 2015; Caves Rugenstein and Chamberlain, 2018). The Plains today host a steep δ18O gradient oriented NE–SW that roughly tracks, but is somewhat oblique to, the aridity gradient at the 100th meridian (Fig. 1c). Given this concurrence, we hypothesize that the Ogallala authigenic carbonate δ18Oc record over space and time will reflect changes in the large-scale hydroclimate and aridity over the Great Plains. In the following sections, we explain how δ18O can be used to track hydroclimate and our approach to sampling and to building a spatially extensive dataset. We then investigate the climatic drivers behind the modern δ18Op gradient over the Plains and compare this to reconstructed maps of δ18Op during Ogallala deposition. Lastly, we apply a recently developed reactive transport model to quantitatively assess our observations of δ18O and how these data relate to overall hydroclimate on the Plains. We find that large-scale atmospheric circulation and the position of the climatological 100th meridian have been remarkably stable, despite correspondingly large changes in global climate since the late Miocene.
2.1 Modern hydroclimate of the North American Great Plains
Spring and summer precipitation in the Great Plains overwhelmingly originates from the Gulf of Mexico, where the Bermuda High drives southeasterly flow while a high-pressure system over the Great Basin effectively blocks Pacific moisture. The combination of these two high-pressure systems creates the conditions for the Great Plains low-level jet, which carries moisture deep into the interior of the North American continent (Helfand and Schubert, 1995). Though the precise mechanisms that generate the GPLLJ are complex (see Shapiro et al., 2016), critically for our purposes, both the existence of the high topography of the North American Cordillera and the east–west-sloping terrain of the Great Plains appear crucial for generating and maintaining a low-level jet over the Plains. For example, in model simulations where cordillera topography is removed, the GPLLJ is weakened or non-existent (Ting and Wang, 2006; Jiang et al., 2007). During winter, the GPLLJ is inactive and precipitation originates largely from the Pacific Ocean due to storms routed by the midlatitude westerly jet. These wintertime storms traverse the wide expanse of topography that comprises the North American Cordillera – including ranges such as the Sierra Nevada, Cascades, and Wasatch – which removes moisture from these midlatitude cyclones. Consequently, precipitation across the Plains typically occurs during interaction with cold Arctic air masses that can penetrate as far south as the southern Great Plains (Nativ and Riggio, 1990; Brubaker et al., 1994). Thus, the combination of topography with atmospheric circulation generates much of the seasonal precipitation pattern that prevails today over the Great Plains.
The position of the 100th meridian aridity boundary is shaped by the relative strength of these two circulation systems (Seager et al., 2018b), yielding a sharp humidity gradient that approximately coincides with the boundary between southerly maritime Gulf of Mexico air and dry continental air (Hoch and Markowski, 2005). On an interannual basis, this boundary can shift depending upon the strength of the midlatitude westerlies relative to the GPLLJ; with increasing westerly wind strength, for example, the 100th meridian shifts east (Hoch and Markowski, 2005). On longer timescales, winter aridity and weaker westerlies have been linked to grassland expansion and forest dieback in the Great Plains in the early Miocene (Kukla et al., 2022b). Besides these two large-scale atmospheric systems, several other factors determine the location and orientation of the sharp aridity gradient that characterizes the Great Plains today (Seager et al., 2018b). First, evapotranspiration of water from the land surface to the atmosphere is critical in determining precipitation. For example, return of water to the atmosphere from the land surface (largely through transpiration) may supply up to 40 % of the precipitation in the Great Plains during spring and summer (Burde et al., 2006; van der Ent et al., 2010). The importance of the land surface may be further enhanced by the widespread grasslands that populate the Plains landscape. Grasses can much more rapidly modify their stomatal conductance and, hence, total transpiration than can trees and shrubs to take advantage of periodic rainstorms (Ferretti et al., 2003; Hetherington and Woodward, 2003). Such rapid water use leads to higher recycling rates of water from the land surface back to the atmosphere. As a consequence, the spread of grasslands onto the Plains during the Miocene has been hypothesized to have fundamentally increased the recycling of water between the land surface and the atmosphere (Mix et al., 2013; Chamberlain et al., 2014).
Model simulations project distinct changes in precipitation and hydroclimate associated with dynamical and thermodynamic responses to warming. GCMs and regional climate models robustly predict that precipitation seasonality will shift from the summer to the spring (Cook et al., 2008). As global temperatures rise, the westerly jet shifts poleward, permitting a stronger and more northerly GPLLJ, producing more precipitation in the late spring (Bukovsky et al., 2017; Zhou et al., 2021a). In contrast, the continued northward shift of the GPLLJ as summer progresses weakens the jet over the Great Plains, leading to enhanced late summer drying (Zhou et al., 2021a). Despite this shift in the timing of the wet season, mean annual precipitation is not expected to change (Bukovsky et al., 2017). With constant mean annual precipitation, the increase in PET owed to rising temperatures will decrease the AI and shift the climatological 100th meridian eastward (Seager et al., 2018a).
2.2 Precipitation oxygen isotopes reflect this hydroclimatic pattern
This annual mixing between the GPLLJ and the westerlies results in a steep spatial gradient in precipitation δ18O mostly due to the differences in topography traversed by each air mass (Kendall and Coplen, 2001). Mountain ranges tend to increase the net loss of moisture from an air mass, preferentially removing 18O and decreasing δ18Op (Rozanski et al., 1993; Poage and Chamberlain, 2001; Winnick et al., 2014; Mix et al., 2019; Kukla et al., 2019). Thus, precipitation derived from the westerlies has low δ18O values by the time it reaches the Great Plains. In contrast, GPLLJ moisture, which has not traversed major topographic barriers and is augmented by a high degree of evapotranspiration that replenishes the GPLLJ, is about 10 ‰ higher than equivalent westerly moisture (Mix et al., 2013; Winnick et al., 2014). The aridity gradient, which depends on the relative contributions of westerly vs GPLLJ moisture, is therefore encoded in the value of δ18Op across the Great Plains, which can generally be understood as the precipitation-weighted average of the end-member sources. This precipitation δ18O signal is captured by authigenic carbonates but is further modified by both the temperature of carbonate formation and other potentially spatially variable factors associated with mineral formation, such as differences in precipitation seasonality and evaporation (Breecker et al., 2009; Caves, 2017; Huth et al., 2019; Kelson et al., 2020, 2023).
The sediments of the Ogallala Formation originate from the Rocky Mountains, and eroded material from the Miocene Rockies was transported by braided, high-energy, ephemeral streams and eolian processes across the Plains (Joeckel et al., 2014; Smith and Platt, 2023; Korus and Joeckel, 2023b). The result was the Ogallala Formation, which spans from South Dakota to southern Texas (black outline in Fig. 1). Though the headwaters of these rivers and fans have since been eroded away, except in southern Wyoming, discontinuous remnants of the Ogallala have been mapped nearly up to their sources in eastern New Mexico (Frye et al., 1982). Consisting of gravel, sand, silt, and clay deposits, the Ogallala Formation also contains abundant calcic paleosols and calcic-rich sediments distributed throughout the formation and across the entire N–S extent of the formation (Gustavson, 1996; Joeckel et al., 2014; Smith et al., 2016; Smith and Platt, 2023). The Ogallala Formation in the southern Great Plains unconformably overlies Permian through Cretaceous strata (Gustavson and Holliday, 1999). In the northern Great Plains, the Ogallala Formation is underlain by the late Oligocene to early Miocene Arikaree Group and the White River Group, upper Eocene to Oligocene in age. Chronostratigraphy of the Ogallala Formation is based on fossil vertebrate faunas of Barstovian to Hemphillian North American land mammal ages (NALMAs) and scattered volcanic ash beds and basalt flows (Kitts, 1965; Leonard and Frye, 1978; Frye et al., 1978; Thomasson, 1979; Winkler, 1985; Schultz, 1990; Swisher, 1992; Gustavson, 1996; Tedford, 1999; Tedford et al., 2004; Cepeda and Perkins, 2006; Smith et al., 2016, 2018). Due to the nature of the largely fluvial and eolian deposits, the Ogallala exhibits substantial heterogeneity north to south. Consequently, different workers have classified the Ogallala Formation as a group (in the northern Great Plains) (Tedford et al., 2004) or as a formation, primarily in Kansas and to the south (Gustavson, 1996; Ludvigson et al., 2009). Herein, we refer to the Ogallala exclusively as a formation. However, in the northern Great Plains, there are further distinct formations such as the Valentine, Ash Hollow, and Olcott formations (Joeckel et al., 2014; Smith et al., 2017), each with defined age constraints based upon biostratigraphy and ashes (Tedford et al., 2004). In the southern Great Plains, previous workers have proposed elevating the Ogallala Formation to group status based upon subdividing the Ogallala into the Bridwell and Couch formations (Winkler, 1985; Gustavson and Winkler, 1988). However, in the southern Great Plains, we adopt the terminology of Gustavson (1996), who concluded that these formations are difficult to map and contain little dateable material, suggesting that the Ogallala remain with formation status. The thickness of Ogallala sediments generally varies relative to the underlying topography between 250 m, in regions where it fills paleovalleys, and 10–30 m in the interfluves between paleovalleys (Gustavson and Holliday, 1999). In the southern Great Plains, there is frequently an erosion-resistant caliche or caprock calcrete that separates the Ogallala Formation from the predominantly eolian Plio-Pleistocene Blackwater Draw Formation and, locally, the lacustrine Blanco Formation (Gustavson, 1996; Gustavson and Holliday, 1999). These caliche caprocks are thought to have developed during one or multiple periods of extended landscape stability and likely record a multi-genetic history (Brock and Buck, 2009; Henry, 2017). In contrast, in the northern Great Plains, the Ogallala Formation is overlain by several high-energy deposits, including the Crooked Creek Formation in Kansas and the Broadwater Formation in Nebraska (Swinehart and Diffendal, 1987).
To capture spatial changes in precipitation δ18O – and hence shifts in the aridity gradient – we collected samples spanning nearly the entire N–S and E–W extent of the Ogallala Formation from paleosol authigenic carbonate material to reconstruct paleo-precipitation δ18O. We build upon previous work (Fox and Koch, 2003, 2004) that developed a spatially extensive dataset of paleosol carbonate isotopes, collected primarily to understand changes in C3 and C4 vegetation during the late Miocene. We build upon these datasets, focusing on filling gaps in the southern and southwestern Great Plains (Texas and New Mexico), while also contributing additional data in the central and northern Great Plains.
Though the Ogallala Formation provides an unparalleled opportunity to collect spatially extensive δ18Oc data, the precise chronology of Ogallala deposition remains uncertain. In many places, specific formations have been dated using biostratigraphy and radiometrically dated ashes (Tedford et al., 2004); however, in many other places, particularly those Ogallala outcrops to the west and disconnected from the primary exposure of the Ogallala, temporal constraints are provided by lithologic correlations (Frye et al., 1982). Even in the formations which have been dated using biostratigraphy, the age constraints are relatively broad, typically limited by the precision of the North American land mammal ages. Lastly, the relatively thin veneer of Ogallala sedimentation combined with the potentially long time span covered by deposition suggests that there are frequent and temporally extensive unconformities within many sections (Smith and Platt, 2023). As a consequence, it remains difficult to correlate sections across the large expanse of the Great Plains.
For the purposes of our study, we use the published age constraints (Table 1) either from the study that originally analyzed the sampled section in detail or from later publications that provide a more precise age. Because we are only interested in broadly comparing samples spatially, we treat all samples in a given section as having the same age. We bound this age by considering the maximum possible age range for the given formation, which is either the Ogallala Formation or, in the northern Great Plains, one of the formations within the Ogallala Group. For example, in locations where we sample well-defined and dated subdivisions of the Ogallala Group (for example, samples from the Ash Hollow Formation at Lake McConaughy State Recreation Area in Nebraska; Joeckel et al., 2014), we consider our sample ages to be bound by the full age range of the formation. In other cases, we know only that our data lie above or below a certain dated ash (for example, samples from Wildcat Bluff Nature Center in Texas; Cepeda and Perkins, 2006), and therefore one bound on the age is provided by the dated material. In some cases, the sampled unit has only been correlated with the Ogallala Formation and there are no other age constraints to narrow the large possible range of ages. We therefore adopt the full possible range of ages given the identification of the unit as the Ogallala Formation. For example, for many sections in New Mexico, Ogallala outcrops have been identified by lithologic or geomorphic correlation with the contiguous body of the Ogallala Formation to the east, but no dateable material has been recovered (Frye et al., 1982). Despite these broad age constraints, we find that our results are not sensitive to the uncertainty in our correlations or to the precise chronology of Ogallala deposition because δ18Oc is largely invariant within any given section.
Table 1Site-averaged data. Values of δ13C are reported in ‰ relative to VPDB. Values of δ18O are reported in ‰ relative to VSMOW. n is the number of samples collected from the site. Mean annual temperature data are retrieved from NARR (Mesinger et al., 2006).

Lastly, we also collected samples from the Miocene-age Tesuque Formation within the Santa Fe Group within the Rio Grande Rift. These samples are the only samples we collected west of the original spatial extent of the Ogallala Formation. Unlike the Ogallala Formation, the Santa Fe Group comprises thick basin fill shed off the Sangre de Cristo Range during ongoing rift extension (Galusha and Blick, 1971; Kuhle and Smith, 2001) and chronological constraints are provided by a combination of magnetostratigraphy (Barghoorn, 1981, 1985), biostratigraphy (Galusha and Blick, 1971; Tedford and Barghoorn, 1993; Aby et al., 2011), and radiometric dates (Mcintosh and Quade, 1996; Izett and Obradovich, 2001; Koning et al., 2013). The Tesuque Formation contains abundant authigenic carbonates, including nodules, root casts, groundwater cements, and laterally extensive Bk horizons (Kuhle and Smith, 2001). To place our samples within an existing stratigraphic framework, we collected samples along the Arroyo de los Martinez section and refer readers to Koning et al. (2013) for a detailed description of this section.
4.1 Stable isotope measurements
We collected carbonates (n=344) from paleosols from 32 distinct sites within the Ogallala Formation or from the Tesuque Formation. In every section, we sampled a wide variety of carbonate types, including rhizoliths, nodules, burrows, carbonate-cemented matrix samples, and caliches in order to test whether these different carbonate types reveal different spatial isotope patterns. Individual sample types for each sample are listed in Table S1 in Manser et al. (2023). During sampling, we first removed the weathered surface layer before selecting samples. Sampling sites are shown in Fig. 1a, sample types are depicted in Fig. 2, and coordinates are reported in Table 1. Samples were powdered for isotopic analysis with a Dremel tool or crushed with a mortar and pestle to obtain a homogeneous powder. Before powdering nodules, caliches, and matrix samples, any outer weathered rind was first discarded. Carbon and oxygen isotope ratios of the carbonate were measured with a ThermoFisher Gas Bench II coupled via a ConFlow IV interface to a Delta V Plus mass spectrometer at ETH Zürich following procedures described in detail in Breitenbach and Bernasconi (2011). Briefly, 140–300 µg of the powdered sample, depending on carbonate content, was reacted with five drops of 104 % phosphoric acid at 70 °C in He-flushed exetainers. Each batch of 79 samples included 16 replicates of the internal standards MS2 (δ13C ‰, δ18O ‰) and ETH-4 (δ13C ‰, ) interspersed throughout the run. The standards are used for drift corrections and data normalization and are calibrated to the international reference materials NBS 19 (δ13C ‰, ‰) and NBS 18 ( ‰, ‰; Bernasconi et al., 2018). Analytical reproducibility of the standards was better than 0.1 ‰ (1σ for both δ13C and δ18O). We convert our δ18Oc data from VPDB to VSMOW using the equations in Brand et al. (2014), and we report all δ18Oc data relative to VSMOW.

Figure 2Field photos representing the primary types of authigenic carbonate sampled in this study. (a) Carbonate nodules. (b) Burrows. (c) Root casts. (d) Caprock calcrete, as pictured in SE New Mexico.
4.2 HYSPLIT
Because δ18Op is heavily influenced by the pathway that moisture takes to reach a certain site, we use NOAA's Hybrid Single-Particle Lagrangian Trajectory Model (HYSPLIT) (Draxler and Hess, 1998; Stein et al., 2015) to analyze the pathways by which moisture reaches the Great Plains. HYSPLIT is commonly used to understand modern precipitation δ18Op data (Sjostrom et al., 2006; Bershaw et al., 2012; Li and Garzione, 2017; Zhu et al., 2018; San Jose et al., 2020) and to yield insights into the controls on reconstructed paleo-precipitation δ18O (Oster et al., 2012; Lechler and Galewsky, 2013; Caves et al., 2014, 2015; Wheeler and Galewsky, 2017; Zhu et al., 2018). To track air parcels back in time and space from a given location, we use North American Regional Reanalysis (NARR) data, which have a 32×32 km resolution (Mesinger et al., 2006), as the HYSPLIT climatological model input. To resolve spatial variability in the origins and pathways of storms, we simulate the origin and pathway of the air parcels for four selected sites (32° N and −97° E; 32° N and −105° E; 42° N and −97° E; 42° N and −105° E). At each site, we initialize the air parcel at 1000 m above ground. We choose this height as this level encapsulates much of the bulk moisture transported by the GPLLJ, which has maximum wind speeds between 500–1000 m above ground level (Jiang et al., 2007), and also captures moisture transport by the midlatitude westerlies (Lechler and Galewsky, 2013; Wheeler and Galewsky, 2017). The sites were chosen to encapsulate nearly the full latitudinal and longitudinal range represented by the carbonate stable isotope data. At each site, we generate nearly 53 000 back trajectories (i.e., one trajectory every 6 h from 1980–2016) and filter these trajectories for only those that are estimated to produce precipitation within 6 h of reaching the endpoint (e.g., Lechler and Galewsky, 2013; Caves et al., 2015). This results in approximately 4000 to 11 000 trajectories at each site. We further use HYSPLIT's built-in clustering algorithm to calculate the percentage of trajectories that originate from the Gulf of Mexico. Lastly, we note two critical assumptions regarding this HYSPLIT analysis. First, we assume that, by tracking air parcels using HYSPLIT, we are also tracking moisture; however, HYSPLIT does not account for moisture addition by evaporation or removal by precipitation and does not track diffusion of moisture into and out of an air mass. The assumption of moisture transport by advection is sometimes violated in regions of strong air mass mixing, such as in the Great Plains (Draxler and Hess, 1998); however, comparison of HYSPLIT results with the results of a more rigorous moisture tracking model – the Water Accounting Model (WAM-2layers) – generally shows close agreement (Driscoll et al., 2024). Second, our HYSPLIT results are strictly only applicable to understand the modern climate. Nevertheless, we use these results to develop insights into the controls on past precipitation δ18O.
4.3 Vapor transport model
Given the moisture pathways predicted by HYSPLIT, we use a one-dimensional vapor transport model (Kukla et al., 2019) to predict the isotopic composition of precipitation transported along these pathways. This model links spatial patterns of δ18Op to the balance of three moisture fluxes – precipitation (P), evapotranspiration (ET), and transport. It uses energetic and mass balance limits on evapotranspiration to place constraints on the relationship between P and ET, which is a key parameter that controls spatial patterns of δ18Op (Salati et al., 1979; Gat and Matsui, 1991; Lee et al., 2007; Winnick et al., 2014; Bailey et al., 2018; Kukla et al., 2019). Together with the dry and moist adiabatic lapse rate (Γ, K m−1) and an assumed environmental lapse rate (γ, K m−1), orographic rainout is incorporated into the model following the work of Smith (1979) and Smith and Barstad (2004). Though there are a variety of topographic parameterizations, for our simulations of westerly-derived moisture we use an idealized topography with a Gaussian-shaped mountain range combined with an orogenic plateau in the lee of the range. In our simulations of GPLLJ δ18Op, we assume flat terrain. Even though the Plains gently rise by more than 1000 m from the Gulf Coast to the Front Range, the model of orographic precipitation applies to adiabatic ascent over topography – a process that does not occur over the Plains. Equation (1) is used to calculate the column-integrated precipitable water content (w, kg m−2) as a function of advection (u, m s−1; the movement of an air parcel) and eddy diffusion, precipitation (P, kg m−2), and evapotranspiration (ET, kg m−2 s−1) (Kukla et al., 2019).
where t is time and D is the coefficient for eddy diffusion (m2 s−1).
Equation (2) is used to calculate the isotopic ratio of precipitable water (rw) over space (x) in steady state following Eq. (1). The isotope ratio of precipitation (rP) is derived by assuming equilibrium fractionation during moisture condensation. The isotope ratio of ET (rET) is derived as a function of the transpired fraction of ET () and the balance of equilibrium and kinetic isotope fractionation. For further details, we refer the reader to Kukla et al. (2019).
Here, r refers to the 18O 16O ratio and subscripts ET, P, and w refer to evapotranspiration, precipitation, and precipitable water, respectively.
Equations (1) and (2) ensure mass conservation and permit the reduction of precipitable water and of the 18O of precipitable water by precipitation. Mass conservation relationships between potential evapotranspiration (PET), evapotranspiration (ET), and precipitation (P) are encapsulated within a Budyko hydrologic balance framework that limits moisture recycling based on energy (when PET ≤ P) or water (when P ≤ PET). Equation (3) can be used to calculate a so-called “Budyko curve”, which determines a unique hydroclimate solution for each isotope gradient using a given value of ω – a non-dimensional free parameter that captures land surface characteristics (such as vegetation, bedrock lithology, ruggedness) and modulates the partitioning of precipitation into either runoff or evapotranspiration (Budyko, 1974; Fu, 1981; Zhang et al., 2004; Greve et al., 2015; Kukla et al., 2019).
To populate the parameters in this model, we again use North American Regional Reanalysis (NARR) data (long-term monthly mean for years 1979–2000) (Mesinger et al., 2006). We show input values for model parameters in the Appendix (Table A1). For ω, we use the global mean value of 2.6 (Greve et al., 2015). For the transpired fraction of ET () we use a value of 0.64 (Good et al., 2015).
We simplify the longitudinal differences in simulated GPLLJ trajectories (see Fig. 3) as a 1-D storm track that transports moisture from the Gulf of Mexico to the Great Plains. To reflect the general curvilinear trajectories of the GPLLJ, partly caused by the influence of the North American Cordillera (Jiang et al., 2007), we implement a bend in our simplified trajectories at 32° N. From this bend, the simulated trajectory runs along the 101° meridian. This trajectory ends at 43° N, the latitude of our northernmost site. This trajectory passes over the middle of the present-day exposure of the Ogallala Formation and, hence, captures a representation of the atmospheric processes that result in δ18Op over the Great Plains.
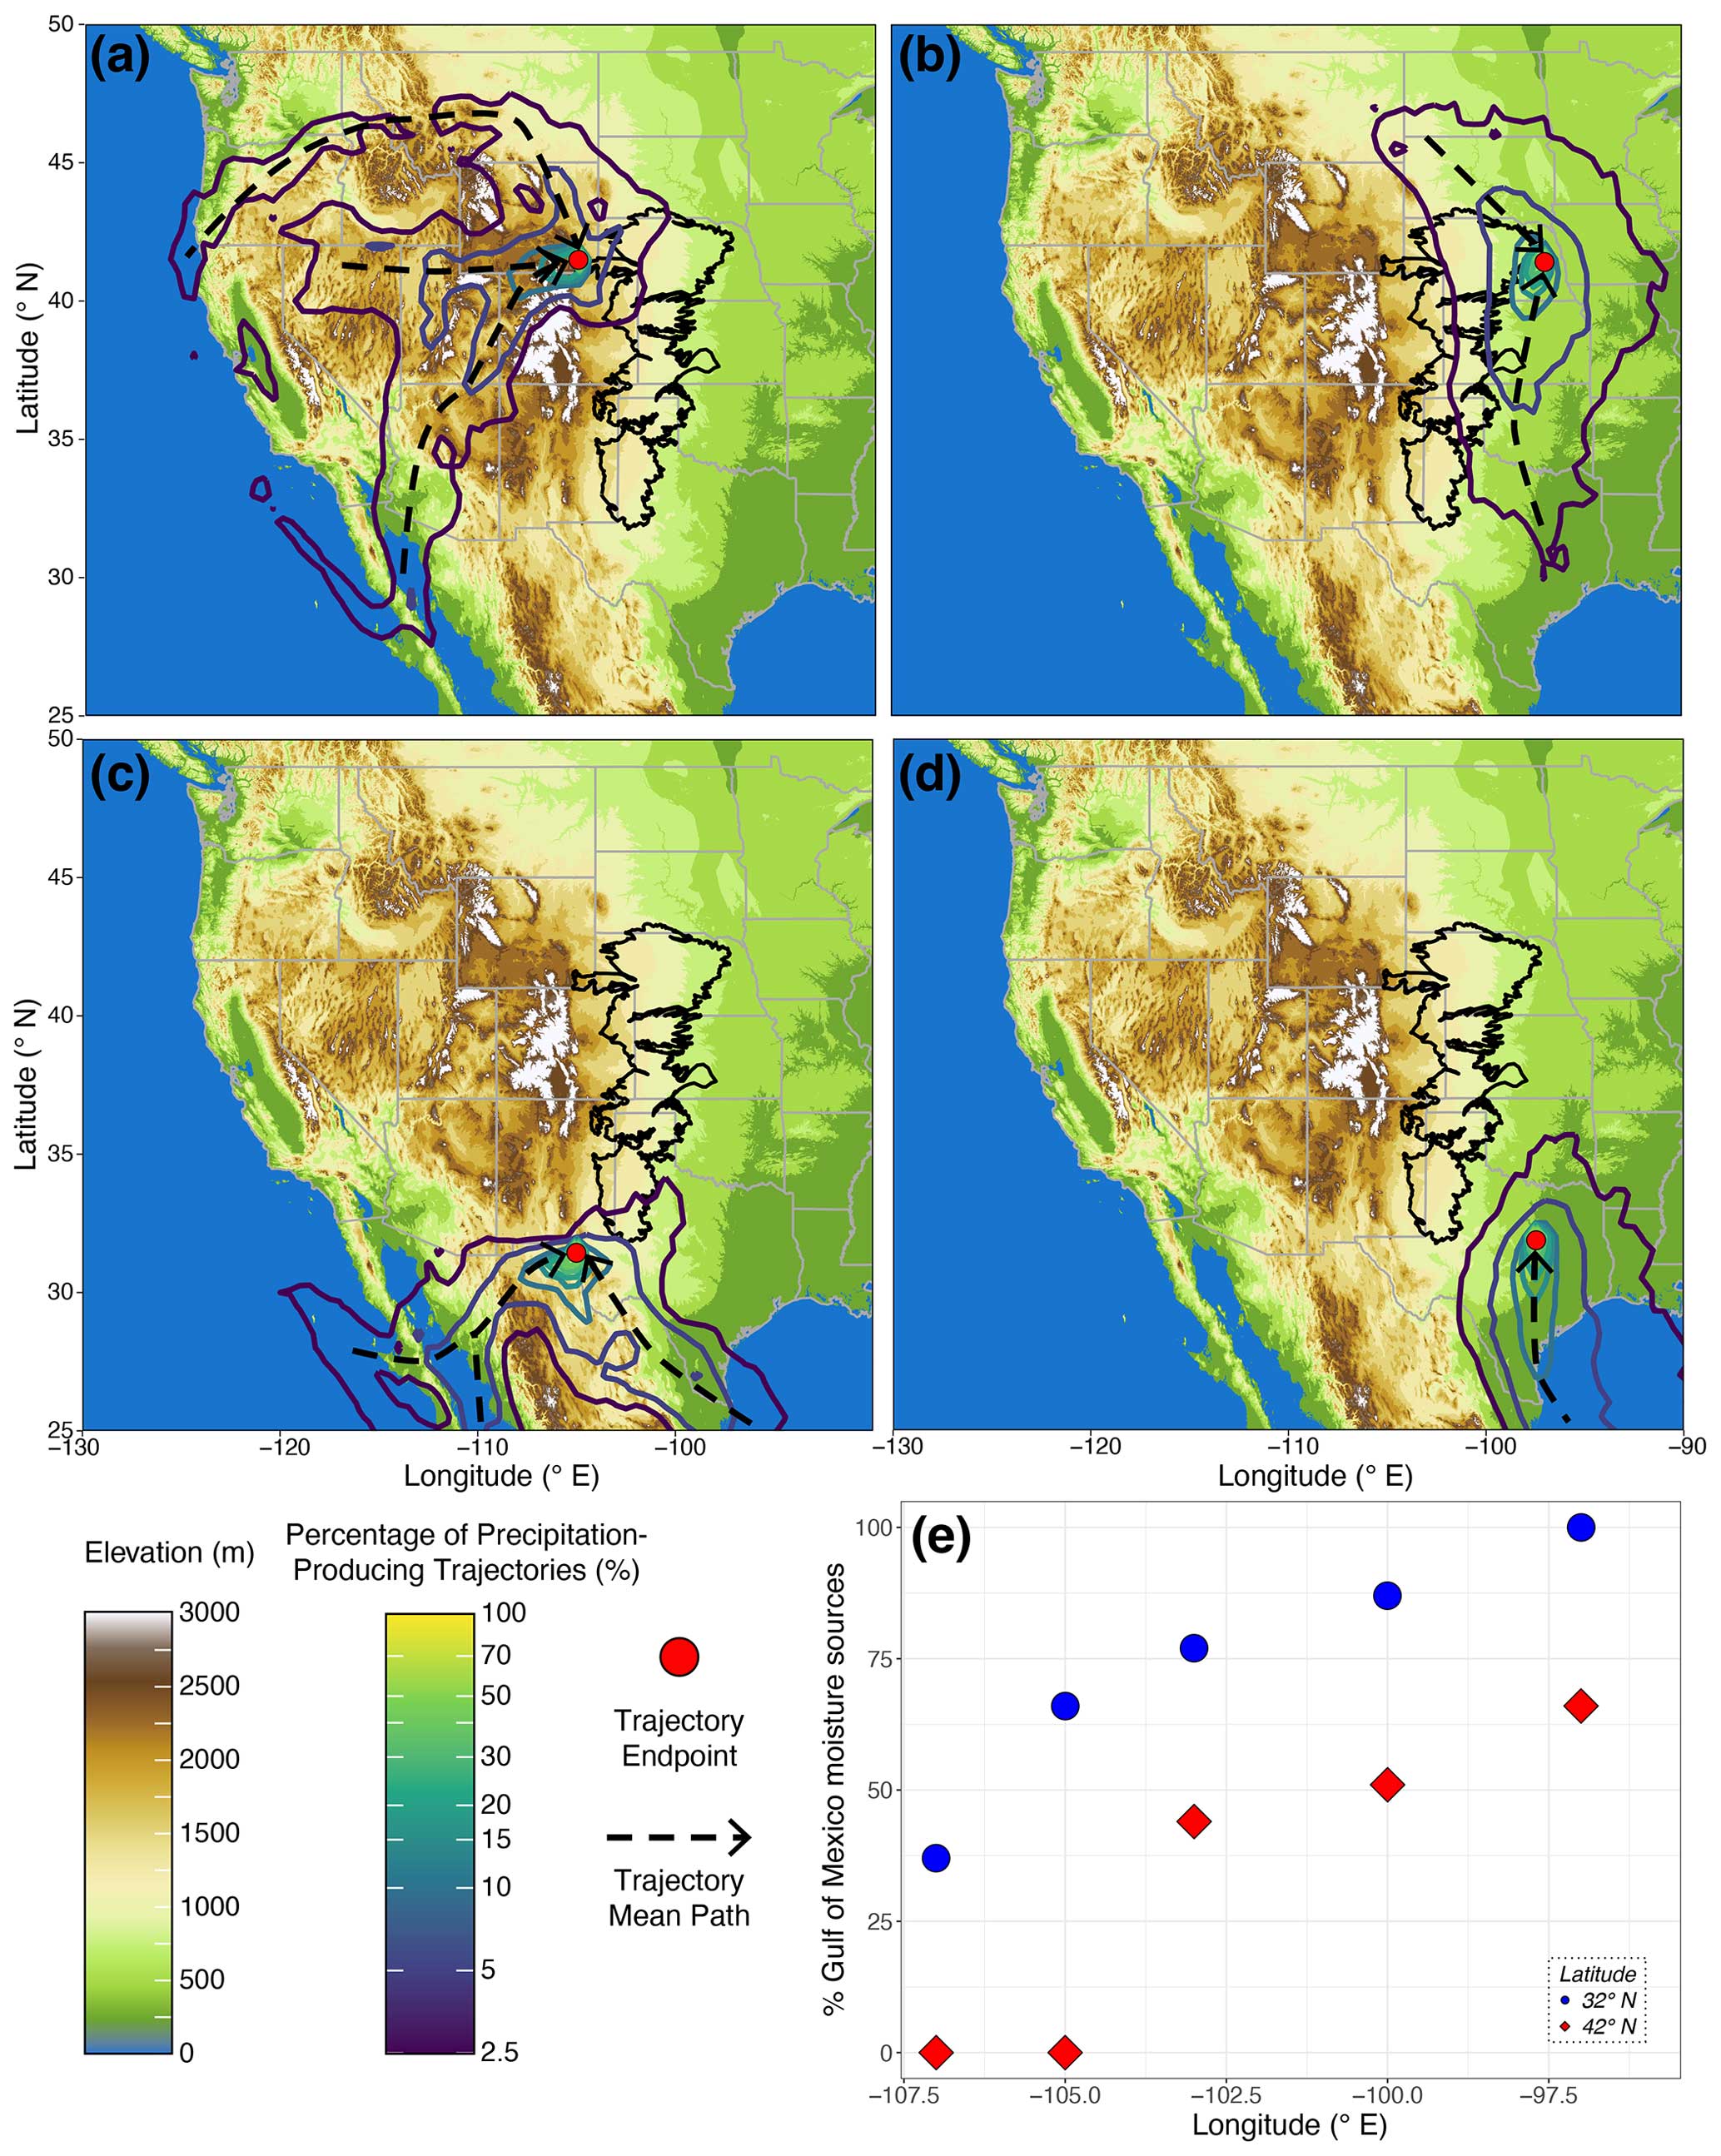
Figure 3Map showing the percentage of precipitation-producing storm tracks at four localities on the Great Plains that bound the latitudinal and longitudinal extent of our data. HYSPLIT air parcels at all four sites are initialized at 1000 m above ground. (a) 42° N, −105° E. (b) 42° N, −97° E. (c) 32° N, −105° E. (d) 32° N, −97° E. The resulting mean storm trajectories are demarcated with dashed black lines with an arrow showing the direction of transport. In panels (a)–(d), the extent of the Ogallala is shown in black. (e) An estimate of the percentage of gulf and southeasterly moisture that reaches each location as a function of longitude. Red points represent a transect of HYSPLIT simulations along the 42° N parallel; blue points represent a transect of HYSPLIT simulations along the 32° N parallel.
To test for the influence of westerly moisture in the Great Plains (as indicated by the HYSPLIT results), we initialized the vapor transport model with annual mean NARR data interpolated to a simplified 1-D trajectory representing the westerlies (Fig. 8). The trajectory latitude is chosen to lie between the northern and southern boundary of the Ogallala Formation. To account for the known effects of orographic rainout on westerly moisture (Friedman et al., 2002; Lechler and Galewsky, 2013; Mix et al., 2019), we use a simplified topography, based on the modern observed topographic profile, that follows a Gaussian-shaped mountain with a flat plateau in the lee.
5.1 Moisture sources and precipitation trajectories
Contour plots in Fig. 3a–d show the percentage of trajectories that produce precipitation at 1000 m above ground level for each of the plotted locations over the course of a year. Western sites receive a substantial portion of their moisture from westerly or southwesterly trajectories that traverse the high topography of the North American Cordillera. In particular, the northwesternmost site (Fig. 3a) receives little moisture from the gulf. In contrast, the southeasternmost site (Fig. 3d) receives predominantly gulf moisture. These patterns vary somewhat seasonally, with gulf and southeasterly moisture more dominant in the spring and summer months and westerly moisture more dominant in the winter months. Our results from HYSPLIT's clustering algorithm show that northern locations receive less gulf and southeasterly moisture than southern locations; however, regardless of latitude, the percentage of storms sourced from the gulf increases to the east (Fig. 3e).
5.2 δ18Oc and δ13C results
Our new δ18Oc data range from a minimum of 17.0 ‰ to a maximum of 27.3 ‰ (Table S1 in Manser et al., 2023). When averaged by section, our new δ18Oc data range from 19.6 ‰ to 26.8 ‰ (Table 1). The compiled data have a much larger range, reflecting their larger latitudinal distribution, with the average section δ18Oc ranging from 13.6 ‰ to 27.0 ‰ (Appendix Table A2). Within individual sections, there is very little variance: the mean range and standard deviation of δ18O in individual sections are ±1.8 ‰ and ±0.68 ‰, respectively, indicating that temporal shifts in δ18Oc in the sampled sections are small (Table 1; Fig. 4b). If we exclude data outside Ogallala Formation, the mean range and standard deviation of δ18Oc in individual sections are lower at ±1.7 ‰ and ±0.6 ‰, respectively, indicating that carbonates in the Ogallala Formation have very little variance.
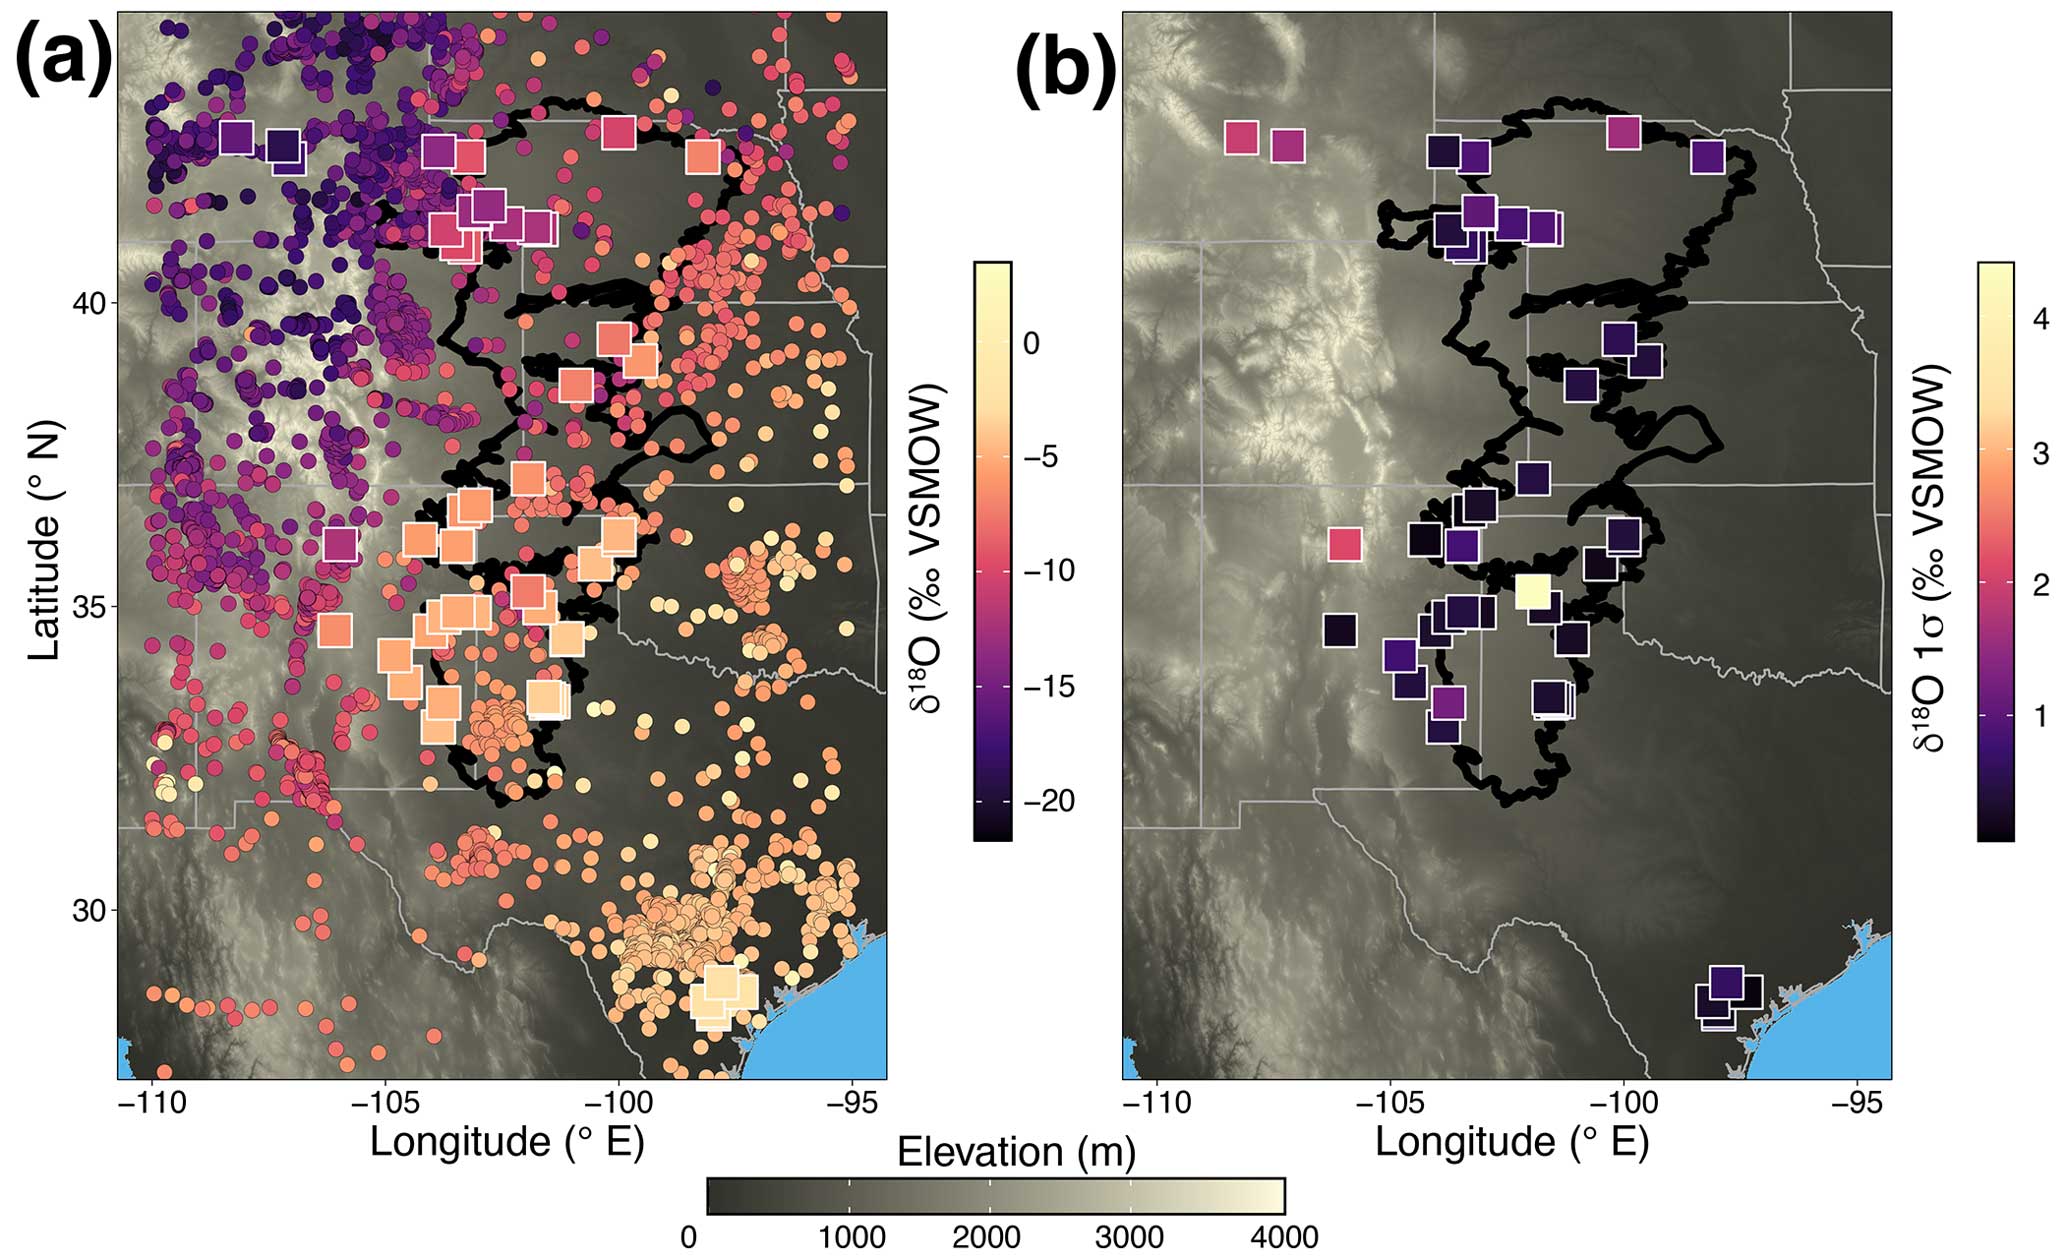
Figure 4Spatial distribution of δ18O (a) and reconstructed δ18Op 1σ (b). (a) Comparison of reconstructed δ18Op from δ18Oc (large squares) calculated using the yearly mean of monthly long-term temperature data retrieved from NARR for each site. Modern meteoric water δ18O (small circles) is derived from modern groundwater, river water, or stream water retrieved from Waterisotopes.org (Waterisotopes Database, 2019). Data points are colored by their δ18O values. (b) The 1σ of the reconstructed δ18Op derived from the variability in the δ18Oc values from each stratigraphic section. In both panels, the black polygon marks the extent of modern-day exposure of the Ogallala Formation.
Our new Ogallala δ13C data have a mean value of −6.14 ±1.4 (1σ) ‰ (Table 1) (excluding data from the Tesuque Formation). In contrast, our compiled Ogallala Formation data have a mean δ13C value of −6.74 ±0.8 (1σ) ‰. This discrepancy is due to relatively high δ13C values in the sections in New Mexico identified via lithologic or geomorphic correlation by Frye et al. (1982) to be Ogallala outcrops. When these Frye et al. (1982) data are excluded, the mean δ13C value in our new data is −6.69 ±0.9 (1σ) ‰, which is statistically indistinguishable from the compiled data δ13C mean.
5.3 Spatial distribution of δ18Op
For each site, we calculate a mean reconstructed δ18Op value and compare these mean values with modern water δ18O (retrieved from Waterisotopes.org; Waterisotopes Database, 2019). To reconstruct paleo-precipitation δ18O, we use the modern 2 m air temperature from NARR to estimate the formation temperature of soil carbonate along with the fractionation factors of Kim and O'Neil (1997). Means, standard deviations, and full δ18O ranges for each site with new data are presented in Table 1, and the previously published δ18O data – converted to paleo-precipitation δ18Op – are presented in Appendix Table A2. All of the δ18Oc data are available as supporting material (Table S1) in Manser et al. (2023). The spatial distribution of the reconstructed δ18Op shows a nearly identical spatial distribution to that of modern δ18O (Fig. 4a). From the Gulf Coast inland, paleo-δ18O follows the modern δ18O gradient, with lower values to the west and to the north. The maximum change in both paleo-δ18O and modern δ18O occurs along a southeast–northwest trend, running roughly from the Gulf Coast in Texas to northern Colorado.
We further test whether decreasing temperatures northward significantly influences our reconstructed δ18Op values. The modern mean annual temperature gradient in the Great Plains (from 28.3 to 43° N) is −1.2 °C per 100 km. In June–July–August (JJA), this gradient is reduced to 0.4 °C per 100 km. We use these two temperature gradients to calculate the effect of changing the spatial pattern of temperature on our reconstructed δ18Op, as well as testing a hypothetical case with latitudinally constant temperature of 25° C. Using the JJA temperature gradient, the reconstructed δ18Op gradient is slightly shallower (red circles in Fig. 5) compared to the modern δ18O gradient (gray dots) and compared to the reconstructed δ18Op gradient (blue circles) using modern yearly mean NARR temperature data (Fig. 5b). The likely maximum difference that a reduced temperature gradient – relative to the modern – can impart on our results is captured in the scenario of spatially uniform temperatures, which represents an extreme end-member scenario where poleward warming in a higher-CO2 world results in a negligible latitudinal temperature gradient. Even spatially uniform temperatures only result in an increase of 2.9 ‰ in the northernmost sites relative to the assumption of a modern temperature gradient, still within the range of modern δ18O across the Plains. These results suggest that our reconstructed δ18Op values are relatively insensitive to assumptions of carbonate formation temperatures in a warmer world with a potentially reduced meridional temperature gradient (Feng et al., 2016; van Dijk et al., 2020).

Figure 5(a) Reconstructed δ18Op plotted against latitude. Reconstructed δ18Op is calculated assuming a spatially uniform temperature of 25 °C (yellow circles), annual mean temperatures (blue circles), or June–July–August (JJA) mean temperatures (red circles). Annual mean and JJA temperatures are taken from monthly long-term mean data retrieved from NARR (Mesinger et al., 2006). Gray circles are modern meteoric water δ18O, including groundwater and river or stream water, retrieved from Waterisotopes.org (Waterisotopes Database, 2019). (b) The same as (a) but the x axis sets the southernmost data (∼28° N) to zero to emphasize the effect on the spatial gradient in δ18O.
There is not only a pronounced N–S δ18O gradient in the paleo-data, but also substantial W–E variation. Figure 6 shows modern and reconstructed δ18Op plotted against longitude using the NARR mean annual temperature to constrain the formation temperature of carbonate. Again, as with the comparison against latitude (Fig. 5), all reconstructed δ18Op estimates fall within the same range as the modern δ18O when projected to longitude. Though again this conclusion is tempered by our assumption of carbonate formation temperatures, we suggest, as above, that this is likely to be a negligible effect, particularly given the relative insensitivity in the 18O fractionation factor to temperature (∼0.2 ‰ K−1) (Kim and O'Neil, 1997).

Figure 6Modern meteoric water δ18O (small, gray circles) and reconstructed δ18Op (large, colored circles) versus longitude. Reconstructed δ18Op is colored with respect to latitude. Modern meteoric water data include δ18O data from groundwater, river water, and stream water retrieved from Waterisotopes.org (Waterisotopes Database, 2019). Vertical error bars are 1σ of the mean section δ18O data.
5.4 Reactive transport modeling of δ18Op
The vapor transport model (Kukla et al., 2019) allows us to predict δ18Op along a given storm track, reflecting the balance between transport, precipitation, and evapotranspiration. Our model of GPLLJ δ18Op simulates higher δ18O at the end of the trajectory compared to both modern and reconstructed δ18Op values (Fig. 7a). Consistent with higher δ18O values, the model also predicts higher atmospheric moisture content and relative humidity than indicated by NARR, suggesting it is underpredicting rainout from air masses that reach the northern plains or that the single air mass assumption implicit in this model is not valid in this region (Fig. 7b).
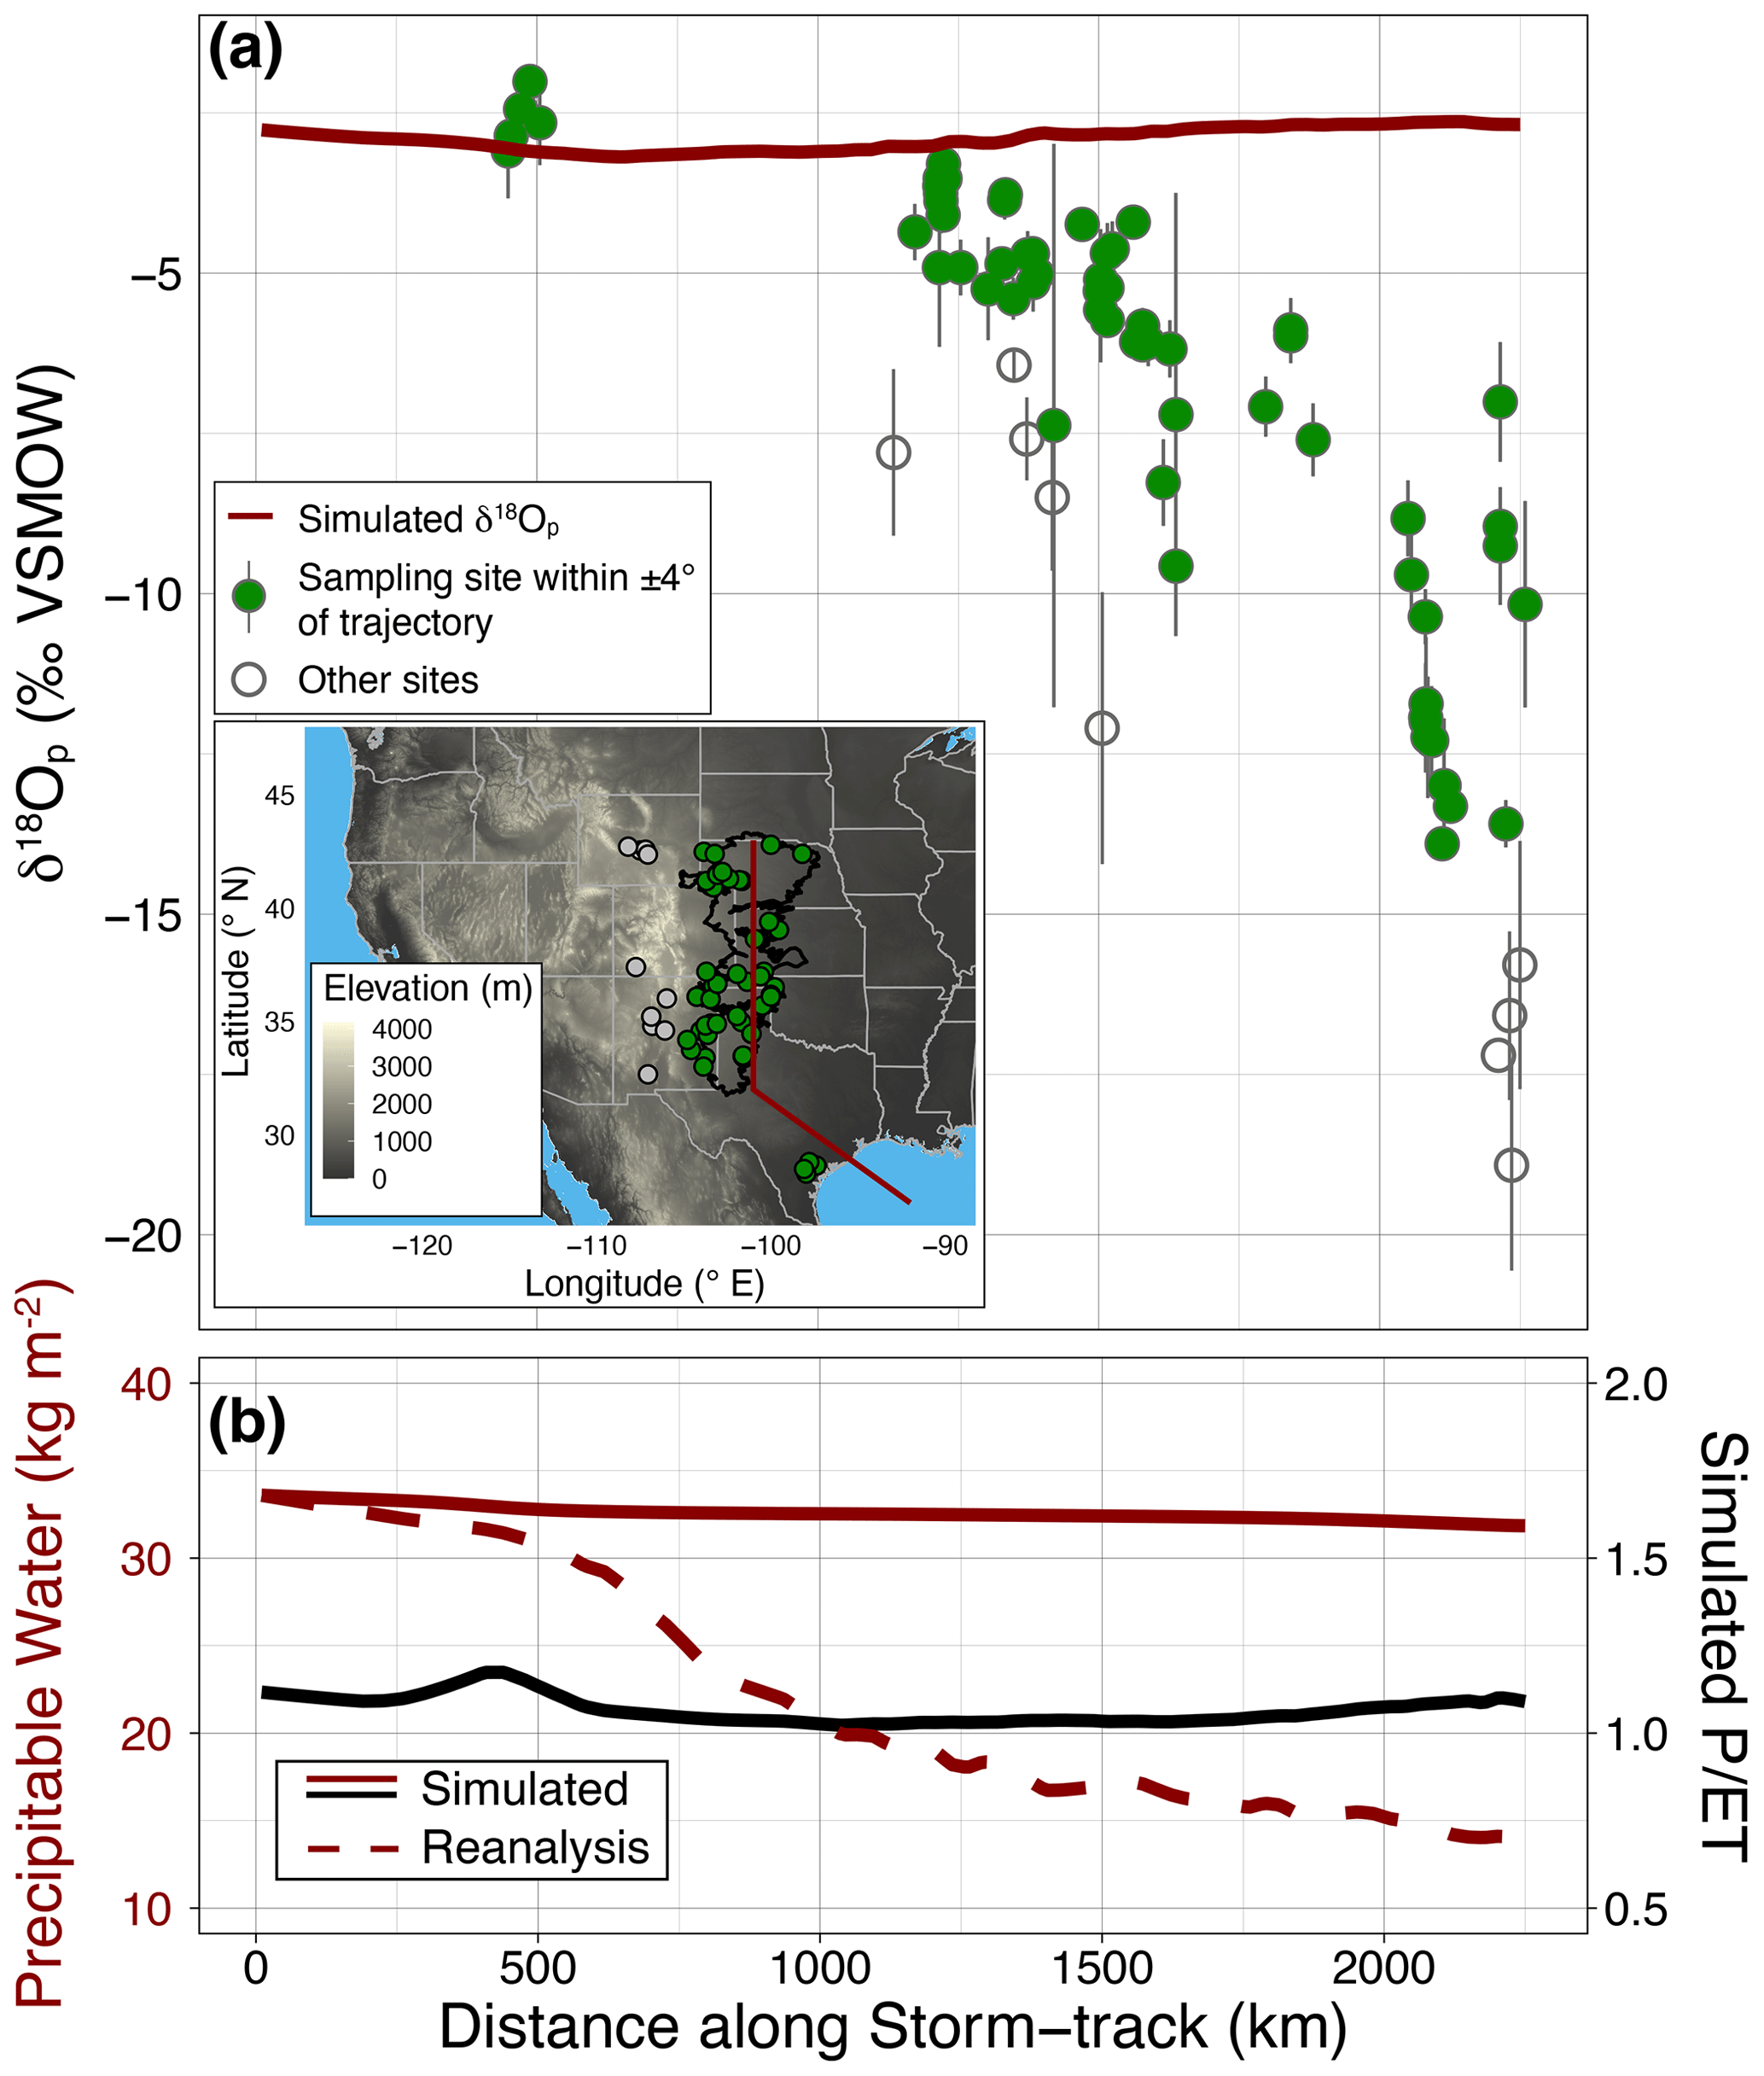
Figure 7Vapor transport model simulation of δ18Op along an idealized Great Plains low-level jet (GPLLJ) trajectory. (a) The red line is the modeled δ18Op along the simulated storm track (exact location of the storm track is shown as a red line in the inset). Green points are reconstructed δ18Op within ±4° longitude of the trajectory. Gray circles are data greater than ±4° longitude from the simulated trajectory. Vertical error bars are 1σ of the mean section reconstructed δ18Op. (b) Simulated precipitable water (solid red) and P ET (solid black) plotted along the simulated storm track. The dashed line shows the actual annual mean precipitable water along this storm track retrieved from NARR.

Figure 8Vapor transport model simulation of δ18Op along an idealized westerly trajectory. (a) The red line is the modeled δ18Op along the simulated storm track (exact location of the storm track is shown as a red line in the inset). Green points are reconstructed δ18Op data within ±4° latitude from the storm track. Large, unfilled gray circles are data greater than ±4° latitude from the simulated trajectory. Vertical error bars are 1σ of the mean section reconstructed δ18Op. Small gray circles are modern meteoric water δ18O, including stream water, river water, and groundwater, retrieved from Waterisotopes.org (Waterisotopes Database, 2019). The gray line is a kernel-smoothed average of the meteoric water δ18O against distance along the storm track. (b) Simulated precipitable water (solid red) and P ET (solid black) plotted along the simulated storm track. The dashed line shows the actual annual mean precipitable water along this storm track retrieved from NARR.
Our model of westerly moisture δ18Op suffers from a similar mismatch between simulated δ18Op and both modern δ18O and reconstructed δ18Op (Fig. 8a). Though our westerly trajectory uses an idealized topography to simulate the topography of the North American Cordillera, we are able to approximately reproduce the decrease in δ18Op that occurs close to the coast of North America. Variations in simulated δ18Op after the initial orographic rainout are primarily driven by temperature that varies with elevation in the NARR data. This leads to minor discrepancies where elevation decreases δ18Op in modern waters but increases δ18Op in the model due to colder temperatures raising δ18Op. Nevertheless, simulated δ18Op approximates meteoric water δ18O along the westerly trajectory until this trajectory reaches the Great Plains at a distance of around 1550 km. At distances larger than this, the model substantially underestimates meteoric water δ18O and reconstructed δ18Op on the Great Plains. Again examining climatological measures related to δ18Op, there is a distinct discrepancy in atmospheric moisture content between the modeled output and the NARR data over the Great Plains at a distance of around 1550 km from the starting point of the simulated westerly trajectory (Fig. 8b).
Our new spatially resolved data provide insight into moisture transport to the Great Plains during the late Neogene. In brief, the overall constancy of δ18O between the late Miocene and the present suggests that the features of atmospheric circulation most responsible for moisture delivery to the Great Plains today – notably the Great Plains low-level jet and the wintertime westerlies – have likely been the dominant features since at least the late Miocene. Further, that the reconstructed δ18Op gradient is indistinguishable from today's δ18O gradient indicates that the balance of GPLLJ and westerly moisture has hardly changed since the late Miocene. Either these circulation features have undergone no substantial change in net rainout, or, if one has, its effect was masked by countervailing changes in the other. Overall, these results bolster earlier findings by Fox and Koch (2004), who found a consistent south-to-north gradient in δ18Oc in the Great Plains that they attributed to a similar latitudinal temperature gradient in the Miocene.
Below, we discuss our findings in more detail, place these data in the context of previous work in the region, and discuss how our new data permit a re-interpretation of the controls on long-term climate in the Great Plains. We also discuss several important caveats in our data that point towards the need for future work to study more nuanced changes in climate than can be resolved with this dataset.
6.1 Constancy of δ18Op in relation to climate change
The Miocene was warmer than the present day, particularly during the Miocene Climate Optimum (MCO) (Westerhold et al., 2020; Steinthorsdottir et al., 2021), and was characterized by a long-term cooling trend after the MCO (Herbert et al., 2016). Even after this cooling interval, the lack of extensive Northern Hemisphere ice sheets and likely a smaller Antarctic ice sheet indicate that the late Miocene was warmer than today, with a reduced latitudinal temperature gradient (LaRiviere et al., 2012; Feng et al., 2016). The warmer climate and shallower temperature gradient could impact δ18Op, yet the decrease in reconstructed δ18Op with latitude appears identical to today (Fig. 4). This result is perhaps not surprising, since temperature appears to have only a secondary effect on the latitudinal gradient of δ18Op (Fig. 5a). Instead, such constancy in δ18Op through time indicates that the mixing of westerly and southerly moisture – the primary control on the latitudinal δ18O gradient – was similar to today.
The results of our vapor transport modeling support the contention that mixing between dry, low-δ18O westerly air masses and moist, high-δ18O southerly air masses is required to explain the long-standing presence of this steep latitudinal gradient in δ18Op. The vapor transport model adequately predicts δ18Op in westerly- or GPLLJ-dominated regions, but it performs poorly where these air masses meet (Figs. 7 and 8). Air mass mixing is neglected in the 1-D vapor transport model, so the model's poor performance in these regions points to mixing as an important control on the latitudinal δ18Op gradient. Notably, this region of air mass mixing is closely tied to the east–west aridity gradient because it tracks the trade-off between drier westerly air and the wetter GPLLJ. Thus, the surprisingly static spatial δ18Op pattern across the Great Plains since the Miocene could be interpreted to reflect no change in the relative mixing of dry and moist air masses over time, maintaining the spatial pattern of the modern aridity gradient. The presence of the North American Cordillera – likely high since the Eocene (Chamberlain et al., 2012; Mix et al., 2013) – suggests that orographic rainout on the western margin of North America is also a long-standing feature, resulting in low-δ18O moisture that is advected to the Great Plains from the west. What is more surprising is that the strength of the GPLLJ appears to be similar to today even in the warmer Miocene, given that this jet and its moisture transport are likely to be sensitive to global climate change (Cook et al., 2008; Zhou et al., 2021a).
Overall, our vapor transport modeling indicates that a purely southerly source of moisture would result in δ18Op values that are too high in the northern plains (Fig. 7), whereas a purely westerly source brings δ18Op values that are too low (Fig. 8). To be clear, a static δ18Op gradient does not require static precipitation and evaporation rates over time. In contrast, precipitable water, P, and E likely all increased in the warmer Miocene (Held and Soden, 2006; Siler et al., 2018), but in such a way that net rainout (and thus the δ18Op fingerprint of hydrological change) did not vary substantially.
6.2 Additional factors that influence δ18Oc
There are a number of additional factors, both climatic and non-climatic, that may affect the δ18Oc data, potentially decoupling δ18Oc values from δ18Op and conflicting with our interpretation above. Such factors include changes in soil temperatures and evaporation and also imprecision in the chronologies of the sections we sampled. Below, we discuss these factors and why our interpretations are robust to assumptions regarding these factors.
6.2.1 Effect of temperature and evaporation on δ18Oc
Given that temperature affects the fractionation of 18O between water and calcite (Kim and O'Neil, 1997), spatial changes in temperature may alter our reconstructed δ18Op gradient. However, we found that even extreme scenarios for changes in the spatial pattern of temperature over the Great Plains (ranging from the modern annual average latitudinal temperature gradient to a null latitudinal temperature gradient) had only a small effect on the overall latitudinal gradient of reconstructed δ18Op (Fig. 5). We therefore conclude that, while temperature change since the Miocene has likely impacted the absolute value of δ18Oc, it does not substantially alter our conclusion that the reconstructed δ18Op spatial pattern is similar to today.
While the spatial pattern of temperature change in the Plains does not appear to have had a major influence on our reconstructed δ18Op gradient, for any reasonable temperature scenario (annual, JJA, or spatially uniform 25 °C), reconstructed δ18Op absolute values are typically higher than modern δ18Op by 2 ‰–3 ‰. Fox and Koch (2004) also found that δ18Oc was typically higher than predicted, particularly in the southern Great Plains, and attributed this observation to both higher temperatures and δ18Op. We suggest that, while the gradient of δ18Op does not appear to have substantially changed since the Miocene, the starting value of marine vapor δ18O may have been slightly higher in the warmer Miocene due to elevated precipitable water, elevating δ18Op across the Great Plains (i.e., van Dijk et al., 2020).
Recent work has indicated that evaporative conditions (i.e., low AI values) may elevate δ18Oc, thereby leading to an overestimate of δ18Op (Kelson et al., 2023). We suggest that our overall conclusion of a similar spatial pattern of δ18Op in the late Miocene is likely not overly influenced by changes in the spatial pattern of evaporation. Today, the latitudinal gradient in AI is negligible (Seager et al., 2018b); instead, the strongest gradient in AI is west to east (Fig. 1). Consequently, the stark latitudinal gradient in reconstructed δ18Op is unlikely to be driven by differential evaporative conditions. While higher marine vapor δ18O may explain the elevated reconstructed absolute δ18Op values (2 ‰–3 ‰ above modern meteoric water δ18O), another explanation may be pervasive evaporative enrichment of pedogenic carbonates across the Great Plains, though this evaporative enrichment does not appear to vary latitudinally.
6.2.2 Changes in precipitation seasonality
Soil carbonates are thought to form mostly seasonally, particularly in the warm season and perhaps as soils dry and plants senesce, causing soil CO2 to decline and carbonates to form (Breecker et al., 2009; Huth et al., 2019). However, the timing of soil carbonate formation may shift as the timing of precipitation and plant productivity varies due to climate change, and such shifts have been invoked to explain a wide range of soil carbonate records in the western US and elsewhere (Caves, 2017; Kukla et al., 2022b; Rugenstein et al., 2022). GCMs indicate that precipitation seasonality over the Great Plains will change substantially in a warmer world, with precipitation shifting towards the spring and away from the late summer (Cook et al., 2008; Bukovsky et al., 2017; Zhou et al., 2021a). Though it is difficult to assess the timing of even modern soil carbonate formation in the Great Plains, our reconstructed Miocene δ18Op data agree most closely with modern water δ18O when using mean annual temperatures. Though we have no a priori reason to suspect that Miocene carbonates may record mean annual temperatures, this close agreement suggests that Miocene carbonates may have formed in the shoulder seasons (i.e., spring and fall), thereby recording intermediate temperatures and, likely, a mixture of summertime GPLLJ moisture and wintertime westerly moisture.
That Miocene soil carbonates formed in the shoulder seasons would help to reconcile our findings of a largely invariant spatial pattern of δ18Op since the Miocene with previously published records that show a large (2 ‰–4 ‰) increase in δ18Oc during the Pliocene–Quaternary in the Great Plains (Fox et al., 2012; Mix et al., 2013; Chamberlain et al., 2014). We suggest that this discrepancy (i.e., a static late Miocene δ18Op spatial pattern but increasing δ18Oc in the Pliocene–Quaternary) likely arises due to changes in the seasonality of soil carbonate formation between the late Miocene and Quaternary. For example, as the world cooled into the Quaternary, the southward shift of the westerly jet would suppress the springtime GPLLJ, while enhancing GPLLJ precipitation over the Great Plains during the summer – the opposite response than observed in GCMs as CO2 rises (Cook et al., 2008; Bukovsky et al., 2017; Zhou et al., 2021a). Such a seasonality shift might shift the timing of soil carbonate formation towards the summer, elevating δ18Oc as it records higher summertime δ18Op (Liu et al., 2010) and thereby elevating δ18Oc relative to the late Miocene.
6.2.3 Imprecision in chronologies and timing of carbonate formation
Our interpretation hinges upon correlating sections across the vast expanse of the Great Plains; however, ages for many Ogallala sections are only poorly constrained, typically via biostratigraphy (Kitts, 1965; Skinner et al., 1977; Thomasson, 1979; Winkler, 1987, 1990; Tedford et al., 2004) or, less frequently, via radiometric dates (Swisher, 1992; Cepeda and Perkins, 2006; Henry, 2017; Smith et al., 2018). Where biostratigraphy has been used, age resolution is typically limited to the scale of the North American land mammal ages. In many places in eastern New Mexico, the Ogallala Formation is recognized by its clay lithology and its topographic position relative to the laterally extensive caprock to the east (Frye et al., 1978, 1982). Further, the character of Ogallala deposition – large alluvial megafans that gradually filled in pre-existing valleys and covered intervening interfluves combined with its relative thinness – suggests that deposition was often sporadic with frequent and cryptic unconformities associated with many of the paleosols distributed throughout the formation. Consequently, correlations across the entirety of the Ogallala Formation are likely to be imprecise and our treatment of the data likely mixes data from the late middle Miocene and the latest Miocene.
Nevertheless, this imprecision in correlation likely does not affect our conclusions. We note that nearly all of our sections have low δ18Oc variability (Fig. 4b; Table 1), suggesting that, throughout deposition of the Ogallala, there was very little change in δ18Op. Ludvigson et al. (2016), analyzing two cores drilled through the Ogallala Formation in western Kansas, found similarly very low variability in δ18Oc across the 50–60 m of sampled core material. This low variability, which contrasts with sections located to the west within the North American Cordillera, indicates that even large discrepancies in correlated sections likely do not affect our overall conclusion that the south-to-north δ18Op gradient has remained similar to today since the late Miocene.
Further, previously published Neogene δ18Oc records show almost no change in δ18Oc during the Miocene (Fox and Koch, 2004; Mix et al., 2013; Chamberlain et al., 2014), again suggesting that imprecision in our correlations is not likely to impact our conclusions. In contrast, modeling studies that have examined changes in δ18Op in the Great Plains in the Miocene have suggested that the south-to-north δ18Op gradient should increase by several per mille as a consequence of higher CO2 and a shallower Equator-to-pole temperature gradient (Feng et al., 2016; Lee, 2019). These studies used boundary conditions thought to approximate the middle Miocene, with atmospheric CO2 of 560 ppm. Disagreement between our results and these model results may arise for a variety of reasons. One such reason may revolve around uncertainty in dating of the Ogallala Formation. While these modeling studies used middle Miocene boundary conditions and 560 ppm CO2, our data likely come from the late Miocene, following substantial cooling after the peak of Neogene warmth during the middle Miocene (Herbert et al., 2016). Consequently, the environment in which much of the Ogallala Formation was deposited may differ from that simulated by Feng et al. (2016) and Lee (2019). Alternatively, given the difficulty in simulating the land–atmosphere coupling over the Great Plains in modern-day simulations (Bukovsky et al., 2017; Laguë et al., 2019; Zhou et al., 2021a) and the importance of the land surface in modulating δ18Op, minor misrepresentations in the land surface parameterizations within these models may yield outsize impacts on the simulated δ18Op gradient. While a thorough review comparing our results to simulated Miocene δ18Op over the Great Plains is outside the scope of this paper, our new spatially resolved dataset provides an opportunity to test model predictions of late Miocene climate simulation skill over central North America.
We additionally assume that the authigenic carbonates that we sampled formed in the late Miocene. Several studies (Joeckel et al., 2014; Smith and Platt, 2023) have noted that some caliche units in the northern and central Great Plains may reflect post-depositional case hardening rather than syn-depositional carbonate formation based upon lateral discontinuities in these units. Given the low variance in our Ogallala samples (typically much less than 1 ‰), we suggest that all of the carbonates in our study formed from the same meteoric water. Further, the δ13C values of our carbonate samples are relatively low ( ‰). Given the expansion of C4 plants during the Plio-Pleistocene, the δ13C values of authigenic carbonates formed in the Plio-Pleistocene are substantially higher ( ‰) (Fox and Koch, 2003). Thus, the low δ13C values of our carbonate samples indicate that they formed during the late Miocene under a dominantly C3 grassland environment. The only exception to these low δ13C values in our sections is from carbonates sampled in eastern New Mexico from outcrops identified as Ogallala by Frye et al. (1982). In many of these sections, there are authigenic carbonate samples with δ13C values ‰ and frequently the caprock caliche samples have δ13C values approaching 0 ‰ (Table S1 in Manser et al., 2023). This suggests that these outcrops either may not be correlative with the Ogallala (Henry, 2017) or that authigenic carbonate formation in these sections occurred substantially later than Ogallala deposition. However, we have no independent age constraints with which to better constrain the ages of these units, and we therefore include them in our study. We do note that the reconstructed δ18Op from these sections is indistinguishable from modern δ18Op in eastern New Mexico, further suggesting that the long-term pattern of δ18Op in the Great Plains has remained invariant. Thus, the combination of the low δ13C values and the low variance in our δ18Oc data suggests that our assumption of late Miocene carbonate formation is robust.
That atmospheric circulation over the Great Plains has remained relatively constant since the late Miocene provides important context for understanding how Great Plains hydroclimate and environments may respond to higher atmospheric CO2. Further, our data provide insight into the climatic and tectonic controls that may have driven deposition of the Ogallala Formation. In both cases, our data places critical constraints on our understanding of both past environments and the future evolution of climate in the Great Plains.
7.1 Response of Great Plains hydroclimate to CO2
Of concern as atmospheric CO2 rises is whether and how the climatological 100th meridian, which demarcates the semi-arid west from the humid east, will shift. The current position of this climatological 100th meridian is partly set today by the boundary between dry westerly air masses that have lost much of their moisture from passage over the North American Cordillera and moist southerly masses transported by the GPLLJ. If dynamical relative shifts in the strength of these two predominant circulation systems were to occur as CO2 rises, one might expect the boundary between low δ18Op and high δ18Op to shift. For example, model simulations indicate that the poleward shift of the westerly jet and North Atlantic Subtropical High with warming should enhance GPLLJ moisture transport in the spring but suppress it in the summer (Zhou et al., 2021a, b). If the overall tendency were a weaker GPLLJ with warming, we might expect less northward moisture transport and thereby a shift of this δ18Op boundary southward and eastward. Instead, we find that the spatial pattern of δ18Op has remained unchanged since the late Miocene, suggesting that the relative strength of these two circulation systems was not substantially different in a warmer, higher-CO2 world. Such findings bolster GCM results that, overall, mean wet-season precipitation does not change substantially and that therefore the boundary between the GPLLJ and the westerlies is not overly sensitive to warming.
Though dynamical shifts in circulation may affect hydroclimate over the Great Plains, additional thermodynamic mechanisms have been invoked to explain shifts in the climatological 100th meridian with warming. Because PET will rise faster than P across the Plains, aridity will increase (Seager et al., 2018a, b). However, this will be complicated by how actual ET – and therefore the partitioning of moisture returned to the atmosphere versus to runoff – responds to warming. How ET changes with warming depends on a variety of factors including plant water use efficiency (Swann et al., 2016; Lemordant et al., 2018) and the temporal distribution of precipitation (Scheff et al., 2022). Our results imply that either (1) the effect of increasing PET relative to P had a small effect on net rainout – and hence δ18Op – in the Miocene, or (2) decreases in ET efficiency with warming, perhaps driven by more efficient plant water use (Lemordant et al., 2018) and which would reduce 18O return to the atmosphere, counteracted the expected increase in δ18Op due to increasing PET relative to P.
Though the late Miocene was likely warmer than today with higher than pre-industrial CO2 (Herbert et al., 2016; Mejía et al., 2017; Sosdian et al., 2018; CenCO2PIP Consortium, 2023), the precise global climate that our new data reflect is uncertain. This uncertainty arises not only because of the chronological uncertainty associated with the Ogallala Formation, but also due to uncertainty in both global temperature and CO2 reconstructions. The late Miocene may have seen global temperatures elevated by 5° higher relative to pre-industrial (Westerhold et al., 2020; Ring et al., 2022) and atmospheric CO2 between 350 and 500 ppm (Tanner et al., 2020; Brown et al., 2022; CenCO2PIP Consortium, 2023). However, these estimates – particularly for CO2 – remain imprecise, and it is therefore difficult to determine just how insensitive the Great Plains hydroclimate is to warming and higher CO2. Further, while the land surface plays a critical role in modifying Great Plains hydroclimate, the late Miocene Great Plains were already dominated by grassland ecosystems (Stromberg, 2005). Though C4 plants have a greater water use efficiency than C3 plants (Osborne and Sack, 2012), the invariant δ18Op spatial pattern suggests that overall ecosystem water use (i.e., transpiration to the atmosphere) was likely similar to today and overall hydroclimate in the late Miocene resembled the hydroclimate today in the Great Plains.
7.2 Implications for understanding the origin of the Ogallala Formation
Why much of the Great Plains shifted from a dominantly erosive landscape to a depositional landscape for several million years, before returning to the dominantly erosive landscape of today, has remained a major outstanding question in North American geology (Heller et al., 2003). As the sediments of the Ogallala Formation are sourced in the Rocky Mountains, this question has been intimately linked to what process drove this major late Cenozoic erosional event, producing the alluvial fans and megafans that blanketed the Great Plains in the late Miocene (Trimble, 1980; Molnar and England, 1990). Paleoaltimetry data have suggested that much of the North American Cordillera has been high since the Eocene (Forest et al., 1995; Mix et al., 2011). If mean elevation has not changed for much of the Cenozoic, then changes in climate – perhaps driven by increasingly variable, orbitally controlled glacial cycles – may have driven the increase in erosion (Molnar and England, 1990; Gregory and Chase, 1994; Zhang et al., 2001). In contrast, multiple studies that have analyzed paleo-slopes of the Ogallala Formation fluvial sediments conclude that the Ogallala Formation must have been tilted post-deposition due to a long-wavelength uplift (McMillan et al., 2002; Heller et al., 2003), perhaps associated with dynamic topography effects driven by continued subduction of the Farallon Plate (Willett et al., 2018).
Our data suggest that hydroclimate was not substantially different in the late Miocene and was therefore unlikely to be the proximal cause of widespread erosion of the Rocky Mountains and deposition of the Ogallala Formation. Instead, we suggest that, because overall hydroclimate – and, in particular, runoff – was similar to today, deposition of the Ogallala Formation must have been driven by long-wavelength tilting of the North American plate that uplifted portions of the Rocky Mountains. Estimates of the uplift necessary to explain post-depositional tilting are less than 1 km (McMillan et al., 2002; Leonard, 2002). Such uplift was likely not substantial enough to either (1) be detectable in paleo-altimetry datasets or (2) substantially modify the strength of the GPLLJ (Jiang et al., 2007). Uplift might be expected to result in lower δ18Op in late Cenozoic basins in the Rocky Mountains due to orographic forcing of precipitation. However, in this region, orographic forcing is limited to GPLLJ storms that reach the Front Range, and continued mixing with low-δ18Op westerly moisture would make it very difficult to discern such a signal. We thus conclude that hydroclimate was not substantially different in the late Miocene in the Great Plains and that long-wavelength tilting must be a necessary component of the formation of the Ogallala Formation.
Our new spatially resolved late Miocene δ18Oc data from across the Great Plains reveal that the spatial pattern of reconstructed δ18Op is indistinguishable from the spatial pattern of modern meteoric water δ18O. Despite changes in global climate, we suggest that this static δ18O spatial pattern reflects an atmospheric circulation system over the Great Plains that in the late Miocene was largely identical to today: wintertime westerly air masses, dried by transit over the North American Cordillera, delivered low-δ18O moisture to the northern Great Plains, while southerly moisture, transported by the Great Plains low-level jet, brought high-δ18O moisture to the southern Great Plains. Thus, on the timescales preserved within the Ogallala Formation, the mixing zone between these two circulation systems was similar to today. Given that these two atmospheric circulation systems are responsible for a nearly 15 ‰ δ18O gradient north to south along the Great Plains, these results appear to be robust to assumptions regarding temperature, evaporation, and precipitation seasonality changes since the late Miocene and also insensitive to uncertainties in our correlations across the expanse of the Ogallala Formation.
These results suggest that, on geological timescales, large-scale hydroclimate in the Great Plains is relatively insensitive to changes in global temperature and atmospheric CO2. Model projections tend to indicate that mean annual precipitation will not increase substantially as CO2 rises (Bukovsky et al., 2017; Zhou et al., 2021a), and our results support this contention, in that a static δ18O spatial pattern suggests that net rainout in the late Miocene across the Great Plains was likely not substantially different than today. In contrast, our results do not support projections that aridity will increase over the Plains (Seager et al., 2018a). While increases in PET are robust in models (Scheff et al., 2017), our results suggest that countervailing decreases in actual ET efficiency likely offset any change in PET, yielding an approximately constant spatial pattern of P ET. Further, our results indicate that large-scale changes in climate (Zhang et al., 2001) are likely not the cause of the widespread erosional event responsible for deposition of Ogallala sediments. Instead, the fact that Great Plains hydroclimate in the late Miocene was similar to today supports the notion that long-wavelength uplift (Moucha et al., 2009; Karlstrom et al., 2011; Willett et al., 2018) shifted the Great Plains from a dominantly erosive landscape to an aggradational one.
The Great Plains lie at a unique climatic and geologic intersection, and this confluence has inspired more than a century of work to understand the relationship between climate, geology, and ecosystems over geologic time in the Plains (Powell, 1879, 1890; Seni, 1980; Fox and Koch, 2003; Jiang et al., 2007; Seager et al., 2018b; Willett et al., 2018). However, the sharp geologic and climatic gradients that characterize this landscape complicate efforts to understand past changes. Nevertheless, our results suggest that spatially resolved datasets provide a powerful means to constrain the position and shape of these gradients in the past. Additional work that utilizes newly developed proxy systems and/or pairs well-established proxies with our continental-scale data will provide an even sharper picture of the climatic and geologic forces that have shaped this remarkable landscape.
Table A1Input parameters for the reactive transport model. All inputs are retrieved from NARR data except ω, which is set to the global average of 2.6 (Greve et al., 2015), and the transpired fraction of ET, which is set to 0.64 (Good et al., 2015).

Table A2Site averages for previously published data, accessed via the PATCH Lab (Kukla et al., 2022a). Values of δ13C are reported in ‰ relative to VPDB. Values of δ18O are reported in ‰ relative to VSMOW. No standard deviation or range is reported for sites that only include one sample. Note that n/a means not applicable.

The R code for the vapor transport model has been published as supporting material to Kukla et al. (2019).
The datasets used in this study are listed below.
-
Compiled, published δ18O data (Appendix Table A2, accessed via the PATCH Lab https://geocentroid.shinyapps.io/PATCH-Lab/, Kukla et al., 2022a)
-
Modern water isotope data (https://wateriso.utah.edu/waterisotopes/pages/spatial_db/SPATIAL_DB.html, Waterisotopes Database, 2019)
-
North American Regional Reanalysis (Mesinger et al., 2006)
-
Table S1, available from the data repository Dryad (Manser et al., 2023, https://doi.org/10.5061/dryad.5hqbzkhc5)
JKCR conceived the project idea, acquired funding, and provided overall supervision. LM conducted the investigation, curated the data, conducted the formal analysis, and prepared the original draft of this paper. TK provided resources and supervised the use of the vapor transport model. All authors contributed to the review and editing of the paper.
The contact author has declared that none of the authors has any competing interests.
Publisher's note: Copernicus Publications remains neutral with regard to jurisdictional claims made in the text, published maps, institutional affiliations, or any other geographical representation in this paper. While Copernicus Publications makes every effort to include appropriate place names, the final responsibility lies with the authors.
This study benefited from discussions with Sean Willett regarding the Ogallala Formation and landscape evolution. We thank Sean Willett for first piquing our interest in this unique and still mysterious paleo-landscape. We thank Madalina Jaggi, Ulrich Treffert, Niklaus Loeffler, and Emilija Krsnik for assistance in the laboratory, Katharina Methner for field assistance, and Dan Koning and Frank Pazzaglia for assistance with finding key outcrops in New Mexico. We also benefited from discussions with Vincenzo Picotti, Giuditta Fellin, and Derek Sjostrom regarding Ogallala paleosol and sandstone petrology. We thank Rusty Winn of RE Janes Gravel Co (Lubbock, TX, USA) for facilitating our access and guiding us to remarkable Ogallala outcrops in the southern Great Plains. We also thank Phillip Osborne for permission to sample on his property and the Wildcat Bluff Nature Center for permission to sample within their preserve. Samples from Lake McConaughy State Recreation Area were collected under a permit issued by the Central Nebraska Public Power and Irrigation District, and samples collected at Palo Duro and Caprock Canyons state parks in Texas were collected under permit 2018-R5-08. Lastly, we thank an anonymous review, David L. Fox, and Jon Smith for reviews that substantially improved this paper. This study was funded by an ETH SEED grant, ETH and Alexander von Humboldt postdoctoral fellowships, and NSF grant EAR-2202916 to Rugenstein.
This research has been supported by the ETH Zürich Foundation (fellowship grant no. 0-20282-17, career seed grant no. 0-20435-18), the Alexander von Humboldt Foundation, and the NSF Directorate for Geosciences (grant no. EAR-2202916).
This paper was edited by Alberto Reyes and reviewed by David L. Fox and one anonymous referee.
Aby, S. B., Morgan, G. S., and Koning, D. J.: A paleontological survey of a part of the Tesuque formation near Chimayo, New Mexico, and a summary of the biostratigraphy of the Pojoaque member (Middle Miocene, Late Barstovian), in: New Mexico Geological Society Guidebook, 62nd Field Conference, Geology of the Tusas Mountains – Ojo Caliente, edited by: Koning, D. J., Karlstrom, K. E., Kelley, S. A., Lueth, V. W., and Aby, S. B., 347–358, https://nmgs.nmt.edu/publications/guidebooks/downloads/62/62_p0347_p0358.pdf (last access: 19 April 2024), 2011. a
Bailey, A., Posmentier, E., and Feng, X.: Patterns of Evaporation and Precipitation Drive Global Isotopic Changes in Atmospheric Moisture, Geophys. Res. Lett., 45, 7093–7101, https://doi.org/10.1029/2018GL078254, 2018. a
Barghoorn, S.: Magnetic-polarity stratigraphy of the Miocene type Tesuque Formation, Santa Fe Group, in: the Espanola Valley, New Mexico., Geol. Soc. Am. Bull., 92, 1027–1041, https://doi.org/10.1130/0016-7606(1981)92<1027:MSOTMT>2.0.CO;2, 1981. a
Barghoorn, S. F.: Magnetic polarity stratigraphy of the Tesuque Formation, Santa Fe Group in the Española Valley, New Mexico, with a taxonomic review of the fossil camels, PhD thesis, Columbia University, https://www.proquest.com/openview/3953a8793e030406f417eb7fb4e4253d/1 (last access: 19 April 2024), 1985. a
Bates, K. L.: America the Beautiful: And Other Poems, Thomas Y. Crowell Company, New York, NY, 305 pp., 1911. a
Bernasconi, S. M., Müller, I. A., Bergmann, K. D., Breitenbach, S. F., Fernandez, A., Hodell, D. A., Jaggi, M., Meckler, A. N., Millan, I., and Ziegler, M.: Reducing Uncertainties in Carbonate Clumped Isotope Analysis Through Consistent Carbonate-Based Standardization, Geochem. Geophy. Geosy., 19, 2895–2914, https://doi.org/10.1029/2017GC007385, 2018. a
Bershaw, J., Penny, S. M., and Garzione, C. N.: Stable Isotopes of Modern Water across the Himalaya and Eastern Tibetan Plateau: Implications for Estimates of Paleoelevation and Paleoclimate, J. Geophys. Res.-Atmos., 117, D02110, https://doi.org/10.1029/2011JD016132, 2012. a
Brand, W. A., Coplen, T. B., Vogl, J., Rosner, M., and Prohaska, T.: Assessment of international reference materials for isotope-ratio analysis (IUPAC technical report), Pure Appl. Chem., 86, 425–467, https://doi.org/10.1515/pac-2013-1023, 2014. a
Breecker, D., Sharp, Z., and McFadden, L.: Seasonal bias in the formation and stable isotopic composition of pedogenic carbonate in modern soils from central New Mexico, USA, Geol. Soc. Am. Bull., 121, 630–640, https://doi.org/10.1130/B26413.1, 2009. a, b
Breitenbach, S. F. M. and Bernasconi, S. M.: Carbon and oxygen isotope analysis of small carbonate samples (20 to 100 µg) with a GasBench II preparation device, Rapid Commun. Mass Sp., 25, 1910–1914, https://doi.org/10.1002/rcm.5052, 2011. a
Brock, A. L. and Buck, B. J.: Polygenetic development of the Mormon Mesa, NV petrocalcic horizons: Geomorphic and paleoenvironmental interpretations, CATENA, 77, 65–75, https://doi.org/10.1016/j.catena.2008.12.008, 2009. a
Brown, R. M., Chalk, T. B., Crocker, A. J., Wilson, P. A., and Foster, G. L.: Late Miocene cooling coupled to carbon dioxide with Pleistocene-like climate sensitivity, Nat. Geosci., 15, 664–670, https://doi.org/10.1038/s41561-022-00982-7, 2022. a
Brubaker, K. L., Entekhabi, D., and Eagleson, P. S.: Atmospheric water vapor transport and continental hydrology over the Americas, J. Hydrol., 155, 407–428, https://doi.org/10.1016/0022-1694(94)90180-5, 1994. a
Budyko, M.: Climate and Life, International Geophysical Series, vol. 18, Academic Press, New York, ISBN 0121394506, 1974. a
Bukovsky, M. S., McCrary, R. R., Seth, A., and Mearns, L. O.: A mechanistically credible, poleward shift in warm-season precipitation projected for the U.S. Southern Great Plains?, J. Climate, 30, 8275–8298, https://doi.org/10.1175/JCLI-D-16-0316.1, 2017. a, b, c, d, e, f, g, h
Burde, G. I., Gandush, C., and Bayarjargal, Y.: Bulk Recycling Models with Incomplete Vertical Mixing. Part II: Precipitation Recycling in the Amazon Basin, J. Climate, 19, 1473–1489, https://doi.org/10.1175/JCLI3688.1, 2006. a
Burls, N. J. and Fedorov, A. V.: Wetter subtropics in a warmer world: Contrasting past and future hydrological cycles, P. Natl. Acad. Sci. USA, 114, 12888–12893, https://doi.org/10.1073/pnas.1703421114, 2017. a
Byerle, L. A.: Modulation of the Great Plains low-level jet and moisture transports by orography and large-scale circulations, J. Geophys. Res., 108, 8611, https://doi.org/10.1029/2002JD003005, 2003. a
Caves, J. K.: Late Miocene Uplift of the Tian Shan and Altai and Reorganization of Central Asia Climate, GSA Today, 27, 20–26, https://doi.org/10.1130/GSATG305A.1, 2017. a, b
Caves, J. K., Sjostrom, D. J., Mix, H. T., Winnick, M. J., and Chamberlain, C. P.: Aridification of Central Asia and Uplift of the Altai and Hangay Mountains, Mongolia: Stable Isotope Evidence, Am. J. Sci., 314, 1171–1201, https://doi.org/10.2475/08.2014.01, 2014. a
Caves, J. K., Winnick, M. J., Graham, S. A., Sjostrom, D. J., Mulch, A., and Chamberlain, C. P.: Role of the westerlies in Central Asia climate over the Cenozoic, Earth Planet. Sc. Lett., 428, 33–43, https://doi.org/10.1016/j.epsl.2015.07.023, 2015. a, b, c
Caves, J. K., Moragne, D. Y., Ibarra, D. E., Bayshashov, B. U., Gao, Y., Jones, M. M., Zhamangara, A., Arzhannikova, A. V., Arzhannikov, S. G., and Chamberlain, C. P.: The Neogene de-greening of Central Asia, Geology, 44, 887–890, https://doi.org/10.1130/G38267.1, 2016. a
Caves Rugenstein, J. K. and Chamberlain, C. P.: The evolution of hydroclimate in Asia over the Cenozoic: A stable-isotope perspective, Earth-Sci. Rev., 185, 1129–1156, https://doi.org/10.1016/j.earscirev.2018.09.003, 2018. a
CenCO2PIP Consortium: Toward a Cenozoic history of atmospheric CO2, Science, 382, eadi5177, https://doi.org/10.1126/science.adi5177, 2023. a, b, c
Cepeda, J. C. and Perkins, M. E.: A 10 million year old ash deposit in the Ogallala Formation of the Texas Panhandle, Tex. J. Sci., 58, 3–12, 2006. a, b, c
Chamberlain, C. P., Mix, H. T., Mulch, A., Hren, M. T., Kent-Corson, M. L., Davis, S. J., Horton, T. W., and Graham, S. A.: The Cenozoic climatic and topographic evolution of the western North American Cordillera, Am. J. Sci., 312, 213–262, https://doi.org/10.2475/02.2012.05, 2012. a
Chamberlain, C. P., Winnick, M. J., Mix, H. T., Chamberlain, S. D., and Maher, K.: The impact of neogene grassland expansion and aridification on the isotopic composition of continental precipitation, Global Biogeochem. Cy., 28, 992–1004, https://doi.org/10.1002/2014GB004822, 2014. a, b, c
Cook, K. H., Vizy, E. K., Launer, Z. S., and Patricola, C. M.: Springtime intensification of the great plains low-level jet and midwest precipitation in GCM Simulations of the twenty-first century, J. Climate, 21, 6321–6340, https://doi.org/10.1175/2008JCLI2355.1, 2008. a, b, c, d, e
de Noblet-Ducoudre, N., Boisier, J.-P., Pitman, A., Bonan, G. B., Brovkin, V., Cruz, F., Delire, C., Gayler, V., van den Hurk, B. J. J. M., Lawrence, P. J., van der Molen, M. K., Müller, C., Reick, C. H., Strengers, B. J., and Voldoire, A.: Determining Robust Impacts of Land-Use-Induced Land Cover Changes on Surface Climate over North America and Eurasia: Results from the First Set of LUCID Experiments, J. Climate, 25, 3261–3281, https://doi.org/10.1175/JCLI-D-11-00338.1, 2012. a
Dobson, J. E. and Campbell, J. S.: The Flatness of U.S. States, Geogr. Rev., 104, 1–9, https://doi.org/10.1111/j.1931-0846.2014.12001.x, 2014. a
Draxler, R. R. and Hess, G.: An Overview of the HYSPLIT_4 Modelling System for Trajectories, Dispersion, and Deposition, Australian Meteorological Magazine, 47, 295–308, 1998. a, b
Driscoll, E., Needham, M. R., Keys, P. W., and Rugenstein, J. K. C.: Cenozoic stable isotope constraints on the Eurasian continental interior hydroclimate response to high CO2, Earth Planet. Sc. Lett., 630, 118623, https://doi.org/10.1016/j.epsl.2024.118623, 2024. a
Duller, R. A., Whittaker, A. C., Swinehart, J. B., Armitage, J. J., Sinclair, H. D., Bair, A., and Allen, P. A.: Abrupt landscape change post-6 Ma on the central Great Plains, USA, Geology, 40, 871–874, https://doi.org/10.1130/G32919.1, 2012. a
Egan, T.: The worst hard time: the untold story of those who survived the great American Dust Bowl, Mariner, Boston, Mass., ISBN 9780618773473, 2006. a
Galbreath, E. C.: A contribution to the Tertiary Geology and Paleontology of Northeastern Colorado, Vertebrata, 4, 1–120, https://kuscholarworks.ku.edu/bitstream/handle/1808/3788/paleo.article.013op.pdf (last access: 19 April 2024), 1953.
Fan, M., Hough, B. G., and Passey, B. H.: Middle to late Cenozoic cooling and high topography in the central Rocky Mountains: Constraints from clumped isotope geochemistry, Earth Planet. Sc. Lett., 408, 35–47, https://doi.org/10.1016/j.epsl.2014.09.050, 2014.
Feng, R., Poulsen, C. J., and Werner, M.: Tropical circulation intensification and tectonic extension recorded by Neogene terrestrial δ18O records of the western United States, Geology, 44, 971–974, https://doi.org/10.1130/G38212.1, 2016. a, b, c, d
Feng, R., Bhattacharya, T., Otto-Bliesner, B. L., Brady, E. C., Haywood, A. M., Tindall, J. C., Hunter, S. J., Abe-Ouchi, A., Chan, W.-L., Kageyama, M., Contoux, C., Guo, C., Li, X., Lohmann, G., Stepanek, C., Tan, N., Zhang, Q., Zhang, Z., Han, Z., Williams, C. J. R., Lunt, D. J., Dowsett, H. J., Chandan, D., and Peltier, W. R.: Past Terrestrial Hydroclimate Sensitivity Controlled by Earth System Feedbacks, Nat. Commun., 13, 1306, https://doi.org/10.1038/s41467-022-28814-7, 2022. a
Ferretti, D. F., Pendall, E., Morgan, J. A., Nelson, J. A., LeCain, D., and Mosier, A. R.: Partitioning evapotranspiration fluxes from a Colorado grassland using stable isotopes: Seasonal variations and ecosystem implications of elevated atmospheric CO2, Plant Soil, 254, 291–303, https://doi.org/10.1023/A:1025511618571, 2003. a
Fonstad, M., Pugatch, W., and Vogt, B.: Kansas Is Flatter Than a Pancake, Annals of Improbable Research, 9, 16–18, https://doi.org/10.3142/107951403782200100, 2007. a
Forest, C. E., Molnar, P., and Emanuel, K. A.: Palaeoaltimetry from energy conservation principles, Nature, 374, 347–350, 1995. a
Fox, D. L. and Koch, P. L.: Tertiary history of C4 biomass in the Great plains, USA, Geology, 31, 809–812, 2003. a, b, c, d
Fox, D. L. and Koch, P. L.: Carbon and oxygen isotopic variability in Neogene paleosol carbonates: constraints on the evolution of the C4-grasslands of the Great Plains, USA, Palaeogeogr. Palaeocl., 207, 305–329, https://doi.org/10.1016/j.palaeo.2003.09.030, 2004. a, b, c, d, e, f
Fox, D. L., Honey, J. G., Martin, R. A., and Peláez-Campomanes, P.: Pedogenic carbonate stable isotope record of environmental change during the Neogene in the southern Great Plains, southwest Kansas, USA: Oxygen isotopes and paleoclimate during the evolution of C4-dominated grasslands, Bull. Geol. Soc. Am., 124, 431–443, https://doi.org/10.1130/B30402.1, 2012. a
Friedman, I., Harris, J., Smith, G., and Johnson, C.: Stable isotope composition of waters in the Great Basin, United States 1. Air-mass trajectories, J. Geophys. Res., 107, 4400, https://doi.org/10.1029/2001JD000565, 2002. a
Fritz, S. A., Eronen, J. T., Schnitzler, J., Hof, C., Janis, C. M., Mulch, A., Böhning-Gaese, K., and Graham, C. H.: Twenty-million-year relationship between mammalian diversity and primary productivity, P. Natl. Acad. Sci. USA, 113, 10908–10913, https://doi.org/10.1073/pnas.1602145113, 2016. a
Frye, J. C., Leonard, A. B., and Glass, H. D.: Late Cenozoic Sediments, Molluscan Faunas, and Clay Minerals in Northern New Mexico, New Mexico Bureau of Mines & Mineral Resources Circular, 160, 32, https://doi.org/10.58799/C-160, 1978. a, b
Frye, J. C., Leonard, A. B., and Glass, H. D.: Western extent of Ogallala Formation in New Mexico, New Mexico Bureau of Mines & Mineral Resources Circular, 175, 41, https://doi.org/10.58799/C-175, 1982. a, b, c, d, e, f, g
Fu, B. P.: On the calculation of the evaporation from land surface, Scientia Atmospherica Sinica, 5, 23–31, 1981. a
Galusha, T. and Blick, J. C.: Stratigraphy of the Santa Fe Group, New Mexico, B. Am. Mus. Nat. Hist., 144, 127, http://hdl.handle.net/2246/1633 (last access: 20 April 2024), 1971. a, b
Gat, J. R. and Matsui, E.: Atmospheric water balance in the Amazon basin: An isotopic evapotranspiration model, J. Geophys. Res., 96, 179–13, https://doi.org/10.1029/91JD00054, 1991. a
Good, S. P., Noone, D., and Bowen, G.: Hydrologic connectivity constrains partitioning of global terrestrial water fluxes, Science, 349, 175–177, https://doi.org/10.1126/science.aaa5931, 2015. a, b
Gregory, K. M. and Chase, C. G.: Tectonic and climatic significance of a late Eocene low-relief, high- level geomorphic surface, Colorado, J. Geophys. Res., 99, 20141–20160, https://doi.org/10.1029/94jb00132, 1994. a
Greve, P., Gudmundsson, L., Orlowsky, B., and Seneviratne, S. I.: Introducing a probabilistic Budyko framework, Geophys. Res. Lett., 42, 2261–2269, https://doi.org/10.1002/2015GL063449, 2015. a, b, c
Godfrey, C., Fan, M., Jesmok, G., Upadhyay, D., and Tripati, A.: Petrography and stable isotope geochemistry of Oligocene-Miocene continental carbonates in south Texas: Implications for paleoclimate and paleoenvironment near sea-level, Sediment. Geol., 367, 69–83, https://doi.org/10.1016/j.sedgeo.2018.02.006, 2018.
Gustavson, T. C.: Fluvial and Eolian Depositional Systems, Paleosols, and Paleoclimate of the Upper Cenozoic Ogallala and Blackwater Draw Formations, Southern High Plains, Texas and New Mexico, Bureau of Economic Geology, Report of Investigations No. 239, https://doi.org/10.23867/RI0239D, 1996. a, b, c, d, e
Gustavson, T. C. and Holliday, V. T.: Eolian sedimentation and soil development on a semiarid to subhumid grassland, Tertiary Ogallala and Quaternary Blackwater Draw formations, Texas and New Mexico High Plains, J. Sediment. Res., 69, 622–634, https://doi.org/10.2110/jsr.69.622, 1999. a, b, c
Gustavson, T. C. and Winkler, D. A.: Depositional facies of the Miocene-Pliocene Ogallala Formation, northwestern Texas and eastern New Mexico, Geology, 16, 203, https://doi.org/10.1130/0091-7613(1988)016<0203:DFOTMP>2.3.CO;2, 1988. a, b
Held, I. and Soden, B.: Robust responses of the hydrological cycle to global warming, J. Climate, 19, 5686–5699, 2006. a
Helfand, H. M. and Schubert, S. D.: Climatology of the simulated Great Plains low-level jet and its contribution to the continental moisture budget of the United States, J. Climate, 8, 784–806, https://doi.org/10.1175/1520-0442(1995)008<0784:COTSGP>2.0.CO;2, 1995. a, b
Heller, P. L., Dueker, K., and McMillan, M. E.: Post-Paleozoic alluvial gravel transport as evidence of continental tilting in the U.S. Cordillera, Geol. Soc. Am. Bull., 115, 1122–1132, https://doi.org/10.1130/B25219.1, 2003. a, b
Henry, K. D.: 40Ar 39Ar Detrital Sanidine Dating of the Ogallala Formation, Llano Estacado, Southeastern New Mexico and West Texas, Master Thesis, New Mexico Tech, https://nmt.on.worldcat.org/oclc/1012939850 (last access: 20 April 2024), 2017. a, b, c
Herbert, T. D., Lawrence, K. T., Tzanova, A., Peterson, L. C., Caballero-Gill, R., and Kelly, C. S.: Late Miocene global cooling and the rise of modern ecosystems, Nat. Geosci., 9, 843–847, https://doi.org/10.1038/ngeo2813, 2016. a, b, c, d
Hetherington, A. M. and Woodward, F. I.: The role of stomata in sensing and driving environmental change, Nature, 424, 901–908, 2003. a
Hoch, J. and Markowski, P.: A Climatology of Springtime Dryline Position in the U.S. Great Plains Region, J. Climate, 18, 2132–2137, https://doi.org/10.1175/JCLI3392.1, 2005. a, b
Huth, T. E., Cerling, T. E., Marchetti, D. W., Bowling, D. R., Ellwein, A. L., and Passey, B. H.: Seasonal Bias in Soil Carbonate Formation and Its Implications for Interpreting High-Resolution Paleoarchives: Evidence From Southern Utah, J. Geophys. Res.-Biogeo., 124, 616–632, https://doi.org/10.1029/2018JG004496, 2019. a, b
Ibarra, D. E., Oster, J. L., Winnick, M. J., Rugenstein, J. K., Byrne, M. P., and Chamberlain, C. P.: Warm and cold wet states in the western United States during the Pliocene-Pleistocene, Geology, 46, 355–358, https://doi.org/10.1130/G39962.1, 2018. a
Izett, G. A. and Obradovich, J. D.: 40Ar 39Ar ages of Miocene tuffs in basin-fill deposits (Santa Fe group, New Mexico, and troublesome formation, Colorado) of the Rio Grande rift system, Mountain Geologist, 38, 77–86, 2001. a
Jacobs, B. F., Kingston, J. D., and Jacobs, L. L.: The Origin of Grass-Dominated Ecosystems, Ann. Mo. Bot. Gard., 86, 590–643, 1999. a
Janis, C. M., Damuth, J., and Theodor, J. M.: Miocene ungulates and terrestrial primary productivity: Where have all the browsers gone?, P. Natl. Acad. Sci. USA, 97, 7899–7904, https://doi.org/10.1073/pnas.97.14.7899, 2000. a
Jiang, X., Lau, N.-C., Held, I. M., and Ploshay, J. J.: Mechanisms of the Great Plains Low-Level Jet as Simulated in an AGCM, J. Atmos. Sci., 64, 532–547, https://doi.org/10.1175/JAS3847.1, 2007. a, b, c, d, e
Joeckel, R. M., Wooden Jr, S. R., Korus, J. T., and Garbisch, J. O.: Architecture, heterogeneity, and origin of late Miocene fluvial deposits hosting the most important aquifer in the Great Plains, USA, Sediment. Geology, 311, 75–95, 2014. a, b, c, d, e
Karlstrom, K. E., Hansen, S. M., McKeon, R., Ouimet, W., MacCarthy, J., Aslan, A., Kelley, S., Dueker, K., Garcia, R. V., Feldman, J., Kirby, E., Schmandt, B., Coblentz, D., Heizler, M., Aster, R., Darling, A., Donahue, M. S., Stockli, D. F., Karlstrom, K. E., Crow, R., Crossey, L. J., Hoffman, M., Lazear, G., Van Wijk, J., and Stachnik, J.: Mantle-driven dynamic uplift of the Rocky Mountains and Colorado Plateau and its surface response: Toward a unified hypothesis, Lithosphere, 4, 3–22, https://doi.org/10.1130/l150.1, 2011. a, b
Kelson, J. R., Huntington, K. W., Breecker, D. O., Burgener, L. K., Gallagher, T. M., Hoke, G. D., and Petersen, S. V.: A Proxy for All Seasons? A Synthesis of Clumped Isotope Data from Holocene Soil Carbonates, Quaternary Sci. Rev., 234, 106259, https://doi.org/10.1016/j.quascirev.2020.106259, 2020. a
Kelson, J. R., Huth, T. E., Passey, B. H., Levin, N. E., Petersen, S. V., Ballato, P., Beverly, E. J., Breecker, D. O., Hoke, G. D., Hudson, A. M., Ji, H., Licht, A., Oerter, E. J., and Quade, J.: Triple oxygen isotope compositions of globally distributed soil carbonates record widespread evaporation of soil waters, Geochim. Cosmochim. Ac., 355, 138–160, https://doi.org/10.1016/j.gca.2023.06.034, 2023. a, b
Kendall, C. and Coplen, T. B.: Distribution of oxygen-18 and deuterium in river waters across the United States, Hydrol. Process., 15, 1363–1393, https://doi.org/10.1002/hyp.217, 2001. a
Kim, S. T. and O'Neil, J. R.: Equilibrium and nonequilibrium oxygen isotope effects in synthetic carbonates, Geochim. Cosmochim. Ac., 61, 3461–3475, https://doi.org/10.1016/S0016-7037(97)00169-5, 1997. a, b, c
Kitts, D. B.: Geology of the Cenozoic Rocks of Ellis County, Oklahoma, Oklahoma Geological Survey Circular 69, http://www.ogs.ou.edu/pubsscanned/Circulars/circular69mm.pdf (last access: 20 April 2024), 1965. a, b
Kocsis, L., Ozsvárt, P., Becker, D., Ziegler, R., Scherler, L., and Codrea, V.: Orogeny forced terrestrial climate variation during the late Eocene-early Oligocene in Europe, Geology, 42, 727–730, https://doi.org/10.1130/G35673.1, 2014. a
Koning, D. J., Grauch, V., Connell, S. D., Ferguson, J., McIntosh, W., Slate, J. L., Wan, E., and Baldridge, W. S.: Structure and tectonic evolution of the eastern Española Basin, Rio Grande rift, north-central New Mexico, Geol. S. Am. S., 494, 185–219, https://doi.org/10.1130/2013.2494(08), 2013. a, b
Korus, J. and Joeckel, R.: Telescopic Megafans on the High Plains, USA Were Signal Buffers in a Major Source-To-Sink System, Sedimentary Record, 21, 1–14, https://doi.org/10.2110/001c.89096, 2023a. a
Korus, J. T. and Joeckel, R. M.: Exhumed fluvial landforms reveal evolution of late Eocene-Pliocene rivers on the Central and Northern Great Plains, USA, Geosphere, 19, 695–718, https://doi.org/10.1130/GES02587.1, 2023b. a
Koster, R. D.: Regions of Strong Coupling Between Soil Moisture and Precipitation, Science, 305, 1138–1140, https://doi.org/10.1126/science.1100217, 2004. a, b
Kuhle, A. J. and Smith, G. A.: Alluvial-slope deposition of the skull ridge member of the Tesuque formation, Española Basin, New Mexico, New Mexico Geology, 23, 30–37, https://doi.org/10.58799/NMG-v23n2.30, 2001. a, b
Kukla, T., Winnick, M. J., Maher, K., Ibarra, D. E., and Chamberlain, C. P.: The sensitivity of terrestrial δ18O gradients to hydroclimate evolution, J. Geophys. Res.-Atmos., 124, 563–582, https://doi.org/10.1029/2018JD029571, 2019. a, b, c, d, e, f, g, h
Kukla, T., Rugenstein, J. K. C., Driscoll, E., Ibarra, D. E., and Chamberlain, C. P.: The PATCH Lab V1.0: A database and workspace for Cenozoic terrestrial paleoclimate and environment reconstruction, Am. J. Sci., 322, 1124–1158, https://doi.org/10.2475/10.2022.02, 2022a (data available at: https://geocentroid.shinyapps.io/PATCH-Lab/, last access: 17 April 2024). a, b, c
Kukla, T., Rugenstein, J. K. C., Ibarra, D. E., Winnick, M. J., Strömberg, C. A., and Chamberlain, C. P.: Drier winters drove Cenozoic open habitat expansion in North America, AGU Advances, 3, e2021AV000566, https://doi.org/10.1029/2021AV000566, 2022b. a, b
Laguë, M. M., Bonan, G. B., and Swann, A. L. S.: Separating the Impact of Individual Land Surface Properties on the Terrestrial Surface Energy Budget in both the Coupled and Uncoupled Land–Atmosphere System, J. Climate, 32, 5725–5744, https://doi.org/10.1175/jcli-d-18-0812.1, 2019. a, b
LaRiviere, J. P., Ravelo, A. C., Crimmins, A., Dekens, P. S., Ford, H. L., Lyle, M., and Wara, M. W.: Late Miocene decoupling of oceanic warmth and atmospheric carbon dioxide forcing, Nature, 486, 97–100, https://doi.org/10.1038/nature11200, 2012. a
Lechler, A. R. and Galewsky, J.: Refining paleoaltimetry reconstructions of the Sierra Nevada, California, using air parcel trajectories, Geology, 41, 259–262, https://doi.org/10.1130/G33553.1, 2013. a, b, c, d
Lee, J.: Understanding Neogene Oxygen Isotopes in the Southern Great Plains Using Isotope‐Enabled General Circulation Model Simulations, J. Geophys. Res.-Atmos., 124, 2452–2464, https://doi.org/10.1029/2018JD028894, 2019. a, b
Lee, J.-E., Fung, I., DePaolo, D. J., and Henning, C. C.: Analysis of the global distribution of water isotopes using the NCAR atmospheric general circulation model, J. Geophys. Res., 112, D16306, https://doi.org/10.1029/2006JD007657, 2007. a
Lehman, T. and Schnable, J.: Geology of the Southern High Plains, Southwestern Association of Student Geological Societies, Lubbock, Texas, 120 pp., https://ttu-ir.tdl.org/bitstreams/42eb7632-ccd1-4f32-9850-bbe6a224876c/download (last access: 19 April 2024), 1992.
Lemordant, L., Gentine, P., Swann, A. S., Cook, B. I., and Scheff, J.: Critical impact of vegetation physiology on the continental hydrologic cycle in response to increasing CO2, P. Natl. Acad. Sci. USA, 115, 201720712, https://doi.org/10.1073/pnas.1720712115, 2018. a, b
Leonard, A. B. and Frye, J. C.: Paleontology of Ogallala Formation, northeastern New Mexico, New Mexico Bureau of Mines & Mineral Resources Circular, 161, 21, https://doi.org/10.58799/C-161, 1978. a
Leonard, E. M.: Geomorphic and tectonic forcing of late Cenozoic warping of the Colorado piedmont, Geology, 30, 595–598, https://doi.org/10.1130/0091-7613(2002)030<0595:GATFOL>2.0.CO;2, 2002. a
Li, L. and Garzione, C. N.: Spatial Distribution and Controlling Factors of Stable Isotopes in Meteoric Waters on the Tibetan Plateau: Implications for Paleoelevation Reconstruction, Earth Planet. Sc. Lett., 460, 302–314, https://doi.org/10.1016/j.epsl.2016.11.046, 2017. a
Liu, Z., Bowen, G. J., and Welker, J. M.: Atmospheric circulation is reflected in precipitation isotope gradients over the conterminous United States, J. Geophys. Res., 115, D22120, https://doi.org/10.1029/2010JD014175, 2010. a
Lucas, S. G., Hunt, A. P., Kues, B. S., Heckert, A. B., and McLemore, V. T.: First-day road log, from Tucumcari to the edge of the Llano Estacado at Gruhlkey, Texas, Palo Duro Canyon, Texas, and San Jon Hill, New Mexico, in: Geology of the Llano Estacado, edited by: Lucas, S. and Ulmer-Scholle, D., New Mexico Geological Society 52nd Annual Fall Field Conference Guidebook, 1–23, https://doi.org/10.56577/ffc-52.1, 2001.
Ludvigson, G. A., Sawin, R. S., Franseen, E. K., Watney, W. L., West, R. R., and Smith, J. J.: A Review of the Stratigraphy of the Ogallala Formation and Revision of Neogene (“Tertiary”) Nomenclature in Kansas, Kansas Current Research in Earth Sciences Bulletin, 256, 1–9, 2009. a
Ludvigson, G. A., Mandel, R., MacFarlane, A., and Smith, J. J.: Capturing the Record of Neogene Climate Change from Strata of the High Plains Aquifer in Kansas: Research Activities and Findings, Tech. rep., Kansas Geological Survey, https://www.kgs.ku.edu/Publications/OFR/2016/OFR16_31/ (last access: 20 April 2024), 2016. a
Manser, L., Kukla, T., and Rugenstein, J. K. C.: Data from: Stable isotope evidence for long-term stability of large-scale hydroclimate in the Neogene North American Great Plains, DRYAD [data set], https://doi.org/10.5061/dryad.5hqbzkhc5, 2023. a, b, c, d, e
Martens, B., Miralles, D. G., Lievens, H., van der Schalie, R., de Jeu, R. A. M., Fernández-Prieto, D., Beck, H. E., Dorigo, W. A., and Verhoest, N. E. C.: GLEAM v3: satellite-based land evaporation and root-zone soil moisture, Geosci. Model Dev., 10, 1903–1925, https://doi.org/10.5194/gmd-10-1903-2017, 2017. a
McDermott, F., Atkinson, T. C., Fairchild, I. J., Baldini, L. M., and Mattey, D. P.: A first evaluation of the spatial gradients in δ18O recorded by European Holocene speleothems, Global Planet. Change, 79, 275–287, https://doi.org/10.1016/j.gloplacha.2011.01.005, 2011. a
McIntosh, W. C. and Quade, J.: 40Ar 39Ar geochronology of tephra layers in the Santa Fe Group, Espanola Basin, New Mexico, in: Geology of the Santa Fe Region, edited by: Bauer, P. W., Kues, B. S., Dunbar, N. W., Karlstrom, K. E., and Harrison, B., New Mexico Geological Society 46th Annual Fall Field Conference Guidebook, 279–287, https://doi.org/10.56577/FFC-46.279, 1996. a
McMillan, M. E., Angevine, C. L., and Heller, P. L.: Postdepositional tilt of the Miocene-Pliocene Ogallala Group on the western Great Plains: Evidence of late Cenozoic uplift of the Rocky Mountains, Geology, 30, 63–66, 2002. a, b, c
Mejía, L. M., Méndez-Vicente, A., Abrevaya, L., Lawrence, K. T., Ladlow, C., Bolton, C., Cacho, I., and Stoll, H.: A diatom record of CO2 decline since the late Miocene, Earth Planet. Sc. Lett., 479, 18–33, https://doi.org/10.1016/j.epsl.2017.08.034, 2017. a
Mesinger, F., DiMego, G., Kalnay, E., Mitchell, K., Shafran, P. C., Ebisuzaki, W., Jović, D., Woollen, J., Rogers, E., Berbery, E. H., Ek, M. B., Fan, Y., Grumbine, R., Higgins, W., Li, H., Lin, Y., Manikin, G., Parrish, D., and Shi, W.: North American regional reanalysis: A long-term, consistens, high-resolution climate dataset for the North American domian, as a major improvement upon the earlier global reanalysis datasets in both resolution and accuracy, B. Am. Meteorol. Soc., 87, 343–360, https://doi.org/10.1175/BAMS-87-3-343, 2006. a, b, c, d, e
Meyer-Christoffer, A., Becker, A., Finger, P., Rudolf, B., Schneider, U., and Ziese, M.: GPCC Climatology Version 2011 at 0.25°: Monthly Land-Surface Precipitation Climatology for Every Month and the Total Year from Rain-Gauges Built on GTS-Based and Historic Data, in: GPCC: Offenbach, Germany, Global Precipitation Climatology Centre (GPCC), at Deutscher Wetterdienst, Offenbach, https://doi.org/10.5676/DWD_GPCC/CLIM_M_V2015_025, 2011. a
Miralles, D. G., Holmes, T. R. H., De Jeu, R. A. M., Gash, J. H., Meesters, A. G. C. A., and Dolman, A. J.: Global land-surface evaporation estimated from satellite-based observations, Hydrol. Earth Syst. Sci., 15, 453–469, https://doi.org/10.5194/hess-15-453-2011, 2011. a
Mix, H. T., Mulch, A., Kent-Corson, M. L., and Chamberlain, C. P.: Cenozoic migration of topography in the North American Cordillera, Geology, 39, 87–90, https://doi.org/10.1130/G31450.1, 2011. a, b
Mix, H. T., Winnick, M. J., Mulch, A., and Page Chamberlain, C.: Grassland expansion as an instrument of hydrologic change in Neogene western North America, Earth Planet. Sc. Lett., 377–378, 73–83, https://doi.org/10.1016/j.epsl.2013.07.032, 2013. a, b, c, d, e
Mix, H. T., Caves Rugenstein, J. K., Reilly, S. P., Ritch, A. J., Winnick, M. J., Kukla, T., and Chamberlain, C. P.: Atmospheric flow deflection in the late Cenozoic Sierra Nevada, Earth Planet. Sc. Lett., 518, 76–85, https://doi.org/10.1016/j.epsl.2019.04.050, 2019. a, b
Molnar, P. and England, P.: Late Cenozoic uplift of mountain ranges and global climate change: chicken or egg?, Nature, 346, 29–34, https://doi.org/10.1038/346029a0, 1990. a, b, c
Moucha, R., Forte, A. M., Rowley, D. B., Mitrovica, J. X., Simmons, N. A., and Grand, S. P.: Deep mantle forces and the uplift of the Colorado Plateau, Geophys. Res. Lett., 36, L19310, https://doi.org/10.1029/2009GL039778, 2009. a, b
Nativ, R. and Riggio, R.: Precipitation in the southern High Plains: Meteorologic and isotopic features, J. Geophys. Res., 95, 22559, https://doi.org/10.1029/JD095iD13p22559, 1990. a
Osborne, C. P. and Sack, L.: Evolution of C4 plants: A new hypothesis for an interaction of CO2 and water relations mediated by plant hydraulics, Philos. T. R. Soc. B, 367, 583–600, https://doi.org/10.1098/rstb.2011.0261, 2012. a
Oster, J. L., Montañez, I. P., and Kelley, N. P.: Response of a modern cave system to large seasonal precipitation variability, Geochim. Cosmochim. Ac., 91, 92–108, https://doi.org/10.1016/j.gca.2012.05.027, 2012. a
Overpeck, J. T. and Udall, B.: Climate change and the aridification of North America, P. Natl. Acad. Sci. USA, 117, 11856–11858, https://doi.org/10.1073/pnas.2006323117, 2020. a
Poage, M. A. and Chamberlain, C. P.: Empirical relationships between elevation and the stable isotope composition of precipitation and surface waters: Considerations for studies of paleoelevation change, Am. J. Sci., 301, 1–15, https://doi.org/10.2475/ajs.301.1.1, 2001. a
Powell, J. W.: Report on the lands of the arid region of the United States, with a more detailed account of the lands of Utah, Government Printing Office, Washington, D.C., https://doi.org/10.3133/70039240, 1879. a, b
Powell, J. W.: The irrigable lands of the arid region, Century Magazine, 39, 766–776, 1890. a, b
Ring, S. J., Mutz, S. G., and Ehlers, T. A.: Cenozoic Proxy Constraints on Earth System Sensitivity to Greenhouse Gases, Paleoceanography and Paleoclimatology, 37, e2021PA004364, https://doi.org/10.1029/2021PA004364, 2022. a
Rozanski, K., Araguás-Araguás, L., and Gonfiantini, R.: Isotopic patterns in modern global precipitation, in: Climate Change in Continental Isotopic Records, edited by: Swart, P. K., Lohmann, K. C., McKenzie, J. A., and Savin, S. M., Wiley Online Library, 1–36, https://doi.org/10.1029/GM078p0001, 1993. a
Rugenstein, J. K. C., Methner, K., Kukla, T., Mulch, A., Lüdecke, T., Fiebig, J., Wegmann, K. W., Zeitler, P. K., and Chamberlain, C. P.: Clumped isotope constraints on warming and precipitation seasonality in Mongolia following Altai uplift, American J. Sci., 322, 28–54, https://doi.org/10.2475/01.2022.02, 2022. a
Salati, E., Dall'Olio, A., Matsui, E., and Gat, J. R.: Recycling of water in the Amazon Basin: An isotopic study, Water Resour. Res., 15, 1250–1258, https://doi.org/10.1029/WR015i005p01250, 1979. a
San Jose, M., Caves Rugenstein, J. K., Cosentino, D., Faccenna, C., Fellin, M. G., Ghinassi, M., and Martini, I.: Stable Isotope Evidence for Rapid Uplift of the Central Apennines since the Late Pliocene, Earth Planet. Sc. Lett., 544, 116376, https://doi.org/10.1016/j.epsl.2020.116376, 2020. a
Scheff, J.: Drought Indices, Drought Impacts, CO2, and Warming: a Historical and Geologic Perspective, Current Climate Change Reports, 4, 202–209, https://doi.org/10.1007/s40641-018-0094-1, 2018. a
Scheff, J., Seager, R., Liu, H., and Coats, S.: Are Glacials Dry? Consequences for Paleoclimatology and for Greenhouse Warming, J. Climate, 30, 6593–6609, https://doi.org/10.1175/JCLI-D-16-0854.1, 2017. a
Scheff, J., Coats, S., and Laguë, M. M.: Why do the Global Warming Responses of Land-Surface Models and Climatic Dryness Metrics Disagree?, Earth's Future, 10, e2022EF002814, https://doi.org/10.1029/2022EF002814, 2022. a
Schubert, S. D.: On the Cause of the 1930s Dust Bowl, Science, 303, 1855–1859, https://doi.org/10.1126/science.1095048, 2004. a
Schultz, G. E.: Clarendonian and Hemphillian Vertebrate Faunas from the Ogallala Formation (Late Miocene-Early Pliocene) of the Texas Panhandle and Adjacent Oklahoma, in: Geologic framework and regional hydrology: Upper Cenozoic Blackwater Draw and Ogallala Formations, Great Plains, edited by: Gustavson, T. C., Bureau of Economic Geology, The University of Texas, Austin, TX, 56–97, https://store.beg.utexas.edu/symposia/3521-sp0006.html (last access: 20 April 2024), 1990. a
Seager, R., Feldman, J., Lis, N., Ting, M., Williams, A. P., Nakamura, J., Liu, H., and Henderson, N.: Whither the 100th Meridian? The Once and Future Physical and Human Geography of America’s Arid–Humid Divide. Part II: The Meridian Moves East, Earth Interact., 22, 1–24, https://doi.org/10.1175/EI-D-17-0012.1, 2018a. a, b, c
Seager, R., Lis, N., Feldman, J., Ting, M., Williams, A. P., Nakamura, J., Liu, H., and Henderson, N.: Whither the 100th Meridian? The Once and Future Physical and Human Geography of America’s Arid–Humid Divide. Part I: The Story So Far, Earth Interact., 22, 1–22, https://doi.org/10.1175/EI-D-17-0011.1, 2018b. a, b, c, d, e, f, g, h
Seni, S. J.: Sand-body geometry and depositional systems, Ogallala Formation, Texas, Bureau of Economic Geology, University of Texas, Report of Investigations, 105, 36, https://repositories.lib.utexas.edu/bitstreams/b4fbcaf5-33e6-415e-824e-e7be531c4eb7/download (last access: 24 April 2024), 1980. a, b
Shapiro, A., Fedorovich, E., and Rahimi, S.: A Unified Theory for the Great Plains Nocturnal Low-Level Jet, J. Atmos. Sci., 73, 3037–3057, https://doi.org/10.1175/JAS-D-15-0307.1, 2016. a
Siler, N., Roe, G. H., and Armour, K. C.: Insights into the zonal-mean response of the hydrologic cycle to global warming from a diffusive energy balance model, J. Climate, 31, 7481–7493, https://doi.org/10.1175/JCLI-D-18-0081.1, 2018. a
Sjostrom, D. J., Hren, M. T., Horton, T. W., Waldbauer, J. R., and Chamberlain, C. P.: Stable isotopic evidence for a pre–late Miocene elevation gradient in the Great Plains–Rocky Mountain region, USA, in: Special Paper 398: Tectonics, Climate, and Landscape Evolution, Geological Society of America, 398, 309–319, https://doi.org/10.1130/2006.2398(19), 2006. a
Skinner, M. F., Skinner, S., and Gooris, R.: Stratigraphy and biostratigraphy of late Cenozoic deposits in central Sioux County, western Nebraska, B. Am. Mus. Nat. Hist., 158, 263–370, 1977. a
Smith, J. J. and Platt, B. F.: Reconstructing late Miocene depositional environments in the central High Plains, USA: Lithofacies and architectural elements of the Ogallala Formation, Sediment. Geol., 443, 106303, https://doi.org/10.1016/j.sedgeo.2022.106303, 2023. a, b, c, d
Smith, J. J., Platt, B. F., Ludvigson, G. A., and Thomasson, J. R.: Ant-nest ichnofossils in honeycomb calcretes, Neogene Ogallala Formation, High Plains region of western Kansas, U.S.A., Palaeogeogr. Palaeocl., 308, 383–394, https://doi.org/10.1016/j.palaeo.2011.05.046, 2011.
Smith, J. J., Platt, B. F., Ludvigson, G. A., Sawin, R. S., Marshall, C. P., and Olcott-Marshall, A.: Enigmatic red beds exposed at point of rocks, Cimarron national Grassland, Morton county, Kansas: Chronostratigraphic constraints from uranium-lead dating of detrital zircons, Current Research in Earth Sciences: Kansas Geological Survey, 261, 1–17, http://www.kgs.ku.edu/Current/2015/Smith/index.html (last access: 19 April 2024), 2015.
Smith, J. J., Layzell, A., Lukens, W., Morgan, M., Keller, S., Martin, R. A., and Fox, D. L.: Getting to the bottom of the High Plains aquifer, in: Unfolding the Geology of the West, vol. 44, Geological Society of America, 93–124, https://doi.org/10.1130/2016.0044(04), 2016. a, b
Smith, J. J., Ludvigson, G. A., Layzell, A., Möller, A., Harlow, R. H., Turner, E., Platt, B., and Petronis, M.: Discovery of Paleogene Deposits of the Central High Plains Aquifer In the Western Great Plains, U.S.A., J. Sediment. Res., 87, 880–896, https://doi.org/10.2110/jsr.2017.48, 2017. a
Smith, J. J., Turner, E., Möller, A., Joeckel, R. M., and Otto, R. E.: First U-Pb zircon ages for late Miocene ashfall Konservat-Lagerstätte and Grove Lake ashes from eastern Great Plains, USA, PLoS ONE, 13, 1–19, https://doi.org/10.1371/journal.pone.0207103, 2018. a, b
Smith, R. B.: The Influence of Mountains on the Atmosphere, Adv. Geophys., 21, 87–230, https://doi.org/10.1016/S0065-2687(08)60262-9, 1979. a
Smith, R. B. and Barstad, I.: A Linear Theory of Orographic Precipitation, J. Atmos. Sci., 61, 1377–1391, https://doi.org/10.1175/1520-0469(2004)061<1377:ALTOOP>2.0.CO;2, 2004. a
Song, F., Feng, Z., Leung, L. R., Houze Jr, R. A., Wang, J., Hardin, J., and Homeyer, C. R.: Contrasting Spring and Summer Large-Scale Environments Associated with Mesoscale Convective Systems over the U.S. Great Plains, J. Climate, 32, 6749–6767, https://doi.org/10.1175/JCLI-D-18-0839.1, 2019. a
Sosdian, S. M., Greenop, R., Hain, M. P., Foster, G. L., Pearson, P. N., and Lear, C. H.: Constraining the evolution of Neogene ocean carbonate chemistry using the boron isotope pH proxy, Earth Planet. Sc. Lett., 498, 362–376, https://doi.org/10.1016/j.epsl.2018.06.017, 2018. a
Stein, A. F., Draxler, R. R., Rolph, G. D., Stunder, B. J. B., Cohen, M. D., and Ngan, F.: NOAA’s HYSPLIT Atmospheric Transport and Dispersion Modeling System, B. Am. Meteorol. Soc., 96, 2059–2077, https://doi.org/10.1175/BAMS-D-14-00110.1, 2015. a
Steinthorsdottir, M., Coxall, H. K., de Boer, A. M., Huber, M., Barbolini, N., Bradshaw, C. D., Burls, N. J., Feakins, S. J., Gasson, E., Henderiks, J., Holbourn, A. E., Kiel, S., Kohn, M. J., Knorr, G., Kürschner, W. M., Lear, C. H., Liebrand, D., Lunt, D. J., Mörs, T., Pearson, P. N., Pound, M. J., Stoll, H., and Strömberg, C. A. E.: The Miocene: The Future of the Past, Paleoceanography and Paleoclimatology, 36, e2020PA004037, https://doi.org/10.1029/2020PA004037, 2021. a, b
Stromberg, C. A. E.: Decoupled taxonomic radiation and ecological expansion of open-habitat grasses in the Cenozoic of North America, P. Natl. Acad. Sci. USA, 102, 11980–11984, https://doi.org/10.1073/pnas.0505700102, 2005. a, b
Strömberg, C. A. E. and McInerney, F. A.: The Neogene transition from C3 to C4 grasslands in North America: assemblage analysis of fossil phytoliths, Paleobiology, 37, 50–71, https://doi.org/10.1666/09067.1, 2011. a
Swann, A. L. S., Hoffman, F. M., Koven, C. D., and Randerson, J. T.: Plant responses to increasing CO2 reduce estimates of climate impacts on drought severity, P. Natl. Acad. Sci. USA, 113, 10019–10024, https://doi.org/10.1073/pnas.1604581113, 2016. a
Swinehart, J. B. and Diffendal Jr., R. F.: Duer Ranch, Merrill County, Nebraska : Contrast between Cenozoic fluvial and eolian deposition, in: Geological Society of America Centennial Field Guide–North-Central Section, edited by: Biggs, D., Geological Society of America, Charlottesville, VA, 23–28, https://doi.org/10.1130/0-8137-5403-8.23, 1987. a
Swisher III, C. C.: 40Ar 39Ar dating and its application to the calibration of the North American land mammal ages, PhD thesis, University of California, Berkeley, http://books.google.com/books?id=fX1LAQAAMAAJ (last accessed: 20 April 2024), 1992. a, b
Tanner, T., Hernández-Almeida, I., Drury, A. J., Guitián, J., and Stoll, H.: Decreasing Atmospheric CO2 During the Late Miocene Cooling, Paleoceanography and Paleoclimatology, 35, 1–25, https://doi.org/10.1029/2020PA003925, 2020. a
Tedford, R. and Barghoorn, S. F.: Neogene stratigraphy and mammalian biochronology of the Española Basin, northern New Mexico, New Mexico Museum of Natural History and Science Bulletin, 2, 159–168, 1993. a
Tedford, R. H.: Rocks and faunas, Ogallala Group, Pawnee Buttes area, Weld County, Colorado, in: The Tertiary record of Weld County, Northeastern Colorado, edited by: Evanoff, E., Tedford, R. H., and Graham, R. W., Denver Museum of Natural History, Denver, Colorado, 31–47, https://coloscisoc.org/wp-content/uploads/2018/09/Rocks_and_Faunas_Ogallala_Group_Pawnee_Buttes_Area_CO.pdf (last access: 20 April 2024), 1999. a
Tedford, R. H., Albright, L. B., Barnosky, A. D., Ferrusquia-Villafranca, I., Hunt, R. M., Storer, J. E., Swisher, C. C., Voorhies, M. R., Webb, S. D., and Whistler, D. P.: Mammalian Biochronology of the Arikareean Through Hemphillian Interval (Late Oligocene Through Early Pliocene Epochs), in: Late Cretaceous and Cenozoic Mammals of North America, edited by: Woodburne, M. O., Chap. 6, Columbia University Press, New York, NY, USA, 169–231, https://doi.org/10.7312/wood13040-008, 2004. a, b, c, d, e
Thomasson, J. R.: Late Cenozoic Grasses and Other Angiosperms from Kansas, Nebraska, and Colorado: Biostratigraphy and Relationships to Living Taxa, Kansas Geological Survey Bulletin 218, https://www.kgs.ku.edu/Publications/Bulletins/218/index.html (last access: 20 April 2024), 1979. a, b
Ting, M. and Wang, H.: The Role of the North American Topography on the Maintenance of the Great Plains Summer Low-Level Jet, J. Atmos. Sci., 63, 1056–1068, https://doi.org/10.1175/JAS3664.1, 2006. a
Trimble, D. E.: Cenozoic tectonic history of the Great Plains contrasted with that of the Southern Rocky Mountains: A synthesis, The Mountain Geologist, 17, 59–69, 1980. a
van der Ent, R. J., Savenije, H. H. G., Schaefli, B., and Steele-Dunne, S. C.: Origin and fate of atmospheric moisture over continents, Water Resour. Res., 46, W09525, https://doi.org/10.1029/2010WR009127, 2010. a
van Dijk, J., Fernandez, A., Bernasconi, S. M., Caves Rugenstein, J. K., Passey, S. R., and White, T.: Spatial Pattern of Super-Greenhouse Warmth Controlled by Elevated Specific Humidity, Nat. Geosci., 13, 739–744, https://doi.org/10.1038/s41561-020-00648-2, 2020. a, b
Waterisotopes Database: Query: North Latitude =50, South Latitude = 26, East Longitude = −125, West Longitude = −85, Type= Groundwater, River or Stream, https://wateriso.utah.edu/waterisotopes/pages/spatial_db/SPATIAL_DB.html (last access: 20 August 2019), 2019. a, b, c, d, e, f, g
Webb, W. P.: The Great Plains, Ginn and Company, Boston, MA, ISBN 0803297025, 1931. a
Westerhold, T., Marwan, N., Drury, A. J., Liebrand, D., Agnini, C., Anagnostou, E., Barnet, J. S., Bohaty, S. M., De Vleeschouwer, D., Florindo, F., Frederichs, T., Hodell, D. A., Holbourn, A. E., Kroon, D., Lauretano, V., Littler, K., Lourens, L. J., Lyle, M., Pälike, H., Röhl, U., Tian, J., Wilkens, R. H., Wilson, P. A., and Zachos, J. C.: An astronomically dated record of Earth's climate and its predictability over the last 66 million years, Science, 369, 1383–1388, https://doi.org/10.1126/SCIENCE.ABA6853, 2020. a, b
Wheeler, L. B. and Galewsky, J.: Atmospheric Flow Patterns Around the Southern Alps of New Zealand and Implications for Paleoaltimetry, Geophys. Res. Lett., 44, 11601–11605, https://doi.org/10.1002/2017GL074753, 2017. a, b
Willett, S. D., McCoy, S. W., and Beeson, H. W.: Transience of the North American High Plains landscape and its impact on surface water, Nature, 561, 528–532, https://doi.org/10.1038/s41586-018-0532-1, 2018. a, b, c, d, e, f
Winkler, D. A.: Stratigraphy, vertebrate paleontology, and deposition history of the Ogallala Group in Blanco and Yellowhouse Canyons, Northwestern Texas, PhD, The University of Texas at Austin, 243 pp., http://hdl.handle.net/2152/34167 (last access: 20 April 2024), 1985. a, b
Winkler, D. A.: Vertebrate-bearing eolian unit from the Ogallala Group (Miocene) in northwestern Texas (USA), Geology, 15, 705–708, https://doi.org/10.1130/0091-7613(1987)15<705:VEUFTO>2.0.CO;2, 1987. a
Winkler, D. A.: Sedimentary facies and biochronology of the Upper Tertiary Ogallala Group, Blanco and Yellowhouse canyons, Texas Panhandle, in: Geologic frame work and regional hydrology; Upper Cenozoic Blackwater Draw and Ogallala formations, Great Plains, edited by: Gustavson, T. C., The University of Texas at Austin, Bureau of Economic Geology, Austin, TX, 39–55, https://store.beg.utexas.edu/symposia/3521-sp0006.html (last access: 20 April 2024), 1990. a
Winnick, M. J., Chamberlain, C. P., Caves, J. K., and Welker, J. M.: Quantifying the isotopic “continental effect”, Earth Planet. Sc. Lett., 406, 123–133, https://doi.org/10.1016/j.epsl.2014.09.005, 2014. a, b, c
Zhang, L., Hickel, K., Dawes, W. R., Chiew, F. H. S., Western, A. W., and Briggs, P. R.: A rational function approach for estimating mean annual evapotranspiration, Water Resour. Res., 40, 1–14, https://doi.org/10.1029/2003WR002710, 2004. a
Zhang, P., Molnar, P., and Downs, W. R.: Increased sedimentation rates and grain sizes 2–4 Myr ago due to the influence of climate change on erosion rates, Nature, 410, 891–897, https://doi.org/10.1038/35073504, 2001. a, b, c
Zhou, W., Leung, L. R., and Lu, J.: Seasonally dependent future changes in the US Midwest hydroclimate and extremes, J. Climate, 35, 17–27, https://doi.org/10.1175/jcli-d-21-0012.1, 2021a. a, b, c, d, e, f, g, h, i, j
Zhou, W., Leung, L. R., Song, F., and Lu, J.: Future Changes in the Great Plains Low-Level Jet Governed by Seasonally Dependent Pattern Changes in the North Atlantic Subtropical High, Geophys. Res. Lett., 48, e2020GL090356, https://doi.org/10.1029/2020GL090356, 2021b. a
Zhu, L., Fan, M., Hough, B., and Li, L.: Spatiotemporal distribution of river water stable isotope compositions and variability of lapse rate in the central Rocky Mountains: Controlling factors and implications for paleoelevation reconstruction, Earth Planet. Sc. Let., 496, 215–226, https://doi.org/10.1016/j.epsl.2018.05.047, 2018. a, b
- Article
(10224 KB) - Full-text XML