the Creative Commons Attribution 4.0 License.
the Creative Commons Attribution 4.0 License.
 | 21 Mar 2023
How does the explicit treatment of convection alter the precipitation–soil hydrology interaction in the mid-Holocene African humid period?
Leonore Jungandreas
Cathy Hohenegger
Martin Claussen
Global climate models with coarse horizontal resolution are largely unable to reproduce the monsoonal precipitation pattern over North Africa during the mid-Holocene. Here we present the first regional, storm-resolving simulations with an idealized but reasonable mid-Holocene vegetation cover. In these simulations, the West African monsoon expands farther north by about 4–5∘, and the precipitation gradient between the Guinea coast and the Sahara decreases compared to simulations with a barren Sahara as it is today. The northward shift of monsoonal precipitation is caused by land surface–atmosphere interaction, i.e., the coupling of soil moisture and precipitation, as well as interactions of the land surface with the large-scale monsoon circulation (e.g., the African easterly jet).
The response of the monsoon circulation to an increased vegetation cover is qualitatively similar but more pronounced in parameterized convection simulations. We attribute the differences in monsoonal precipitation to differences in soil moisture that are strongly controlled by runoff and precipitation characteristics. If precipitation is intense and falls over a spatially small region, as in our storm-resolving simulations, about 35 % of all precipitation water goes into runoff instead of filling soil moisture storage. In contrast, in light and spatially more homogeneous precipitation, as produced in our parameterized convection simulations, only some 20 % leaves the grid cell as runoff. Therefore, much more water is available to maintain high soil moisture content. We confirm the significant role of soil moisture and runoff by performing simulations with the same constant soil moisture field in both storm-resolving and parameterized convection simulations. These constant soil moisture simulations cancel the effect of lower soil moisture on the land–atmosphere feedback cycle in our storm-resolving simulations. We show that precipitation strongly increases in the storm-resolving simulations, especially in moisture-controlled regions, such as the northern Sahel and Sahara, and reaches equally high values as in parameterized convection simulations. Our study highlights how the type of rainfall (e.g., local and intense or widespread and light) impacts soil moisture and thus land–atmosphere feedbacks. This is contrary to many studies that focus mainly on the amount of rainfall and how it modifies land–atmosphere feedbacks. Moreover, this study suggests that comprehensive land-surface schemes, which appropriately respond to varying precipitation characteristics, are needed for studying land surface–atmosphere interaction.
- Article
(5162 KB) - Full-text XML
- BibTeX
- EndNote


During the mid-Holocene, about 5000 to 11 000 years ago, the climate of the North African continent was wetter than today; its landscape was characterized by a denser vegetation cover consisting of grasslands and shrublands (Jolly et al., 1998) and shaped by abundant lakes and wetlands (Tierney et al., 2017). This so-called “African humid period” (AHP) was triggered by steady variations in the Earth's orbit (Kutzbach and Guetter, 1986; Street-Perrott et al., 1990). These variations led to a stronger northern hemispheric insolation gradient and thereby to an intensified West African monsoon circulation (Kutzbach and Otto-Bliesner, 1982; Kutzbach and Liu, 1997). It is widely accepted that the initial changes in the West African monsoon circulation were amplified by ocean–atmosphere (Kutzbach and Liu, 1997) and land–atmosphere feedbacks (Claussen and Gayler, 1997; Braconnot et al., 1999, 2012; Krinner et al., 2012; Gaetani et al., 2017; Claussen et al., 2017), causing strong changes in the hydrological cycle and vegetation, as indicated, for example, in sediment records or fossils in numerous proxy data (e.g., Peyron et al., 2006; Bartlein et al., 2011).
The intensified West African monsoon shifted monsoonal precipitation further north and led to an increase in soil moisture and hence increased vegetation cover over the semi-arid and arid regions of the Sahel–Sahara region. In the simplest feedback, increased soil moisture and enhanced vegetation cover increased evapotranspiration, which increased latent heat flux and, therefore, lower-tropospheric humidity (e.g., Kutzbach et al., 1996; Doherty et al., 2000). This favored convective activity and a positive feedback on precipitation.
Moreover, wetter soils and a higher vegetation cover are darker than bare soil; hence, the surface albedo is lower (e.g., Kutzbach and Liu, 1997; Claussen and Gayler, 1997; Texier et al., 1997; Broström et al., 1998; Doherty et al., 2000; Braconnot et al., 2000; Vamborg et al., 2011). A decreased surface albedo increased the available net surface radiation over mid-Holocene North Africa. Levis et al. (2004) argued that the increase in net surface energy raised the temperature over the continent and enhanced the land–sea temperature gradient. This albedo–temperature feedback dominated the direct soil moisture–precipitation feedback (as explained above) and intensified monsoon circulation and precipitation over mid-Holocene North Africa. However, the temperature over North Africa can also decrease in response to a decrease in albedo and an increase in surface net energy as found by Ripley et al. (1976) and Claussen and Gayler (1997). Due to the higher moisture availability, most of the surplus of surface energy is transferred to the atmosphere via latent heat flux rather than sensible heat flux. The decrease in the Bowen ratio (sensible heat flux divided by latent heat flux) increases the vertical gradient of moist static energy within the boundary layer that destabilizes the atmosphere and favors convection and precipitation (Schär et al., 1999).
Moreover, the decrease in temperature over North Africa (via enhanced latent heat flux) can affect the meridional temperature gradient over North Africa and induce a dynamic land–atmosphere feedback as pointed out by Patricola and Cook (2007) and Rachmayani et al. (2015). Therefore, a weakened meridional temperature gradient slows down the African easterly jet due to the thermal wind balance (Cook, 1999; Wu et al., 2009). This slowdown of the African easterly jet includes two coupling mechanisms to convection and precipitation. Firstly, it decreases the mid-level moisture export out of North Africa and increases the available moisture for convection and precipitation (Cook, 1999). Secondly, with the northward shift of the maximum temperature gradient, the African easterly jet core also shifts northward. This includes a broadening of the region of deep ascending motion between the African easterly jet and the tropical easterly jet, supporting the broader occurrence of convection and precipitation (Xue and Shukla, 1993, 1996; Cook, 1999; Nicholson and Grist, 2001; Grist and Nicholson, 2001).
However, in all paleoclimate studies, climate models still struggle to reproduce the precipitation distribution (i.e., the amplitude and/or the extension of the tropical rain belt) to support the greening of the semi-arid and arid regions of the North African continent (e.g., Joussaume et al., 1999; Braconnot et al., 2012; Harrison et al., 2015; Brierley et al., 2020) compared to proxy data. A possible explanation for diverging rainfall distributions could be the parameterization of convective rainfall, which is used in coarse-resolution climate models (e.g., Yang and Slingo, 2001; Randall et al., 2003; Stephens et al., 2010; Dirmeyer et al., 2012; Fiedler et al., 2020; Jungandreas et al., 2021). The influence of the representation of convection on the mid-Holocene West African monsoon but with present-day land-surface cover was investigated by Jungandreas et al. (2021). Although they found no substantial effect on the meridional precipitation distribution over mid-Holocene North Africa when comparing storm-resolving with parameterized convection simulations, they identified an important feedback between the land surface and precipitation that depends on how convection is represented in the model. Resolving convection explicitly leads to less frequent but more local and intense precipitation. In contrast, parameterizing convection causes less intense but more frequent precipitation that steadily moistens the soil by generating less runoff. As the soil is not able to absorb the high amount of rainfall in storm-resolving simulations, a large fraction is removed from the system as runoff and thus causes a noticeably weaker refilling of the soil moisture during the monsoon season compared to parameterized convection simulations. Consequently, in storm-resolving simulations, the lower soil moisture yields a lower latent heat flux and, consequently, extenuated convective activity, while in parameterized convection simulations, the higher latent heat flux further supports convection and maintains a strong positive precipitation feedback.
In their simulation, Jungandreas et al. (2021) have prescribed present-day conditions for the vegetation cover, like the simulation setup used in the Paleoclimate Modeling Intercomparison Project phase 1 (PMIP1). This is, in relation to early and mid-Holocene conditions, an unrealistic specification of land-surface conditions. In this study, we first address the question of whether a more realistic land-surface coverage, i.e., more widespread vegetation cover and, likely, higher soil moisture, affects the hydrological conditions in a way that monsoonal precipitation in storm-resolving simulations is increased and shifted further north compared to present-day conditions. Second, we address how the response differs between simulations with storm-resolving and parameterized convection simulations. Furthermore, motivated by the results of Jungandreas et al. (2021), we also aim to understand whether differences in runoff may explain different sensitivity to land cover change between storm-resolving and parameterized convection simulations.
Therefore, in the present study, we first examine the most important land–atmosphere feedbacks in our storm-resolving simulations that evolve due to a higher vegetation cover (Sect. 3.1). To do so, we prescribe a larger, mid-Holocene-like vegetation cover over North Africa based on the simulated total vegetation cover fraction of the transient mid-Holocene simulations of the Max Planck Institute Earth System Model (MPI-ESM) (Dallmeyer et al., 2020). Subsequently, we compare the parameterized convection simulations (Sect. 3.2). Finally, we repeat our simulations with higher vegetation cover but additionally prescribe the same constant soil moisture field in both the storm-resolving and the parameterized convection simulations to assess the importance of runoff in shaping the precipitation response to land cover change. Based on these simulations, we investigate the dependence of the hydrological cycle on the representation of convection in our model (Sect. 3.3).
2.1 Model
The model and simulation setup used in this study is identical to the one used in Jungandreas et al. (2021). We use the ICON (ICOsahedral Nonhydrostatic) model framework version 2.5.0 (Zängl et al., 2015) in its operational numerical weather prediction (NWP) mode. The ICON-NWP model framework supports nested experiments. The nesting allows us to run coarse-horizontal-resolution simulations with parameterized convection and high-resolution simulations using explicitly resolved convection simultaneously. We simulate using a one-way nesting strategy. The convective parameterization used in our simulations is based on the bulk mass-flux approach introduced by Tiedtke (1989) with modifications by Bechtold et al. (2014). Zängl et al. (2015) list the other physical parameterizations of the model framework. All simulations are limited-area simulations. The domains are outlined in Fig. 1, as is the main analysis domain we use in our investigations.
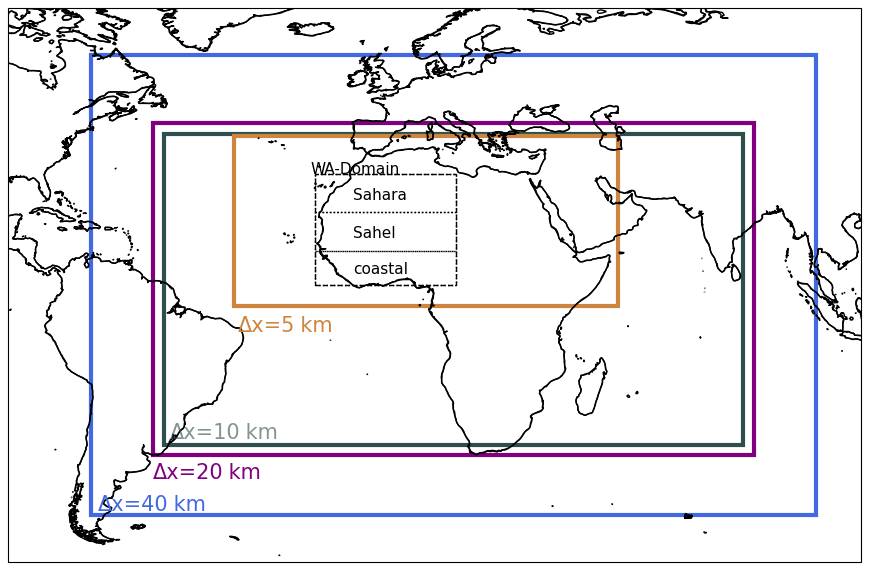
Figure 1Solid colored domains outline the nesting domains of the simulations for the various grid spacings (as indicated). The dashed black domain labeled “WA domain” (West Africa) displays the main analysis domain. The WA domain spans the area from 5–31∘ N and from 18∘ E–15∘ W. The three dotted black domains within the WA domain are used to distinguish the coastal African region (“coastal”), the Sahel region (“Sahel”), and the Saharan region (“Sahara”) that are indicated in the longitudinal mean plots. The coastal region spans from 5–13∘ N and from 18∘ E–15∘ W. The Sahel region spans from 13–22∘ N and from 18∘ E–15∘ W and the Sahara region from 22–31∘ N and from 18∘ E–15∘ W.
2.2 Simulation setup
We perform a 30-year spin-up simulation that covers the period from 7039 b2k (years before the year 2000) to 7010 b2k. The spin-up simulation is conducted on a regional domain with a 40 km horizontal grid spacing and 75 vertical levels (blue domain outlined in Fig. 1) using parameterized convection. The soil moisture reaches a stable state after around 15 years (of the 30-year spin-up period). We select 2 years after this 15-year soil moisture spin-up phase consistent with the procedure applied in Jungandreas et al. (2021). Based on the 30-year monthly mean time series of the parameterized convection simulation (40 km-P), JAS mean values, and the latitudinal extent of monsoonal precipitation for every year over the WA domain, we selected a relatively strong and a relatively weak monsoon year (in terms of precipitation amount and northward extent). We performed the nested experiments for the boreal summer monsoon season for both the weak and the strong monsoon year. In this paper, we only present the analysis of the strong monsoon year. However, the results are qualitatively the same in the weak monsoon year.
The nesting experiments are initialized on 30 May and run for 5 months (JJASO). The initial and boundary data originate from the transient, global Holocene simulation conducted with the MPI Earth System Model (ESM). More details about the transient MPI-ESM Holocene simulation are provided by Dallmeyer et al. (2020).
The parent domain of the nested simulation (blue outlined domain in Fig. 1) is identical to the domain of the spin-up simulation with the same horizontal and vertical resolution. Inside the 40 km domain, further nested domains are embedded with horizontal resolutions of 20, 10, and 5 km (Fig. 1). While the simulations with 40, 20, and 10 km grid spacing use parameterized convection, the 5 km domain uses explicitly resolved convection. In the following, we refer to the simulations with 40 km horizontal grid spacing and parameterized convection as 40 km-P simulations. Similarly, the 5 km resolution simulation with explicitly resolved convection is labeled as 5 km-E. Due to computational restrictions, we have to limit the downscaling simulations to maximum 5 km as the finest horizontal resolution. However, we do not expect qualitatively different results if we use a finer spatial resolution. First, our simulations at 10 km horizontal resolution yield qualitatively very similar results (see Appendix B), indicating no strong dependence on the spatial resolution in our study. Also, Hohenegger et al. (2020) analyzed convergence properties across resolution between 2.5 and 80 km but could not identify a significant sensitivity. Second, the large mesoscale convective systems of the West African monsoon, which are dominantly responsible for the precipitation over North Africa (Vizy and Cook, 2018), can be appropriately resolved using models with 5 km horizontal resolution. This is also why these types of simulations are commonly referred to as storm-resolving, and we will use this term throughout the text to refer to the kilometer-scale simulations with explicitly resolved deep convection.
The nested simulations are initialized by their respective parent domain 1 h after another. Lateral boundary conditions for the nested simulations are also obtained from their parent simulation and updated every 6 h. We further prescribe 6-hourly sea surface temperature (SST) and sea ice (SIC) fields from the transient MPI-ESM Holocene simulation, as well as the same orbital parameters and tracer gases carbon dioxide (CO2), methane (CH4), and nitrogen oxide (N2O).
In our analysis (Sect. 3), we focus on the three strongest monsoon months from July to September (JAS). Further, we investigate both the 40 km parameterized convection (40 km-P) and the 5 km storm-resolving simulations (5 km-E) to analyze whether and how differently the atmosphere responds to the underlying surface conditions in both representations of convection.
2.2.1 The “Green Sahara” (GS) simulations
To investigate the influence of the land surface on the monsoonal rain belt in simulations with parameterized convection and in storm-resolving simulations, we compare simulations with present-day vegetation cover (Jungandreas et al., 2021, Fig. 2a and c) to simulations with a higher, more realistic mid-Holocene-like vegetation cover (Fig. 2b and d). Because the largest area of North Africa in the simulations with present-day vegetation cover is bare soil (desert) or sparse vegetation, we refer to these simulations in the following as DS simulations (for Dry Sahara). The land-surface cover of these simulations is generated by the German Weather Service (DWD) by combining GLOBCOVER2009, Harmonized World Soil Database (HWSD), and the GLOBE & Lake Database. The simulations with a higher vegetation cover are introduced below.
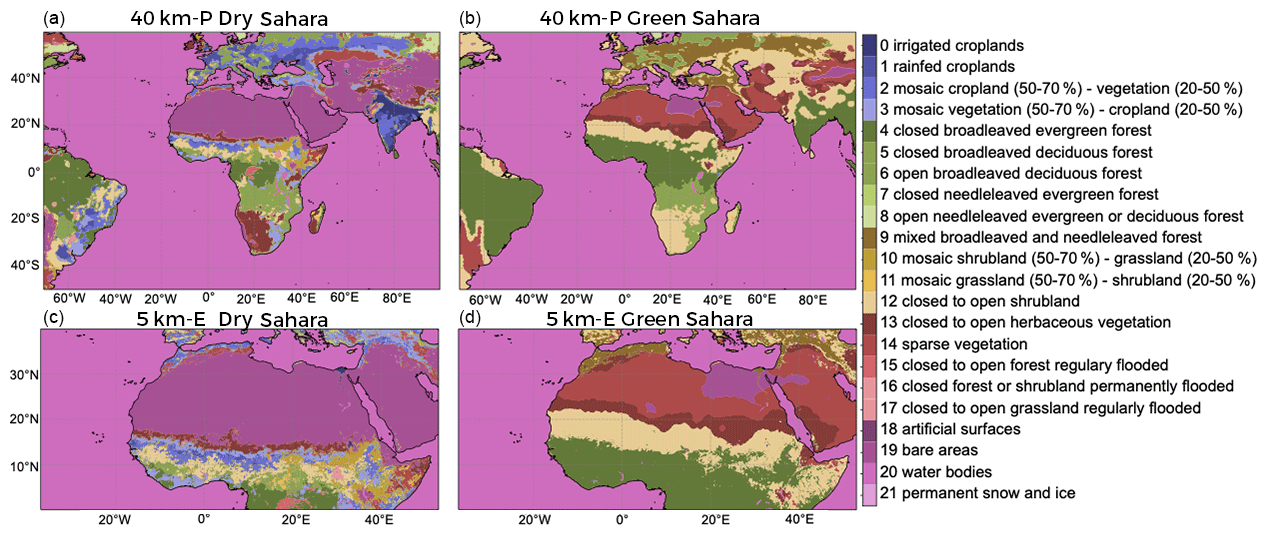
Figure 2Land-surface cover for the Dry Sahara (a, c) and Green Sahara (b, d) simulations for the 40 and 5 km simulations, respectively.
We prescribe an idealized, denser vegetation cover over the whole 40 km simulation domain (spanning from 70.5∘ W–99.5∘ E and from 59∘ N to 49∘ S) guided by the MPI-ESM Holocene simulations (see Dallmeyer et al., 2020). The MPI-ESM Holocene simulations, which cover the last 8000 years, include a prediction of vegetation cover. The desert fraction is computed as the fraction of a grid box that is not covered by vegetation. We use this desert fraction to know how far north vegetation reached and to determine the main vegetation types for our GS simulations. In our GS simulation, vegetation is specified consisting of seven vegetation types: closed broadleaved evergreen forest (dark green in Fig. 2), closed needle-leaved evergreen forest (light green), mixed broadleaved and needle-leaved forest (brownish), closed to open shrubland (yellow), closed to open herbaceous vegetation (dark red), sparse vegetation (lighter red), and bare area (desert, purple)(see Fig. 2b and d). We prescribe one homogeneous vegetation type per grid cell. Obviously, a specific present-day vegetation type cannot be transformed into one specific mid-Holocene vegetation type over the whole simulation domain. Therefore, depending on the region, we apply different criteria to modify the vegetation cover, as described in Table A1 and summarized below. For North Africa, our main region of interest, we extend the present-day area of evergreen tropical rainforest (Fig. 2b, dark green) to about 15∘ N. North of the rainforest, we then prescribe a decreasing vegetation gradient from closed to open shrubland (light yellow), to closed to open herbaceous vegetation (dark red), to sparse vegetation (lighter red). Bare soil (desert) prevails only over a small area of Egypt. In the following, we label these vegetated Sahara simulations with GS (for Green Sahara).
With the vegetation cover, we adjust all variables that depend on the vegetation type, for example, the leaf area index, surface albedo, root depth, minimal stomata resistance, and several others (see Table A2), which are prescribed in the external parameters. The external parameters have to represent the characteristics of the specific vegetation type in each grid cell. However, present-day external parameters for ICON-NWP, which we use to calculate the external parameters for our GS simulation, represent a mixture of different vegetation types per grid cell. We calculate the spatially constant values for our GS simulations as follows.
-
We calculate the dominant land cover type (i.e., vegetation type) for each grid cell of the present-day land cover distribution of the 40 km domain (see Fig. 2a).
-
All grid cells of this simulation with the same dominant vegetation type are used to calculate the domain mean or either the 75th or the 85th percentile value for each variable.
-
We prescribe either the mean or the percentile values for each parameter to the idealized mid-Holocene vegetation types, respectively. The percentile values are used if the mean value underestimates the parameter value. This can happen because the parameter value of the present-day external parameters does not represent the dominant vegetation type but a mixture of different vegetation types.
Table A2 in summarizes all modified variables and indicates if we use mean or percentile values.
2.2.2 Green Sahara simulations with constant soil moisture, GS-cSM
In addition to the GS simulations, we perform a second set of GS simulations, but with a prescribed soil moisture field that we keep constant for the whole simulation period (Fig. 3). We label these simulations with GS-cSM (for “Green Sahara with constant soil moisture”). We prescribe the soil moisture field of 1 September at 00:00 UTC of the 40 km-P GS simulation to all four domains at all times. The soil moisture field from 1 September displays relatively high soil moisture levels, compared to the soil moisture levels at the beginning of the GS simulations, to provide enough soil moisture for evapotranspiration. Small variations between the 5 km-E and 40 km-P soil moisture field are possible due to interpolation. Apart from keeping the soil moisture constant, the simulation setup in the GS-cSM simulations is identical to the GS simulation setup.
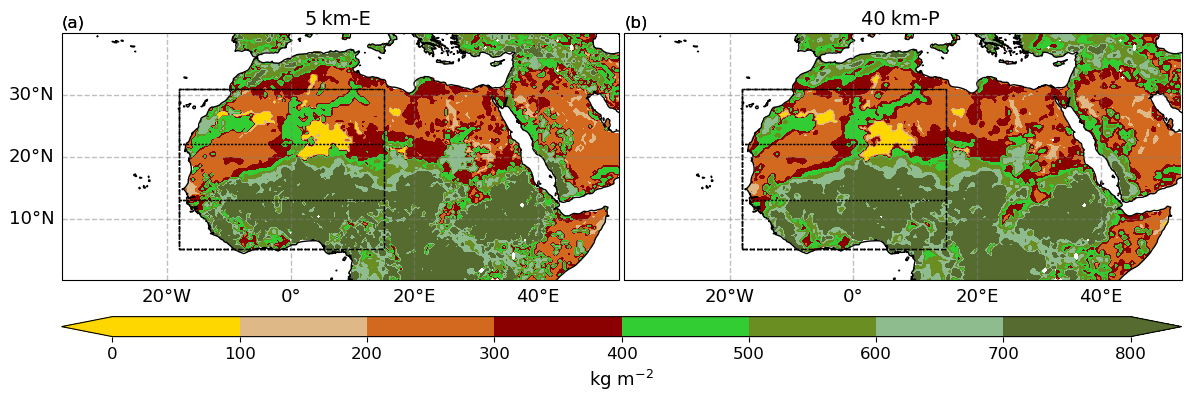
Figure 3The prescribed constant soil moisture field as a sum over the uppermost six soil layers (up to a depth of 3.42 m) in the 5 km-E (a) and the 40 km-P (b) simulation. The vertical black dashed lines indicate the borders of the coastal, the Sahel, and the Sahara region outlined in Fig. 1.
In the following section (Sect. 3.1), we compare the storm-resolving simulations with present-day land-surface cover (DS) introduced by Jungandreas et al. (2021) with the simulations with higher vegetation cover (GS, Sect. 2.2.1) to describe the evolving land–atmosphere feedbacks. Subsequently, in Sect. 3.2 we briefly highlight the differences between parameterized (40 km-P) and storm-resolving (5 km-E) simulations. In Sect. 3.3 we present the results of our sensitivity experiment in which we prescribe the same constant soil moisture field in the 5 km-E and the 40 km-P simulations.
All analyses are done for the months of July to September over the WA domain and, if not further specified, for the subregions “coastal”, “Sahel”, or “Sahara” as shown in Fig. 1.
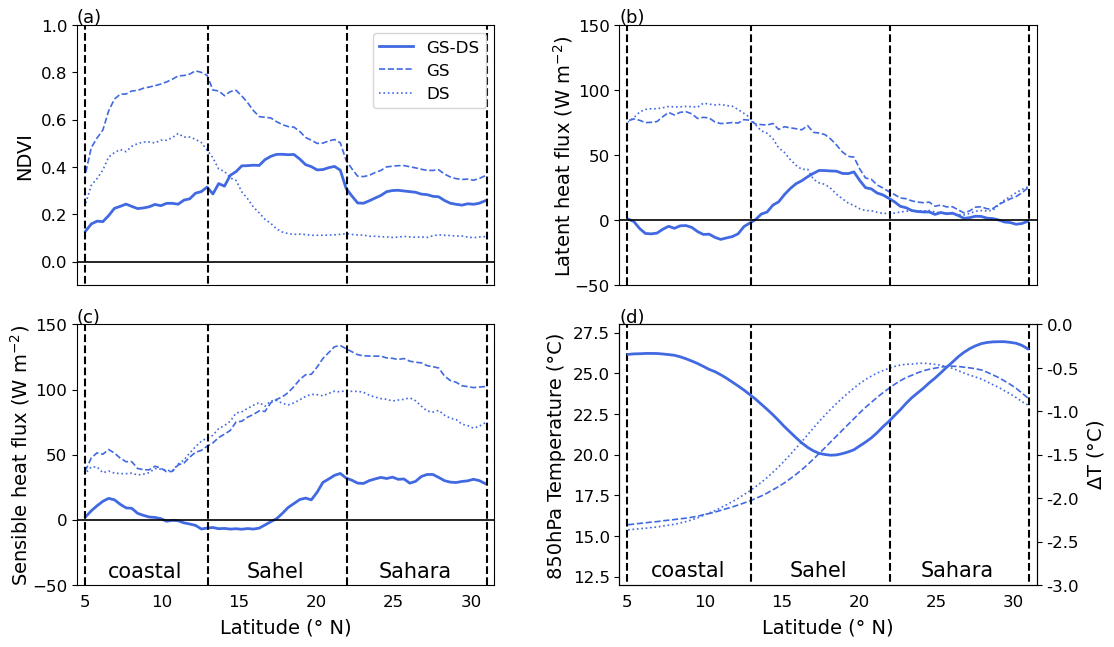
Figure 4JAS mean meridional distribution of the normalized difference vegetation index (NDVI; a), the latent heat flux (b), the sensible heat flux (c), and the 850 hPa temperature (d) for the 5 km-E storm-resolving simulations. Note the second y axis in panel (d) for the difference temperature (solid line). The longitudinal mean is taken over the WA domain for the 5 km-E simulations. The lines indicate the distribution for the Dry Sahara simulation (DS, blue dotted line), for the Green Sahara simulation (GS, blue dashed line), and the difference between the GS and the DS simulation (blue solid line). The vertical black dashed lines indicate the borders of the coastal, the Sahel, and the Sahara region outlined in Fig. 1.
3.1 Land–atmosphere coupling – how the land influences the large-scale monsoon circulation
3.1.1 Changes in vegetation and the surface energy budget
In our simulations, the main influence of the prescribed change in vegetation cover is, on the one hand, on the energy partitioning into latent and sensible heat flux and, on the other hand, on the temperature gradient over the North African continent between the drier, warmer region of the Sahara and the cooler, moister regions near the coast.
In the GS simulation, we prescribe a higher vegetation cover (indicated by the normalized difference vegetation index – NDVI; Fig. 4a) over the whole WA domain, with the strongest increase over the Sahel region compared to the DS simulation. Prescribing a higher vegetation cover strongly decreases the surface albedo by about 54 % (compare energy fluxes in Table 1). The decrease in albedo implies about 50 % less reflection of solar incoming radiation at the surface and thus higher absorption of solar radiation. This remains true despite the decrease in incoming solar radiation due to higher cloud cover (Fig. A2). The thermal outgoing radiation at the surface slightly decreases due to mostly colder temperature and the longwave, downward radiation increases due to higher cloud cover. Taking these two effects together, the surface gains more thermal energy. All in all, net radiation increases and the total heat flux (sensible + latent heat flux) from the surface into the atmosphere increases. How much of the total energy is transformed into latent and sensible heat strongly depends on the water availability at the surface.
Table 1JAS mean values of radiation components at the surface averaged over the WA domain (Fig. 1) for the 5 km-E DS and GS simulations. The abbreviations used are as follows: SW↓ – downward, shortwave radiation, SW↑ – upward, shortwave radiation, SWnet – net shortwave radiation, LW↓ – downward, longwave radiation, LW↑ – upward, longwave radiation, LWnet – net longwave radiation, Rnet – net radiation, LH – latent heat flux, SH – sensible heat flux, Res – residuum term.

Over the coastal region, moisture is generally abundant (regardless of the prevailing vegetation type, i.e., dense shrubland or forest). Hence, latent heat flux is high and sensible heat flux small in both the GS and DS simulation (Fig. 4b and c). Therefore, variations between the GS and the DS simulations are small. In contrast, over the Sahel (a region strongly controlled by water availability) the higher vegetation cover increases the interception storage of water and makes deeper soil water available for evapotranspiration. Therefore, the total increase in the surface heat fluxes (compare Fig. 4b and c) over the Sahel is dominated by the increase in latent heat flux. Over the Sahara, water remains too limited and the increase in sensible heat flux dominates the total increase in the surface heat fluxes in the GS compared to the DS simulation.
Differences in the temperature field are dominantly determined by differences in the latent heat flux. Latent heat flux is more effective in transporting energy from the surface into the atmosphere and can cool the surface. As shown in Fig. 4 d, lower-tropospheric temperature (here shown for 850 hPa) decreases in the GS compared to the DS simulation. The strongest decrease in temperature of about 1.5 ∘C is located over the Sahel region and coincides with the region of the strongest increase in latent heat flux. The maximum temperature over the Sahara shifts northward where vegetation cover is less dense and thus latent heat flux is smaller. Simultaneously, the temperature over the coastal region does not change substantially, consistent with the small variations in latent heat flux. Consequently and as indicated by the difference in temperature (solid line, note the second y axis), the temperature gradient south of about 18∘ N (location of the maximum decrease) weakens, while it strengthens north of 18∘ N. The maximum temperature gradient shifts north by about 2–3∘ in the GS compared to the DS simulation (not shown). This temperature coupling is especially important for the formation and the location of the African easterly jet over North Africa and thus influences the dynamics of the atmosphere and will be further discussed in Sect. 3.1.2.
3.1.2 Changes in atmospheric dynamics
Despite the decrease in temperature (Fig. 4d), the low-pressure system (not shown) over the Sahara deepens. This strengthening of the low-pressure system is caused by a stronger thermal uplift at the surface, which in turn is caused by the increase in net radiation (SW + LW; see Table 1) at the surface over the northern Sahel and Sahara region. Therefore, the surface pressure gradient between the Sahara and the tropical Atlantic Ocean increases and drives a stronger low-level, southwesterly monsoon flow (Fig. 5). The strengthened southwesterly winds transport cool and moist air from the Gulf of Guinea and the coastal region (consistent with the drying of the coastal region, Fig. 7) deep into the African continent and provide additional moisture for convection and precipitation. Moreover, in response to the strengthened low-level, southwesterly winds, the location of the Intertropical Front (ITF, the location where the southwesterly monsoon flow converges with the northeasterly Harmattan winds) shifts about 2∘ further north (from about 20 to 22∘ N; Fig. 5). The low- and mid-level lifting over the northern Sahel and southern Sahara region that is associated with the lifting of air at the ITF (between 20–23∘ N) (Nicholson, 2009; Thorncroft et al., 2011) slightly strengthens and reaches higher altitudes in the GS simulation (Fig. 6c).
The decrease in the temperature gradient south of about 18∘ N (Fig. 4d) and the northward shift of the maximum temperature gradient imply a weakening of the meridional gradient in geopotential. The weakening of the geopotential gradient weakens the African easterly jet (AEJ; indicated by the local maximum of easterly wind speed – blueish color – at about 600 hPa) and shifts its core about 3∘ N in the GS compared to the DS simulation (Fig. 5; Cook, 1999; Wu et al., 2009). Several studies (e.g., Cook, 1999; Nicholson and Grist, 2001; Grist and Nicholson, 2001) confirm that the northward displacement and a weakening of the AEJ are associated with more humid conditions over the Sahel. Hence, more moisture remains over North Africa as a source for clouds and precipitation in the GS simulations (compare to Fig. A3).
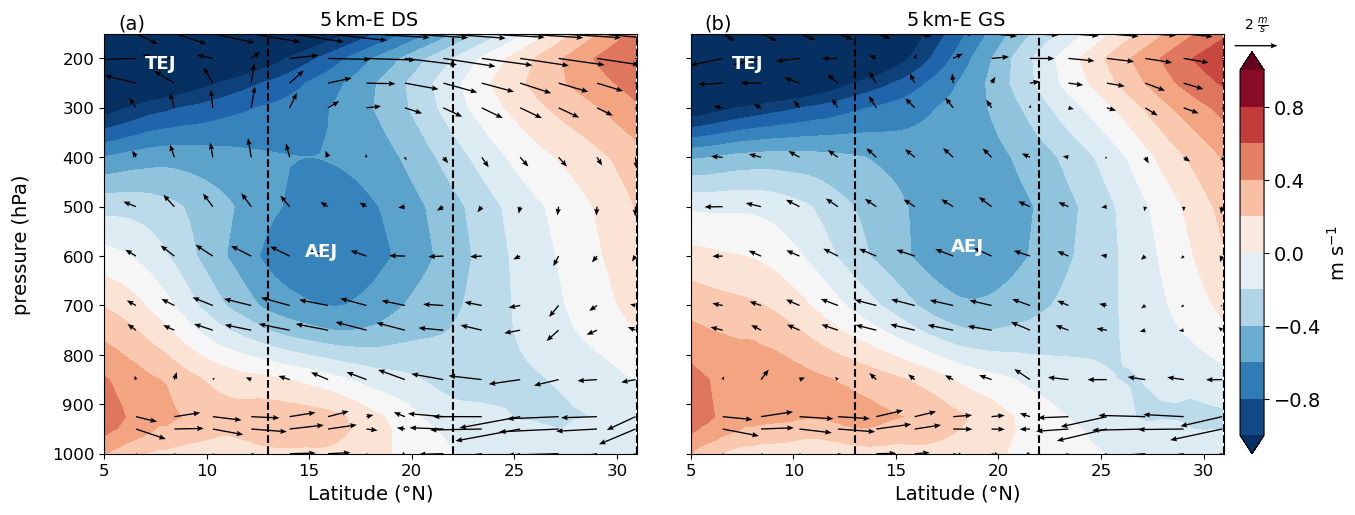
Figure 5Vertical cross section of the wind field over the WA domain (Fig. 1). The shading displays the mean zonal wind and the arrows the mean meridional and vertical wind for the 5 km-E and the DS (a) and the GS (b) simulation, respectively. Note that the vertical wind speed is multiplied by 100 to make arrows more visible. The locations of the African easterly jet (AEJ) and the tropical easterly jet (TEJ) are indicated by the labels. The dashed vertical lines indicate the borders of the coastal, Sahel, and Sahara domain also displayed in Fig. 1.
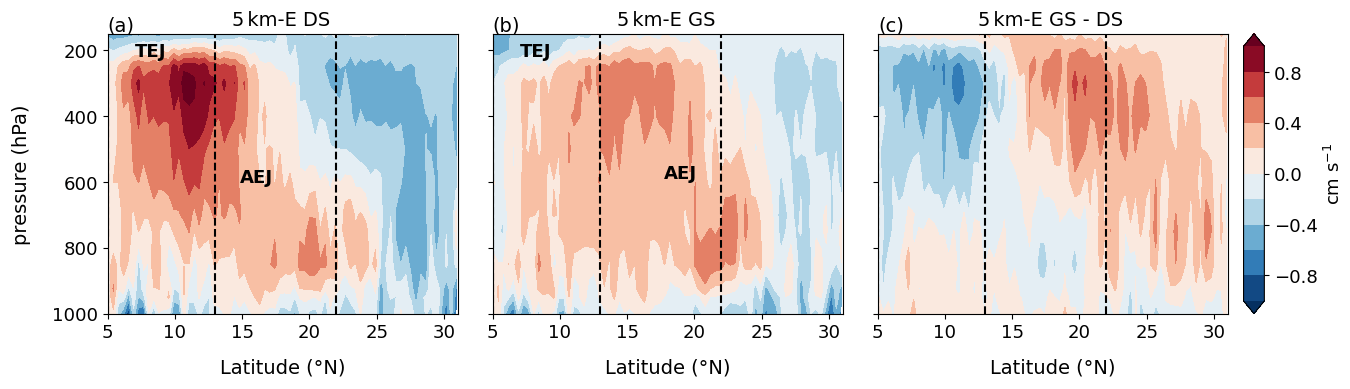
Figure 6Vertical cross section of the vertical wind component for the 5 km-E DS (a) and GS (b), as well as for the difference between the GS and DS (c simulation, respectively, averaged over the WA domain outlined in Fig. 1. Again, the locations of the African easterly jet (AEJ) and the tropical easterly jet (TEJ) are indicated by the labels. The dashed vertical lines again indicate the latitudes of the coastal, Sahel, and Sahara domain also displayed in Fig. 1.
Moreover, with the northward shift of the AEJ, the region of strong ascent between the tropical easterly jet (TEJ; maximum easterly winds at about 200 hPa) and the AEJ axes (e.g., Grist and Nicholson, 2001; Nicholson and Grist, 2001) broadens and reaches further north. Fig. 6c displays a decrease in vertical upward motion at middle and high levels over the coastal region and an increase over the Sahel–Sahara region up to about 25∘ N in the GS compared to the DS simulation. The ascending motion between the jet axes is part of a deep meridional overturning circulation (Thorncroft et al., 2011). It not only distributes moisture within the whole troposphere (Fig. 7), but it also forces the low-level inflow of fresh, moist monsoonal air from the south and southwest (also compare to Fig. A3). Hence, it potentially contributes to the strengthening of the low-level, southwesterly monsoon winds in the GS simulations. Moreover, stronger convection in turn yields higher latent heat release, enhances the temperature gradient, and reinforces the monsoon circulation. Stronger upward motion and higher atmospheric humidity lead to more supportive conditions for convection and therefore support higher precipitation rates over the Sahel and Sahara.
3.1.3 Changes in atmospheric thermodynamics
The change in surface latent heat flux together with the strengthened monsoon circulation influences the moisture in the lower troposphere as shown in Fig. 7. Over the coastal region relative humidity decreases slightly in the GS compared to the DS simulation. The decrease in latent heat flux and the intensified southwesterly monsoon winds yield a higher moisture divergence over the coastal region. In contrast, the increase in relative humidity in the lowest atmosphere layers over the Sahel and Sahara region can be linked to the increase in latent heat flux (Fig. 4b), the decrease in temperature (Fig. 4d), and the convergence of moisture (not shown). This increase in boundary layer relative humidity supports the triggering of convection over these regions. In turn, the increase in convective activity likely contributes to the increase in the upper-tropospheric humidity as it distributes boundary layer moisture upwards.
Figure 7Vertical cross section of the difference in relative humidity between the GS and the DS simulation for the 5 km-E simulations. The field is averaged over the WA domain outlined in Fig. 1. The vertical dashed lines delineate the latitudes of the coastal, the Sahel, and the Sahara domain (see Fig. 1).
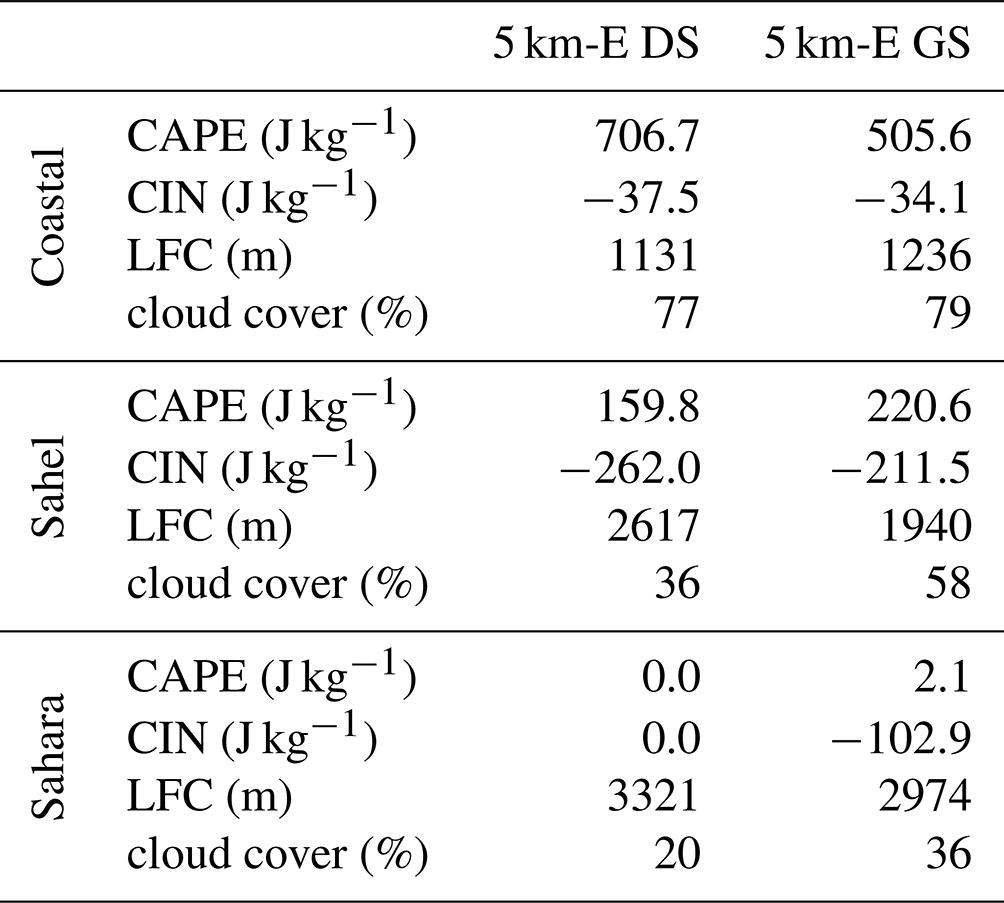
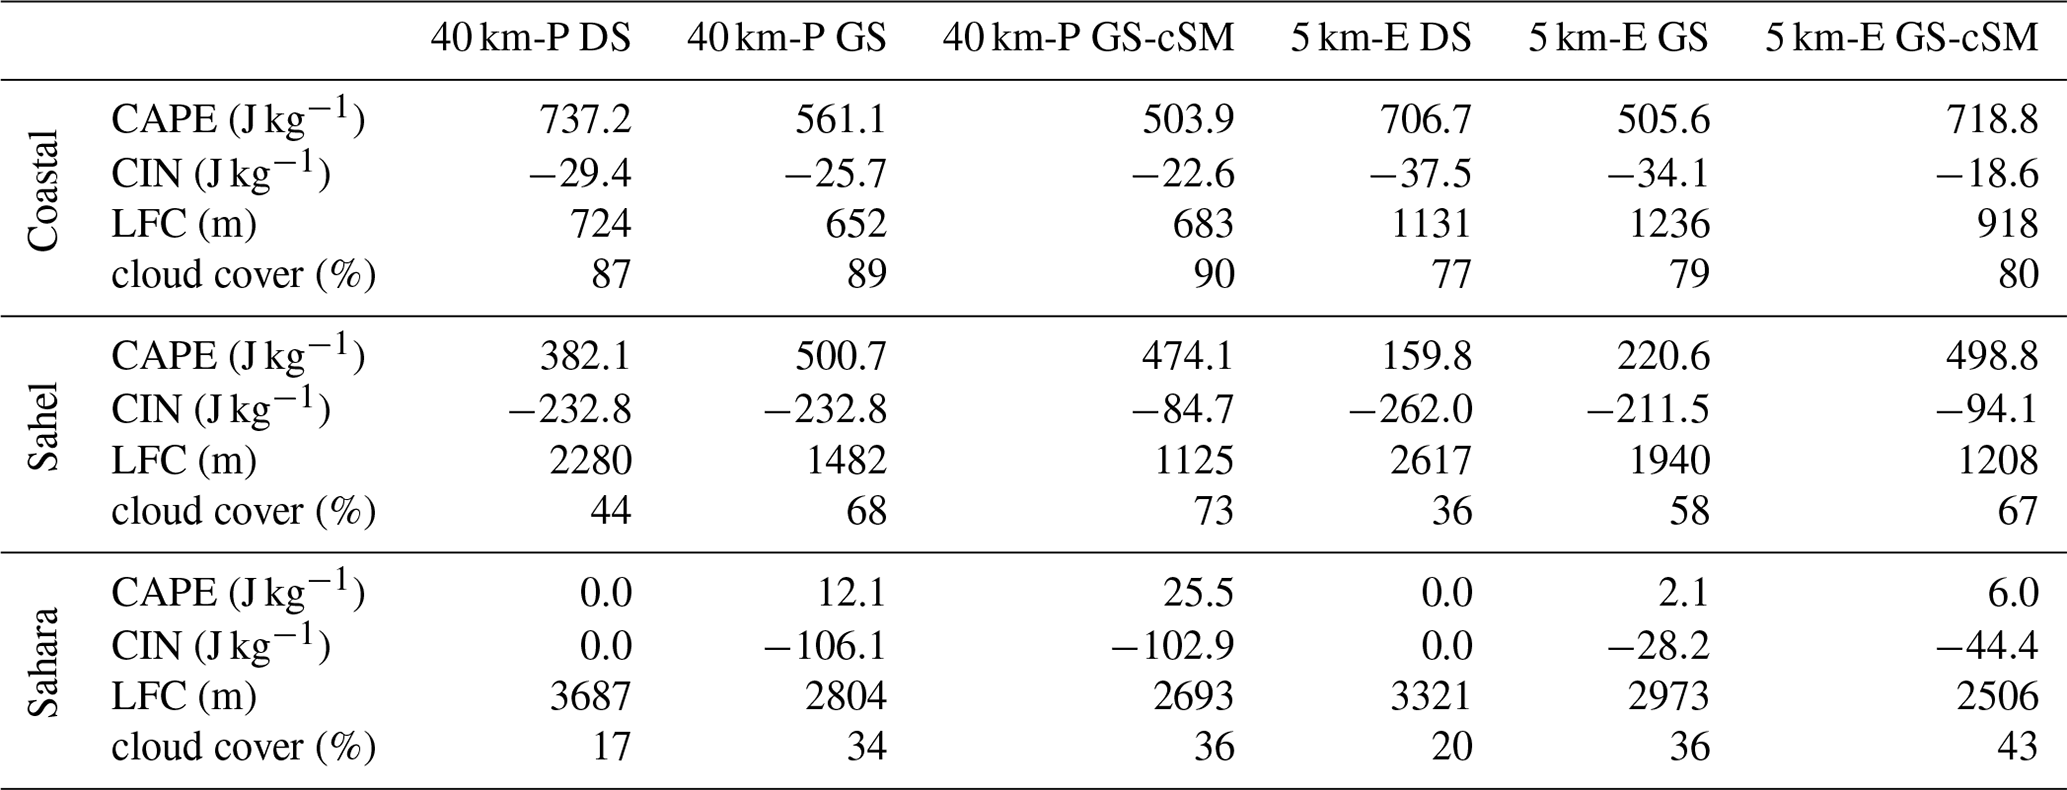
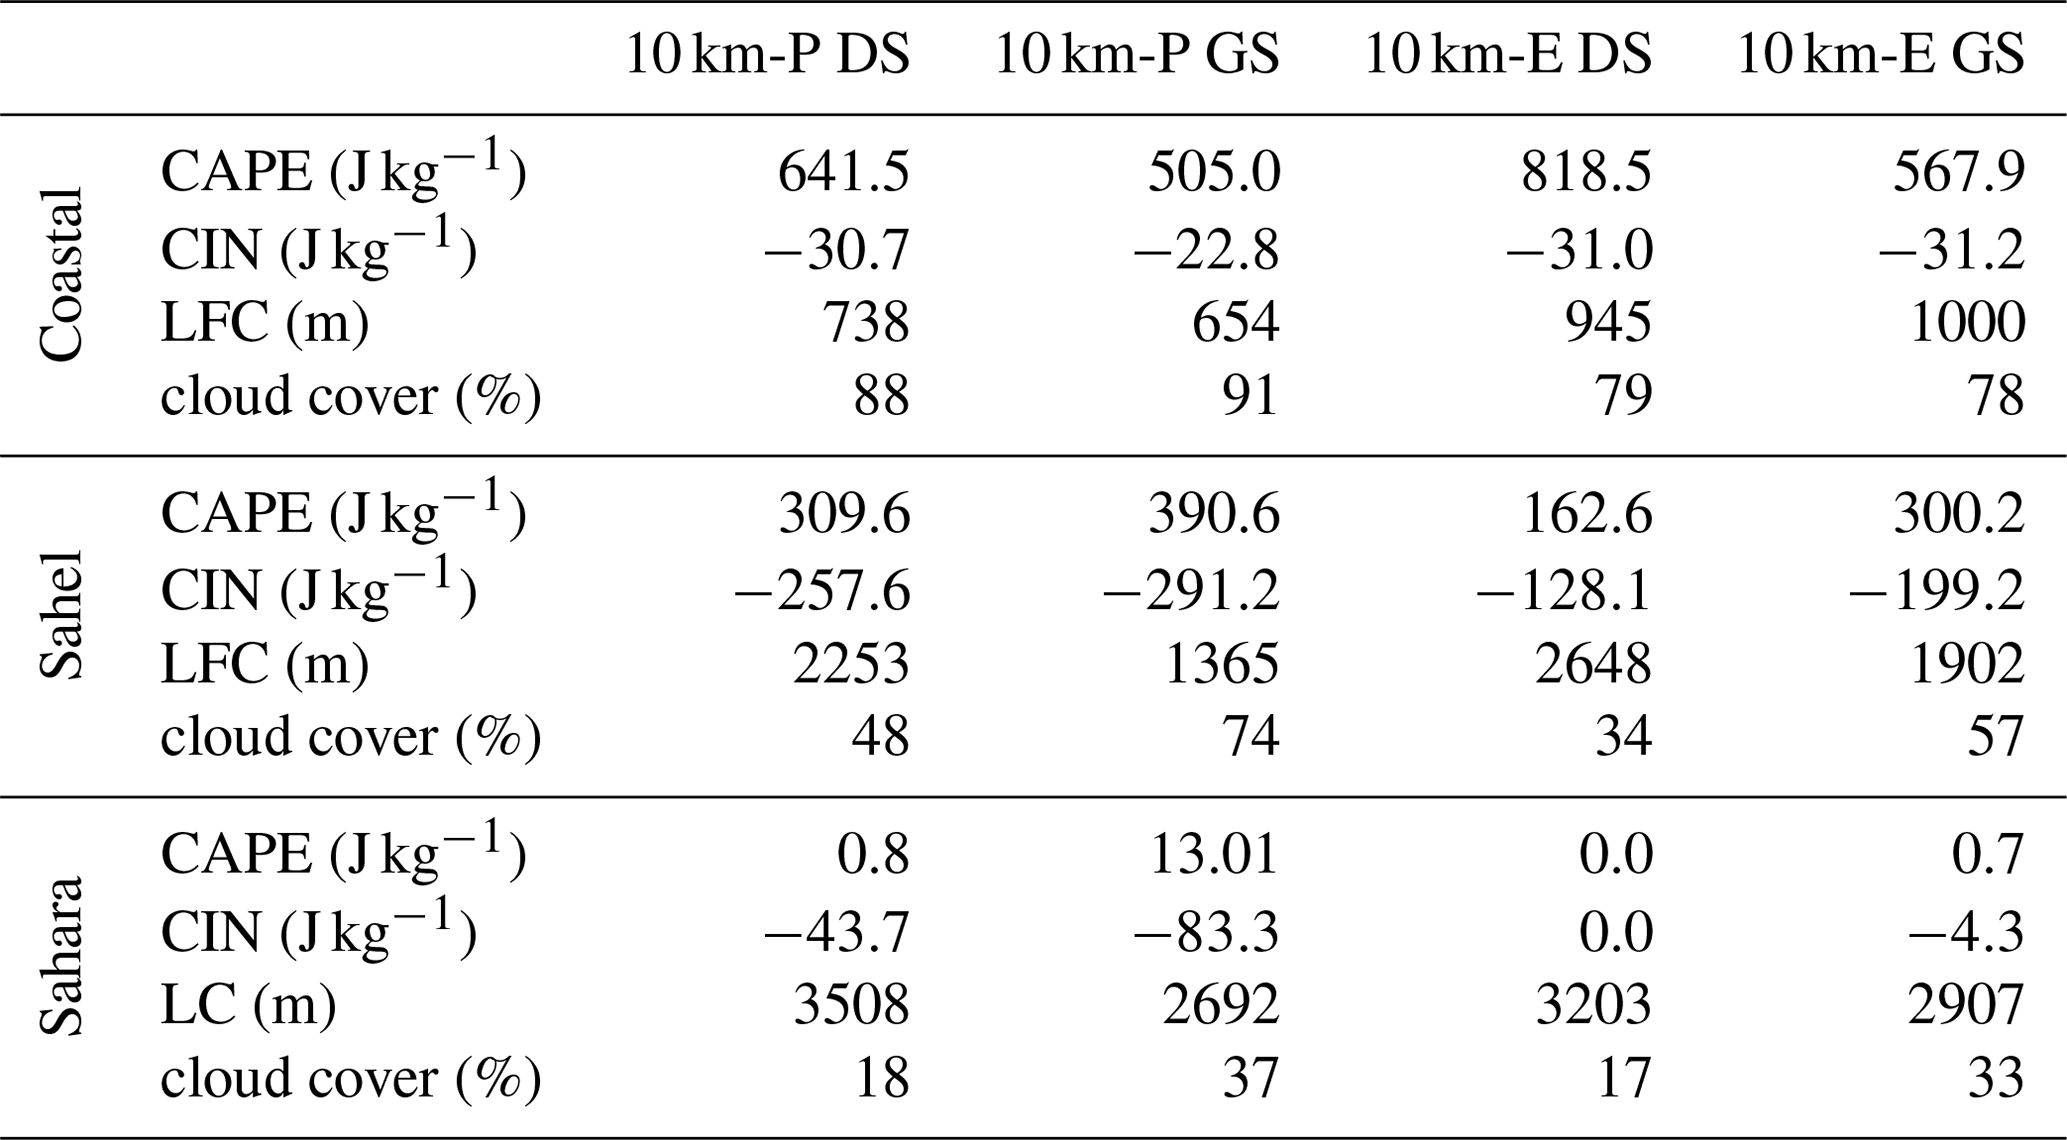
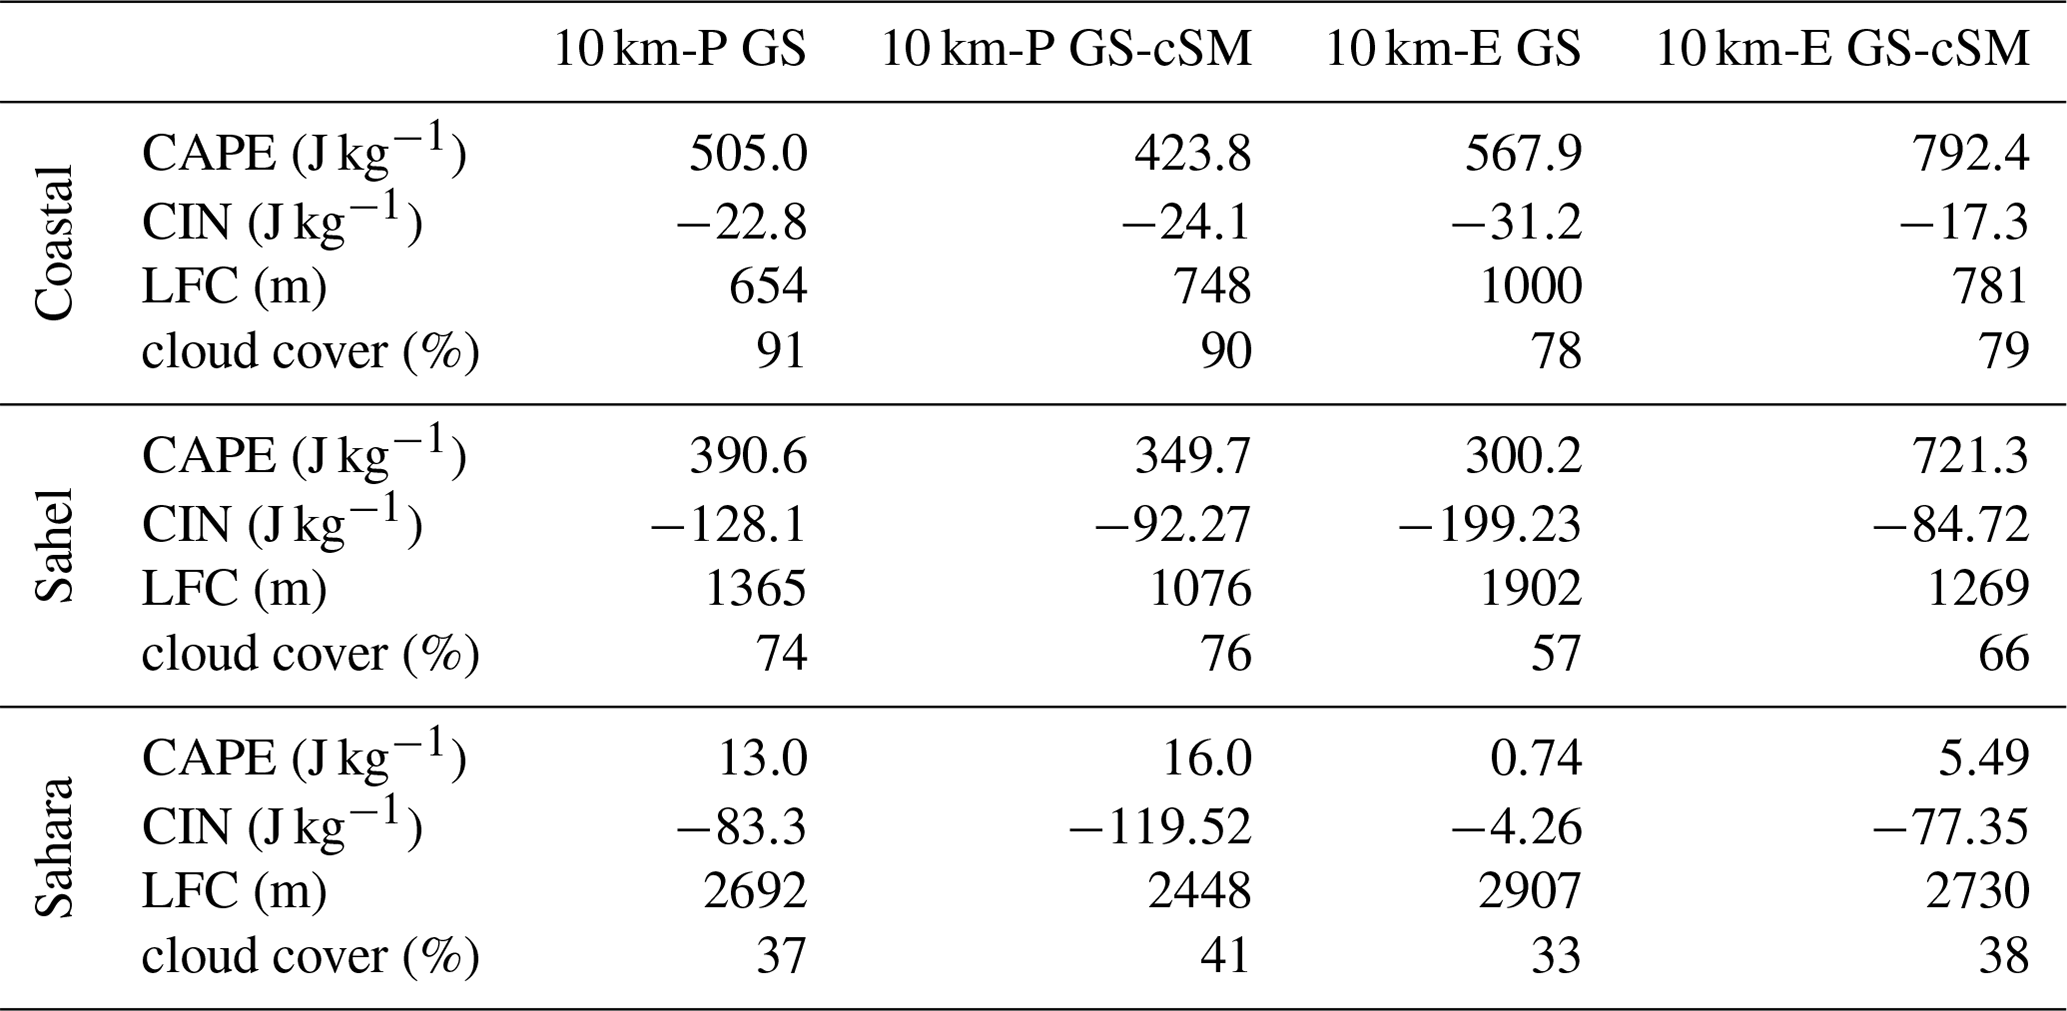
Changes in the stability parameters, such as CAPE (convective available potential energy1) and CIN (convective inhibition2) listed in Table 2, are consistent with the less supportive conditions for the triggering of convection in the GS simulation over the coastal region and the more supportive conditions over the Sahel and Sahara region. Over the coastal region, CAPE slightly decreases and, despite the CIN becoming slightly less negative, the level of free convection (LFC3) is higher. Over the Sahel region, CAPE increases, CIN becomes less negative, and the LFC is lowered. Changes over the Sahara are very weak and indicate generally poor conditions for convection and precipitation to occur.
Table 2JAS mean values of 12:00 UTC CAPE, CIN and JAS mean level of free convection (LFC), and total cloud cover for the coastal, Sahel, and Sahara region (Fig. 1) for the 5 km-E DS and GS simulation.
3.1.4 Resulting changes in precipitation
The land–atmosphere coupling described above induces a positive land–atmosphere feedback over the Sahel–Sahara region, where the mean precipitation increases in response to increased vegetation cover, and a negative feedback over the coastal region (Fig. 8; increased vegetation cover that leads to a decrease in precipitation which counteracts the growing of plants). Over the coastal region, the increase in vegetation cover leads to a decrease in latent heat flux (Sect. 3.1.1) and humidity, which are less favorable thermodynamic conditions (Sec. 3.1.3), and weakened vertical upward motion (Fig. 6). The trend is the opposite over the Sahel region (and to a lesser extent over the Sahara region): latent heat flux and lower-tropospheric humidity strongly increase and yield more supportive thermodynamic conditions. The modified thermodynamic gradient between the coastal and the Sahel–Sahara region shifts the AEJ northward (Sect. 3.1.2), enhances the monsoon circulation, and increases atmospheric humidity. As a result, precipitation shifts from the coastal towards the Sahel–Sahara region by about 4–5∘. Therefore, we suggest that the main cause for the further northward propagation of monsoonal precipitation in the GS simulation is of a dynamical nature. However, to quantify which feedback dominates the precipitation response, further analyses are needed and are beyond the scope of this paper.
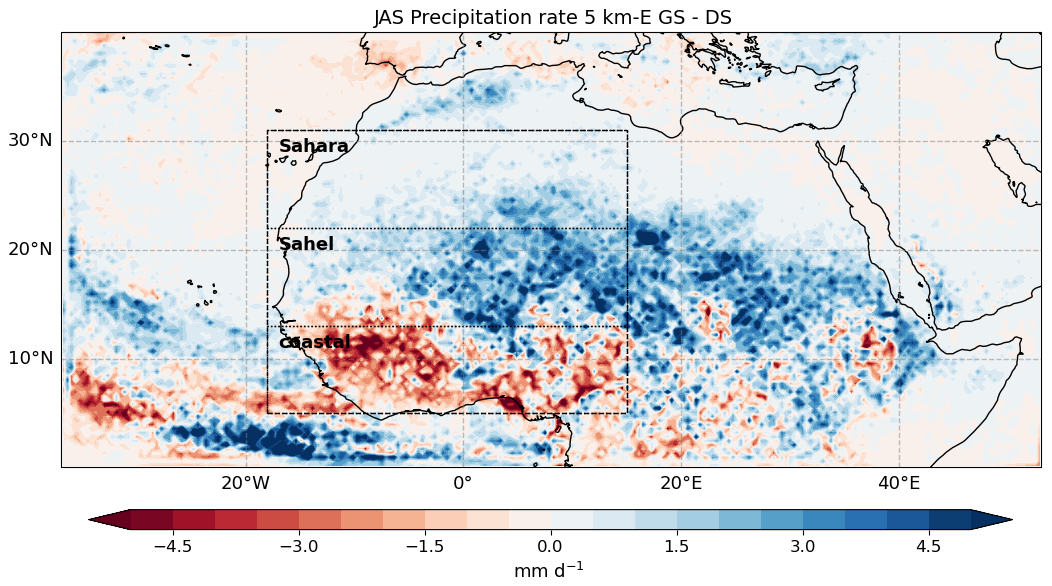
Figure 8JAS mean difference in precipitation rate between the 5 km-E GS and DS simulation. The dashed box indicates the WA analysis domain.
3.2 Positive land–atmosphere feedbacks but with different strength – differences between 40 km-P and 5 km-E simulations
In the previous section, we analyzed the differences between the 5 km-E GS and DS simulation to identify the operating land–atmosphere feedbacks in our storm-resolving simulations. All feedback mechanisms explained in Sect. 3.1 also qualitatively hold for simulations with parameterized convection and for all horizontal resolutions. Both representations of convection show a positive precipitation coupling over the Sahel–Sahara region and a negative coupling over the coastal region in response to an increased vegetation cover. Beside these similarities in the general feedback sign, there are pronounced differences in the magnitude of the changes between storm-resolving and parameterized convection simulations.
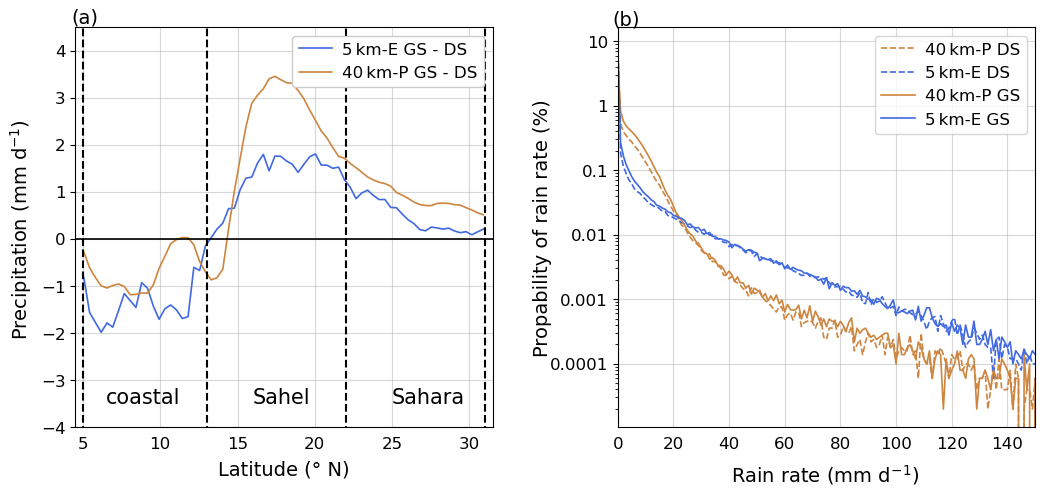
Figure 9(a) Difference of the JAS mean meridional precipitation distribution between the GS and DS simulation for the 5 km-E simulations (blue line) and the 40 km-P simulation (orange line), respectively. The vertical black dashed lines indicate the borders of the coastal, the Sahel, and the Sahara region outlined in Fig. 1. Panel (b) shows the probability density function of rain rate calculated over all land points of the WA domain. Blue lines indicate the 5 km-E DS (dashed) and GS (solid) simulations. Orange lines display the 40 km-P DS (dashed) and GS (solid) simulations.
Figure 9a displays strong differences in the precipitation response to changes in the land-surface cover between the two representations of convection. The decrease in precipitation in the 5 km-E GS compared to the DS simulation over the coastal region is stronger, while the increase over the Sahel and Sahara region is noticeably weaker than in the 40 km-P simulations. Over the Sahara, the precipitation increase in the 40 km-P simulations remains higher but differences to the 5 km-E simulations become smaller. We find that precipitation in the 40 km-P simulations is generally much higher throughout the WA domain and extends farther north (by about 2∘ taking 2 mm d−1 as a threshold) compared to the 5 km-E simulations (not shown; refer to Jungandreas et al., 2021, for the DS simulations).
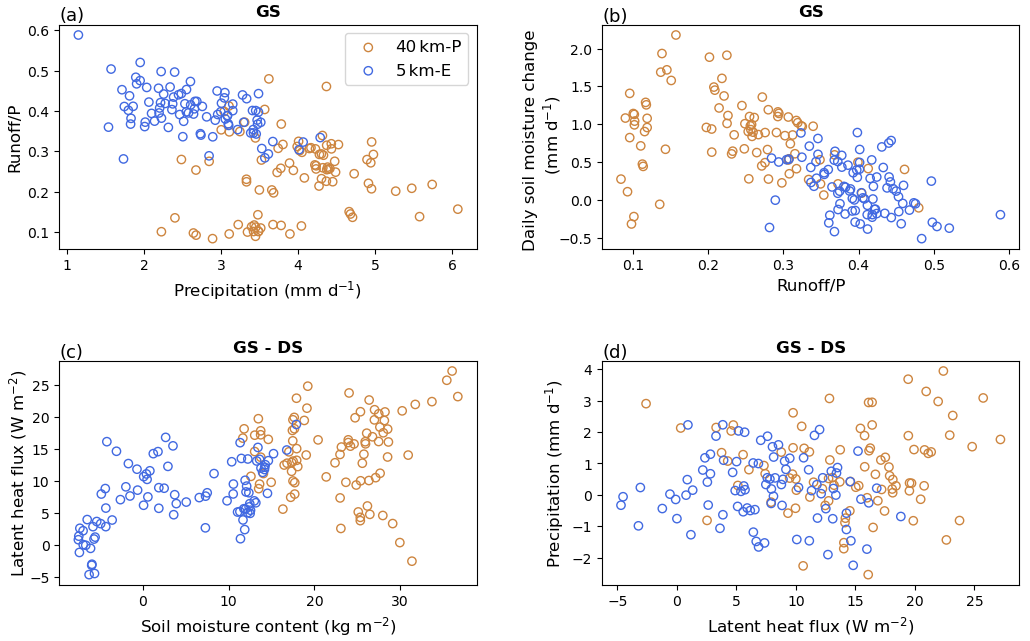
Figure 10Relationship between different variables in the GS simulation (a, b) and the difference between the GS and the DS simulation (c, d) for the 5 km-E simulations (blue circles) and the 40 km-P simulations (orange circles). Each circle indicates 1 d of the JAS season averaged over the WA domain outlined in Fig. 1. The panels show the following relationships: (a) the ratio between runoff and precipitation rate as a function of precipitation rate, (b) the daily change in soil moisture (within the six uppermost soil layers reaching up to a depth of 3.42 m) as a function of the runoff–precipitation ratio, (c) the difference in latent heat flux as a function of the difference in total soil moisture content (again within the six uppermost soil layers reaching up to a depth of 3.42 m), and (d) the difference in the precipitation rate as a function of the difference of latent heat flux.
We attribute the different precipitation signal to the precipitation–runoff–soil moisture mechanism described for the DS simulations in Jungandreas et al. (2021). Precipitation in the 5 km-E simulations is more often more local and intense, as indicated by the probability density function of the precipitation rate (Fig. 9b). Kendon et al. (2021) found that strong precipitation events tend to be too intense in some convection-permitting models. For the ICON-model, however, Stevens et al. (2020) showed the probability density function of precipitation intensity for simulations conducted with a grid spacing of 312 m, 625 m, and 2.5 km over the tropical Atlantic and for simulations conducted with a grid spacing of 625 m and 2.8 km over a land area of Germany for present-day conditions. Over the tropical Atlantic, there is a clear dependency with resolution with much more frequent downpours at coarse resolution, whereas this effect is not present over the land area. Using the same model version, Paccini (2021, https://pure.mpg.de/rest/items/item_3367420_4/component/file_3367464/content, last access: 20 March 2023) investigated the representation of the probability density function of rainfall intensity over the Amazon and show that ICON with 5 km grid spacing matches observations very well. Therefore, we believe that the probability density function of precipitation intensity is more realistic in 5 km-E than in the 40 km-P simulations and that the former does not significantly overestimate the occurrence of downpours.
More frequent downpours lead to larger amounts of runoff relative to the precipitation amount (Fig. 10a) in the 5 km-E compared to the 40 km-E simulations. In the mean over the WA domain, about 37 % and 35 % of precipitation become runoff in the 5 km-E GS and the DS simulation, respectively, while in the 40 km-P GS and DS simulations only about 21 % and 20 % of the precipitation leave the system as runoff, respectively. As a result of the higher runoff–precipitation ratio, the daily change in soil moisture is much smaller in the 5 km-E compared to the 40 km-P GS simulation (Fig. 10b) (this is also true for the DS simulations). This implies that much less of the surplus of precipitation in the 5 km-E GS simulation (compared to the DS simulation) is stored in the soil (especially over the Sahel and Sahara region) compared to the 40 km-P simulations, resulting in generally lower total soil moisture content in 5 km-E simulations (not shown). Note that the 40 km-P data points at a runoff–precipitation ratio of about 0.1 (Fig. 10a and b) seem to be separated from the other data points. These data points correspond to the first 20 d of the analyzed monsoon season. During this period, soil moisture is still low compared to the period later in the monsoon season. Therefore, soil moisture storage is not filled. Later in the season when soil moisture is higher, the runoff–precipitation ratio increases as a larger fraction of precipitation has to be turned into runoff. We cannot identify coherent larger regions that these points correspond to.

Figure 11Difference of the JAS mean soil moisture content in the six uppermost soil layers between the GS-cSM and the GS simulation for the 5 km-E (a) and the 40 km-P (b) simulations. The dashed black box indicates the WA analysis domain.
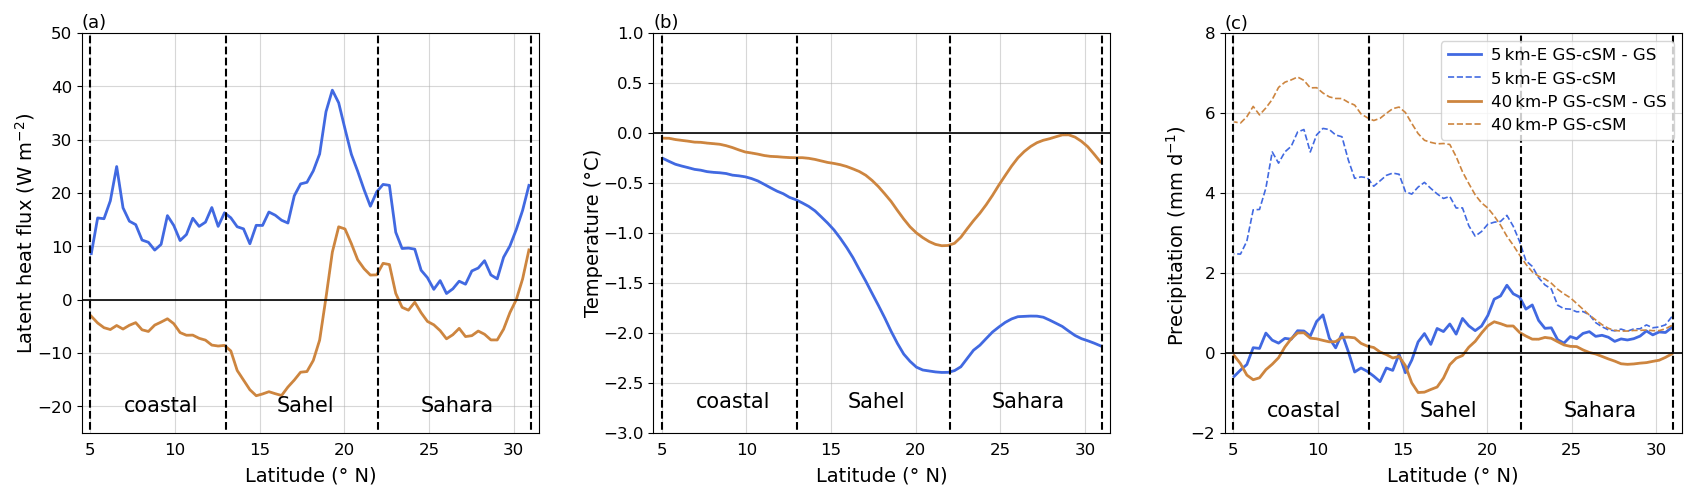
Figure 12Difference of the JAS mean meridional distributions of latent heat flux (a), 850 hPa temperature (b), and precipitation (c) between the GS-cSM and the GS simulations (solid lines) as well as for the GS-cSM simulation (dashed lines in panel c) for the 5 km-E (blue lines) and the 40 km-P (orange lines), respectively. The vertical black dashed lines indicate the boarders of the coastal, the Sahel, and the Sahara region outlined in Fig. 1.
We argue that the precipitation–runoff–soil moisture mechanism dampens the potential precipitation response to a vegetated Sahel–Sahara region in the 5 km-E compared to the 40 km-P simulations. A weaker precipitation response in the 5 km-E simulation could result from either a weaker response of precipitation to a given change in latent heat flux, as, for instance, argued in past studies (Schär et al., 1999; Hohenegger et al., 2009), or from a weaker change in latent heat flux due to a missing refilling of the soil moisture by precipitation. Figure 10c and d emphasize that the latter effect (weaker change in latent heat flux due to smaller changes in soil moisture) dominates the weaker response of precipitation to an increase in vegetation cover in the 5 km-E simulations. While the response of precipitation to the change in latent heat flux is not substantially different in the 5 km-E compared to the 40 km-P simulations (Fig. 10d), Fig. 10c indicates that much smaller changes in soil moisture yield smaller changes in latent heat flux. We hypothesize that the higher soil moisture values in the storm-resolving simulations, comparable to the ones in the parameterized convection simulations, would enhance the land–atmosphere coupling and shift monsoonal precipitation further north.
3.3 The influence of runoff-controlled soil moisture
In the following, we test our hypothesis that the high amounts of runoff influence the precipitation response in the 5 km-E GS simulation via the control of soil moisture. We eliminate the limiting influence of the runoff on soil moisture in both representations of convection. For this purpose, we perform a set of simulations in which we prescribe the same soil moisture fields in the 40 km-P and the 5 km-E GS simulations and keep this soil moisture field constant for the whole simulation period (Sect. 2.2.2). We refer to these simulations as GS-cSM (“Green Sahara with constant soil moisture”).
Figure 11a shows that soil moisture noticeably increases in the 5 km-E GS-cSM simulation, while the difference between the GS-cSM and the GS simulation in the 40 km-P run is much smaller (Fig. 11b). As a result, the latent heat flux (Fig. 12a) strongly increases in the 5 km-E GS-cSM simulation, especially over the Sahel region. In response to the strong increase in soil moisture and latent heat flux, especially over the Sahel and Sahara region, we find that the lower-tropospheric humidity increases more strongly in the 5 km-E GS-cSM simulations (not shown), supporting the triggering of convection. Further, the stability of the atmosphere, especially over the Sahel, decreases and conditions become more supportive in the 5 km-E GS-cSM compared to the GS simulation (see Table A3).
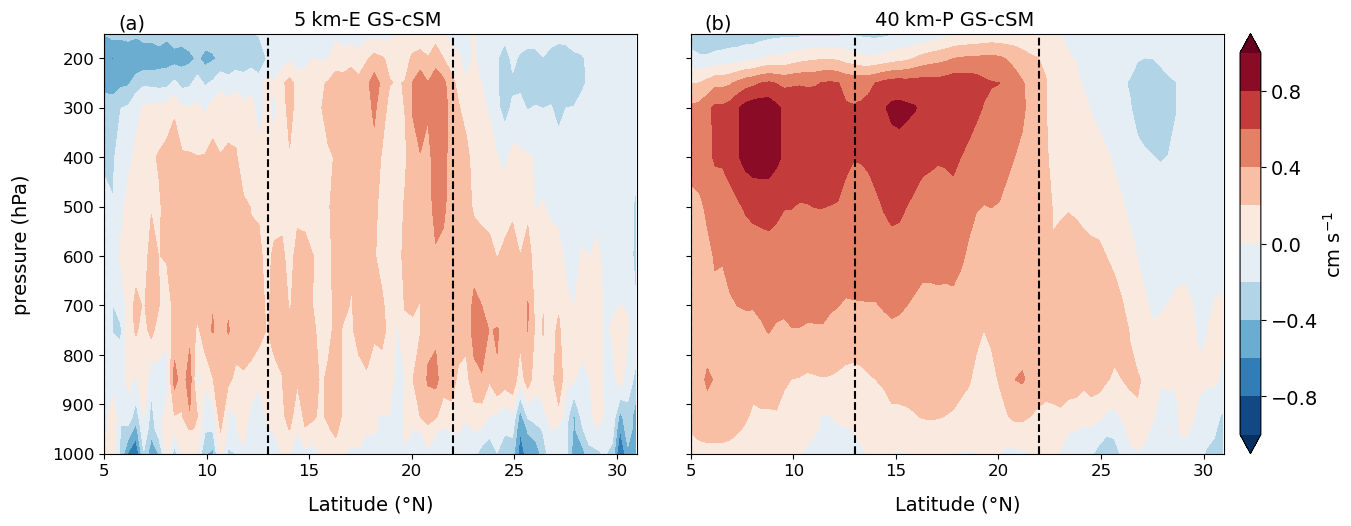
Figure 13JAS mean meridional cross section of vertical wind speed for the 5 km-E GS-cSM (a) and the 40 km-P GS-cSM (b) simulation. The vertical dashed lines indicate the boarders of the coastal, Sahel, and Sahara region outlined in Fig. 1.
The increase in soil moisture and latent heat flux further reduces the lower-tropospheric temperature (Fig. 12b) over the Sahel in the 5 km-E GS-cSM simulation and thereby further reduces the temperature gradient over the continent. As explained in Sect. 3.1.2, the temperature gradient strongly influences the AEJ strength and its location. The temperature reduction between the 5 km-E GS-cSM and GS simulation is stronger than in the 40 km-P simulations. As a result, the mean winds of the AEJ weaken by 2 m s−1 in the 5 km-E GS-cSM simulation (compared to the GS simulation) and by 0.5 m s−1 in the 40 km-P GS-cSM simulations. In the end, the AEJ becomes weaker in the 5 km-E GS-cSM (6.6 m s−1) than in the 40 km-P GS-cSM simulation (7.9 m s−1). Moreover, the AEJ core shifts further north to 20.8∘ N in the 5 km-E GS-cSM simulation and to 20.4∘ N in the 40 km-P GS-cSM simulation. Hence, the AEJ is located at about the same location in both the 5 km-E and 40 km-P GS-cSM simulations. We argue that the location and strength of the AEJ are essential for the northward extent of monsoonal precipitation in our simulations, consistent with the findings of Nicholson and Grist (2001), Grist and Nicholson (2001), and Cook (1999).
Consequently, over the northern Sahel, precipitation (Fig. 12c) shows a strong increase of up to about 1.7 mm d−1 in the 5 km-E GS-cSM simulations, while the increase in the 40 km-P GS-cSM simulation is noticeably smaller with about 0.8 mm d−1. As a result, monsoonal precipitation extends equally far north in the 5 km-E GS-cSM and the 40 km-P GS-cSM simulation (Fig. 12c, dashed lines). According to Joussaume et al. (1999), vegetation needs about 200 mm yr−1 of precipitation to trigger the transition from desert-like vegetation to steppe. Assuming that most monsoon precipitation falls during the months from June to September, a value of 200 mm yr−1 corresponds to about 1.7 mm d−1 in our simulations. Figure 12c shows that the value of 1.7 mm d−1 is crossed at around 24∘ N in the GS-cSM simulation and slightly further south in the GS simulation. This is consistent with the prescribed vegetation cover, keeping in mind that north of 24∘ N, the Libyan Sand Sea exists in the eastern Sahara, prescribed as bare area in the model (Fig. 2). Hence, in principle, the precipitation would be sufficient to maintain the vegetation cover in the model. However, for a more precise, model-consistent analysis, we would need to implement a dynamic vegetation model into the regional climate model, which is beyond the scope of this study. We argue that the soil moisture north of about 17∘ N becomes an important factor for the northward propagation of monsoonal precipitation. This confirms our hypothesis that, in the 5 km-E DS and GS simulations, the limited soil moisture hampers the northward extent of monsoonal precipitation in response to a change in vegetation cover.
However, south of about 17∘ N precipitation remains much lower in the 5 km-E simulations than in the 40 km-P simulations. This is likely because precipitation in this region is not moisture-controlled. Whether convection and precipitation can develop is determined by other processes, such as the presence of vertical lifting that is strong enough. Figure 13 displays a much stronger vertical velocity in the 40 km-P GS-cSM than in the 5 km-E GS-cSM simulations. This is also true for the DS and the GS simulations, as well as for all horizontal resolutions. Therefore, we argue that the generally higher mean precipitation rates in the 40 km-P simulations result from the convective parameterization scheme used in the ICON-NWP model framework.
The precipitation increase due to the modified thermodynamic and dynamic atmospheric conditions in the 5 km-E GS-cSM compared to the GS simulation shows the strong indirect effect of increased soil moisture on the atmospheric state. To quantify the contributions of the thermodynamic and the dynamic feedback, more simulations are necessary and are beyond the scope of this paper.
In this study, we have performed the first storm-resolving simulations (5 km-E) of mid-Holocene North Africa with an idealized but reasonably increased vegetation cover. To investigate the land–atmosphere feedbacks we have compared these vegetated Sahara simulations (GS) with simulations with mid-Holocene atmospheric conditions but with present-day vegetation cover (DS; see Jungandreas et al., 2021, for more details). In response to the higher vegetation cover, precipitation shifts from the coastal towards the Sahel and Sahara region in the GS simulation and leads to a stronger northward extent of monsoonal precipitation of about 4–5∘ (regardless of the representations of convection). Our modeling results suggest that both thermodynamic and dynamic feedbacks modulate precipitation over (mid-Holocene) North Africa. Which one dominates under which conditions needs to be further investigated.
We have identified the following feedback mechanisms.
-
As a result of the increased vegetation cover, soil moisture and interception water increases (also because precipitation increases); this yields higher latent heat fluxes over the Sahel and Sahara region. A higher latent heat flux increases the boundary layer atmospheric moisture and generates more supportive thermodynamic conditions favorable for convection to develop.
-
The change in vegetation cover alters the dynamics of the monsoon circulation by affecting the temperature and moisture gradient over North Africa. The decrease in the temperature and moisture gradient results in a weakening and northward shift of the AEJ. These changes in the AEJ lead to moister conditions over the Sahel in the whole troposphere by both enhanced upward transport (together with the TEJ) of boundary layer moisture and decreased mid-level export of moisture from the African continent. These findings are consistent with previous results of Cook (1999), Grist and Nicholson (2001), and Nicholson and Grist (2001), who have associated a weaker and further northward AEJ with more humid conditions over the Sahel.
When compared to simulations that use parameterized convection (40 km-P) (as all global climate models, such as the ones used in the Paleoclimate Modelling Intercomparison Project – PMIP, have done up to now), we find important differences between the 40 km-P and the 5 km-E simulations. As shown in Jungandreas et al. (2021), the representation of convection strongly influences the hydrological cycle in our simulations. As a result of different precipitation characteristics (e.g., intensity and spatial distribution), the representation of convection influences the response of soil moisture to precipitation via the modulation of runoff. We again emphasize that the land–atmosphere feedback is not only a result of how strongly precipitation changes due to a certain change in latent heat flux or soil moisture. How the land surface (soil moisture and runoff) reacts to specific precipitation characteristics (drizzle or shower) also needs to be taken into account in the feedback loop.
The consequently lower soil moisture values in the 5 km-E simulation induce a weaker response of precipitation to a change in vegetation cover. To have a closer look at this difference in the response, we conducted simulations with the same constant soil moisture field in both the 5 km-E and the 40 km-P simulation. The elimination of the impact of runoff on soil moisture induces stronger changes in the 5 km-E than in the 40 km-P simulations, especially over the northern Sahel and Sahara region. This result confirms the impact of the land surface on precipitation over the Sahel and Sahara in our simulations. In storm-resolving simulations, rainfall over the Sahel and Sahara tends to increase, while in parameterized convection simulations rainfall becomes smaller over the Sahel region and larger over the northern Sahel and the Sahara. Specifically, the meridional difference between rainfall over the coastal region and the Sahara is smaller in storm-resolving simulations.
This study highlights the importance of considering both pathways of the soil moisture–precipitation feedback: not only the precipitation response to changes in soil moisture conditions is important, but also the soil moisture response to specific precipitation characteristics plays a crucial role to maintain a strong positive feedback loop. The latter suggests that the representation of the land surface in modeling studies, especially the soil hydrology (including runoff), is of major importance for an adequate representation of land–atmosphere interactions and other atmospheric processes. Describing realistic precipitation characteristics by simulating on storm-resolving scales can have far-reaching consequences for simulating land surface–atmosphere interaction and should be considered in future studies.
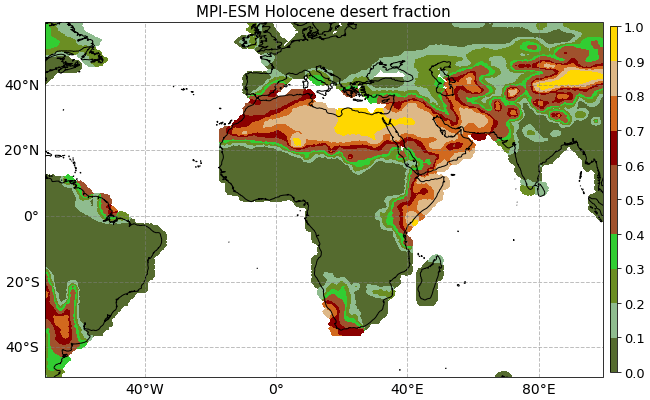
Figure A1MPI-ESM desert fraction from the transient Holocene simulations. 0: no desert area within a grid box, 1: the whole grid box is desert.
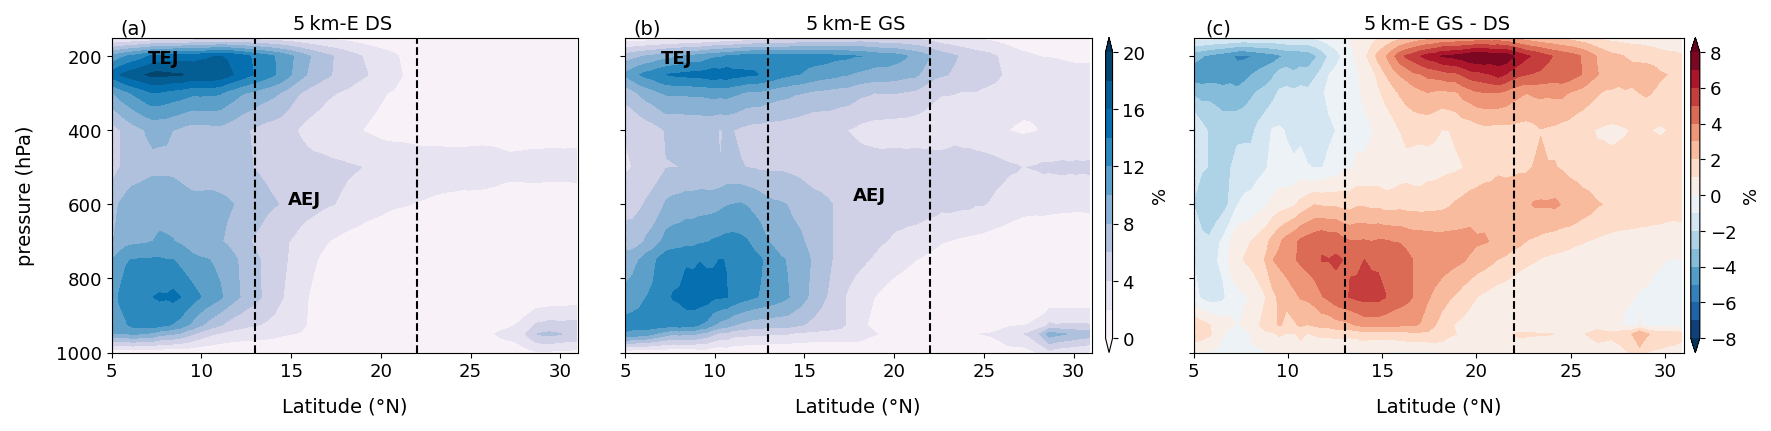
Figure A2JAS mean cloud cover over the WA domain for the 5 km-E DS simulation (a), the GS simulation (b), and the difference between GS and DS (c). The vertical black dashed lines indicate the borders of the coastal, the Sahel, and the Sahara region outlined in Fig. 2.
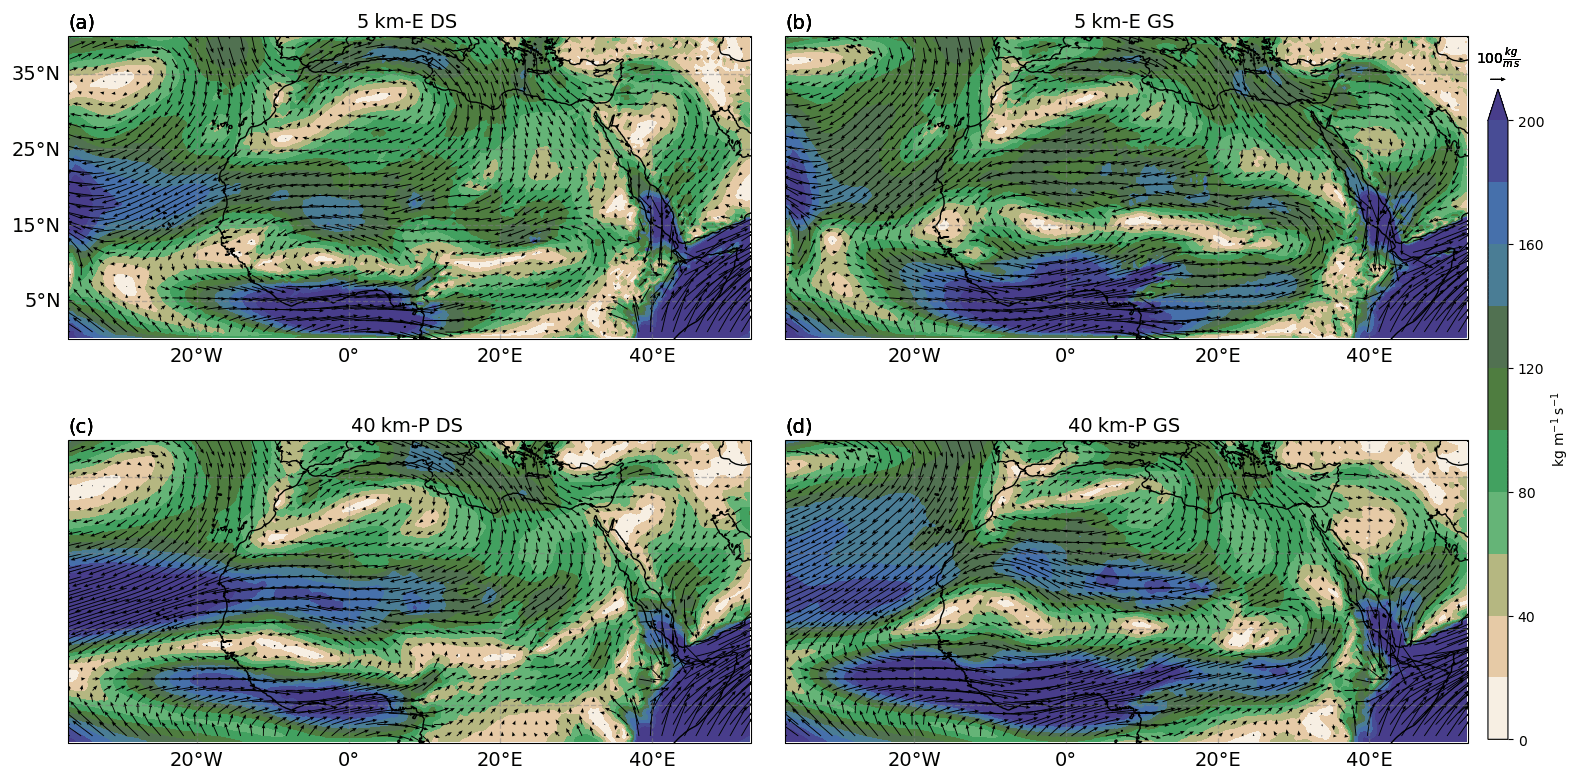
Figure A3JAS mean 1000 to 200 hPa vertically integrated moisture flux magnitude (shading) and vertically integrated moisture flux vectors (kg m−1 s−1) for the 5 km-E DS (a) and GS (b), as well as for the 40 km-P DS (c) and GS (d) simulation.
Table A1Conditions for the prescription of the new vegetation types for the Green Sahara simulations. We prescribe a new, idealized vegetation cover that reflects mid-Holocene conditions depending on (1) the region, (2) the value range of the simulated desert fraction from the MPI-ESM Holocene simulations (Dallmeyer et al., 2020), and (3) the present-day vegetation type set as a default value in the forecast model of the Deutsche Wetterdienst (German Meteorological Service). Which numbers correspond to which vegetation type can be obtained from the legend of Fig. 2.
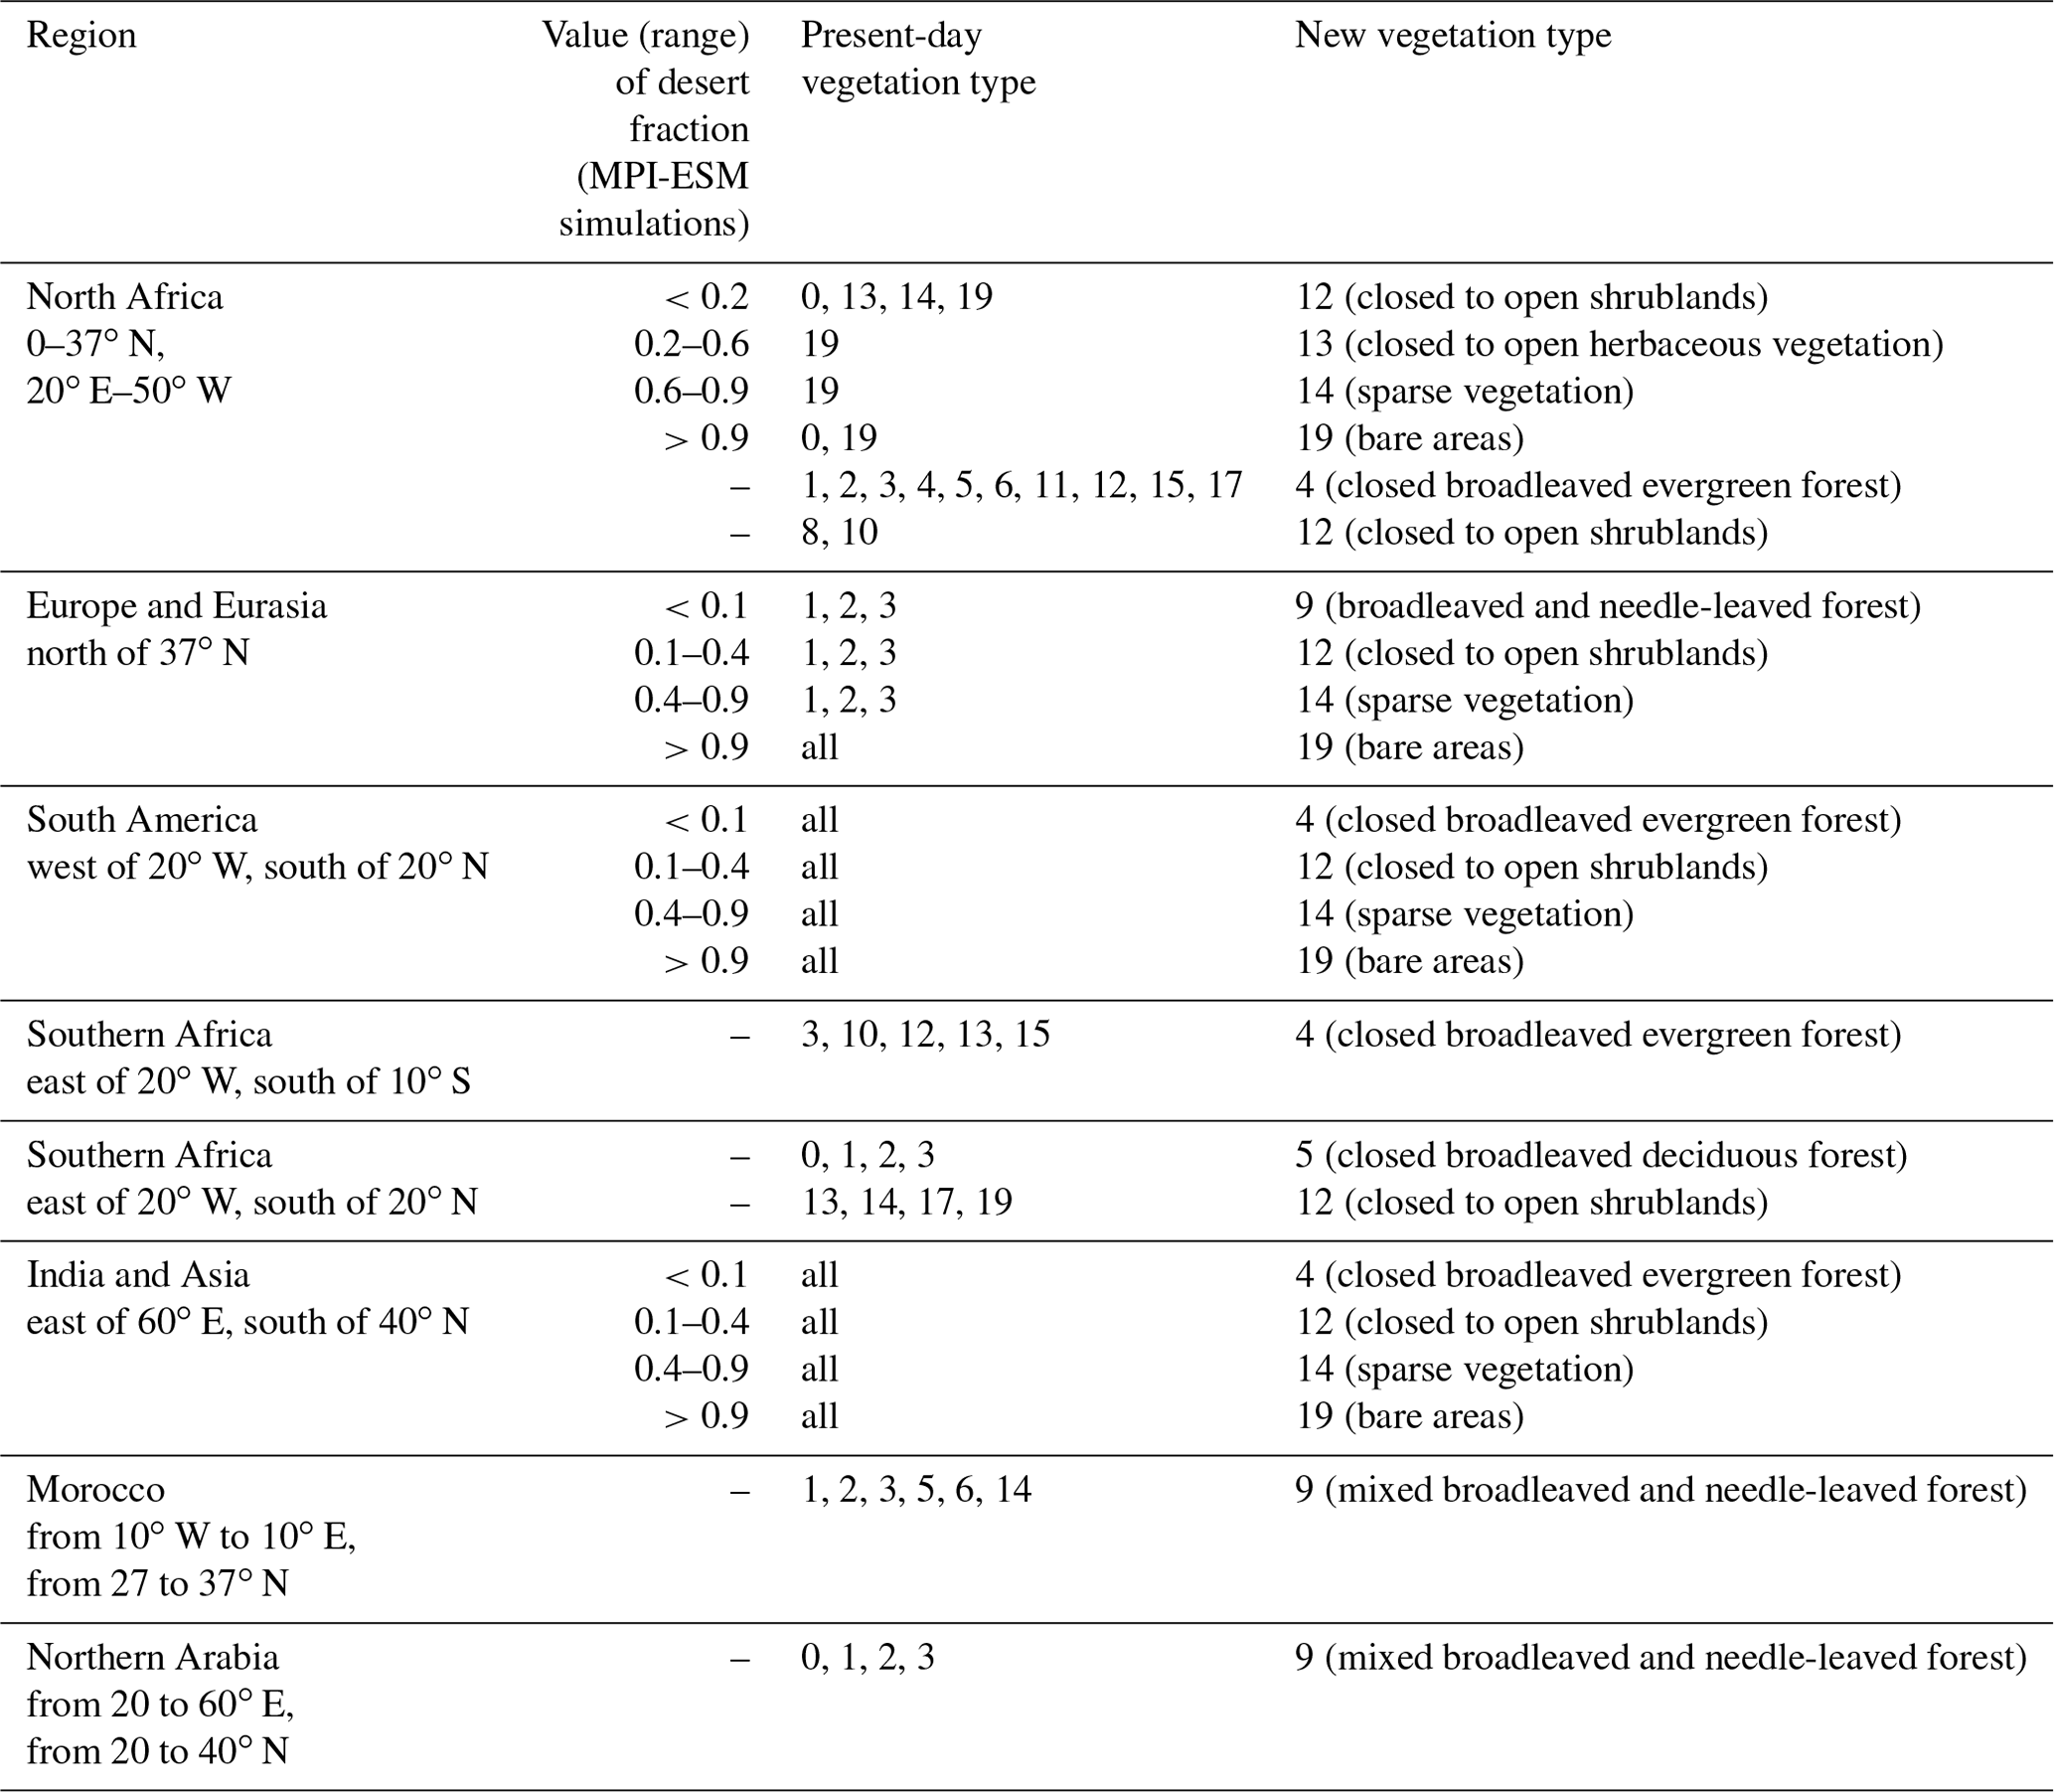
Table A2Values prescribed for each variable and each vegetation type in the GS simulations. The values were calculated based on all grid points where a vegetation type is dominant. Variable names in brackets refer to the variable names in the external parameter file used in the simulations.

Table A3The 12:00 UTC JAS mean values of CAPE and CIN along with JAS mean values of the level of free convection (LFC) and total cloud cover for the coastal, Sahel, and Sahara region (Fig. 1), for the 40 km-P DS, GS, and GS-cSM simulation, and for the 5 km-E DS, GS, and GS-cSM simulation.
We analyze the effect of the horizontal resolution on our findings and present the results for the 10 km parameterized (10 km-P) and explicitly resolved convection (10 km-E) simulations in the following. We show that the main mechanisms described for the 5 km-E and the 40 km-P simulations are also valid for the 10 km-E and 10 km-P simulations. The results between simulations with the same representation of convection are more similar to each other than simulations with the same horizontal resolution. However, the results show that differences between the 10 km-E and the 10 km-P simulations are not as strong as between the 5 km-E and the 40 km-P simulation. We do find the characteristic precipitation–runoff–soil moisture mechanism that limits the soil moisture–precipitation feedback in the 10 km-E DS and GS simulations, but the difference to the 10 km-P simulations coupling is not as strong. We argue that this is because, in the 10 km-P simulation, the grid spacing already partly allows for explicit calculations of precipitation compared to the 40 km-P simulations. Therefore, precipitation intensity and runoff are more similar in the 10 km-E and 10 km-P simulations than in the 5 km-E and the 40 km-P simulations.
B1 Changes in vegetation, latent heat flux, and temperature
Figure B1 shows dominantly similar responses of the surface variables in the 10 km-P and 10 km-E simulations as in the 40 km-P and 5 km-E simulations, respectively. The meridional vegetation gradient (see Fig. 4a) is identical to the one in the 5 km-E and the 40 km-P simulation because it is prescribed in the external parameters. The largest differences between the GS and DS simulations are simulated over the Sahel region, similarly to the results in the main paper. The increased vegetation cover yields higher water availability and, hence, leads to a decrease in sensible heat flux (Fig. B1a and b) and an increase in latent heat flux (Fig. B1c and d) over the Sahel. Over the Sahara region, the increase in sensible heat flux dominates the increase in the turbulent heat fluxes because water becomes too limited to support stronger latent heat flux. This increase is approximately equally strong in the 10 km-E and the 10 km-P simulations. We notice that differences in the turbulent heat fluxes between the 10 km-E and the 10 km-P simulations are less pronounced than between the 5 km-E and the 40 km-P simulations. The main difference is that the maximum increase in latent heat flux in the 10 km-P is located further north (at about 19∘ N) compared to the 10 km-E simulations (at about 17∘ N), with implications for temperature and moisture gradient over the continent.
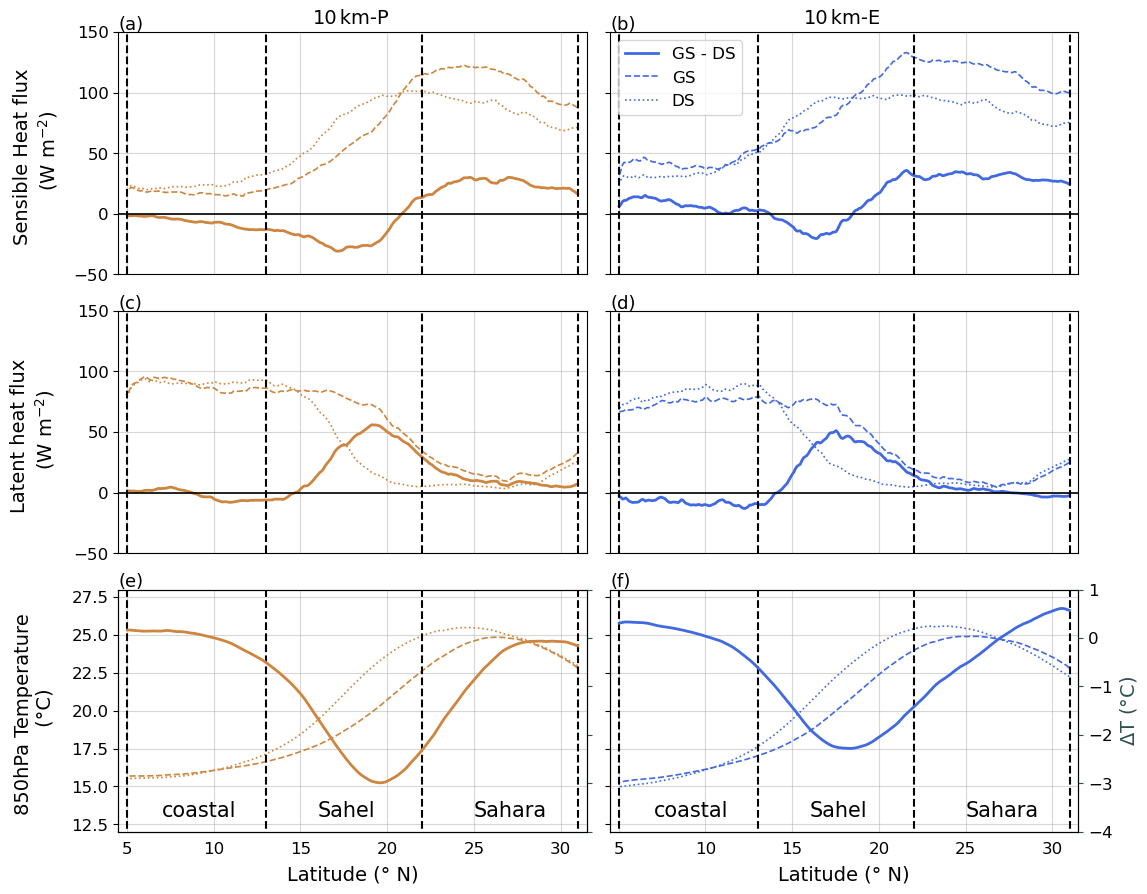
Figure B1JAS mean meridional distribution of sensible heat flux (a, b), latent heat flux (c, d), and 850 hPa temperature (e, f) for the Desert Sahara simulations (blue dotted lines), the Green Sahara simulations (blue dashed lines), and the difference between Green Sahara and Desert Sahara simulation (blue solid lines) for the 10 km-P (a, c, e) and the 10 km-E (b, d, f) simulation, respectively. The vertical dashed lines indicate the boarders of the coastal, the Sahel, and the Sahara region outlined in Fig. 1.
The temperature over the North African continent decreases and the location of the maximum temperature shifts northward (about 2∘) in both representations of convection. Changes in the meridional temperature distribution between the GS and DS simulations are noticeably stronger in the 10 km-P than in the 10 km-E simulations. The 10 km-P simulations display a stronger maximum decrease in temperature (about 3 ∘C) located at about 19∘ N (consistent with the location of the maximum increase in latent heat flux). In contrast, the maximum temperature decrease in the 10 km-E simulations is only 2 ∘C and located further south at about 17∘ N. As already shown in the main paper, this can have far-reaching consequences for the monsoon dynamics linked to the AEJ.
B2 Changes in atmospheric dynamics
The low-level southwesterly monsoon intensifies as a response to the increased vertical motion over the Sahel (due to increased energy at the surface and the increase in vertical motion between the jet axes). With the strengthened monsoon flow, more moisture is transported from the coastal region deep into the Sahel and Sahara region, contributing to the decrease in relative humidity (Fig. B4). Moreover, the ITF shifts further north, and thereby the associated region of dynamical uplifting caused by the convergence of the southwesterly monsoon winds and the northeasterly Harmattan winds shifts further north. Similar to the 40 km-P simulations, the southwesterly monsoon flow is stronger and the monsoon layer is deeper in the 10 km-P compared to the 10 km-E simulations. Therefore, the ITF is located further north and more cool, moist air is transported into the African continent to support the generation of convection and precipitation.
In response to the changes in the temperature gradient over North Africa, the AEJ (Fig. B2) strongly weakens in the GS simulations and shifts 3–4∘ northward in both representations of convection. With the shift in the AEJ, the region of upward motion between the axes of the TEJ and the AEJ broadens and shifts northward. Consequently, in both representations of convection, the vertical upward motion (Fig. B3) decreases over the coastal and southern Sahel region and intensifies over the rest of the Sahel region. Furthermore, the descending motion over the Sahara decreases in the GS compared to the DS simulations. The upward vertical motion is generally stronger in the 10 km-P than in the 10 km-E simulations (Fig. B3a–d). We can also find the generally stronger vertical upward motion in the 40 km-P compared to the 5 km-E simulation. We therefore suggest that the generally stronger vertical upward motion is a result of the convective parameterization scheme in our simulations. Further investigations of this feature would be necessary to confirm and explain this assumption.

Figure B2Vertical cross section of the wind field over the WA domain (Fig. 1). The shading displays the mean zonal wind, and the arrows display the mean meridional and vertical wind for the 10 km-P DS (a) and GS (c) as well as the 10 km-E DS (b) and GS (d) simulation, respectively. Note that the vertical wind speed is multiplied by 100 to make arrows more visible. The locations of the African easterly jet (AEJ) and the tropical easterly jet (TEJ) are indicated by the labels. The dashed vertical lines indicate the borders of the coastal, Sahel, and Sahara domain also displayed in Fig. 1.
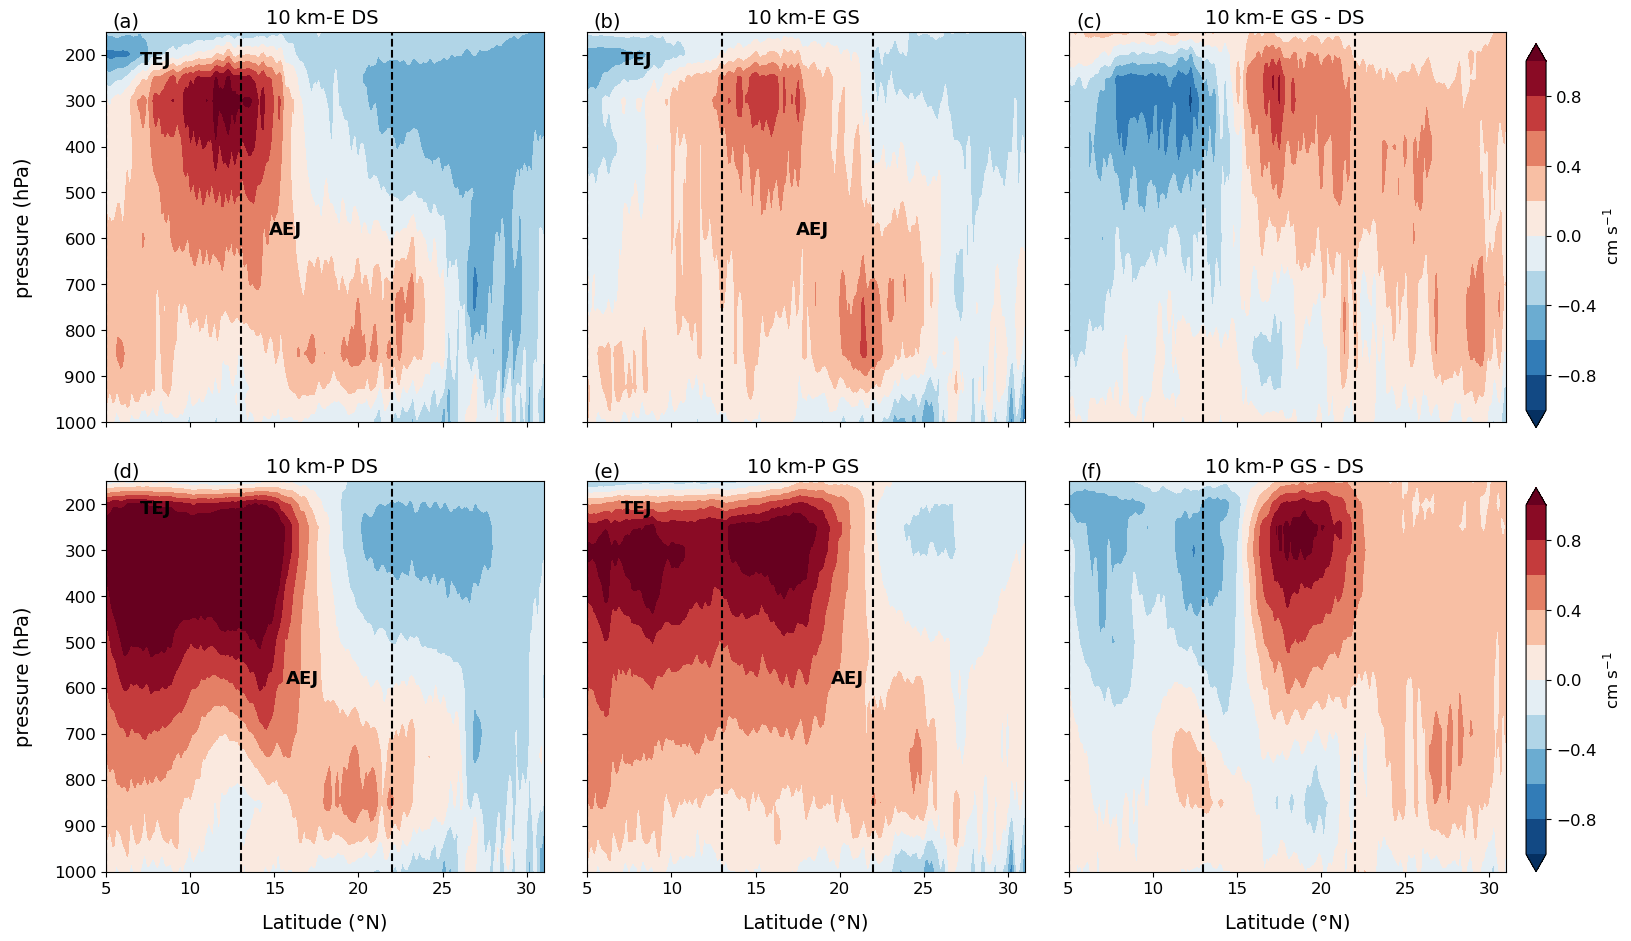
Figure B3Vertical cross section of the vertical wind component for the 10 km-E DS (a), GS (b), and the difference between the GS and DS (c) simulation; similarly for the 10 km-P DS (d), GS (e), and GS minus DS (f) simulation, respectively. We averaged over the WA domain outlined in Fig. 1. Again, the locations of the African easterly jet (AEJ) and the tropical easterly jet (TEJ) are indicated by the labels. The dashed vertical lines again indicate the latitudes of the coastal, Sahel, and Sahara domain also displayed in Fig. 1.
B2.1 Changes in atmospheric thermodynamics
Changes in relative humidity in the 10 km-P and the 10 km-E simulation are consistent with the changes in the 40 km-P and the 5 km-E simulation, respectively. Relative humidity reveals a strong increase over the Sahel and Sahara region, which is consistent with the changes in latent heat flux (Fig. B1c and d) and in the wind field (Fig. B2). Again, it is likely that stronger convection in the GS simulations positively feeds back on the atmospheric humidity.
Generally, the 10 km-P simulations show higher relative humidity values throughout the troposphere and over all latitudes (not shown). The increase in relative humidity over the Sahel–Sahara region between the GS and the DS simulation is more pronounced in the 10 km-P GS than in the 10 km-E GS simulation, while the decrease in relative humidity over the coastal region is stronger in the 10 km-E GS simulation.
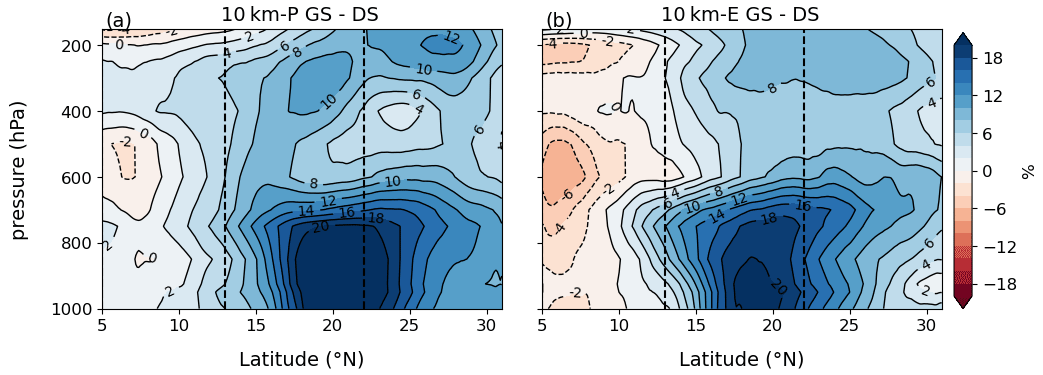
Figure B4JAS mean meridional vertical cross section of relative humidity for the difference between the GS and DS simulation for the 10 km-P (a) and the 10 km-E (b) simulations. The average is calculated over the WA domain, and the vertical dashed lines indicate the boarders of the coastal, the Sahel, and the Sahara region outlined in Fig. 1.
Table B1 reveals that the stability of the atmosphere becomes more supportive for convection and precipitation in the GS compared to the DS simulations in both representations of convection. Over the coastal region, conditions for convection and precipitation are very supportive, with high CAPE and cloud cover and low (weak negative) CIN and LFC values. We find that CAPE over the Sahel increases more strongly in the 10 km-E GS than in the 10 km-P GS simulation. Additionally, CIN values are less negative. However, the LFC is lower and cloud cover higher in the 10 km-P than in the 10 km-E simulations.
Table B1JAS mean values of 12:00 UTC CAPE along with CIN and JAS mean level of free convection (LFC) as well as total cloud cover for the coastal, Sahel, and Sahara region (Fig. 1) for the 10 km-E and the 10 km-P DS and GS simulation, respectively.
Conditions for convection and precipitation are overall more supportive in the 10 km-P simulations. However, differences in CAPE between the 10 km-P GS and the 10 km-E GS simulation are smaller or even reversed compared to the results between the 40 km-P GS and the 5 km-E GS simulation.
B3 Changes in precipitation
In agreement with the results of the main paper (Sect. 3.1.4), precipitation in the GS simulations decreases over the coastal region and strongly increases over the Sahel region (Figs. B5 and B6). This shift of the main precipitation band is consistent with the changes in the thermodynamic gradient over North Africa. The latter is characterized by a decrease in latent heat flux (Fig. B1c and d), relative humidity (Fig. B4), and vertical upward motion (Fig. B3) over the coastal region; in contrast, the strongest increase in these variables is over the Sahel region. The change in the thermodynamic gradient modifies the atmospheric dynamic: the AEJ weakens and shifts northward. Consistent with previous studies (Grist and Nicholson, 2001; Nicholson and Grist, 2001), this enhances the conditions for convection and precipitation over the Sahel and Sahara region. Similar to the precipitation response in the main paper, the 10 km-P simulations simulate a stronger increase in precipitation over the Sahel and Sahara region and a weaker decrease over the coastal region compared to the 10 km-E simulations.
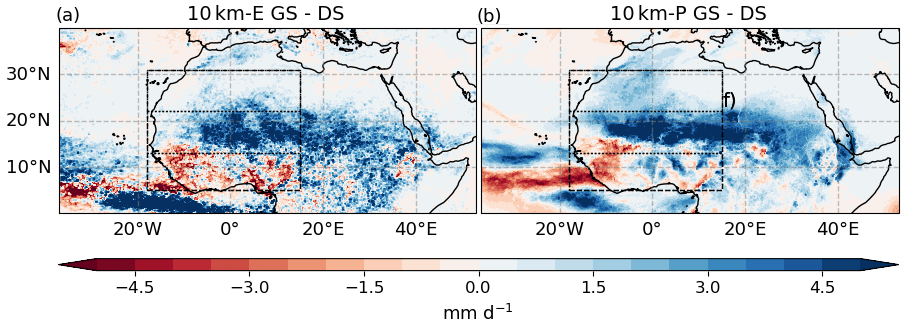
Figure B5JAS mean difference in precipitation rate between the GS and DS simulation for the 10 km-E (a) and the 10 km-P (b) experiment, respectively. The dashed box indicates the WA analysis domain.
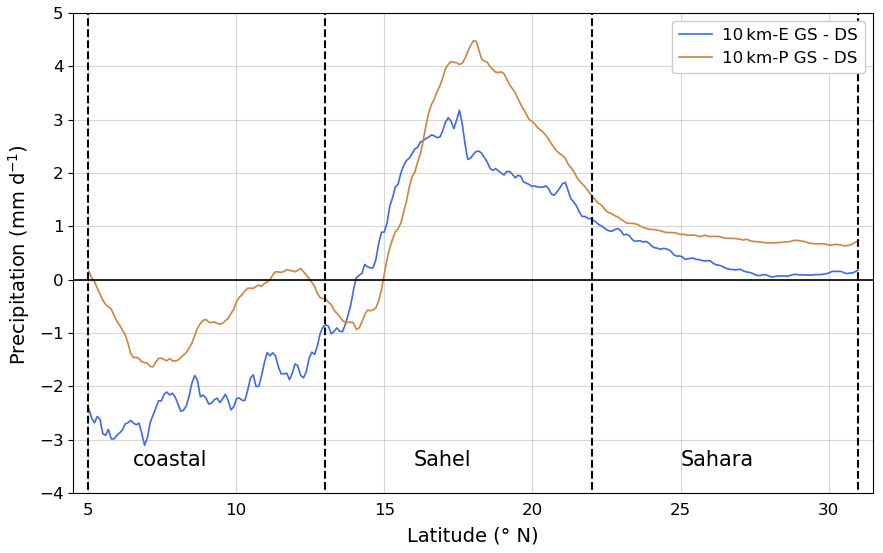
Figure B6Difference of the JAS mean meridional precipitation distribution between the GS and DS simulation for the 10 km-E simulations (blue line) and the 10 km-P simulation (orange line), respectively. The vertical black dashed lines indicate the borders of the coastal, the Sahel, and the Sahara region outlined in Fig. 1.
Consistent with the findings in the main paper, both representations of convection simulate a positive land–atmosphere coupling in response to the increase in vegetation cover over the Sahel and Sahara region, while a negative feedback evolves over the coastal region. This land–atmosphere coupling is stronger in the 10 km-P simulations compared to the 10 km-E simulations. However, differences tend to be smaller (e.g., in latent heat flux and thermodynamics).
B4 The soil moisture–runoff–precipitation mechanism
We can find a more pronounced response of the atmosphere to changes in the vegetation cover in the 10 km-P than in the 10 km-E simulations. As already examined in the main paper, this weaker land–atmosphere coupling is strongly determined by the soil moisture–runoff–precipitation mechanism that dampens the potential precipitation response to changes in the land surface in explicitly resolved convection simulations.
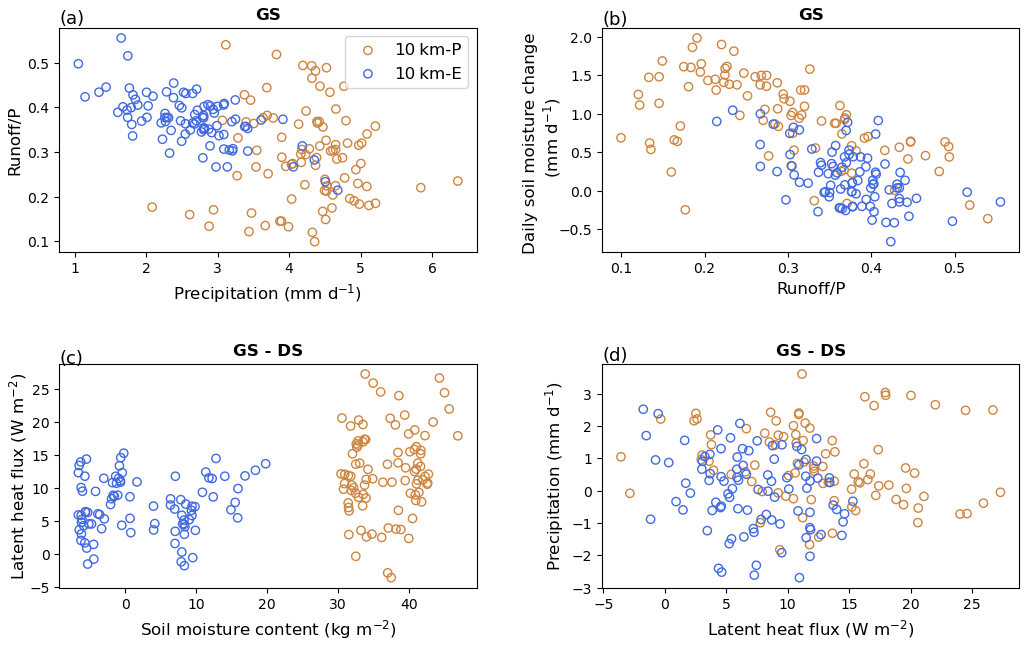
Figure B7Relationship between different variables in the GS simulation (a, b) and the difference between the GS and the DS simulation (c, d) for the 10 km-E simulations (blue circles) and the 10 km-P simulations (orange circles). Each circle indicates 1 d of the JAS season averaged over the WA domain outlined in Fig. 1. The panels show the following relationships: (a) the ratio between runoff and precipitation rate as a function of precipitation rate, (b) the daily change in soil moisture (within the six uppermost soil layers reaching up to a depth of 3.42 m) as a function of the runoff–precipitation ratio, (c) the difference in latent heat flux as a function of the difference in total soil moisture content (again within the six uppermost soil layers reaching up to a depth of 3.42 m), and (d) the difference in the precipitation rate as a function of the difference of latent heat flux.
Figure B7a displays higher amounts of runoff relative to the amount of precipitation in the 10 km-E than in the 10 km-P simulations. In both the 10 km-E DS (not shown) and GS simulation 36 % of precipitation leaves the system as runoff. In comparison, in the 10 km-P DS (not shown) and GS simulation only 23 % and 29 % of precipitation are lost into runoff.
Due to the overall higher loss of precipitation water into runoff, the daily change in soil moisture content (in the uppermost six soil layers up to a depth of 3.42 m) is smaller in the 10 km-E than in the 10 km-P simulations (Fig. B7b). Hence, soil moisture is generally noticeably lower in the 10 km-E compared to the 10 km-P simulations (especially over the coastal and Sahel region) (not shown). Moreover, the changes in soil moisture between the GS and DS simulation are much smaller in the 10 km-E than in the 10 km-P simulations, resulting in smaller mean evapotranspiration rates (Fig. B7c). This feature is identical to the results of the main paper. However, Fig. B7d indicates that the reason for the weaker precipitation response in the 10 km-E simulations is not because the coupling of precipitation to a given change in evapotranspiration is weaker. It is rather the dampened evapotranspiration due to a missing refilling of soil moisture that leads to smaller precipitation rates. Additionally, we argue that the weaker dynamic feedback contributes to smaller precipitation rates in the 10 km-E simulations compared to the 10 km-P simulations. Based on these results, we argue that the precipitation–runoff–soil moisture mechanism also exists in the 10 km-E simulations.
B5 The influence of runoff-controlled soil moisture
We now analyze the differences between the 10 km GS and GS-cSM simulations to investigate to what extent the runoff hampers the potential precipitation response to changing surface conditions.

Figure B8Difference of the JAS mean soil moisture content in the six uppermost soil layers between the GS-cSM and the GS simulation for the 10 km-E (a) and the 10 km-P (b) simulations. The dashed black box indicates the WA analysis domain.
Similar to the results in the main paper, soil moisture content (Fig. B8) shows a strong increase over the whole WA domain in the 10 km-E GS-cSM simulation (compared to the GS simulation), while changes between the 10 km-P GS-cSM and GS simulation are much smaller (or even show a decrease in soil moisture).
The resulting increase in latent heat flux in the 10 km-E GS-cSM simulation is noticeably higher, with a maximum increase of 40 W m−2 over the northern Sahel, compared to the 10 km-P GS-cSM simulation (Fig. B9a). This increase in latent heat flux modulates the increase in relative humidity (not shown) and promotes the increase in atmospheric thermodynamic conditions (Table B2) for convection and precipitation in the 10 km-E GS-cSM simulations. Changes in CAPE, CIN, LFC height, and cloud cover between the GS-cSM and the GS simulations are stronger in the 10 km-E than in the 10 km-P simulations and further support the increase in precipitation in the 10 km-E GS-cSM simulation. In the 10 km-P GS-cSM simulation, CAPE decreases slightly over the Sahel region, but CIN values, LFC height, and cloud cover support the still higher precipitation rates in the 10 km-P GS-cSM compared to the 10 km-E GS-cSM simulations. Differences in the thermodynamics of the atmosphere between the 10 km-P and the 10 km-E simulations are weaker than between the 40 km-P and the 5 km-E simulations. Nevertheless, they reflect a noticeable influence of soil moisture on the atmosphere.

Figure B9Difference of the JAS mean meridional distributions of latent heat flux (a), 850 hPa temperature (b), and precipitation (c) between the GS-cSM and the GS simulations (solid lines) as well as for the GS-cSM simulation (dashed lines in panel c), the 10 km-E (blue lines), and the 10 km-P (orange lines), respectively. The vertical black dashed lines indicate the boarders of the coastal, the Sahel, and the Sahara region outlined in Fig. 1.
Table B212:00 UTC JAS mean values of CAPE, CIN and JAS mean values of the level of free convection (LFC), and total cloud cover for the coastal, Sahel, and Sahara region (Fig. 1) as well as for the 10 km-P DS, GS, and GS-cSM simulation and for the 10 km-E DS, GS, and GS-cSM simulation.
As described in the main paper, the changes in soil moisture and latent heat flux affect the temperature over North Africa (Fig. B9b). The decrease in temperature is stronger in the 10 km-E GS-cSM than in the 10 km-P GS-cSM simulations, with the strongest decrease over the northern Sahel region. This much stronger decrease in temperature over the Sahel than over the coastal region modulates the temperature gradient over the continent and influences the atmospheric monsoon dynamics. As a result of the weakened temperature gradient south of about 20∘ N, the AEJ (not shown) again shifts almost 2∘ further north in the 10 km-E GS-cSM simulation, while in the 10 km-P GS-cSM simulation it remains at about the same latitude as in the GS simulation. The AEJ strength (not shown) does not change substantially between the GS-cSM and the GS simulation in either the 10 km-E (about 8.3 and 8.2 m s−1, respectively) or 10 km-P simulations (about 7.9 and 8.3 m s−1, respectively).
In the 10 km-E GS-cSM simulation, the northward shift of the AEJ core leads to a weaker vertical upward motion in the lower and middle troposphere between about 18 and 23∘ N (Fig. B10c). However, air masses are still lifted in this region (Fig. B10a), and the increasing vertical upward motion in the upper troposphere (Fig. B10c, above ∼500 hPa) indicates that air masses can be lifted further up. Hence, air masses can reach the freezing level more easily, which makes the generation of precipitation more effective. This is consistent with the maximum increase in precipitation (Fig. B9c) in this region. Over the Sahara region vertical upward motion increases in the lower atmosphere layers and the descending motion in the upper troposphere decreases. However, only in the southern Sahara does the availability of enough moisture allow for the formation of some precipitation.
In the 10 km-P GS-cSM simulation, vertical upward motion increases noticeably from 20–31∘ N, especially in the upper troposphere, and strongly decreases in the middle and upper troposphere between 13 and 20∘ N (Fig. B10d). This increase in vertical upward motion over the northern Sahel and Sahara region supports the strong increase in precipitation between 20 and 25∘ N (Fig. B9c). Generally, vertical upward motion remains substantially stronger in the 10 km-P GS-cSM simulations over the whole WA domain (Fig. B10a and b) as already found in the DS and GS simulations (Fig. B3) and in the main paper (Fig. 13).
Precipitation (Fig. B9c) increases especially over the Sahel region in the 10 km-E GS-cSM simulation, while in the 10 km-P GS-cSM simulation, precipitation displays a strong decrease between 14 and 20∘ N, consistent with the strong decrease in vertical upward motion (Fig. B10d). However, over the northern Sahel (north of 20∘ N) and the southern Sahara region (up to about 25∘ N), precipitation shows an equally strong or stronger increase in precipitation in the 10 km-P compared to the 10 km-E simulations, despite only very weak changes in soil moisture and latent heat flux. Hence, in contrast to the results in the main paper, monsoonal rainfall in the GS-cSM simulations extends slightly further north in the 10 km-P than in the 10 km-E simulations.
In summary, the 10 km-P and 10 km-E simulations also show a positive land–atmosphere feedback over the Sahel–Sahara region and a negative feedback over the coastal region. The differences between the 10 km-E and 10 km-P simulations are slightly weaker than between the 5 km-E and the 40 km-P simulations, but the principal mechanisms remain the same. The comparison between the GS and the GS-cSM simulations reveals a considerable influence of the runoff (i.e., of soil moisture) on the atmospheric state and hence on monsoonal precipitation in our simulations.
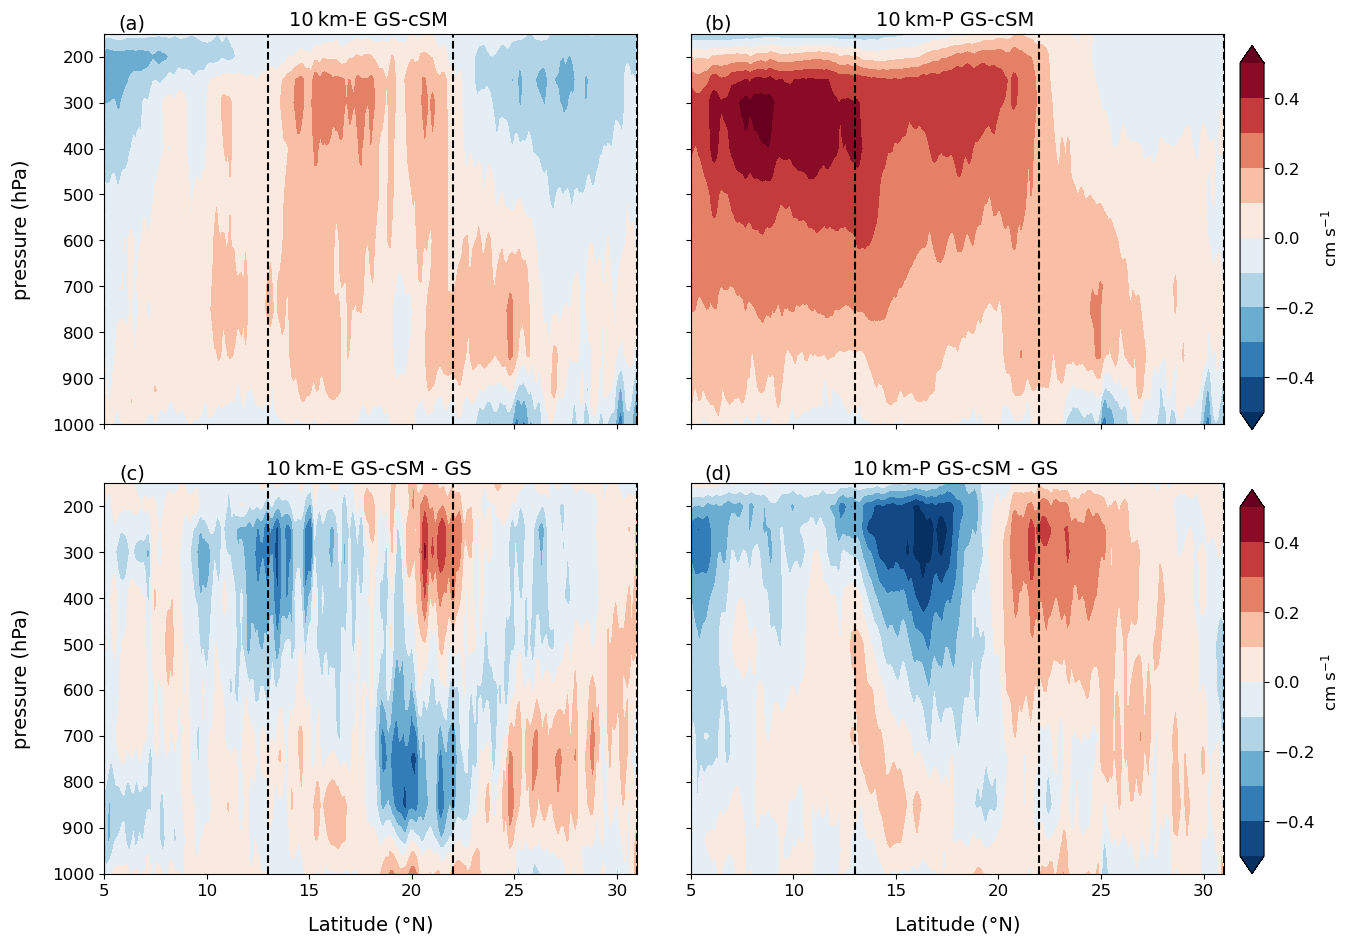
Figure B10Vertical cross section of the vertical wind component for the GS-cSM and for the difference between the GS-cSM and GS simulation for the 10 km-E (a, c) and the 10 km-P (b, d), respectively, averaged over the WA domain outlined in Fig. 1. The dashed vertical lines again indicate the latitudes of the coastal, Sahel, and Sahara domain also displayed in Fig. 1.
The scripts used in the analysis and other supplementary information that may be useful in reproducing the authors' work can be obtained from MPG.PuRe (http://hdl.handle.net/21.11116/0000-000A-E8FB-6; Jungandreas, 2023a).
Daily mean model output from the simulations to reproduce the results from the main paper can be downloaded from DKRZ LTA DOCU (https://doi.org/10.26050/WDCC/ICON-NWP_mH_pd; Jungandreas, 2023b).
LJ, CH, and MC designed the research project and the experiments together. LJ performed the simulations and analysis. CH and MC gave input, ideas, and feedback to the analysis of the simulations. LJ prepared the paper with contributions from all co-authors.
The contact author has declared that none of the authors has any competing interests.
Publisher's note: Copernicus Publications remains neutral with regard to jurisdictional claims in published maps and institutional affiliations.
We thank Anne Dallmeyer for valuable discussions and comments as well as for providing an internal review. We appreciate the valuable and constructive reviews by the three anonymous referees. This research was supported by the International Max Planck Research School on Earth System Modelling (IMPRS-ESM), Hamburg. The model simulations were performed at the Deutsche Klimarechenzentrum (DKRZ), which we acknowledge for providing technical support.
The article processing charges for this open-access publication were covered by the Max Planck Society.
This paper was edited by Qiuzhen Yin and reviewed by three anonymous referees.
Bartlein, P. J., Harrison, S., Brewer, S., Connor, S., Davis, B., Gajewski, K., Guiot, J., Harrison-Prentice, T., Henderson, A., Peyron, O., Prentice, I. C., Scholze, M., Seppä, H., Shuman, B., Sugita, S., Thompson, R. S., Viau, A. E., Williams, J., and Wu, H.: Pollen-based continental climate reconstructions at 6 and 21 ka: a global synthesis, Clim. Dynam., 37, 775–802, https://doi.org/10.1007/s00382-010-0904-1, 2011. a
Bechtold, P., Semane, N., Lopez, P., Chaboureau, J.-P., Beljaars, A., and Bormann, N.: Representing equilibrium and nonequilibrium convection in large-scale models, J. Atmos. Sci., 71, 734–753, https://doi.org/10.1175/JAS-D-13-0163.1, 2014. a
Braconnot, P., Joussaume, S., Marti, O., and De Noblet, N.: Synergistic feedbacks from ocean and vegetation on the African monsoon response to mid-Holocene insolation, Geophys. Res. Lett., 26, 2481–2484, https://doi.org/10.1029/1999GL006047, 1999. a
Braconnot, P., Joussaume, S., De Noblet, N., and Ramstein, G.: Mid-Holocene and last glacial maximum African monsoon changes as simulated within the paleoclimate modelling intercomparison project, Global Planet. Change, 26, 51–66, https://doi.org/10.1016/S0921-8181(00)00033-3, 2000. a
Braconnot, P., Harrison, S. P., Kageyama, M., Bartlein, P. J., Masson-Delmotte, V., Abe-Ouchi, A., Otto-Bliesner, B., and Zhao, Y.: Evaluation of climate models using palaeoclimatic data, Nat. Clim. Change, 2, 417–424, https://doi.org/10.1038/nclimate1456, 2012. a, b
Brierley, C. M., Zhao, A., Harrison, S. P., Braconnot, P., Williams, C. J. R., Thornalley, D. J. R., Shi, X., Peterschmitt, J.-Y., Ohgaito, R., Kaufman, D. S., Kageyama, M., Hargreaves, J. C., Erb, M. P., Emile-Geay, J., D'Agostino, R., Chandan, D., Carré, M., Bartlein, P. J., Zheng, W., Zhang, Z., Zhang, Q., Yang, H., Volodin, E. M., Tomas, R. A., Routson, C., Peltier, W. R., Otto-Bliesner, B., Morozova, P. A., McKay, N. P., Lohmann, G., Legrande, A. N., Guo, C., Cao, J., Brady, E., Annan, J. D., and Abe-Ouchi, A.: Large-scale features and evaluation of the PMIP4-CMIP6 midHolocene simulations, Clim. Past, 16, 1847–1872, https://doi.org/10.5194/cp-16-1847-2020, 2020. a
Broström, A., Coe, M., Harrison, S. P., Gallimore, R., Kutzbach, J., Foley, J., Prentice, I., and Behling, P.: Land surface feedbacks and palaeomonsoons in northern Africa, Geophys. Res. Lett., 25, 3615–3618, https://doi.org/10.1029/98GL02804, 1998. a
Claussen, M. and Gayler, V.: The greening of the Sahara during the mid-Holocene: results of an interactive atmosphere-biome model, Global Ecol. Biogeogr. Lett., 6, 369–377, https://doi.org/10.2307/2997337, 1997. a, b, c
Claussen, M., Dallmeyer, A., and Bader, J.: Theory and modeling of the African humid period and the green Sahara, in: Oxford Research Encyclopedia of Climate Science, https://doi.org/10.1093/acrefore/9780190228620.013.532, 2017. a
Cook, K. H.: Generation of the African easterly jet and its role in determining West African precipitation, J. climate, 12, 1165–1184, https://doi.org/10.1175/1520-0442(1999)012<1165:GOTAEJ>2.0.CO;2, 1999. a, b, c, d, e, f, g
Dallmeyer, A., Claussen, M., Lorenz, S., and Shanahan, T.: The end of the African humid period as seen by transient comprehensive Earth system model simulation of the last 8000 years, Clim. Past, 16, 117–120, https://doi.org/10.5194/cp-16-117-2020, 2020. a, b, c, d
Dirmeyer, P. A., Cash, B. A., Kinter, J. L., Jung, T., Marx, L., Satoh, M., Stan, C., Tomita, H., Towers, P., Wedi, N., Achuthavarier, D., Adams, J. M., Altshuler, E. L., Huang, B., Jin, E. K., and Manganello, J.: Simulating the diurnal cycle of rainfall in global climate models: Resolution versus parameterization, Clim. Dynam., 39, 399–418, https://doi.org/10.1007/s00382-011-1127-9, 2012. a
Doherty, R., Kutzbach, J., Foley, J., and Pollard, D.: Fully coupled climate/dynamical vegetation model simulations over Northern Africa during the mid-Holocene, Clima. Dynam., 16, 561–573, https://doi.org/10.1007/s003820000065, 2000. a, b
Fiedler, S., Crueger, T., D'Agostino, R., Peters, K., Becker, T., Leutwyler, D., Paccini, L., Burdanowitz, J., Buehler, S. A., Cortes, A. U., Dauhut, T., Dommenget, D., Fraedrich, K., Jungandreas, L., Maher, N., Naumann, A. K., Rugenstein, M., Sakradzija, M., Schmidt, H., Sielmann, F., Stephan, C., Timmreck, C., Zhu, X., and Stevensm, B.: Simulated tropical precipitation assessed across three major phases of the coupled model intercomparison project (CMIP), Mon. Weather Rev., 148, 3653–3680, https://doi.org/10.1175/MWR-D-19-0404.1, 2020. a
Gaetani, M., Messori, G., Zhang, Q., Flamant, C., and Pausata, F. S.: Understanding the mechanisms behind the northward extension of the West African Monsoon during the Mid-Holocene, J. Climate, 30, 7621–7642, https://doi.org/10.1175/JCLI-D-16-0299.1, 2017. a
Grist, J. P. and Nicholson, S. E.: A study of the dynamic factors influencing the rainfall variability in the West African Sahel, J. Climate, 14, 1337–1359, https://doi.org/10.1175/1520-0442(2001)014<1337:ASOTDF>2.0.CO;2, 2001. a, b, c, d, e, f
Harrison, S. P., Bartlein, P., Izumi, K., Li, G., Annan, J., Hargreaves, J., Braconnot, P., and Kageyama, M.: Evaluation of CMIP5 palaeo-simulations to improve climate projections, Nat. Clim. Change, 5, 735–743, https://doi.org/10.1038/nclimate2649, 2015. a
Hohenegger, C., Brockhaus, P., Bretherton, C. S., and Schär, C.: The soil moisture–precipitation feedback in simulations with explicit and parameterized convection, J. Climate, 22, 5003–5020, https://doi.org/10.1175/2009JCLI2604.1, 2009. a
Hohenegger, C., Kornblueh, L., Klocke, D., Becker, T., Cioni, G., Engels, J. F., Schulzweida, U., and Stevens, B.: Climate statistics in global simulations of the atmosphere, from 80 to 2.5 km grid spacing, J. Meteorol. Soc. Jpn. Ser. II, 98, 73–91, https://doi.org/10.2151/jmsj.2020-005, 2020. a
Jolly, D., Prentice, I. C., Bonnefille, R., Ballouche, A., Bengo, M., Brenac, P., Buchet, G., Burney, D., Cazet, J.-P., Cheddadi, R., Edorh, T., Elenga, H., Elmoutaki, S., Guiot, J., Laarif, F., Lamb, H., Lezine, A.-M., Maley, J., Mbenza, M., Peyron, O., Reille, M., Reynaud-Farrera, I., Riollet, G., Ritchie, J. C., Roche, E., Scott, L., Ssemmanda, I., Straka, H., Umer, M., Van Campo, E., Vilimumbalo, S., Vincens, A., and Waller, M.: Biome reconstruction from pollen and plant macrofossil data for Africa and the Arabian peninsula at 0 and 6000 years, J. Biogeogr., 25, 1007–1027, https://doi.org/10.1046/j.1365-2699.1998.00238.x, 1998. a
Joussaume, S., Taylor, K., Braconnot, P., Mitchell, J., Kutzbach, J., Harrison, S., Prentice, I., Broccoli, A., Abe-Ouchi, A., Bartlein, P. J., Bonfils, C.., Dong, B., Guiot, J., Herterich, K., Hewitt, C. D., Jolly, D., Kim, J. W., Kislov, A., Kitoh, A., Loutre, M. F., Masson, V., McAvaney, B., McFarlane, N., de Noblet, N., Peltier, W. R., Peterschmitt, J. Y., Pollard, D., Rind, D., Royer, J. F., Schlesinger, M. E., Syktus, J., Thompson, S., Valdes, P., Vettoretti, G., Webb, R. S., and Wyputta, U.: Monsoon changes for 6000 years ago: results of 18 simulations from the Paleoclimate Modeling Intercomparison Project (PMIP), Geophys. Res. Lett., 26, 859–862, https://doi.org/10.1029/1999GL900126, 1999. a, b
Jungandreas, L.: Scripts and supplementary informations, MPG.PuR [code], http://hdl.handle.net/21.11116/0000-000A-E8FB-6 (last access: 20 March 2023), 2023a. a
Jungandreas, L.: Data, DKRZ LTA DOCU [data set], https://doi.org/10.26050/WDCC/ICON-NWP_mH_pd, 2023b. a
Jungandreas, L., Hohenegger, C., and Claussen, M.: Influence of the representation of convection on the mid-Holocene West African Monsoon, Clim. Past, 17, 1665–1684, https://doi.org/10.5194/cp-17-1665-2021, 2021. a, b, c, d, e, f, g, h, i, j, k, l
Kendon, E., Prein, A., Senior, C., and Stirling, A.: Challenges and outlook for convection-permitting climate modelling, Philos. T. Roy. Soc. A, 379, 20190547, https://doi.org/10.1098/rsta.2019.0547, 2021. a
Krinner, G., Lézine, A. M., Braconnot, P., Sepulchre, P., Ramstein, G., Grenier, C., and Gouttevin, I.: A reassessment of lake and wetland feedbacks on the North African Holocene climate, Geophys. Res. Lett., 39, L07701, https://doi.org/10.1029/2012GL050992, 2012. a
Kutzbach, J. and Otto-Bliesner, B.: The sensitivity of the African-Asian monsoonal climate to orbital parameter changes for 9000 years BP in a low-resolution general circulation model, J. Atmos. Sci., 39, 1177–1188, https://doi.org/10.1175/1520-0469(1982)039<1177:TSOTAA>2.0.CO;2, 1982. a
Kutzbach, J., Bonan, G., Foley, J., and Harrison, S.: Vegetation and soil feedbacks on the response of the African monsoon to orbital forcing in the early to middle Holocene, Nature, 384, 623–626, https://doi.org/10.1038/384623a0, 1996. a
Kutzbach, J. E. and Guetter, P. J.: The influence of changing orbital parameters and surface boundary conditions on climate simulations for the past 18 000 years, J. Atmos. Sci., 43, 1726–1759, https://doi.org/10.1175/1520-0469(1986)043<1726:TIOCOP>2.0.CO;2, 1986. a
Kutzbach, J. E. and Liu, Z.: Response of the African monsoon to orbital forcing and ocean feedbacks in the middle Holocene, Science, 278, 440–443, https://doi.org/10.1126/science.278.5337.440, 1997. a, b, c
Levis, S., Bonan, G. B., and Bonfils, C.: Soil feedback drives the mid-Holocene North African monsoon northward in fully coupled CCSM2 simulations with a dynamic vegetation model, Clim. Dynam., 23, 791–802, https://doi.org/10.1007/s00382-004-0477-y, 2004. a
Nicholson, S. E.: A revised picture of the structure of the “monsoon” and land ITCZ over West Africa, Clim. Dynam., 32, 1155–1171, https://doi.org/10.1007/s00382-008-0514-3, 2009. a
Nicholson, S. E. and Grist, J.: A conceptual model for understanding rainfall variability in the West African Sahel on interannual and interdecadal timescales, Int. J. Climatol., 21, 1733–1757, https://doi.org/10.1002/joc.648, 2001. a, b, c, d, e, f
Patricola, C. M. and Cook, K. H.: Dynamics of the West African monsoon under mid-Holocene precessional forcing: Regional climate model simulations, J. Climate, 20, 694–716, https://doi.org/10.1175/JCLI4013.1, 2007. a
Peyron, O., Jolly, D., Braconnot, P., Bonnefille, R., Guiot, J., Wirrmann, D., and Chalié, F.: Quantitative reconstructions of annual rainfall in Africa 6000 years ago: Model-data comparison, J. Geophys. Res.-Atmos., 111, D24, https://doi.org/10.1029/2006JD007396, 2006. a
Rachmayani, R., Prange, M., and Schulz, M.: North African vegetation–precipitation feedback in early and mid-Holocene climate simulations with CCSM3-DGVM, Clim. Past, 11, 175–185, https://doi.org/10.5194/cp-11-175-2015, 2015. a
Randall, D., Khairoutdinov, M., Arakawa, A., and Grabowski, W.: Breaking the cloud parameterization deadlock, B. Am. Meteorol. Soc. 84, 1547–1564, https://doi.org/10.1175/BAMS-84-11-1547, 2003. a
Ripley, E., Charney, J., Stone, P. H., and Quirk, W. J.: Drought in the Sahara: Insufficient biogeophysical feedback?, Science, 191, 100–102, https://doi.org/10.1126/science.191.4222.100, 1976. a
Schär, C., Lüthi, D., Beyerle, U., and Heise, E.: The soil–precipitation feedback: A process study with a regional climate model, J. Climate, 12, 722–741, https://doi.org/10.1175/1520-0442(1999)012<0722:TSPFAP>2.0.CO;2, 1999. a, b
Stephens, G. L., L'Ecuyer, T., Forbes, R., Gettelmen, A., Golaz, J.-C., Bodas-Salcedo, A., Suzuki, K., Gabriel, P., and Haynes, J.: Dreary state of precipitation in global models, J. Geophys. Res.-Atmos., 115, D24211, https://doi.org/10.1029/2010JD014532, 2010. a
Stevens, B., Acquistapace, C., Hansen, A., Heinze, R., Klinger, C., Klocke, D., Rybka, H., Schubotz, W., Windmiller, J., Adamidis, P., Arka, I., Barlakas, V., Bierkamp, J., Brueck, M., Brune, S., Buehler, S. A., Burkhardt, U., Cioni, G., Costa-Surós, M., Crewell, S., Crueger, T., Deneke, H., Friedrichs, P., Henken, C. C., Hohenegger, C., Jacob, M., Jakub, F., Kalthoff, N., Koehler, M., van Laar, T. W., Li, P., Loehnert, U., Macke, A., Madenach, N., Mayer, B., Nam, C., Naumann, A. K., Peters, K., Poll, S., Quaas, J., Röber, N., Rochetin, N., Scheck, L., Schemann, V., Schnitt, S., Seifert, A., Senf, F., Shapkalijevski, M., Simmer, C., Singh, S., Sourdeval, O., Spickermann, D., Strandgren, J., Tessiot, O., Vercauteren, N., Vial, J., Voigt, A., and Zaengl, G.: The added value of large-eddy and storm-resolving models for simulating clouds and precipitation, J. Meteorol. Soc. Jpn. Ser. II, 98, 395–435, https://doi.org/10.2151/jmsj.2020-021, 2020. a
Street-Perrott, F., Mitchell, J., Marchand, D., and Brunner, J.: Milankovitch and albedo forcing of the tropical monsoons: a comparison of geological evidence and numerical simulations for 9000 yBP, Earth Environ. Sci. Trans. Roy. Soc. Edinburgh, 81, 407–427, https://doi.org/10.1017/S0263593300020897, 1990. a
Texier, D., De Noblet, N., Harrison, S., Haxeltine, A., Jolly, D., Joussaume, S., Laarif, F., Prentice, I., and Tarasov, P.: Quantifying the role of biosphere-atmosphere feedbacks in climate change: coupled model simulations for 6000 years BP and comparison with palaeodata for northern Eurasia and northern Africa, Clim. Dynam., 13, 865–881, https://doi.org/10.1007/s003820050202, 1997. a
Thorncroft, C. D., Nguyen, H., Zhang, C., and Peyrillé, P.: Annual cycle of the West African monsoon: regional circulations and associated water vapour transport, Q. J. Roy. Meteorol. Soc., 137, 129–147, https://doi.org/10.1002/qj.728, 2011. a, b
Tiedtke, M.: A comprehensive mass flux scheme for cumulus parameterization in large-scale models, Mon. Weather Rev., 117, 1779–1800, https://doi.org/10.1175/1520-0493(1989)117<1779:ACMFSF>2.0.CO;2, 1989. a
Tierney, J. E., Pausata, F. S., and deMenocal, P. B.: Rainfall regimes of the Green Sahara, Sci. Adv., 3, e1601503, https://doi.org/10.1126/sciadv.1601503, 2017. a
Vamborg, F., Brovkin, V., and Claussen, M.: The effect of a dynamic background albedo scheme on Sahel/Sahara precipitation during the mid-Holocene, Clim. Past, 7, 117–131, https://doi.org/10.5194/cp-7-117-2011, 2011. a
Vizy, E. K. and Cook, K. H.: Mesoscale convective systems and nocturnal rainfall over the West African Sahel: role of the Inter-tropical front, Clim. Dynam., 50, 587–614, https://doi.org/10.1007/s00382-017-3628-7, 2018. a
Wu, M.-L. C., Reale, O., Schubert, S. D., Suarez, M. J., Koster, R. D., and Pegion, P. J.: African easterly jet: Structure and maintenance, J. Climate, 22, 4459–4480, https://doi.org/10.1175/2009JCLI2584.1, 2009. a, b
Xue, Y. and Shukla, J.: The influence of land surface properties on Sahel climate. Part 1: desertification, J. Climate, 6, 2232–2245, https://doi.org/10.1175/1520-0442(1993)006<2232:TIOLSP>2.0.CO;2, 1993. a
Xue, Y. and Shukla, J.: The influence of land surface properties on Sahel climate. Part II. Afforestation, J. Climate, 9, 3260–3275, https://doi.org/10.1175/1520-0442(1996)009<3260:TIOLSP>2.0.CO;2, 1996. a
Yang, G.-Y. and Slingo, J.: The diurnal cycle in the tropics, Mon. Weather Rev., 129, 784–801, https://doi.org/10.1175/1520-0493(2001)129<0784:TDCITT>2.0.CO;2, 2001. a
Zängl, G., Reinert, D., Rípodas, P., and Baldauf, M.: The ICON (ICOsahedral Non-hydrostatic) modelling framework of DWD and MPI-M: Description of the non-hydrostatic dynamical core, Q. J. Roy. Meteorol. Soc., 141, 563–579, https://doi.org/10.1002/qj.2378, 2015. a, b
- Abstract
- Introduction
- Methods
- Results and discussion
- Summary and conclusion
- Appendix A: Additional figures and tables
- Appendix B: Analysis of 10 km simulations
- Code availability
- Data availability
- Author contributions
- Competing interests
- Disclaimer
- Acknowledgements
- Financial support
- Review statement
- References