the Creative Commons Attribution 4.0 License.
the Creative Commons Attribution 4.0 License.
 | 20 Feb 2023
Drought increase since the mid-20th century in the northern South American Altiplano revealed by a 389-year precipitation record
Mariano S. Morales
Doris B. Crispín-DelaCruz
Claudio Álvarez
Duncan A. Christie
M. Eugenia Ferrero
Laia Andreu-Hayles
Ricardo Villalba
Anthony Guerra
Ginette Ticse-Otarola
Ernesto C. Rodríguez-Ramírez
Rosmery LLocclla-Martínez
Joali Sanchez-Ferrer
Edilson J. Requena-Rojas
Given the short span of instrumental precipitation records in the South American Altiplano, longer-term hydroclimatic records are needed to understand the nature of climate variability and to improve the predictability of precipitation, a key natural resource for the socioeconomic development in the Altiplano and adjacent arid lowlands. In this region grows Polylepis tarapacana, a long-lived tree species that is very sensitive to hydroclimatic changes and has been widely used for tree-ring studies in the central and southern Altiplano. However, in the northern sector of the Peruvian and Chilean Altiplano (16–19∘ S) still exists a gap of high-resolution hydroclimatic data based on tree-ring records. Our study provides an overview of the temporal evolution of the late-spring–mid-summer precipitation for the period 1625–2013 CE at the northern South American Altiplano, allowing for the identification of wet or dry periods based on a regional reconstruction from three P. tarapacana chronologies. An increase in the occurrence of extreme dry events, together with a decreasing trend in the reconstructed precipitation, has been recorded since the 1970s in the northern Altiplano within the context of the last ∼4 centuries. The average precipitation over the last 17 years stands out as the driest in our 389-year reconstruction. We reveal a temporal and spatial synchrony across the Altiplano region of dry conditions since the mid-1970s. Independent tree-ring-based hydroclimate reconstructions and several paleoclimatic records based on other proxies available for the tropical Andes record this synchrony. The influence of El Niño–Southern Oscillation (ENSO) on the northern Altiplano precipitation was detected by our rainfall reconstruction that showed past drier conditions in our study region associated with ENSO warm events. The spectral properties of the rainfall reconstruction showed strong imprints of ENSO variability at decadal, sub-decadal, and inter-annual timescales, in particular from the Pacific NIÑO 3 sector. Overall, the recent reduction in precipitation in comparison with previous centuries, the increase in extreme dry events and the coupling between precipitation and ENSO variability reported by this work is essential information in the context of the growing demand for water resources in the Altiplano. This study will contribute to a better understanding of the vulnerability and resilience of the region to the projected evapotranspiration increase for the 21st century associated with global warming.
- Article
(6859 KB) - Full-text XML
- BibTeX
- EndNote


The Altiplano in the central Andes (∼16–24∘ S) is the largest semi-arid, high-altitude region in South America. With an average elevation of 4000 m a.s.l. and a large number of volcanoes up to 6700 m a.s.l., the Altiplano has hosted the settlement of diverse communities over thousands of years. Historically, human activities in the Altiplano have been strongly modulated by hydroclimatic variations (Tandeter, 1991; Binford et al., 1997; Nielsen, 2002; Núñez et al., 2002). Water resources in this dry environment are crucial for agriculture, wetlands for livestock breeding, mining, and other socioeconomic activities. Extreme drought events in the Altiplano, such as those that occurred in 1982/1983 and 1988/1989, caused serious problems in freshwater supplies for population drinking water, local agricultural, and livestock activities, causing large economic losses (Tandeter, 1991; García et al., 2003, 2007; Buytaert and De Bièvre, 2012).
Precipitation in the Altiplano is highly seasonally associated with the development of the South American summer monsoon (SASM) (see Sect. 2.1), which is the dominant mode of climate variability over tropical South America (Vera et al., 2006; Garreaud et al., 2009; Marengo et al., 2012; Vuille et al., 2012). In the Altiplano, temperature series consistently show a positive warming trend since the second half of the 20th century (Lavado-Casimiro et al., 2013; Vuille et al., 2015; Hunziker et al., 2018), while trends in precipitation show a high spatial heterogeneity, largely determined by the complex Andean topography (Vuille et al., 2003; Bennett et al., 2016; Imfeld et al., 2021). For instance, Huerta and Lavado-Casimiro (2021) indicated no significant trends towards wet or dry conditions for total annual precipitation in the Peruvian Altiplano during the period 1971–2013. A decline, albeit non-significant, was found for the period 1980–2010 in most of the stations located in the drier southern Altiplano in Bolivia and Chile by Bennett et al. (2016). Similar results were described by Vuille et al. (2003) for the period 1950–1994. However, an increasing trend of total summer precipitation only for the northeast of the Peruvian Altiplano was also reported (Bennett et al., 2016). Imfeld et al. (2021) found a positive trend in summer precipitation from the southern Andes of Peru for the period 1965/1966–2017/2018. Similarly, Segura et al. (2020) found a positive trend in the regional precipitation for the southern tropical Andes (including the Altiplano) during the period 1982–2018 using the CHIRPS satellite product.
The climate projections based on global and regional circulation models under different greenhouse gas (GHG) emissions scenarios show a steady warming for the Altiplano throughout the 21st century (Bradley et al., 2006; Urrutia and Vuille, 2009; Seth et al., 2010; IPCC, 2021). Summer precipitation is projected to decrease until the end of the 21st century, posing serious challenges for future water supply in this semi-arid region (Urrutia and Vuille, 2009; Minvielle and Garreaud, 2011; Neukom et al., 2015). Presently, due to the steady increase in human demand for water resources in the central Andes it is a key issue to identify the spatial patterns of precipitation, its temporal evolution, the return time interval of extreme hydroclimatic events, and their future projections. The scarcity and short length of precipitation records in this region, usually less than 50 years, hampers the assessment of the range of natural hydroclimate variability and the evaluation of possible changes. As an alternative, tree rings are one of the best paleoclimate proxies for reconstructing climate variability on a multi-century scale due to their annual resolution, high spatial coverage, and sensitivity to annual and/or seasonal climate variations (Jones et al., 1998).
The tree species Polylepis tarapacana (Rosaceae) grows on the slopes of high volcanoes located between 4200–5200 m a.s.l. along the Altiplano and is adapted to cope with extreme dry conditions and low temperatures as well as high solar irradiance, reaching ages up to 700 years (Morales et al., 2004; Christie et al., 2009; Solíz et al., 2009; Garcia-Plazaola et al., 2015). Tree rings from this long-lived species have been used to reconstruct the hydroclimate evolution of the central and southern regions of the South American Altiplano, including precipitation variability for the last 707 years from the Bolivian and Chilean sector (Morales et al., 2012) and 601-year surface variations in the Vilama–Coruto lake system ranging from northwestern Argentina to southwestern Bolivia (Morales et al., 2015). However, at present there is still a lack of long-term tree-ring chronologies to infer hydroclimatic variability in the northern sector of the Altiplano across the Peruvian and Chilean Andes spanning from 16 to 19∘ S. The main goal of this study is to develop an original tree-ring-based precipitation reconstruction for the northern sector of the Altiplano (16–19∘ S), using a new set of P. tarapacana tree-ring chronologies. This new high-resolution hydroclimate reconstruction will allow the characterization of the temporal variability in droughts and pluvials in this Andean sector over the past centuries. This will enable the comparison of its precipitation evolution with hydroclimate patterns observed in the southern regions in the Altiplano. Developing new high-resolution hydroclimate reconstructions is essential to understand the Altiplano spatial hydroclimate variations in a multi-century context, as well as to understand the influence of major drivers of climate variability, such as El Niño–Southern Oscillation (ENSO) and SASM, in local precipitation across the central Andes.
2.1 Precipitation of the South American Altiplano
Precipitation in the South American Altiplano results from the complex interactions between the large-scale atmospheric circulation and local orographic effects imposed by the topography of the Andes (Garreaud and Aceituno, 2001, Garreaud et al., 2003; Vuille and Keimig, 2004). Altiplano precipitation is episodic and convective in nature, related to the zonal flow of upper-air circulation from the Amazon basin (Pacific Ocean) that favors the occurrence of humid (dry) events (Garreaud, 1999; Falvey and Garreaud, 2005). More than 60 % of the total annual rainfall occurs during the summer months (December–February; Vuille and Keimig, 2004). This strong seasonality is associated with the development of the South American summer monsoon (SASM) over the tropical sector of the continent east of the Andes. The SASM presents a seasonal cycle including the onset (October–November), maturity (December–February), and die-off (March–April) periods. One of the most prominent components of this monsoon system is an upper-level pressure cell, known as the Bolivian High, which develops over the central Andes in response to latent heat released by deep summer convection over the Amazon basin (Lenters and Cook, 1997). Moist events are related to a southward displacement of the Bolivian High, which allows the expansion of the airflow from the east and the influx of humid air masses over the Altiplano (Lenters and Cook, 1997; Garreaud et al., 2009). The zonal wind in the upper troposphere over the Altiplano is largely modulated by sea surface temperature (SST) across the tropical Pacific Ocean (Vuille et al., 2000; Garreaud and Aceituno, 2001; Bradley et al., 2003). Therefore, the amount of moisture reaching the Altiplano from the Amazon basin is largely modulated by the dynamics of the Bolivian High and the strength of the zonal winds in the upper troposphere (Lenters and Cook, 1997; Vuille, 1999; Garreaud and Aceituno, 2001; Garreaud et al., 2003; Vuille and Keimig, 2004).
2.2 Study area
The study region is across the Andes in southern Peru and northern Chile, also known as the northern Altiplano. The climate is semi-arid with dry, cold winters and rainy, warm summers, with a total annual precipitation that ranges between 290–400 mm. More than 85 % of the total annual precipitation occurs during summer (December to March). Maximum monthly temperatures are 12.9 ∘C in July and 17.6 ∘C in November, whereas the minimum temperature is −9.4 ∘C in August and 1.7 ∘C in January.
Two new chronologies of Polylepis tarapacana were developed at the Chiluyo (CHI; Crispin-DeLaCruz et al., 2021) and Paucarani (PAU; Requena-Rojas et al., 2021) sites in the department of Tacna in Peru and a third one at the Suriplaza site (SUR) in the Arica and Parinacota region in Chile (Fig. 1, Table 1). None of these chronologies have been used in tree-ring-based precipitation reconstruction before. Trees were sampled on steep slopes in rocky and xeric environments (Fig. 1b–d). Due to the presence of twisted stems and eccentric radial growth, cross-sections from P. tarapacana were taken from living multi-stemmed trees. Subfossil wood samples were also collected.
Table 1Geographical locations of P. tarapacana sampling sites in the Altiplano of Peru (Chiluyo, CHI; Paucarani, PAU) and Chile (Suriplaza, SUR), statistics for the individual and regional chronologies, and correlation matrix for the common 1880–2007 period (all r values, P<0.05). R-Bar is the mean correlation between the tree-ring series, and EPS is the expressed population signal.
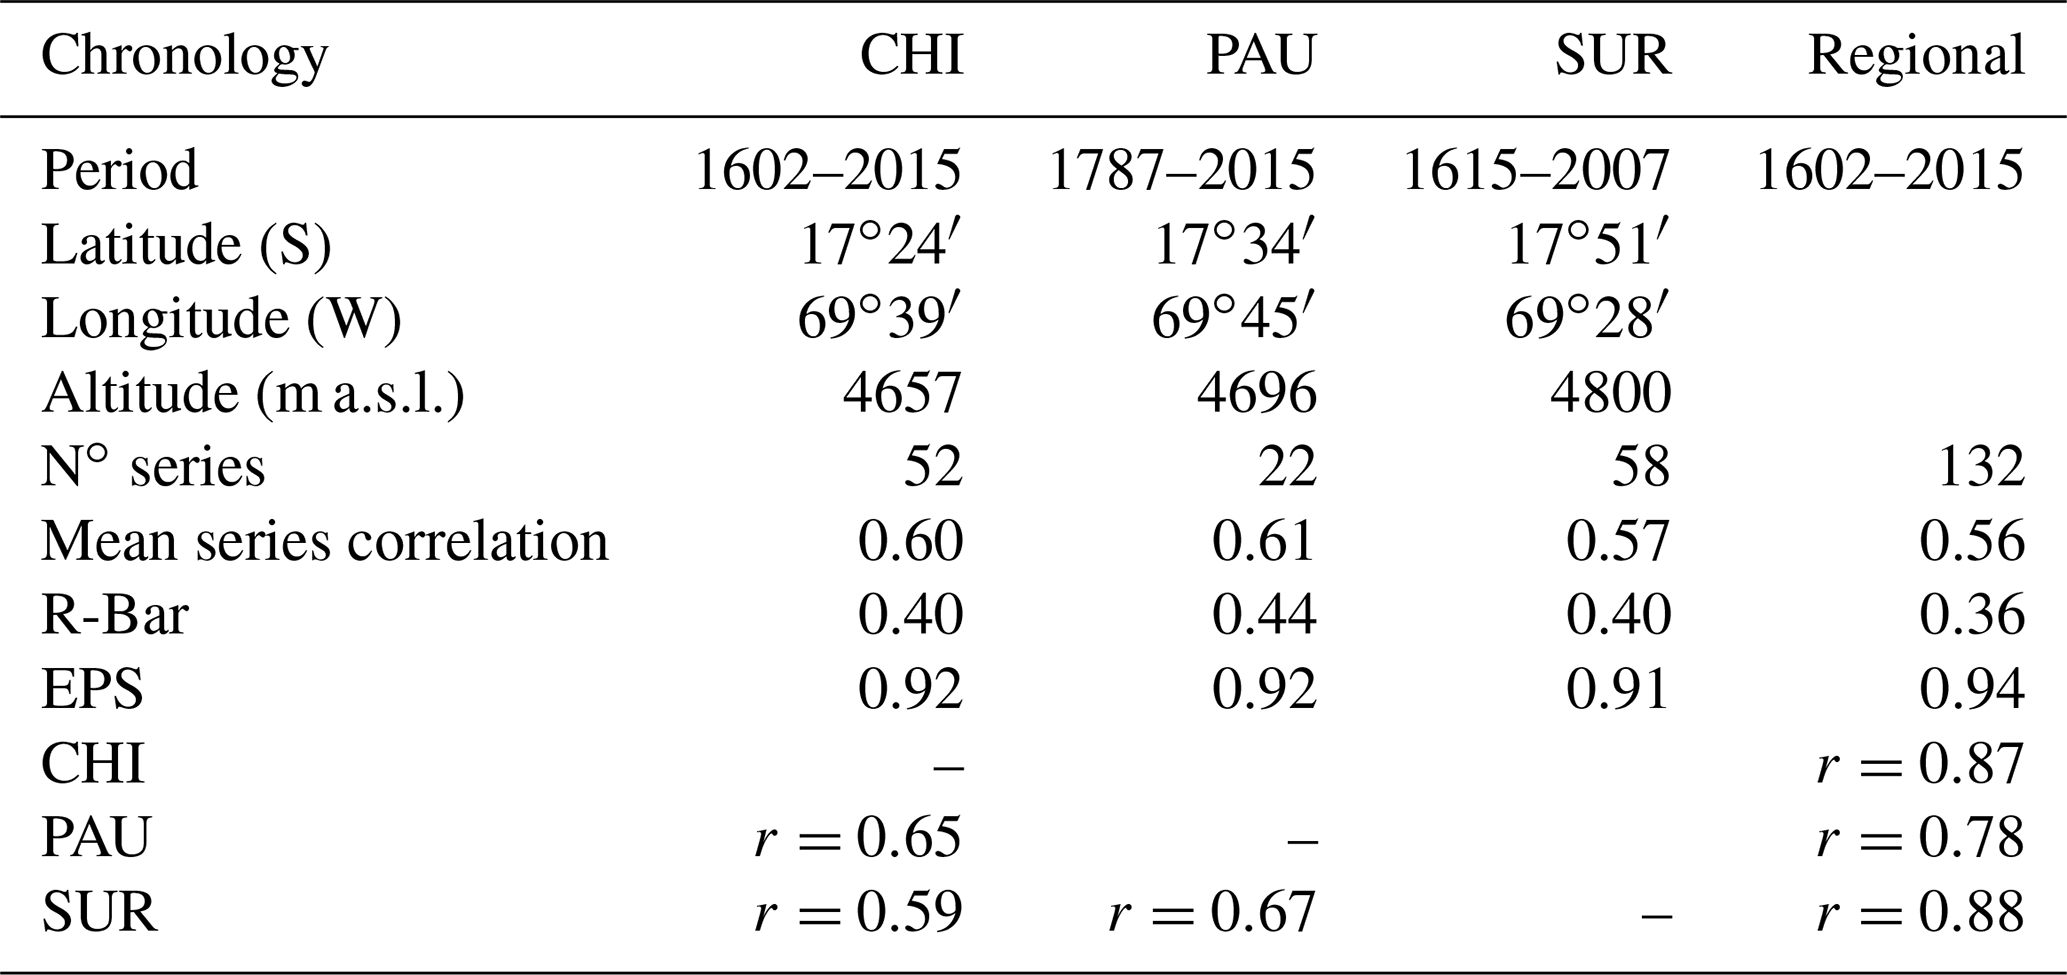
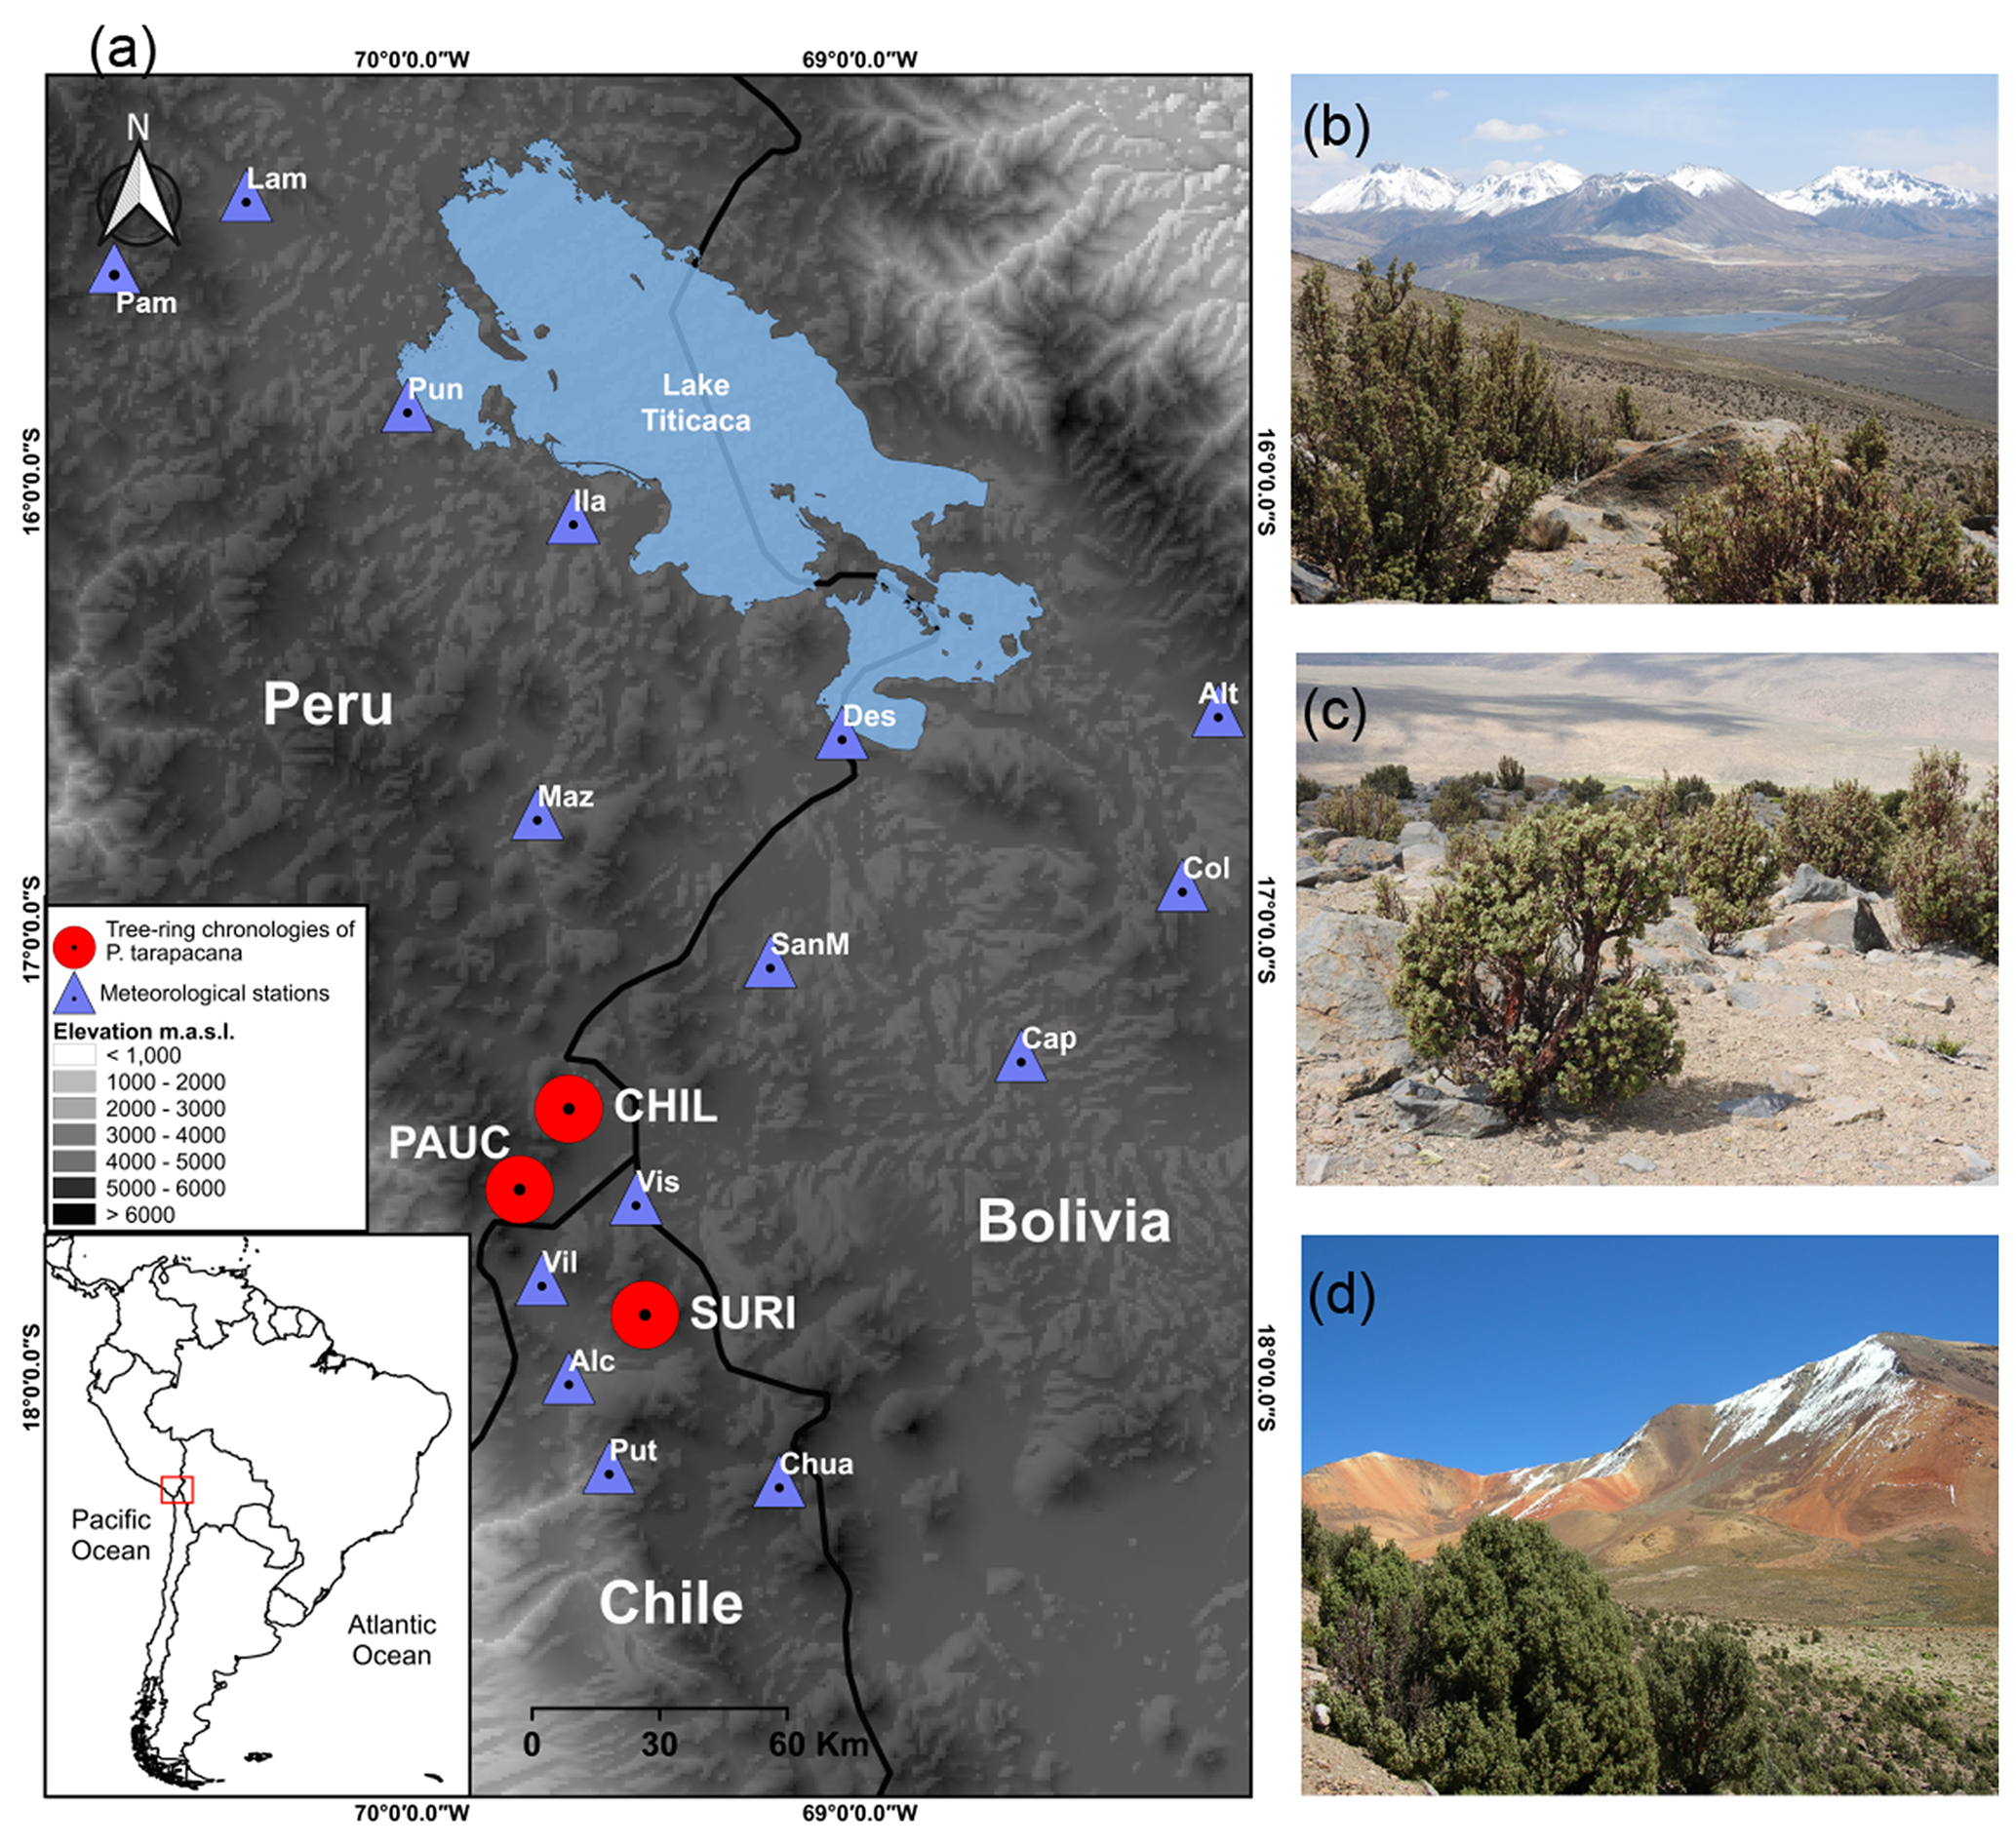
Figure 1Study area. (a) Map of the northern Altiplano region showing the geographic locations of the three Polylepis tarapacana ring-width chronologies (red circles) and the 15 weather stations (blue triangles) used in this study to create the regional precipitation and temperature indexes. Basemap source: GADM 2022 and data version 4.0.4. were downloaded from https://gadm.org/data.html (last access: 4 April 2022). (b–d) Study sites: (b) Chiluyo, (c) Paucarani, and (d) Suriplaza.
2.3 Tree-ring-width chronologies development
Cross-sections were mounted and sanded following standard dendrochronological techniques (Stokes and Smiley, 1968), and each growth ring was visually dated following Schulman's convention (1956) for the Southern Hemisphere that assigns to each ring the calendar year in which tree radial growth begins. Tree rings were measured with a binocular stereoscope to the nearest 0.001 mm. The COFECHA program (Holmes, 1983) was used to assess the quality of the visual dating and to identify measurement errors. Correctly dated ring-width measurement series were standardized to eliminate age-related growth trends and minimize non-climatically related growth variations (Fritts, 1976).
We used a conservative method of standardization, fitting negative exponential or linear curves with zero or negative slope to each individual tree-ring series. When the age–size trend is removed, some of the variance related to the climate signal can also be lost, leading to a trend distortion in the resulting index series (Melvin, 2004). To avoid this, the three standard chronologies were developed using the signal-free procedure (RCSigFree program; Melvin, 2004; Melvin and Briffa, 2008; Cook et al., 2017). To assess the quality of the tree-ring chronologies, the mean correlation between the tree-ring series (R-Bar) and the expressed population signal (EPS) statistics were computed using the RCSigFree program (Cook et al. 2017). The R-Bar is the mean correlation coefficient for all possible pairings among tree-ring series that integrate a chronology, computed for a specified common time interval (Briffa, 1995). EPS measures the strength of the common signal in the chronology over time by comparing a finite sample chronology with a hypothetical chronology that has been infinitely replicated (Wigley et al., 1984). Values of EPS above 0.85 are accepted as a good level of common signal fidelity between the finite sample chronology and the hypothetical chronology (Wigley et al., 1984).
Previous studies with P. tarapacana chronologies across the south-central Altiplano have determined a high regional common signal among records, highlighting a common spatial pattern at the regional scale (Solíz et al., 2009, Morales et al., 2012, 2015; Crispin-DelaCruz et al., 2022). We evaluate this in our study region using a correlation coefficient among the three signal-free standard tree-ring chronologies over their well-replicated common period 1880–2007. Based on the highly significant correlation coefficients that range from r=0.59 to 0.67 (n=128, p<0.001; Table 1), we created a well-replicated regional tree-ring chronology by assembling in a single record the 132 individual tree-ring-width series from the three sites. A correlation analysis of the three individual chronologies with the resulting regional chronology showed high and similar correlations ranging from 0.78 to 0.84 over the period 1880–2007 (Table 1).
2.4 Climate data collection and analysis
In semi-arid environments with complex topography, such as the central Andes, precipitation exhibits considerable spatial variability. In the northern Altiplano there are few instrumental records prior to 1970, and they are not regularly distributed. Therefore, to minimize the influence of any single station record and to highlight the common pattern of spatial and temporal variation across the study region, we developed a regional precipitation index. Monthly precipitation records were collected from seven meteorological stations located above 3200 m a.s.l. in the northern Altiplano between 16 and 19∘ S. Only station records with less than 10 % of missing data were considered (Table 2). Data gaps were estimated using linear regressions (Ramos-Calzado et al., 2008). Correlation coefficients between the standard P. tarapacana regional chronology and precipitation monthly variations from each of the seven meteorological stations were used to determine the seasonal precipitation period best related to radial growth, which was from November to January (NDJ, late spring to mid-summer). Inter-annual time series of the total NDJ precipitation were computed for each of the seven available stations, normalized (z score; Jones and Hulme, 1996) and averaged to obtain a regional index of precipitation from the northern South American Altiplano for the period 1970–2019. To assess the partial influence of temperature on tree growth we compiled monthly temperature data from nine high-altitude (>3200 m a.s.l.) meteorological stations from the Altiplano (Table 2). Based on these data, we computed a regional-mean NDJ temperature index for the period 1963–2014 across the study region, following the same procedure described for developing the regional precipitation index.
Table 2Geographical locations of the meteorological stations in the Altiplano used in this study to compose the regional precipitation and temperature indexes for the northern Altiplano.

Source: Peru – SENAMHI, Bolivia – SENAMHI, Chile – DMC and DGA.
2.5 Reconstruction method
We developed the NDJ precipitation reconstruction by regressing the regional standard tree-ring chronology against NDJ regional precipitation using a principal component regression approach (Cook et al., 2007). Predictors for the reconstruction included the regional tree-ring chronology at time t+0, and its temporal lags (t+1 and t+2) significantly correlated (α=0.05) to the regional precipitation record during the 1970–2010 calibration period. These three lags were considered to be potential predictors of annual precipitation and allow for a 3-year response to climate in the tree-ring-width chronology (Fritts, 1976). As the predictors were intercorrelated, they were converted to orthogonal variables to reduce the dimension of the regression problem and to enhance the common precipitation signal, using a principal component analysis (Cooley and Lohnes, 1971). The selection criterion for choosing the best reconstruction model was based on maximizing the adjusted R2 (R2adj) by a stepwise multiple regression approach (Weisberg, 1985). Given the relatively short precipitation record for calibration, the reconstruction model was developed using the leave-n-out cross-validation procedure, where n is five ( number of positive lags: t+1 and t+2) (Michaelsen, 1987; Meko, 1997). In this approach five observations were successively withheld, a model was estimated on the remaining observations, and a prediction was made for the omitted observations. This resulted in a set of estimated precipitation values, which were compared to the observed precipitation to compute validation statistics of model accuracy and error. The leave-five-out analysis was performed using the GEOSA package in MATLAB program (https://www.ltrr.arizona.edu/~dmeko/geos585a.html, last access: 9 February 2023). To evaluate the similarities between the precipitation estimated by the reconstruction model and the observed instrumental data we used the proportion of variance explained by the regression (R2), the F statistic of the regression, and the autocorrelation in the regression residuals measured by the significance of the linear trend and the Durbin–Watson test (Draper and Smith, 1981). We also calculated the reduction of error (RE) during the verification period (Gordon, 1982), as well as the root mean square standard error (RMSE) as a measure of the inherent uncertainties in the reconstruction (Weisberg, 1985). The reconstructed precipitation values are anomalies expressed as percentages with respect to the common instrumental precipitation period 1982–2013.
2.6 Analysis of precipitation extreme events
A nonparametric Gaussian kernel function was applied to estimate the temporal changes in the occurrence rates of extreme wet/dry annual events in the precipitation reconstruction (Mudelsee et al., 2003). The kernel function detects non-monotonic trends and imposes no restrictions on the parameters. Here, the long-term changes in the probability of occurrence of one specific extreme event were explored by using a kernel smoothing over a 40-year bandwidth. By resampling the list of yearly events in a 1000-bootstrap simulation we created confidence bands at the 95 % level for a better interpretation of the estimations (Cowling et al., 1996; Mudelsee, 2014). The intensity of extreme annual wet and dry events was selected from values above or below the 95th and 5th percentiles, respectively.
2.7 Spatial patterns and spectral properties of the NDJ precipitation
To identify the spatial extent of the northern Altiplano precipitation across South America, we developed field correlation maps between the observed and the reconstructed NDJ precipitation with the NDJ precipitation grid from the Global Precipitation Climatology Project database (GPCP; Adler et al., 2018). Field correlation maps were calculated for the common period 1979–2013 between the GPCP NDJ precipitation grid and the instrumental and reconstructed precipitation (https://psl.noaa.gov/data/correlation/, last access: 23 March 2022).
Periodicities in the precipitation reconstruction were determined by means of spectral analysis. First, we establish the significant oscillatory modes in the instrumental and reconstructed precipitation using a Blackman–Tukey (BT) spectral density analysis (Jenkins and Watts, 1968) for the period spanning each time series. A total of 30 % of the series length was used to determine the number of lags used for the auto- and cross-covariance functions. A Hamming filter was used to smooth the spectral functions, and the confidence level of the spectrum (95 % confidence level) was computed from a first-order Markov null continuum based on the lag-1 autocorrelation (red noise) of the instrumental and the reconstructed time series (Mitchell et al., 1966). Second, we applied singular spectral analysis (SSA; Vautard and Ghil, 1989) to detect and extract the temporal patterns of the main oscillatory modes of reconstructed and instrumental precipitation time series. The SSA is a nonparametric method based on the empirical orthogonal function analysis that samples lagged copies of time series at equal time intervals and decomposes the instrumental and reconstructed series into oscillatory modes through the calculation of the eigenvalues and eigenvectors of the autocovariance matrix (Vautard and Ghil, 1989; Vautard, 1995). In this way SSA extracts the waveforms or reconstructed components of the main periodic or quasi-periodic modes of the analyzed time series and allows for the assessment of the changes in the amplitude and phase of each mode over the time period of the series. We used the program AnClim (Štepánek, 2008) to perform the BT analysis and the SSA program (Boninsegna and Holmes, unpublished operating manual, on file at Laboratory of Tree-Ring Research, University of Arizona) to extract the main oscillatory modes.
2.8 ENSO signals in the northern Altiplano precipitation
To assess the influence of the tropical Pacific sea surface temperatures (SSTs) on the reconstructed NDJ precipitation variability over the northern Altiplano, we computed spatial correlations maps between the reconstructed NDJ precipitation and the SSTs from the gridded National Centers for Environmental Prediction (NCEP) reanalysis global database ( grid point resolution; Kistler et al., 2001) for the period 1949–2013. Here we test the relationships between the reconstruction and the SSTs on a monthly basis and for different sets of SST months: NDJ, DJF, NDJFM, July–June, October–September. We found the strongest spatial correlation for the October–September SST period. Since the SST shows a strong intra-annual persistence, it is expected to find a SST signal covering the whole year and not exclusively during the NDJ months corresponding to the precipitation reconstruction.
We also correlated the inter-annual variations in the NDJ precipitation reconstruction and the mean annual (prior Oct–current Sep) SST anomalies averaged for the NIÑO 3 sector (SSTs_N3) from the tropical Pacific (5∘ N–5∘ S, 90–150∘ W) for the period 1870–2013. Finally, we extracted and compared the main oscillatory modes of variability in the NDJ precipitation reconstruction and the SSTs_N3 for the period 1870–2013. For that purpose, we performed SSAs (Vautard and Ghil, 1989) as described in Sect. 2.7.
2.9 Comparisons with hydroclimatic reconstructions from the Altiplano and tropical Andes
We evaluated similarities and differences in the northern Altiplano NDJ precipitation reconstruction with independent tree-ring-based hydroclimatic reconstructions from the South American Altiplano, and we compared it with an annual (prior November to current October) precipitation reconstruction covering the period 1300–2009 CE, based on P. tarapacana chronologies from the central and southern sectors of the Altiplano (Morales et al., 2012); an annual (January to December) tree-ring reconstruction of the variations in lake surface area from the Vilama–Coruto system in the southwestern Altiplano covering the period 1407–2007 CE (Morales et al., 2015); and a gridded summer (DJF) reconstruction of the Palmer Drought Severity Index (scPDSI) covering the entire Altiplano region for the period 1400–2019 CE (Morales et al., 2020).
Comparisons were also developed with other hydroclimatic proxy records from the tropical Andes, such as the stable oxygen isotope (δ18O) record from the Quelccaya ice core, Peru (Thompson et al., 2006); the δ18O record from Pumacocha lake sediment, Peru (Bird et al., 2011); and the composite DJF scPDSI reconstruction from the entire Altiplano (17-23∘ S, 66–70∘ W) extracted from a Paleo Hydrodynamics Data Assimilation (PHYDA) product (Steiger et al., 2018).
3.1 Regional tree-ring chronology and climate–growth relationship
The newly developed regional signal-free standard P. tarapacana chronology covers the period 1602–2015 but is well replicated with more than 10 ring-width series since the year 1625 (Fig. 2a). In agreement with the sample size, the R-Bar and EPS statistics indicate a strong common signal among the individual time series that composed the regional chronology with an R-Bar mean value of 0.36 and an EPS value above the 0.85 threshold during the period 1625–2015 (Fig. 2a, Table 1). A mean sensitivity value of 0.33 indicates that the P. tarapacana regional chronology contains relatively high inter-annual variability in radial growth (Table 1).

Figure 2Regional tree-ring chronology and its relationships with climate variables. (a) Regional signal-free chronology of Polylepis tarapacana for the northern South American Altiplano, the number of tree-ring series (gray shading), and R-Bar and EPS statistics for the period 1602–2015 CE. The dashed horizontal red line represents the EPS 0.85 threshold. The vertical red line indicates the year since the chronology is represented with more than 10 ring-width series. Comparison between the inter-annual variations in the tree-ring chronology (black line) with (b) the regional precipitation index from November to January (NDJ; blue line) for the period 1970–2010 and (c) the regional NDJ temperature index (red line) for the period 1963–2010 for the northern South American Altiplano. The temperature is shown inversely to facilitate the comparison between records (right axis). The correlation coefficients and the slope trend and significance are indicated in each panel.
The radial growth variation in P. tarapacana is positively correlated (r=0.63, p<0.001) with the regional NDJ precipitation index of the previous growing season (Fig. 2b) and negatively correlated (, p<0.001) with the regional NDJ temperature index of the previous growing season (Fig. 2c) for the period 1970–2010. While prior late-spring to mid-summer precipitation enhanced P. tarapacana growth response, temperatures for the same months exerted a negative effect on tree growth.
3.2 Reconstruction model and temporal evolution of the precipitation
Our tree-ring reconstruction explains 42.5 % of the total NDJ precipitation variability during the calibration period (1970–2010; Fig. 3a). The consistency between observed and reconstructed precipitation indicates a good quality of the calibration model to reproduce past precipitation variability for the study region. The predictive power of the calibration model is consistent with a significant F value (F=9.1, p<0.0001) and a positive reduction of error (RE = 0.2). The residuals of the regression models have a normal distribution; were not significantly autocorrelated according to Durbin–Watson tests; and show a decreasing trend, albeit not significant (Fig. 3b).

Figure 3Precipitation variations in the northern sector of the Altiplano during the last 4 centuries. (a) Observed (instrumental; green line) and estimated (tree ring; blue line) variations in late-spring–mid-summer precipitation (November–January) in the northern part of the Altiplano (precipitation anomalies are expressed in percentages with respect to the calibration period 1970–2010). Calibration and verification statistics: explained variance (R2) during the calibration period, Pearson's correlation coefficient (r) between observed and reconstructed values, regression F value, and reduction of error (RE). (b) The residuals of the regression (red line) with the slope of the trend (black line). The Durbin–Watson (DW) statistic and the trend slope are indicated. (c) Tree-ring-based reconstruction of late-spring–summer precipitation in the northern Altiplano region for the period 1625–2013 (precipitation anomalies expressed in percentages (%) with respect to the average instrumental precipitation for the common period 1982–2013). To emphasize the low-frequency variations, a 35-year cubic smoothing spline reducing 50 % of the reconstruction variance is shown. Values above (below) the reconstructed mean for the period 1625–2013 are indicated with blue (red) lines. The gray band represents the RMSE. Vertical red (blue) bars in the bottom of the panel indicate the extreme dry/pluvial events calculated for the 5th (95th) percentile threshold.
Our reconstruction spans the period 1625–2013, covering the last 389 years of NDJ precipitation variations from late spring–mid-summer for the northern region of the Altiplano (Andean region from northern Chile-southern Peru; Fig. 3c). The record is characterized by strong inter-annual variations that occur within decadal, multi-decadal, and centennial fluctuations. Severe and persistent droughts and pluvials are identified in the reconstruction. During the period 1625–1661 rainfall variations oscillate around the long-term mean with the occurrence of 3 extremely wet years (1642, 1643, 1645). The period 1664 to 1724 was characterized by relatively humid conditions interrupted by two extreme 2-year dry events in 1692/1693 and 1722/1723. A persistent 15-year period of severe drought conditions at the end of the 18th century (1782–1797) was briefly interrupted by 3 years with average conditions in 1789–1791, followed by a 5-year drought between 1803–1809. One of the wettest periods in the northern sector of the Altiplano was recorded between 1818 and 1832, and the wettest year in the last 389 years was recorded for 1876, immediately followed by an extremely dry year in 1877. Decadal drought condition was recorded for the period 1926 to 1941; thereafter, another prolonged event with abundant rainfall occurred between 1942 and 1957. A marked negative trend in precipitation was recorded in the second half of the 20th century and the beginning of the 21st century, culminating in a dry period from the late 1970s to the present. The period from 1997 to 2013 is particularly dry, with a mean precipitation value (89.8 %) at the lowest tail of the 17-year mean moving-window precipitation distribution, that is ∼30 % less precipitation than the historical mean calculated from 1625 to 2013 (120.3 %) (Fig. 4a). Averaged precipitation for 1997–2013 ranks as the single driest 17-year period during the last 389 years (Fig. 4a).

Figure 4The 1997–2013 drought and extreme precipitation event occurrence rates. (a) Average reconstructed precipitation for the period 1997–2013 (dashed red line) and for the period 1625–2013 (black line) compared to 17-year-average moving-window precipitation anomaly distribution (%) for the reconstructed period 1625–2013. (b) Occurrence rate of extreme dry (orange) and wet (blue) precipitation events and the sum of both (dry plus wet; gray) for the period 1625–2013. Extreme dry/wet events were calculated for the 5th and 95th percentile thresholds of the precipitation reconstruction, respectively. A smoothed bandwidth of 40 years was applied using a time-dependent kernel method. The shaded areas represent 95 % confidence intervals based on 1000 bootstrap simulations.
3.3 Temporal changes in dry/wet precipitation extremes
The return time analysis for the reconstruction is characterized by a non-stationarity behavior in the occurrence of dry extremes, with the highest rates recorded during the last 3 decades of the 20th century and beginning of the 21st century and one extreme event recorded every ∼9 years (Fig. 4b). The opposite situation occurred before 1650, with one extreme dry event recorded every ∼33 years. The 18th and 19th centuries showed a relatively low and constant recurrence rate of extreme dry events with a drought every ∼ 20–27 years, while from 1940 to 2013, there was a steady increase in extreme dry events from ∼17 to ∼9 years (Fig. 4b). The return time analysis of abundant-precipitation events varies between one pluvial event every 12–30 years (Fig. 4b). The highest rate of pluvials was recorded from 1626 to 1680, with a wet event every ∼ 12–15 years. Also, a high rate of extreme-wet-event occurrences (every ∼15 years) was recorded during the first half of the 19th century (Fig. 4b). The addition of extreme dry and pluvial events indicates that the highest occurrence rate of extreme events took place during the second half of the 20th century and beginning of the 21st century, with one extreme event every 6.7–7.5 years (Fig. 4b). This period is dominated by the occurrence of extreme dry events. The second-highest period of extreme-event frequency is the 17th century, with one event every 8–10 years, dominated by pluvial events (Fig. 4b).
3.4 Spatial patterns and dominant spectral modes of the precipitation variability
The spatial correlation analysis between the reconstructed and observed NDJ precipitation of the northern South American Altiplano and the gridded GPCP NDJ precipitation for the common period 1979–2013 showed consistent spatial patterns. High correlation coefficients (r>0.4, p<0.05) were observed across the South American Altiplano and projected to the south-central Andes. Positive correlations (r>0.3, p<0.05) were also recorded in the surrounding lowlands from the central Andes and in the equatorial sector of Brazil, while weaker positive correlations were observed within the region of convection over the Amazon basin (∼5–17.5∘ S, 72.5–47.5∘ W; Vuille et al., 2012) (Fig. 5a, b).
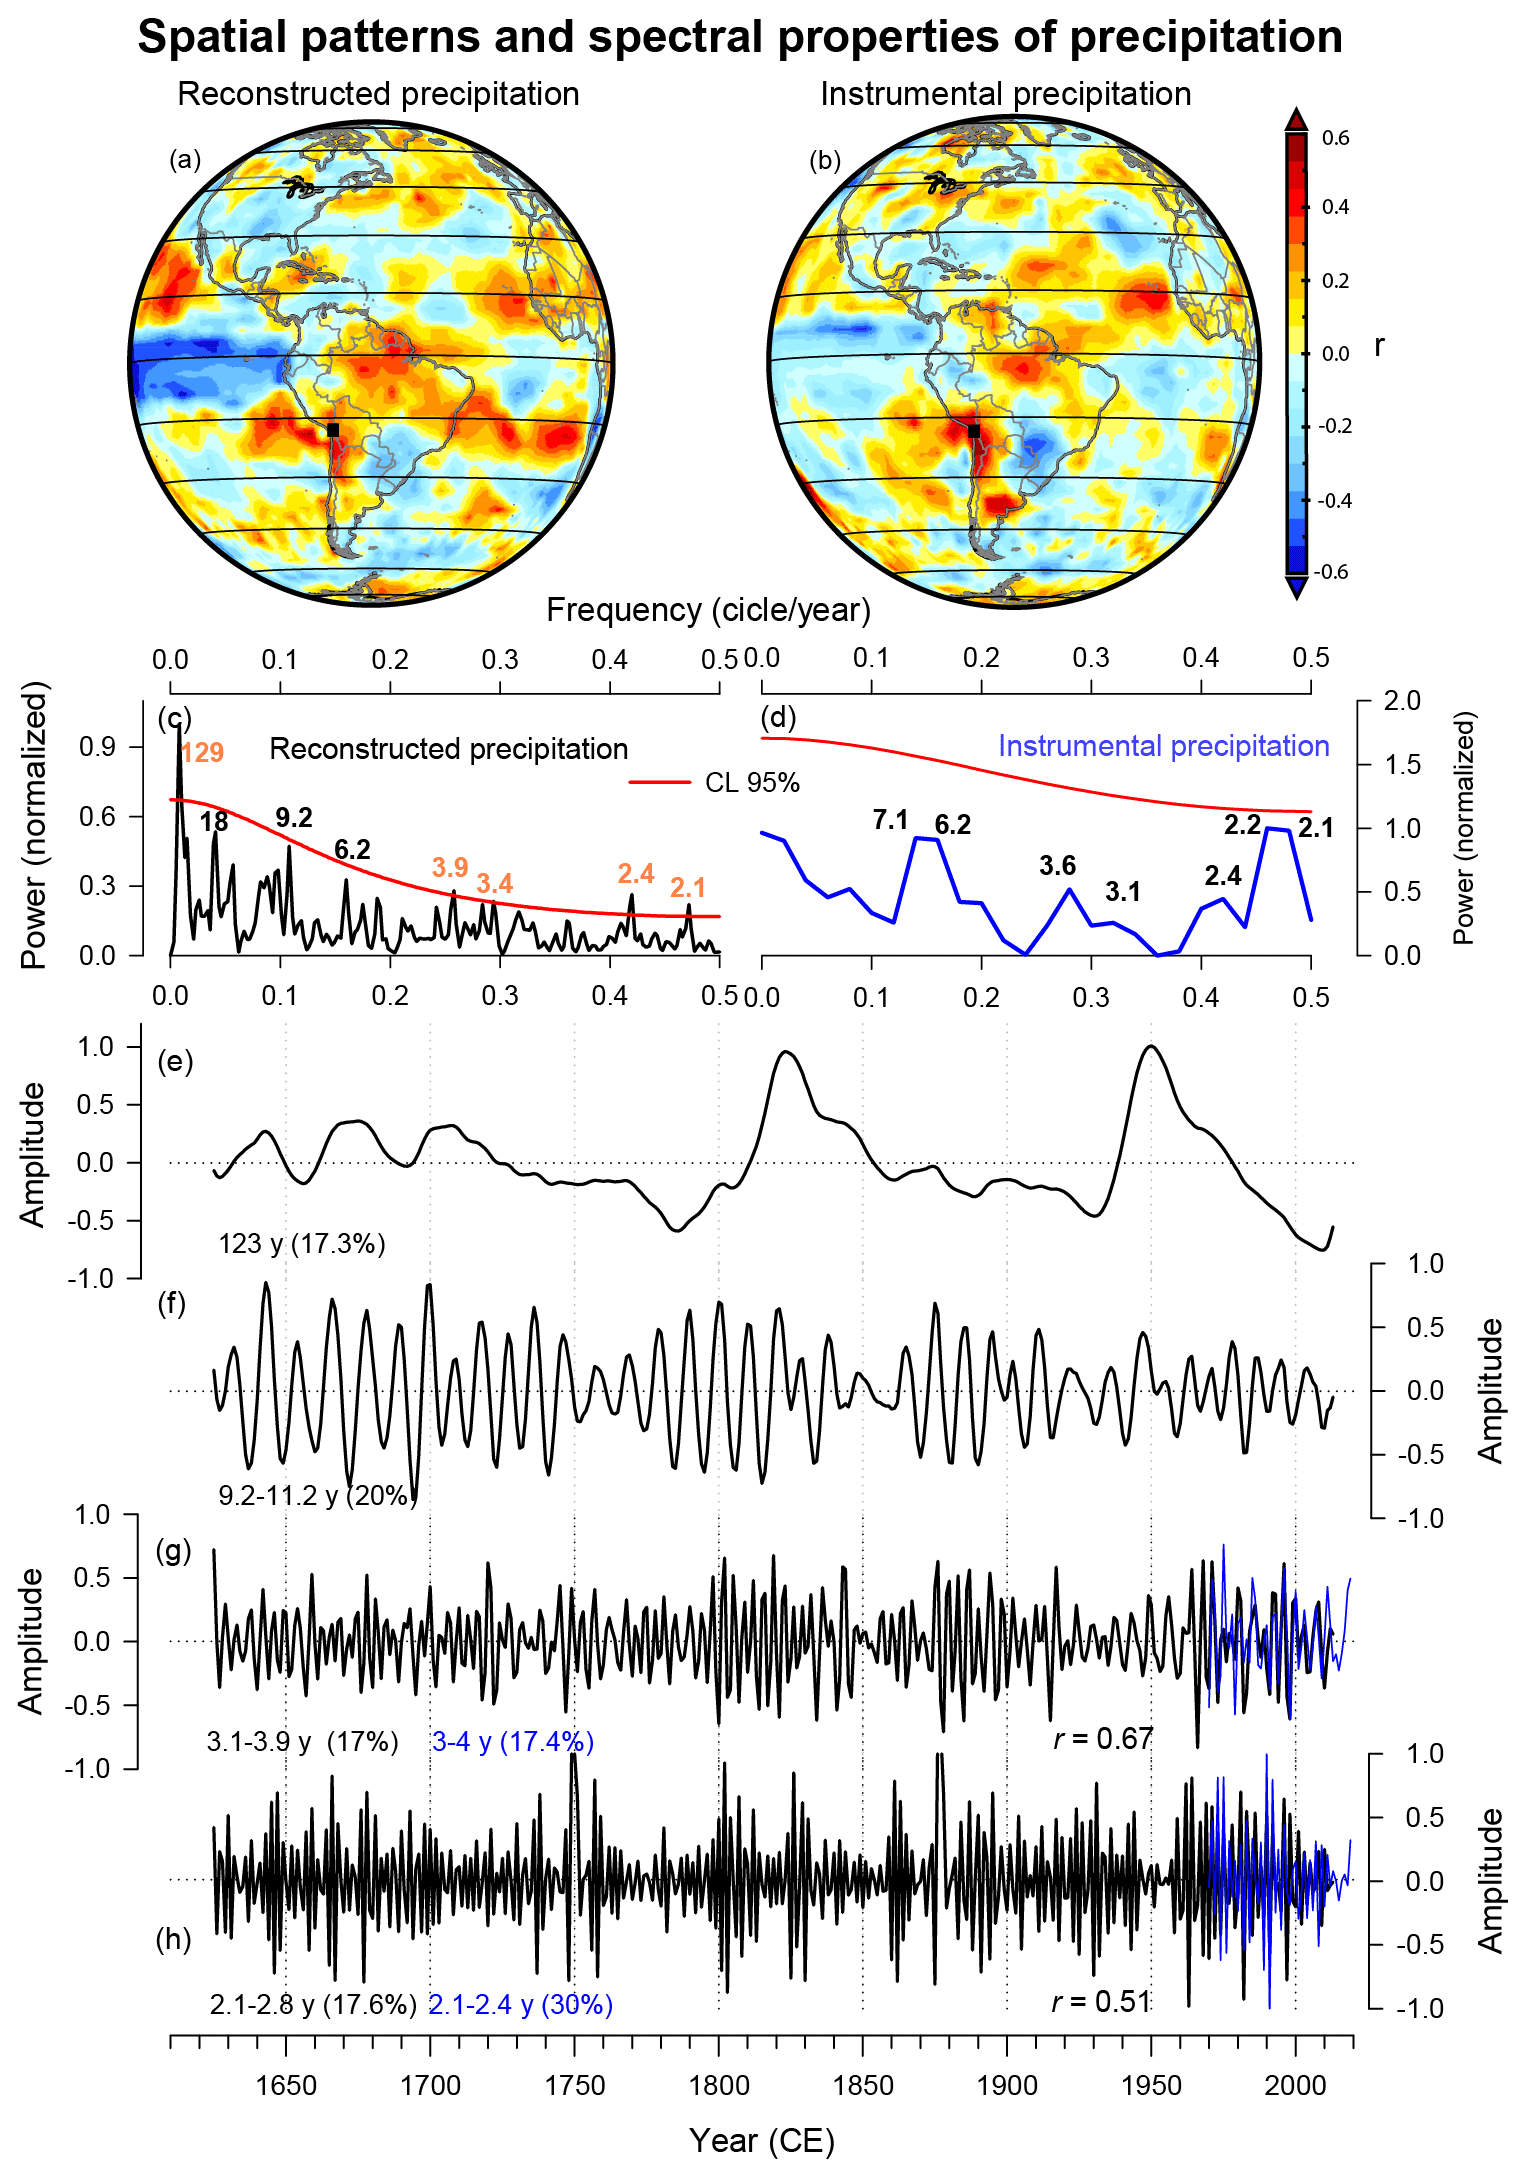
Figure 5Spatial patterns and spectral properties of precipitation. Spatial correlation field between the GPCP gridded NDJ precipitation and the northern Altiplano (a) reconstructed and (b) instrumental NDJ precipitation for the period 1979–2013. (c) Blackman–Tukey power spectral analysis of the reconstructed (1625–2013) and (d) instrumental (1970–2019) precipitation from the northern sector of the South American Altiplano. Black numbers indicate periods with high spectral power but not statistically significant (95 % confidence level), while orange numbers represent significant peaks (95 % confidence level). (e–h) Dominant modes of secular, decadal, and inter-annual variability extracted by singular spectral analysis (SSA) from the reconstructed and instrumental precipitation over the period 1625–2013 and 1970–2019, respectively. The frequencies of the SSA waveforms for the reconstructed (instrumental) precipitation are indicated in black (blue); number of years with the corresponding explained variance in percentages (%).
The spectral density analysis for the reconstructed precipitation shows increased spectral power from inter-annual to centennial scales (Fig. 5c). Spectral peaks are significant (95 % confidence) at cycles centered on 129, 3.9, 3.4, 2.4, and 2.1 years (Fig. 5c), indicating that the reconstruction contains a strong high-frequency signal. The same analysis for the instrumental precipitation detects high, but not significant, spectral power at inter-annual scales that ranges between 2.1- and 7.1-year spectral peaks (Fig. 5d), consistent with the high-frequency spectral signal in the reconstruction.
The main secular (e), decadal (f), and inter-annual (g, h) oscillatory modes of the northern Altiplano precipitation reconstruction were related to the following oscillatory cycles with the associate variance from the total precipitation reconstruction: ∼123 years with 17.3 % variance (Fig. 5e), 9.2–11.2 years with 20 % variance (Fig. 5f), 3.1–3.9 years with 17 % variance (Fig. 5g), and 2.1–2.8 years with 17.6 % variance (Fig. 5h). The changes in amplitude indicate a shift in the intensity of the oscillatory waveforms. The secular wave is dominated by the occurrence of wet events around the 1820s and 1940s. The decadal wave is more intense between 1625–1750, 1770–1840, and 1870–1920. The oscillatory mode in the 3.4-year waveform shows an increase in amplitude in the periods 1795–1845, 1875–1920, 1960–1970, and 1990–2000 and a decrease in amplitude during 1920–1960. The amplitude of the 2.4-year waveform was highly variable throughout the past 4 centuries (Fig. 5h).
Regarding instrumental precipitation, the inter-annual oscillatory modes of 3–4 years and 2.1–2.4 years explained 17.4 % and 30 % of the total precipitation variance. Significant positive correlations were recorded between the reconstruction and instrumental precipitation (Fig. 5g, h), showing the high-frequency variability shared by both precipitation records. More specifically, the inter-annual oscillatory modes of 3.1–3.9 years reconstructed precipitation, and the 3–4-year instrumental precipitation correlated positively (r=0.67, p<0.01; Fig. 5g), as well as the 2.1–2.8-year reconstructed precipitation and the 2.1–2.4-year instrumental precipitation (r=0.51, P<0.01; Fig. 5h).
3.5 ENSO signals in the northern South American Altiplano precipitation
The comparisons between tropical Pacific SST and the reconstructed precipitation for the northern Altiplano region were done for overlapping time periods (1949–2013 and 1870–2013). The comparisons between tropical Pacific SST and the reconstructed precipitation for the northern Altiplano region were done for the overlapping time periods 1949–2013 and 1870–2013. Figure 6 shows the influence of tropical Pacific SST variability over the northern South American Altiplano. The spatial correlation pattern showed a significant negative relationship between the reconstructed precipitation and the SSTs from the tropical east-central Pacific Ocean for the period 1949–2013. The strongest correlations were found in the region south of the NIÑO 3 sector (∼2–13∘ S, 100–150∘ W; Fig. 6a).
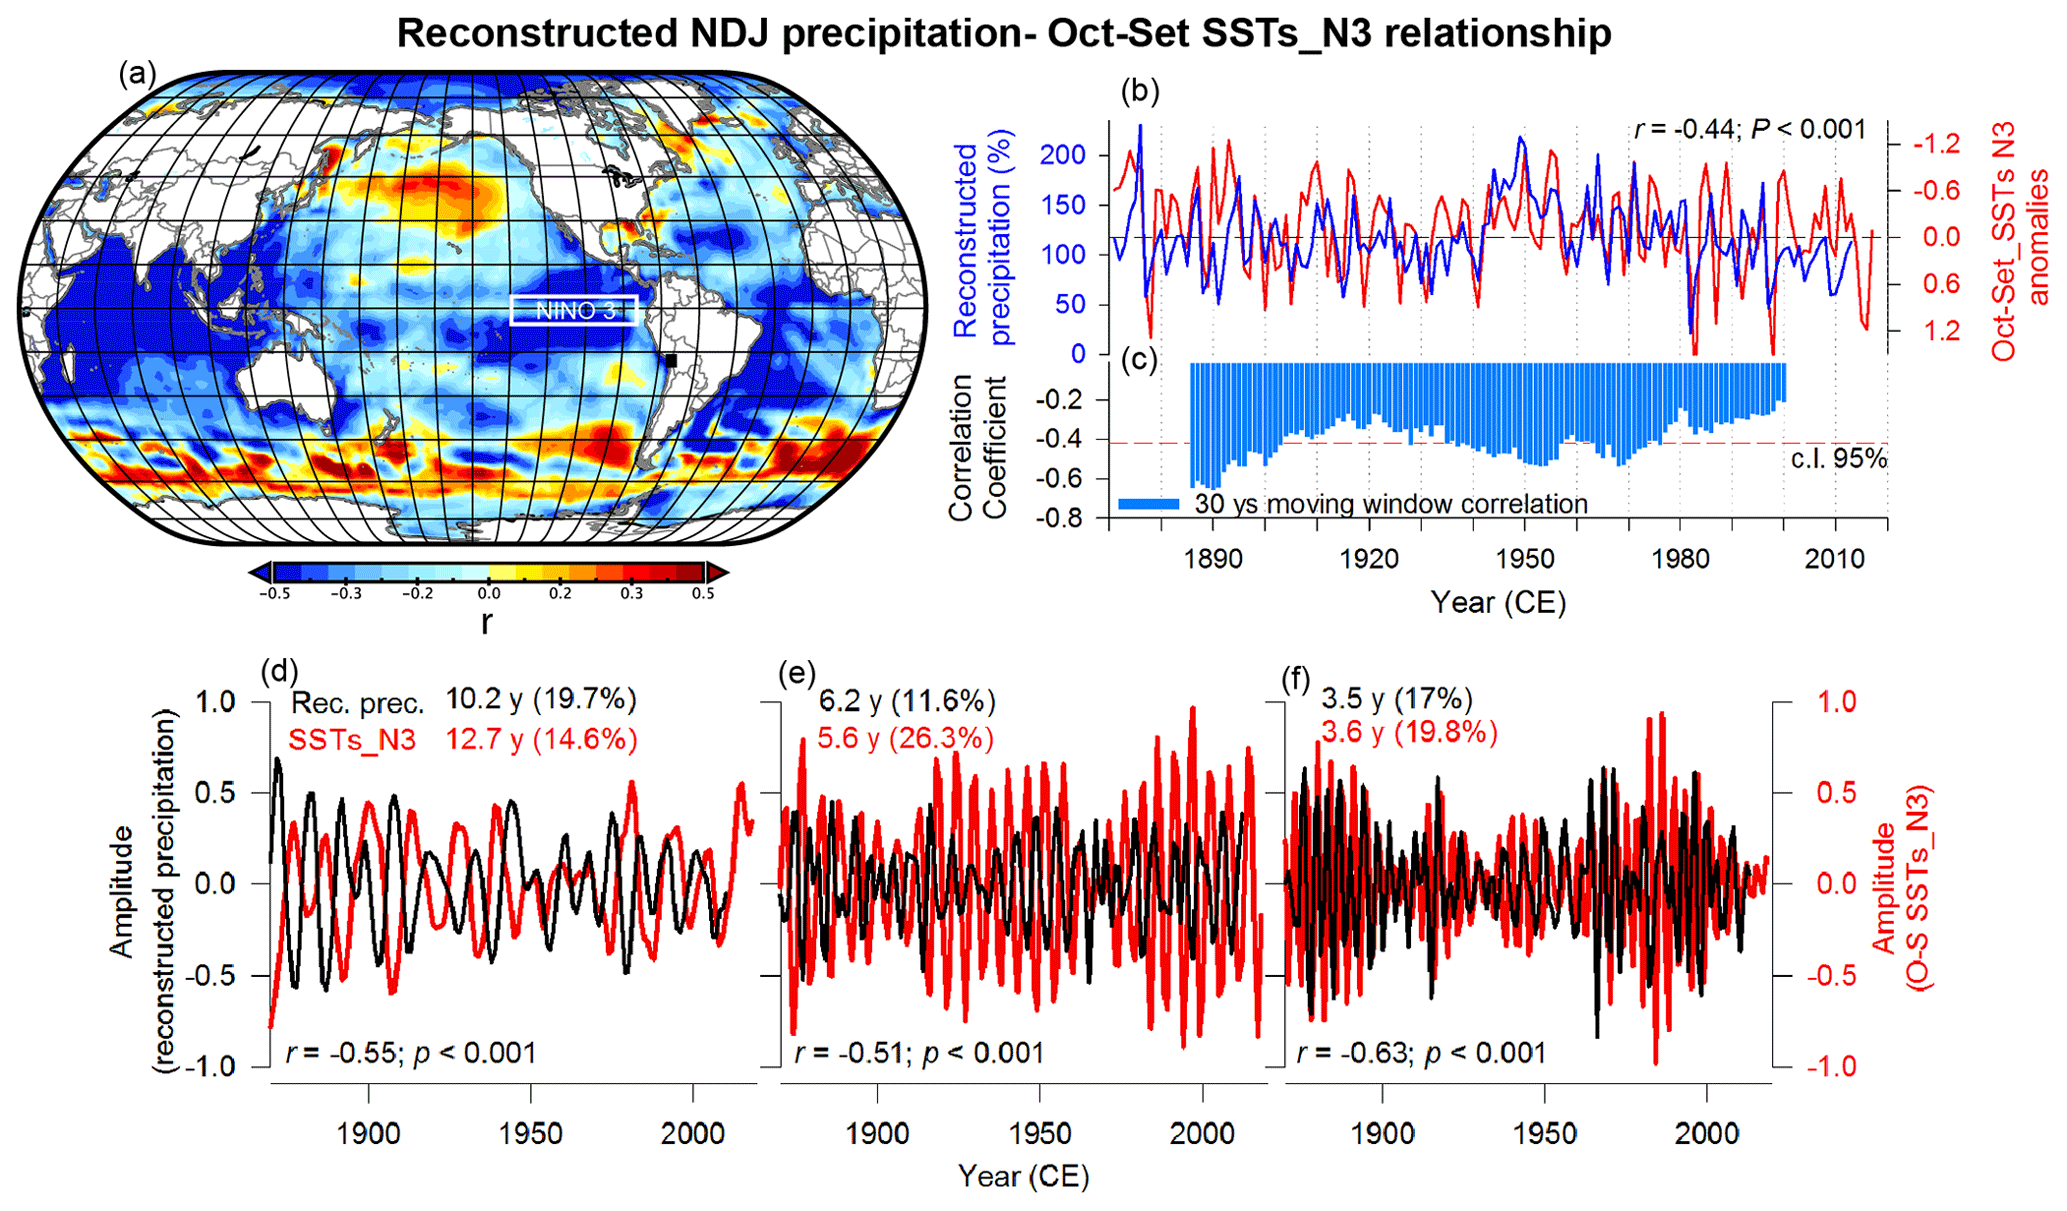
Figure 6ENSO signals in the northern South American Altiplano. (a) Spatial correlation patterns over the period 1949–2013 between the reconstructed November–January (NDJ) precipitation for the northern Altiplano (black square) and the gridded October–September (O–S) sea surface temperatures (SSTs). (b) Inter-annual relationship between the reconstructed NDJ precipitation and O–S sea surface temperatures (SSTs) averaged for the NIÑO 3 region (SSTs_N3; white rectangle in panel a) for the period 1870–2013. (c) Moving 30-year correlation between the reconstructed NDJ precipitation and the SSTs_N3 for the period 1870–2013. (d–f) Comparisons between the waveforms of the precipitation reconstruction (black line) and the SSTs_N3 (red line) extracted by SSA over the 1870–2013 period. The periodicities are indicated in each panel, and the percentages of variance explained by each frequency are indicated in parentheses. The correlation coefficients between the two series are shown in each panel.
The time series of reconstructed precipitation and the mean SST Oct–Sep anomalies averaged for the NIÑO 3 sector of the tropical Pacific showed significant negative correlations (, P<0.001; Fig. 6b). Correlation coefficients calculated between the two time series for time windows of 30 years lagged 1 year detected changes in the stability of the relationship between the precipitation reconstruction and the SSTs_N3 through time (Fig. 6c). Strong negative correlations were recorded centered on the periods 1885–1900, 1940–1955, and 1965–1975, while a lack of relationships was found centered on the periods 1910–1935 and 1978–2000 (Fig. 6c).
A high percentage of the variability in the recorded precipitation reconstruction and the SSTs_N3 is dominated by oscillation modes at decadal (Fig. 6d) and inter-annual (Fig. 6e, f) frequencies. Correlation analyses among the main dominant oscillatory modes of the precipitation reconstruction and the SSTs_N3 at decadal (Fig. 6d) and inter-annual (Fig. 6e, f) frequencies showed significant negative correlations. These results highlight the occurrence of common waveforms and demonstrate the ENSO signal in the precipitation reconstruction from the northern South American Altiplano.
3.6 Comparisons among hydroclimatic tree-ring-based reconstructions in the Altiplano
The NDJ precipitation reconstruction was compared with independent multi-century tree-ring-based hydroclimate reconstructions from three different regions in the South American Altiplano. The comparison correlations between our reconstruction and the three hydroclimate reconstructions generated using independent tree-ring records were significant (Fig. 7). This agreement among the reconstructions, regardless of the different season, reflects a strong co-variability in inter-annual and decadal hydroclimate fluctuations over the entire South American Altiplano from north to south during the past 4 centuries (Fig. 7). All four reconstructions show the occurrence of a period with inter-annual oscillations embedded in slightly wetter long-term conditions during the period ∼ 1625–1750. An extended period with generalized dry conditions from ∼ 1780 to 1810 was followed by very wet years between ∼ 1820–1850. Dry conditions were documented in all four reconstructions during the mid-1920s and 1930s. However, the wet period recorded during the 1940s and 1950s by the northern Altiplano reconstruction presented here represents one of the two wettest events in this new record and does not seem to be detected by the three other reconstructions located in southern localities (Fig. 7). Remarkably, the long-term interval with persistent droughts recorded during the last 3 decades of the 20th century and beginning of the 21st century is consistently observed in all the tree-ring-based hydroclimatic records in the Altiplano, representing the period recording the most severe drought conditions over the entire centennial time span for each of the hydroclimate reconstructions (Fig. 7).
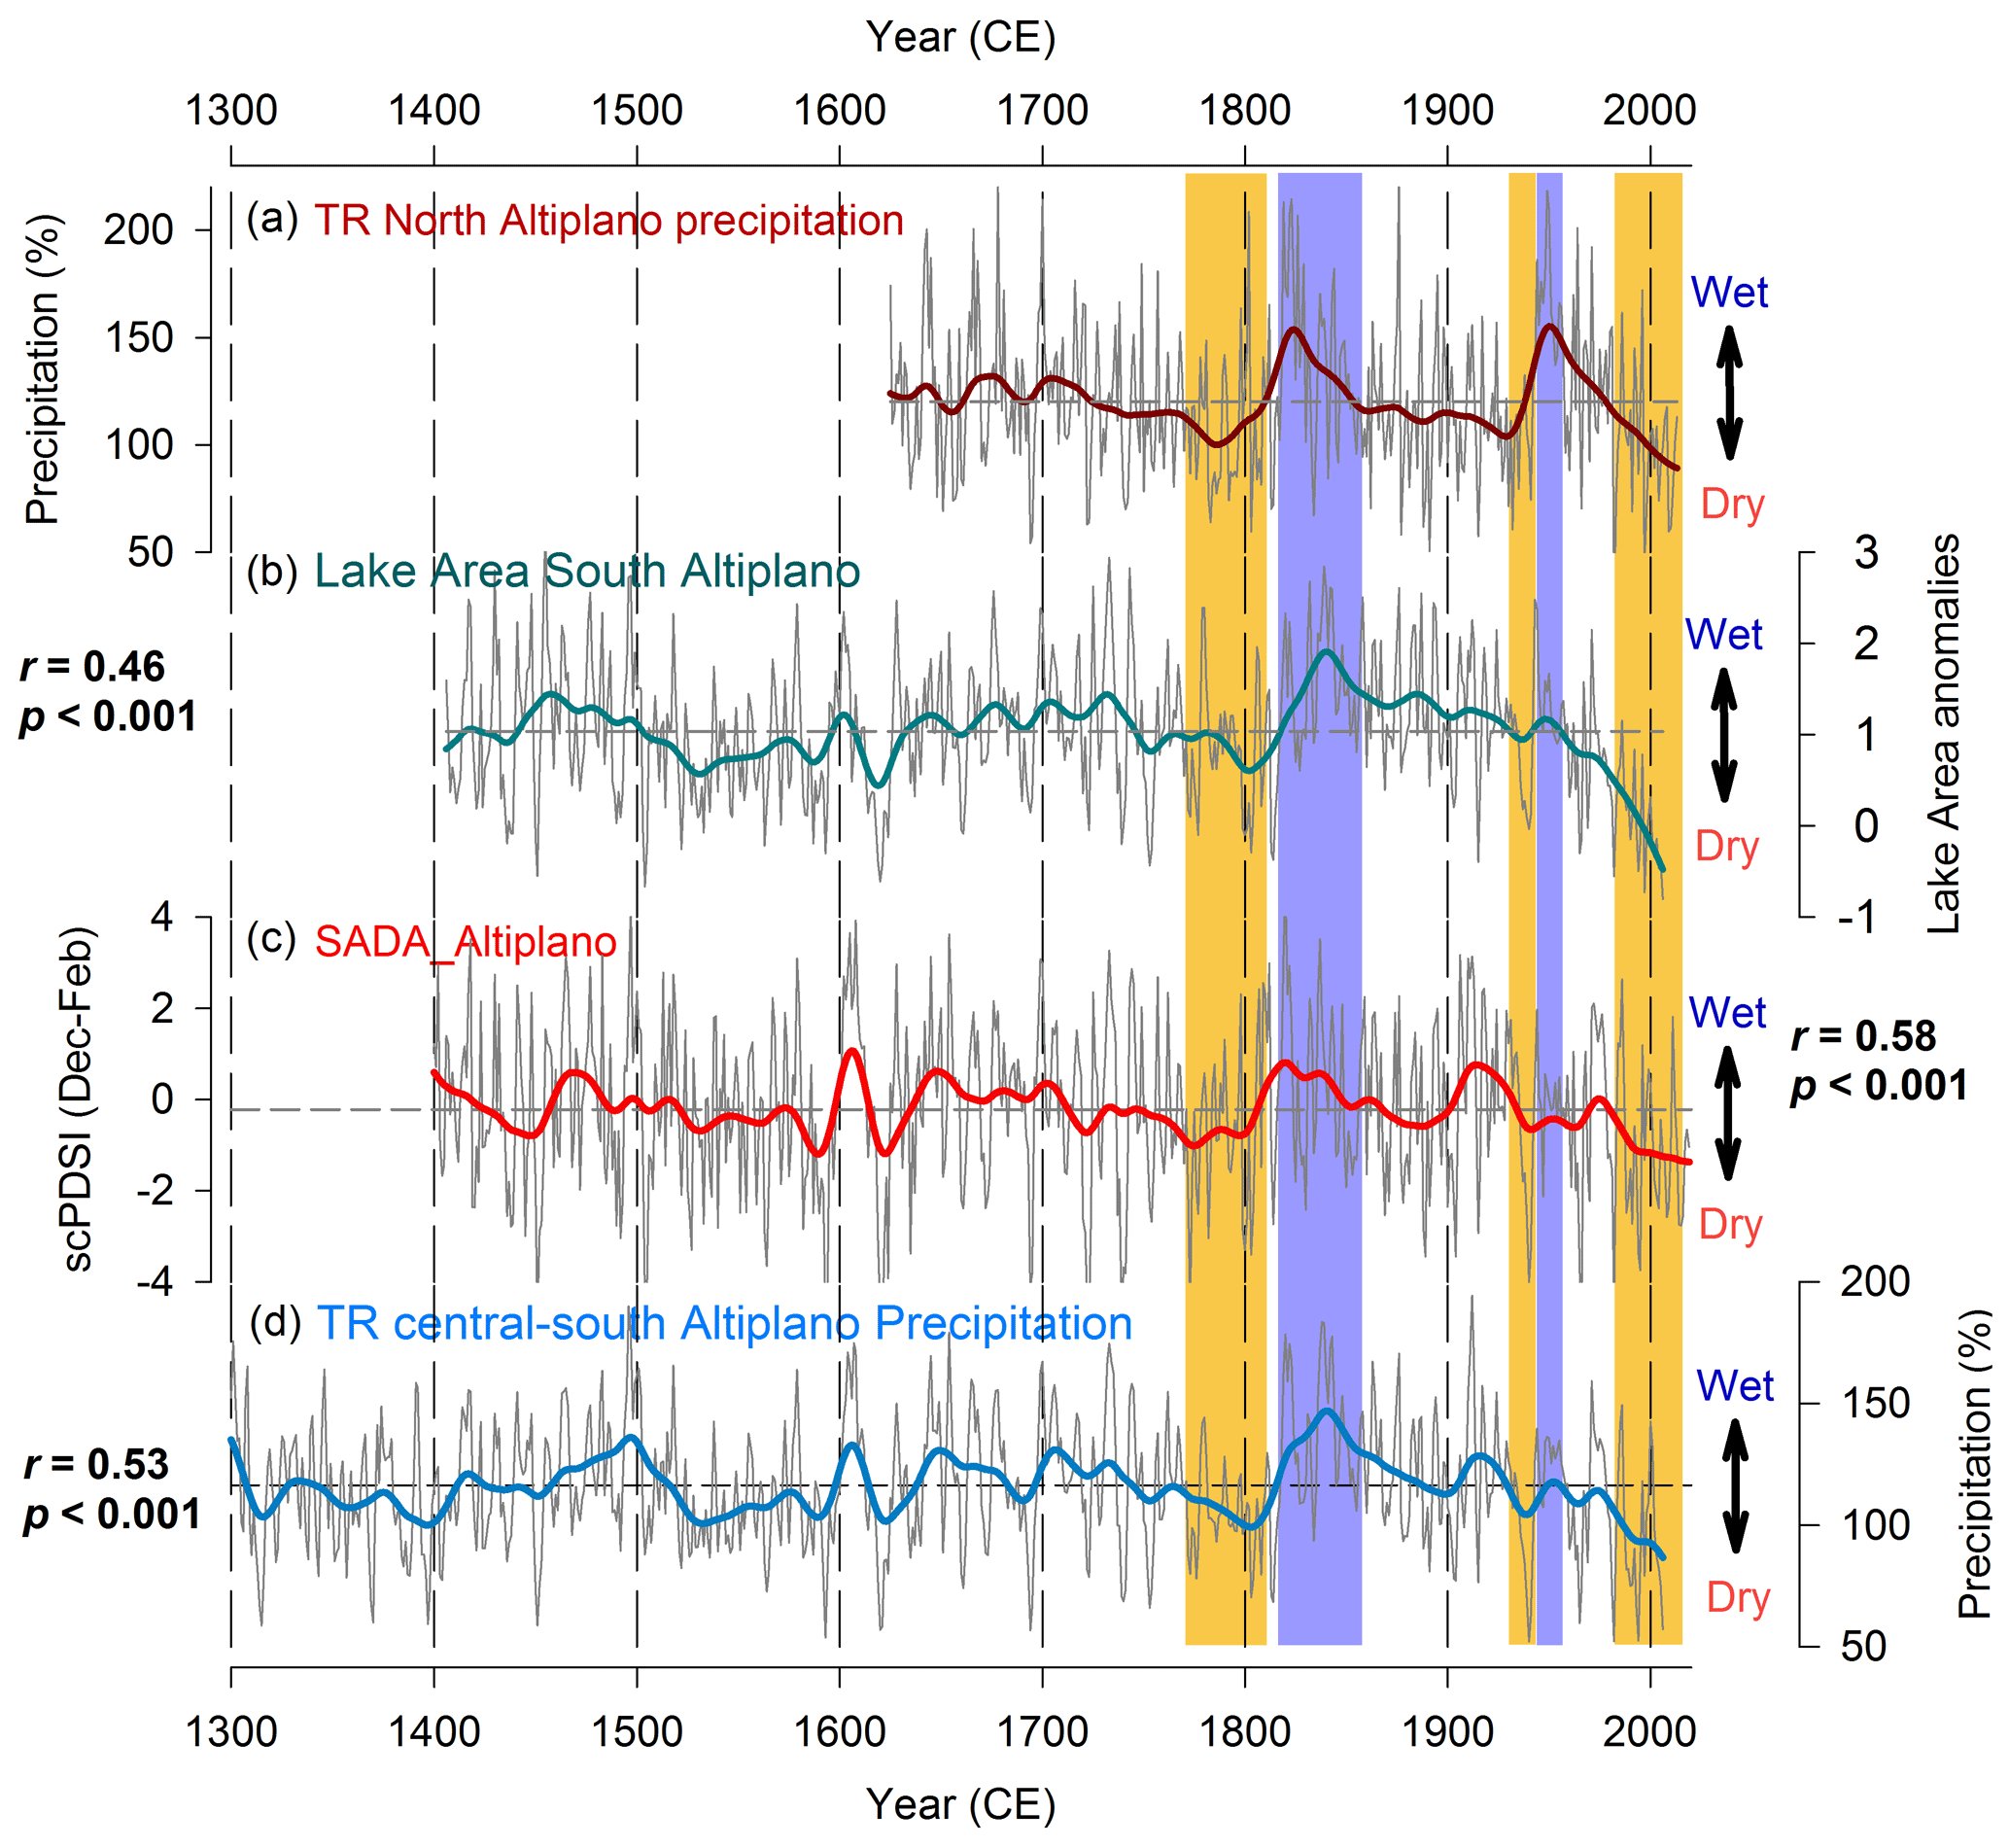
Figure 7Comparison among four hydroclimate tree-ring-based reconstructions from the South American Altiplano. From top to bottom: (a) precipitation from the northern sector of the Altiplano (this study), (b) lake area variations from the southwestern Altiplano, (c) scPDSI from the entire Altiplano (17–23∘ S, 66–70∘ W), and (d) precipitation from the central and southern Altiplano. Shaded background represents long-term drought (yellow) and wet period (light blue) coincidences among the four reconstructions. The 35-year smoothed spline (thick colored lines) highlights the multi-decadal variability in the four hydroclimate tree-ring-based reconstructions. Correlation coefficients (r and p values) between the northern Altiplano precipitation reconstruction and each hydroclimatic reconstruction are indicated with black numbers in their corresponding panels for the common period (1625–2008).

Figure 8Comparison among four hydroclimate reconstructions from the central and southern sectors of the tropical Andes. The 35-year smoothed spline (thick colored lines) highlights the multi-decadal variability in the four paleoenvironmental records. From top to bottom: (a) precipitation from the northern sector of the Altiplano (this study); (b) the stable oxygen isotope (δ18O) record from the Quelccaya ice core, Peru (Thompson et al., 2006); (c) the δ18O stable isotope record from Pumacocha lake sediment, Peru (Bird et al., 2011); and (d) the composite scPDSI from the entire Altiplano (17–23∘ S, 66–70∘ W, Steiger et al., 2018). Shaded background represents drought period (yellow) shared among the four reconstructions.
In Fig. 8 we compare the multi-decadal variation in the NDJ precipitation reconstruction from the northern Altiplano with hydroclimatic records from the tropical Andes, namely the δ18O record from the Quelccaya ice core, the δ18O record from Pumacocha lake sediment, and the composite scPDSI reconstruction from the entire Altiplano extracted from a PHYDA product. The four paleoenvironment records showed high variability with respect to the alternation of wet and dry periods. However, we observed a great consistency among all the records analyzed from the Altiplano and tropical Andes with respect to the dry conditions since ∼1970 (Fig. 8). This level of spatial synchrony of a prolonged period of drought condition is practically not observed in previous centuries.
Here, we present the first tree-ring-based reconstruction of precipitation variations over the last 4 centuries for the northern South American Altiplano region. This study provides new insights into the climatic variability in the tropical Andes based on the analysis of 389 years of rainfall in a region lacking long-term local meteorological records. To develop this reconstruction we used 132 tree-ring series from P. tarapacana, a species characterized by its high sensitivity to local and regional hydroclimatic variations (Argollo et al., 2004; Morales et al., 2004, 2012, 2015; Christie et al., 2009; Solíz et al., 2009; Crispín-DeLaCruz et al., 2022). This newly developed precipitation reconstruction allows us to explore the evolution, periodicities, and trends of rainfall variability over the last 4 centuries, as well as changes in the occurrence rate of extremely dry and wet years within a multi-century perspective for the northern region of the Altiplano.
The regression model used to develop the reconstruction explains 42.5 % of the total variance of the late-spring (November) to the mid-summer (January) precipitation for the 1970–2010 calibration period. This value is lower than that previously reported for a tree-ring-based precipitation reconstruction in the central-southern Altiplano (R2=0.56; Morales et al., 2012). A lower sample size of trees used to generate the northern regional chronology in comparison with the southern-central regional chronology could have influenced the relatively lower correlation obtained and highlights the importance of fieldwork expeditions to increase the number of centennial tree-ring chronologies in the northern sector of the Altiplano. The poor quality, low spatial coverage, and brevity of the climate instrumental records could also affect the climate–growth relationships used to develop the reconstruction model. Other factors such as differences in hydroclimate conditions prevailing throughout the entire Altiplano and/or species sensitivity to precipitation should also be considered to be potential causes for the observed difference in R2. In the northern Altiplano, rainfall is almost double that recorded in the southern region (i.e., 300–400 mm vs. 100–200 mm, respectively; Crispín DeLaCruz et al., 2021). Therefore, precipitation at our study site would be less limiting for tree growth than in the drier southern regions of the Altiplano (Solíz et al., 2009; Rodríguez-Catón et al., 2021). While rainfall explains a high percentage of the total variance of radial growth, temperature variations could also play a secondary role via evapotranspiration, which regulates stomatal aperture and carbon fixation for P. tarapacana growth as suggested by Rodríguez-Catón et al. (2021).
Prolonged dry periods in our reconstruction, such as those recorded in 1782–1797, 1926–1941, and 1997–2013, highlight the existence of decadal droughts in the northern South American Altiplano sector. Similarly, prolonged wet conditions were reconstructed across this region during the periods 1818–1832 and 1938–1957. Most dry and wet periods recorded in our reconstruction are consistent with those documented in a tree-ring-based precipitation reconstruction for the central and southern Altiplano region (Fig. 7; Morales et al., 2012) and lake area size reconstruction for the southwestern Altiplano (Morales et al., 2015), as well as a scPDSI reconstruction averaged for the entire Altiplano region (Morales et al., 2020). This indicates the existence of a common temporal pattern of hydroclimate variability across the South American Altiplano region. Nonetheless, our newly developed northern record has revealed important regional differences, such as more pronounced humid conditions during the period 1938–1957 than reported for the central and southern sectors of the Altiplano (Fig. 7; Morales et al., 2012, 2015, 2020).
The first half of the 19th century recorded one of the wettest periods over the past 389 years, consistent with the wet conditions identified in the other three tree-ring-based hydroclimatic reconstructions from different regions of the Altiplano. Similarly, other lower-resolution environmental proxies such as the speleothem record from eastern Bolivian Andes caves (Apaéstegui et al., 2018), the sediment core from the peat accumulation wetland at Cerro Tuzgle (Schitteck et al., 2016), and environmental records derived from deposits of rodent plant debris in the Andean foothills of the northern Atacama Desert in Chile (Mujica et al., 2015) also pointed out the occurrence of this extremely pluvial period during the 19th century. This pluvial maximum coincides with a significant population increase among the Aymara people from the Tarapacá region in the Chilean Altiplano (Lima et al., 2016), which would have been favored by increased productivity in their agropastoral system as a result of favorable wet conditions. The wettest year recorded in our reconstruction is 1876, which is associated with the occurrence of a prolonged cool phase of the central tropical Pacific during 1870–1876 (La Niña conditions), the year 1876 being the coldest SST record (Singh et al., 2018). These cool-La Niña-phase conditions reversed to warm SSTs during the strong 1877/1878 El Niño event (Singh et al., 2018), which is registered in our precipitation reconstruction as an extremely dry year in 1877.
In a long-term context, the northern Altiplano precipitation reconstruction recorded a sustained negative trend since the mid-1970s, with the period 1997–2013 being the driest in the last 389 years. Consistent with this pattern, reconstructions of south-central Altiplano rainfall, lake size in the southwest, and mean scPDSI for the entire Altiplano also highlight the occurrence of these arid conditions during the late 20th–early 21st century (Fig. 7). These negative trends in the hydroclimate were concurrent with the rapid retreat of glaciers across the tropical Andes observed during the second half of the 20th century (Ramírez et al., 2001; Francou et al., 2003; Vuille et al., 2008; Jomelli et al., 2009). In addition, this abrupt change towards more arid conditions from the 1970s onwards was also recorded in the Quelccaya ice core (Thompson et al., 2006), the Pumacocha sediments (Bird et al., 2011), and the Paleo Hydrodynamics Data Assimilation (PHYDA; Steiger et al., 2018) for the Altiplano (17–23∘ S, 66–70∘ W; Fig. 8). Therefore, the multi-decadal negative trend observed in our precipitation reconstruction is consistent with other hydroclimatic reconstructions based on tree rings and other paleoclimatic proxies for the region. Nonetheless, there are some inconsistencies with studies using short instrumental precipitation records. Segura et al. (2020), based on instrumental satellite precipitation data for the southern region of the tropical Andes (12–20∘ S, 60–80∘ W), evaluate the common pattern of summer rainfall variation for this region during the period 1982–2018. They identified a positive trend especially after 2010, which would be influenced by upward motion over the western Amazon. This study included our study area, but the much larger domain used in the Segura et al. (2020) study may not fully represent the local rainfall variations from our study area. This difference between trends could also result from the distinct time span of the instrumental records used. Because trends are timescale-dependent, comparing instrumental precipitation over the recent decades with long-term paleoclimate records provides a more comprehensive perspective than assessing trends for only the past few decades in isolation.
In the context of the last 4 centuries of hydroclimatic variability provided by our reconstruction, the severe aridity conditions since the late 20th century are unprecedented. Due to its large spatial extent and temporal synchronicity, this extraordinarily dry event across the Altiplano may be modulated by the action of large-scale atmospheric and oceanic forcings common to the entire region such as zonal wind and ENSO variability. Previous studies show that the intensity of the summer (DJF)-mean zonal winds at 200 hPa are negatively related to precipitation in the Altiplano (Minvielle and Garreaud, 2011; Neukom et al., 2015; Díaz and Vera, 2018; Morales et al., 2018). The recent increase in aridity conditions recorded in the paleorecords from the southern tropical Andes is in agreement with these studies, showing a strengthening of upper-tropospheric westerly winds during the last decades of the 20th century and early 21st century. Modeling exercises by Neukom et al. (2015) project an intensification of the westerlies during the 21st century, which in turn would be strongly associated with a decrease in precipitation over the central Andes.
Regarding ENSO, Li et al. (2013) reported an activity increase at the end of the 20th century that was anomalously high compared to the previous 7 centuries. It is documented that ENSO strongly influences circulation patterns over the study area (Vuille et al., 2000; Garreaud and Aceituno, 2001); thus an increase in ENSO activity could lead to stronger westerly zonal winds and less moisture input from the eastern tropical lowlands, generating drier conditions in the central Andes. Variations in rainfall in the Altiplano are also related to changes in SASM (Vera et al., 2006) as illustrated by high-resolution isotopic proxies that reported drought conditions in the Altiplano associated with a weakening of SASM during the last decades (Vuille et al., 2012).
The Blackman–Tukey spectral density analyses demonstrated that the rainfall reconstruction shares strong inter-annual periodicities with the instrumental precipitation index. At an inter-annual frequency band, the dominant oscillatory modes found for the northern Altiplano precipitation are consistent with modes described in hydroclimatic reconstructions developed for the central and southern Altiplano (Morales et al., 2012, 2015), while sub-decadal and multi-decadal periodicities were important but not significant, such as in the previous two reconstructions. The main waveforms of variability that compound the northern Altiplano NDJ precipitation reconstruction showed non-stationary cycles in precipitation during the last 389 years. The 17 % of the rainfall variance was associated with the oscillatory mode of a 3.1–3.9-year cycle that exhibits some peculiar cyclic properties, showing the highest amplitude cycles over the late 1700s through the 1800s and some periods of the 1900s. In contrast, the amplitude variability in the waveform decreased in the period 1920–1960, which is consistent with the low amplitude variability in the central and southern Altiplano hydroclimatic reconstructions (Morales et al., 2012, 2015), which has been associated with low ENSO activity reported during the same period (Torrence and Wester, 1999).
The northern Altiplano rainfall reconstruction shows consistent spatial patterns with rainfall across the entire Altiplano and the south-central Andes, but also with the equatorial region of Brazil and the core sector of maximum monsoon convection activity, which reflects the SASM influences over the northern Altiplano precipitation. Regarding the influence of tropical Pacific SST, while a strong influence of the NIÑO 3 sector was detected in the northern reconstructed precipitation the central and southern rainfall reconstructions were mostly linked with SSTs from the NIÑO 3.4 sector (Morales et al., 2012, 2015). This could be a consequence of a latitudinal rainfall gradient along the Altiplano associated with the spatial pattern variability in the tropical Pacific SSTs. Both the reconstructed rainfall and the SSTs_N3 shared spectral properties at decadal, sub-decadal, and inter-annual variability that demonstrate the ENSO signal imprints in precipitation at different timescales. A high consistency was observed in the amplitude changes in the main oscillatory modes of decadal and inter-annual variability between reconstructed precipitation and SSTs_N3, reflecting the instability of ENSO's influence on local precipitation.
This new precipitation reconstruction provides a long-term context for our present understanding of hydroclimate extremes in this region and identifies an increase in the occurrence rate of extreme droughts since the mid-20th century. Climate change is already affecting extreme events across the globe (IPCC, 2021), and the northern Altiplano is not an exception. According to our reconstruction, since the 1990s the occurrence of 1 extremely dry year is every 9 to 10 years, which is an occurrence rate from 2 to 3 times higher than during the 19th, 18th, and 17th centuries. The instrumental regional precipitation index developed in this study shows a mean condition value (100 % with respect to 1982–2013) that represents 20 % less precipitation than the reconstructed mean (120 % with respect to 1625–2013). Therefore, the period corresponding to the instrumental data can be considered dry in relation to the last 389 years of the precipitation record.
Droughts are of particular relevance in climate variability for this semi-arid region of the Andes. Therefore, the information provided by this study allows us to understand that mean dry conditions dominate the instrumental period, and the frequency of occurrence of extreme drought events in the present has no precedent in the past. Under a global warming context, the Altiplano's water resources are fundamental for biodiversity conservation and socioeconomic activities. The projected increase in evapotranspiration as a result of global warming, together with a wide range of variability among the precipitation models projected for the 21st century, may lead to growing demand for water in a region already under water stress. Knowing the current hydroclimatic situation in this region, we need to consider whether the current configuration of social and organizational structures is sufficient to provide the resilience and adaptation to successfully address current and future hydroclimatic changes. A better understanding of the future of the Altiplano's water resources should be listed as a priority for stakeholders and decision-makers to avoid social conflicts at both the local and regional levels. Under this complex political, social, and environmental scenario, the results from our study are relevant to plan and implement adaptive strategies to reduce these vulnerabilities in the face of future water shortages.
In this study we developed the first tree-ring reconstruction of late-spring–mid-summer precipitation for the northern South American Altiplano. Our reconstruction covers the last 389 years and extends dendroclimatological studies northward in the tropical Andes, filling a gap in paleoclimatic information at low latitudes.
Our study provides an overview of the hydroclimate of the northern South American Altiplano through the identification of long-term wet and dry periods and the temporal evolution of annual precipitation during the last ∼4 centuries. In addition, the secular and inter-annual dominant oscillatory modes in precipitation were identified.
Extremely dry years have been more frequent during the second half of the 20th century in the northern Altiplano within the context of the last 389 years. This is in agreement with the reported increase in the occurrence of extreme-dry-event years in other regions across the Andes.
Persistent periods of drought/wet conditions over the past 389 years are highly consistent with evidence provided by independent paleoclimatic records available for the Altiplano. Our study revealed a strong common temporal and spatial synchrony of drought conditions since the 1980s recorded by different tree-ring-based hydroclimate reconstructions across the Altiplano region and by other paleo-proxies for hydroclimate variability from the southern tropical Andes.
Our 389-year-long rainfall perspective allows us to evaluate the 1970–2019 period covered by the instrumental records in this region of the Andes in a multi-century context. A shift to dry conditions in our precipitation reconstruction since the mid-1970s suggests that the 49-year interval of instrumental records coincides with this multi-decadal dry period in the northern Altiplano. This suggests that the mean condition of this recent period has lower precipitation amounts than the historical mean, and thus it is not fully representative of the natural envelope of the precipitation regime in this Andean region observed during the last centuries.
The Polylepis tarapacana composite tree-ring chronology and the first three principal components used as predictors in the reconstruction model are stored as the file assets_1_crnreglags_PCs.xls. Also, the instrumental and reconstructed precipitation dataset for the northern South American Altiplano, as well as all the data used to develop Figs. 2, 3, and 4, are stored as the file assets_2_Rec_instr_precipitation_L5O.xls. Both file assets are deposited at https://doi.org/10.5281/zenodo.6467673 (Morales et al., 2023).
MSM, EJR-R, DAC, LA-H, RV, and MEF designed research; MSM, EJR-R, and DAC collected samples; MSM performed research; DBCDLC, CA, DAC, and EJR-R provided tree-ring measurements and interpretation; MSM, DBCDLC, AG, RL-M, GT-O, JS-F, and EJR-R analyzed data; MSM wrote the paper; DAC, RV, MEF, and LA-H reviewed and edited versions of the paper.
The contact author has declared that none of the authors has any competing interests.
Publisher’s note: Copernicus Publications remains neutral with regard to jurisdictional claims in published maps and institutional affiliations.
We acknowledge the Dirección General de Aguas and Dirección Meteorológica de Chile in Chile and Servicio Nacional de Meterología e Hidrología in Bolivia and Peru for providing quality-controlled daily and monthly climate data, which were essential for developing the reconstruction model. We acknowledge the Chilean Forest Service CONAF for permission to collect the tree-ring samples in Las Vicuñas National Reserve. The constructive comments of two anonymous reviewers significantly improved the quality of this paper. We thank the co-editors-in-chief of Climate of the Past for considering the award of a full-waiver grant to publish this article in the Climate of the Past journal.
This study was supported by the Fondo Nacional de Desarrollo Científico, Tecnológico y de Innovación Tecnológica, Peru (FONDECYTBM-INC.INV 039-2019). Laia Andreu-Hayles and Mariano S. Morales were supported by US National Science Foundation (NSF) grants AGS-1702789, AGS-1903687, and OISE-1743738 and by the THEMES project funded by the BNP Paribas Foundation in the frame of its “Climate Initiative” program. Mariano S. Morales, M. Eugenia Ferrero, and Ricardo Villalba were supported by the Agencia Nacional de Promoción Científica y Tecnológica, Argentina (PICT 2013-1880), and ConsejoNacional de Investigaciones Científicas y Tecnológicas (PIP20 11220130100584) projects. Duncan A. Christie was supported by FONDECYT 1201411, FONDAP 1522A0001, and ANID/BASALFB210018. Claudio Álvarez was supported by ANID-PFCHA/Doctorado Nacional/2018-21181009. M. Eugenia Ferrero was partially supported by ANPCyT-PICT-2019-01336. Doris B. Crispín-DelaCruz, was partially supported by the Fundação de Amparo à Ciência e Tecnologia do Estado de Pernambuco – FACEPE (Process IBPG-1418-5.00/21).
This paper was edited by Keely Mills and reviewed by two anonymous referees.
Adler, R. F., Sapiano, M., Huffman, G. J., Wang, J.-J., Gu, G., Bolvin, D., Chiu, L., Schneider, U., Becker, A., Nelkin, E., Xie, P., Ferraro, R., and Shin, D.-B.: The Global Precipitation Climatology Project (GPCP) Monthly Analysis (New Version 2.3) and a Review of 2017 Global Precipitation, Atmosphere, 9, 138, https://doi.org/10.3390/atmos9040138, 2018.
Apaéstegui, J., Cruz, F. C., Vuille, M., Fohlmeistere, J., Espinoza, J. C., Sifeddine, A., Strikis, N., Guyot, J. L, Ventura, R., Cheng, H., and Edwards, R. L.: Precipitation changes over the eastern Bolivian Andes inferred from speleothem (δ18O) records for the last 1400 years, Earth. Planet. Sc. Lett., 494, 124–134, 2018.
Argollo, M., Solíz, C., and Villalba, R.: Potencialidad dendrocronológica de Polylepis tarapacana en los Andes centrales de Bolivia, Ecol. Bol., 39, 5–24, 2004.
Bennett, M., New, M., Marino, J., and Sillero-Zubiri, C.: Climate complexity in the Central Andes: A study case on empirically based local variations in the Dry Puna, J. Arid Environ., 128, 40–49, 2016.
Binford, M. W., Kolata, A. L., Brenner, M., Janusek, J. W., Seddon, M. T., Abbott, M. B., and Jason, H.: Climate variation and the rise and fall of an Andean civilization, Quaternary Res., 47, 235–248, 1997.
Bird, W. B., Abbott, M. B., Vuille M., Rodbell, D. T., Stansella, N. D., and Rosenmeier, M. F.: A 2,300-year-long annually resolved record of the South American summer monsoon from the Peruvian Andes, P. Natl. Acad. Sci. USA, 108, 8583–8588, https://doi.org/10.1073/pnas.1003719108, 2011.
Bradley, R. S., Vuille, M., Hardy, D., and Thompson, L. G.: Low latitudeice cores record Pacific sea surface temperatures, Geophys. Res. Lett., 30, 1174, https://doi.org/10.1029/2002GL016546, 2003.
Bradley, R. S., Vuille, M., Diaz, H. F., and Vergara, W.: Threats towater supplies in the tropical Andes, Science, 312, 1755–1756, https://doi.org/10.1126/science.1128087, 2006.
Briffa, K. R.: Interpreting high-resolution proxy climate data. The example of dendroclimatology, in: Analysis of climate variability, applications of statistical techniques, edited by: von Storch, H. and Navarra, A., Springer Verlag, Berlin, 77–94, ISBN 978-3-662-03167-4, 1995.
Buytaert, W. and De Bièvre, B.: Water for cities: The impact of climate change and demographic growth in the tropical Andes, Water Resour. Res. 48, 1–13, 2012.
Christie, D. A., Lara, A., Barichivich, J., Villalba, R., Morales, M. S., and Cuq, E.: El Niño-Southern Oscillation signal in the world's high-elevation tree-ring chronologies from the Altiplano, Central Andes, Palaeogeogr. Palaeocl. Palaeoecol., 281, 309–319, 2009.
Cook, E. R., Krusic, P. J., Peters, K., and Melvin, T.: Program Signal Free (v45), RCS Signal Free tree–ring standardization program. Tree–Ring Laboratory of Lamont–Doherty Earth Observatory, https://www.ldeo.columbia.edu/tree-ring-laboratory/resources/software (last access: 15 March 2022), 2017.
Cooley, W. W. and Lohnes, P. R.: Multivariate data analysis, John Wiley & Son, New York, https://doi.org/10.1002/bimj.19730150413, 1971.
Cowling, A., Hall, P., and Phillips, M. J.: Bootstrap confidence regions for the intensity of a Poisson point process. J. Am. Stat. Assoc. 91, 1516–1524, 1996.
Crispín-DelaCruz, D., Morales, M. S, Andreu-Hayles, L., Christie, D. A., Guerra, A., and Requena-Rojas, E. J.: High ENSO sensitivity in tree rings from a northern population of Polylepis tarapacana in the Peruvian Andes, Dendrochronologia, 71, 1–11, https://doi.org/10.1016/j.dendro.2021.125902, 2021.
Díaz, L. B. and Vera, C. S.: South American precipitation changes simulated by PMIP3/ CMIP5 models during the Little Ice Age and the recent global warming period, Int. J. Climatol., 38, 2638–2650, https://doi.org/10.1002/joc.5449, 2018.
Draper, N. R. and Smith, H. (Eds.): Applied Regression Analysis, John Wiley & Son, New York, ISBN 9781118625682, 1981.
Falvey, M. and Garreaud, R.: Moisture variability over the South American Altiplano during the SALLJEX observing season, J. Geophys. Res., 110, D22105, https://doi.org/10.1029/2005JD006152, 2005.
Francou, B., Vuille, M., Wagnon, P., Mendoza, J., and Sicart, J. E.: Tropical climate change recorded by glacier in the central Andes during the last decades of the twentieth century: Chacaltaya, Bolivia, 16∘ S, J. Geophys. Res., 108, 4154, https://doi.org/10.1029/2002JD002959, 2003.
Fritts, H. C. (Ed.): Tree rings and climate, Academic Presss, London, ISBN 9780323145282, 1976.
Garcia, M., Raes, D., and Jacobsen, S. E.: Reference evapotranspiration and crop coefficient of quinoa (Chenopodium quinoa Willd) in the Bolivian Altiplano, Agr. Water Manage., 60, 119–134, 2003.
Garcia, M., Raes, D., Jacobsen, S. E., and Michel, T.: Agroclimatic constraints for rainfed agriculture in the Bolivian Altiplano, J. Arid. Environ., 71, 109–121, 2007.
García-Plazaola, J. I, Rojas, R., Christie, D. A., and Coopman, R. E.: Photosynthetic responses of trees in high-elevation forests: comparing evergreen species along an elevation gradient in the Central Andes, AoB Plants 7, 1–13, 2015.
Garreaud, R. D.: Multiscale analysis of the summertime precipitation over the central Andes, Mon. Weather Rev. 127, 901–921, https://doi.org/10.1175/1520-0493(1999)127<0901:MAOTSP>2.0.CO;2, 1999.
Garreaud, R. and Aceituno, P.: Interannual rainfall variability overthe South American Altiplano, J. Climate, 14, 2779–2789, https://doi.org/10.1175/1520-0442(2001)014<2779:IRVOTS>2.0.CO;2, 2001.
Garreaud, R., Vuille, M., and Clement, C.: The climate of the Altiplano: Observed current conditions and mechanisms of past changes, Palaeogeogr. Palaeocl. Palaeoecol., 194, 5–22, https://doi.org/10.1016/S0031-0182(03)00269-4, 2003.
Garreaud, R. D., Vuille, M., Compagnucci, R., and Marengo, J.: Present day South American climate, Paleoclim. Palaeogeogr. Palaeocl., 281, 180–195, 2009.
Gordon, G.: Verification of dendroclimatic reconstructions, in: Climate from Tree Rings, edited by: Hughes, M. K., Kelly, P. M., Pilcher, J. R., and LaMarche Jr., V. C., Cambridge University Press, 58–61, 1982.
Holmes R. L.: Computer-assisted quality control in tree-ring dating and measurement, Tree-Ring Bulletin, 43, 69–78, 1983.
Huerta, A. and Lavado-Casimiro, W.: Trends and variability of precipitation extremes in the Peruvian Altiplano for the period 1971–2013, Int. J. Climatol., 41, 513–528, https://doi.org/10.1002/joc.6635, 2021.
Hunziker, S., Brönnimann, S., Calle, J., Moreno, I., Andrade, M., Ticona, L., Huerta, A., and Lavado-Casimiro, W.: Effects of undetected data quality issues on climatological analyses, Clim. Past, 14, 1–20, https://doi.org/10.5194/cp-14-1-2018, 2018.
Imfeld, N., Sedlmeier, K., Gubler, S., Correa Marrou, K., Davila, C. P., Huerta, A., Lavado-Casimiro, W., Rohrer, M., Scherrer, S. C., and Schwierz, C.: A combined view on precipitation and temperature climatology and trends in the southern Andes of Peru, Int. J. Climatol. 41, 679–698, https://doi.org/10.1002/joc.6645, 2021.
IPCC: Masson-Delmotte, V., Zhai, P., Pirani, A., Connors, S. L., Péan, C., Berger, S., Caud, N., Chen, Y., Goldfarb, L., Gomis, M. I., Huang, M., Leitzell, K., Lonnoy, E., Matthews, J. B. R., Maycock, T. K., Waterfield, T., Yelekçi, O., Yu, R., and Zhou B. (Eds.): Climate Change 2021: The Physical Science Basis. Contribution of Working Group I to the Sixth Assessment Report of the Intergovernmental Panel on Climate Change, Cambridge University Press, ISBN 978-92-9169-158-6, 2021.
Jenkins, G. M. and Watts, D. G.: Spectral analysis and its applications, Holden-Day, San Francisco, ISBN 10 0816244642, 1968.
Jomelli, V., Favier, V., Rabatel, A., Brunstein, D., Hoffmann, G., and Francou, B.: Fluctuations of glaciers in the tropical Andes over the last millennium and palaeoclimatic implications: A review, Palaeogeogr. Palaeocl., 281, 269–282, 2009.
Jones, P. D. and Hulme, M.: Calculating regional climatic time series for temperature and precipitation: methods and illustrations, Int. J. Climatol., 16, 361–377, https://doi.org/10.1002/(SICI)1097-0088(199604)16:4<361::AID-JOC53>3.0.CO;2-F, 1996.
Jones, P. D., Briffa, K. R., Barnett, T. P., and Tett, S. F. B.: High-resolution palaeoclimatic records for the last millennium: interpretation, integration and comparison with General Circulation Model control-run temperaturas, The Holocene, 4, 455–471, https://doi.org/10.1191/095968398667194956, 1998.
Kistler, R., Kalnay, E., Collins, W., Saha, S., White, G., Woollen, J., Chelliah, M., Ebisuzaki, W., Kanamitsu, M., Kousky, V., Van Der Dool, H., Jenne, R., and Fiorino, M.: The NCEP-NCAR 50 year Reanalysis: Monthly Means CD-ROM and documentation, B. Am. Meteorol. Soc., 82, 247–267, 2001.
Lavado-Casimiro, W. S., Labat, D., Ronchail, J., Espinoza, J. C., and Guyot, J. L.: Trends in rainfall and temperature in the Peruvian Amazon-Andes basin over the last 40years (1965–2007), Hydrol. Process., 27, 2944–2957, https://doi.org/10.1002/hyp.9418, 2013.
Lenters, J. D. and Cook, K. H.: On the origin of the Bolivian Highand related circulation features of the South American climate, J. Atmos. Sci., 54, 656–677, https://doi.org/10.1175/1520-0493(1999)127<0409:SPVOSA>2.0.CO;2, 1997.
Li, J., Xie, S. P., Cook, E. R., Morales, M. S., Christie, D. A., Johnson, N. C., Chen, F., D’Arrigo, R., Fowler, A. M., Gou, X., and Fang, K.: El Niño modulations over thepast seven centuries, Nat. Clim. Chang. 3, 822–826, https://doi.org/10.1038/nclimate1936, 2013.
Lima L., Christie D. A., Calogero Santoro M., and Latorre C.: Coupled socio environmental changes triggered indigenous Aymara depopulation of the semiarid Andes of Tarapacá-Chile during the late 19th–20th centuries, PLoS ONE, 11, e0160580, https://doi.org/10.1371/journal.pone.0160580, 2016.
Marengo, J. A., Liebmann, B., Grimm, A. M., Misra, V., Dias, P. L. S., Cavalcanti, I. F. A., Carvalho, L. M. V., Berbery, E. H., Ambrizzi, T., Vera, C. S., Saulo, A. C., Nogues-Paegle, J., Zipser, E., Seth, A., and Alves, L. M.: Recent developments on the South American monsoon system, Int. J. Climatol., 32, 1–21, 2012.
Meko, D. M.: Dendroclimatic reconstruction with time varying subsets of tree indices, J. Climate, 10, 687–696, 1997.
Melvin, T. and Briffa K.: A “signal-free” approach to dendroclimatic standardization, Dendrochronologia, 26, 71–86, 2008.
Melvin, T. M.: Historical growth rates and changing climatic sensitivity of boreal conifers, Ph.D. thesis, University of East Anglia, Norwich, United Kingdom, https://crudata.uea.ac.uk/cru/pubs/thesis/2004-melvin/melvin-2004-thesis.pdf (last access: 8 February 2023), 2004.
Michaelsen, J.: Cross-validation in statistical climate forecast models, J. Clim. Appl. Meteorol., 26, 1589–1600, 1987.
Minvielle, M. and Garreaud, R.: Projecting rainfall changes over the South American Altiplano, J. Climate, 24, 4577–4583, 2011.
Mitchell Jr., J. M., Dzerdseevskii, B., Flohn, H., Hofmeyr, W. L., Lamb, H. H., Rao, N., and Wallen, C. C.: Climatic change,World Meteorological Organization, Geneva, https://library.wmo.int/doc_num.php?explnum_id=865 (last access: 8 February 2023), 1966.
Morales, M. S., Villalba, R., Grau, R., and Paolini, L.: Rainfall-controlled tree growth in high-elevation subtropical treelines, Ecology, 85, 3080–3089, https://doi.org/10.1890/04-0139, 2004.
Morales, M. S., Christie, D. A., Villalba, R., Argollo, J., Pacajes, J., Silva, J. S., Alvarez, C. A., Llancabure, J. C., and Soliz Gamboa, C. C.: Precipitation changes in the South American Altiplano since 1300 AD reconstructed by tree-rings, Clim. Past, 8, 653–666, https://doi.org/10.5194/cp-8-653-2012, 2012.
Morales, M. S., Carilla, J., Grau, H. R., and Villalba, R.: Multi-century lake area changes in the Southern Altiplano: a tree-ring-based reconstruction, Clim. Past, 11, 1139–1152, https://doi.org/10.5194/cp-11-1139-2015, 2015.
Morales, M. S., Christie, D. A., Neukom R, Rojas F, and Villalba R.: Variabilidad hidroclimática en el Sur del Altiplano: Pasado, presente y futuro, in: Serie Conservación de la Naturaleza 24: La Puna Argentina: Naturaleza y Sociedad, edited by: Grau, H. R., Babot, M. J., Izquierdo A. E., and Grau, A., Fundación Miguel Lillo, Tucumán, Argentina, 75–91, ISBN 978-950-668-032-9, 2018.
Morales, M. S., Cook, E. R., Barichivich, J., Christie, D. A., Villalba, R., LeQuesne, C., Srur, A. M., Eugenia Ferrero, M., González-Reyes, Á., Couvreux, F., Matskovsky, V., Aravena, J. C., Lara, A., Mundo, I. A., Rojas, F., Prieto, M. R., Smerdon, J. E., Bianchi, L. O., Masiokas, M. H., Urrutia-Jalabert, R., Rodriguez-Catón, M., Muñoz, A. A., Rojas-Badilla, M., Alvarez, C., Lopez, L., Luckman, B. H., Lister, D., Harris, I., Jones, P. D., Park Williams, A., Velazquez, G., Aliste, D., Aguilera-Betti, I., Marcotti, E., Flores, F., Muñoz, T., Cuq, E., and Boninsegna, J. A.: Six hundred years of South American tree rings reveal an increase in severe hydroclimatic events since mid-20th century, P. Natl. Acad. Sci. USA, 117, 16816–16823, https://doi.org/10.1073/pnas.2002411117, 2020.
Morales, M. S., De La Cruz, D. B. C., Álvarez, C., Duncan, A. C., Ferrero, E., Andreu-Hayles, L., Villalba , R., Guerra, A., Ticse-Otarola, G., Rodríguez-Ramírez, E., LLocclla Martínez, R., Sanchez-Ferrer, J., and Requena-Rojas, E. J.: Drought increased since the mid-20th century in the northern South American Altiplano revealed by a 389-year precipitation record, Zenodo [data set], https://doi.org/10.5281/zenodo.6467673, 2023.
Mudelsee, M.: Climate Time Series Analysis: Classical Statistical and Bootstrap Methods, Atmospheric and Oceanographic Sciences Library, Springer, Vol. 51, ISBN 978-3-319-04450-7, 2014.
Mudelsee, M., Borngen, M., Tetzlaff, G., and Grunewald, U.: No upward trends in the occurrence of extreme floods in central Europe, Nature, 425, 166–169, 2003.
Mujica, M. I., Latorre, C., Maldonado, A., González-Silvestre, L., Pinto, R., de Pol-Holz, R., and Santoro, C. M.: Late Quaternary climate change, relict populations and present-day refugia in the northern Atacama Desert: A case study from Quebrada La Higuera (18∘ S), J. Biogeogr., 42, 76–88, 2015.
Neukom R., Rohrer M., Calanca P., Salzmann N., Huggel C., Acuña D., Christie D. A., and Morales, M. S.: Facing unprecedented drying of the Central Andes? Precipitation variability over the period AD 1000–2100, Environ. Res. Lett., 10, 084017, https://doi.org/10.1088/1748-9326/10/8/084017, 2015.
Nielsen, A. E.: Asentamientos, conflicto y cambio social en el Altiplano de Lípez (Potosí, Bolivia), Revista Española de Antropología Americana, 32, 179–205, e-ISSN 1988-2718, 2002.
Núñez, L., Grosjean, M., and Cartagena, I.: Human occupations and climate change in the Puna de Atacama, Chile, Science, 298, 821–824, 2002.
Ramírez, E., Francou, B., Ribstein, P., Descloıtres, M., Guérin, R., Mendoza, J., Gallaire, R., Pouyaud, B., and Jordan, E.: Small glaciers disappearing in the tropical Andes, A case study in Bolivia: Glacier Chacaltaya (16∘ S), J. Glaciol., 47, 187–194, 2001.
Ramos-Calzado, P., Gómez-Camacho, J., Pérez-Bernal, F., and Pitta-Lopez, M. F.: A novel approach to precipitation series completion in climatological datasets: application to Andalusia, Int. J. Climatol, 2029, 2011–2029, https://doi.org/10.1002/joc.1657, 2008.
Rodríguez-Catón, M., Andreu-Hayles, L., Morales, M. S., Daux, V., Christie, D. A., Coopman, R. E., Alvarez, C., Rao, M. P., Aliste, D., Flores, F., and Villalba, R.: Different climate sensitivity for radial growth, but uniform for tree-ring stable isotopes along an aridity gradient in Polylepis tarapacana, the world's highest elevation tree-species, Tree Physiol, 41, 1353–1371, https://doi.org/10.1093/treephys/tpab021, 2021.
Schittek, K., Kock, S. T., Lücke, A., Hense, J., Ohlendorf, C., Kulemeyer, J. J., Lupo, L. C., and Schäbitz, F.: A high-altitude peatland record of environmental changes in the NW Argentine Andes (24∘ S) over the last 2100 years, Clim. Past, 12, 1165–1180, https://doi.org/10.5194/cp-12-1165-2016, 2016.
Schulman, E.: Dendroclimatic changes in semiarid America, Tucson, University of Arizona Press, https://www.cabdirect.org/cabdirect/abstract/19560601984 (last access: 8 February 2023), 1956.
Segura, H., Espinoza, J. C., Junquas, C., Lebel, T., Vuille, M., and Garreaud, R.: Recent changes in the precipitation-driving processes over the southern tropical Andes/western Amazon, Clim. Dynam., 54, 2613–2631, https://doi.org/10.1007/s00382-020-05132-6, 2020.
Seth, A., Thibeault, J., Garcia, M., and Valdivia, C.: Making sense of Twenty-First-Century climate change in the Altiplano: observed trends and CMIP3 projections, Ann. Assoc. Am. Geogr., 100, 835e847, https://doi.org/10.1080/00045608.2010.500193, 2010.
Singh, D., Seager, R., Cook, B. I., Cane, M., Mingfang, T., Cook, E., and Davis, M.: Climate and the Global Famine of 1876–78, J. Climate, 31, 9445–9467, 2018.
Solíz, C., Villalba, R., Argollo, J., Morales, M. S., Christie, D. A., Moya, J., and Pacajes, J.: Spatio-temporal variations in Polylepis tarapacana radial growth across the Bolivian Altiplano during the 20th century, Palaeogeogr. Palaeocl. Palaeoecol, 281, 296–330, 2009.
Štěpánek, P.: AnClim – software for time series analysis, Dept. of Geography, Fac. of Natural Sciences, Munich, http://www.climahom.eu/AnClim.html (last access: 10 March 2022), 2008.
Steiger, N. J., Smerdon, J. E., Cook, E. R., and Cook, B. I.: A reconstruction of global hydroclimate and dynamical variables over the Common Era, Sci. Data, 5, 180086, https://doi.org/10.1038/sdata.2018.86, 2018.
Stokes, M. A. and Smiley, T. L.: An introduction to tree-ring dating, University of Chicago Press, Chicago, ISBN 0-8165-1680-4, 1968.
Tandeter, E.: Crisis in Upper Peru, 1800–1805, HAHR-Hisp. Am. Hist. R., 71, 35–71, 1991.
Thompson, L. G., Mosley-Thompson, E., Brecher, H., Davis, M.,León, B., Les, D., Lin, P. N., Mashiotta, T., and Mountain, K.: Abrupt tropical climate change: Past and present, P. Natl. Acad. Sci. USA, 103, 10536–10543, https://doi.org/10.1073/pnas.0603900103, 2006.
Torrence, C. and Webster, P.: Interdecadal changes in the ENSO Monsoon system, J. Climate, 12, 2679–2690, https://doi.org/10.1175/1520-0442(1999)012<2679:ICITEM>2.0.CO;2, 1999.
Urrutia, R. and Vuille, M.: Climate change projections for the tropical Andes using a regional climate model: Temperature and precipitation simulations for the end of the 21st century, J. Geophys. Res., 114, D02108, https://doi.org/10.1029/2008JD011021, 2009.
Vautard, R.: Patterns in Time: SSA and MSSA, in: Analysis of climate variability. Applications of statistical techniques, edited by: von Storch, H. and Navarra, A., Springer, Berlin, 259–287, ISBN 978-3-662-03167-4, 1995.
Vautard, R. and Ghil, M.: Singular spectrum analysis in nonlinear dynamics, with applications to paleoclimatic time series, Physica D, 35, 395–424, 1989.
Vera, C., Higgins, W., Amador, J., Ambrizzi, T., Garreaud, R., Gochis, D., Gutzler, D., Lettenmaier, D., Marengo, J., Mechoso, C. R., Nogues-Paegle, J., Silva Dias, P. L., and Zhang, C.: Toward a unified view of the American Monsoon Systems, J. Climate, 19, 4977–5000, 2006.
Vuille, M.: Atmospheric circulation over the Bolivian Altiplano during dry and wet periods and extreme phases of the Southern Oscillation, Int. J. Climatol., 19, 1579–1600, https://doi.org/10.1002/(SICI)1097-0088(19991130)19:14<1579::AID-JOC441>3.0.CO;2-N, 1999.
Vuille, M. and Keimig, F.: Interannual variability of summertimeconvective cloudiness and precipitation in the central Andes derivedfrom ISCCP-B3 data, J. Climate, 17, 3334–3348, https://doi.org/10.1175/1520-0442(2004)017<3334:IVOSCC>2.0.CO;2, 2004.
Vuille, M., Bradley R. S., and Keimig F.: Interannual climate variabilityin the central Andes and its relation to tropical Pacific and Atlantic forcing, J. Geophys. Res., 105, 12, 447–460, 2000.
Vuille, M., Bradley, R. S., Werner, M., and Keimig, F.: 20th century climate change in the tropical Andes: Observations and model results, Clim. Change, 59, 75–99, 2003.
Vuille, M., Francou, B., Wagnon, P., Juen, I., Kaser, G., Mark, B., and Bradley, R.: Climate change and tropical Andean glaciers: Past, present and future, Earth-Sci Rev., 89, 79–96, 2008.
Vuille, M., Burns, S. J., Taylor, B. L., Cruz, F. W., Bird, B. W., Abbott, M. B., Kanner, L. C., Cheng, H., and Novello, V. F.: A review of the South American monsoon history as recorded in stable isotopic proxies over the past two millennia, Clim. Past, 8, 1309–1321, https://doi.org/10.5194/cp-8-1309-2012, 2012.
Vuille, M., Franquist, E., Garreaud, R., Lavado-Casimiro, W. S., and Cáceres, B.: Impact of the global warming hiatus on Andean temperature, J. Geophys. Res.-Atmos., 120, 3745–3757, https://doi.org/10.1002/2015JD023126, 2015.
Weisberg, S.: Applied Linear Regression, John Wiley & Son, New York, https://doi.org/10.1002/bimj.4710300746, 1985.
Wigley, T. M. L., Briffa, K. R., and Jones, P. D.: On the average value of correlated time series, with applications in dendroclimatology and hydrometeorology, J. Clim. Appl. Meterol., 23, 201–213, https://doi.org/10.1175/1520-0450(1984)023<0201:OTAVOC>2.0.CO;2, 1984.