the Creative Commons Attribution 4.0 License.
the Creative Commons Attribution 4.0 License.
 | 06 Jan 2023
A cosmogenic nuclide-derived chronology of pre-Last Glacial Cycle glaciations during MIS 8 and MIS 6 in northern Patagonia
Tancrède P. M. Leger
Andrew S. Hein
Ángel Rodés
Robert G. Bingham
Irene Schimmelpfennig
Derek Fabel
Pablo Tapia
The precise environmental mechanisms controlling Quaternary glacial cycles remain ambiguous. To address this problem, it is critical to better comprehend the drivers of spatio-temporal variability in ice-sheet evolution by establishing reliable chronologies of former outlet-glacier advances. When spanning multiple glacial cycles, such chronologies have the capacity to contribute to knowledge on the topic of interhemispheric phasing of glaciations and climate events. In southern Argentina, reconstructions of this kind are achievable, as Quaternary expansions of the Patagonian Ice Sheet have emplaced a well-preserved geomorphological record covering several glacial cycles. Moreover, robust ice-sheet reconstructions from Patagonia are powerful barometers of former climate change, as Patagonian glaciers are influenced by the Southern Westerly Winds and the Antarctic Circumpolar Current coupled to them. It is essential to better constrain former shifts in these circulation mechanisms as they may have played a critical role in pacing regional and possibly global Quaternary climate change. Here, we present a new set of cosmogenic 10Be and 26Al exposure ages from pre-Last Glacial Cycle moraine boulder, glaciofluvial outwash cobble, and bedrock samples. This dataset constitutes the first direct chronology dating pre-Last Glacial Maximum (LGM) glacier advances in northern Patagonia and completes our effort to date the entire preserved moraine record of the Río Corcovado valley system (43∘ S, 71∘ W). We find that the outermost margins of the study site depict at least three distinct pre-Last Glacial Cycle stadials occurring around 290–270, 270–245, and 130–150 ka. Combined with the local LGM chronology, we discover that a minimum of four distinct Pleistocene stadials occurred during Marine Isotope Stages 8, 6, and 2 in northern Patagonia. Evidence for Marine Isotope Stage 4 and 3 deposits were not found at the study site. This may illustrate former longitudinal and latitudinal asynchronies in the Patagonian Ice Sheet mass balance during these Marine Isotope Stages. We find that the most extensive middle-to-late Pleistocene expansions of the Patagonian Ice Sheet appear to be out of phase with local summer insolation intensity but synchronous with orbitally controlled periods of longer and colder winters. Our findings thus enable the exploration of the potential roles of seasonality and seasonal duration in driving the southern mid-latitude ice-sheet mass balance, and they facilitate novel glacio-geomorphological interpretations for the study region. They also provide empirical constraints on former ice-sheet extent and dynamics that are essential for calibrating numerical ice-sheet and glacial isostatic adjustment models.
- Article
(17173 KB) - Full-text XML
-
Supplement
(5494 KB) - BibTeX
- EndNote


Understanding the environmental mechanisms driving the Quaternary build-up and collapse cycles of Earth's major ice sheets remains a focus of ongoing research. Key to this research is the establishment of detailed chronologies offering direct dating of major ice-sheet expansion and recession events (Darvill et al., 2016). Numerical glacier chronologies are most informative when presenting unambiguous dating of ice-sheet margins spanning the entirety of the Last Glacial Cycle (LGC: ∼ 125–15 ka) and, ideally, earlier Quaternary glacial cycles (Kaplan et al., 2010; Schaefer et al., 2015). To the east of the Patagonian Andes, the Argentinian foreland contains one of the most complete and well-preserved sequences of Quaternary glacial deposits in the world (Clapperton, 1993). This unique geomorphological record provides the opportunity to reconstruct and date glacier fluctuations of the formerly 2500 km long (from north to south) Patagonian Ice Sheet (PIS) over several glacial cycles (Mercer, 1976; Hein et al., 2011). Furthermore, the PIS occupied a key mid-latitude position in the ocean-dominated Southern Hemisphere (SH) and was the only ice mass to fully intersect the precipitation-bearing Southern Westerly Wind belt, a fundamental feature of the southern mid-latitude climate system. Hence, reconstructing the timing of PIS expansion and recession events during several glacial cycles can provide a rare insight into southern mid-latitude Quaternary climate evolution (Davies et al., 2020).
Palaeo-climate proxy records such as those retrieved from ice- and ocean-sediment cores indicate that some of the most potent Quaternary cooling events occurred during the middle Pleistocene (Parrenin et al., 2013; Shakun et al., 2015), a period (∼ 800–130 ka; Hughes et al., 2020) characterised by 100 kyr pacing of glacial–interglacial cycles. Paradoxically, there is a dearth of directly dated terrestrial glacial records for these glacial events (Hughes et al., 2020). In Patagonia, bracketing ages for pre-LGC glaciations have been produced in some places (e.g. near Lago Argentino; 50.5∘ S) with 40Ar 39Ar dating, K-Ar dating, and palaeomagnetic measurements on lava flows interbedded between Pliocene/Pleistocene glacial till units (Mercer, 1976; Sylwan et al., 1991; Meglioli, 1992; Singer et al., 2004). For instance, Mercer (1976) used such methods to constrain the likely timing of the Greatest Patagonian Glaciation to between 1.2 and 1.0 Ma in the Río Gallegos (52∘ S) and Lago Buenos Aires (46.5∘ S) regions. While such studies have been instrumental in establishing the broad chronological framework for Patagonian glaciations (Rabassa and Coronato, 2009), direct numerical dating of individual outlet-glacier advances is now required to develop a detailed knowledge of pre-Last Glacial Maximum (LGM) and pre-LGC ice-sheet activity in Patagonia.
In Patagonia, direct numerical dating of pre-LGC glacial advances, achievable using terrestrial cosmogenic nuclide (TCN) surface exposure dating, has been limited to two valleys of eastern central Patagonia (Kaplan et al., 2005; Hein et al., 2009, 2011, 2017; Cogez et al., 2018). Throughout the rest of the southern mid-latitudes (23–66∘ S), terrestrial glacial records yielding TCN exposure ages that pre-date the LGC have been reported using moraine boulders in New Zealand (Putnam et al., 2013), the southern central Andes (Terrizzano et al., 2017), and Tasmania (Barrows et al., 2002; Kiernan et al., 2004, 2010, 2014, 2017; Colhoun and Barrows, 2011; Augustinus et al., 2017). Because pre-LGC moraines and boulders are often poorly preserved, the majority of these investigations have identified the approximate timing of individual pre-LGC glacial advances with small (n<5 per moraine) and scattered sets of ages. Consequently, robust and direct numerical chronologies of pre-LGC glacial expansion events remain particularly scarce in the southern mid-latitudes. Patagonian investigations have shown that TCN exposure dating can yield direct ages for the deposition of pre-LGC moraine-outwash complexes preserved in the Argentinian steppe (e.g. Hein et al., 2017). While moraine boulders are well suited to dating glacier advances of the LGC, Hein et al. (2009) revealed that it can be more appropriate to target outwash terraces in eastern Patagonia for dating pre-LGC glacial margins because their low-gradient surfaces are less prone to degradation via gravity-driven diffusion when compared to steep-sided and unconsolidated moraines. On pre-LGC moraines, such degradation more frequently causes moraine surface lowering and boulder exhumation post-deposition, leading to significant exposure-age scatter and underestimations of moraine formation age. In contrast, surface cobbles from well-preserved outwash plains tend to display comparatively less post-depositional scatter and are thought to date the glacial event more precisely (Hein et al., 2009). This approach has been used successfully to constrain the timing of glacial advances in several locations in central and southern Patagonia (Darvill et al., 2015; Hein et al., 2009, 2011, 2017; Mendelová et al., 2020). However, to date, no pre-LGC glacial events have been dated using this technique in northern Patagonia. Consequently, we adopt this approach here and target both moraine boulders and outwash surface cobbles to constrain the timing of pre-LGC glacial advances in northeastern Patagonia.
We focus our investigation on the Río Corcovado (RC) valley system (43∘ S; 71∘ W), formerly host to a major outlet glacier of the PIS in northeastern Patagonia (Caldenius, 1932). We present a multi-glacial-cycle 10Be and 26Al TCN exposure-age chronology from the three stratigraphically oldest glacial moraine/outwash complexes deposited by the RC outlet glacier. This study builds on our earlier work (Leger et al., 2020, 2021a, b) to compile a geochronological reconstruction that spans the entire preserved moraine-outwash record of the RC valley system. We use our cosmogenic nuclide-derived chronology to test whether major middle Pleistocene advances previously dated in central Patagonia (Hein et al., 2009, 2017) coincide with moraines found in its northeastern sector (this study), and thus whether such advances depict strong regional climate signals expressed across much of the palaeo-ice front. We then compare the different magnitudes of middle Pleistocene Patagonian glaciations relative to other formerly glaciated regions of the world and thereby assess the presence of former interhemispheric and inter-regional (a)synchronies in ice-sheet behaviour. Finally, we evaluate the synchronicity of PIS expansion events with other global and regional palaeo-climate proxy records and explore the potential roles of various insolation parameters in controlling middle-to-late Pleistocene climate variations in Patagonia and the southern mid-latitudes.
Our study site focuses on the ice-marginal environment of the former PIS during Quaternary ice-age maxima, at the latitude of the major eastward-flowing Palena outlet glacier (43∘ S; Leger et al., 2020, 2021a). This up-to-100 km-long outlet glacier diverged towards the eastern mountain front into three glaciers occupying the Río Frío valley to the northeast, the Río Huemul (RH) valley to the east, and the RC valley to the south (Fig. 1; Leger et al., 2021a). The local valleys are characterised by a westward-sloping bed topography such that the former outlet glaciers flowed up along reverse-sloping beds. The surface geology of the study area is characterised by well-preserved and distinct sequences of ice-contact glaciogenic deposits interspersed among their associated glaciolacustrine and glaciofluvial sediment-landform assemblages (Leger et al., 2020). Terminal moraine complexes indicate that the RC and RH outlet glaciers re-converged to deposit moraine sequences located approximately 60 km to the east of the Argentinian town of Corcovado (43∘54′ S; 71∘46′ W), into an environment presently climatically defined as the semi-arid Patagonian steppe (Fig. 1; Garreaud et al., 2013). The local aridity (∼570 mm a−1; Fick and Hijmans, 2017; Fig. 1a) results from the Patagonian Andes acting as a powerful orographic barrier to the dominant Southern Westerly Winds (Fig. 1a), causing a potent west–east rain-shadow effect (Garreaud et al., 2013; Fig. 1a). Along the flowlines of the RC outlet glacier, the ice eroded bedrock mainly sourced from the Mesozoic north Patagonian batholith towards the west (Hervé et al., 2017) along with formations of Jurassic/Cretaceous volcanic and sedimentary units located farther east (Haller et al., 2003). Moraine-outwash complexes studied here thus contain a mixture of rock types, including quartz-bearing leuco-monzonite, granite, and white granodiorite that are well suited to TCN exposure dating using in situ 10Be and 26Al radionuclides.
Ice-sheet-wide geomorphological mapping of glacial sediment–landform assemblages has been conducted by Caldenius (1932), Glasser and Jansson (2008), and Davies et al. (2020), while the first detailed glacial geomorphological map specific to the RC and RH valleys was generated by Leger et al. (2020). These maps enabled the identification of at least eight stratigraphically distinct moraine-outwash complexes deposited by the RC outlet glacier (Fig. 1c). This study focuses on dating results from the three stratigraphically oldest glacial margins: i.e. the RC 0 (outermost), RC I, and RC II (Fig. 1c) moraine-outwash complexes. Directly inboard of these margins, the RC outlet glacier deposited another series of at least five younger moraine complexes (RC III–VII moraines) that were previously dated to between 26.4±1.4 and 19.9±1.1 ka using TCN exposure dating and Bayesian age modelling (Leger et al., 2021a). The latter moraine belts reflect the local Last Glacial Maximum (LGM) expansions of the PIS.
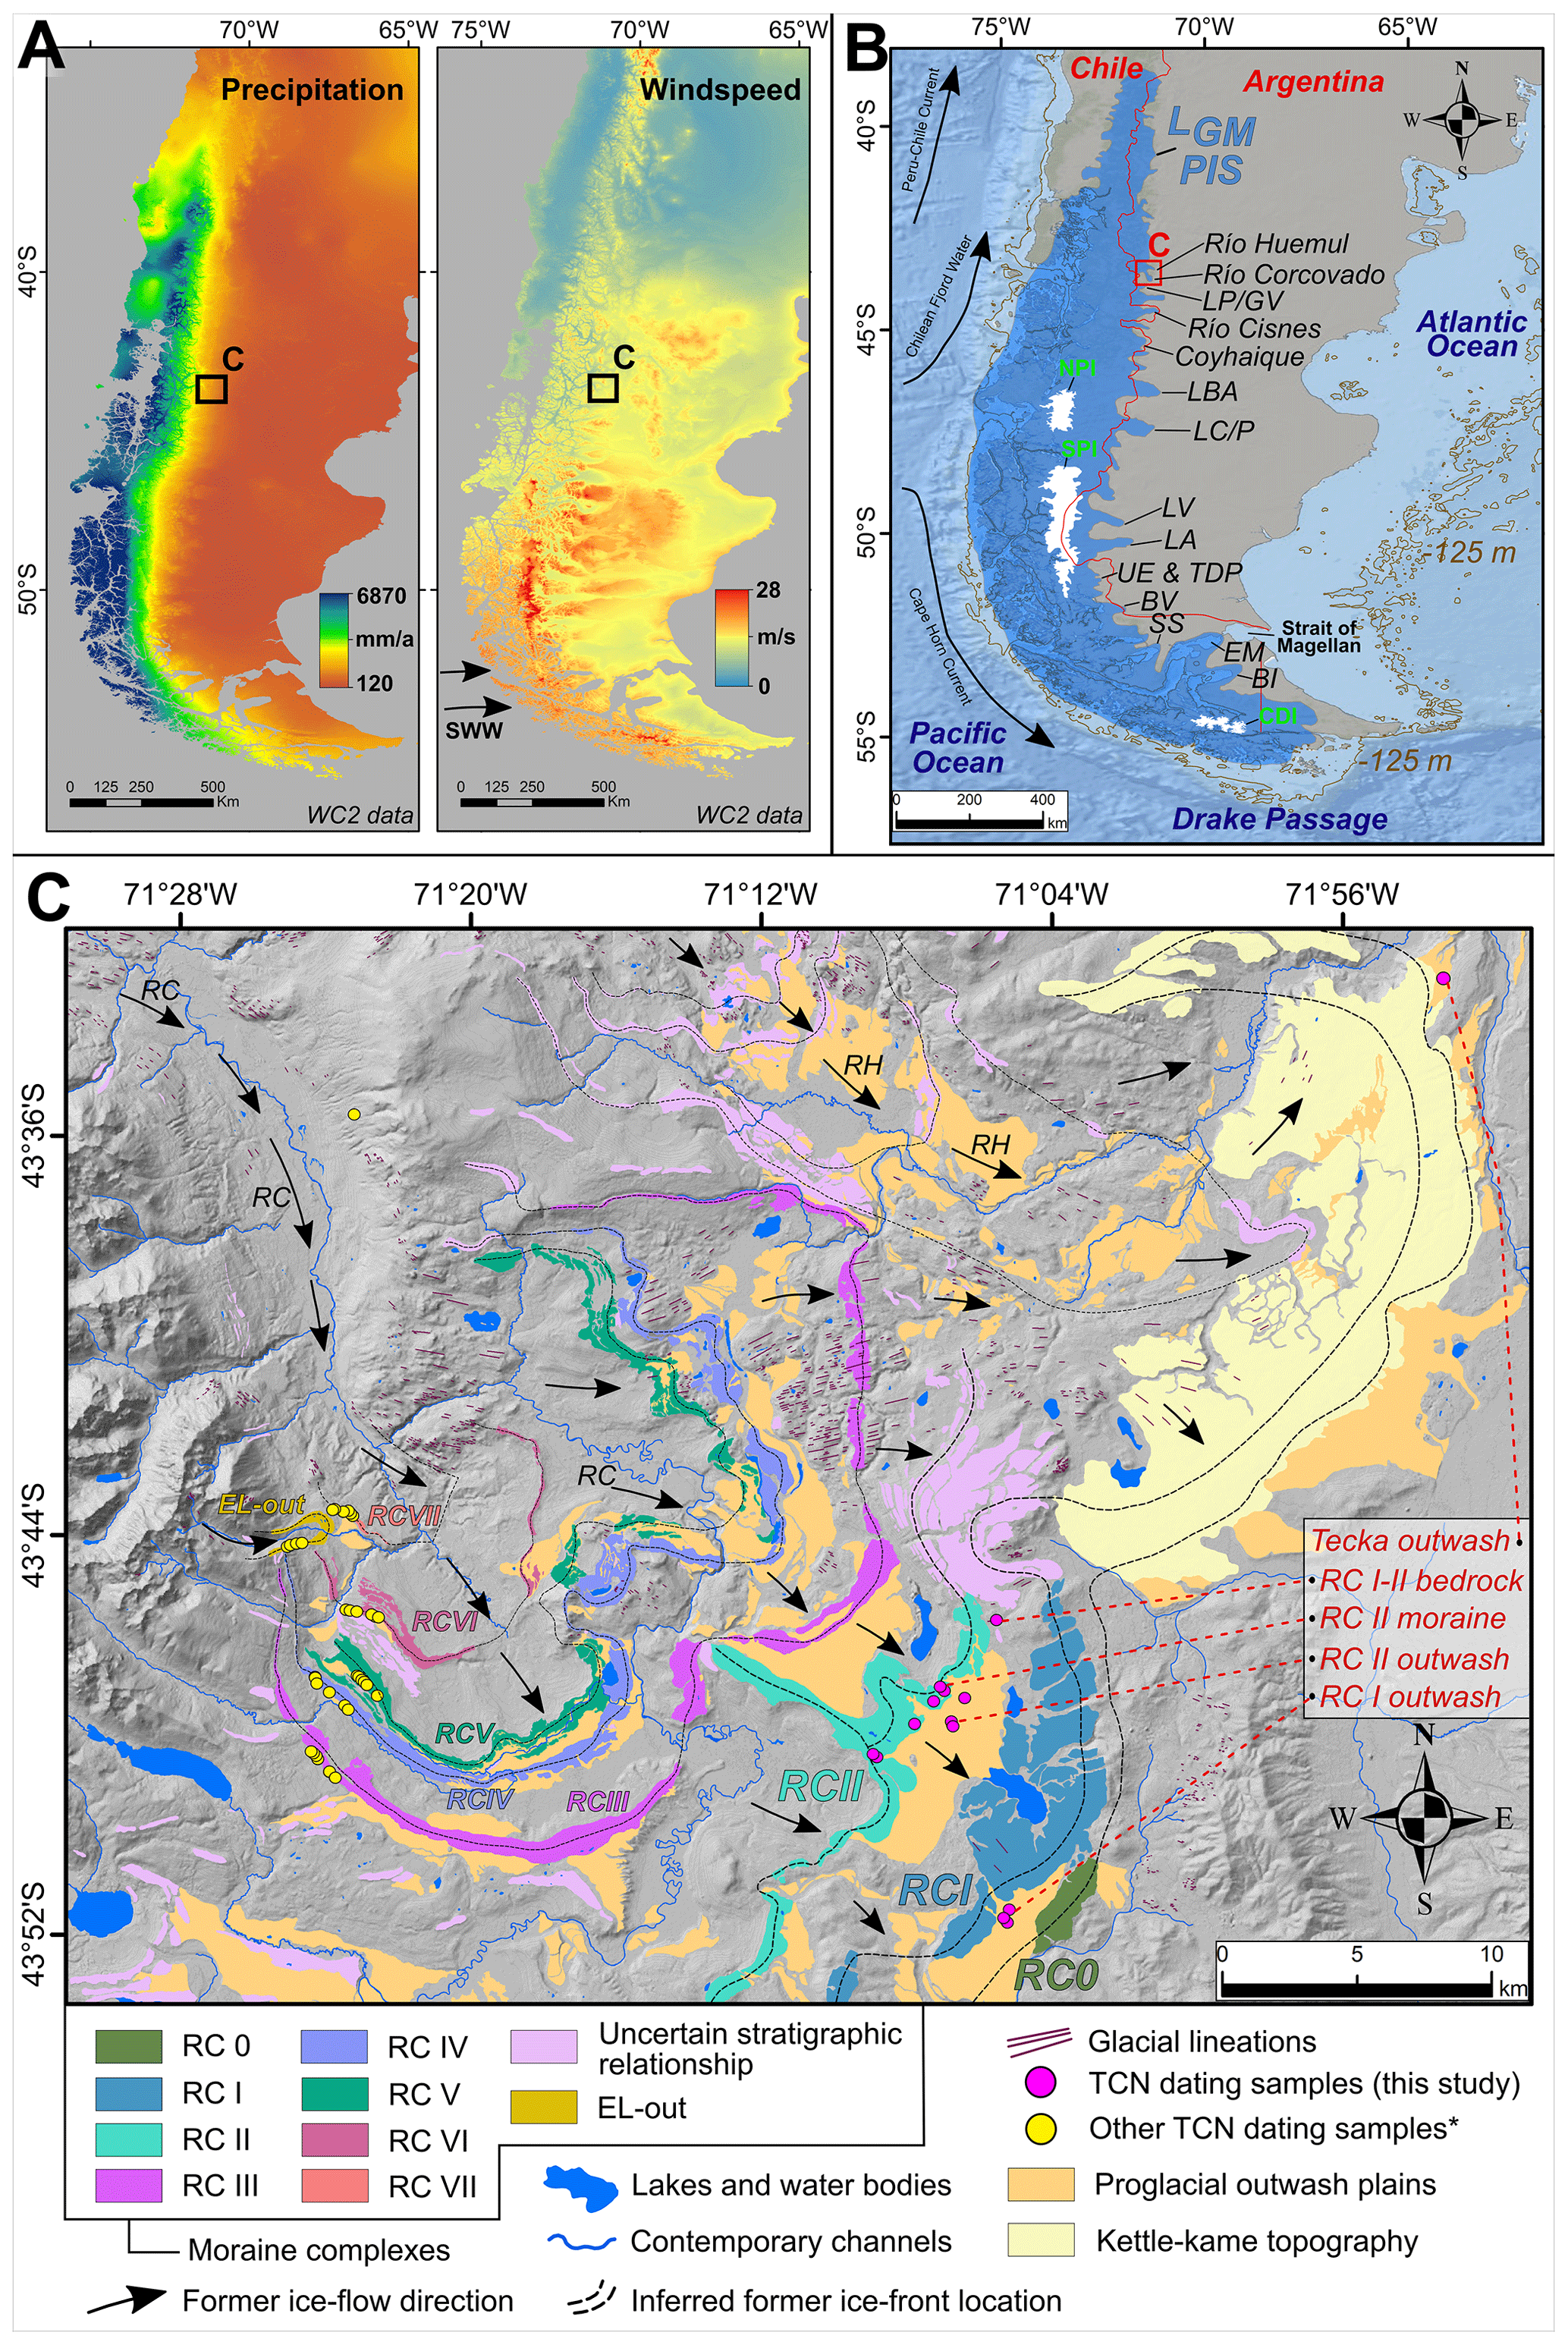
Figure 1(a) 1 km2 spatial resolution total annual precipitation (mm a−1) and mean annual windspeed (m s−1) land data (1970–2000 mean) from the WorldClim version 2.1 dataset (Fick and Hijmans, 2017) overlaid on maps of southernmost South America, with the location of the study area highlighted by a black box. (b) Adapted from Leger et al. (2020, 2021a, b): approximate former extent of the PIS during the LGM. Locations of major PIS paleo-outlet glaciers are designated as follows: BI: Bahía Inútil, EM: Estrecho de Magallanes, SS: Seno Skyring, BV: Bella Vista, TDP & UE: Torres del Paine & Última Esperanza, LA: Lago Argentino, LV: Lago Viedma, LC/P: Lago Cochrane/Pueyrredón, LBA: Lago Buenos Aires, LP/LGV: Lago Palena/General Vintter. NPI, SPI, and CDI stand for the North, South, and Cordillera Darwin Patagonian ice fields, respectively. A −125 m (brown-coloured) topographic contour roughly simulating former coastline locations at the LGM is displayed (after Lambeck et al., 2014). Bathymetric data were acquired from the General Bathymetric Chart of the Oceans (GEBCO). (c) Glacial geomorphology of the study area indicating stratigraphic relationship of moraine-outwash complexes preserved, sample site location, and former ice-flow direction. RC and RH stand for the Río Corcovado and Río Huemul outlet glaciers. * Other TCN dating samples, as published in Leger et al. (2021 a, b).
Preliminary identification and mapping of the major glacial sediment–landform assemblages studied here was carried out using remotely sensed imagery and topographic data. These geomorphological interpretations were then ground checked during a 5 week field season during the 2020 austral summer. Details of the geomorphological mapping methodology and criteria, and a complete map of the study area, are given by Leger et al. (2020). To date the RC 0–II glacier advances, we sampled both outwash surface cobbles and moraine boulders. Specifically, we measured 10Be in five cobbles from the outermost proglacial outwash surface sampled, here termed the “Tecka outwash”, which we correlate stratigraphically with the RC 0 advance (Fig. 1c). We sampled five and six cobbles respectively from the RC I and RC II outwash terraces, six moraine boulders located along a single broad ridge of the RC II moraine complex, and one ice-moulded bedrock surface located between the RC I and II margins (Figs. 1–3). Additionally, we measured 26Al in 5 of these 23 samples to determine whether they present simple or complex exposure/burial histories. The chosen moraine boulders are large (90–200 cm high) and rounded to sub-rounded granodiorite and granite erratics embedded in the RC II moraine crest (Fig. 3). Where found, the top 2–5 cm of boulder surfaces exhibiting smooth rock fragments protruding from more eroded surrounding surfaces were sampled using a hammer, chisel, and angle grinder.
To date the formation of proglacial outwash plains, quartz-bearing and fluvially rounded cobbles (4–10 cm diameter; crushed whole) were sampled from well-preserved terraces characterised by low surface gradients (∼0.5–1∘), following the procedure established by Hein et al. (2009, 2011) (Fig. 2a–d). Surface ventifacts and desert varnish, indicative of prolonged cobble exposure, were considered a required sampling criterion. Sample preparation and cosmogenic isotope ratio measurements were conducted at three different laboratories: the Cosmogenic Isotope Analysis and Accelerator Mass Spectrometer (AMS) facilities of the Scottish Universities Environmental Research Centre (SUERC) (East Kilbride, UK), the French National Cosmogenic Nuclides Laboratory (LN2C) and the ASTER AMS facility of the European Centre for Research and Teaching in Environmental Geosciences (CEREGE, Aix-en-Provence, France), and the University of Edinburgh's Cosmogenic Nuclide Laboratory (Edinburgh, UK). Sample details and nuclide concentrations are displayed in Table 1. Details relevant to sample location, photographs, preparation, and wet chemistry are provided in the Supplement.
10Be and 26Al exposure ages were calculated using the online calculator formerly known as the CRONUS-Earth online calculator version 3 (Balco et al., 2008). Rock density was assumed to be 2.65 g cm−3 and the elevation flag was standard. For 10Be exposure-age calculations, we used the NIST_27900 standardisation (equivalent to 07KNSTD within rounding error) and the central Patagonia production rate (Kaplan et al., 2011) re-calculated from the ICE-D online database (http://calibration.ice-d.org/, last access: 29 March 2022). This local production rate yields a current sea-level high-latitude production rate of 3.96±0.2410Be atoms g−1 yr−1 using Lm scaling, versus 4.09±0.1910Be atoms g−1 yr−1 for the global mean of Borchers et al. (2016). Details regarding specific AMS standards, nominal 10Be 9Be ratios, and the 10Be half-life employed are included in the Supplement. 26Al exposure ages were calculated using the Purdue Z92-0222 AMS standardisation (equivalent to KNSTD within rounding error) and the default CRONUS-Earth online calculator's global production rate of Borchers et al. (2016), as the central Patagonia production rate does not feature 26Al 27Al measurements. We, however, consider it reasonable to use both the central Patagonia and global production rates when comparing 10Be and 26Al ages, as their respective 10Be calibrations agree within error, with reported LSDn scaling-fitting parameter values of 0.823±0.067 and 0.846±0.040, respectively (calibration: ICE-D online database). All exposure ages are displayed in Table 2. Below, we discuss exposure ages calculated using the time-dependent LSDn scaling scheme of Lifton et al. (2014) with 1σ analytical uncertainties. Exposure ages are between 6 %–9 % and 0.6 %–1% older when using the St and Lm scaling schemes of Lal (1991) and Stone (2000), respectively. The 10Be New Zealand production rate (Putnam et al., 2010), often used for Patagonian TCN exposure-age datasets due to its southern mid-latitude location (44∘ S), decreases our exposure ages by between 1.7 % and 1.5 % using LSDn scaling, which is less than the 1σ analytical uncertainties (3.5 %–1.6 %).
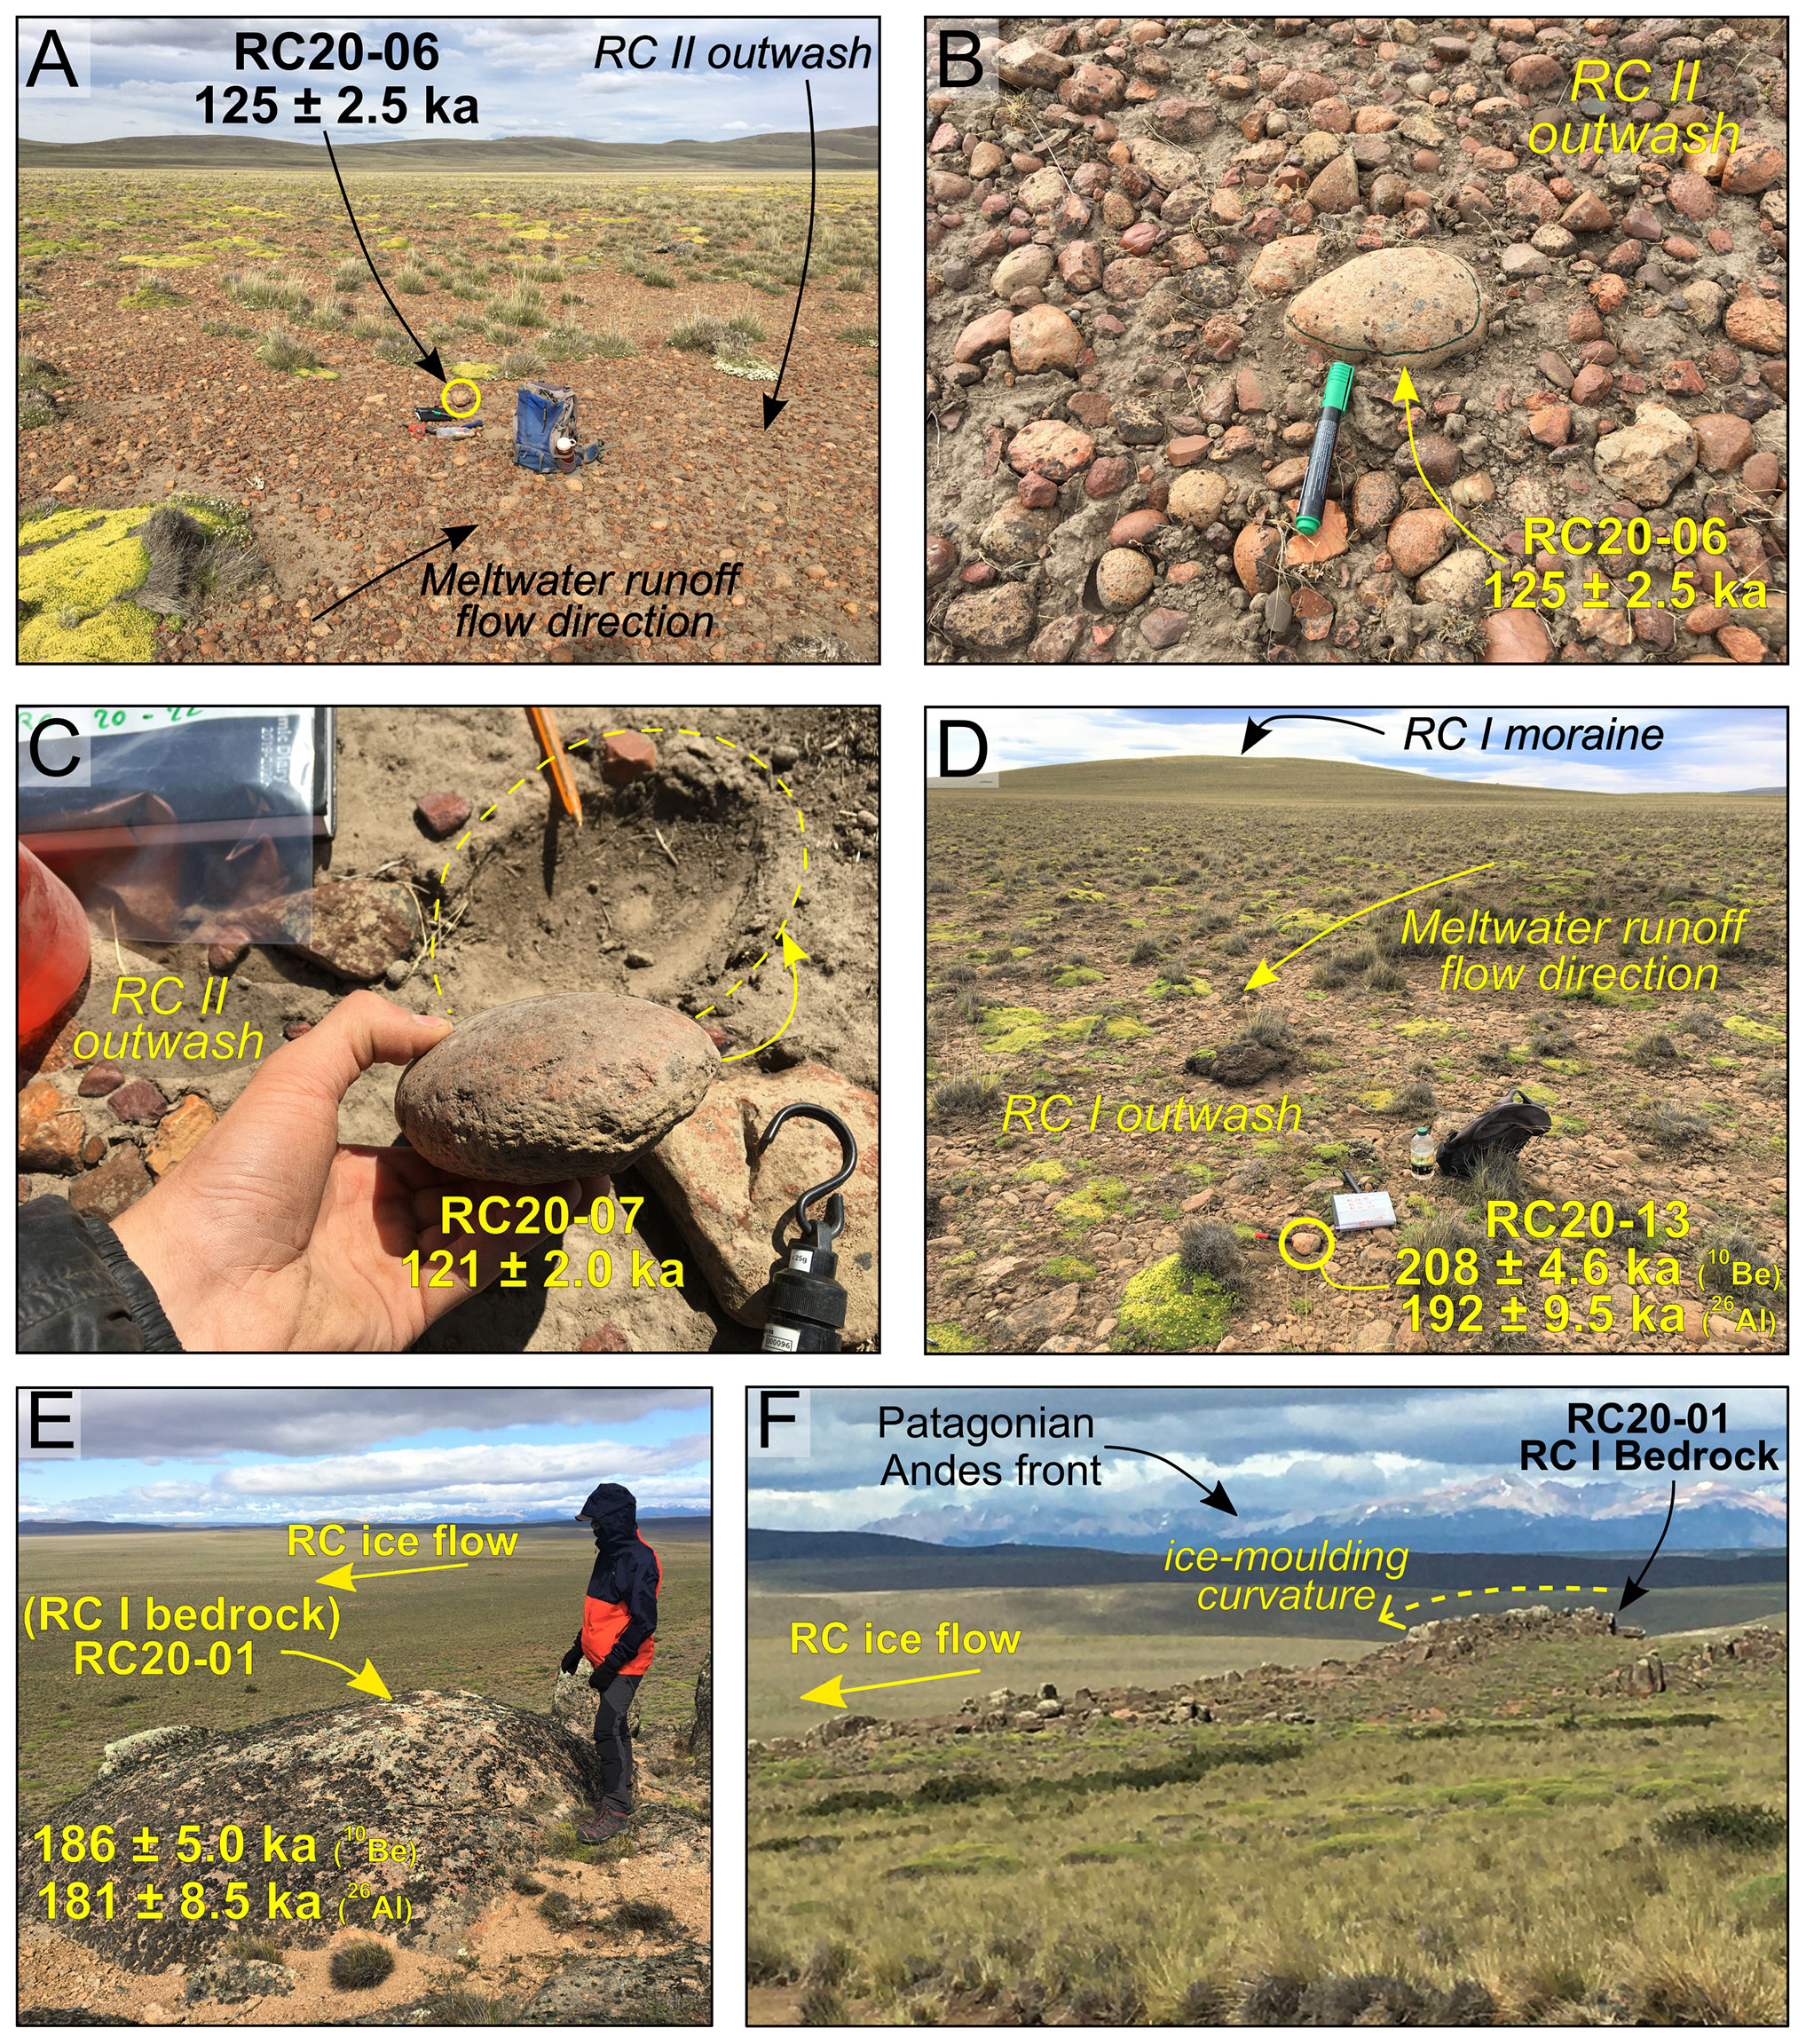
Figure 2Field photographs of (a–d) proglacial outwash plains and outwash surface cobbles sampled for TCN exposure dating and (e, f) the ice-moulded bedrock surface sampled (RC20-01). Ages displayed are 10Be exposure ages ±1σ analytical uncertainties. Further sample coordinates and characteristics are presented in Table 1.

Figure 3Field photographs of moraine granite and granodiorite boulders sampled for TCN exposure dating. Ages displayed are 10Be exposure ages ±1σ analytical uncertainties.
4.1 Geomorphology
In the RC valley, the three most distal preserved moraine complexes (RC 0–II) are morphologically distinct from the younger LGM moraines (RC III–VII). They display greater relief (70–90 m) than the RC III–VII moraines (10–40 m; Leger et al., 2021a), are more subdued, and have broader-crested ridges. Along our sampling transect, the three moraine complexes are 14 km (RC 0), 12 km (RC I), and 5 km (RC II) more distal than the outermost-dated LGM moraine (RC III). The sampled RC II moraine is a ∼1 km-wide multi-ridge complex presenting a flat-topped, subdued crest surface elevated up to 45 m above its ice-distal outwash plain. The ice-distal slope gradient is variable but does not exceed 5∘ – a relatively low grade compared to the slopes of the younger, better preserved LGM moraines, which feature slope gradients of 9–19∘ (Leger et al., 2021a). The RC I moraine complex features slope gradients (>5∘) and surface geomorphologies for individual moraine ridges comparable to the RC II moraine belt, but it is much wider in places (up to 4.6 km) and exhibits a greater concentration of distinct hummocky ridges and moraines. The subdued moraine geomorphologies characteristic of the RC 0–II margins are suggestive of progressive lateral slope downwasting and post-depositional moraine surface erosion of fine material (Clapperton, 1993; Glasser and Jansson, 2008; Hein et al., 2017). Geomorphological observations thus suggest the RC II and older moraine complexes were deposited significantly prior to the local LGM. In the adjacent RH valley, the outermost glacial margin consists of a ∼2 km-wide belt of kettle-kame topography displaying a chaotic hummocks-and-hollows configuration, and was formerly termed the “Tecka drift” (Haller et al., 2003; Leger et al., 2020). The sampled Tecka outwash surface marks the distal limit of this kettle-kame deposit (Fig. 1c). Based on geomorphological mapping and moraine-complex traceability across the RC and RH valleys, the Tecka limit (RH valley) is assumed here to correspond stratigraphically to the RC 0 advance, for which no well-preserved outwash plain surface could be found in the RC valley (Fig. 1c).
The outwash surfaces sampled in this study all present long-term preservation properties (Fig. 2). They display low-gradient surfaces (0.5–1∘), desert pavements, sparse vegetation cover, and preserved braided palaeo-meltwater channels suggestive of limited surface erosion/deflation (Fig. 2a, d; Leger et al., 2020). These glaciofluvial terraces are composed of sorted and fluvially rounded sands and gravel deposits. Near the locations of outwash cobble sampling, the outwash surfaces display no detectable signs of post-deposition activation and/or incision by post-glacial hydrology. Where checked, modern soil thickness varied between 0 and 20 cm. This is comparable to observations made further south in the Lago Pueyrredón (47.3∘ S) and Lago Belgrano (47.5∘ S) valleys (Hein et al., 2009; Mendelová et al., 2020). At the locations of sampling, these terraces occur adjacent to moraine complexes and mark their distal limits (Fig. 1c), thus enabling the unambiguous stratigraphic association of an outwash deposit with a specific glacial advance.
Table 1TCN exposure dating sample details and nuclide concentrations.
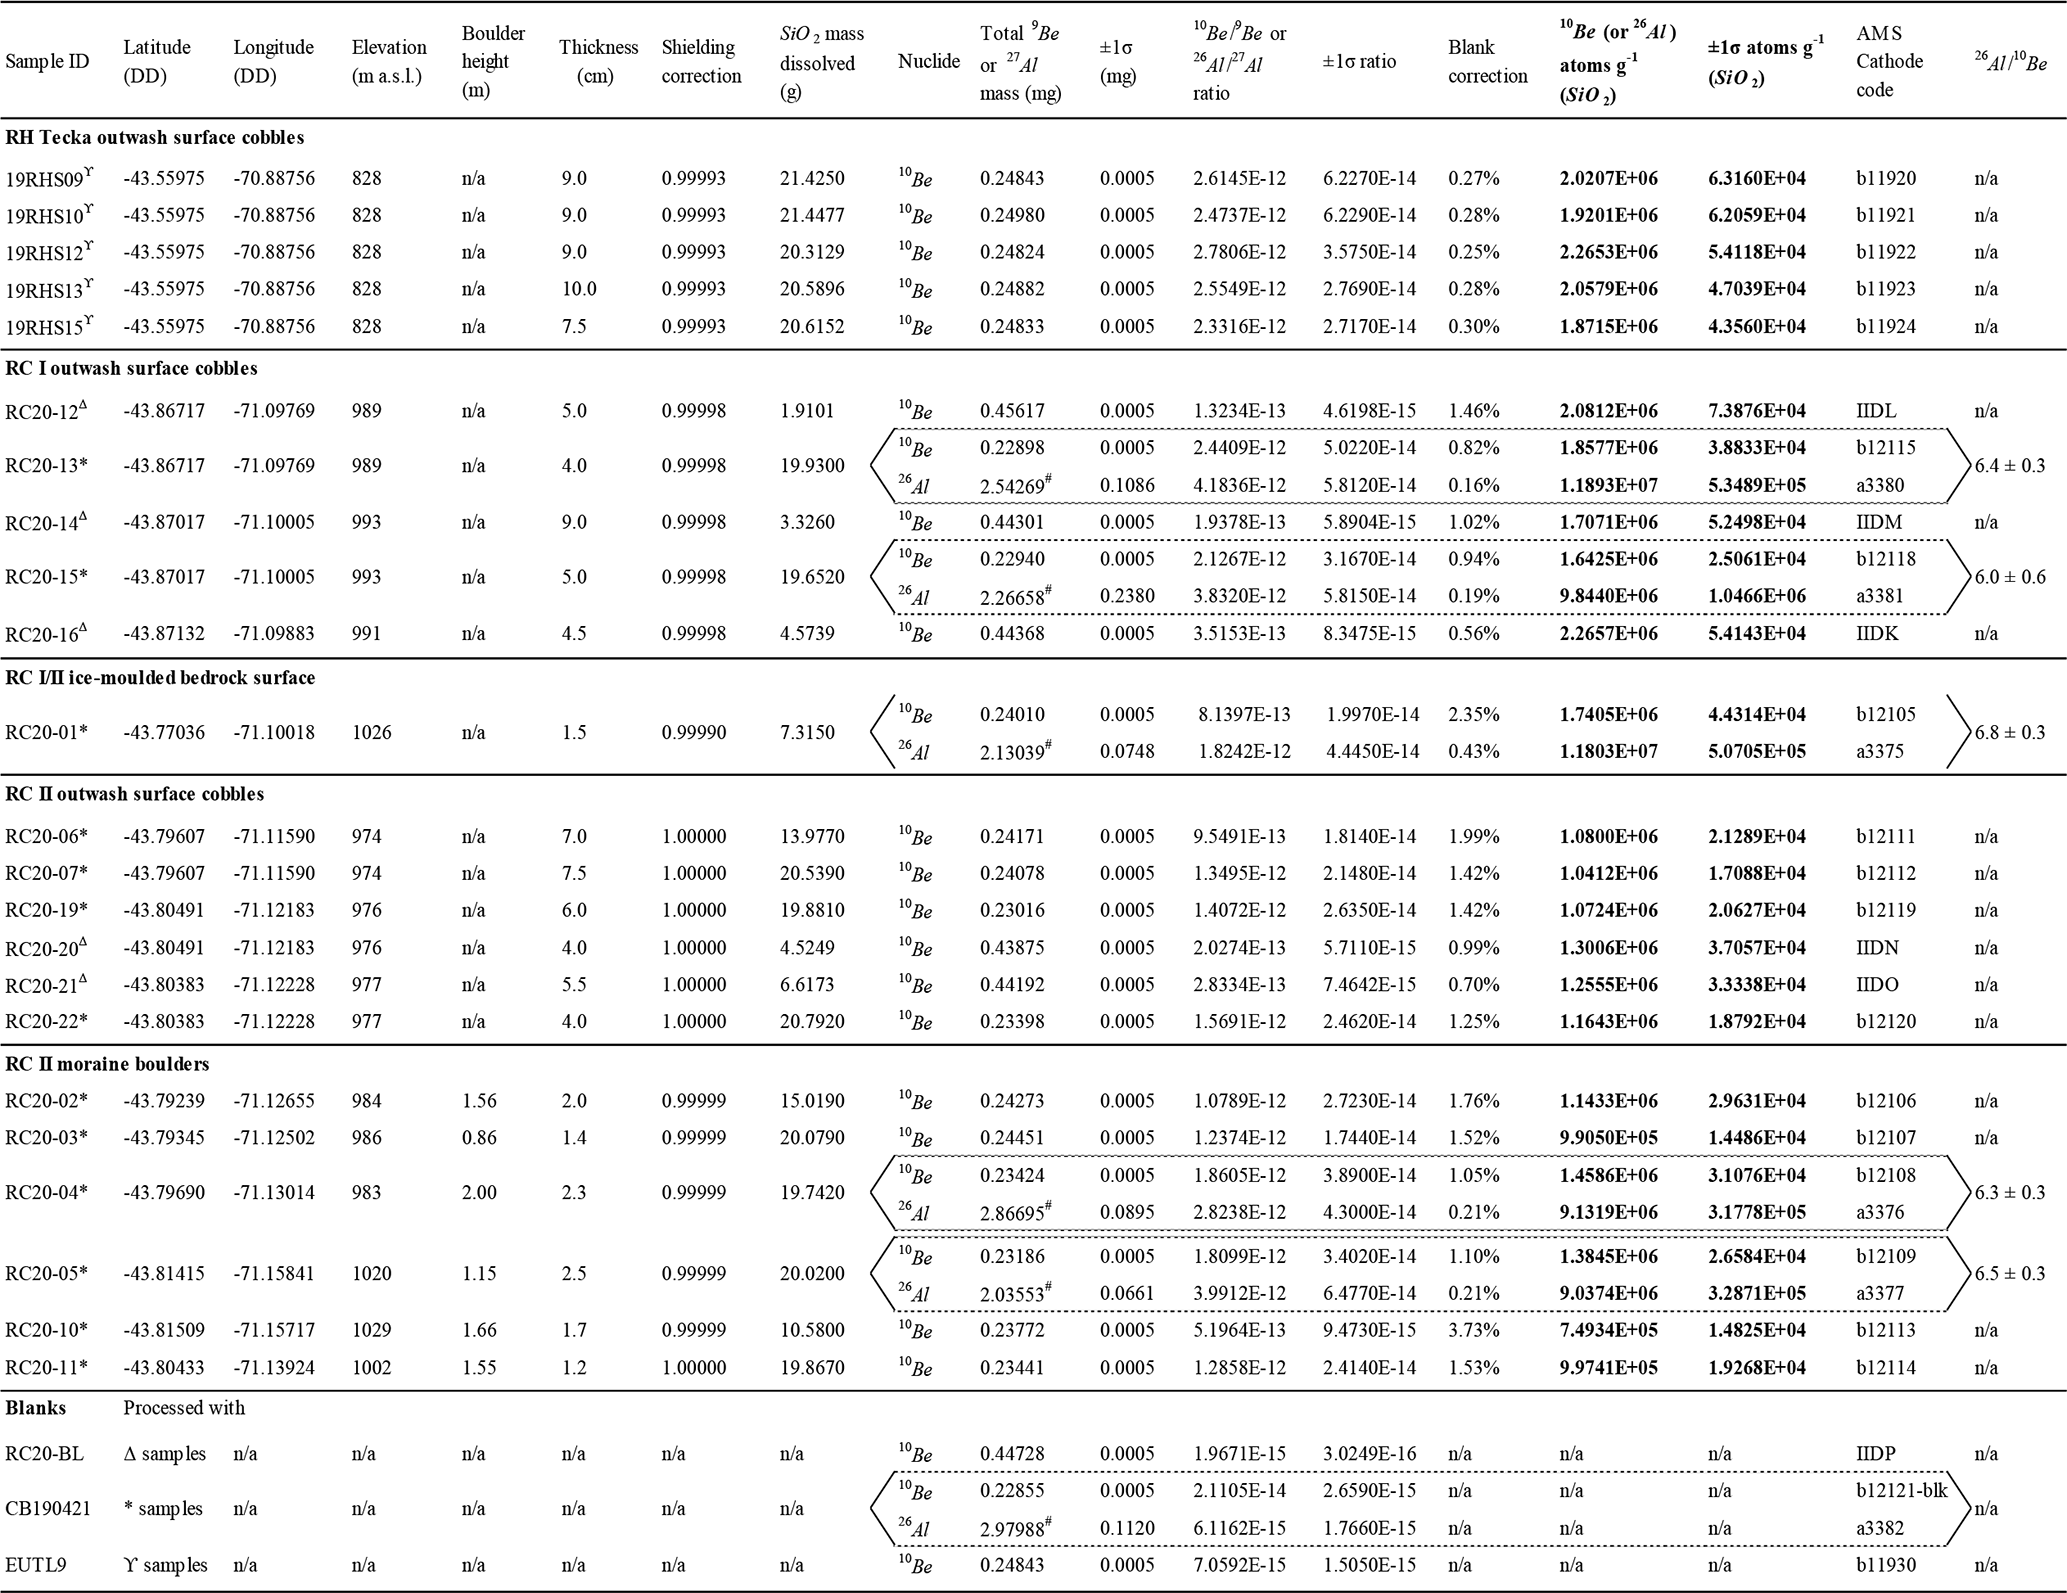
All cobble samples were crushed whole, without prior cutting. Sample preparation and wet chemistry were conducted at three different laboratories: Υ samples: the University of Edinburgh's Cosmogenic Nuclide Laboratory (Edinburgh, UK), * samples: the Scottish Universities Environmental Research Centre (SUERC) (East Kilbride, UK), Δ samples: the French National Cosmogenic Nuclides Laboratory (LN2C) of the European Centre for Research and Teaching in Environmental Geosciences (CEREGE, Aix-en-Provence, France). Nuclide ratios in Υ and * samples were measured at the SUERC AMS facility (East Kilbride, UK), while nuclide ratios in Δ samples were measured at the ASTER AMS facility (CEREGE, Aix-en-Provence, France). SiO2 is the chemical formula of silica (quartz). # Total 27Al mass from both the carrier (27Al concentration: 982±0.1 µg g−1) and the sample, determined by ICP-OES. The Be carrier solution used at LN2C has a 9Be concentration of 3025±9 µg g−1, while carrier solutions used at SUERC and the University of Edinburgh's Cosmogenic Nuclide Laboratory have 9Be concentrations of 849±12 and 1000 µg g−1, respectively. Conversions of isotope ratios to 10Be and 26Al concentrations were conducted following standard equations.
4.2 TCN exposure-age chronology
The exposure-age results for the 23 samples are presented in Table 2. Four of the five cobbles sampled on the outermost Tecka/RC 0 outwash surface (Fig. 1c) range from 252.0±6.3 ka to 284.1±7.0 ka and afford a mean 10Be exposure age of 268.7±14.4 ka (arithmetic mean ±1σ standard deviation). One older age (19RHS12: 311.5±8.1 ka) lies outside the remaining population's 95 % (2σ) confidence level and is rejected as a statistical outlier. The remaining exposure-age population is relatively well clustered given the landform age, but still displays a >1 mean square weighted deviation (MSWD) value of 4.38 (>k=2.63). Such a MSWD value is indicative of greater exposure-age scatter than can be predicted by 1σ analytical uncertainties alone (Jones et al., 2019).
The five 10Be ages from the RC I outwash surface cobbles range from 185.0±3.0 to 257.4±6.6 ka. Although the age population presents no obvious statistical or stratigraphical outliers, the exposure ages are poorly clustered and present a high MSWD value of 33.6 (>k=2.41), indicating significantly more exposure-age scatter than solely predicted by analytical uncertainties. From the 26Al measured in two samples (RC20-13 and RC20-15) from this population, the resulting 26Al 10Be concentration ratios are 6.4±0.3 and 6.0±0.6, respectively. These ratios are consistent with the canonical 26Al 10Be surface spallation production ratio of ∼6.75, the value currently used in the CRONUS-Earth online calculator (Balco et al., 2008), and are here interpreted as indicating a single, continuous exposure history (within uncertainty) post erosion (Granger and Muzikar, 2001; Balco and Rovey, 2008; Fig. S1 in the Supplement).
The ice-moulded bedrock surface (RC20-01), located inboard of the RC I moraine and outboard of the RC II moraine, yields a 10Be exposure age of 185.7±5.0 ka, an 26Al exposure age of 181.1±8.5 ka, and an 26Al 10Be concentration ratio of 6.8±0.3, which is consistent with continuous exposure post erosion of the surface.
The six 10Be ages from the RC II outwash surface cobbles range from 120.6±2.0 to 146.6±4.3 ka, with a mean exposure age of 131.3±11.1 ka. The age population is tightly clustered considering the analytical uncertainties associated with the TCN exposure dating of pre-LGC landforms, and thus features no obvious statistical or stratigraphical outliers. However, the population still yields a MSWD value of 11.4 (>k=2.26), diagnostic of some non-analytical exposure-age scatter in the 10Be age distribution.
Three of the six 10Be ages from the RC II moraine boulders range from 125.5±3.4 to 161.9±3.6 ka and afford a mean exposure age of 145.3±18.4 ka. Younger ages from the remaining three boulders (RC20-03, 10, 11) plot outside the remaining boulder population's 95 % confidence level and the 2σ envelope associated with the youngest RC II outwash cobble (RC20-07). We consider 10Be inheritance an unlikely source of exposure-age scatter compared to the high potential for boulder exhumation causing young outliers. Moreover, the RC II outwash and RC II moraine belt are geomorphologically likely to represent the same glacier expansion event. These three younger boulder ages, which furthermore would indicate a glaciation occurring during the warmer MIS 5 interglacial (a less probable alternative), were thus rejected as stratigraphical and statistical outliers (Table 2). The three remaining moraine boulder ages still exhibit a high MSWD value of 28.7 (>k=3.0), indicating that the remaining dataset displays substantially more exposure-age scatter than can be predicted solely by analytical uncertainties. The two oldest sampled boulders, RC20-04 (161.9±3.6 ka) and RC20-05 (148.6±3.0 ka), yield 26Al exposure ages of 143.6±5.4 and 137.5±5.4 ka, corresponding to 26Al 10Be concentration ratios of 6.3±0.3 and 6.5±0.3, respectively. Such ratios are interpreted here as indicating continuous exposure post erosion of the sampled boulders.
Table 2TCN exposure ages and summary statistics.
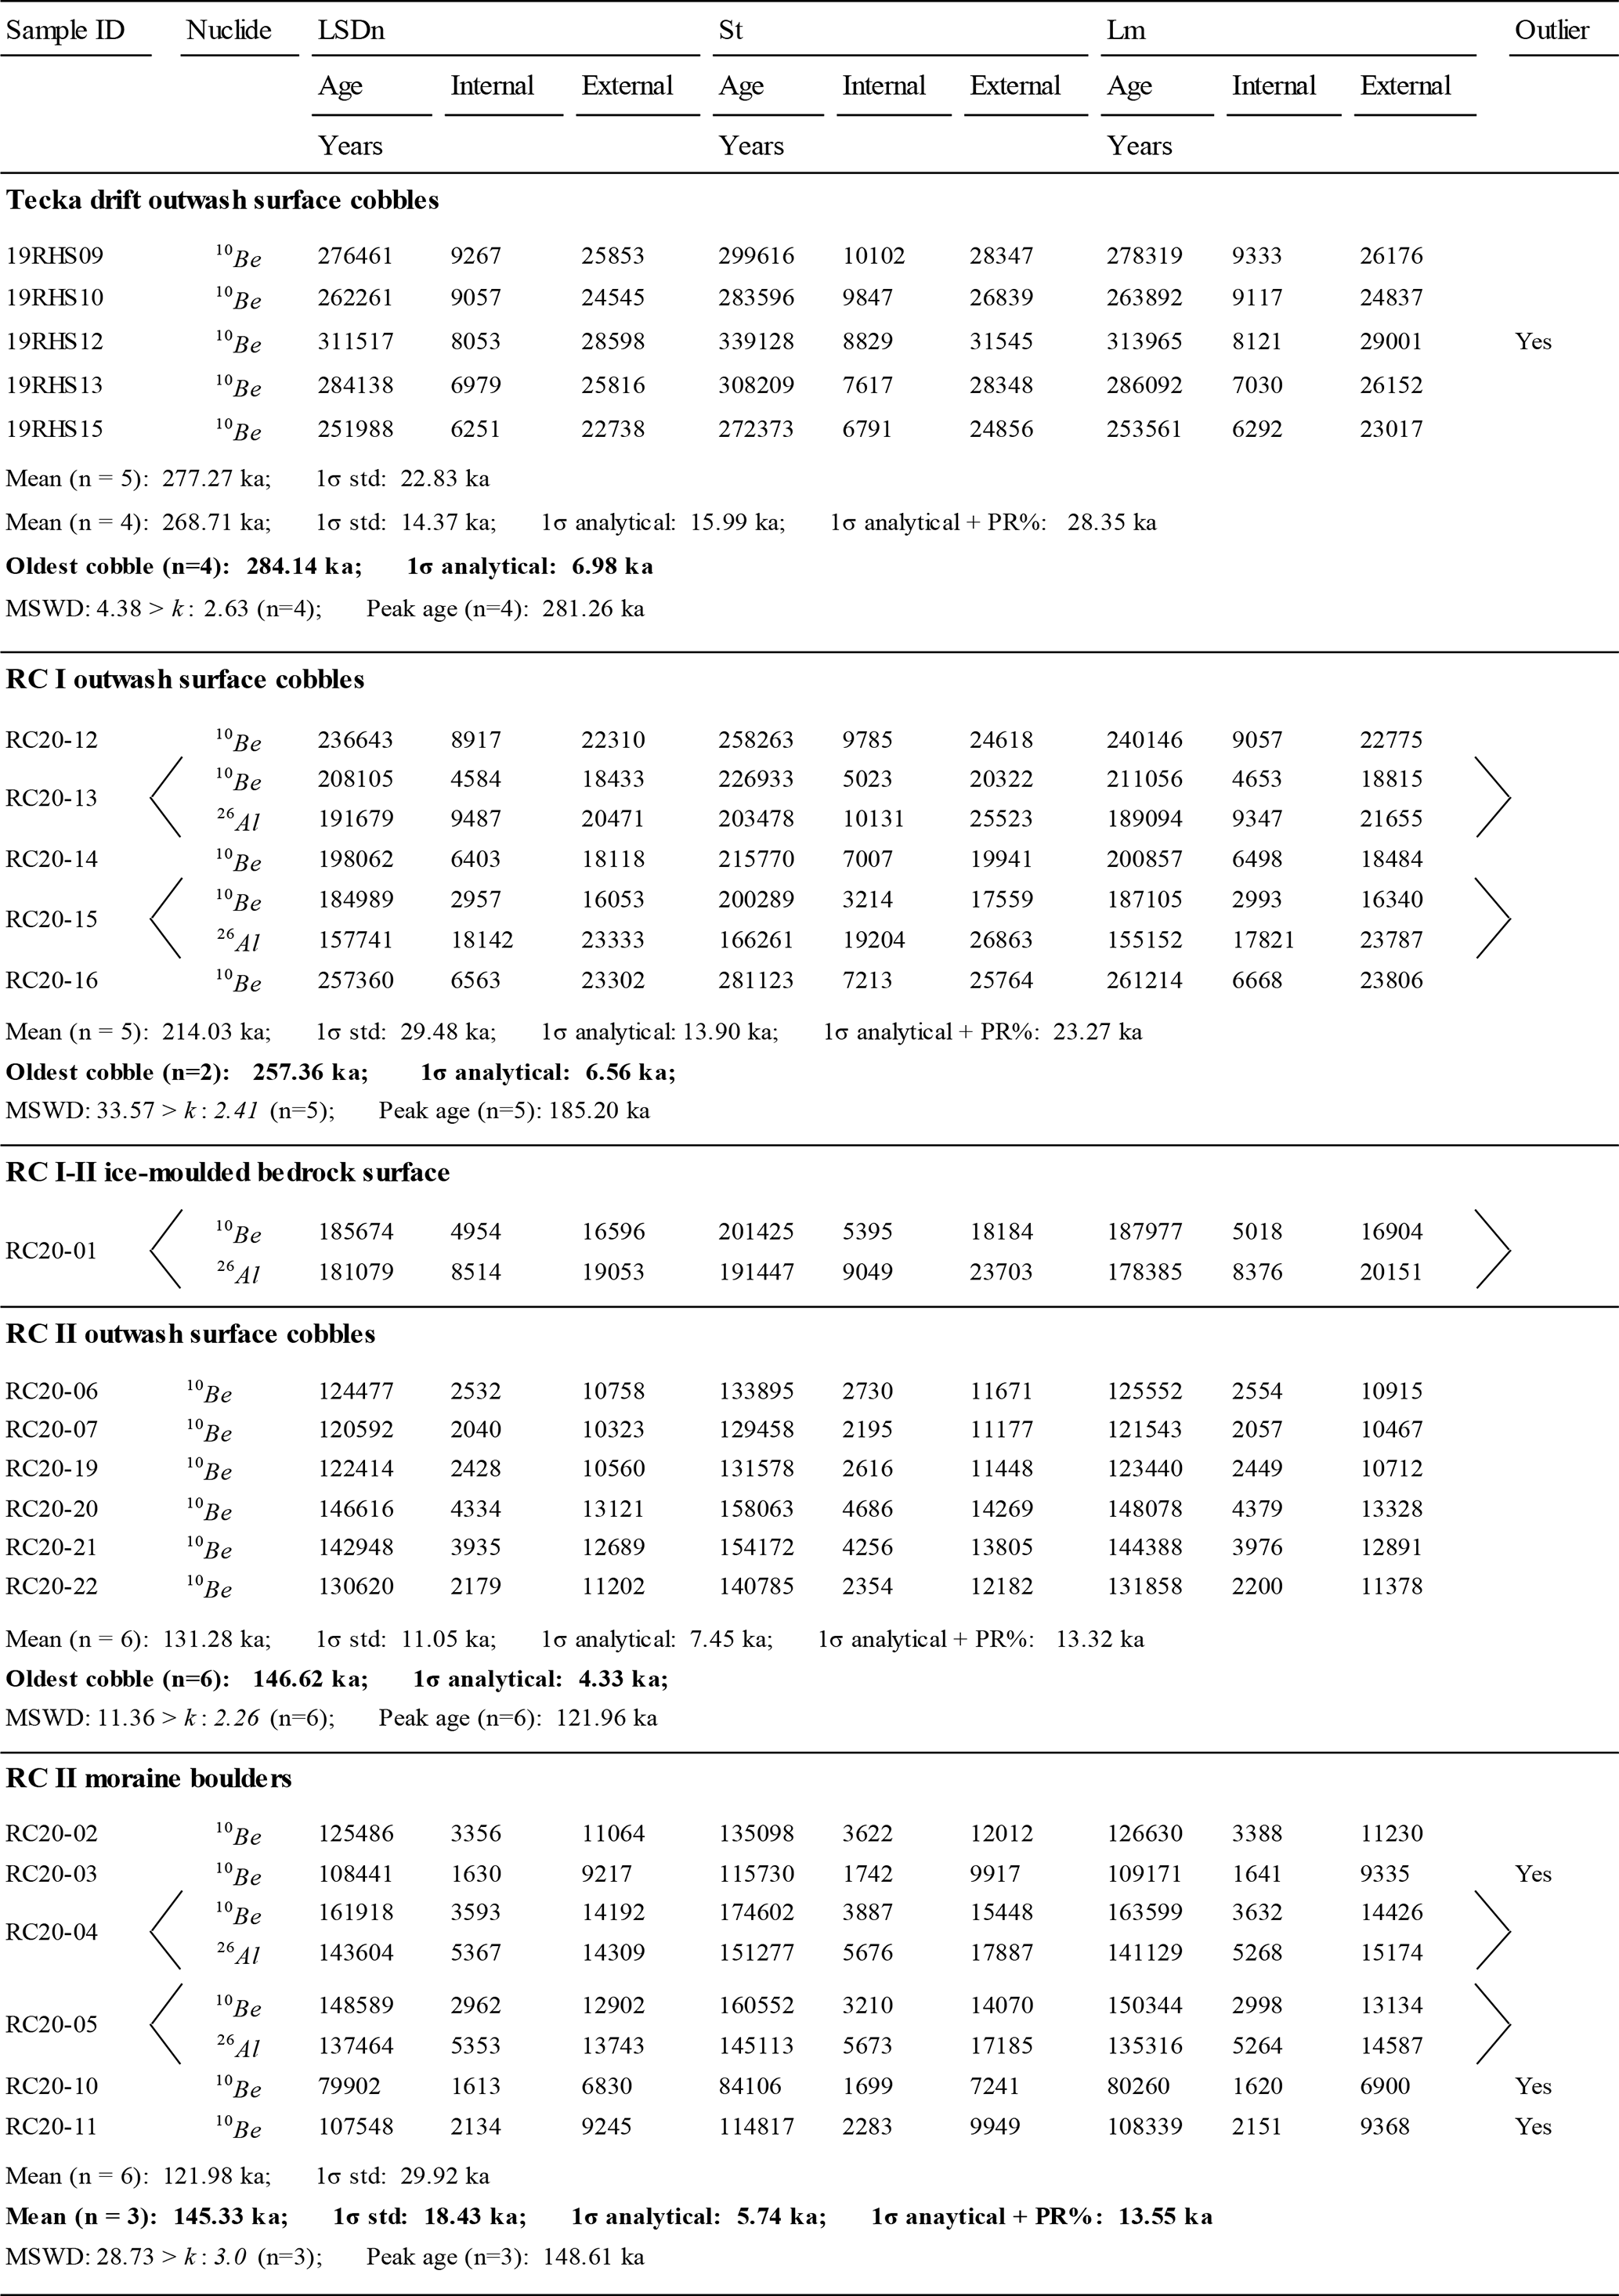
10Be and 26Al exposure ages were calculated using the online calculator formerly known as the CRONUS-Earth online calculator version 3 (Balco et al., 2008). Rock density is assumed to be 2.65 g cm−3 and the elevation flag is the standard. All samples were collected in 2020. 10Be ages reported here are calculated using the central Patagonia production rate (Kaplan et al., 2011; re-calculated from the ICE-D online database: http://calibration.ice-d.org/, last access: 29 March 2022), while 26Al ages are calculated here using the global 26Al production rate of Borchers et al. (2016). The AMS standardizations employed for calculator input data are NIST_27900 (10Be) and Purdue Z92-0222 (26Al). Scaling schemes: St is the time-independent version of Lal (1991) and Stone (2000), Lm is the time-dependent version of Lal (1991) and Stone (2000), and LSDn is the time-dependent scheme of Lifton et al. (2014). Ages are reported with 1σ analytical and external uncertainties, the latter including production rate and scaling uncertainties in addition to analytical ones. Summary statistics were calculated for each dated landform using only 10Be exposure ages and LSDn scaling. This includes arithmetic means with the 1σ SD, 1σ propagated (from individual ages) analytical uncertainty, and propagated 1σ analytical plus production rate uncertainty (PR%). Summary statistics for sets of outwash surface cobble ages also display the oldest cobble exposure age, which is considered a better minimum-age estimate of outwash deposit formation here. Summary statistics also include MSWDs and peak ages calculated using standard equations as described by Jones et al. (2019). Ages in bold are here interpreted as the most appropriate summary ages per landform and are the ones used throughout the paper for discussion (see justification in Sect. 4.3).
4.3 TCN exposure-age scatter sources
We consider post-depositional shielding of TCN exposure dating samples by vegetation and/or snow to be negligible given the semi-arid and windy conditions (annual 1970–2000 mean wind speed of ∼5.3 m s−1; WorldClim 2.1 data; Fick and Hijmans, 2017) that characterise the study site and more generally the Argentinian steppe foreland (Garreaud et al., 2013; Hein et al., 2009, 2017). Modern daily winter (June–August) precipitation is estimated at 2.2 mm near the sampling site (Fick and Hijmans, 2017), which would represent between 20 and 50 cm thick snowfalls given various snow densities. Snow cover 75–150 cm thick persisting for 4 months of the year is typically required to reduce nuclide production by ∼5 % (snow density range: 0.16–0.33 g cm−3; Dunai, 2010). Snow accumulation at the study site is thus considered too low to impact exposure ages beyond analytical uncertainties at the 105 year timescale. Cosmogenic nuclide inheritance from previous exposure has been shown to be negligible in other eastern Patagonian valleys (e.g. Douglass et al., 2007; Hein et al., 2009) and is considered unlikely for our samples based on the long (>80 km) distances separating glacial deposits and source regions. Such transport distances should have enabled efficient glacial erosion of transported clasts. For moraine boulder samples, we expect the exposure-age scatter to originate mainly from rock surface erosion and boulder exhumation through moraine surface deflation and lateral creep (Putkonen and Swanson, 2003; Briner et al., 2005; Hein et al., 2017).
For all outwash surface cobbles sampled, total rock-surface erosion is considered negligible due to the same reasons described for moraine boulder samples, but also due to the fluvially rounded and polished nature of the target cobbles. Such an interpretation is further supported by the analysis of 10Be concentrations in a proglacial outwash depth profile of MIS 8 – old sediments deposited more than 65 km east of the closest bedrock source region, in an eastern Patagonian setting similar to our study site (Hein et al., 2009). Results from this analysis indicate that nuclide inheritance is negligible in outwash deposits of the Río Blanco and Hatcher units in the Lago Pueyrredón valley (47.5∘ S). We do, however, expect exposure-age scatter to reflect cobble exhumation via a combination of outwash surface deflation (Hein et al., 2009; Darvill et al., 2015) and near-surface turbation (e.g. cryoturbation) caused by possible local development of soil permafrost during cold intervals (Trombotto, 2008). We thus assume post-depositional disturbance to be the predominant cause of cobble exhumation and young apparent exposure ages (Phillips et al., 1990; Hein et al., 2011), and thus consider the oldest cobble exposure age a better minimum-age estimate of outwash-plain stabilisation following glacier-front retreat, with the exception of obvious statistical outliers (Table 2, Fig. 4).
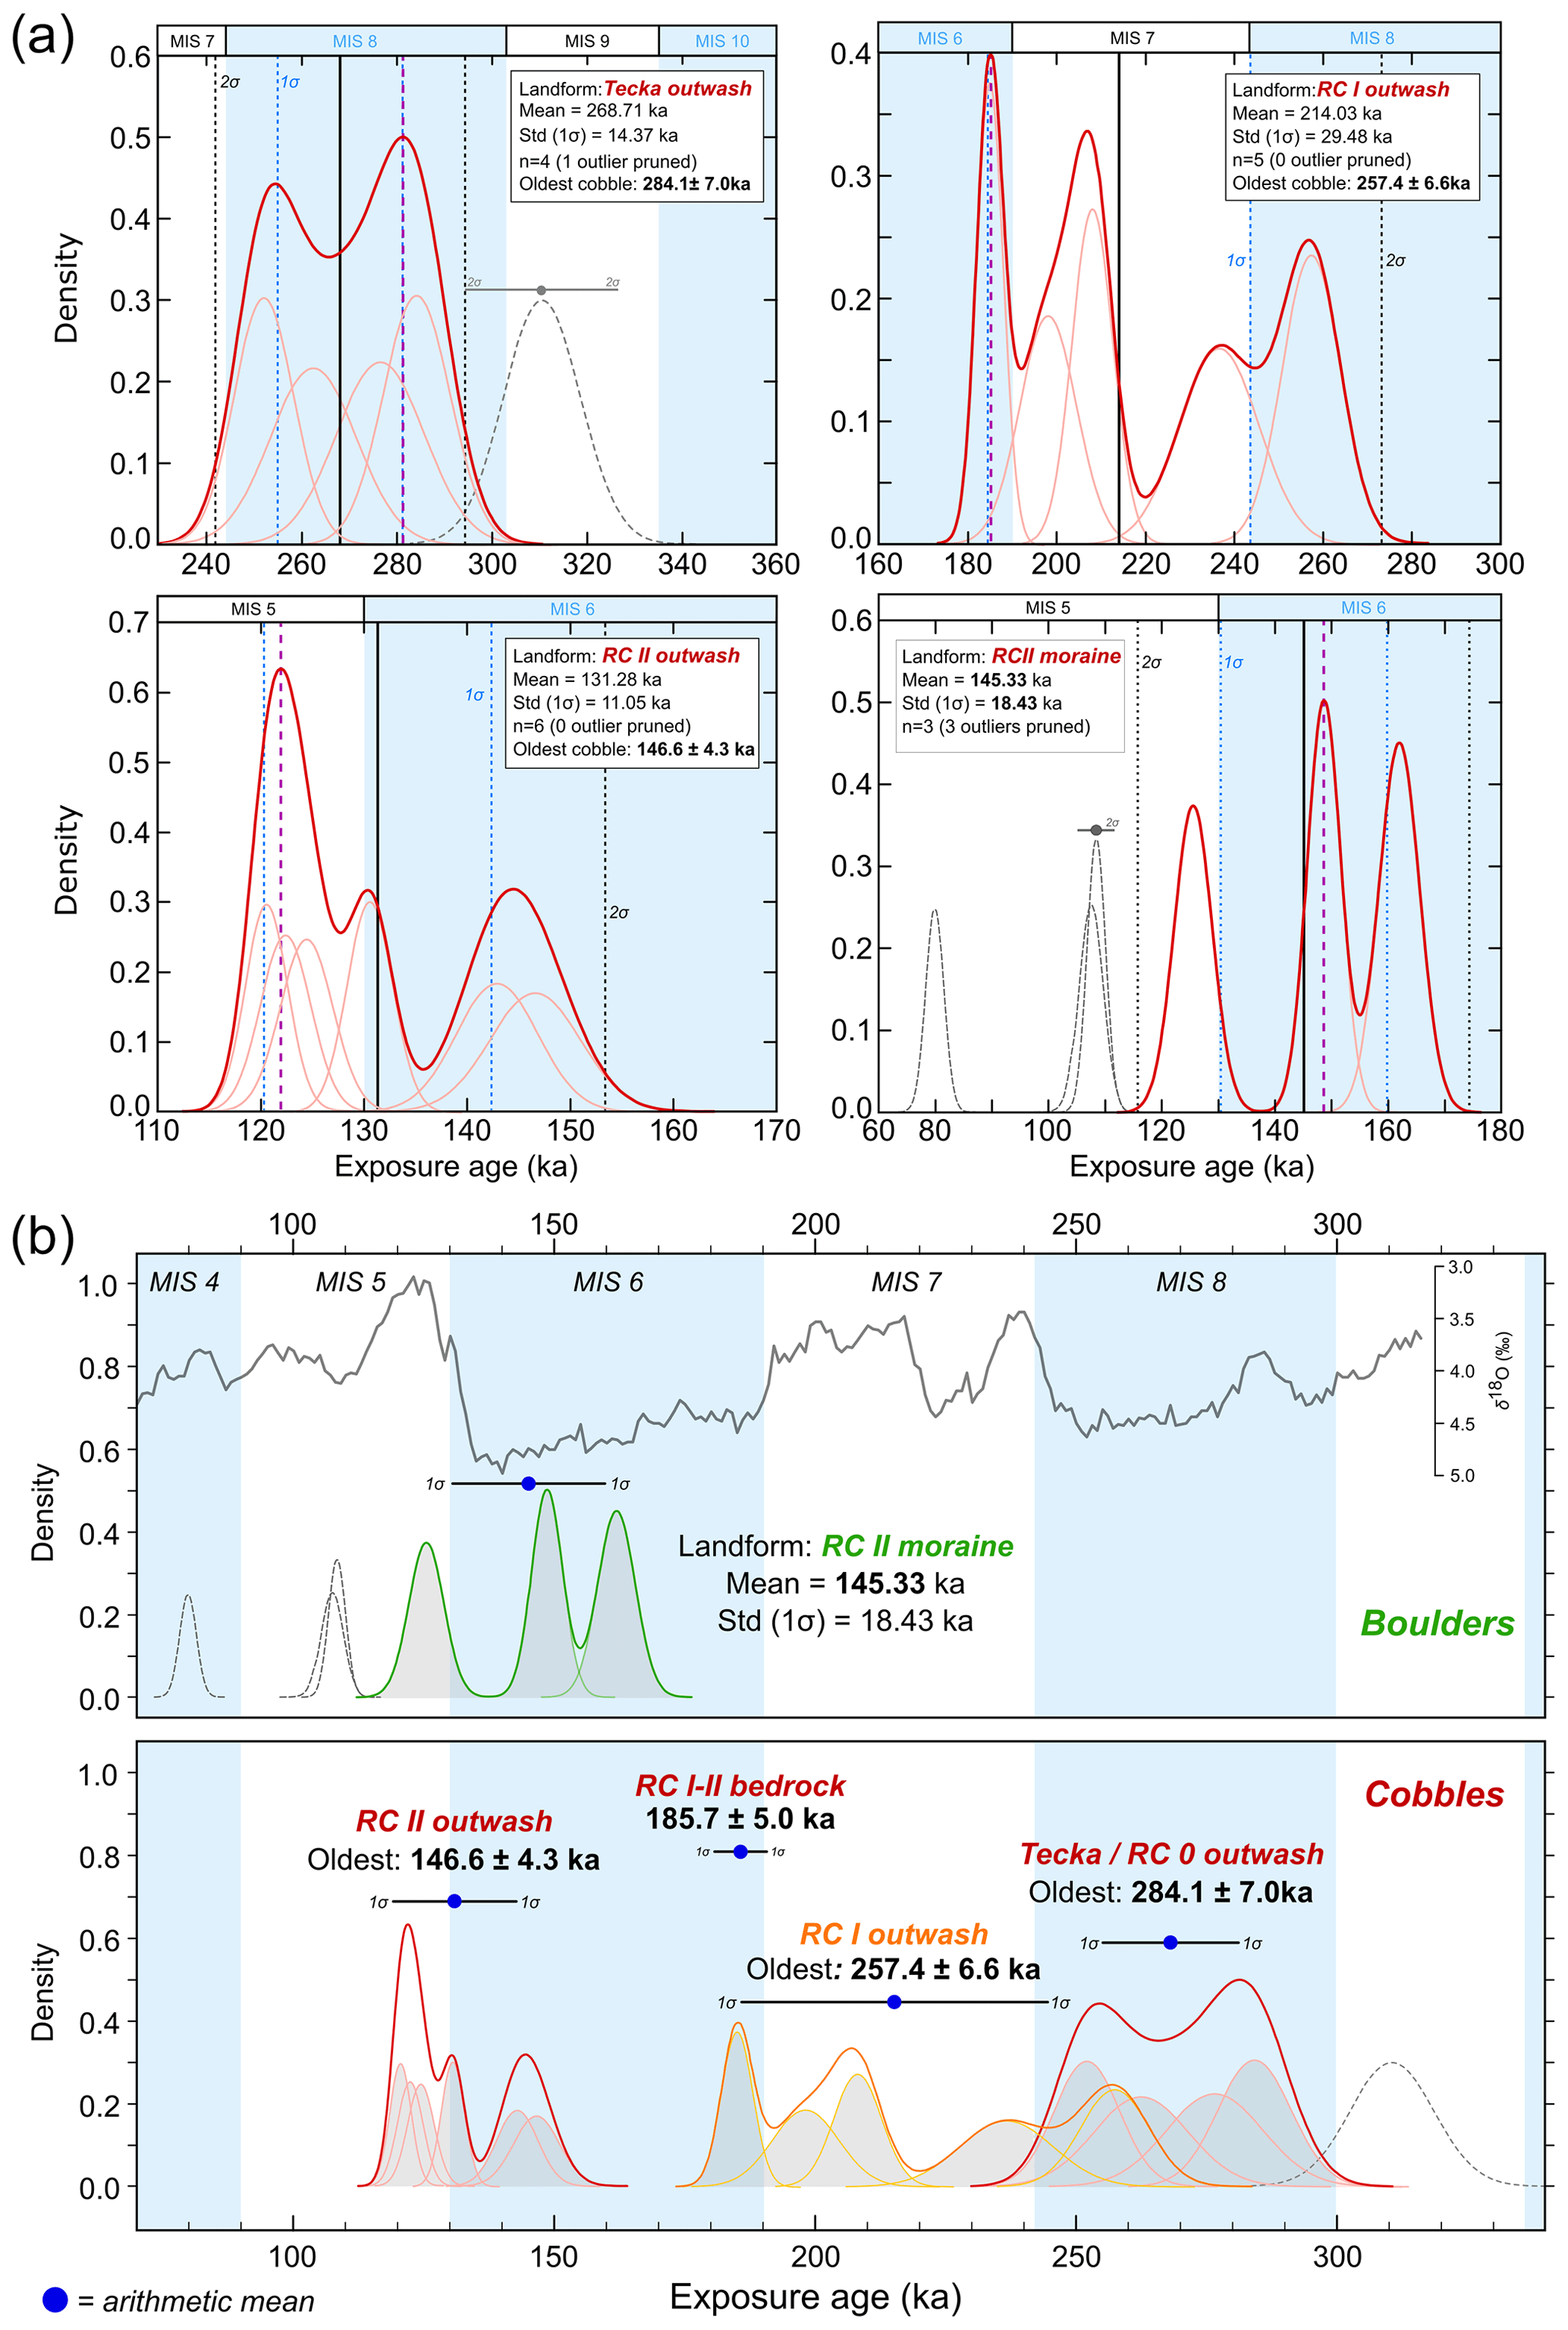
Figure 4(a) Kernel density plots adapted from IceTEA tools for exposure dating outputs (Jones et al., 2019) and summary statistics for dated landforms. Each thick red curve represents the summed probability distribution for the exposure-age population, excluding outliers, while thin red curves depict Gaussian curves for individual samples. Outliers are denoted by dashed grey curves. Dashed black and purple vertical lines denote the population's arithmetic mean and peak ages, respectively. (b) Same kernel density plots as (a) but visualised on a single timescale to enable better comparison of different landform ages and the relative exposure-age scatter between surface outwash cobble and moraine boulder samples. Panel (b) also features the global LR04 stack of benthic δ18O records of Lisiecki and Raymo (2005) that are commonly used to define the timing of Marine Isotope Stages and are denoted by alternating white and blue vertical bands here.
5.1 TCN exposure age interpretations
5.1.1 The Tecka/RC 0 outwash cobble exposure ages
Surface cobbles from the Tecka/RC 0 outwash (Fig. 1c) yield a mean exposure age of 268.7±14.4 ka (n=4), excluding one statistical outlier with an age of 311.5±8.1 ka, and display a discernible amount of exposure-age scatter (MSWD: 4.38>k). Following the rationale outlined in Sect. 4.3, we consider the outwash's oldest cobble (284.1±7.0 ka) to be the closest minimum-age estimate for the RC 0 advance (Figs. 4, 5). The relatively tight cluster of remaining exposure ages (284±7–252±6 ka) supports this interpretation (Fig. 4).
At the sampling sites, the outwash terrace surface displays preserved braided meltwater channels that suggest minimal outwash surface deflation post deposition. We therefore assess the possible impact of cryoturbation alone on exposure-age underestimation and estimate broadly the potential magnitude of former cobble exhumation through soil. To do so, we model the constant exhumation of all sampled cobbles (excluding outliers) through a given soil horizon (density: 1.3 g cm−3) and calculate the resulting exposure-age bias caused by cosmic-ray attenuation with depth (Gosse and Phillips, 2001; see the Supplement). We acknowledge that cobble upfreezing was unlikely to have been continuous and of a similar magnitude for all cobbles. We assume that some of this variability is considered by reporting a population mean exposure age post simulation that matches the original age of the oldest cobble, although this assumption undoubtedly yields uncertainties. Using such simulations, we calculate that a soil thickness of ∼12 cm would have been required for the Tecka/RC 0 cobbles to yield a mean 10Be exposure age (283.1±15.0 ka: +5.7 %) that approximately matches that of the oldest original surface cobble. This estimated magnitude of cobble upfreezing is plausible given our observations of modern soil thicknesses (0–20 cm) near to the sampling locations. Therefore, despite local semi-arid conditions, cobble exhumation due to cryoturbation through a realistic soil thickness can potentially explain the observed exposure-age scatter (Fig. 5). Such results may also support the hypothesis that outwash surface erosion and deflation was minimal at this location.
In summary, our interpretations suggest that the exposure ages from the Tecka outwash place the timing of the RC 0 advance at around 290–270 ka, during the Marine Isotope Stage (MIS) 8 (300–243 ka; Lisiecki and Raymo, 2005) interval (Figs. 4, 6).
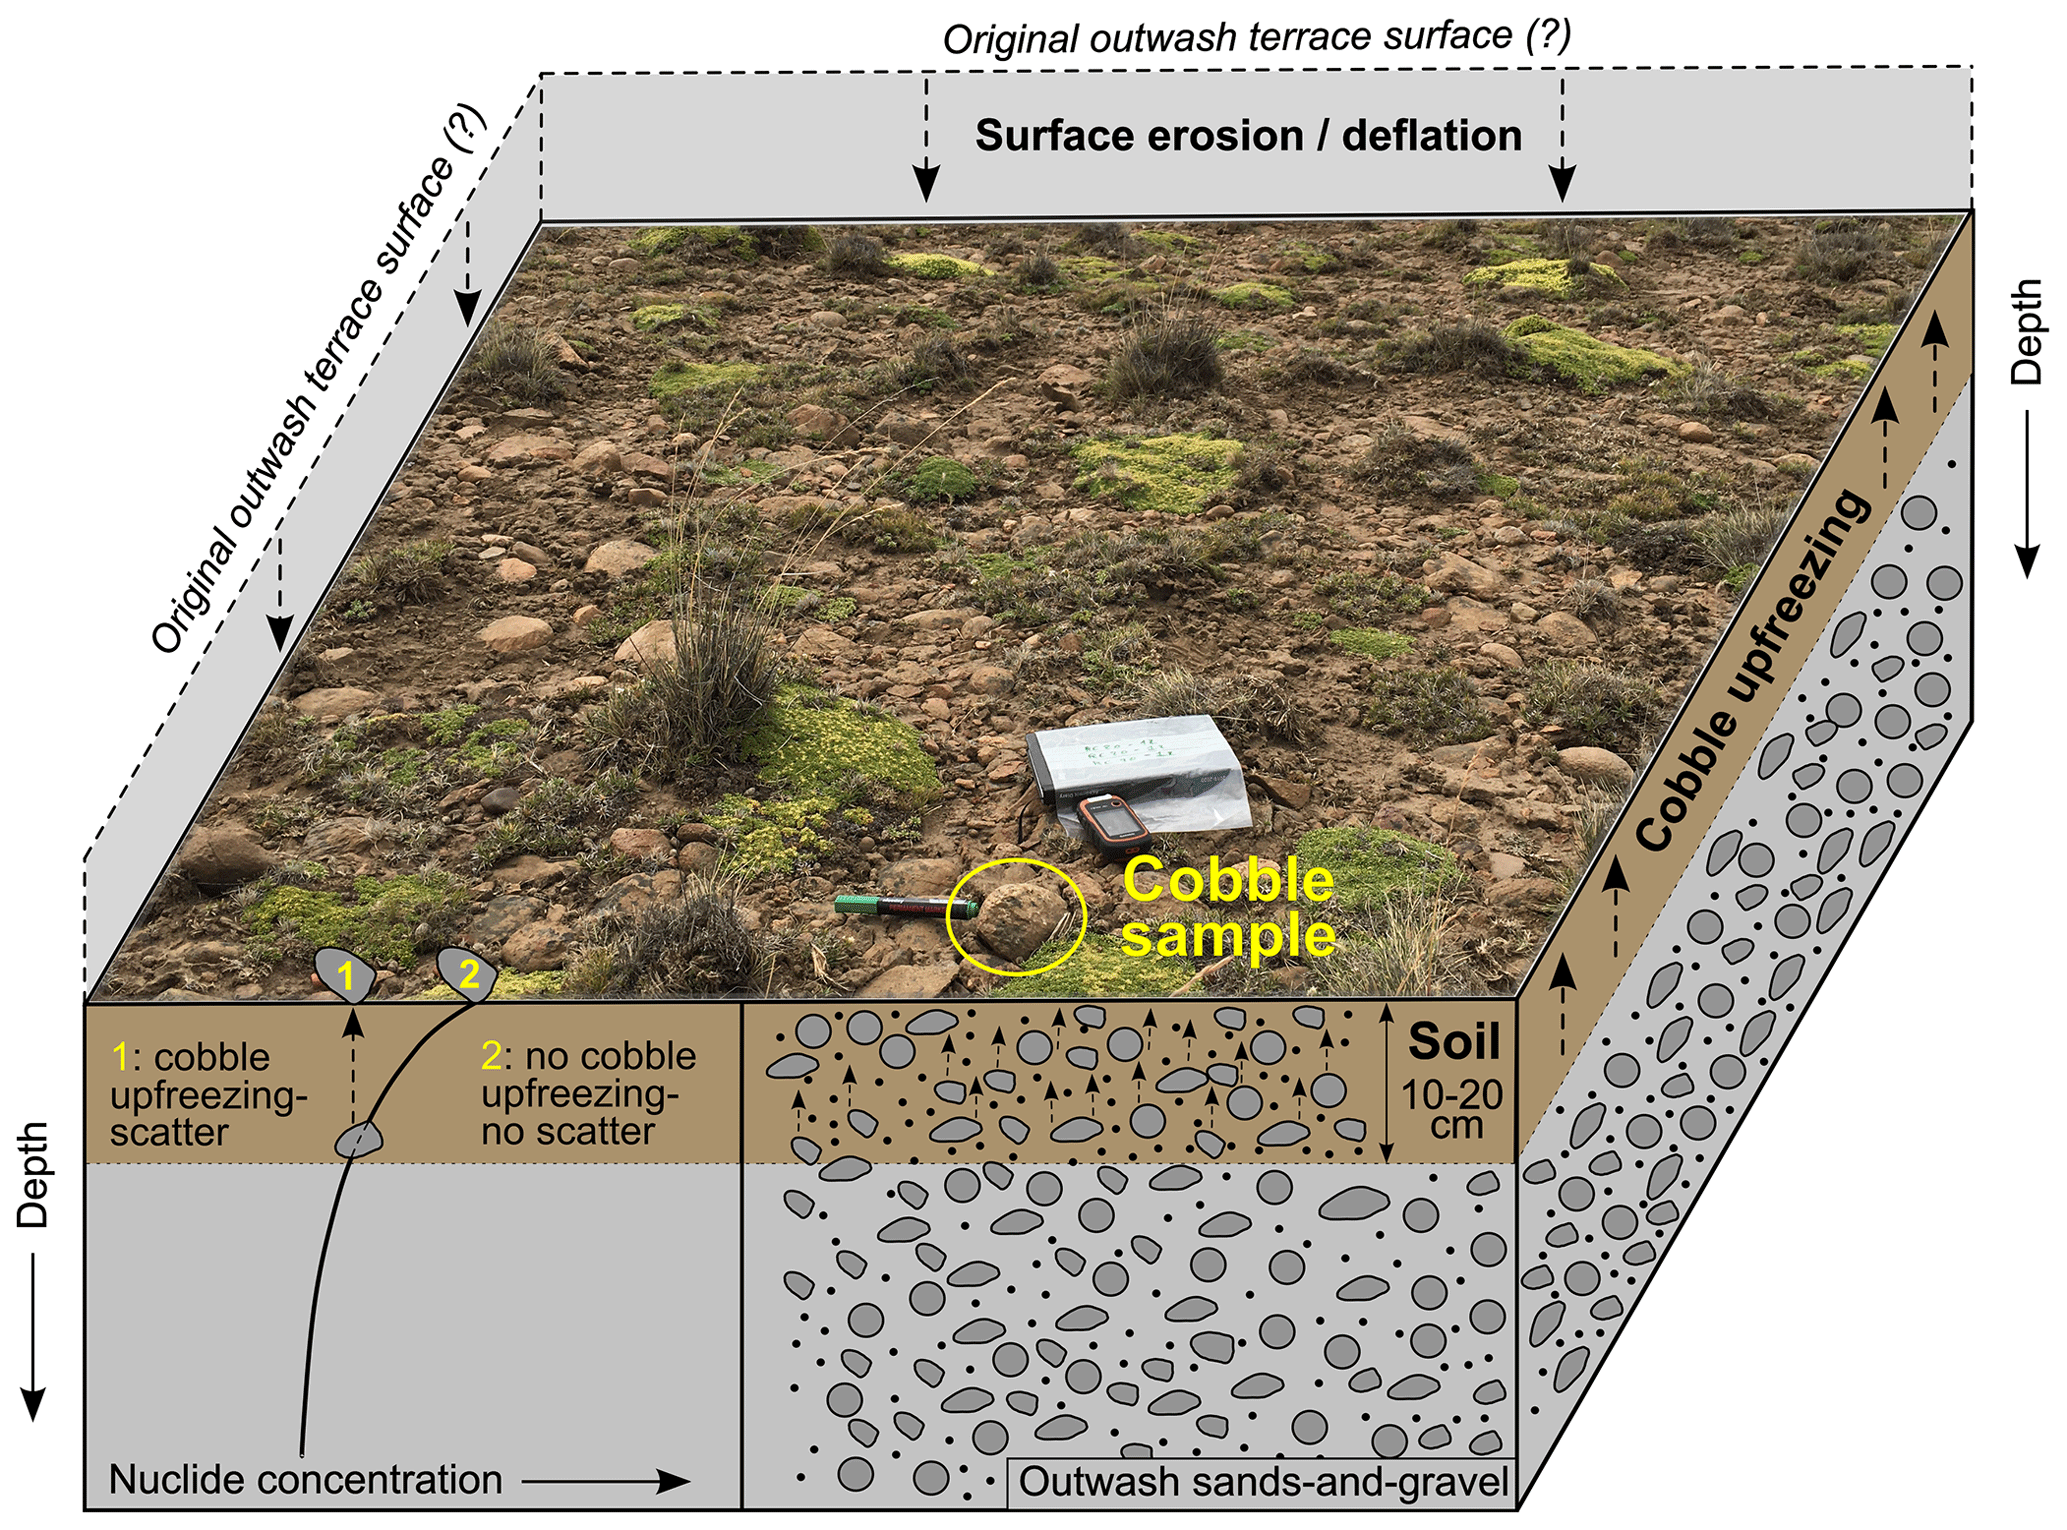
Figure 5Illustration of the impact of combined outwash–plain surface deflation and near-surface turbation on the exposure-age scatter for the outwash surface cobbles sampled. The relationship between depth and nuclide concentration is illustrated by the decay curve (purely schematic) at the bottom left-hand corner of the diagram, which demonstrates that radionuclide production in rock minerals reduces with depth below the surface due to cosmic-ray attenuation. The attenuation effect causes cobbles that have experienced some exhumation post deposition due to the effect of upfreezing (dashed vertical arrows; scenario 1) to display exposure-age scatter, causing landform deposition age underestimation. Cobbles that have remained near the outwash surface since deposition (scenario 2) will display less/no scatter and provide a better estimate of the true minimum outwash deposition age. Cobble upfreezing is considered to mainly occur within the soil horizon (brown coloured) due to the impact of potential permafrost formation. Soil thickness is locally estimated to reach a maximum of ∼20 cm. The outwash surface photograph focuses on one of the surface cobbles sampled (yellow circle) and enables the assessment of the surface cobble density, roundness, size, vegetation type, and cover density that are characteristic of outwash plain surfaces sampled within the context of this investigation.
5.1.2 The RC I outwash cobbles and the RC I outermost advance
Surface cobbles from the RC I outwash are poorly clustered (MSWD: 33.6>k) and afford a mean exposure age of 214.0±29.5 ka and an oldest cobble age of 257.4±6.6 ka (Table 2, Fig. 4). As previously justified (Sect. 4.3), we consider the population's oldest cobble (257.4±6.6 ka) as the closest minimum-age estimate for the RC I outwash deposition. Simulations of constant cobble upfreezing through soil (Sect. 5.1.1) demonstrate that a mean exposure age (257.2±35.3 ka: +20 %) similar to that of the oldest original cobble is obtained when simulating constant exhumation through a ∼39 cm thick soil horizon. Although reasonable, this average soil thickness is greater than modern observations (0–20 cm). For these cobbles, three distinct outwash surface locations were sampled. They display near identical surface morphologies, vegetation cover and apparent modern soil thicknesses (Fig. 2d). It is thus challenging to assess whether spatially variable cryoturbation could have contributed to the observed scatter. This may indicate that, additionally to cobble upfreezing, outwash surface deflation played, in this instance, an important role in causing significant exhumation of certain RC I cobbles post deposition. This hypothesis is supported by the observation that RC I cobble exposure ages display three distinct age groups that correspond with the three different sampling locations (Table 1, Fig. S3 in the Supplement). The first group (sample RC20-16) yields an exposure age of 257.4±6.6 ka, while the second (RC20-12 and 13) and third (RC20-14 and 15) groups display mean exposure ages of 222.4±20.2 and 191.5±9.3 ka, respectively. We note that the 1σ standard deviations associated with these age groups do not overlap. Thus, it seems plausible that outwash surface deflation was greater at the locations of the second and third sample groups, which, combined with clast upfreezing, could therefore explain the substantial exposure-age scatter observed in the 10Be age distribution of the RC I outwash cobbles.
An alternative hypothesis to explain the large RC I exposure-age scatter would be to argue that the RC I outwash could be a composite glaciofluvial deposit formed by meltwater runoff associated with numerous distinct RC outlet-glacier advances. While we commonly expect younger glaciofluvial sedimentation to bury previous deposits, certain cobbles associated with the oldest advances could have been remobilised by either meltwater or ice during younger advances and re-deposited towards the outwash surface. The overlap between the youngest RC I outwash cobble age (185.0±3.0 ka) and the deglacial 10Be age (185.7±5.0 ka) obtained from the ice-moulded bedrock surface sampled directly inboard of the RC I limit could support this hypothesis. Moreover, the RC I moraine belt is a wider (∼4 km) complex that constitutes more ice-contact hummocks and hummocky ridges, suggestive of a greater glaciogenic sediment volume than the RC 0 and RC II moraine complexes (Fig. 6a). This geomorphological distinction could signal that a higher number of individual outlet-glacier advances have reached the RC I margin.
Establishing which of the previous hypotheses are more likely to be valid would require a more detailed chronological and sedimentological analysis through a depth profile of the RC I outwash deposit. However, regardless of which mechanism is responsible for the observed exposure-age scatter, we argue that the oldest exposure age from the RC I outwash suggests that a separate extensive advance of the RC outlet glacier occurred at around 270–245 ka, during the latest stage of the MIS 8 interval (Figs. 4, 6).
5.1.3 The sampled bedrock surface and the innermost RC I advances
The sampled ice-moulded bedrock's position and elevation (1026 m a.s.l.) suggest that it was exposed after deglaciation from the RC I moraine–outwash complex and prior to the RC II advance (Figs. 1c, 6a). Its 10Be age of 185.7±5.0 ka is thus interpreted as a minimum-age estimate of ice-front retreat after the innermost RC outlet-glacier advance had reached the RC I moraine complex. The older RC I outwash-cobble mean exposure age (214.0±29.5 ka) brings further evidence for this stratigraphic relationship. The 26Al 10Be ratio (6.8±0.3) from this surface bedrock sample does not indicate a complex exposure-burial history (within uncertainty), thus suggesting that the RC glacier did not advance beyond and bury the bedrock for a prolonged and >100 kyr period (Fig. S1 in the Supplement). This ratio also demonstrates efficient subglacial erosion of the bedrock surface, which created a fresh surface free of inherited nuclides when last covered by ice.
Unlike other samples, we noticed signs of surface erosion on the bedrock outcrop (Fig. 2e). The surface demonstrated a lack of fluvio-glacial polish preservation and showed signs of homogeneous granular disintegration to a depth that proved challenging to quantify in the field. The coarser-grained and flat nature of this rock surface may have caused it to be more subject to frost wedging than rounded moraine boulders. We thus suspect a certain degree of exposure-age underestimation from this bedrock sample (RC20-01). Applying the rock-surface erosion rate of 0.2 mm kyr−1 estimated for semi-arid central Patagonia (Douglass et al., 2007; Hein et al., 2017) increases its age by 3 % to 191.3±5.3 ka, which is within the 1σ analytical uncertainty of the exposure age. Subsequently, this minimum deglacial exposure age suggests that the youngest outlet-glacier advance to have reached the RC I moraine complex had to have occurred prior to ∼190 ka. This interpretation is coherent with RC I outwash cobble exposure ages, and together indicate that the RC I complex was most likely deposited prior to the MIS 6 (191–130 ka; Lisiecki and Raymo, 2005) cold interval. Because palaeo-climate proxy records such as the Antarctic atmospheric temperature and global SST suggest a return to warmer, near-interglacial conditions between the MIS 7d interstadial (∼ 220–230 ka) and ∼190 ka (Fig. 8; Parrenin et al., 2013; Shakun et al., 2015), it is possible that the innermost RC I advance occurred during or prior to the MIS 7d interstadial.
To summarise, outwash cobble and bedrock ages suggest that outermost RC I glaciogenic deposits were likely deposited by a MIS 8 glacier advance (∼ 270–245 ka), as portrayed by the oldest outwash cobble age (Figs. 6b, 7). On the other hand, the innermost and youngest outlet-glacier advance to have reached the multi-ridge, 4 km-wide RC I moraine complex (Figs. 1c, 6a) may have been significantly younger, and perhaps occurred during the MIS 7d interstadial. However, the latter part of this interpretation remains unclear due to the lack of chronological data for the innermost RC I deposits in combination with the analytical uncertainties and the large scatter displayed by outwash cobble exposure ages from this margin. More chronological constraints are thus required to test this hypothesis.
5.1.4 The RC II exposure ages
As for the older RC I and Tecka outwash cobble samples, we argue that the observed scatter (MSWD: 11.4>k) in the RC II outwash cobble exposure ages (mean: 131.3±11.1 ka) likely originates from cobble exhumation and minor outwash-surface deflation (Fig. 5). This interpretation is reinforced by cobble ages displaying a younger mean age and a tighter cluster than moraine boulders from the stratigraphically equivalent glacial margin (RC II; Table 2, Fig. 4). Consequently, the oldest surface cobble (146.7±4.3 ka) is deemed a better minimum-age estimate for the RC II glacial advance. We find that a similar mean exposure age (145.5±12.6 ka: +11 %) to that of the oldest cobble can be obtained when simulating the constant exhumation of all cobbles (see Sect. 5.1.1) through a 24 cm thick soil horizon. This estimate, although highly uncertain, is consistent with modern soil thickness observations near sampling locations (0–20 cm). This simulation suggests that, despite local semi-arid conditions, cobble upfreezing through a realistic soil thickness can cause the observed exposure-age scatter leading to the age underestimation of outwash plain formation. In summary, the RC II outwash cobble ages seem to suggest a minimum-age estimate of ∼145 ka. Therefore, we argue that the RC II limit reflects an extensive expansion of the local PIS outlet glacier that occurred towards the latest stage of MIS 6 (Figs. 4, 6, 7).
Following outlier removal (n=3), the RC II moraine boulder mean exposure age (n=3; 145.3±18.4 ka) overlaps the RC II mean outwash cobble age within the 1σ analytical uncertainty. The boulder population also displays two ages that are consistent with the set of outwash cobbles (125.5±3.4 and 148.6±3.0 ka). These results support our stratigraphic interpretation that these two landforms were deposited by the same outlet-glacier advance. Because we sampled rounded boulders and specifically targeted raised rock fragments presenting polished surfaces, here we consider boulder surface erosion to be negligible, in contrast to the sampled ice-moulded bedrock surface, where granular disintegration was ubiquitous. The population's oldest boulder (RC20-04: 161.9±3.6 ka) displays an ∼15 kyr older exposure age than the oldest RC II outwash surface cobble. Cosmogenic nuclide inheritance from pre-glacial-transport exposure is considered unlikely given the >80 km distance to the source region and the sub-rounded morphology of the boulders sampled, indicative of subglacial clast erosion (Fig. 3b,c). We instead propose that this older boulder may reflect at least one earlier glacial advance to the same terminal position, or may have been re-deposited during the RC II advance following exposure during previous glacier advances that reached proximal inboard ice-front positions. The 26Al 10Be concentration ratio from this sample (6.3±0.3) does not suggest a prolonged period of boulder burial (Fig. S1 in the Supplement). We therefore hypothesise that previous PIS advances might have occurred locally during earlier MIS 6 cold intervals (e.g. MIS 6c, e), while the youngest penultimate MIS 6 glacial maximum is more accurately dated by the RC II surface outwash cobbles, as the glaciofluvial terraces likely remained active until the end of the glaciation.
Overall, our results from the RC II limit (n=12 ages) indicate that outwash surface cobble ages display less post-depositional scatter than moraine boulder ages, with MSWD values of ∼11 vs. ∼30, respectively. This comparison thus agrees with results of Hein et al. (2009, 2017) suggesting that well-rounded cobbles sampled from the surface of former proglacial outwash plains are better suited for numerically dating pre-LGC glaciations in semi-arid, undisturbed environments such as the Argentinian steppe of Patagonia. However, even if semi-arid conditions usually limit the soil thickness to <20 cm on outwash plains of the Argentinian steppe, our simulations show that potential cobble exhumation due to cryoturbation alone can cause meaningful landform-age underestimations for pre-LGC glacial deposits. This source of post-depositional exposure-age scatter is thus important to consider when interpreting outwash surface cobble exposure ages. Another advantage of targeting outwash cobbles is their abundance in formerly active glaciofluvial environments, while moraine boulders on pre-LGC margins are often sparse and, where found, are highly eroded. This enables rigorous selection of the cobbles that are most suitable for TCN exposure dating. On the other hand, obtaining exposure ages from both moraine boulders and outwash cobbles can provide additional insight into former glacier activity that may not be evident without the combined approach.
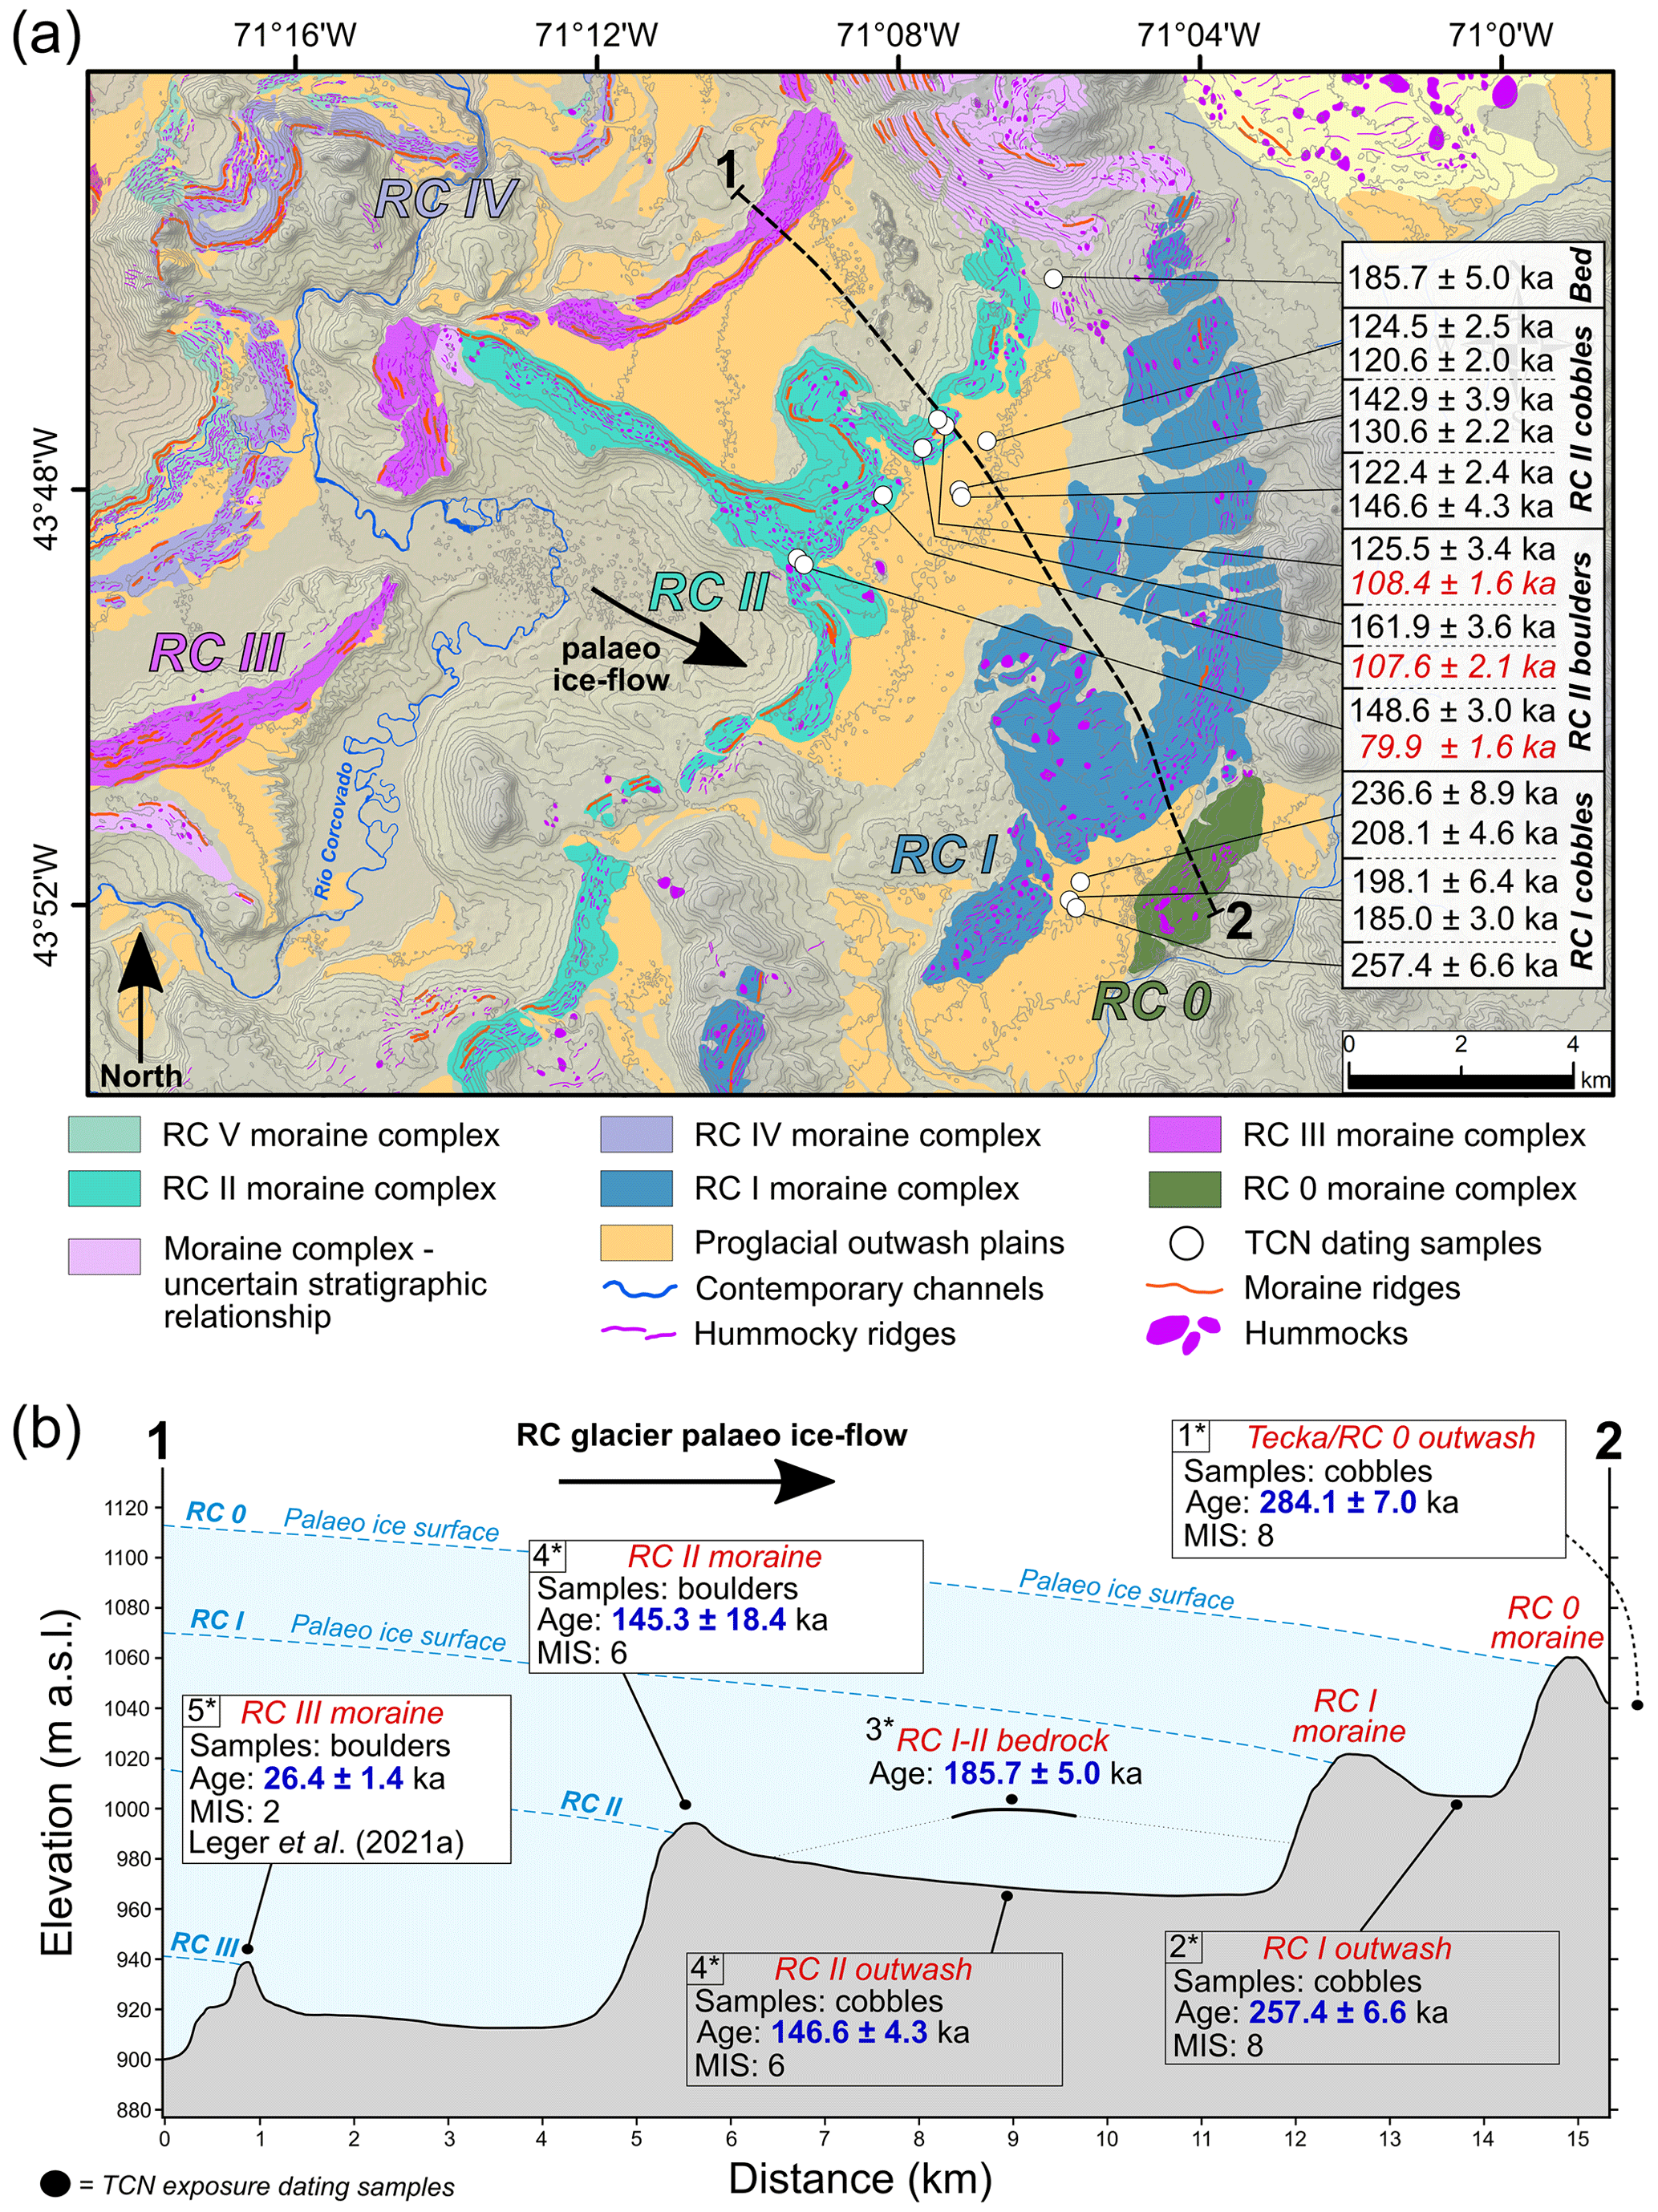
Figure 6(a) Glacial geomorphological map focused on the RC 0 to RC II moraine-outwash sequence around the location of TCN exposure dating samples, as highlighted by white dots (with the exception of Tecka/RC 0 outwash samples, Fig. 1c). Displayed exposure ages are 10Be ages ±1σ analytical uncertainties, calibrated with LSDn scaling and the central Patagonia production rate (Kaplan et al., 2011). Ages in red were interpreted as outliers. “Bed” stands for “bedrock” and depicts the ice-moulded bedrock surface sampled. Elevation data are provided by the 30 m resolution DEM from the ALOS World 3D missions (AW3D30, version 2.2; JAXA; https://www.Eorc.jaxa.jp/ALOS/en/aw3d30/, last access: 29 March 2022) with a shaded relief background and elevation contour lines at 15 m intervals. (b) Simplified and smoothed elevation profile graph (DEM data: AW3D30) drawn along the black line denoted in panel (a), along with TCN exposure dating results (10Be) from the RC 0–III moraine-outwash dataset after interpretation of the best minimum-age estimate for each dated landform. Palaeo-ice surface elevation and slope gradients are hypothetical and purely schematic. * Stratigraphic order of events (1: oldest, 5: youngest).
5.2 Comparisons with palaeo-climate and global cryosphere contexts
5.2.1 The MIS 8 glaciations
Our chronology suggests that two of the most extensive PIS advances preserved at the study site (RC 0 and RC I outermost) occurred during MIS 8, at around 290–270 and 270–245 ka, respectively (Figs. 6, 7). These expansion events are coeval within dating uncertainties, with glacial advances recorded by the two largest outlet glaciers of the former PIS in central Patagonia. There, the penultimate glacial advances in both the Lago Buenos Aires valley (46.5∘ S; Hein et al., 2017; Fig. 1) and the Lago Pueyrredón valley (47.5∘ S; Hein et al., 2009) are thought to have occurred during MIS 8 (Fig. 8i, h). Altogether, these three pre-LGC Patagonian TCN chronologies indicate that the MIS 8 glacial events were some of the PIS's most extensive Pleistocene glaciations. These advances likely affected the former PIS across a large latitudinal range, as they can now be traced across multiple valleys from central to northern Patagonia. The geographical ubiquity of these events is diagnostic of a strong climatic forcing, while their timing coincides with some of the lowest middle Pleistocene δ deuterium values recorded over Antarctica at around 280–270 ka, which are associated with a maximum MIS 8 Antarctic cooling of −8.5 ∘C relative to pre-industrial modern temperatures (Parrenin et al., 2013; Fig. 8). The RC 0 advance may also be coeval with a severe peak in the dust flux recorded in the EPICA Dome C Antarctic ice core at ∼270 ka (Lambert et al., 2008; Fig. 8). Isotopic composition analyses have demonstrated that Antarctic ice-core dust concentrations are positively correlated to outwash-plain activity in southern Patagonia, and thus may directly reflect PIS outlet-glacier expansion events (Sugden et al., 2009; Koffman et al., 2021).
During MIS 8, Northern Hemisphere (NH) mid-latitude summer insolation intensity reached two distinct minima at 280 and 255 ka (Berger and Loutre, 1991; Fig. 8). These troughs are synchronous with peaks in the SH mid-latitude seasonality curve indicative of colder winters and warmer summers in Patagonia at those times (Fig. 8d; Darvill et al., 2016). Importantly, the signal of NH mid-latitude summer insolation intensity also mirrors orbitally controlled SH seasonal duration (Fig. 8c; Denton et al., 2021). Hence, Patagonia was experiencing longer, colder winters and shorter, warmer summers around 280 and 255 ka. In contrast, SH mid-latitude summer insolation intensity reached maximum values at 280 and 255 ka but minimum values at 292 and 268 ka, which are within the exposure-age scatter and analytical uncertainties associated with the dating of the RC 0 and outermost RC I advances (this study) and the MIS 8 advances of the Lago Buenos Aires and Lago Pueyrredón outlet glaciers (Hein et al., 2009, 2017). Therefore, due to current TCN exposure dating uncertainties, it remains a challenge to determine whether the MIS 8 Patagonian glaciation was coeval with a SH or a NH mid-latitude summer insolation intensity minimum. However, more accurate dating of younger PIS outlet-glacier advances occurring during the global LGM (MIS 2; e.g. Peltier et al., 2021), including the RC outlet glacier (RC III–VII; Leger et al., 2021a), has shown that these later SH glacier advances – and SSTs and Antarctic atmospheric temperature depressions – were anti-phased with SH summer insolation intensity, and were instead coeval with high SH seasonality and winter duration. Consequently, it is plausible that the PIS advanced at ∼280 ka (RC 0) and ∼255 ka (RC I), when SH summer insolation intensity was high but SH winters were cold and long. The proposed timing for the RC 0 advance is consistent with other SH palaeo-climate proxy records which suggest that peak MIS 8 cooling occurred relatively early during the glacial cycle (i.e. 280–270 ka; Fig. 8), in contrast with the later MIS 6 and MIS 5d to MIS 2 glaciations, which are characterised by maximum global cooling that occurred just prior to sudden glacial terminations (Hughes et al., 2020).
Paradoxically, MIS 8 displays a relatively weak global cooling signal in several records such as benthic δ18O (Hughes et al., 2020), and is thought to have been characterised by the lowest sea-level depression relative to other middle-Pleistocene 100 kyr glacial intervals (−93 m; Spratt and Lisiecki, 2016). Moreover, glacial terrestrial records from different regions demonstrate contrasting ice-sheet and glacier behaviours during MIS 8. Indeed, although stratigraphic evidence for MIS 8 glaciations is often elusive, some has been reported for the Fennoscandian and British-Irish ice sheets (Beets et al., 2005; Davies et al., 2012; White et al., 2010; 2017) and former ice sheets and glaciers overprinting Poland (Krznanian glaciations; Lindner and Marks; 1999), Siberia and Russia (Astakhov et al., 2011, 2016), central and southern Europe (e.g. Preusser et al., 2011), and the West Coast Range of Tasmania (Colhoun and Barrows, 2011; Kiernan et al., 2010). In North America, chronological constraints for the stratigraphic evidence of pre-MIS 6 glacial deposits are, in most cases, too imprecise to determine the Marine Isotope Stage to which they relate (Hughes et al., 2020). The review by Hughes et al. (2020) concludes that robust chronological evidence of MIS 8 glaciations is rare, and, where it is found, it is often characterised by margins located inboard of MIS 6 limits. In general, direct chronological evidence of MIS 8 glaciations more extensive than MIS 6-2 advances has only been found in Russia (east of the Urals; Astakhov et al., 2016) and Patagonia. Therefore, the extensive MIS 8 glaciation of Patagonia implies a strong regional cooling signal (Hein et al., 2017).
It has been noted in previous work that the major eastern Patagonian valleys, including the RC valley (Figs. 6, 7), feature records of progressively decreasing glacier extents as the glacier advances get younger (Singer et al., 2004; Kaplan et al., 2009; Cogez et al., 2018). This pattern may not be entirely climate related. Instead, it might be caused by a combination of long-term erosion of the accumulation area and focused subglacial erosion along former glacial valleys that resulted in glacial overdeepening (Kaplan et al., 2009). During Quaternary glacial cycles, selective subglacial erosion – shown to be most effective along the flowlines of warm-based PIS outlet glaciers and near the centre of the ice sheet, where the ice was thickest (Clapperton, 1983) – has caused rapid and zonally asymmetric overdeepening of the main Patagonian valleys (Rabassa and Clapperton, 1990). In the past ∼1.2 Myr, this erosive process has been estimated to cause >1000 m of bedrock elevation lowering in certain Patagonian valleys (Singer et al., 2004). Kaplan et al. (2009) argued that such overdeepening would likely have overcome the effects of tectonic- and glacial-isostatic-adjustment-related uplift. For a given location and identical climate forcing, erosion-driven bed lowering may have led to progressively more negative glacier mass balances during each major PIS expansion event, causing less extensive glacier advances with time. Moreover, while it was more effective towards the former ice divide, subglacial erosion would also have increased retrograde basal slope gradients and thus augmented basal shear stress during subsequent glacier advances. These processes could therefore partly explain the observed pattern of decreasing outlet-glacier extent through time in eastern Patagonia (Fig. 6). Consequently, although the geographically widespread MIS 8 advances of the PIS were most likely the result of strong climate forcing, their outboard positions relative to MIS 6-2 deposits do not necessarily indicate colder regional conditions during MIS 8 than during the younger advances.

Figure 7Palaeo-glacial reconstructions for the RC, RH, RF, and Lago Palena/General Vintter (LP/LGV) valleys for each of the advances/stillstands and deglacial events interpreted in this investigation (a–c). Panel (d) displays the ice extent associated with the RC III moraine complex, as described in detail in a companion publication (Leger et al., 2021a). The latter reconstruction includes the formation of glaciolacustrine phase one (here termed “PL1”; Leger et al., 2021a). The ice-sheet and mountain glacier models were digitised manually in ArcGIS. Apart from when they are delineated by confidently mapped moraine limits (e.g. the RC, RH, and LP/LGV moraine sequences), the geographical locations of ice margins are inferred from the topography. Topographic data are from the AW3D30 DEM. “OC” and “MB” denote the type of rock samples used for TCN exposure dating of the represented event, and stand for “outwash cobbles” and “moraine boulders”, respectively. Yellow stars indicate the approximate sample locations for TCN exposure dating of each represented event, while each panel features the number of 10Be exposure ages produced (n=x) at the bottom left-hand corner (this excludes 26Al ages). There are no previously published glacier chronologies for the RH, RF, and LP/LGV valleys. Relative ice extents in those neighbouring valleys are thus inferred from our RC chronology and cross-valley comparisons of moraine set numbers, preservation, and morphostratigraphy. Hence, these inferences yield some uncertainties. Proglacial lake volume estimates were computed from DEM data (AW3D30).
5.2.2 The MIS 6 glaciation
TCN exposure ages from the RC II deposit suggest that a major expansion of the PIS occurred during MIS 6 and towards the latter part of the glacial interval at around 130–150 ka (Figs. 4, 6, 7). Our chronology suggests that maximum PIS expansion occurred just prior to the rapid global warming leading to MIS 5e, one of the warmer middle-to-late Pleistocene interglacial periods (Fig. 8). This is consistent with global sea-level reconstructions suggesting that the second greatest global ice volume of the past 800 kyr, associated with a sea-level minimum of −125 m, was reached towards the end of MIS 6, at ∼ 140–135 ka (Spratt and Lisiecki, 2016). At that time, mean atmospheric temperatures over Antarctica are estimated to have reached their second lowest values of the past 800 kyr (−9.3 ∘C relative to the pre-industrial period; Fig. 8). Global cooling during MIS 6 was more persistent than during other middle Pleistocene glacial cycles. Indeed, this cycle is associated with four major Antarctic atmospheric temperature minima spread over ∼50 kyr and occurring at around ∼185, ∼165, ∼155, and ∼140 ka (Parrenin et al., 2013; Fig. 8). As observed for the MIS 8 interval, these peaks in atmospheric cooling occurred a few kyr after NH summer insolation intensity minima associated with SH seasonality and winter duration maxima. Global SSTs and atmospheric CO2 concentrations remained consistently low for the same 50 kyr time window between ∼190 and ∼140 ka (Bereiter et al., 2015; Shakun et al., 2015). The persistence of the cold phase throughout MIS 6 may have facilitated multiple expansions of the PIS at this time. In our 10Be chronology, this may be reflected in the potential recycling and re-deposition of one RC II moraine boulder sample, yielding a 10Be exposure age of 162±4 ka during the younger penultimate advance dated by the RC II outwash cobbles (∼ 130–150 ka).
Evidence for several distinct MIS 6 glaciations has been reported from other regions of the world. For the European Ice Sheet, for instance, stratigraphic investigations have led to the dating, and naming, of two glaciations within MIS 6: the Late Saalian Drenthe glaciation at 175–155 ka and the Warthe Stadial between 150 and 135 ka (Toucanne et al., 2009; Margari et al., 2014). More generally, MIS 6 glacial deposits are ubiquitous near former glacial margins and are documented by a wider body of evidence than other pre-LGC glaciations (e.g. Rinterknecht et al. 2012; Putnam et al., 2013; Kiernan et al., 2014; Evans et al., 2019; Fernandes et al., 2021), suggesting that the greatest global ice volume of the middle Pleistocene was likely reached during that interval (Hughes et al., 2020). In Patagonia, however, our chronology is amongst the first published datasets offering the direct and robust dating of a MIS 6 glacial expansion event. Indeed, the well-studied Lago Pueyrredón and Lago Buenos Aires pre-LGC moraine-outwash records do not provide clear chronological evidence for MIS 6 advances (Hein et al., 2009, 2017). However, this may just imply that the MIS 2 advances of the Lago Pueyrredón and Lago Buenos Aires outlet glaciers were more extensive than any MIS 6 glacial events. Therefore, just as for the MIS 8 glaciation, MIS 6 expansions of outlet glaciers may have been ubiquitous throughout the former PIS. However, the current lack of robust pre-LGC glacier chronologies in Patagonia prevents this hypothesis from being tested adequately.
5.2.3 Synthesis: the timing of Patagonian glaciations
Along with companion publications focusing on the LGC (Leger et al., 2020, 2021a), our findings illustrate that the preserved sequence of moraine-outwash complexes in the RC valley system records a minimum of four major PIS expansion events occurring during MIS 8, 6, and 2. In Antarctic atmospheric paleo-temperature proxy records, global SST records, and global atmospheric CO2 records, the strongest minima between today and 330 ka are all recorded by the RC moraine-outwash complexes, with the exception of the 70–60 ka (MIS 4) cold interval, for which no preserved moraine-outwash complex could be found at the study site. However, we note that a major advance of the PIS near this time did occur on the western side of the Andes at 42∘ S (García et al., 2021; Gómez et al., 2022). There, Garcia et al. (2021) dated glacial sediments on the Isle of Chiloe to 57.8±4.7 ka, or early MIS 3, with a somewhat smaller advance occurring during MIS 2 at 26.0±2.9 ka. The lack of a corresponding MIS 3/4 moraine east of the mountains suggests that the PIS behaved asynchronously between its western and eastern margins at this time. In southeastern Patagonia, advances more extensive than MIS 2 were also dated to MIS 4 and 3 using TCN exposure dating (e.g. Darvill et al., 2016; García et al., 2018; Peltier et al., 2021). We argue that while the RC outlet glacier most likely advanced during the MIS 4 and 3 cooling events, these intervals were relatively short lived, impeding the PIS from becoming locally thick enough to allow the RC outlet glacier to advance along its retrograde bed slope and generate an extensive advance. Very likely, in addition, all glaciogenic deposits associated with MIS 3/4 advances may have been eroded during the younger MIS 2 advances. This may suggest that steady cooling over periods > 15–20 kyr is an important pre-requisite for northeastern PIS outlet glaciers to reach a mass balance positive enough to enable highly extensive advances.
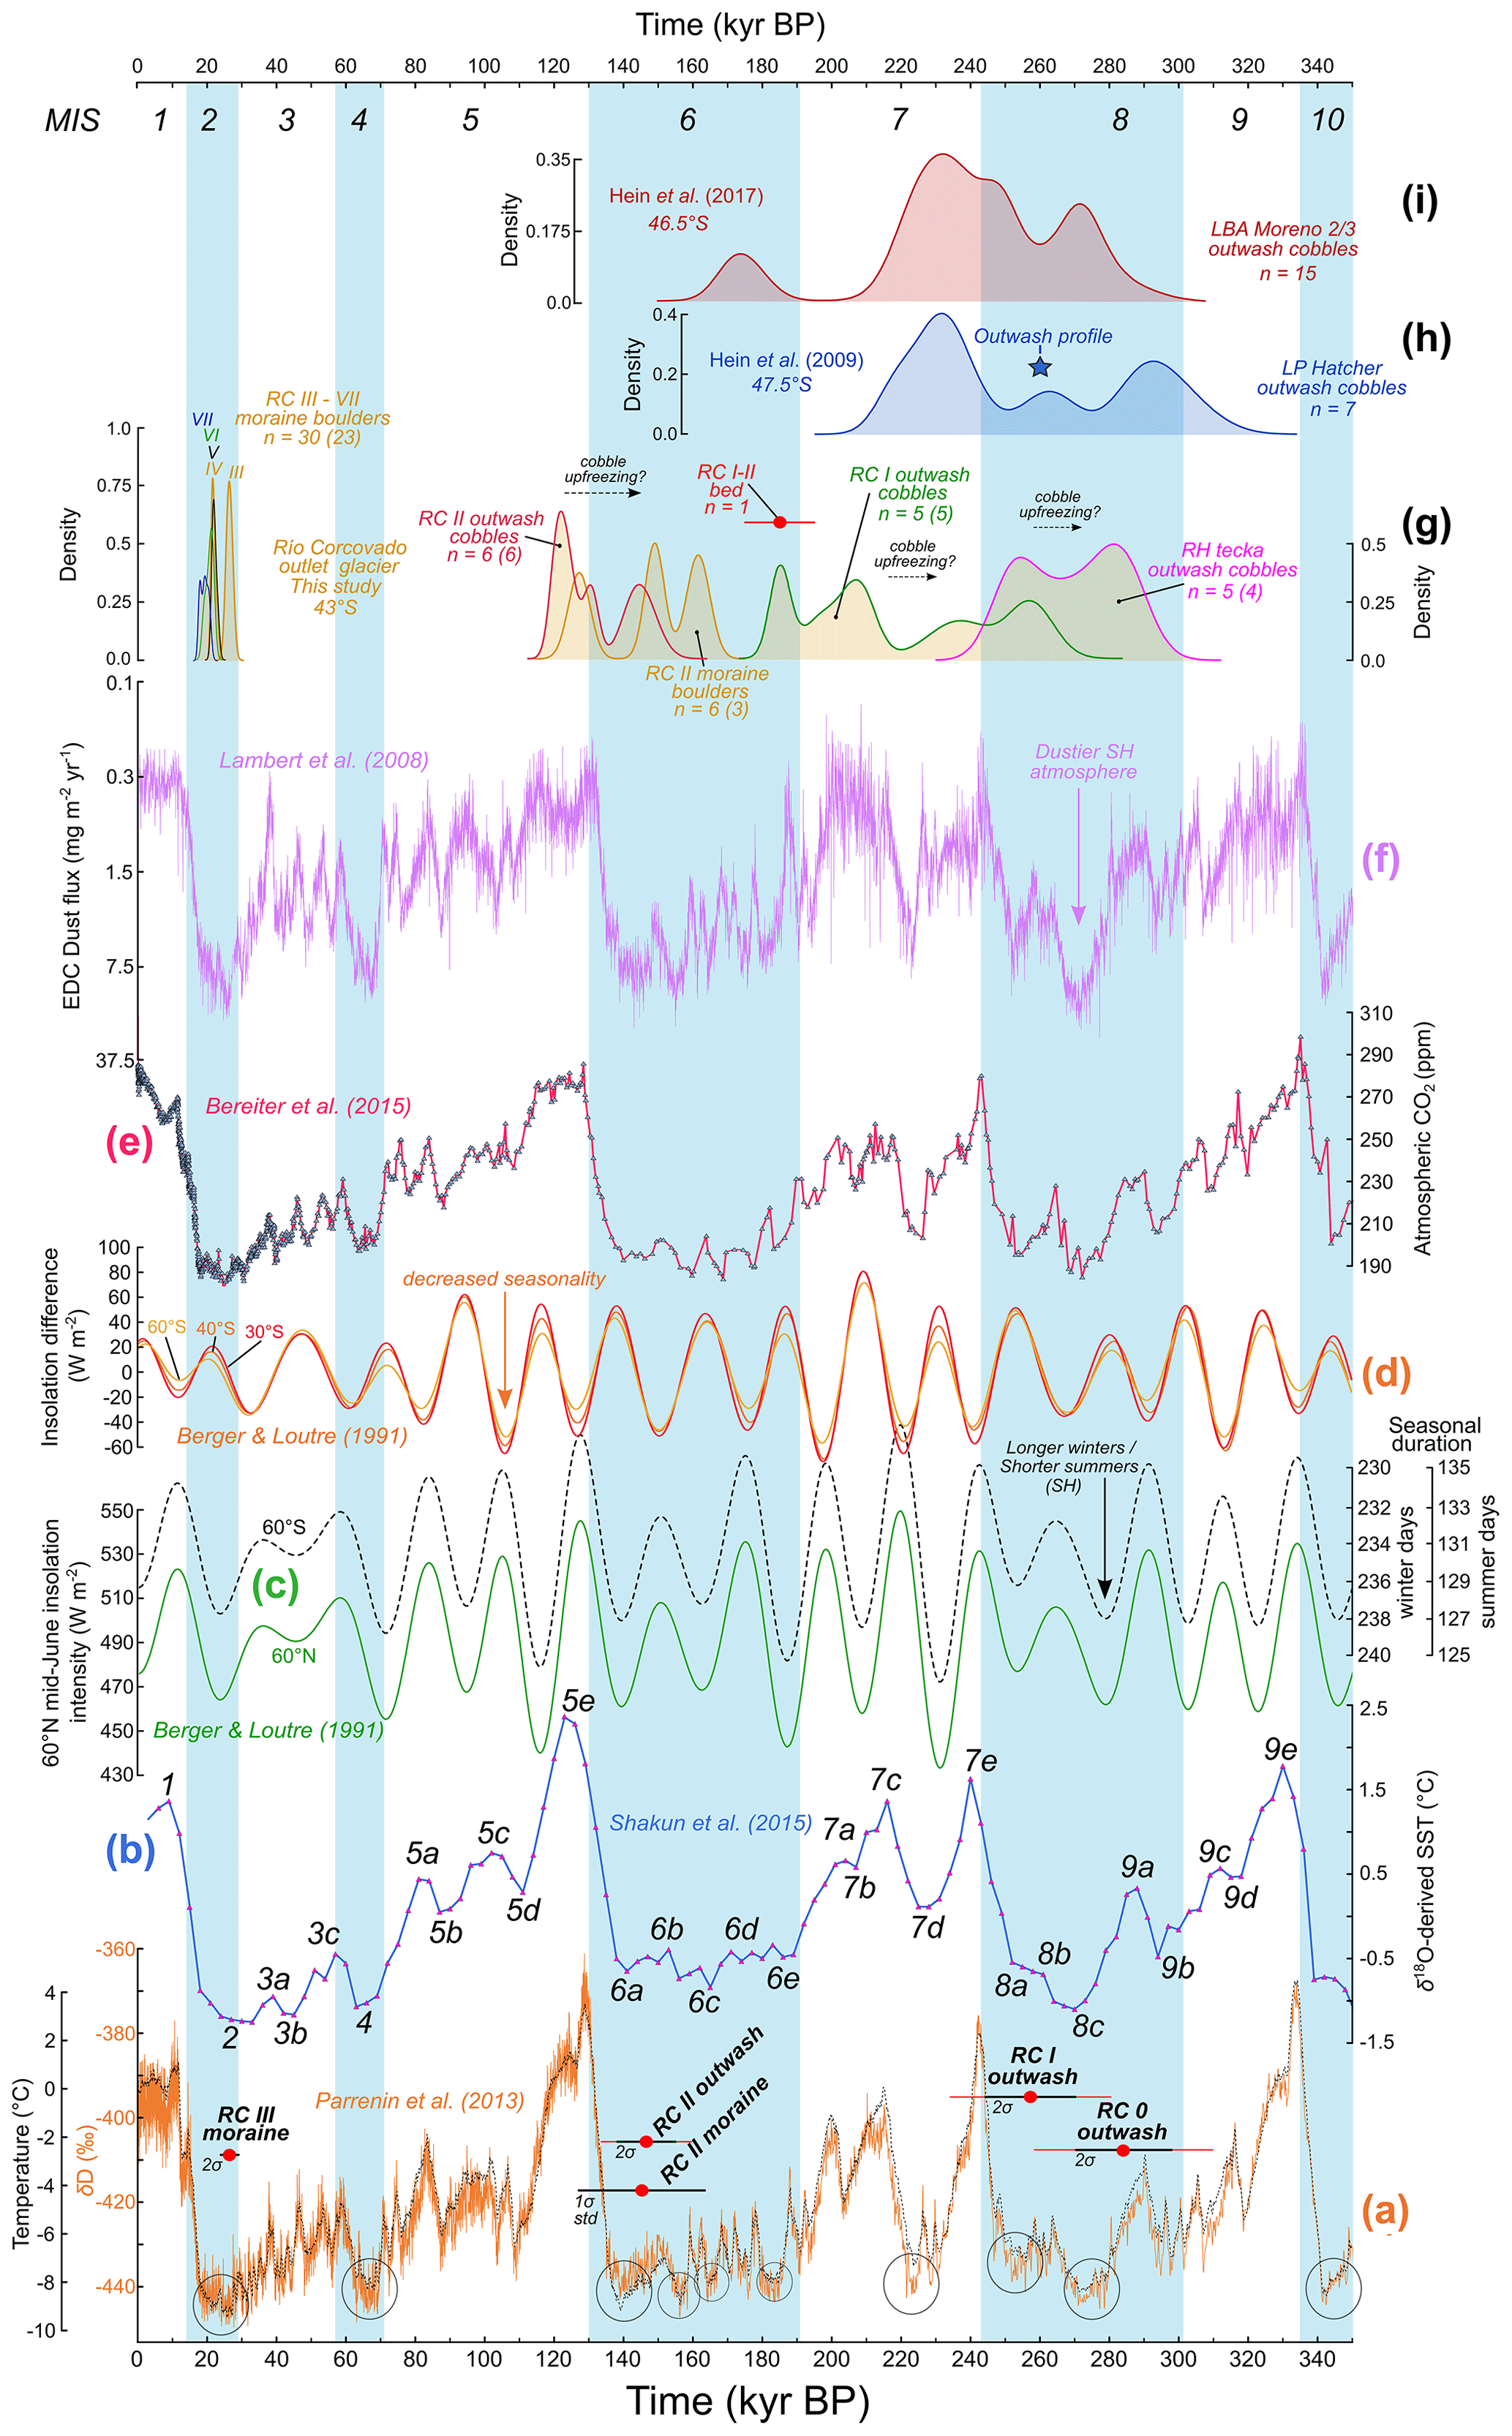
Figure 8Vertical plot comparing this investigation's TCN 10Be chronology to other Patagonian outlet-glacier TCN chronologies, to insolation intensity variations, and to palaeo-climate proxy records over the past 350 kyr. (a) Stable isotope δ deuterium record (orange curve) from the EPICA Dome C (EDC) ice core, 75∘ S, East Antarctica, and Antarctic atmospheric temperature (overlying dashed black curve) from a stack of isotopic temperature reconstructions from five different ice cores (EDC, Vostok, Dome Fuji, TALDICE, and EDML) (Parrenin et al., 2013), with the most potent cooling events of the past 350 kyr highlighted by black circles. TCN exposure ages from the RC valley interpreted as the best minimum-age estimate for each reconstructed glacial event are displayed (red dots) with analytical (black horizontal bars) and external (red horizontal bars) uncertainties. (b) Global stack (n=49 cores) of paired planktonic δ18O-derived sea surface temperature (SST) data with Marine Isotope Stage numbers indicated (Shakun et al., 2015). (c) Dark green line: summer (mid-June) insolation intensity for 60∘ N (Berger and Loutre, 1991). Dashed black curve: seasonal duration at 60∘ S (insolation threshold = 300 W m−2), after Huybers and Denton (2008) and Denton et al. (2021). (d) Southern Hemisphere seasonality at 30∘ S, 40∘ S, and 60∘ S, calculated by subtracting June from December insolation intensity values (Berger and Loutre, 1991) such that increasing seasonality indicates colder winters and warmer summers (after Darvill et al., 2016). (e) Composite record of atmospheric CO2 concentrations from several Antarctic ice cores including EDC, WAIS, Vostock, Siple Dome, TALDICE, EDML, and LAW Dome (Bereiter et al., 2015). (f) Dust flux record from the EDC ice core (Lambert et al., 2008). (g–i) Kernel density distribution curves for TCN exposure ages from the RC 0 to RC II moraine-outwash records (this study: g), the Hatcher moraine-outwash complex in the Lago Cochrane/Pueyrredón valley (Hein et al., 2009; h), and the Moreno 2/3 moraine-outwash limits in the Lago General Carerra/Buenos Aires valley (Hein et al., 2017; i).
5.3 Climatic and orbital drivers of SH glaciations – hypotheses
Our chronology implies that the most extensive middle Pleistocene PIS expansion events (MIS 8, 6, and 2) preserved match the strongest minima in Antarctic atmospheric temperatures (Parrenin et al., 2013), global oceanic SSTs (Shakun et al., 2015), and global atmospheric CO2 concentrations (Bereiter et al., 2015) (Fig. 8). They also appear to occur around the timing of minima in NH summer insolation intensity (60∘ N) and maxima in SH seasonality, while being out of phase with the mid-latitude SH summer insolation intensity (Fig. 8c). However, one must note that this statement can only be advanced with confidence for the local MIS 2 expansions of the PIS. For the local MIS 8 and MIS 6 glaciations, this observation is based on current knowledge of 10Be production rates and the assumptions made in this paper, and does not take into account the full exposure-age range covered by dating analytical uncertainties. The first observations of the asynchrony between SH mid-latitude glacier advances/recessions and local summer insolation intensity (e.g. Mercer, 1976; Denton et al., 1999) encouraged the hypothesis that major glacial-termination-inducing warming signals were primarily controlled by the NH summer insolation intensity driving the NH glacial mass balance, and were propagated from the Northern to the Southern Hemisphere through oceanic and atmospheric circulation shifts (e.g. Broecker, 1998; Denton et al., 2010). Some of these interhemispheric climate-transmission mechanisms, such as the impact of the abrupt weakening of the Atlantic meridional overturning circulation in the North Atlantic following the last deglaciation, have been well documented (Barker et al., 2009; Denton et al., 2010). However, there is still a great deal of debate regarding the dominant trigger mechanisms responsible for global ice-sheet expansion/retreat cycles (Putnam et al., 2013). Indeed, the above hypothesis entails the dilemma that while the NH summer insolation intensity would be a key driver of the NH ice-sheet mass balance, it would have little impact on mass fluctuations of SH mid-latitude ice sheets and glaciers (Denton et al., 2021). This problem invites the consideration of alternative hypotheses, such as the potential roles of SH seasonality and seasonal duration in controlling global ice-sheet mass fluctuations.
García et al. (2018) noted that the extensive advances of the Torres del Paine (51∘ S) and the Última Esperanza (51.5∘ S) outlet glaciers at 48 ka (MIS 3) coincide with a minimum in obliquity-modulated high-latitude winter insolation intensity. The authors therefore hypothesise that colder SH winters during periods of high obliquity may favour SH mid-latitude glaciation by promoting local atmospheric cooling, Southern Ocean stratification, and expanded Antarctic sea ice. Since we observe that middle-to-late Pleistocene PIS expansion events appear to occur during periods of longer, colder winters and shorter, warmer summers, we suggest that other PIS chronologies (including this study) may support the hypothesis of García et al. (2018).
Alternatively, the Zealandia Switch hypothesis (Denton et al., 2021) focuses on the SH seasonal duration aspect of orbitally controlled insolation as a potential driver of late-Quaternary glaciation. By pacing the seasonal cycle of the weakened and northward-migrated Southern Westerly Winds during winter versus the strengthened and southward-migrated Southern Westerly Winds during summer, this hypothesis implies that SH seasonal duration might be a key driver of global climate change during middle-to-late Pleistocene glacial/interglacial cycles. Using global climate model simulations, the authors show that a reduced SH summer duration and increased SH winter duration could cause millennial-scale equatorward migrations of the Southern Westerly Winds and its coupled Antarctic Circumpolar Current. Such a zonal wind configuration would induce a northward migration of the subtropical front and a latitudinally restricted subtropical gyre system in the Indo-Pacific Ocean basins (Denton et al., 2021). The bathymetry of the Australia/Zealandia continent is such that a restricted Indo-Pacific subtropical gyre could decrease the Indonesian Throughflow and restrict the westward Agulhas Leakage into the South Atlantic Ocean (Lorrey and Bostock, 2017). A reduced Aghulhas Leakage has implications for the Atlantic salt input, resulting in a potential weakening of the Atlantic Meridional Overturning Circulation (Caley et al., 2012; De Boer et al., 2013). The authors thus argue that such a southern oceanic and atmospheric circulation configuration could promote a global glacial mode (Denton et al., 2021) that would greatly affect the SH and thus Patagonian glacier mass balance.
Moreover, variations in the intensity and latitudinal position of the Southern Westerly Winds influence the Southern Ocean upwelling of deep-stored CO2 and nutrients (Anderson et al., 2009; Ai et al., 2020). This mechanism is thought to represent a major contribution to variations in global atmospheric CO2 concentrations over millennial timescales (Sarmiento and Toggweiler, 1984). Former equatorward shifts and weakening of the Southern Westerly Winds could have decreased Southern Ocean upwelling and enhanced CO2 storage in the deep ocean, thus causing delayed global cooling amplification (Sime et al., 2013). Conversely, a poleward migration and strengthening of the Southern Westerly Winds is thought to amplify global warming via increasing Southern Ocean upwelling, CO2 outgassing, and increasing CO2 atmospheric concentrations. This hypothetical CO2 capacitor storage-and-release mechanism may explain the highly amplified warming observed during major glacial terminations (Anderson et al., 2009; Denton et al., 2021). This positive feedback mechanism may partly justify why middle-to-late Pleistocene global oceanic and atmospheric temperature variations often reached their most extreme values with a notable delay (a few kyr) relative to the NH mid-latitude summer insolation intensity.
To summarise, empirical data, including this study, suggest that major middle-to-late Pleistocene cycles of SH mid-latitude glaciers and ice sheets appear to be coeval with NH glaciers and ice sheets but out of phase with local mid-latitude summer insolation intensity (Putnam et al., 2013; Peltier et al., 2021), traditionally thought to be the primary driver of middle-to-late Pleistocene glacial expansion/demise cycles (Mercer, 1984). However, recent hypotheses suggest that this paradox might be explained by the potentially more dominant climate-forcing effect of the seasonality and seasonal-duration expressions of SH insolation through their impact on atmospheric temperature, the position of the Southern Westerly Winds belt and Subtropical Front, Antarctic sea ice extent, and Southern Ocean stratification and CO2 storage-and-release feedback mechanisms. Testing the above hypotheses and determining which of seasonality or seasonal duration played a primary role in driving SH climate and glacial variations during the middle-to-late Pleistocene remains a major challenge and represents a key avenue for future research.
-
We provide geomorphological and direct chronological evidence for at least three extensive, stratigraphically distinct pre-Last Glacial Cycle advances of the Río Corcovado glacier, a major outlet of the former northern Patagonian Ice Sheet. TCN surface exposure dating of outwash surface cobbles yields best age range estimates for the RC 0, RC I, and RC II advances of 290–270, 270–245, and 150–130 ka, respectively.
-
Together with evidence we have reported in Leger et al. (2021a, b), our complete chronology reveals a minimum of four distinct expansion events of northeastern Patagonian Ice Sheet outlet glaciers that occurred during the MIS 8, MIS 6, and MIS 2 intervals.
-
Our dataset presents the first robust direct dating evidence of MIS 6 glaciations in Patagonia.
-
We did not find evidence for MIS 4 and 3 deposits in the RC valley geomorphological record. However, extensive glaciations did occur at these times at the former western margin of the ice sheet, and in other, more southern, Patagonian regions. This highlights longitudinal and latitudinal asynchronies in the former Patagonian Ice Sheet mass balance during these stages. We suggest that MIS 4 and 3 outlet-glacier advances likely occurred in northeastern Patagonia but were of a relatively short extent, and their associated deposits were likely eroded by the younger, more extensive MIS 2 glaciation.
-
We interpret that major middle-to-late Pleistocene Patagonian Ice Sheet expansions may have occurred in synchrony with the greatest cooling events recorded in global SST and Antarctic atmospheric temperatures, with the most prominent peaks in Antarctic ice-core dust concentrations, and with major minima in global CO2 atmospheric concentrations. We observe a particularly good correlation between Antarctic atmospheric temperature signals and southern mid-latitude ice-sheet volume fluctuations over several glacial cycles.
-
Our results suggest that Patagonian glaciations were more extensive during MIS 8 than during MIS 6-2, while global ice volumes and sea level depression were not particularly high during MIS 8. This implies an interhemispheric asynchrony in the relative volume and extent of Earth's major ice sheets during MIS 8. However, we acknowledge that a larger MIS 8 eastern Patagonian Ice Sheet is not necessarily indicative of a more potent local climate-forcing event than during younger glaciations (MIS 6-2), as glacial erosion, which greatly influences the local topography, may play a role in controlling ice-sheet extent.
-
Major middle-to-late Pleistocene advances of the Patagonian Ice Sheet appear to have occurred out of phase with local summer insolation intensity but in synchrony with orbitally controlled periods of longer and colder winters. We hypothesise that seasonality and seasonal duration may exert more control over the southern mid-latitude ice-sheet mass balance than mid-latitude summer insolation intensity over millennial timescales. This may be a consequence of the possible effect of seasonal duration variability on the strength and migration of the Southern Westerly Winds, and the impact of these migrations on global climate and Southern Ocean circulation and CO2 upwelling, as proposed by the Zealandia Switch hypothesis.
-
Our findings corroborate work by Hein et al. (2009, 2017) and indicate that, in eastern Patagonia, pre-LGC outwash surface cobbles yield exposure ages displaying less post-depositional scatter than moraine boulders from the same margins, and hence facilitate more accurate estimations of the approximate timing of pre-LGC glacial advances.
All data associated with the production of new 10Be and 26Al TCN exposure ages, including sample characteristics and preparation protocols, are provided in the manuscript tables and figures and the Supplement. Further inquiries can be directed to the corresponding author.
The data needed to re-calculate the 10Be and 26Al TCN exposure ages presented in this paper using the online calculator formerly known as the CRONUS-Earth online calculators version 3 is freely available online, as long as the original publication is cited when used and/or referred to. This includes a text file with data blocks in the correct input format and arranged by the landforms studied in this investigation. The data are located in an open-access Mendeley Data online repository accessible using this DOI: https://doi.org/10.17632/gg4b3sh9k2.1 (Leger et al., 2022).
The supplement related to this article is available online at: https://doi.org/10.5194/cp-19-35-2023-supplement.
ASTER Team: Georges Aumaître (Aix-Marseille Université, CNRS, Coll. France, IRD, INRAE, CEREGE, Aix-en-Provence, 13545, France), Fawzi Zaidi (Aix-Marseille Université, CNRS, Coll. France, IRD, INRAE, CEREGE, Aix-en-Provence, 13545, France), and Karim Keddadouche (Aix-Marseille Université, CNRS, Coll. France, IRD, INRAE, CEREGE, Aix-en-Provence, 13545, France).
TPML co-conceived the study with ASH, raised the finances for fieldwork, conducted fieldwork with help from PTG, wrote the NERC NEIF grant application together with ASH, conducted result analyses and interpretations, wrote the manuscript and supplementary materials with feedback provided by ASH and RGB and later by AR, IS, and DF in a second time, and generated maps and figures. TCN exposure-age analyses, including wet chemistry and AMS measurements, were conducted by AR and DF at SUERC and TPML, and by IS and the ASTER Team at CEREGE and the ASTER AMS.
The contact author has declared that none of the authors has any competing interests.
Publisher’s note: Copernicus Publications remains neutral with regard to jurisdictional claims in published maps and institutional affiliations.
We express our gratitude towards all individuals who contributed to the https://crowd.science/ (last access: 29 March 2022) crowdfunding campaign that provided us with the means to conduct a field expedition to the study site in January and February 2020. We thank all local landowners who authorized access and sampling on their properties, in particular the Estancia Tecka (Chubut Province, Argentina) for enabling access to their land and private roads. We thank Elaine McDougall and Allan Davidson for their invaluable laboratory work enabling efficient quartz isolation and purification from our rock samples. Finally, we are thankful to the three reviewers for providing valuable feedback and comments which greatly improved the final manuscript.
This study was conducted within the context of a University of Edinburgh E3 Doctoral Training Partnership Ph.D. studentship (award code: NE/L002558/1) awarded by the Natural Environment Research Council (NERC) and the University of Edinburgh School of GeoSciences to Tancrède P. M. Leger Fieldwork (1 February 2020) was partly supported by a crowd-funding campaign through the Crowd.Science fundraising platform (https://crowd.science, last access: 29 March 2022) and a British Society for Geomorphology Postgraduate Research Grant award (BSG-2019-04) awarded to Tancrède P. M. Leger. TCN exposure dating laboratory analysis and AMS measurements were funded by a NERC National Environmental Isotope Facility (NEIF) grant (2245-0320) awarded to Andrew S. Hein and Tancrède P. M. Leger in July 2020. For the purpose of open access, the author has applied a creative commons attribution (CC BY) licence to any author accepted manuscript version arising.
This paper was edited by Denis-Didier Rousseau and reviewed by three anonymous referees.
Ai, X. E., Studer, A. S., Sigman, D. M., Martínez-García, A., Fripiat, F., Thöle, L. M., Michel, E., Gottschalk, J., Arnold, L., Moretti, S., Schmitt, M., Oleynik, S., Jaccard, S. L., and Haug, G. H.: Southern Ocean upwelling, Earth's obliquity, and glacial-interglacial atmospheric CO2 change, Science, 370, 1348–1352, https://doi.org/10.1126/science.abd2115, 2020.
Anderson, R. F., Ali, S., Bradtmiller, L. I., Nielsen, S. H. H., Fleisher, M. Q., Anderson, B. E., and Burckle, L. H.: Wind-Driven Upwelling in the Southern Ocean and the Deglacial Rise in Atmospheric CO2, Science, 323, 1443–1448, https://doi.org/10.1126/science.1167441, 2009.
Astakhov, V.: Ice margins of northern Russia revisited, in: Quaternary Glaciations – Extent and Chronology: A Closer Look, edited by: Ehlers, J., Gibbard, P. L., and Hughes, P. D., Developments in Quaternary Sciences 15, Elsevier, Amsterdam, 1–14, ISBN-10 0444534474, 2011.
Astakhov, V., Shkatova, V., Zastrozhnov, A., and Chuyko, M.: Glaciomorphological Map of the Russian Federation, Quat. Int., 420, 4–14, https://doi.org/10.1016/j.quaint.2015.09.024, 2016.
Augustinus, P., Fink, D., Fletcher, M.-S., and Thomas, I.: Re-assessment of the mid to late Quaternary glacial and environmental history of the Boco Plain, western Tasmania., Quat. Sci. Rev., 160, 31–44, https://doi.org/10.1016/j.quascirev.2017.01.015, 2017.
Balco, G. and Rovey, C. W.: An isochron method for cosmogenic-nuclide dating of buried soils and sediments, Am. J. Sci., 308, 1083–1114, https://doi.org/10.2475/10.2008.02, 2008.
Balco, G., Stone, J. O., Lifton, N. A., and Dunai, T. J.: A complete and easily accessible means of calculating surface exposure ages or erosion rates from 10Be and 26Al measurements, Quat. Geochronol., 3, 174–195, https://doi.org/10.1016/j.quageo.2007.12.001, 2008.
Barker, S., Diz, P., Vautravers, M. J., Pike, J., Knorr, G., Hall, I. R., and Broecker, W. S.: Interhemispheric Atlantic seesaw response during the last deglaciation, Nature, 457, 1097–1102, https://doi.org/10.1038/nature07770, 2009.
Barrows, T. T., Stone, J. O., Fifield, L. K., and Cresswell, R. G.: The timing of the Last Glacial Maximum in Australia, Quat. Sci. Rev., 21, 159–173, https://doi.org/10.1016/S0277-3791(01)00109-3, 2002.
Beets, D. J., Meijer, T., Beets, C. J., Cleveringa, P., Laban, C., and van der Spek, A. J. F.: Evidence for a Middle Pleistocene glaciation of MIS 8 age in the southern North Sea, Quat. Int., 133–134, 7–19, https://doi.org/10.1016/j.quaint.2004.10.002, 2005.
Bereiter, B., Eggleston, S., Schmitt, J., Nehrbass-Ahles, C., Stocker, T. F., Fischer, H., Kipfstuhl, S., and Chappellaz, J.: Revision of the EPICA Dome C CO2 record from 800 to 600 kyr before present: Analytical bias in the EDC CO2 record, Geophys. Res. Lett., 42, 542–549, https://doi.org/10.1002/2014GL061957, 2015.
Berger, A. and Loutre, M. F.: Insolation values for the climate of the last 10 million years, Quat. Sci. Rev., 10, 297–317, https://doi.org/10.1016/0277-3791(91)90033-Q, 1991.
Borchers, B., Marrero, S., Balco, G., Caffee, M., Goehring, B., Lifton, N., Nishiizumi, K., Phillips, F., Schaefer, J., and Stone, J.: Geological calibration of spallation production rates in the CRONUS-Earth project, Quat. Geochronol., 31, 188–198, https://doi.org/10.1016/j.quageo.2015.01.009, 2016.
Briner, J. P., Kaufman, D. S., Manley, W. F., Finkel, R. C., and Caffee, M. W.: Cosmogenic exposure dating of late Pleistocene moraine stabilization in Alaska, Geol. Soc. Am. Bull., 117, 1108, https://doi.org/10.1130/B25649.1, 2005.
Broecker, W. S.: Paleocean circulation during the Last Deglaciation: A bipolar seesaw?, Paleoceanography, 13, 119–121, https://doi.org/10.1029/97PA03707, 1998.
Caldenius, C. C. Z.: Las Glaciaciones Cuaternarias en la Patagonia y Tierra del Fuego: Una investigación regional, estratigráfica y geocronológica, – Una comparación con la escala geocronológica sueca, Geogr. Ann., 14, 1–164, https://doi.org/10.1080/20014422.1932.11880545, 1932.
Caley, T., Giraudeau, J., Malaizé, B., Rossignol, L., and Pierre, C.: Agulhas leakage as a key process in the modes of Quaternary climate changes, P. Natl. Acad. Sci. USA, 109, 6835–6839, https://doi.org/10.1073/pnas.1115545109, 2012.
Clapperton, C. M.: The glaciation of the Andes: Quat. Sci. Rev., 2, 83–155, https://doi.org/10.1016/0277-3791(83)90005-7, 1983
Clapperton, C. M.: Quaternary geology and geomorphology of South America: Amsterdam, Elsevier Science Publishers B.V., 779 pp., ISBN-10 0444882472, 1993.
Cogez, A., Herman, F., Pelt, É., Reuschlé, T., Morvan, G., Darvill, C. M., Norton, K. P., Christl, M., Märki, L., and Chabaux, F.: U-Th and 10Be constraints on sediment recycling in proglacial settings, Lago Buenos Aires, Patagonia, Earth Surf. Dynam., 6, 121–140, https://doi.org/10.5194/esurf-6-121-2018, 2018.
Colhoun, E. A. and Barrows, T. T.: The glaciation of Australia, in: uaternary Glaciations – Extent and Chronology: A Closer Look. Developments in Quaternary Sciences 15, edited by: Ehlers, J., Gibbard, P. L., and Hughes, P. D., Elsevier, Amsterdam, 1037–1045, 2011.
Darvill, C. M., Bentley, M. J., Stokes, C. R., Hein, A. S., and Rodés, Á.: Extensive MIS 3 glaciation in southernmost Patagonia revealed by cosmogenic nuclide dating of outwash sediments, Earth Planet. Sci. Lett., 429, 157–169, https://doi.org/10.1016/j.epsl.2015.07.030, 2015.
Darvill, C. M., Bentley, M. J., Stokes, C. R., and Shulmeister, J.: The timing and cause of glacial advances in the southern mid-latitudes during the last glacial cycle based on a synthesis of exposure ages from Patagonia and New Zealand, Quat. Sci. Rev., 149, 200–214, https://doi.org/10.1016/j.quascirev.2016.07.024, 2016.
Davies, B. J., Roberts, D. H., Bridgland, D. R., Ó Cofaigh, C., Riding, J. B., Demarchi, B., Penkman, K. E. H., and Pawley, S. M.: Timing and depositional environments of a Middle Pleistocene glaciation of northeast England: New evidence from Warren House Gill, County Durham, Quat. Sci. Rev., 44, 180–212, https://doi.org/10.1016/j.quascirev.2010.02.003, 2012.
Davies, B. J., Darvill, C. M., Lovell, H., Bendle, J. M., Dowdeswell, J. A., Fabel, D., García, J.-L., Geiger, A., Glasser, N. F., Gheorghiu, D. M., Harrison, S., Hein, A. S., Kaplan, M. R., Martin, J. R. V., Mendelova, M., Palmer, A., Pelto, M., Rodés, Á., Sagredo, E. A., Smedley, R. K., Smellie, J. L., and Thorndycraft, V. R.: The evolution of the Patagonian Ice Sheet from 35 ka to the present day (PATICE), Earth-Sci. Rev., 204, 103152, https://doi.org/10.1016/j.earscirev.2020.103152, 2020.
De Boer, A. M., Graham, R. M., Thomas, M. D., and Kohfeld, K. E.: The control of the Southern Hemisphere Westerlies on the position of the Subtropical Front, J. Geophys. Res.-Oceans, 118, 5669–5675, https://doi.org/10.1002/jgrc.20407, 2013.
Denton, G. H., Lowell, T. V., Heusser, C. J., Schluchter, C., Andersen, B. G., Heusser, L. E., Moreno, P. I., and Marchant, D. R.: Geomorphology, Stratigraphy, and Radiocarbon Chronology of LlanquihueDrift in the Area of the Southern Lake District, Seno Reloncavi, and Isla Grande de Chiloe, Chile, Geogr. Ann. Ser. Phys. Geogr., 81, 167–229, https://doi.org/10.1111/j.0435-3676.1999.00057.x, 1999.
Denton, G. H., Anderson, R. F., Toggweiler, J. R., Edwards, R. L., Schaefer, J. M., and Putnam, A. E.: The Last Glacial Termination, Science, 328, 1652–1656, https://doi.org/10.1126/science.1184119, 2010.
Denton, G. H., Putnam, A. E., Russell, J. L., Barrell, D. J. A., Schaefer, J. M., Kaplan, M. R., and Strand, P. D.: The Zealandia Switch: Ice age climate shifts viewed from Southern Hemisphere moraines, Quat. Sci. Rev., 257, 106771, https://doi.org/10.1016/j.quascirev.2020.106771, 2021.
Douglass, D. C., Singer, B. S., Ackert, R. P., Kaplan, M. R., and Caffee, M. W.: Constraining Boulder Erosion Rates and Ages of Mid-Pleistocene Moraines, Lago Buenos Aires, Argentina, Geological Society of America Abstracts and Programs, Northeastern Section, 42nd Annual Meeting, 2007.
Dunai, T. J.: Cosmogenic nuclides: principles, concepts and applications in the earth surface sciences: Cambridge University Press, 2010.
Evans, D. J. A., Roberts, D. H., Bateman, M. D., Ely, J., Medialdea, A., Burke, M. J., Chiverrell, R. C., Clark, C. D., and Fabel, D.: A chronology for North Sea Lobe advance and recession on the Lincolnshire and Norfolk coasts during MIS 2 and 6, Proc. Geol. Assoc., 130, 523–540, https://doi.org/10.1016/j.pgeola.2018.10.004, 2019.
Fernandes, M., Oliva, M., Vieira, G., Palacios, D., Fernández-Fernández, J. M., Delmas, M., García-Oteyza, J., Schimmelpfennig, I., Ventura, J., ASTER Team, Aumaître, G., and Keddadouche, K.: Maximum glacier extent of the Penultimate Glacial Cycle in the Upper Garonne Basin (Pyrenees): new chronological evidence, Environ. Earth Sci., 80, 796, https://doi.org/10.1007/s12665-021-10022-z, 2021.
Fick, S. E. and Hijmans, R. J.: WorldClim 2: new 1-km spatial resolution climate surfaces for global land areas, Int. J. Climatol., 37, 4302–4315, https://doi.org/10.1002/joc.5086, 2017.
García, J.-L., Hein, A. S., Binnie, S. A., Gómez, G. A., González, M. A., and Dunai, T. J.: The MIS 3 maximum of the Torres del Paine and Última Esperanza ice lobes in Patagonia and the pacing of southern mountain glaciation, Quat. Sci. Rev., 185, 9–26, https://doi.org/10.1016/j.quascirev.2018.01.013, 2018.
García, J.-L., Lüthgens, C., Vega, R. M., Rodés, Á., Hein, A. S., and Binnie, S. A.: A composite 10Be, IR-50 and 14C chronology of the pre-Last Glacial Maximum (LGM) full ice extent of the western Patagonian Ice Sheet on the Isla de Chiloé, south Chile (42∘ S), E&G Quaternary Sci. J., 70, 105–128, https://doi.org/10.5194/egqsj-70-105-2021, 2021.
Garreaud, R., Lopez, P., Minvielle, M., and Rojas, M.: Large-Scale Control on the Patagonian Climate, J. Clim., 26, 215–230, https://doi.org/10.1175/JCLI-D-12-00001.1, 2013.
Glasser, N. and Jansson, K.: The Glacial Map of southern South America, J. Maps, 4, 175–196, https://doi.org/10.4113/jom.2008.1020, 2008.
Gómez, G. A., García, J.-L., Villagrán, C., Lüthgens, C., and Abarzúa, A. M.: Vegetation, glacier, and climate changes before the global last glacial maximum in the Isla Grande de Chiloé, southern Chile (42∘ S), Quat. Sci. Rev., 276, 107301, https://doi.org/10.1016/j.quascirev.2021.107301, 2022.
Gosse, J. C. and Phillips, F. M.: Terrestrial in situ cosmogenic nuclides: theory and application, Quat. Sci. Rev., 20, 1475–1560, https://doi.org/10.1016/S0277-3791(00)00171-2, 2001.
Granger, D. E. and Muzikar, P. F.: Dating sediment burial with in situ-produced cosmogenic nuclides: theory, techniques, and limitations, Earth Planet. Sci. Lett., 188, 269–281, https://doi.org/10.1016/S0012-821X(01)00309-0, 2001.
Haller, M., Lech, R. R., Martinez, O. A., Meister, C. M., and Page, S. M.: Hoja Geologica 4373IV/III, Trevelin, Provincia del Chubut, Programa Nacional de Cartas Geologicas de la Republica Argentina: Servicio Geologico Nacional, Buenos Aires, scale 1:250 000, https://repositorio.segemar.gov.ar/handle/308849217/4230 (last access: 19 December 2022), 2003.
Hein, A. S., Hulton, N. R. J., Dunai, T. J., Schnabel, C., Kaplan, M. R., Naylor, M., and Xu, S.: Middle Pleistocene glaciation in Patagonia dated by cosmogenic-nuclide measurements on outwash gravels, Earth Planet. Sci. Lett., 286, 184–197, https://doi.org/10.1016/j.epsl.2009.06.026, 2009.
Hein, A. S., Dunai, T. J., Hulton, N. R. J., and Xu, S.: Exposure dating outwash gravels to determine the age of the greatest Patagonian glaciations, Geology, 39, 103–106, https://doi.org/10.1130/G31215.1, 2011.
Hein, A. S., Cogez, A., Darvill, C. M., Mendelova, M., Kaplan, M. R., Herman, F., Dunai, T. J., Norton, K., Xu, S., Christl, M., and Rodés, Á.: Regional mid-Pleistocene glaciation in central Patagonia, Quat. Sci. Rev., 164, 77–94, https://doi.org/10.1016/j.quascirev.2017.03.023, 2017.
Hervé, F., Fuentes, F. J., Calderón, M., Fanning, M., Quezada, P., Pankhurst, R., and Rapela, C.: Ultramafic rocks in the North Patagonian Andes: is their emplacement associated with the Neogene tectonics of the Liquiñe–Ofqui Fault Zone?, Andean Geol., 44, 1, https://doi.org/10.5027/andgeoV44n1-a01, 2017.
Hughes, P. D., Gibbard, P. L., and Ehlers, J.: The “missing glaciations” of the Middle Pleistocene, Quat. Res., 96, 161–183, https://doi.org/10.1017/qua.2019.76, 2020.
Huybers, P. and Denton, G.: Antarctic temperature at orbital timescales controlled by local summer duration, Nat. Geosci., 1, 787–792, https://doi.org/10.1038/ngeo311, 2008.
Jones, R. S., Small, D., Cahill, N., Bentley, M. J., and Whitehouse, P. L.: iceTEA: Tools for plotting and analysing cosmogenic-nuclide surface-exposure data from former ice margins, Quat. Geochronol., 51, 72–86, https://doi.org/10.1016/j.quageo.2019.01.001, 2019.
Kaplan, M. R., Douglass, D. C., Singer, B. S., Ackert, R. P., and Caffee, M. W.: Cosmogenic nuclide chronology of pre-last glacial maximum moraines at Lago Buenos Aires, 46∘ S, Argentina, Quat. Res., 63, 301–315, https://doi.org/10.1016/j.yqres.2004.12.003, 2005.
Kaplan, M. R., Hein, A. S., Hubbard, A., and Lax, S. M.: Can glacial erosion limit the extent of glaciation?, Geomorphology, 103, 172–179, https://doi.org/10.1016/j.geomorph.2008.04.020, 2009.
Kaplan, M. R., Schaefer, J. M., Denton, G. H., Barrell, D. J. A., Chinn, T. J. H., Putnam, A. E., Andersen, B. G., Finkel, R. C., Schwartz, R., and Doughty, A. M.: Glacier retreat in New Zealand during the Younger Dryas stadial, Nature, 467, 194–197, https://doi.org/10.1038/nature09313, 2010.
Kaplan, M. R., Strelin, J. A., Schaefer, J. M., Denton, G. H., Finkel, R. C., Schwartz, R., Putnam, A. E., Vandergoes, M. J., Goehring, B. M., and Travis, S. G.: In-situ cosmogenic 10Be production rate at Lago Argentino, Patagonia: Implications for late-glacial climate chronology, Earth Planet. Sci. Lett., 309, 21–32, https://doi.org/10.1016/j.epsl.2011.06.018, 2011.
Kiernan, K., Fifield, L. K., and Chappell, J.: Cosmogenic nuclide ages for Last Glacial Maximum moraine at Schnells Ridge, Southwest Tasmania, Quat. Res., 61, 335–338, https://doi.org/10.1016/j.yqres.2004.02.004, 2004.
Kiernan, K., Fink, D., Greig, D., and Mifud, C.: Cosmogenic radionuclide chronology of pre-last glacial cycle moraines in the Western Arthur range, Southwest Tasmania, Quat. Sci. Rev., 29, 3286–3297, https://doi.org/10.1016/j.quascirev.2010.07.023, 2010.
Kiernan, K., McMinn, M. S., and Fink, D.: Topographic and microclimatic impacts on glaciation of the Denison Range, southwest Tasmania, Quat. Sci. Rev., 97, 136–147, https://doi.org/10.1016/j.quascirev.2014.05.008, 2014.
Kiernan, K., Fink, D., and McConnell, A.: Cosmogenic 10Be and 26Al exposure ages of glaciations in the Frankland Range, southwest Tasmania reveal a limited MIS-2 ice advance, Quat. Sci. Rev., 157, 141–151, https://doi.org/10.1016/j.quascirev.2016.12.008, 2017.
Koffman, B. G., Goldstein, S. L., Winckler, G., Borunda, A., Kaplan, M. R., Bolge, L., Cai, Y., Recasens, C., Koffman, T. N. B., and Vallelonga, P.: New Zealand as a source of mineral dust to the atmosphere and ocean, Quat. Sci. Rev., 251, 106659, https://doi.org/10.1016/j.quascirev.2020.106659, 2021.
Lal, D.: Cosmic ray labeling of erosion surfaces: in situ nuclide production rates and erosion models, Earth Planet. Sci. Lett., 104, 424–439, https://doi.org/10.1016/0012-821X(91)90220-C, 1991.
Lambeck, K., Rouby, H., Purcell, A., Sun, Y., and Sambridge, M.: Sea level and global ice volumes from the Last Glacial Maximum to the Holocene, P. Natl. Acad. Sci. USA, 111, 15296–15303, https://doi.org/10.1073/pnas.1411762111, 2014.
Lambert, F., Delmonte, B., Petit, J. R., Bigler, M., Kaufmann, P. R., Hutterli, M. A., Stocker, T. F., Ruth, U., Steffensen, J. P., and Maggi, V.: Dust-climate couplings over the past 800,000 years from the EPICA Dome C ice core, Nature, 452, 616–619, https://doi.org/10.1038/nature06763, 2008.
Leger, T. P. M., Hein, A. S., Bingham, R. G., Martini, M. A., Soteres, R. L., Sagredo, E. A., and Martínez, O. A.: The glacial geomorphology of the Río Corcovado, Río Huemul and Lago Palena/General Vintter valleys, northeastern Patagonia (43∘ S, 71∘ W), J. Maps, 16, 651–668, https://doi.org/10.1080/17445647.2020.1794990, 2020.
Leger, T. P. M., Hein, A. S., Bingham, R. G., Rodés, Á., Fabel, D., and Smedley, R. K.: Geomorphology and 10Be chronology of the Last Glacial Maximum and deglaciation in northeastern Patagonia, 43∘ S–71∘ W, Quat. Sci. Rev., 272, 107194, https://doi.org/10.1016/j.quascirev.2021.107194, 2021a.
Leger, T. P. M., Hein, A. S., Goldberg, D., Schimmelpfennig, I., Van Wyk de Vries, M. S., Bingham, R. G., and ASTER Team: Northeastern Patagonian Glacier Advances (43∘ S) Reflect Northward Migration of the Southern Westerlies Towards the End of the Last Glaciation, Front. Earth Sci., 9, 751987, https://doi.org/10.3389/feart.2021.751987, 2021b.
Leger, T. P. M., Hein, A. S., Rodés, Á., Bingham, R. G., Schimmelpfennig, I., Fabel, D., Gonzalez, P. T., and ASTER Team: 10Be and 26Al TCN exposure age input data for CRONUS-Earth online calculator version 3, https://doi.org/10.17632/gg4b3sh9k2.1, 2022.
Lifton, N., Sato, T., and Dunai, T. J.: Scaling in situ cosmogenic nuclide production rates using analytical approximations to atmospheric cosmic-ray fluxes, Earth Planet. Sci. Lett., 386, 149–160, https://doi.org/10.1016/j.epsl.2013.10.052, 2014.
Lindner, L. and Marks, L.: New approach to stratigraphy of palaeolake and glacial sediments of the younger Middle Pleistocene in mid-eastern Poland, Geol. Q., 43, 1–8, 1999.
Lisiecki, L. E. and Raymo, M. E.: A Pliocene-Pleistocene stack of 57 globally distributed benthic δ18O records, Paleoceanography, 20, PA1003, https://doi.org/10.1029/2004PA001071, 2005.
Lorrey, A. M. and Bostock, H.: The Quaternary climate of New Zealand. Advances in Quaternary Science – the New Zealand Landscape, Springer-Verlag, 67–139, https://doi.org/10.2991/978-94-6239-237-3_3, 2017.
Margari, V., Skinner, L. C., Hodell, D. A., Martrat, B., Toucanne, S., Grimalt, J. O., Gibbard, P. L., Lunkka, J. P., and Tzedakis, P. C.: Land-ocean changes on orbital and millennial time scales and the penultimate glaciation, Geology, 42, 183–186, https://doi.org/10.1130/G35070.1, 2014.
Meglioli, A.: Glacial geology and chronology of southernmost Patagonia and Tierra del Fuego, Argentina and Chile, Ph.D. thesis, Bethlehem, Pennsylvania, Lehigh University, 216 pp., https://www.proquest.com/dissertations-theses/glacial-geology-chronology-southernmost-patagonia/docview/304013276/se-2 (last access: 19 December 2022), 1992.
Mendelová, M., Hein, A. S., Rodés, Á., and Xu, S.: Extensive mountain glaciation in central Patagonia during Marine Isotope Stage 5, Quat. Sci. Rev., 227, 105996, https://doi.org/10.1016/j.quascirev.2019.105996, 2020.
Mercer, J. H.: Glacial history of Southernmost South America, Quat. Res., 6, 125–166, https://doi.org/10.1016/0033-5894(76)90047-8, 1976.
Mercer, J. H.: Simultaneous climatic change in both hemispheres and similar bipolar interglacial warming: Evidence and implications, in: Geophysical Monograph Series, vol. 29, edited by: Hansen, J. E. and Takahashi, T., American Geophysical Union, Washington, D. C., 307–313, https://doi.org/10.1029/GM029p0307, 1984.
Parrenin, F., Masson-Delmotte, V., Köhler, P., Raynaud, D., Paillard, D., Schwander, J., Barbante, C., Landais, A., Wegner, A., and Jouzel, J.: Synchronous Change of Atmospheric CO2 and Antarctic Temperature During the Last Deglacial Warming, Science, 339, 1060–1063, https://doi.org/10.1126/science.1226368, 2013.
Peltier, C., Kaplan, M. R., Birkel, S. D., Soteres, R. L., Sagredo, E. A., Aravena, J. C., Araos, J., Moreno, P. I., Schwartz, R., and Schaefer, J. M.: The large MIS 4 and long MIS 2 glacier maxima on the southern tip of South America, Quat. Sci. Rev., 262, 106858, https://doi.org/10.1016/j.quascirev.2021.106858, 2021.
Phillips, F. M., Zreda, M. G., Smith, S. S., Elmore, D., Kubik, P. W., and Sharma, P.: Cosmogenic Chlorine-36 Chronology for Glacial Deposits at Bloody Canyon, Eastern Sierra Nevada, Science, 248, 1529–1532, https://doi.org/10.1126/science.248.4962.1529, 1990.
Preusser, F., Graf, H. R., Keller, O., Krayss, E., and Schlüchter, C.: Quaternary glaciation history of northern Switzerland, E&G Quaternary Sci. J., 60, 282–305, https://doi.org/10.3285/eg.60.2-3.06, 2011.
Putkonen, J. and Swanson, T.: Accuracy of cosmogenic ages for moraines, Quat. Res., 59, 255–261, https://doi.org/10.1016/S0033-5894(03)00006-1, 2003.
Putnam, A. E., Schaefer, J. M., Barrell, D. J. A., Vandergoes, M., Denton, G. H., Kaplan, M. R., Finkel, R. C., Schwartz, R., Goehring, B. M., and Kelley, S. E.: In situ cosmogenic 10Be production-rate calibration from the Southern Alps, New Zealand, Quat. Geochronol., 5, 392–409, https://doi.org/10.1016/j.quageo.2009.12.001, 2010.
Putnam, A. E., Schaefer, J. M., Denton, G. H., Barrell, D. J. A., Birkel, S. D., Andersen, B. G., Kaplan, M. R., Finkel, R. C., Schwartz, R., and Doughty, A. M.: The Last Glacial Maximum at 44∘ S documented by a 10Be moraine chronology at Lake Ohau, Southern Alps of New Zealand, Quat. Sci. Rev., 62, 114–141, https://doi.org/10.1016/j.quascirev.2012.10.034, 2013.
Rabassa, J. and Clapperton, C. M.: Quaternary glaciations of the southern Andes, Quat. Sci. Rev., 9, 153–174, https://doi.org/10.1016/0277-3791(90)90016-4, 1990.
Rabassa, J. and Coronato, A.: Glaciations in Patagonia and Tierra del Fuego during the Ensenadan Stage/Age (Early Pleistocene–earliest Middle Pleistocene), Quat. Int., 210, 18–36, https://doi.org/10.1016/j.quaint.2009.06.019, 2009.
Rinterknecht, V., Braucher, R., Böse, M., Bourlès, D., and Mercier, J. L.: Late Quaternary ice sheet extents in northeastern Germany inferred from surface exposure dating, Quat. Sci. Rev., 44, 89–95, https://doi.org/10.1016/j.quascirev.2010.07.026, 2012.
Sarmiento, J. L. and Toggweiler, J. R.: A new model for the role of the oceans in determining atmospheric , Nature, 308, 621–624, https://doi.org/10.1038/308621a0, 1984.
Schaefer, J. M., Putnam, A. E., Denton, G. H., Kaplan, M. R., Birkel, S., Doughty, A. M., Kelley, S., Barrell, D. J. A., Finkel, R. C., Winckler, G., Anderson, R. F., Ninneman, U. S., Barker, S., Schwartz, R., Andersen, B. G., and Schluechter, C.: The Southern Glacial Maximum 65,000 years ago and its Unfinished Termination, Quat. Sci. Rev., 114, 52–60, https://doi.org/10.1016/j.quascirev.2015.02.009, 2015.
Shakun, J. D., Lea, D. W., Lisiecki, L. E., and Raymo, M. E.: An 800-kyr record of global surface ocean δ 18 O and implications for ice volume-temperature coupling, Earth Planet. Sci. Lett., 426, 58–68, https://doi.org/10.1016/j.epsl.2015.05.042, 2015.
Sime, L. C., Kohfeld, K. E., Le Quéré, C., Wolff, E. W., de Boer, A. M., Graham, R. M., and Bopp, L.: Southern Hemisphere westerly wind changes during the Last Glacial Maximum: model-data comparison, Quat. Sci. Rev., 64, 104–120, https://doi.org/10.1016/j.quascirev.2012.12.008, 2013.
Singer, B. S., Ackert Jr., R. P., and Guillou, H.: 40Ar/39Ar and K-Ar chronology of Pleistocene glaciations in Patagonia, Geol. Soc. Am. Bull., 116, 434–450, https://doi.org/10.1130/B25177.1, 2004.
Spratt, R. M. and Lisiecki, L. E.: A Late Pleistocene sea level stack, Clim. Past, 12, 1079–1092, https://doi.org/10.5194/cp-12-1079-2016, 2016.
Stone, J. O.: Air pressure and cosmogenic isotope production, J. Geophys. Res.-Sol. Ea., 105, 23753–23759, https://doi.org/10.1029/2000JB900181, 2000.
Sugden, D. E., McCulloch, R. D., Bory, A. J.-M., and Hein, A. S.: Influence of Patagonian glaciers on Antarctic dust deposition during the last glacial period, Nat. Geosci., 2, 281–285, https://doi.org/10.1038/ngeo474, 2009.
Sylwan, C., Beraza, L., and Caselli, A.: Magnetoestratigrafi a de la secuencia morenica en el valle del Lago Pueyrredon, provincia de Santa Cruz, Revista de la Asociación Geológica Argentina, 46, 235–238, 1991.
Terrizzano, C. M., García Morabito, E., Christl, M., Likerman, J., Tobal, J., Yamin, M., and Zech, R.: Climatic and Tectonic forcing on alluvial fans in the Southern Central Andes, Quat. Sci. Rev., 172, 131–141, https://doi.org/10.1016/j.quascirev.2017.08.002, 2017.
Toucanne, S., Zaragosi, S., Bourillet, J. F., Cremer, M., Eynaud, F., Van Vliet-Lanoë, B., Penaud, A., Fontanier, C., Turon, J. L., and Cortijo, E.: Timing of massive “Fleuve Manche” discharges over the last 350 kyr: insights into the European ice-sheet oscillations and the European drainage network from MIS 10 to 2, Quat. Sci. Rev., 28, 1238–1256, https://doi.org/10.1016/j.quascirev.2009.01.006, 2009.
Trombotto, D.: Geocryology of Southern South America, in: Developments in Quaternary Sciences, vol. 11, Elsevier, 255–268, https://doi.org/10.1016/S1571-0866(07)10012-9, 2008.
White, T. S., Bridgland, D. R., Westaway, R., Howard, A. J., and White, M. J.: Evidence from the Trent terrace archive, Lincolnshire, UK, for lowland glaciation of Britain during the Middle and Late Pleistocene, Proc. Geol. Assoc., 121, 141–153, https://doi.org/10.1016/j.pgeola.2010.05.001, 2010.
White, T. S., Bridgland, D. R., Westaway, R., and Straw, A.: Evidence for late Middle Pleistocene glaciation of the British margin of the southern North Sea: Late Middle Pleistocene Glaciation Of The British North Sea Margin, J. Quat. Sci., 32, 261–275, https://doi.org/10.1002/jqs.2826, 2017.