the Creative Commons Attribution 4.0 License.
the Creative Commons Attribution 4.0 License.
 | 22 Nov 2023
Evaluating the 11-year solar cycle and short-term 10Be deposition events with novel excess water samples from the East Greenland Ice-core Project (EGRIP)
Chiara I. Paleari
Florian Mekhaldi
Tobias Erhardt
Minjie Zheng
Marcus Christl
Florian Adolphi
Maria Hörhold
Raimund Muscheler
10Be is produced by the interaction between galactic cosmic rays (GCRs) and solar energetic particles (SEPs) with the Earth's atmospheric constituents. The flux of GCRs is modulated by the varying strength of the magnetic fields of the Earth and the Sun. Measurement of 10Be concentrations from polar ice cores is thus a valuable tool to reconstruct the variations in the geomagnetic field and solar activity levels. The interpretation of 10Be records is, however, complicated by non-production-related effects on the 10Be deposition rate caused by climate- or weather-induced variability. Furthermore, volcanic eruptions have been proposed to lead to short-term 10Be deposition enhancements. In this study, we test the use of excess meltwater from continuous flow analysis (CFA) to measure 10Be, allowing less time-consuming and more cost-effective sample preparation. We compare two records obtained from CFA and discrete samples from the East Greenland Ice core Project (EGRIP) S6 firn core, reaching back to 1900 CE. We find that the two records agree well and that the 10Be record from CFA samples agrees as well as the discrete samples with other records from Greenland. Furthermore, by subtracting the theoretically expected GCR-induced signal, we investigate the high-frequency variability in the 10Be records from Greenland and Antarctica after 1951 CE, focusing on SEP events and volcanic eruptions. Finally, we use the 10Be records from Greenland and Antarctica to study the 11-year solar cycles, allowing us to assess the suitability of the CFA samples for the reconstruction of solar activity. This result opens new opportunities for the collection of continuous 10Be records with less time-consuming sample preparation, while saving an important portion of the ice cores for other measurements.
- Article
(5972 KB) - Full-text XML
-
Supplement
(300 KB) - BibTeX
- EndNote


10Be is produced in the atmosphere by the interaction between high-energy cosmic ray particles (galactic cosmic rays – GCRs) and atmospheric atoms. About 65 % of atmospheric 10Be nuclides are produced in the stratosphere (Heikkilä et al., 2009, 2013; Masarik and Beer, 1999), where they can be assumed to be well mixed due to an average residence time of 1–2 years (Heikkilä et al., 2008). Upon binding to sulfate aerosols (e.g., Igarashi et al., 1998), 10Be is removed from the atmosphere by wet and dry deposition and can be measured in environmental archives, such as ice cores from Greenland and Antarctica. Using the ECHAM5 general circulation model coupled with the aerosol module HAM, Heikkilä et al. (2009) showed that the dominant component of 10Be in polar ice cores is stratospheric 10Be, making up to about two-thirds of the signal preserved in ice cores from Greenland and Antarctica. Consequently, they argued that deposition fluxes of 10Be reflect well the changes in the global average 10Be atmospheric production rate.
The flux of GCRs reaching the Earth is modulated by the magnetic fields of Sun and Earth. The production of 10Be thus anticorrelates with the strength of the helio- and geomagnetic fields allowing us to use 10Be from ice cores to reconstruct solar activity (e.g., Beer et al., 1990; McCracken, 2004; Muscheler et al., 2007; Steinhilber et al., 2012; Vonmoos et al., 2006), and the variations in the geomagnetic field dipole moment (e.g., Muscheler et al., 2005; Raisbeck et al., 1985, 2006).
In the last decade, it has also been shown that solar storms can leave a significant imprint in 10Be from Greenland and Antarctica. These events can, in fact, lead to short-lived peaks in the radionuclide concentrations (Mekhaldi et al., 2015; Miyake et al., 2015, 2019; O'Hare et al., 2019; Paleari et al., 2022). Mekhaldi et al. (2021) have modeled the theoretically expected globally averaged annual production rate of 10Be since the 1950s, using neutron monitor data, and the theoretical production induced by ground level enhancements (GLEs); i.e., solar energetic particle (SEP) events that cause sudden increases in ground-based neutron monitor count rates. The strongest directly observed GLE – GLE no. 05 from 1956 – caused, for instance, an increase of only about 5 % in the annual 10Be production rate. Considering that the 11-year solar cycle is estimated to cause a variability of ±15 % to ±35 % (e.g., Baroni et al., 2011; Paleari et al., 2022; Pedro et al., 2012; Mekhaldi et al., 2021), the signal of modern events cannot be unequivocally distinguished from the variability caused by the 11-year cycle and climate and local weather influences (Mekhaldi et al., 2021). For the instrumental period, no unambiguous SEP signal could be detected in ice cores so far, not even in seasonal 10Be data (e.g., Pedro et al., 2011a, b; Zheng et al., 2020).
Moreover, as proposed by Baroni et al. (2011, 2019), peaks in 10Be concentrations in ice cores may sometimes be linked to stratospheric volcanic eruptions. The Agung and Pinatubo eruptions, for instance, are estimated to have caused an increase in 10Be deposition of 66 % and 35 %, relative to the baseline radionuclide concentration in the Vostok ice core from Antarctica (Baroni et al., 2011).
Especially for detecting the short-lived spikes caused by SEPs in the past, high-resolution measurements are required. These are often labor-intense and limited by the availability of sufficient ice core sample material. In this study, we aim at testing the use of excess meltwater samples usually discarded from continuous flow analysis (CFA) for the measurement of cosmogenic 10Be. This method could provide the potential for high-resolution and cost-efficient 10Be sampling without the need for competing for the valuable ice. We collected the meltwater from the CFA system at the Institute for Climate and Environmental Physics at the University of Bern (Switzerland). The system is used to measure impurities in ice cores (e.g., Erhardt et al., 2022), which requires the use of pristine ice. The system is equipped with a melt head designed to only capture the inner part of the ice core for the measurement of impurities, preventing the ice from being possibly contaminated by the surrounding atmosphere (Erhardt et al., 2019). The outer part can in theory be used for cosmogenic radionuclide measurements, as they are less prone to contamination. This technique has already been used to collect a short record of about 40 years from the EGRIP (East Greenland Ice core Project) ice core to study an extreme SEP event that hit Earth 9125 yr BP (Paleari et al., 2022), which is estimated to be 2 orders of magnitude larger than modern GLEs. While suitable for the assessment of the existence of the peak in 10Be concentrations, it was not possible to analyze in depth and ultimately quantify the uncertainties related to this method. That is because the record was only compared to ice core records from other locations from Greenland and Antarctica and therefore characterized by different climate and weather conditions. Here, we present a new 10Be record from the S6 firn core from EGRIP (see Fig. 1 for the location), covering the depth from about 4 to 26 m and corresponding approximately to the period between 1900 and 2008 CE. To assess the suitability of the CFA samples to measure cosmogenic radionuclides and retrieve a solar signal, 10Be records obtained from CFA and discrete firn samples from the EGRIP S6 core (Zheng et al., 2023) are compared. The use of two 10Be records from the same core allows us to directly assess the quality and possible differences between the sampling methods.
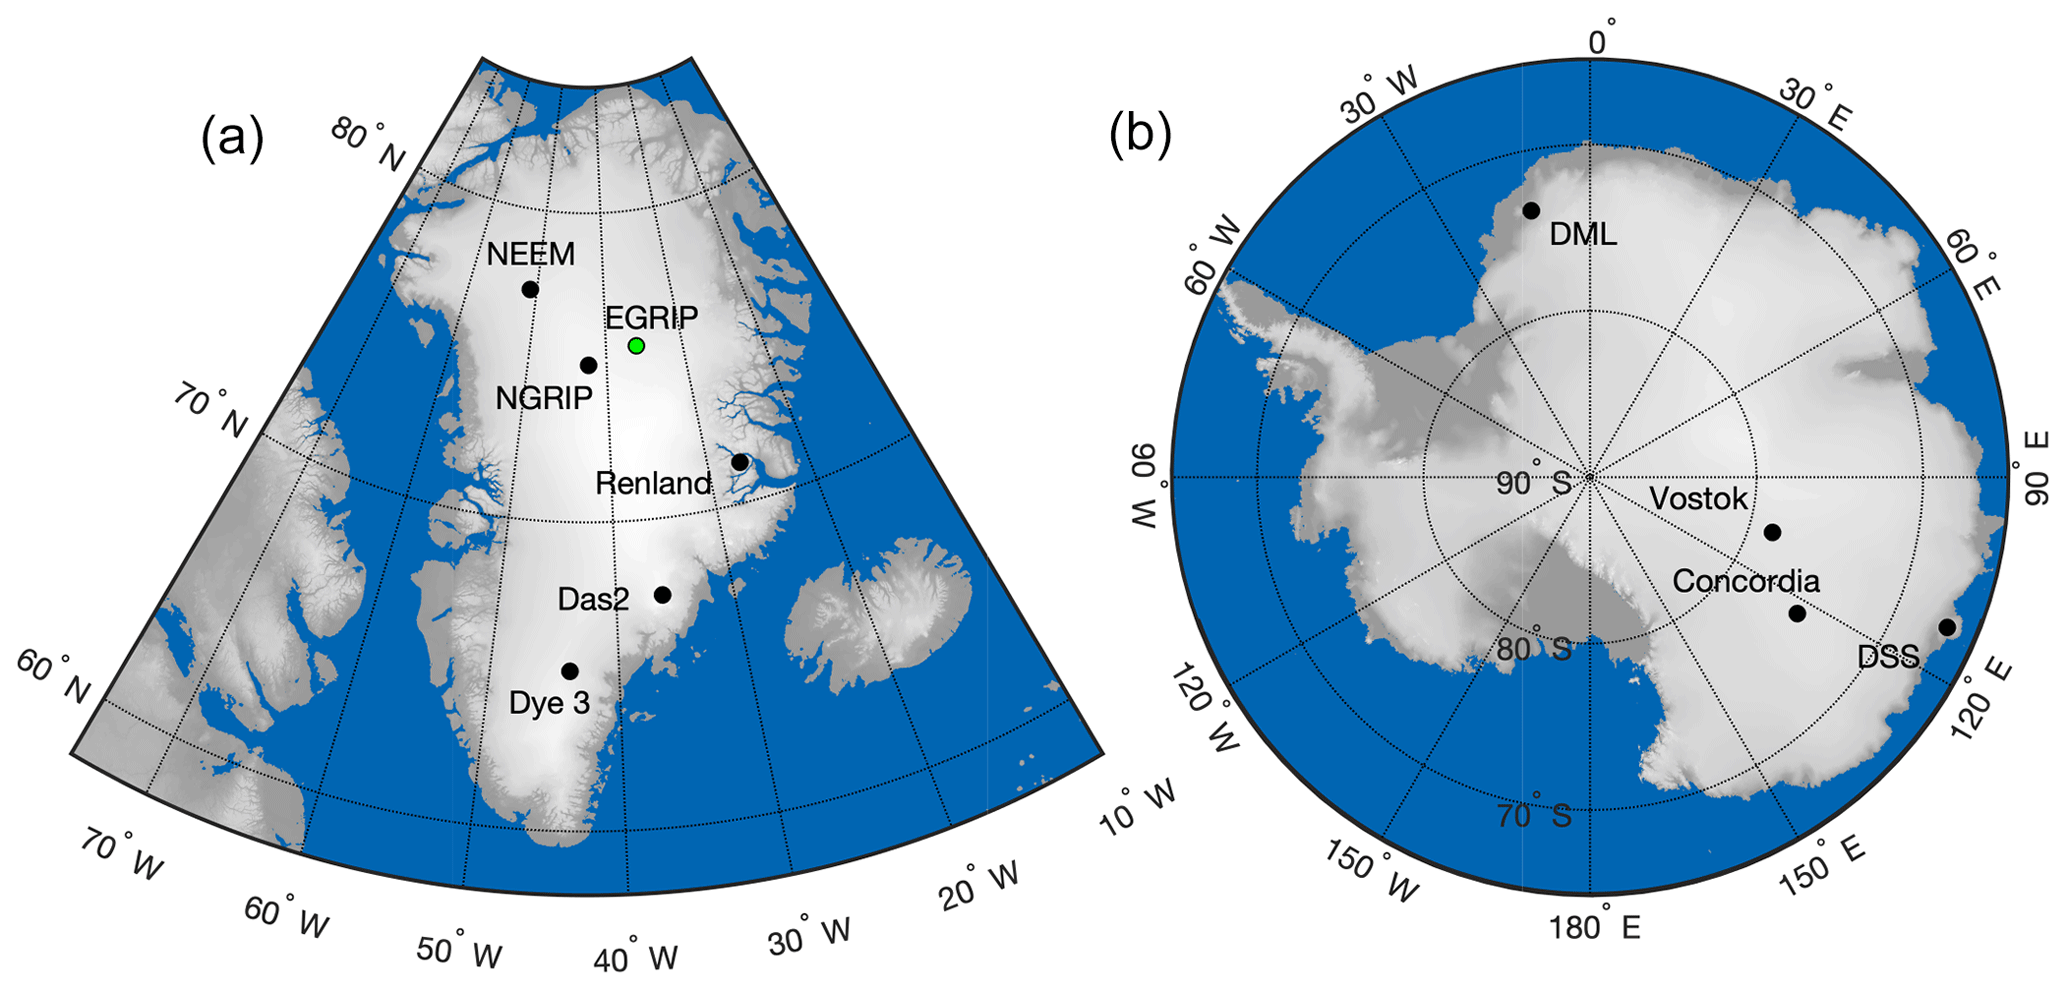
Figure 1Location of the EGRIP site (marked with a green circle) and other ice core locations from Greenland (a) and Antarctica (b) discussed in this work.
In addition, we investigate the causes of short-term and non-GCR-related 10Be variability in the 10Be records from EGRIP S6 and other available records from Greenland and Antarctica. More specifically, we aim to investigate whether we can detect the signal of large SEP events (or GLEs) and volcanic eruptions. Furthermore, we investigate the preservation of the 11-year solar cycle in the 10Be records.
2.1 Collection and preparation of the CFA samples
The CFA samples were collected during the melting campaign carried out at the Institute for Climate and Environmental Physics at the University of Bern (Switzerland) in October 2019. During the campaign, 36×36 mm vertical sticks of ice of 1 m in length were continuously melted on a melt head. The melt head is designed to only inject meltwater from the inner part of the core for measurement (26×26 mm; e.g., Erhardt et al., 2022), while the meltwater from the outer part of the core, otherwise discarded, is pumped towards centrifuge tubes for continuous 10Be sampling through a 3 m long Teflon tube. To collect the water, we used 50 mL centrifuge tubes into which 0.1 mg 9Be carrier (from Scharlau (1000 mg L−1; Be4O(C2H3O2)6 in HCl 2 %) was previously injected.
The preparation of the samples for accelerator mass spectrometry (AMS) measurements was carried out at the Department of Geology at Lund university (Sweden). Each ∼50 mL sample was directly precipitated with NH4OH. This allows us to avoid the use of ion exchange chromatography (IEC), thereby saving about 3 h of preparation per 12 samples and a significant number of materials (e.g., ion exchange columns). A schematic summarizing the preparation of 10Be samples with and without IEC at Lund University can be found in Nguyen et al. (2021). After centrifugation, the precipitate was transferred to a quartz crucible. During this step, consecutive samples were paired to obtain samples of ∼100 g with 0.2 mg of 9Be carrier. The resulting samples have an average length of 25 cm, corresponding to an average time resolution of 1.2 years, with a minimum of 0.7 years and maximum of 2 years, depending on annual layer thickness and firn density. The crucibles were then placed into an oven, where the temperature is slowly raised to 850 ∘C, allowing the oxidization of Be(OH)2 to BeO. Finally, 1 mg of niobium was added, and the mixture was pressed into target holders for measurements. The measurements were carried out at the Laboratory of Ion Beam Physics at ETH Zürich (Switzerland). The record was blank corrected ( blank ratios were ∼6 % of the samples ratio; average of the blank samples was ). The measured ratios were normalized to the ETH Zürich in-house standards S2007N and S2010N, which were both calibrated relative to the ICN 01-5-1 standard ( nominal) (Christl et al., 2013).
2.2 Depth attribution of the samples
The depth–sample relationship has to be reconstructed, since the continuous melting does not allow a precise measurement of the depth range covered by each CFA 10Be sample. During sample collection, it is possible to know in which vial there is a transition between two consecutive 1 m sections, and the samples in between are assumed to contain equidistant sections of firn in terms of ice-equivalent depth and ignoring any short-term fluctuations in melt speed. This is probably not accurate, as the layer thickness is not constant. Taking also into account the time needed for the meltwater to flow from the melt head to the centrifuge tubes (usually 20–30 s) and that was calculated at the beginning of each melting session, we assume the uncertainty related to the depth attribution to be <6 cm (3–4 months on average). We thus consider this to not affect our results significantly (see Sect. 3).
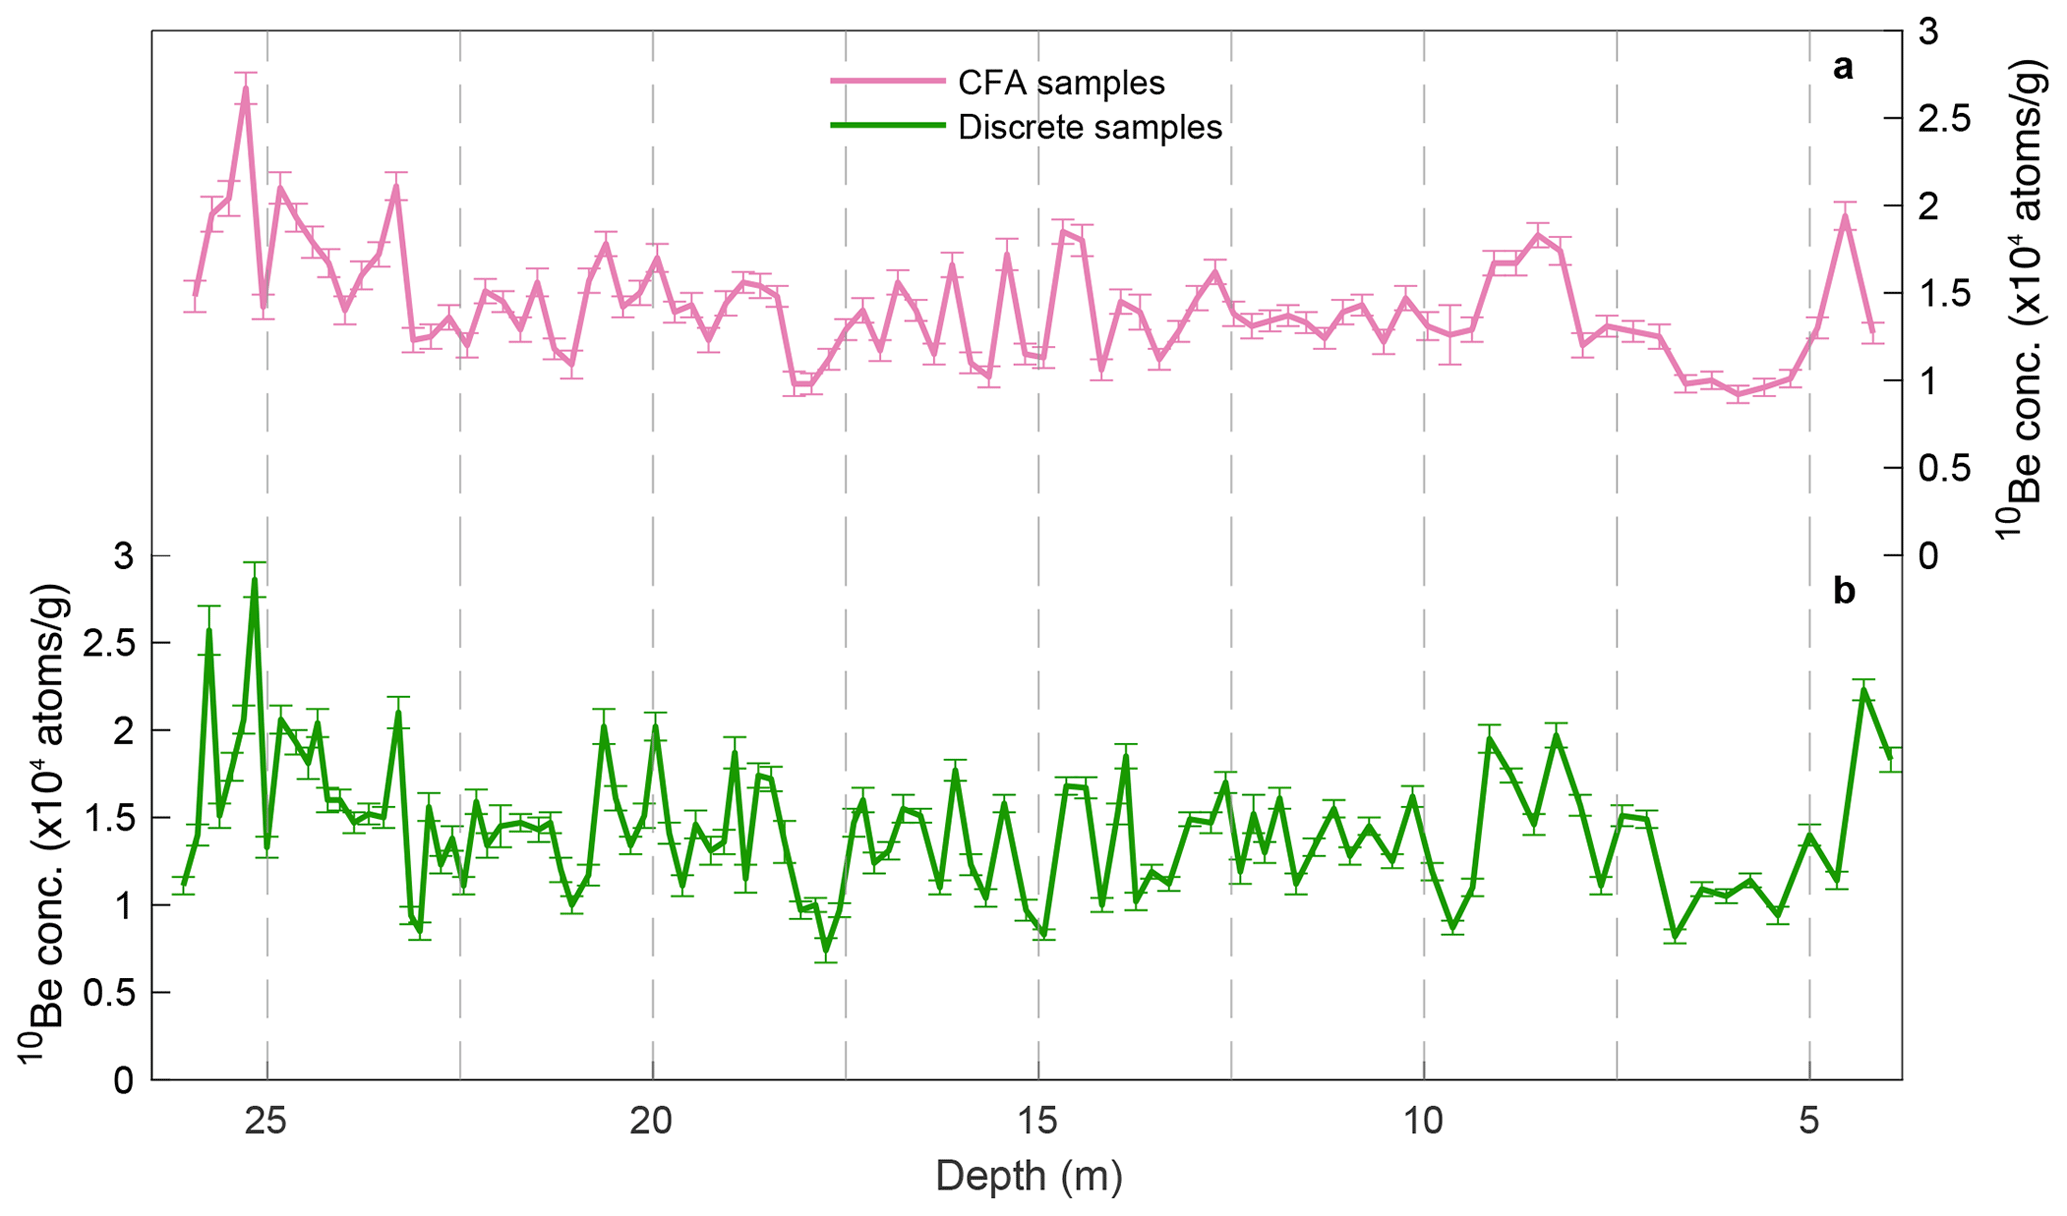
Figure 210Be concentration record from CFA excess water samples (a) and 10Be concentrations from discrete firn samples (b) (Zheng et al., 2023) from the EGRIP S6 core. The records are plotted versus the depth of the core. The error bars represent the 1σ measurement uncertainty.
2.3 Timescale of the EGRIP S6 core
The timescale for the EGRIP S6 core is constructed by counting the annual layers visible in the CFA dataset of the core. To constrain the annual layer count and align the EGRIP S6 age model with the main core, tie points of the EGRIP–GICC05 age scale (Mojtabavi et al., 2020) were identified in the electrolytic meltwater conductivity records at 21.53, 23.94, and 30.63 m depth and 73, 87, and 125 years b2k (before 2000 CE), respectively. In addition, the drilling year was used as an age constraint at the surface. The counting was performed using the StratiCounter algorithm (Winstrup et al., 2012). Between the first tie point and the surface age, the timescale is adjusted within the annual layer counting uncertainty, based on work by Zheng et al. (2023), who identified the timescale offset (i) between the EGRIP discrete firn 10Be data and the theoretical 10Be production rate referred from the sunspot numbers and (ii) between accumulation rates (layer thickness) and precipitation. For consistency, in this study, we adopt the updated chronology by Zheng et al. (2023).
The 10Be record from EGRIP S6 CFA excess water samples is shown in pink in Fig. 2a. The 10Be concentrations were measured in firn from about 4 to 26 m depth, encompassing the period 1900–2008, according to the chronology by Zheng et al. (2023). The 10Be concentrations have an average of atoms g−1. Figure 2b shows the 10Be concentrations from discrete firn samples from the same core. The average 10Be concentration of the discrete record is atoms g−1 (Zheng et al., 2023). The meltwater samples have, on average, a measurement uncertainty of 5 %, similar to the 10Be measurements carried out on the discrete firn samples (Zheng et al., 2023), despite the smaller size (100 g for CFA samples versus ca. 140 g for discrete samples).
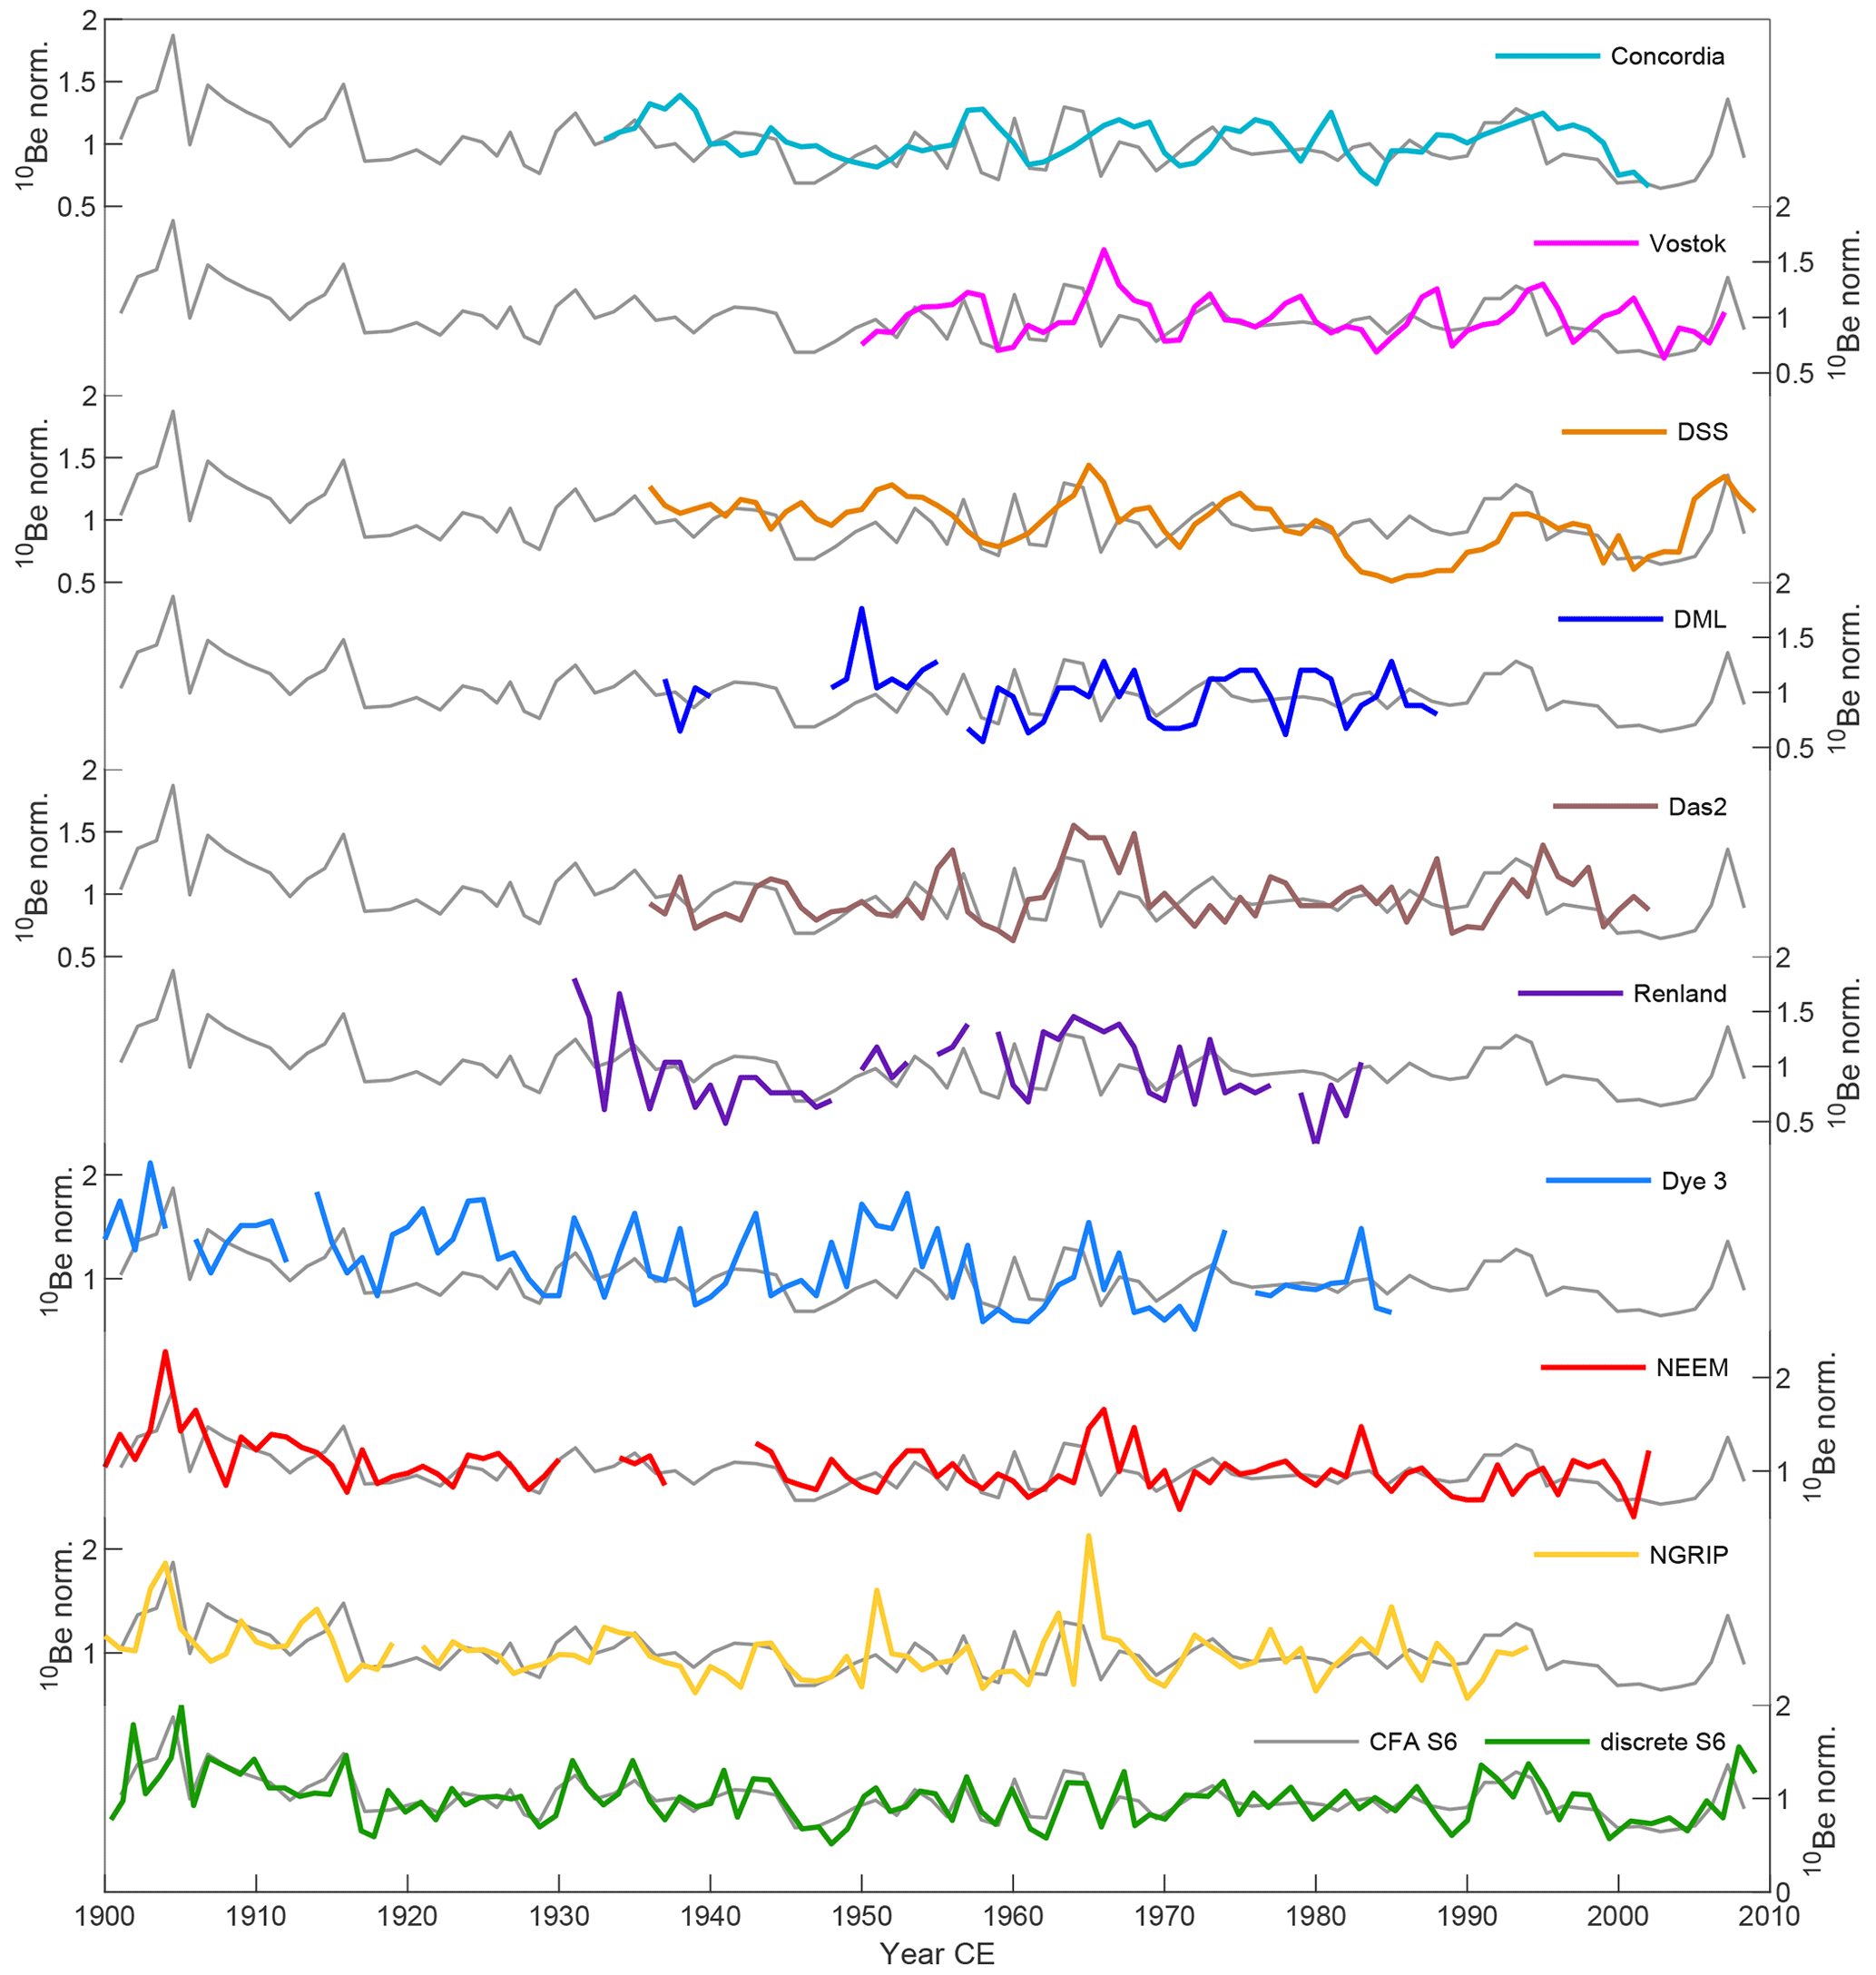
Figure 3Normalized 10Be concentration records from the EGRIP S6 CFA samples in comparison to the normalized 10Be records from discrete samples (Zheng et al., 2023), NGRIP (Berggren et al., 2009), NEEM (Zheng et al., 2021), Dye 3 (Beer et al., 1990), Renland (Aldahan et al., 1998), Das2 (Pedro et al., 2012), DML (Aldahan et al., 1998), DSS (Pedro et al., 2012), Vostok (Baroni et al., 2011), and Concordia (Baroni et al., 2011), starting in 1900 CE.
As the sampling rates of the two S6 records are different, the 10Be records need to be virtually resampled to be directly compared. The 10Be concentrations from CFA samples and from discrete samples were interpolated linearly at steps of 0.1 year, and the yearly 10Be concentrations were calculated by averaging over 10 consecutive data points. The two yearly resampled 10Be records agree well (r=0.77; p<0.01 – computed using a t test). If we resample the discrete record to match the resolution of the CFA 10Be record, then we obtain a correlation coefficient of 0.71 (p<0.01). It can, however, be pointed out that the first ∼8 m of the CFA excess water record (between ∼4 and ∼12 m depth) is seemingly more autocorrelated compared to the deeper part of the record, and relative to the discrete 10Be record, the latter also smoother in the first ∼8 m of the record compared to the deeper part. The sampling method and rate can likely affect the degree to which the two records agree. 10Be deposition is known to be highly seasonal, with maxima closely related to the enhanced stratosphere–troposphere exchanges (STEs), causing an increased descent of 10Be from the stratosphere, where most of the production takes place, to the troposphere (Stohl et al., 2003; Zheng et al., 2020; Spiegl et al., 2022; Heikkilä and Smith, 2013; Pedro et al., 2011a). Moreover, one of the main complications of dealing with CFA systems is the possible smoothing of the signal locked in the ice (Erhardt et al., 2022; Kaufmann et al., 2008; Mekhaldi et al., 2017; Sigg et al., 1994). 10Be ions may attach to the walls of the plastic tube connecting the melt head to the centrifuge tubes, as 10Be precipitates in a basic environment. Therefore, it is possible that some atoms may precipitate on the plastic walls and be remobilized at a later stage. Loss of 10Be to the centrifuge tube walls is considered unlikely, since the 9Be carrier (slightly acidic) was added to the centrifuge tubes before collecting the samples, and the ratio is, in theory, preserved. It is, however, most likely that the smoothing in the shallower part of the CFA 10Be record is caused by analytical issues related to the upward wicking of meltwater in the very porous snow during melting, which affects the shallow most parts of the core.
To investigate whether the CFA excess water samples are suitable to preserve the 10Be production rate signal as robustly as discrete firn samples, the 10Be records from EGRIP S6 are compared to other available 10Be records from Greenland and Antarctica. We compare the 10Be record from CFA samples to 10Be concentration records from the NGRIP (Berggren et al., 2009), NEEM (Zheng et al., 2021), Dye 3 (Beer et al., 1990), Renland (Aldahan et al., 1998), Das2 (Pedro et al., 2012), DML (Aldahan et al., 1998), DSS (Pedro et al., 2012), Vostok (Baroni et al., 2011), and Concordia (Baroni et al., 2011) cores. The NEEM record is available at sub-annual resolution, and thus, we calculated mass-weighted means of each year. Figure 3 shows the comparison between the CFA 10Be record (gray line) and the other records from Greenland and Antarctica starting in 1900 CE. The degree to which the CFA 10Be record agrees with the other 10Be records can be seen in the correlation matrix in Fig. 4. For this analysis, we used the CFA and discrete 10Be records resampled at 1-year resolution to match the timescale of the other records. To calculate the correlation coefficients, the records were normalized to their mean for the period 1949–1985, thus representing the time span shared by all records.
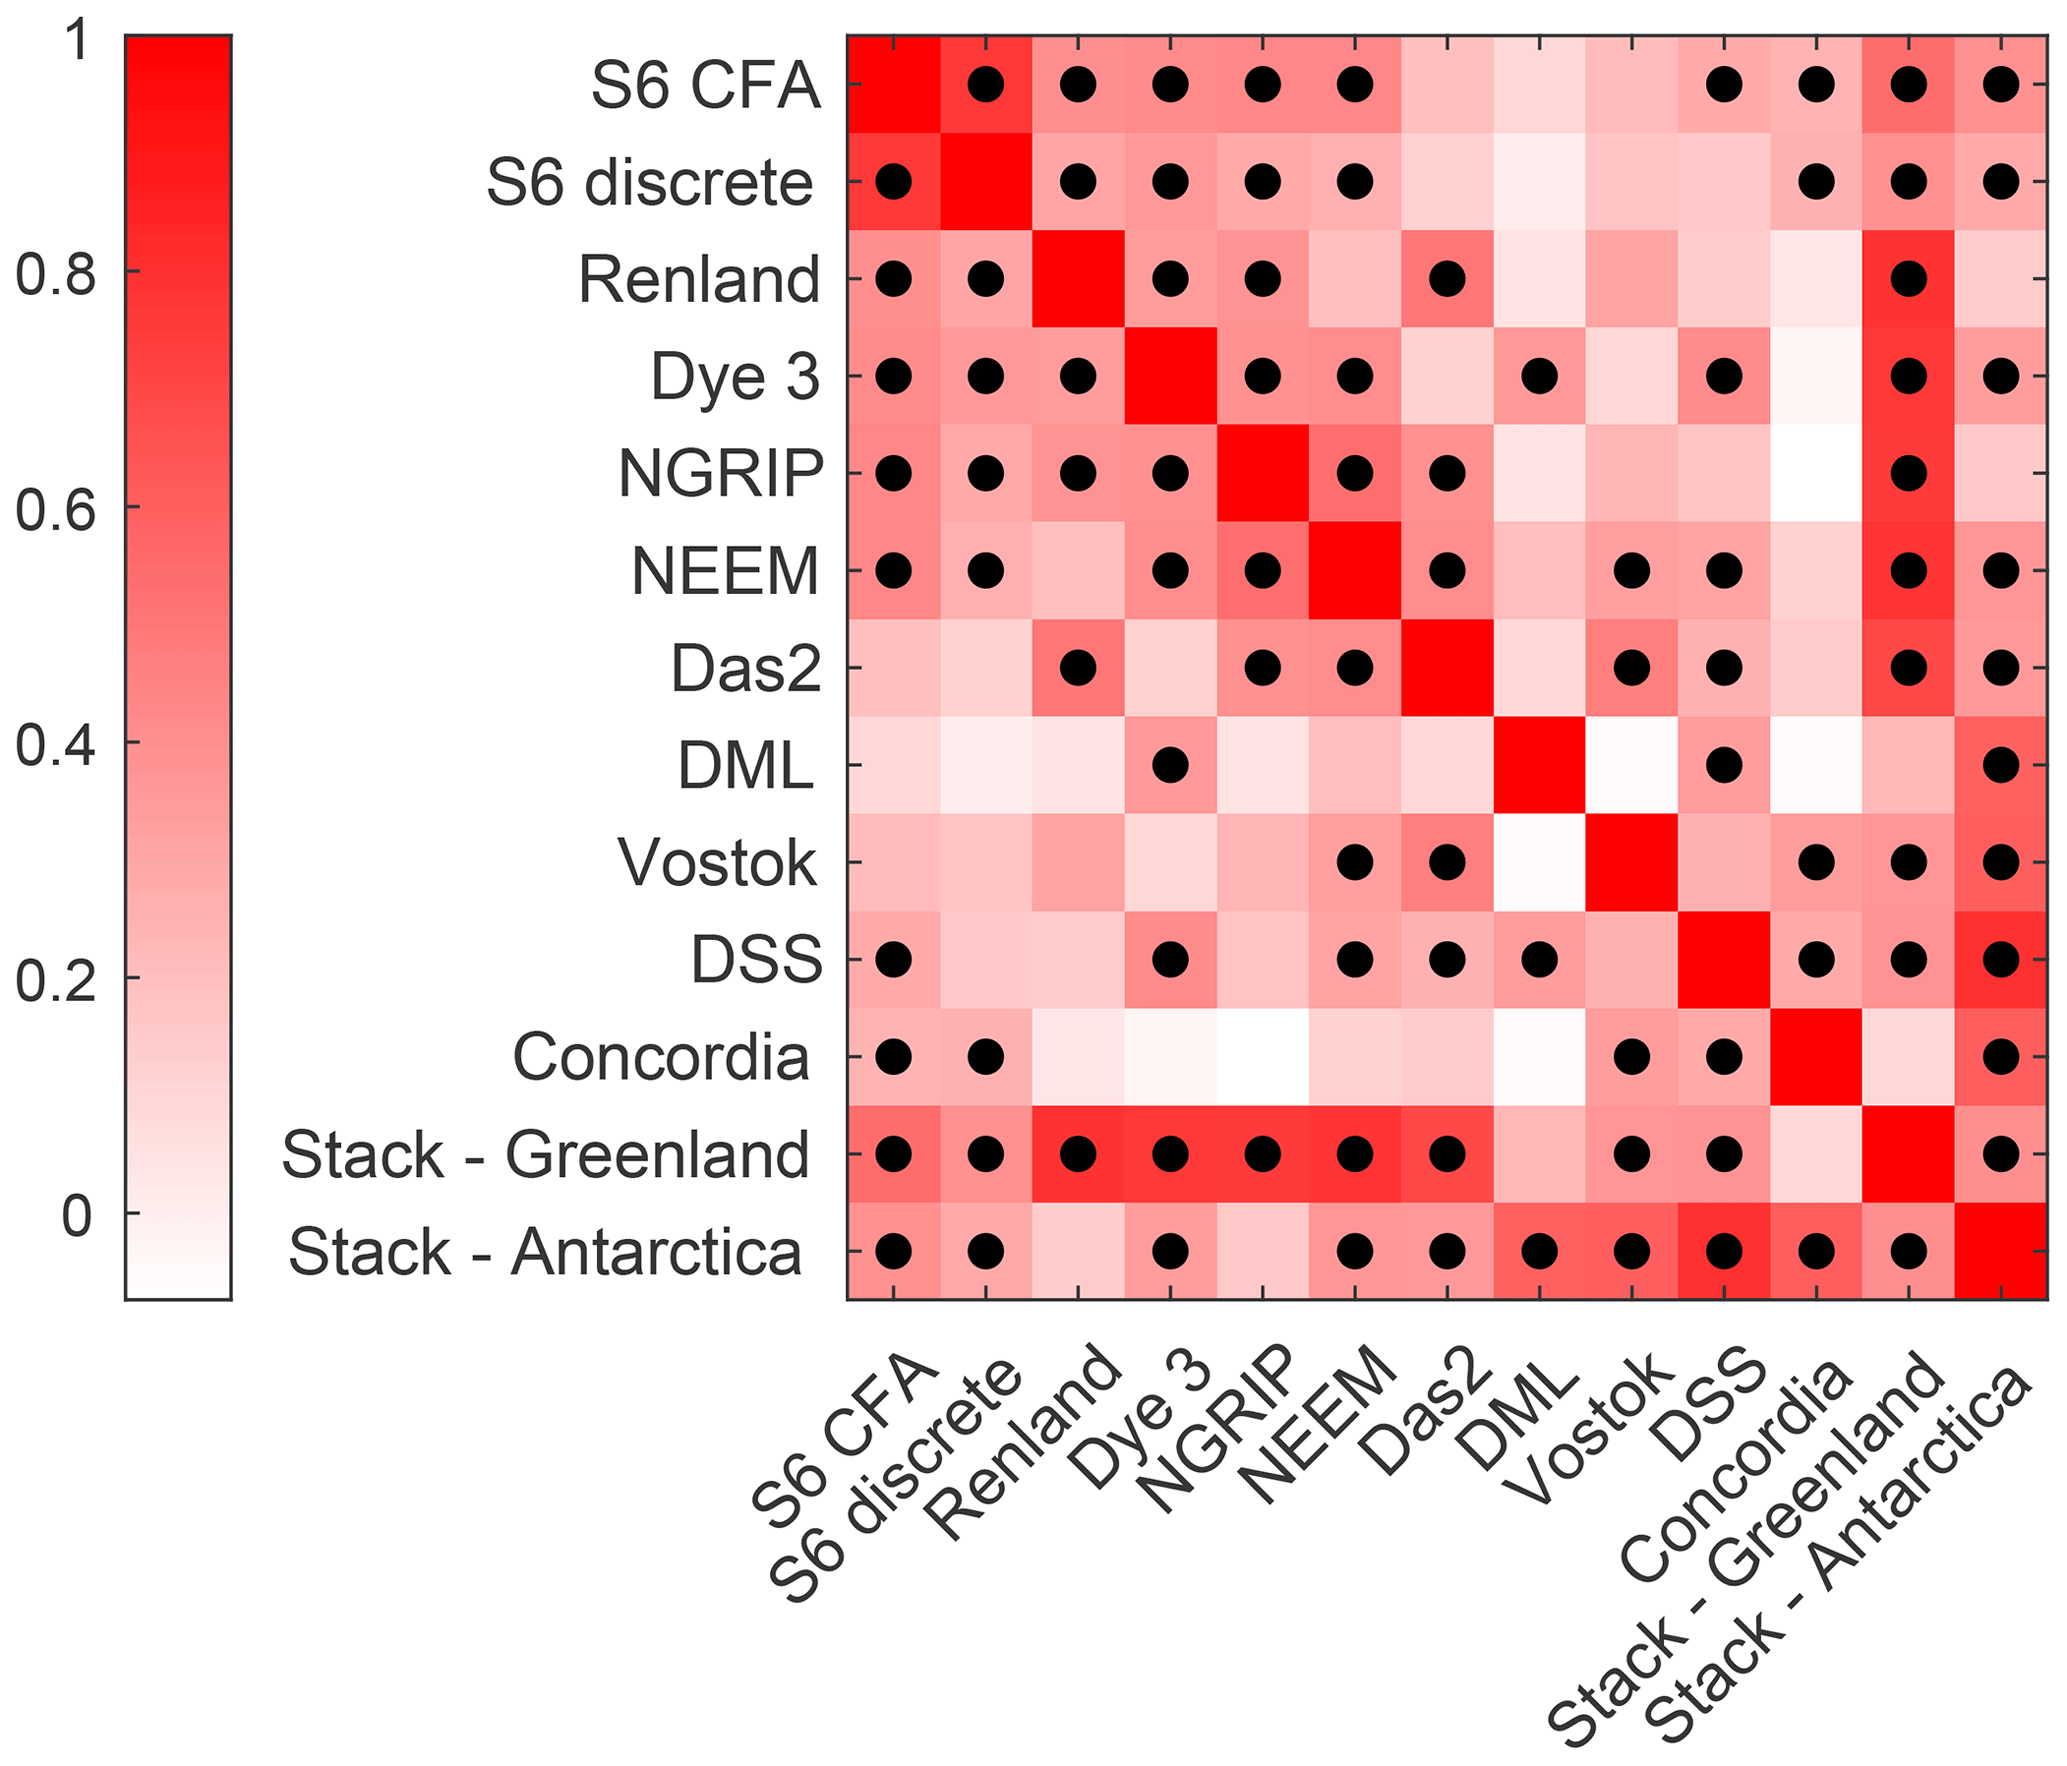
Figure 4Correlation matrix (Pearson correlation coefficient) between the 10Be records from EGRIP S6 (CFA and discrete), Renland, Dye 3, NGRIP, NEEM, Das2, DML, Vostok, DSS, Concordia, and the Antarctic and Greenland stacks (excluding the EGRIP S6 records) since 1900 CE. Dots represent significant correlations (p<0.05).
In general, the EGRIP CFA 10Be record shows similar but somewhat higher correlation coefficients with the other records from Greenland and Antarctica, compared with the discrete EGRIP 10Be record. While the higher correlation coefficients can likely be attributed to the higher autocorrelation inherent to the smoothing effect of CFA sampling in the shallower part of the record, our results indicate that the signal measured in the CFA samples is reproducing the common radionuclide signal in Greenland and Antarctica, as well as the discrete firn samples. The EGRIP S6 records from CFA and discrete firn samples agree well with the 10Be records from Greenland, except for Das2 (see Fig. 4). This could be explained by the very high 10Be concentrations in the Das2 record during the 1960s, corresponding to a pronounced minimum in accumulation rate (Pedro et al., 2012). Moreover, the differences between the EGRIP S6 records and the Das2 record in the early 1990s likely affect the correlation coefficient. We obtain correlation coefficients of 0.54 (p<0.01) and 0.39 (p<0.01) between the stack of 10Be records from Greenland (excluding the EGRIP S6 records) and the S6 records from CFA and discrete samples, respectively. We obtain correlation coefficients of 0.39 (p<0.01) and 0.29 (p<0.01) between the stack of records from Antarctica and the S6 records from CFA and discrete samples, respectively.
Differences between the records could arise from non-production-related biases such as measurement and sampling uncertainty, meteorological influences on the transport and deposition of 10Be en route and on site, and local re-distribution of snow by surface winds. For instance, Heikkilä and Smith (2013) found a strong correlation between 10Be deposition and the North Atlantic Oscillation (NAO) in Greenland, with a positive correlation on the east coast and negative on the west coast.
CFA and discrete 10Be records are then compared with the stack of the normalized 10Be records from Greenland (excluding EGRIP S6 records) and Antarctica (Fig. 5). The calculation of a stack with several records from different sites allows us to reduce the noise by isolating their common signal, which is expected to more closely reflect the atmospheric production signal. The CFA 10Be record has a correlation coefficient of 0.60 (p<0.01) with the global 10Be stack, while the 10Be record from discrete firn samples has a correlation coefficient of 0.42 (p<0.01).
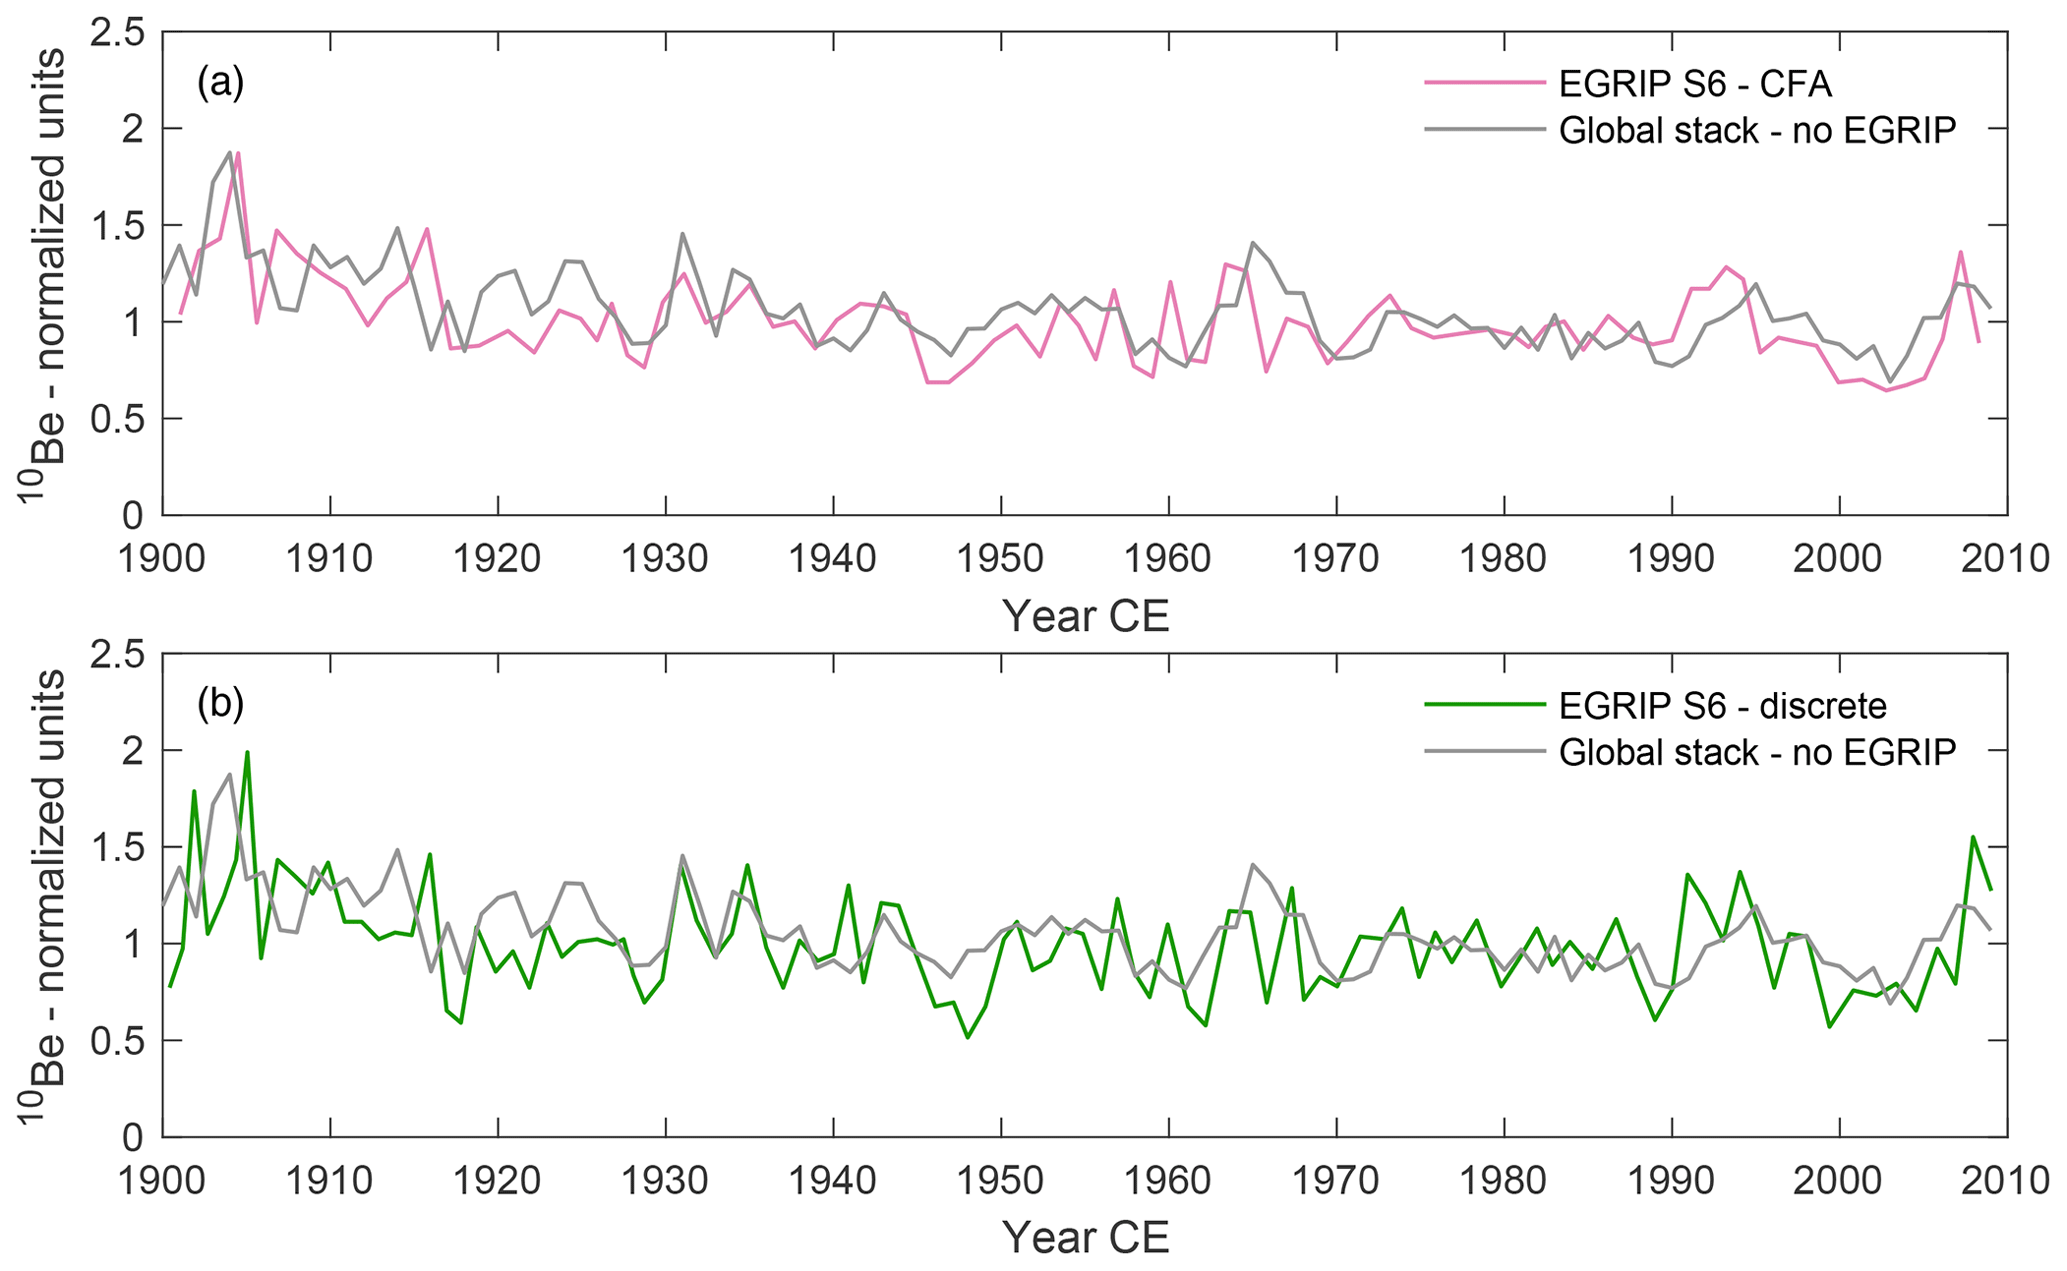
Figure 5Comparison between the global stack calculated using the normalized 10Be records from Greenland and Antarctica (NGRIP, NEEM, Renland, Dye 3, Das2, DML, DSS, Vostok, and Concordia) and the normalized 10Be records from EGRIP S6 CFA (a) and discrete (b) samples.
5.1 EGRIP S6 records
10Be records from ice cores are valuable tools to reconstruct solar activity prior to the advent of spaceborne measurements, ground-based instrumental records, and sunspot observations. Nevertheless, the interpretation of 10Be records is complicated by the influence of climate, local weather noise (e.g., Pedro et al., 2011a, b), and the stochastic occurrence of volcanic eruptions (Baroni et al., 2011, 2019).
Here, we investigate outliers in the two 10Be records from the EGRIP S6 firn core to assess whether it is possible to infer their cause. To do so, the normalized globally averaged 10Be production rate caused by GCRs (Mekhaldi et al., 2021) was virtually resampled at the resolution of the CFA and discrete 10Be records. This resampled production rate was subtracted from the two normalized 10Be records from EGRIP S6 for the period from 1951 (constrained by the advent of neutron monitors) to 2008, assuming that this removes the variability induced by the 11-year solar cycle. We then standardized the residuals to z scores; i.e., the number of standard deviations by which the residuals are above or below their mean value. We repeated the experiment using the modeled normalized 10Be deposition flux over latitudes 60–90∘ N caused by GCRs and including the transport modeled using the parameterization from Heikkilä et al. (2009) (Mekhaldi et al., 2021). From this point on, we will refer to Resrecordname_prod and Resrecordname_transport. The standard scores of the resulting residuals are shown in Fig. 6 (CFA samples in pink and discrete firn samples in green), and a summary of the results is shown in Table 1.
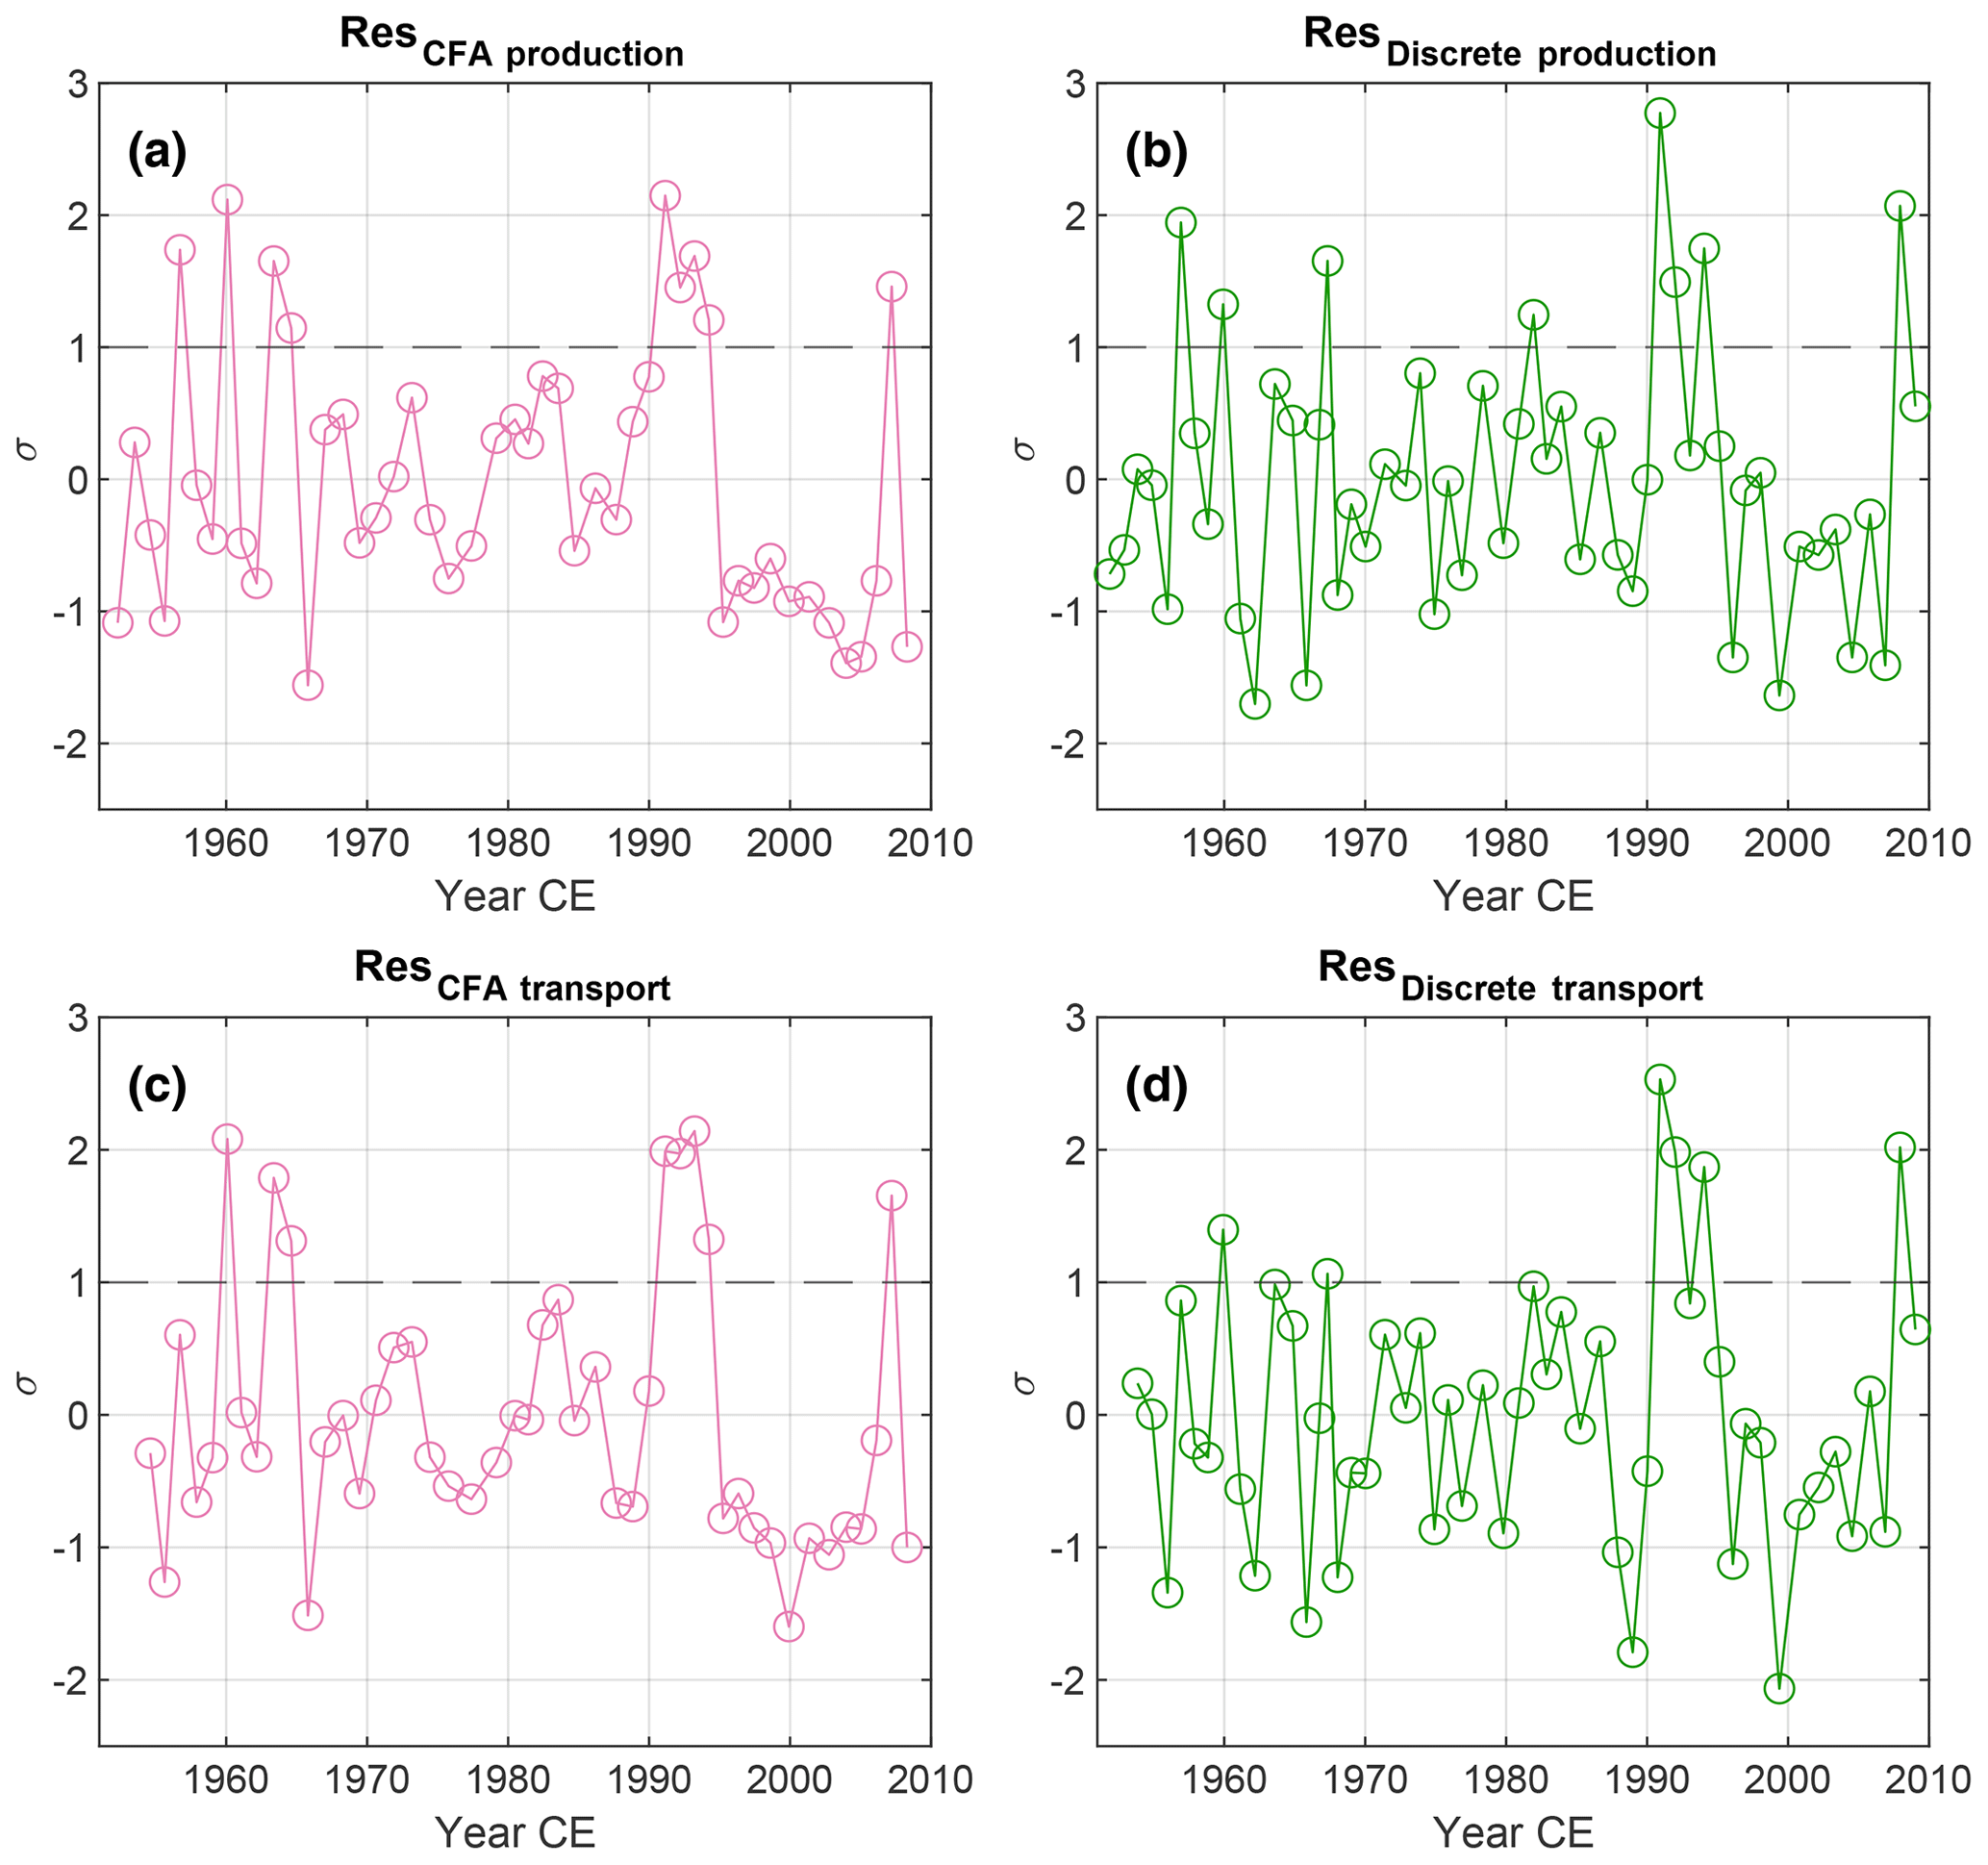
Figure 6Standard scores for the EGRIP S6 10Be records. Panels (a) and (b) show the standardized residuals obtained by subtracting the normalized theoretical 10Be global production rate from the normalized EGRIP S6 10Be records since 1951 (CFA 10Be sample residuals in pink; discrete 10Be sample residuals in green). Panels (c) and (d) show the same as panels (a) and (b) but for the 10Be deposition flux, including the transport over latitudes 60–90∘ N (Mekhaldi et al., 2021).
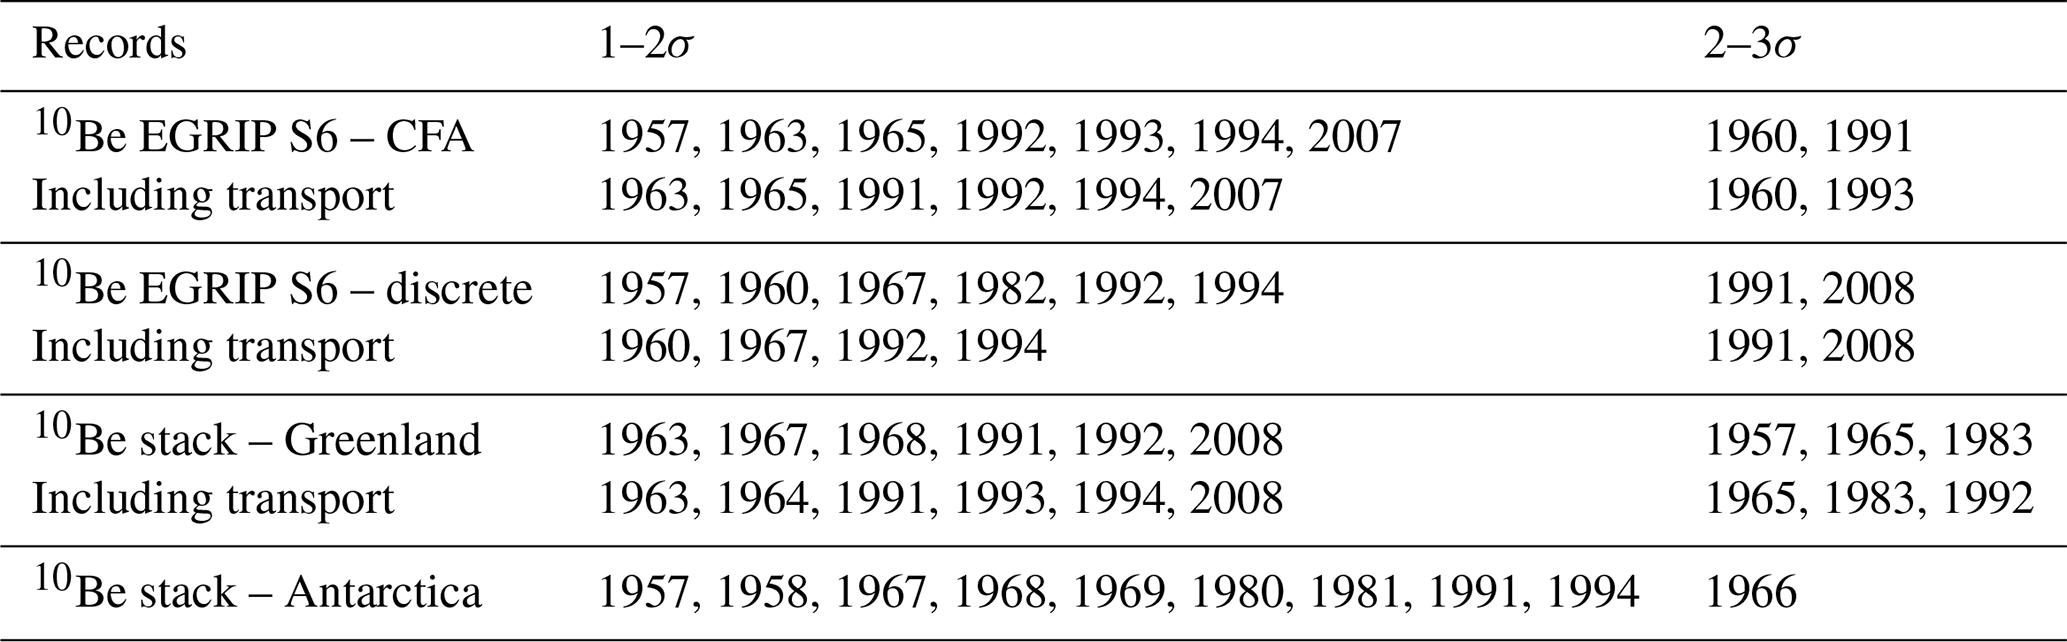
Table 1Summary of the years during which we find standard scores exceeding 1σ from the GCR-production-corrected EGRIP S6 records, Greenland and Antarctic stacks.
Although we expect some of these results to be exclusively caused by noise inherent to the data, values exceeding 1σ in the years following a stratospheric volcanic eruption and/or a solar storm may be more likely. Several of the major stratospheric volcanic eruptions from the last 70 years have been identified in sulfate records from Greenland in 1957, 1964, 1982–1984, and 1991 (Sigl et al., 2015; Zielinski et al., 1997). Some of the eruptions were traced to, for instance, Agung (in 1963), El Chichón (in 1982), and Pinatubo (in 1991). Taking into account timescale uncertainties and the lag due to the transport of 10Be from the stratosphere, we would expect to find values exceeding 1σ in the years of the eruptions and/or 1 to 2 years after the eruptions. The results of the analysis are summarized in Table 1. Some of the results are coeval with the timing of the Agung and Pinatubo eruptions, although the Pinatubo eruption is generally not particularly prominent in the other 10Be records from Greenland (see Fig. 3), and the uncertainty in the S6 chronology may affect our interpretation.
Although it is reasonable to expect values exceeding 1σ to be related to stochastic noise, we want to investigate whether GLE no. 05 from 1956 left any traces in the 10Be records from ice cores. GLE no. 05 is the event that yielded the most annual production of 10Be over the last 70 years of instrumental data, with an estimated increase of +5.1 % in the modeled annual 10Be global production rate (Mekhaldi et al., 2021). The analysis of the standard scores shows that values exceeding 1σ can be identified in 1957 in ResCFA_prod and Resdiscrete_prod. We find an increase in 10Be concentrations of 21 % in 1957 in the CFA record and an increase of 42 % in the discrete record. The increases were calculated relative to the average 10Be concentration over solar cycle 19 (excluding the targeted years). However, we cannot exclude that the increase in 10Be concentration is caused mostly by the natural variability in the 10Be, with a more modest contribution of the SEP events and/or volcanic eruptions.
5.2 10Be stacks from Greenland and Antarctica
In the following section, we analyze the standard scores of the residuals obtained by subtracting the normalized theoretical 10Be production rate (by GCRs) from the Greenlandic and Antarctic stacks. As volcanic eruptions may impact 10Be records from Greenland and Antarctica differently, the analysis of the standard scores has been performed separately on the stacks from the two regions.
The stack from Greenland (see Fig. 7a) has been calculated using all the records from Greenland from Fig. 3 normalized to their respective mean during the period 1951–1985, representing the time span shared by all the records. Figure 7b shows the standard scores calculated on the residuals obtained by subtracting the modeled normalized 10Be production rate (Mekhaldi et al., 2021) from the Greenland 10Be stack (ResGreenland_prod). Figure 7c shows the standard scores calculated on the residuals obtained by subtracting the normalized 10Be modeled deposition flux, including the transport in the Northern Hemisphere (Mekhaldi et al., 2021) (ResGreenland_transport).
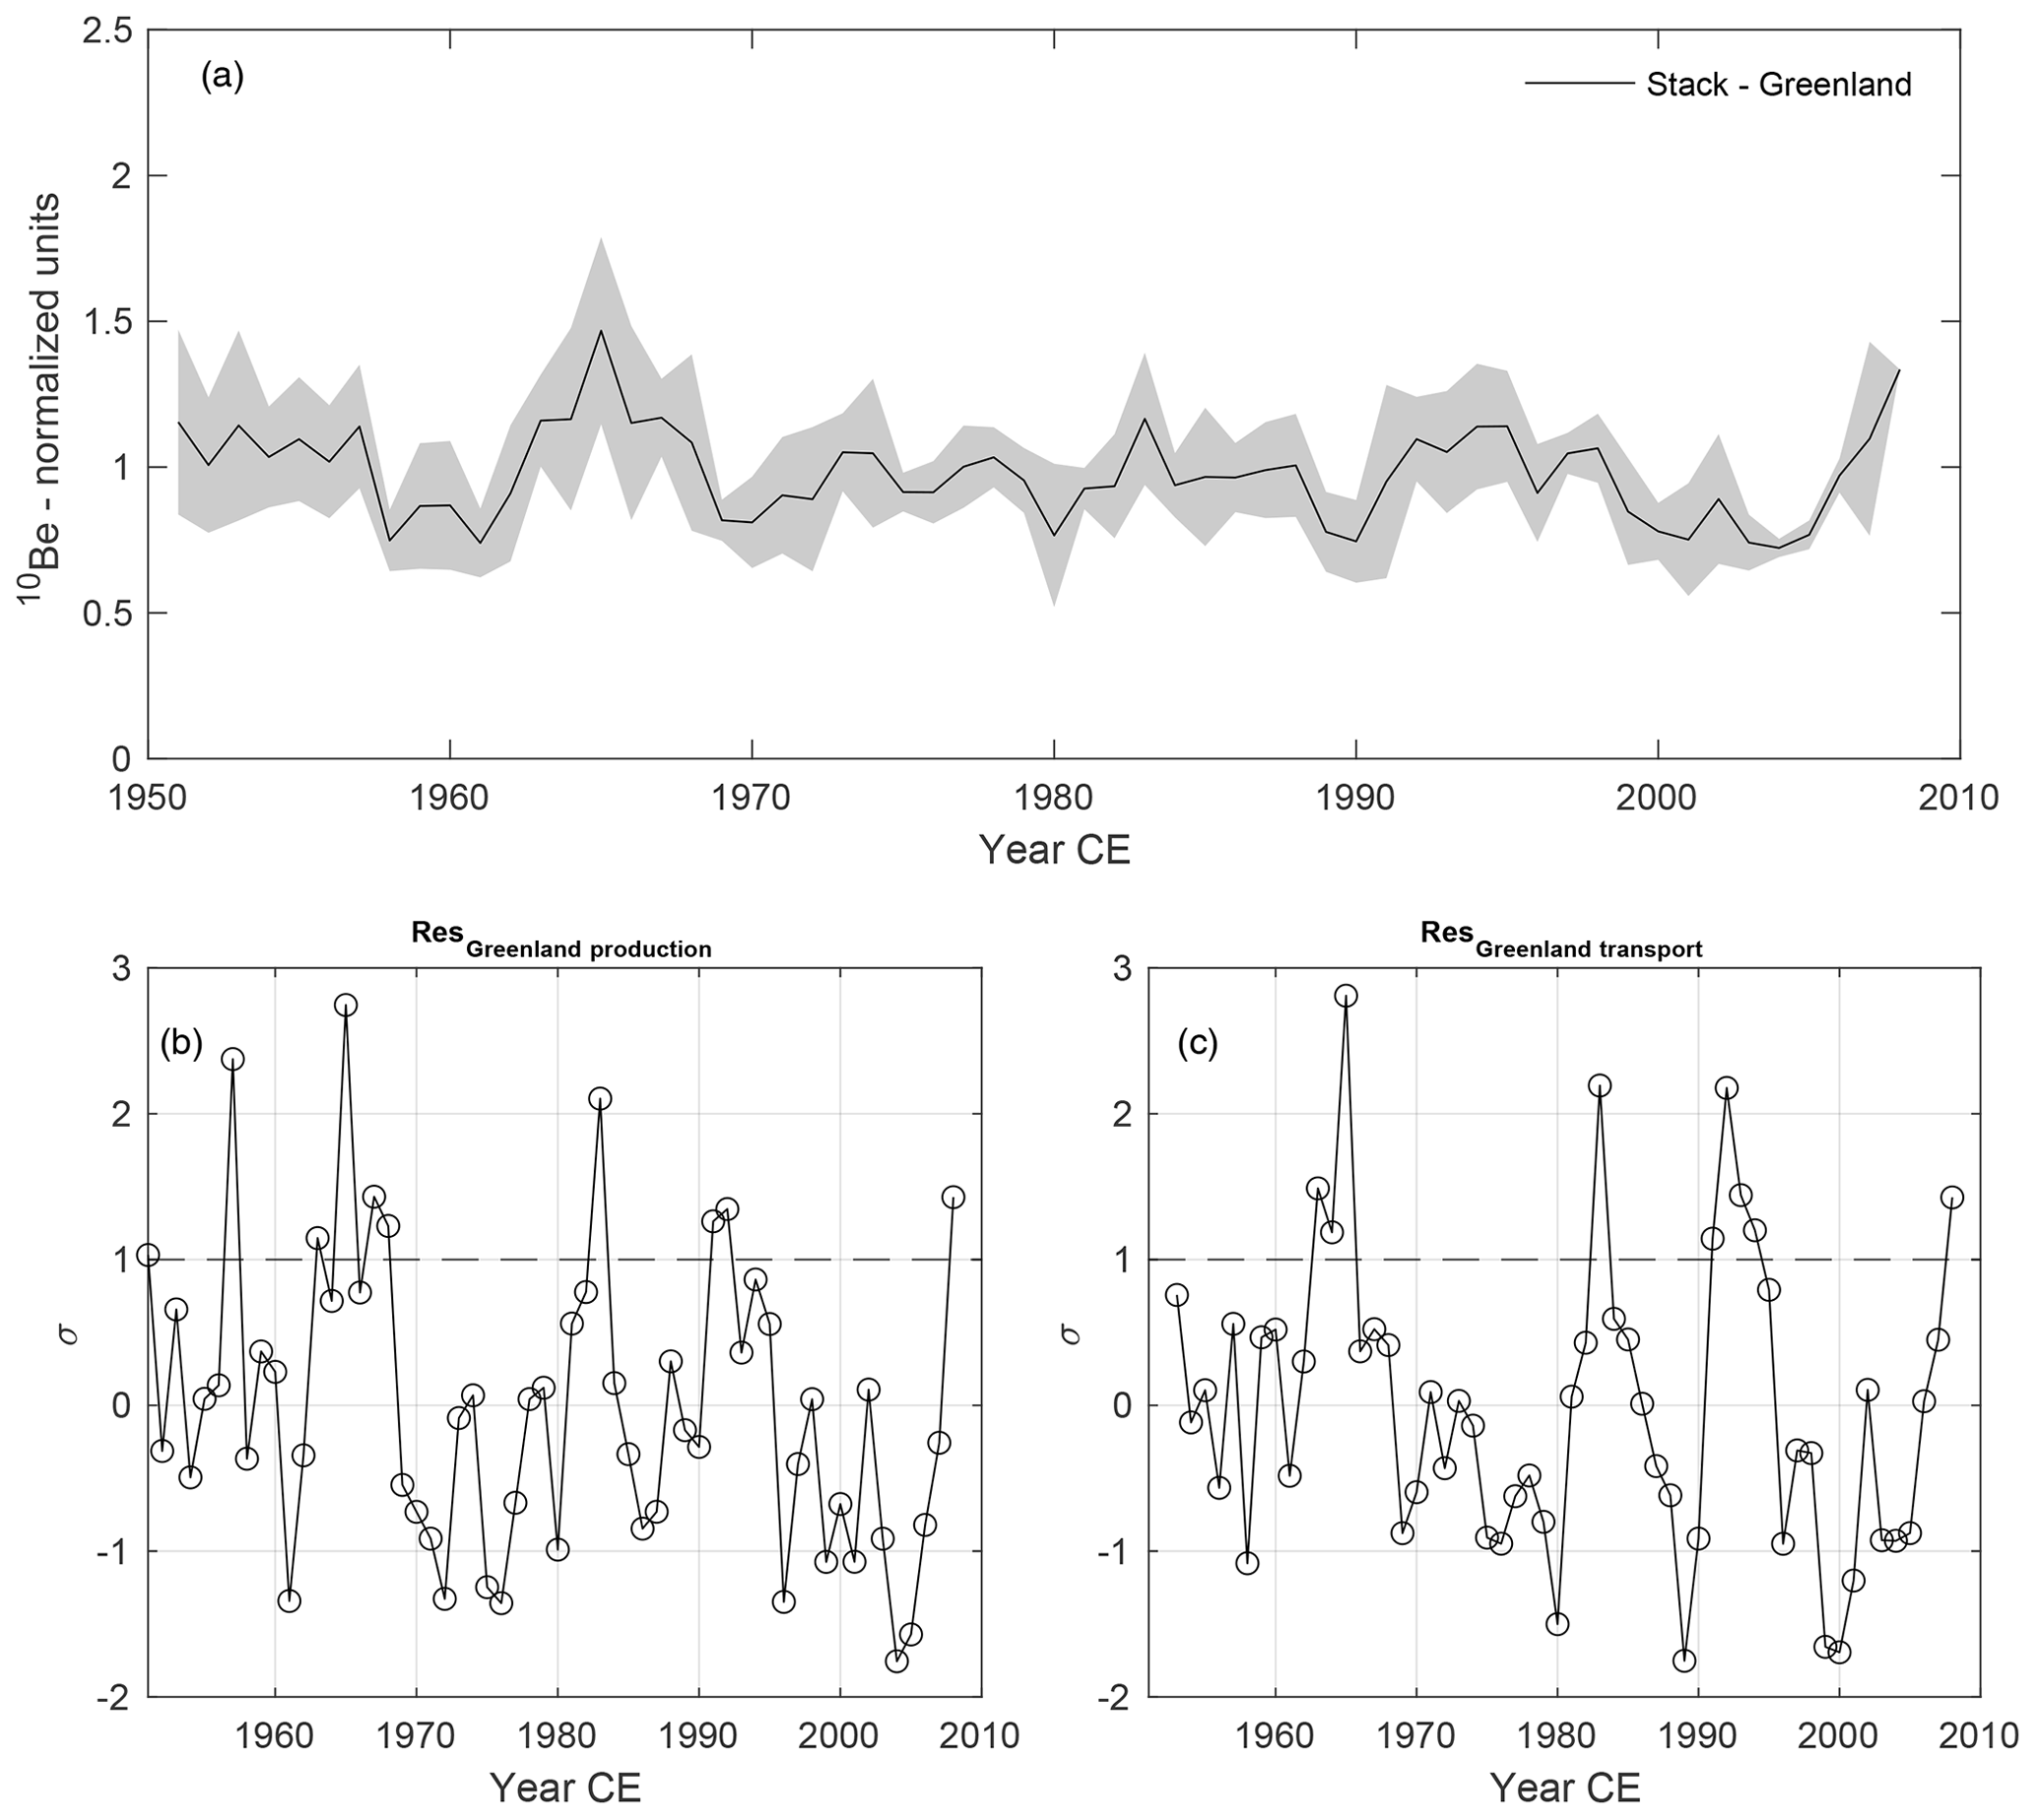
Figure 7Standard scores for the difference between the Greenland 10Be stack and the theoretical GCR-induced production rate. The stack (a) was calculated using the normalized 10Be records from Dye 3, NGRIP, NEEM, Das2, Renland, and EGRIP S6 (CFA and discrete) since 1951. Panel (b) shows the standardized residuals obtained by subtracting the modeled 10Be global production rate from the stack. Panel (c) shows the same as panel (b) but using the normalized 10Be deposition flux modeled (taking transport into account) over latitudes 60–90∘ N (Mekhaldi et al., 2021).
The standard scores are above −2σ, in agreement with the results from the EGRIP S6 records. The years in which the standard scores exceed 1σ are summarized in Table 1. We find an increase of 16 % in 10Be concentrations in year 1957 relative to the baseline (average 10Be concentration over solar cycle 19). However, the increase in 10Be concentrations is coeval, with a peak detected in the NEEM sulfate record (Sigl et al., 2013). Therefore, the presence of a 10Be increase in ice cores from Antarctica would lend support to the possible contribution of GLE no. 05 to the 10Be deposited in Greenland and Antarctica in 1957. We carried out the same analysis on the stack calculated from the Antarctic records. We subtracted the normalized global 10Be production rate from the stack of DSS, DML, Concordia, and Vostok normalized 10Be records and calculated the standard scores. The stack and standard scores of the residuals are shown in Fig. 8.
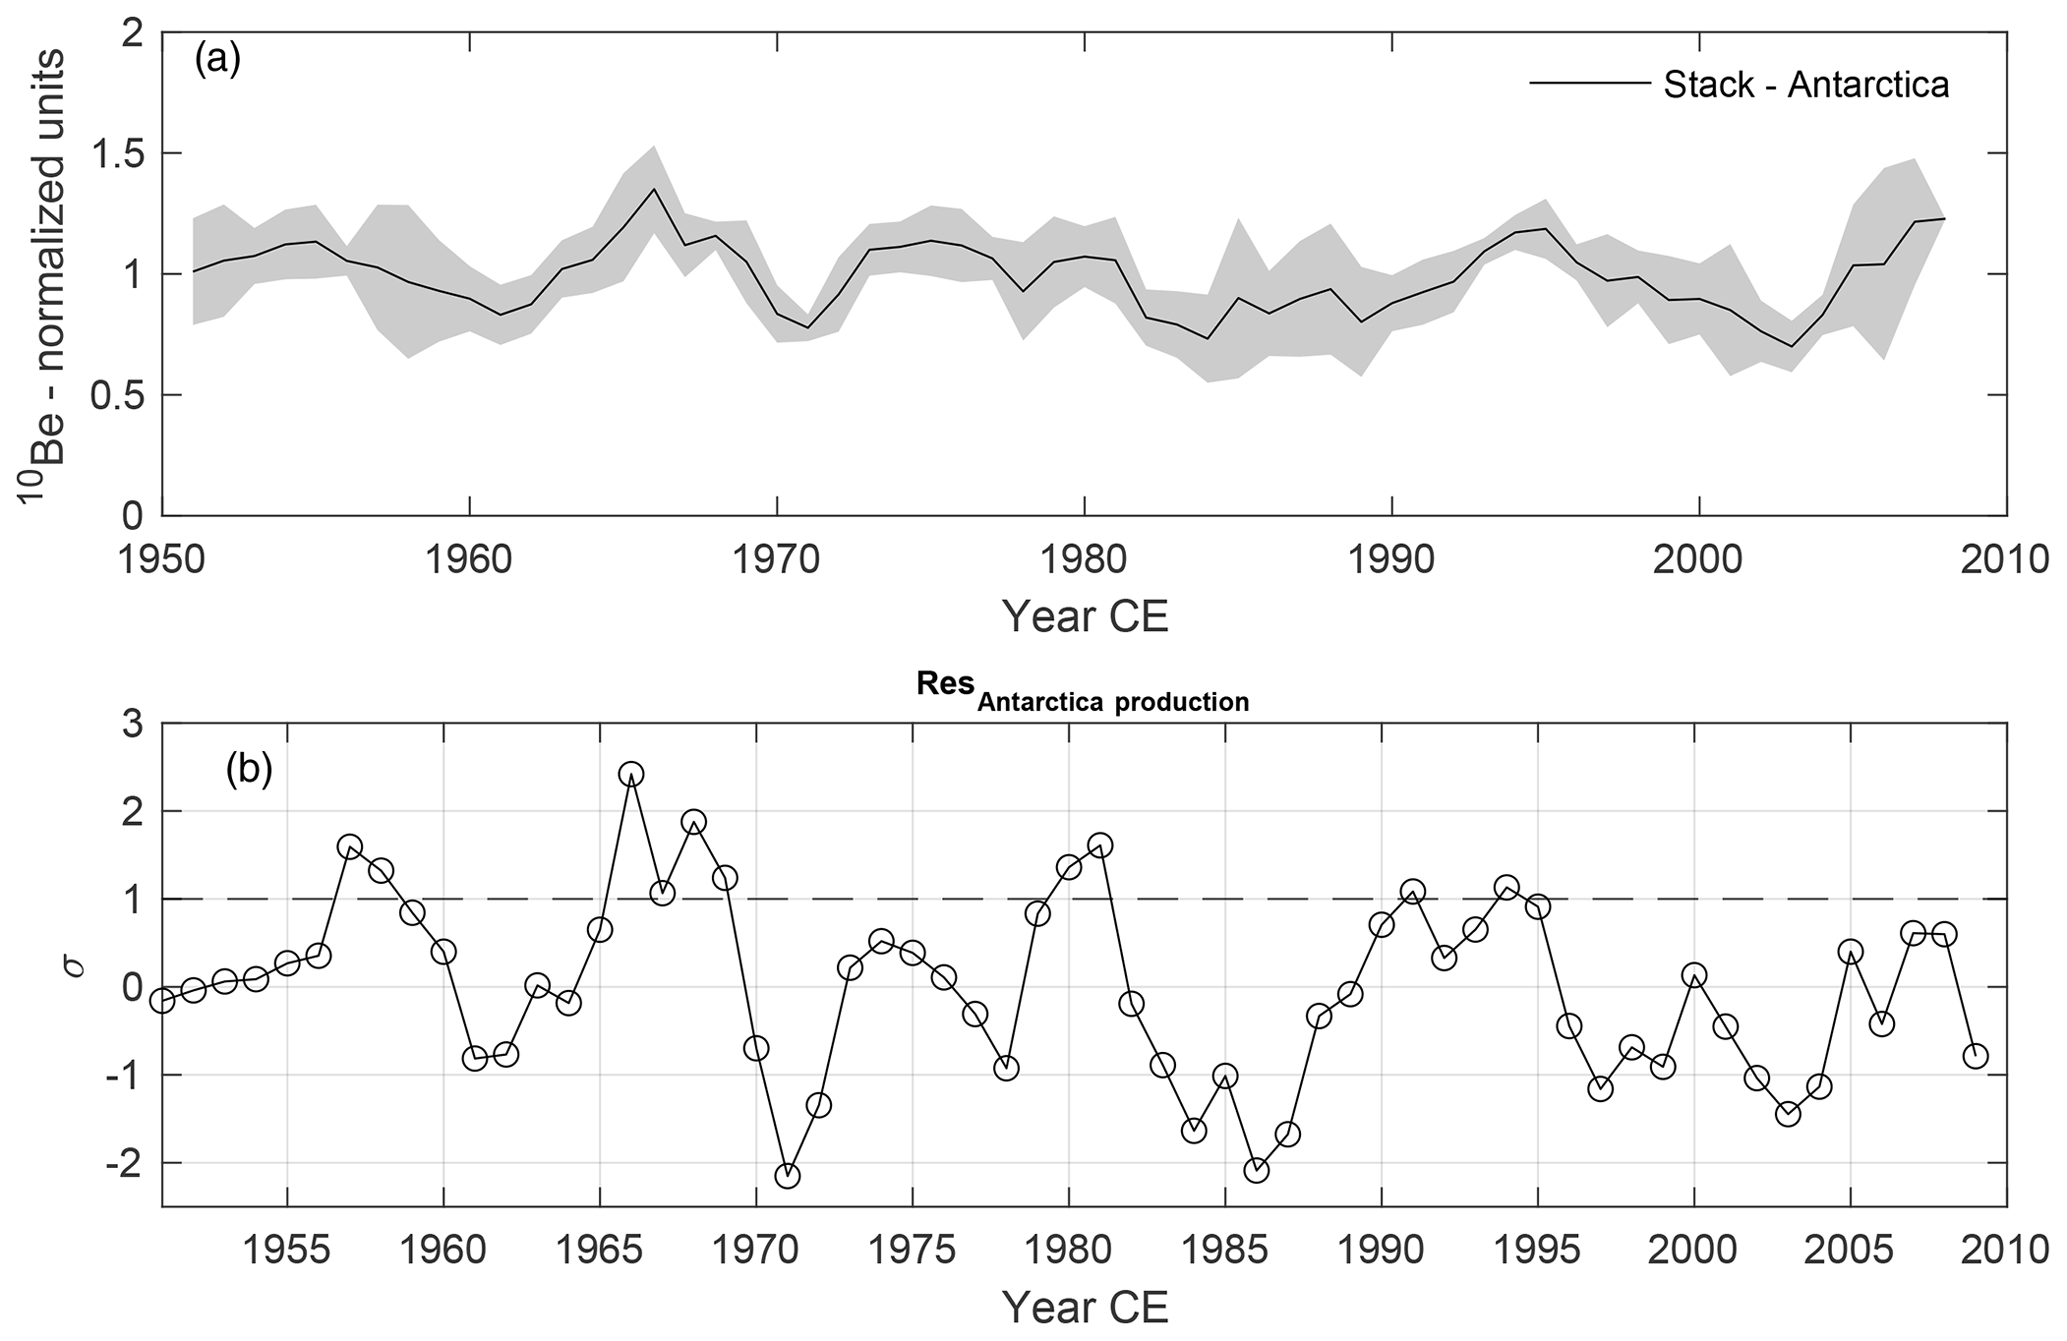
Figure 8Standard scores for the Antarctic stack. The stack (a) was calculated using the normalized 10Be records from Vostok, DML, Concordia, and DSS from 1951. The standard scores were calculated on the residuals obtained by subtracting the normalized modeled 10Be global production rate from the stack (b).
The results of the analysis are summarized in Table 1. The increase in 1994 can be linked to a possible volcanic influence on the 10Be transport and/or deposition (Baroni et al., 2011). We do not find any evidence of the influence of the El Chichón eruption in the Antarctic stack, although the eruption left an imprint in some Antarctic sulfate records (Sigl et al., 2015). We find an increase relative to the baseline of 4.3 % in 1957, which is lower than the increase modeled by Mekhaldi et al. (2021) and the increase recorded in the stack of records from Greenland.
To assess the suitability of CFA meltwater samples to reconstruct solar activity, we investigate the presence of the 11-year solar cycle in the data. The wiggles of the 11-year solar cycles are estimated to cause a variability of about ±15 % to ±35 % in the 10Be records from Greenland and Antarctica (e.g., Baroni et al., 2011; Heikkilä et al., 2009; Mekhaldi et al., 2021; Paleari et al., 2022). To investigate the presence of the 11-year cycle in the data, we performed continuous wavelet transform (Grinsted et al., 2004) on the 10Be records from CFA and discrete samples and on the global 10Be stack, calculated using the records from NGRIP, NEEM, Dye 3, Renland, Das2, DML, DSS, Vostok, and Concordia. The continuous wavelet power spectrums are shown in Fig. 9.
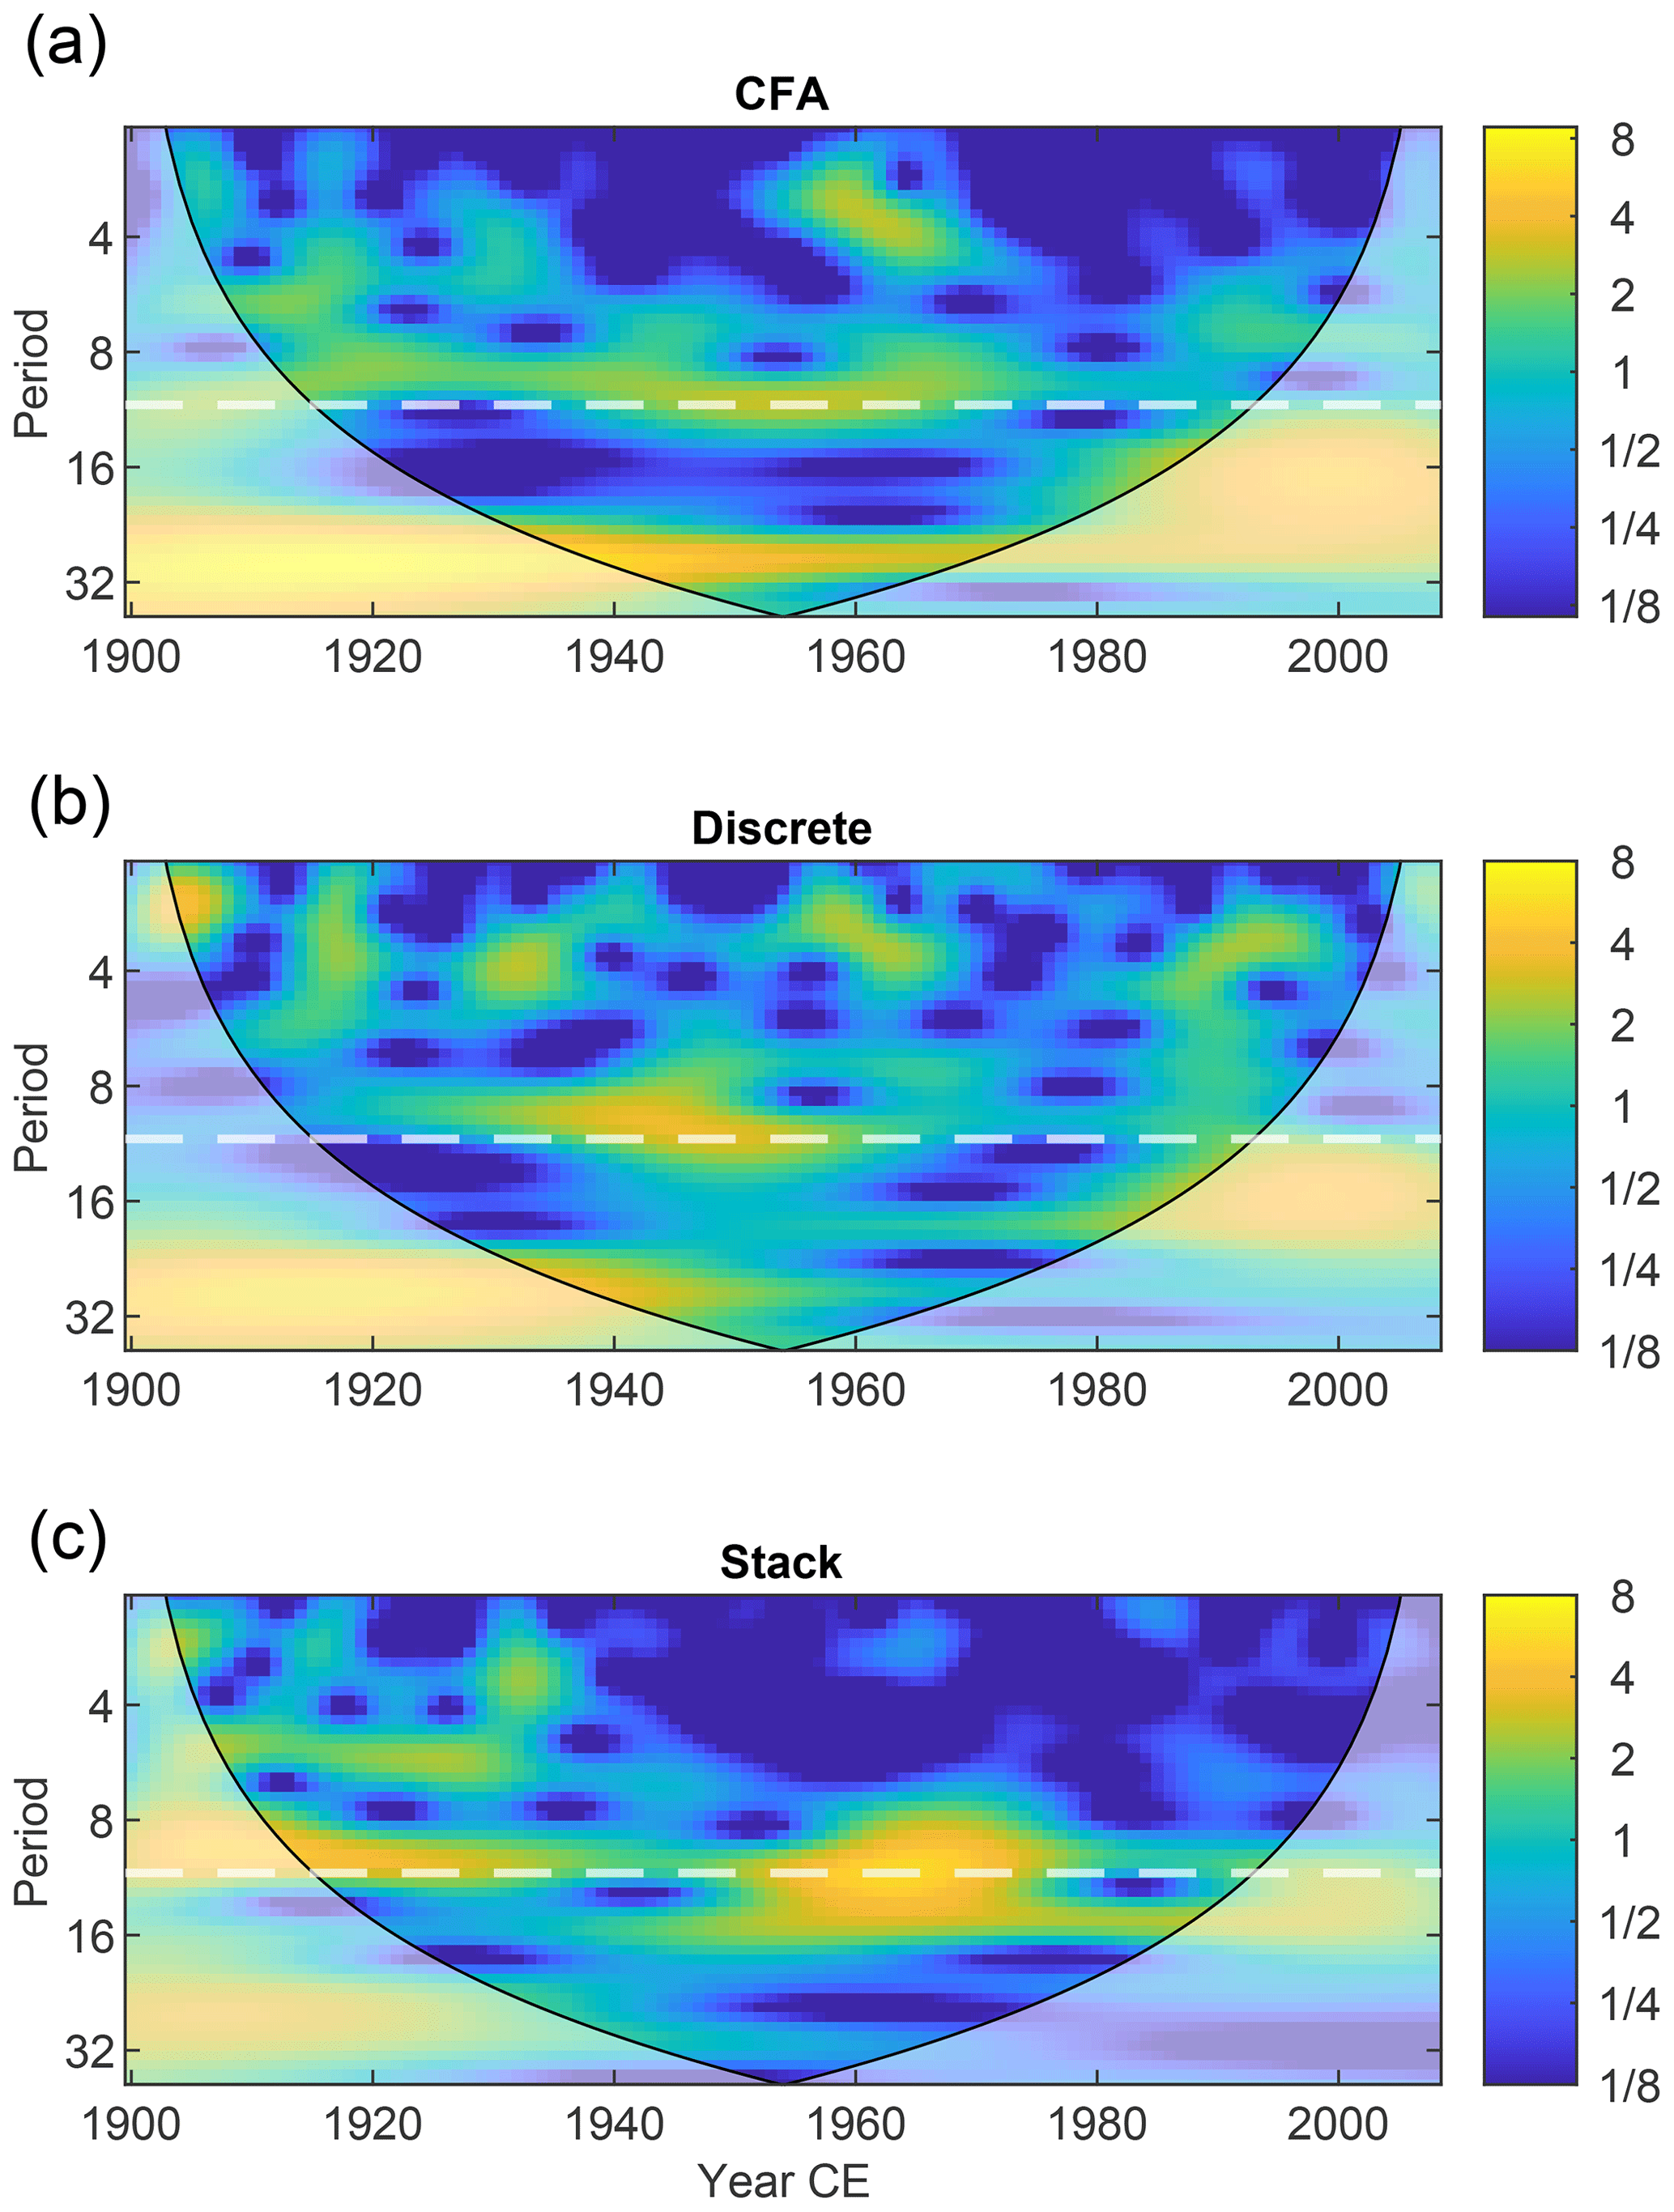
Figure 9Continuous wavelet power spectrum (Grinsted et al., 2004) of the 10Be concentration records from CFA samples (a) and discrete samples (b) from EGRIP S6 and of the global stack (c), calculated including the records from NGRIP, NEEM, Dye 3, Renland, Das2, DML, DSS, Vostok, and Concordia. The dashed white line denotes the frequency of the 11-year cycle.
Figure 9 shows that the 11-year solar cycle is present in the EGRIP S6 records. In particular, the figure highlights that the 11-year solar cycle is preserved in the CFA and discrete records spanning the period 1900–1960, especially so in the CFA record. Conversely, it is not observed in the more recent part of the record, likely due to higher background noise. As expected from the increased signal-to-noise ratio, Fig. 9 also confirms that the 11-year cycle is well preserved throughout the global stack. Moreover, Fig. 9 highlights that the discrete 10Be record is characterized by more prominence of higher-frequency noise (period < 4 years), as opposed to the CFA 10Be record, likely due to the smoothing caused by analytical issues inherent to the CFA system (Erhardt et al., 2022; Kaufmann et al., 2008; Mekhaldi et al., 2017; Sigg et al., 1994).
There also exists a 22-year cycle, whereby the Sun reverses polarity after every 11-year cycle. This is evidenced in neutron monitor measurements that show that the GCR flux at Earth has a polarity-dependent shape. More specifically, 11-year cycles take the form of a peak under negative polarity and the form of a plateau under positive polarity (e.g., Poopakun et al., 2022; Lockwood et al., 2001). Bearing this difference in mind, we separate our analysis between periods characterized by negative and positive polarity (Fig. 10a and b, respectively). Because we are now interested in the shape of the cycles, as seen in neutron monitor data that are anticorrelated with solar activity, we now consider solar maxima as the onset of solar cycles to investigate the peak shape in the radionuclide data. The 10Be records from Greenland (except EGRIP S6) and Antarctica were split into time windows for each period and normalized to their respective mean and therefore used to create a global stack (blue line). The blue envelopes denote the standard deviation of the records. The stacks obtained from the modeled 10Be production rate from Mekhaldi et al. (2021) are shown as a dashed line for comparison. The global stack is compared to the CFA stack (magenta) and discrete firn samples stack (green) from EGRIP S6.
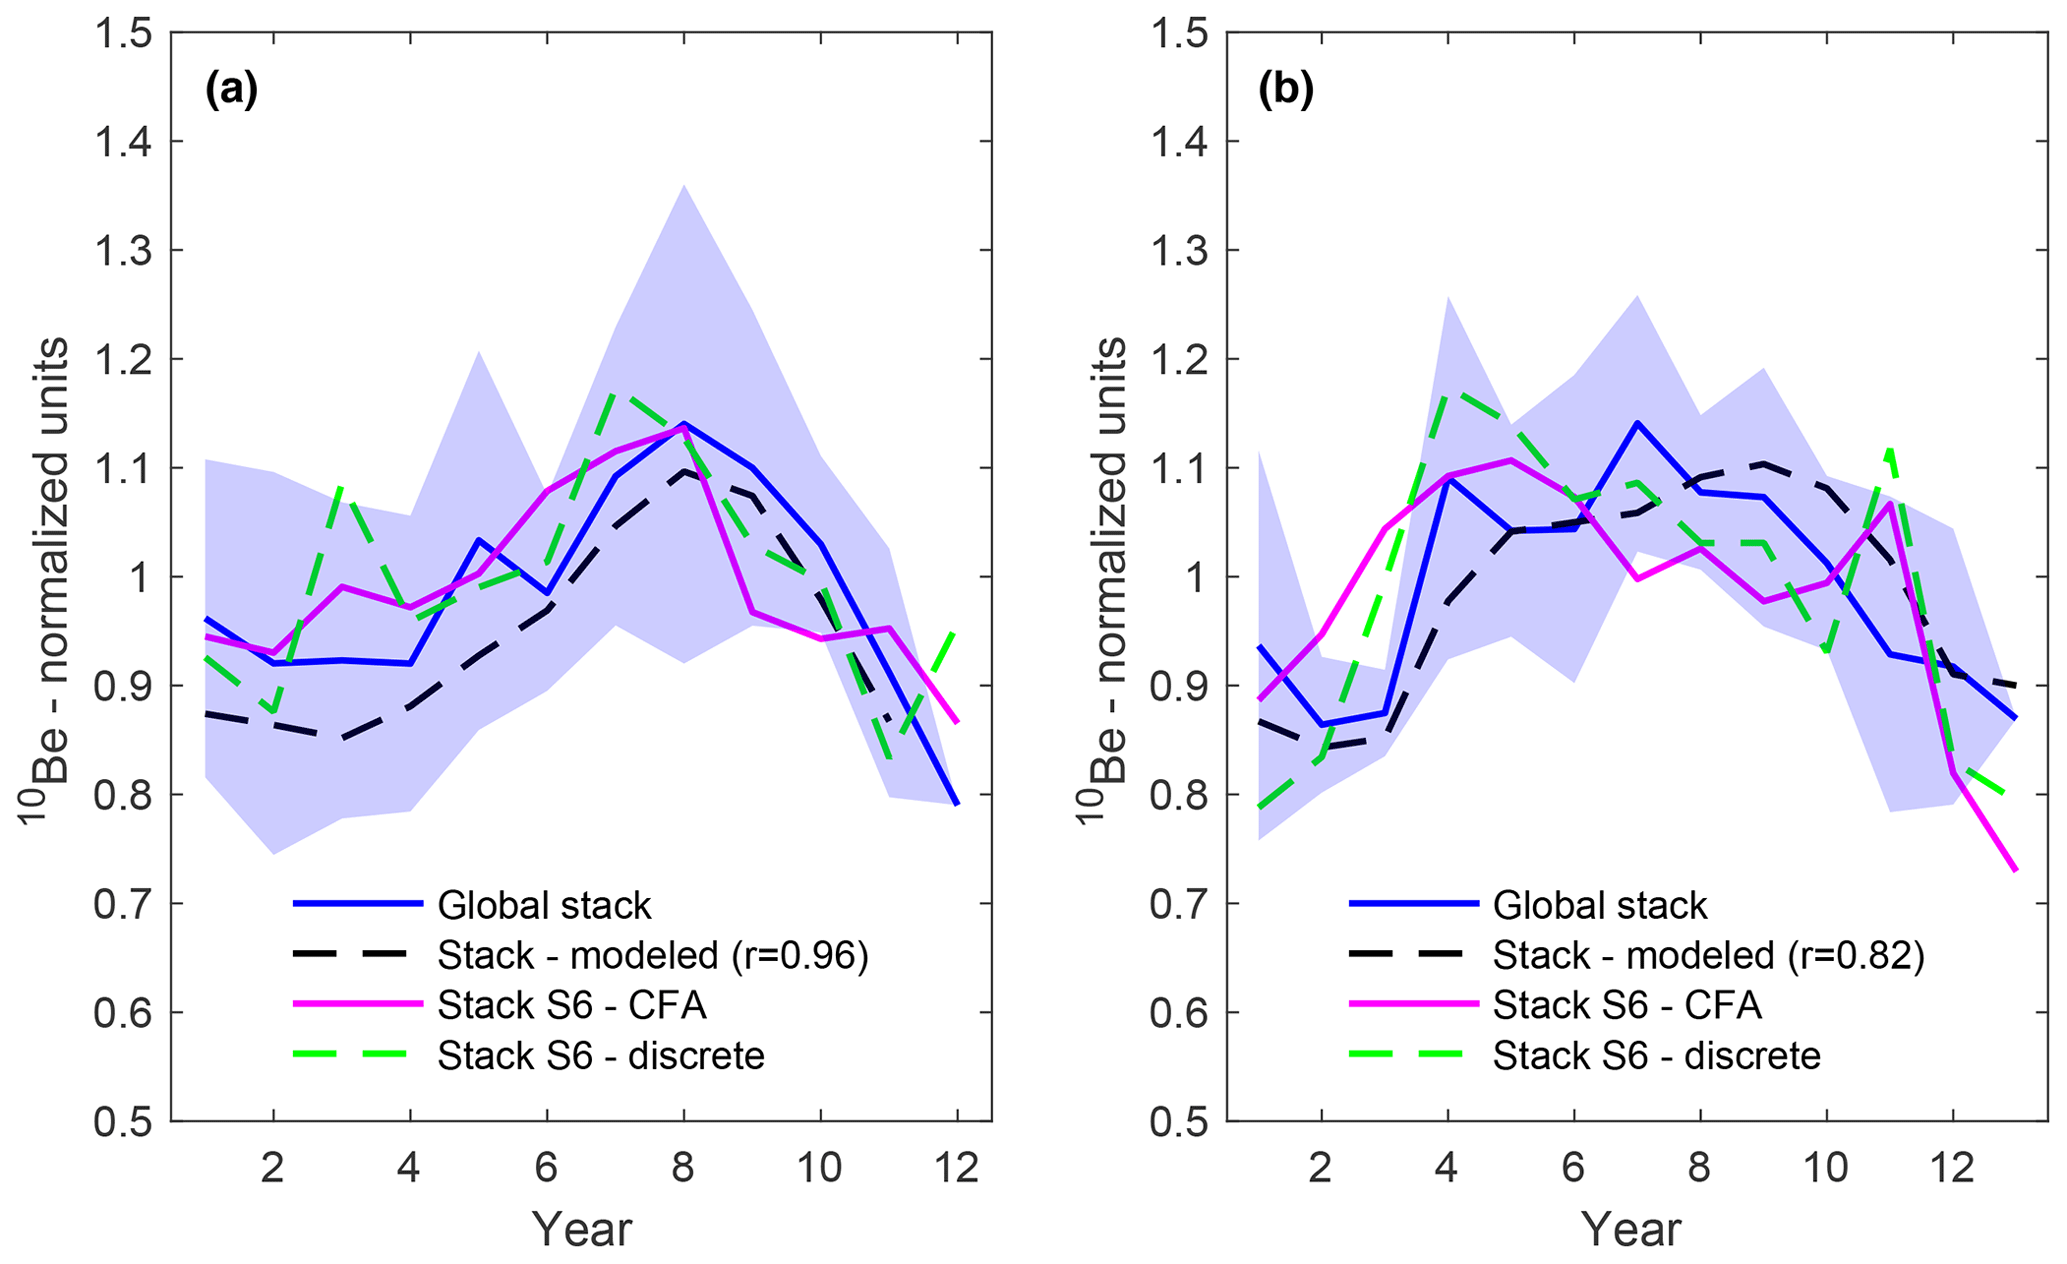
Figure 10Panel (a) shows the global stack of the periods of negative polarity of the Sun's magnetic field, as indicated by neutron monitors (in blue; the blue envelope represents the standard deviation). The stacks from CFA and discrete samples from EGRIP S6 are shown as a solid magenta line and a dashed green line, respectively. The global stack includes the 10Be records from NEEM, NGRIP, Dye 3, Das2, Renland, DSS, Vostok, DML, and Concordia cores. The stacks are compared to the modeled global annual production rate (Mekhaldi et al., 2021; dashed black line; the correlation coefficient with the global stack (p<0.01) is denoted in the legend). Panel (b) shows the same for periods of positive polarity.
The global and modeled stacks agree very well in both shape and amplitude for both periods of negative (Fig. 10a) and positive (Fig. 10b) polarity. Similarly, the stacks from discrete and CFA samples agree very well (r=0.74 for negative polarity (Fig. 10a) and r=0.87 for positive polarity (Fig. 10b); p<0.01), although the S6 CFA stacks are smoother than the discrete stacks. However, CFA and discrete stacks agree well, showing that the two records show a very similar signal. This result is promising, as it shows the suitability of CFA samples for solar activity reconstructions.
In this study, we present the 10Be record obtained from excess water from CFA measurements of the EGRIP S6 firn core. The record, spanning from 1900 to 2008, has been compared to another 10Be record obtained from discrete firn samples from the same core. Although some smoothing due to analytical issues inherent to the CFA system may be present in the shallower part of the core, the CFA 10Be record agrees well with the 10Be record from discrete firn samples and with other 10Be records from Greenland.
By subtracting the global 10Be production rate variability caused by the 11-year solar cycle, we investigate the possible causes of excursions in the EGRIP S6 10Be records and in the stacks of Greenlandic and Antarctic records. We find that values exceeding 1σ in the standardized residuals are coeval with the timing of some of the major volcanic eruptions that are also detected in sulfate records (Zielinski et al., 1997; Sigl et a., 2015), such as the Agung (1963) and Pinatubo (1991) eruptions. Moreover, values exceeding 1σ in the residuals in 1957 may be consistent with the occurrence of GLE no. 05. However, an increase in sulfate concentrations was detected in records from Greenland, according to Sigl et al. (2013), illustrating the challenges to separate the causes for small radionuclide excursions. We find an increase of 16 % in the stack from Greenland and in 4.3 % the stack from Antarctica in 1957. This study shows that, presently, volcanic eruptions and GLEs influences cannot be unambiguously distinguished from the internal variability in annually resolved 10Be records, in agreement with previous studies (e.g., Pedro et al., 2012; Mekhaldi et al., 2021).
Finally, we analyzed how the 11-year solar cycles are preserved in the discussed records. Our results show that the 11-year solar cycles are well preserved in CFA and discrete 10Be records from EGRIP S6. By stacking periods of different polarity of the Sun's magnetic field separately, it is possible to see their different shape in 10Be data, as expected according to the flux of the GCRs at Earth. The stacks from CFA 10Be samples agree well with the stacks from discrete 10Be samples from EGRIP S6, thus showing that CFA excess water samples are suitable for the reconstruction of solar activity. These results open the possibility of collecting continuous and high-resolution 10Be records with a more time-efficient sampling and preparation, while saving an important portion of valuable ice for other measurements.
The 10Be data generated in this study are provided in the Supplement.
The supplement related to this article is available online at: https://doi.org/10.5194/cp-19-2409-2023-supplement.
RM and CIP designed the project. CIP sampled and prepared the EGRIP CFA 10Be samples, performed the analysis, and wrote the paper. FM contributed to the interpretation of the data. MC contributed with the measurement of 10Be samples. TE helped with the collection of the EGRIP CFA samples and the interpretation of the data. MH helped with the sampling of the EGRIP S6 core. All authors contributed to the discussion.
The contact author has declared that none of the authors has any competing interests.
Publisher's note: Copernicus Publications remains neutral with regard to jurisdictional claims made in the text, published maps, institutional affiliations, or any other geographical representation in this paper. While Copernicus Publications makes every effort to include appropriate place names, the final responsibility lies with the authors.
This article is part of the special issue “Ice core science at the three poles (CP/TC inter-journal SI)”. It is a result of the IPICS 3rd Open Science Conference, Crans-Montana, Switzerland, 2–7 October 2022.
This project has been funded by a grant from the Royal Physiographic Society of Lund (to Chiara I. Paleari), the Swedish Research Council (grant nos. DNR2013-8421 and DNR2018-05469 to Raimund Muscheler). Florian Mekhaldi acknowledges funding from the Swedish Research Council (grant no. 2020-00420). Florian Adolphi acknowledges funding by the Helmholtz Association (grant no. VH-NG-1501). Tobias Erhardt acknowledges the long-term support of ice core research at the University of Bern by the Swiss National Science Foundation (SNSF) and the Oeschger Center for Climate Change Research. Minjie Zheng has been supported by the Swedish Research Council (grant no. 2021-06649). The EGRIP CFA campaign was organized and directed by the Continuous Flow Analysis Group at the Climate and Environmental Physics Group by Tobias Erhardt and Camilla Jensen, with support by the EGRIP project. EGRIP is directed and organized by the Centre for Ice and Climate at the Niels Bohr Institute, University of Copenhagen. It is supported by funding agencies and institutions in Denmark (A. P. Møller Foundation, University of Copenhagen), USA (U.S. National Science Foundation, Office of Polar Programs), Germany (Alfred Wegener Institute, Helmholtz Centre for Polar and Marine Research), Japan (National Institute of Polar Research and Arctic Challenge for Sustainability), Norway (University of Bergen and Trond Mohn Foundation), Switzerland (Swiss National Science Foundation), France (French Polar Institute Paul-Emile Victor, Institute for Geosciences and Environmental research), Canada (University of Manitoba), and China (Chinese Academy of Sciences and Beijing Normal University).
This research has been supported by the Kungliga Fysiografiska Sällskapet i Lund and the Vetenskapsrådet (grant no. DNR2018-05469).
This paper was edited by Mathieu Casado and reviewed by three anonymous referees.
Aldahan, A., Possnert, G., Johnsen, S. J., Clausen, H. B., Isaksson, E., Karlen, W., and Hansson, M.: Sixty year 10Be record from Greenland and Antarctica, Proc. Indian Acad. Sci. Earth Planet. Sci., 107, 139–147, https://doi.org/10.1007/bf02840464, 1998.
Baroni, M., Bard, E., Petit, J. R., Magand, O., and Bourlès, D.: Volcanic and solar activity, and atmospheric circulation influences on cosmogenic 10Be fallout at Vostok and Concordia (Antarctica) over the last 60 years, Geochim. Cosmochim. Ac., 75, 7132–7145, https://doi.org/10.1016/j.gca.2011.09.002, 2011.
Baroni, M., Bard, E., Petit, J. R., and Viseur, S.: Persistent Draining of the Stratospheric 10Be Reservoir After the Samalas Volcanic Eruption (1257 CE), J. Geophys. Res.-Atmos., 124, 7082–7097, https://doi.org/10.1029/2018JD029823, 2019.
Beer, J., Blinov, A., Bonani, G., Finkel, R. C., Hofmann, H. J., Lehmann, B., Oeschger, H., Sigg, A., Schwander, J., Staffelbach, T., Stauffer, B., Suter, M., and Wötfli, W.: Use of 10Be in polar ice to trace the 11-year cycle of solar activity, Nature, 347, 164–166, https://doi.org/10.1038/347164a0, 1990.
Berggren, A. M., Beer, J., Possnert, G., Aldahan, A., Kubik, P., Christl, M., Johnsen, S. J., Abreu, J., and Vinther, B. M.: A 600-year annual 10Be record from the NGRIP ice core, Greenland, Geophys. Res. Lett., 36, 1–5, https://doi.org/10.1029/2009GL038004, 2009.
Christl, M., Vockenhuber, C., Kubik, P. W., Wacker, L., Lachner, J., Alfimov, V., and Synal, H. A.: The ETH Zurich AMS facilities: Performance parameters and reference materials, Nucl. Instrum. Meth. Phys. Res. Sect. B, 294, 29–38, https://doi.org/10.1016/j.nimb.2012.03.004, 2013.
Erhardt, T., Jensen, C. M., Borovinskaya, O., and Fischer, H.: Single Particle Characterization and Total Elemental Concentration Measurements in Polar Ice Using Continuous Flow Analysis-Inductively Coupled Plasma Time-of-Flight Mass Spectrometry, Environ. Sci. Technol., 53, 13275–13283, https://doi.org/10.1021/acs.est.9b03886, 2019.
Erhardt, T., Bigler, M., Federer, U., Gfeller, G., Leuenberger, D., Stowasser, O., Röthlisberger, R., Schüpbach, S., Ruth, U., Twarloh, B., Wegner, A., Goto-Azuma, K., Kuramoto, T., Kjær, H. A., Vallelonga, P. T., Siggaard-Andersen, M.-L., Hansson, M. E., Benton, A. K., Fleet, L. G., Mulvaney, R., Thomas, E. R., Abram, N., Stocker, T. F., and Fischer, H.: High-resolution aerosol concentration data from the Greenland NorthGRIP and NEEM deep ice cores, Earth Syst. Sci. Data, 14, 1215–1231, https://doi.org/10.5194/essd-14-1215-2022, 2022.
Grinsted, A., Moore, J. C., and Jevrejeva, S.: Application of the cross wavelet transform and wavelet coherence to geophysical time series A, Nonlin. Processes Geophys., 11, 515–533, https://doi.org/10.5194/npg-11-515-2004, 2004.
Heikkilä, U. and Smith, A. M.: Production rate and climate influences on the variability of 10Be deposition simulated by ECHAM5-HAM: Globally, in Greenland, and in Antarctica, J. Geophys. Res.-Atmos., 118, 2506–2520, https://doi.org/10.1002/jgrd.50217, 2013.
Heikkilä, U., Beer, J., and Feichter, J.: Modeling cosmogenic radionuclides 10Be and 7Be during the maunder minimum using the ECHAM5-HAM general circulation Model, Atmos. Chem. Phys., 8, 2797–2809, https://doi.org/10.5194/acp-8-2797-2008, 2008.
Heikkilä, U., Beer, J., and Feichter, J.: Meridional transport and deposition of atmospheric 10Be, Atmos. Chem. Phys., 9, 515–527, https://doi.org/10.5194/acp-9-515-2009, 2009.
Heikkilä, U., Beer, J., Abreu, J. A., and Steinhilber, F.: On the atmospheric transport and deposition of the cosmogenic radionuclides (10Be): A review, Space Sci. Rev., 176, 321–332, https://doi.org/10.1007/s11214-011-9838-0, 2013.
Igarashi, Y., Hirose, K., and Otsuji-Hatori, M.: Beryllium-7 Deposition and Its Relation to Sulfate Deposition, J. Atmos. Chem., 29, 217–231, https://doi.org/10.1023/A:1005921113496, 1998.
Kaufmann, P. R., Federer, U., Hutterli, M. A., Bigler, M., Schüpbach, S., Ruth, U., Schmitt, J., and Stocker, T. F.: An improved continuous flow analysis system for high-resolution field measurements on ice cores, Environ. Sci. Technol., 42, 8044–8050, https://doi.org/10.1021/es8007722, 2008.
Lockwood, J. A., Webber, W. R., and Debrunner, H.: Differences in the maximum intensities and the intensity-time profiles of cosmic rays in alternate solar magnetic field polarities, J. Geophys. Res.-Space, 106, 10635–10644, https://doi.org/10.1029/2000ja000307, 2001.
Masarik, J. and Beer, J.: Simulation of particle fluxes and cosmogenic nuclide production in the Earth's atmosphere, J. Geophys. Res.-Atmos., 104, 12099–12111, https://doi.org/10.1029/1998JD200091, 1999.
McCracken, K. G.: Geomagnetic and atmospheric effects upon the cosmogenic 10Be observed in polar ice, J. Geophys. Res.-Space, 109, 1–17, https://doi.org/10.1029/2003JA010060, 2004.
Mekhaldi, F., Muscheler, R., Adolphi, F., Aldahan, A., Beer, J., McConnell, J. R., Possnert, G., Sigl, M., Svensson, A., Synal, H. A., Welten, K. C., and Woodruff, T. E.: Multiradionuclide evidence for the solar origin of the cosmic-ray events of and , Nat. Commun., 6, 1–8, https://doi.org/10.1038/ncomms9611, 2015.
Mekhaldi, F., McConnell, J. R., Adolphi, F., Arienzo, M. M., Chellman, N. J., Maselli, O. J., Moy, A. D., Plummer, C. T., Sigl, M., and Muscheler, R.: No Coincident Nitrate Enhancement Events in Polar Ice Cores Following the Largest Known Solar Storms, J. Geophys. Res.-Atmos., 122, 11900–11913, https://doi.org/10.1002/2017JD027325, 2017.
Mekhaldi, F., Adolphi, F., Herbst, K., and Muscheler, R.: The Signal of Solar Storms Embedded in Cosmogenic Radionuclides: Detectability and Uncertainties, J. Geophys. Res.-Space, 126, e2021JA029351, https://doi.org/10.1029/2021ja029351, 2021.
Miyake, F., Suzuki, A., Masuda, K., Horiuchi, K., Motoyama, H., Matsuzaki, H., Motizuki, Y., Takahashi, K., and Nakai, Y.: The AD 775 cosmic ray event shown in beryllium-10 data from Antarctic Dome Fuji ice core, Proc. Sci., 42, 84–89, https://doi.org/10.22323/1.236.0110, 2015.
Miyake, F., Horiuchi, K., Motizuki, Y., Nakai, Y., Takahashi, K., Masuda, K., Motoyama, H., and Matsuzaki, H.: 10Be Signature of the Cosmic Ray Event in the 10th Century CE in Both Hemispheres, as Confirmed by Quasi-Annual 10Be Data From the Antarctic Dome Fuji Ice Core, Geophys. Res. Lett., 46, 11–18, https://doi.org/10.1029/2018GL080475, 2019.
Mojtabavi, S., Wilhelms, F., Cook, E., Davies, S. M., Sinnl, G., Skov Jensen, M., Dahl-Jensen, D., Svensson, A., Vinther, B. M., Kipfstuhl, S., Jones, G., Karlsson, N. B., Henrique Faria, S., Gkinis, V., Astrid Kjær, H., Erhardt, T., Berben, S. M. P., Nisancioglu, K. H., Koldtoft, I., and Olander Rasmussen, S.: A first chronology for the East Greenland Ice-core Project (EGRIP) over the Holocene and last glacial termination, Clim. Past, 16, 2359–2380, https://doi.org/10.5194/cp-16-2359-2020, 2020.
Muscheler, R., Beer, J., Kubik, P. W., and Synal, H. A.: Geomagnetic field intensity during the last 60,000 years based on 10Be and 36Cl from the Summit ice cores and 14C, Quaternary Sci. Rev., 24, 1849–1860, https://doi.org/10.1016/j.quascirev.2005.01.012, 2005.
Muscheler, R., Joos, F., Beer, J., Müller, S. A., Vonmoos, M., and Snowball, I.: Solar activity during the last 1000 yr inferred from radionuclide records, Quaternary Sci. Rev., 26, 82–97, https://doi.org/10.1016/j.quascirev.2006.07.012, 2007.
Nguyen, L., Paleari, C. I., Müller, S., Christl, M., Mekhaldi, F., Gautschi, P., Mulvaney, R., Rix, J., and Muscheler, R.: The potential for a continuous 10Be record measured on ice chips from a borehole, Result. Geochem., 5, 100012, https://doi.org/10.1016/j.ringeo.2021.100012, 2021.
O'Hare, P., Mekhaldi, F., Adolphi, F., Raisbeck, G., Aldahan, A., Anderberg, E., Beer, J., Christl, M., Fahrni, S., Synal, H.-A., Park, J., Possnert, G., Southon, J., Bard, E., and Muscheler, R.: Multiradionuclide evidence for an extreme solar proton event around 2,610 B.P. (∼660 BC), P. Natl. Acad. Sci. USA, 116, 201815725, https://doi.org/10.1073/pnas.1815725116, 2019.
Paleari, C. I., Mekhaldi, F., Adolphi, F., Christl, M., Vockenhuber, C., Gautschi, P., Beer, J., Brehm, N., Erhardt, T., Synal, H., Wacker, L., Wilhelms, F., and Muscheler, R.: Cosmogenic radionuclides reveal an extreme solar particle storm near a solar minimum 9125 years BP, Nat. Commun., 13, 214, https://doi.org/10.1038/s41467-021-27891-4, 2022.
Pedro, J. B., Heikkilä, U. E., Klekociuk, A., Smith, A. M., Van Ommen, T. D., and Curran, M. A. J.: Beryllium-10 transport to Antarctica: Results from seasonally resolved observations and modeling, J. Geophys. Res.-Atmos., 116, 1–14, https://doi.org/10.1029/2011JD016530, 2011a.
Pedro, J. B., Smith, A. M., Simon, K. J., Van Ommen, T. D., and Curran, M. A. J.: High-resolution records of the beryllium-10 solar activity proxy in ice from Law Dome, East Antarctica: Measurement, reproducibility and principal trends, Clim. Past, 7, 707–721, https://doi.org/10.5194/cp-7-707-2011, 2011b.
Pedro, J. B., McConnell, J. R., van Ommen, T. D., Fink, D., Curran, M. A. J., Smith, A. M., Simon, K. J., Moy, A. D., and Das, S. B.: Solar and climate influences on ice core 10Be records from Antarctica and Greenland during the neutron monitor era, Earth Planet. Sc. Lett., 355–356, 174–186, https://doi.org/10.1016/j.epsl.2012.08.038, 2012.
Poopakun, K., Nuntiyakul, W., Ruffolo, D., Evenson, P., Peng, J., Chuanraksasat, P., Duldig, M. L., Humble, J. E., and Oh, S.: Solar Magnetic Polarity Effect on Neutron Monitor Count Rates from Latitude Surveys Versus Antarctic Stations, Proc. Sci., 395, 1268, https://doi.org/10.22323/1.395.1268, 2022.
Raisbeck, G. M., Yiou, F., Bourles, D., and Kent, D. V.: Evidence for an increase in cosmogenic 10Be during a geomagnetic reversal, Nature, 315, 315–317, https://doi.org/10.1038/315315a0, 1985.
Raisbeck, G. M., Yiou, F., Cattani, O., and Jouzel, J.: 10Be evidence for the Matuyama-Brunhes geomagnetic reversal in the EPICA Dome C ice core, Nature, 444, 82–84, https://doi.org/10.1038/nature05266, 2006.
Sigg, A., Fuhrer, K., Anklln, M., Staffelbach, T., and Zurmühle, D.: A Continuous Analysis Technique for Trace Species in Ice Cores, Environ. Sci. Technol., 28, 204–209, https://doi.org/10.1021/es00051a004, 1994.
Sigl, M., McConnell, J. R., Layman, L., Maselli, O., McGwire, K., Pasteris, D., Dahl-Jensen, D., Steffensen, J. P., Vinther, B., Edwards, R., Mulvaney, R., and Kipfstuhl, S.: A new bipolar ice core record of volcanism from WAIS Divide and NEEM and implications for climate forcing of the last 2000 years, J. Geophys. Res.-Atmos., 118, 1151–1169, https://doi.org/10.1029/2012JD018603, 2013.
Sigl, M., Winstrup, M., McConnell, J. R., Welten, K. C., Plunkett, G., Ludlow, F., Büntgen, U., Caffee, M., Chellman, N., Dahl-Jensen, D., Fischer, H., Kipfstuhl, S., Kostick, C., Maselli, O. J., Mekhaldi, F., Mulvaney, R., Muscheler, R., Pasteris, D. R., Pilcher, J. R., Salzer, M., Schüpbach, S., Steffensen, J. P., Vinther, B. M., and Woodruff, T. E.: Timing and climate forcing of volcanic eruptions for the past 2,500 years, Nature, 523, 543–549, https://doi.org/10.1038/nature14565, 2015.
Spiegl, T. C., Yoden, S., Langematz, U., Sato, T., Chhin, R., Noda, S., Miyake, F., Kusano, K., Schaar, K., and Kunze, M.: Modeling the Transport and Deposition of 10Be Produced by the Strongest Solar Proton Event During the Holocene, J. Geophys. Res.-Atmos., 127, e2021JD035658, https://doi.org/10.1029/2021JD035658, 2022.
Steinhilber, F., Abreu, J. A., Beer, J., Brunner, I., Christl, M., Fischer, H., Heikkilä, U., Kubik, P. W., Mann, M., McCracken, K. G., Miller, H., Miyahara, H., Oerter, H., and Wilhelms, F.: 9,400 Years of cosmic radiation and solar activity from ice cores and tree rings, P. Natl. Acad. Sci. USA, 109, 5967–5971, https://doi.org/10.1073/pnas.1118965109, 2012.
Stohl, A., Bonasoni, P., Cristofanelli, P., Collins, W., Feichter, J., Frank, A., Forster, C., Gerasopoulos, E., Gäggeler, H., James, P., Kentarchos, T., Kromp-Kolb, H., Krüger, B., Land, C., Meloen, J., Papayannis, A., Priller, A., Seibert, P., Sprenger, M., Roelofs, G. J., Scheel, H. E., Schnabel, C., Siegmund, P., Tobler, L., Trickl, T., Wernli, H., Wirth, V., Zanis, P., and Zerefos, C.: Stratosphere-troposphere exchange: A review, and what we have learned from STACCATO, J. Geophys. Res.-Atmos., 108, 8516, https://doi.org/10.1029/2002jd002490, 2003.
Vonmoos, M., Beer, J., and Muscheler, R.: Large variations in Holocene solar activity: Constraints from 10Be in the Greenland Ice Core Project ice core, J. Geophys. Res.-Space, 111, 1–14, https://doi.org/10.1029/2005JA011500, 2006.
Winstrup, M., Svensson, A. M., Rasmussen, S. O., Winther, O., Steig, E. J., and Axelrod, A. E.: An automated approach for annual layer counting in ice cores, Clim. Past, 8, 1881–1895, https://doi.org/10.5194/cp-8-1881-2012, 2012.
Zheng, M., Adolphi, F., Sjolte, J., Aldahan, A., Possnert, G., Wu, M., Chen, P., and Muscheler, R.: Solar and climate signals revealed by seasonal 10Be data from the NEEM ice core project for the neutron monitor period, Earth Planet. Sc. Lett., 541, 116273, https://doi.org/10.1016/j.epsl.2020.116273, 2020.
Zheng, M., Adolphi, F., Sjolte, J., Aldahan, A., Possnert, G., Wu, M., Chen, P., and Muscheler, R.: Solar Activity of the Past 100 Years Inferred From 10Be in Ice Cores – Implications for Long-Term Solar Activity Reconstructions, Geophys. Res. Lett., 48, e2020GL090896, https://doi.org/10.1029/2020GL090896, 2021.
Zheng, M., Adolphi, F., Paleari, C., Tao, Q., Erhardt, T., Christl, M., Wu, M., Lu, Z., Hörhold, M., Chen, P., and Muscheler, R.: Solar, Atmospheric, and Volcanic Impacts on 10Be Depositions in Greenland and Antarctica During the Last 100 Years, J. Geophys. Res.-Atmos., 128, 1–16, https://doi.org/10.1029/2022JD038392, 2023.
Zielinski, G. A., Dibb, J. E., Yang, Q., Mayewski, P. A., Whitlow, S., Twickler, M. S., and Germani, M. S.: Assessment of the record of the 1982 El Chichón eruption as preserved in Greenland snow, J. Geophys. Res.-Atmos., 102, 30031–30045, https://doi.org/10.1029/97JD01574, 1997.
- Abstract
- Introduction
- Methods
- 10Be record from CFA excess water samples
- Comparison with other records from Greenland and Antarctica
- Potential SEP and volcanic signals in 10Be
- The 11-year solar cycle
- Conclusions
- Data availability
- Author contributions
- Competing interests
- Disclaimer
- Special issue statement
- Acknowledgements
- Financial support
- Review statement
- References
- Supplement