the Creative Commons Attribution 4.0 License.
the Creative Commons Attribution 4.0 License.
 | 06 Jan 2023
Frequency of large volcanic eruptions over the past 200 000 years
Andrea Burke
Laura Crick
Emily A. Doyle
Helen M. Innes
Sue H. Mahony
James W. B. Rae
Mirko Severi
R. Stephen J. Sparks
Volcanic eruptions are the dominant cause of natural variability in climate forcing on timescales up to multidecadal. Large volcanic eruptions lead to global-scale climate effects and influence the carbon cycle on long timescales. However, estimating the frequency of eruptions is challenging. Here we assess the frequency at which eruptions with particular deposition fluxes are observed in the EPICA Dome C ice core over the last 200 kyr. Using S isotope analysis we confirm that most of the largest peaks recorded at Dome C are from stratospheric eruptions. The cumulative frequency through 200 kyr is close to linear, suggesting an approximately constant rate of eruptions. There is no evidence for an increase in the rate of events recorded in Antarctica at either of the last two deglaciations. Millennial variability is at the level expected from recording small numbers of eruptions, while multimillennial variability may be partly due to changes in transport efficiency through the Brewer–Dobson circulation. Our record of events with sulfate deposition rates > 20 and >50 mg m−2 contains 678 and 75 eruptions, respectively, over the last 200 kyr. Calibration with data on historic eruptions and analysis of a global Quaternary dataset of terrestrial eruptions indicates that sulfate peaks with deposition rates > 20 and >50 mg m−2 correspond to explosive eruptions of magnitude ≥ 6.5 and ≥7, respectively. The largest recorded eruption deposited just over 300 mg m−2.
- Article
(1505 KB) - Full-text XML
-
Supplement
(4581 KB) - BibTeX
- EndNote


Volcanic eruptions can have devastating local effects, and at a global scale they are one of the important natural components of forcing in the climate system (Robock, 2000). The forcing arises from sulfate aerosol that is formed from SO2 erupted into the stratosphere. On longer timescales the balance between volcanism and weathering controls the CO2 content of the atmosphere, and changes in volcanic eruption frequency could contribute to the changes in CO2 concentration observed at glacial terminations (Huybers and Langmuir, 2009). In order to constrain changes in forcing by volcanic aerosol, as well as any role of volcanoes in glacial–interglacial CO2 change, a key question is whether global eruption rate is steady and, if not, whether any variation is related to climate.
There has been much interest in the notion that rates of explosive volcanism have been moderated by processes related to climate change (Kutterolf et al., 2019; Watt et al., 2013). Rates of mantle melting are expected to be affected by glacial cycles: melting of ice caps leads to unloading, enhanced mantle melting and enhanced volcanism (Huybers and Langmuir, 2009; Jull and McKenzie, 1996). Rates of volcanism might also be affected by sea level change (Huybers and Langmuir, 2009; Kutterolf et al., 2019). Over very long timescales, changes in plate tectonics and occurrence of mantle plume volcanism are expected to be reflected in rates of volcanism.
Beyond the period of direct historic observations, explosive eruptions are recorded as tephra deposits in terrestrial and marine records and as both sulfate and occasional tephra deposits in ice cores. Terrestrial tephra deposits give information about location as well as strength and frequency of eruptions (Brown et al., 2014), but they are notoriously difficult to use, and a statistical approach is needed to turn them into useful measures of eruption frequency (Rougier et al., 2018). Tephra in marine cores offers a further opportunity to compile eruption statistics (Mahony et al., 2020), but it is also challenging to compile a record that is unbiased over time and space. Eruptions are also recorded as sulfate deposition in ice cores. While this provides no direct information on the location and magnitude of each eruption, it can be used to log eruptions relevant for climate forcing (Gao et al., 2008; Sigl et al., 2015). There have been only limited investigations (Castellano et al., 2004, 2005; Cole-Dai et al., 2021; Lin et al., 2022) to estimate volcanic eruption occurrence from ice core data beyond the last 2500 years.
Although records from both poles may be combined to identify explosive eruptions recorded at both poles (and therefore most likely having reached the stratosphere), the use of Greenland ice core records alone is complicated because they are dominated by the relatively local input from Icelandic eruptions. For the region around Antarctica, there are active volcanoes in New Zealand, the Andes, the South Sandwich and South Shetland Islands, within the continent in Marie Byrd Land, and around McMurdo Sound. However, the frequency of large eruptions from these areas is expected to be low (notwithstanding an unusual event at the last deglaciation; McConnell et al., 2017), and the local sources within the continent are far from Dome C. The record of eruptions is therefore likely dominated by those that have reached the stratosphere and have a global climate effect.
Eruptions can be logged using spikes in sulfate or, as a surrogate, spikes in the dielectric profile conductance (DEP) or low-frequency electrical conductivity (ECM) of ice (Wolff, 2000), both of which respond to acidity in the ice. Such records are continuously available from a number of ice cores on the East Antarctic plateau. Issues of resolution and diffusion mean that the volcanic spikes cannot be reliably observed to the bottom of the cores, but they are clearly identified over at least the last two glacial cycles. This has, for example, allowed their use to synchronise age models to 128 ka between EPICA cores at Dome C (EDC) and Dronning Maud Land (EDML) (Ruth et al., 2007), to 145 ka between EDC and Vostok (Parrenin et al., 2012), and to 216 ka between EDC and Dome F (Fujita et al., 2015).
Several issues make it challenging to construct a consistent record of sulfate deposition throughout an ice core. Firstly, there is a background of sulfate from non-volcanic sources (mainly sea salt and marine biogenic). Because this background and its variability change with climate, methods which merely seek outliers (Castellano et al., 2004) risk recording volcanic events depositing a particular amount of sulfate in some climate periods and not in others. Secondly, there is a very large amount of variability in the amount of sulfate deposited in the small footprint of snow surface sampled by an ice core (Gautier et al., 2016; Wolff et al., 2005) so that the sulfate signal of individual eruptions in a single core is subject to great uncertainty. Thirdly, despite the lower frequency of local eruptions, Antarctic ice cores will still record some of these minor eruptions which did not reach the stratosphere but are smaller eruptions of more regional origin. These can in principle be filtered using sulfur isotope analysis to identify mass-independent fractionation (Baroni et al., 2008; Burke et al., 2019; Gautier et al., 2019; McConnell et al., 2017; Savarino et al., 2003a).
A final issue is related to resolution and diffusion. Snow accumulation rates at the East Antarctic sites mentioned above (Dome Fuji, EDC, Vostok and EDML) vary from 2–6 cm water equivalent at the different sites in the present day and are typically less than 50 % of that in the last glacial maximum. Eruption signals are generally recorded above background for only 2–3 years. It is therefore essential to use only data with a good depth resolution (at EDC resolution of better than 5 cm is optimal) and to estimate the flux across the peak and not just at the maximum, which will certainly be modulated by the resolution. Additionally, sulfate peaks diffuse with age (Barnes et al., 2003), and we find that volcanic peaks that were just a few years wide on deposition may appear to be 20 years wide in ice of 200 ka age at EDC. This is helpful because it means that, as layers thin with depth, the decreasing age resolution of our measurements is not a limiting factor. However, it makes it yet more challenging to identify eruptions of a particular scale in a consistent way because peaks that stand clearly above background in recent ice diffuse towards the background in older ice.
It is also important to be aware that even a perfect record of sulfate deposition events is not easy to convert into a record of eruption magnitude and frequency. In addition to the strength of the eruption, sulfate deposition depends on the sulfur content of the eruption, the latitude of the volcano and atmospheric transport processes (Marshall et al., 2021). Finally, there are difficulties in converting sulfate loading in an ice core to the magnitude (defined by volcanologists as magma mass erupted). Eruption magnitude is only one of several factors that influence sulfate mass released in explosive eruptions (Wallace and Edmonds, 2011).
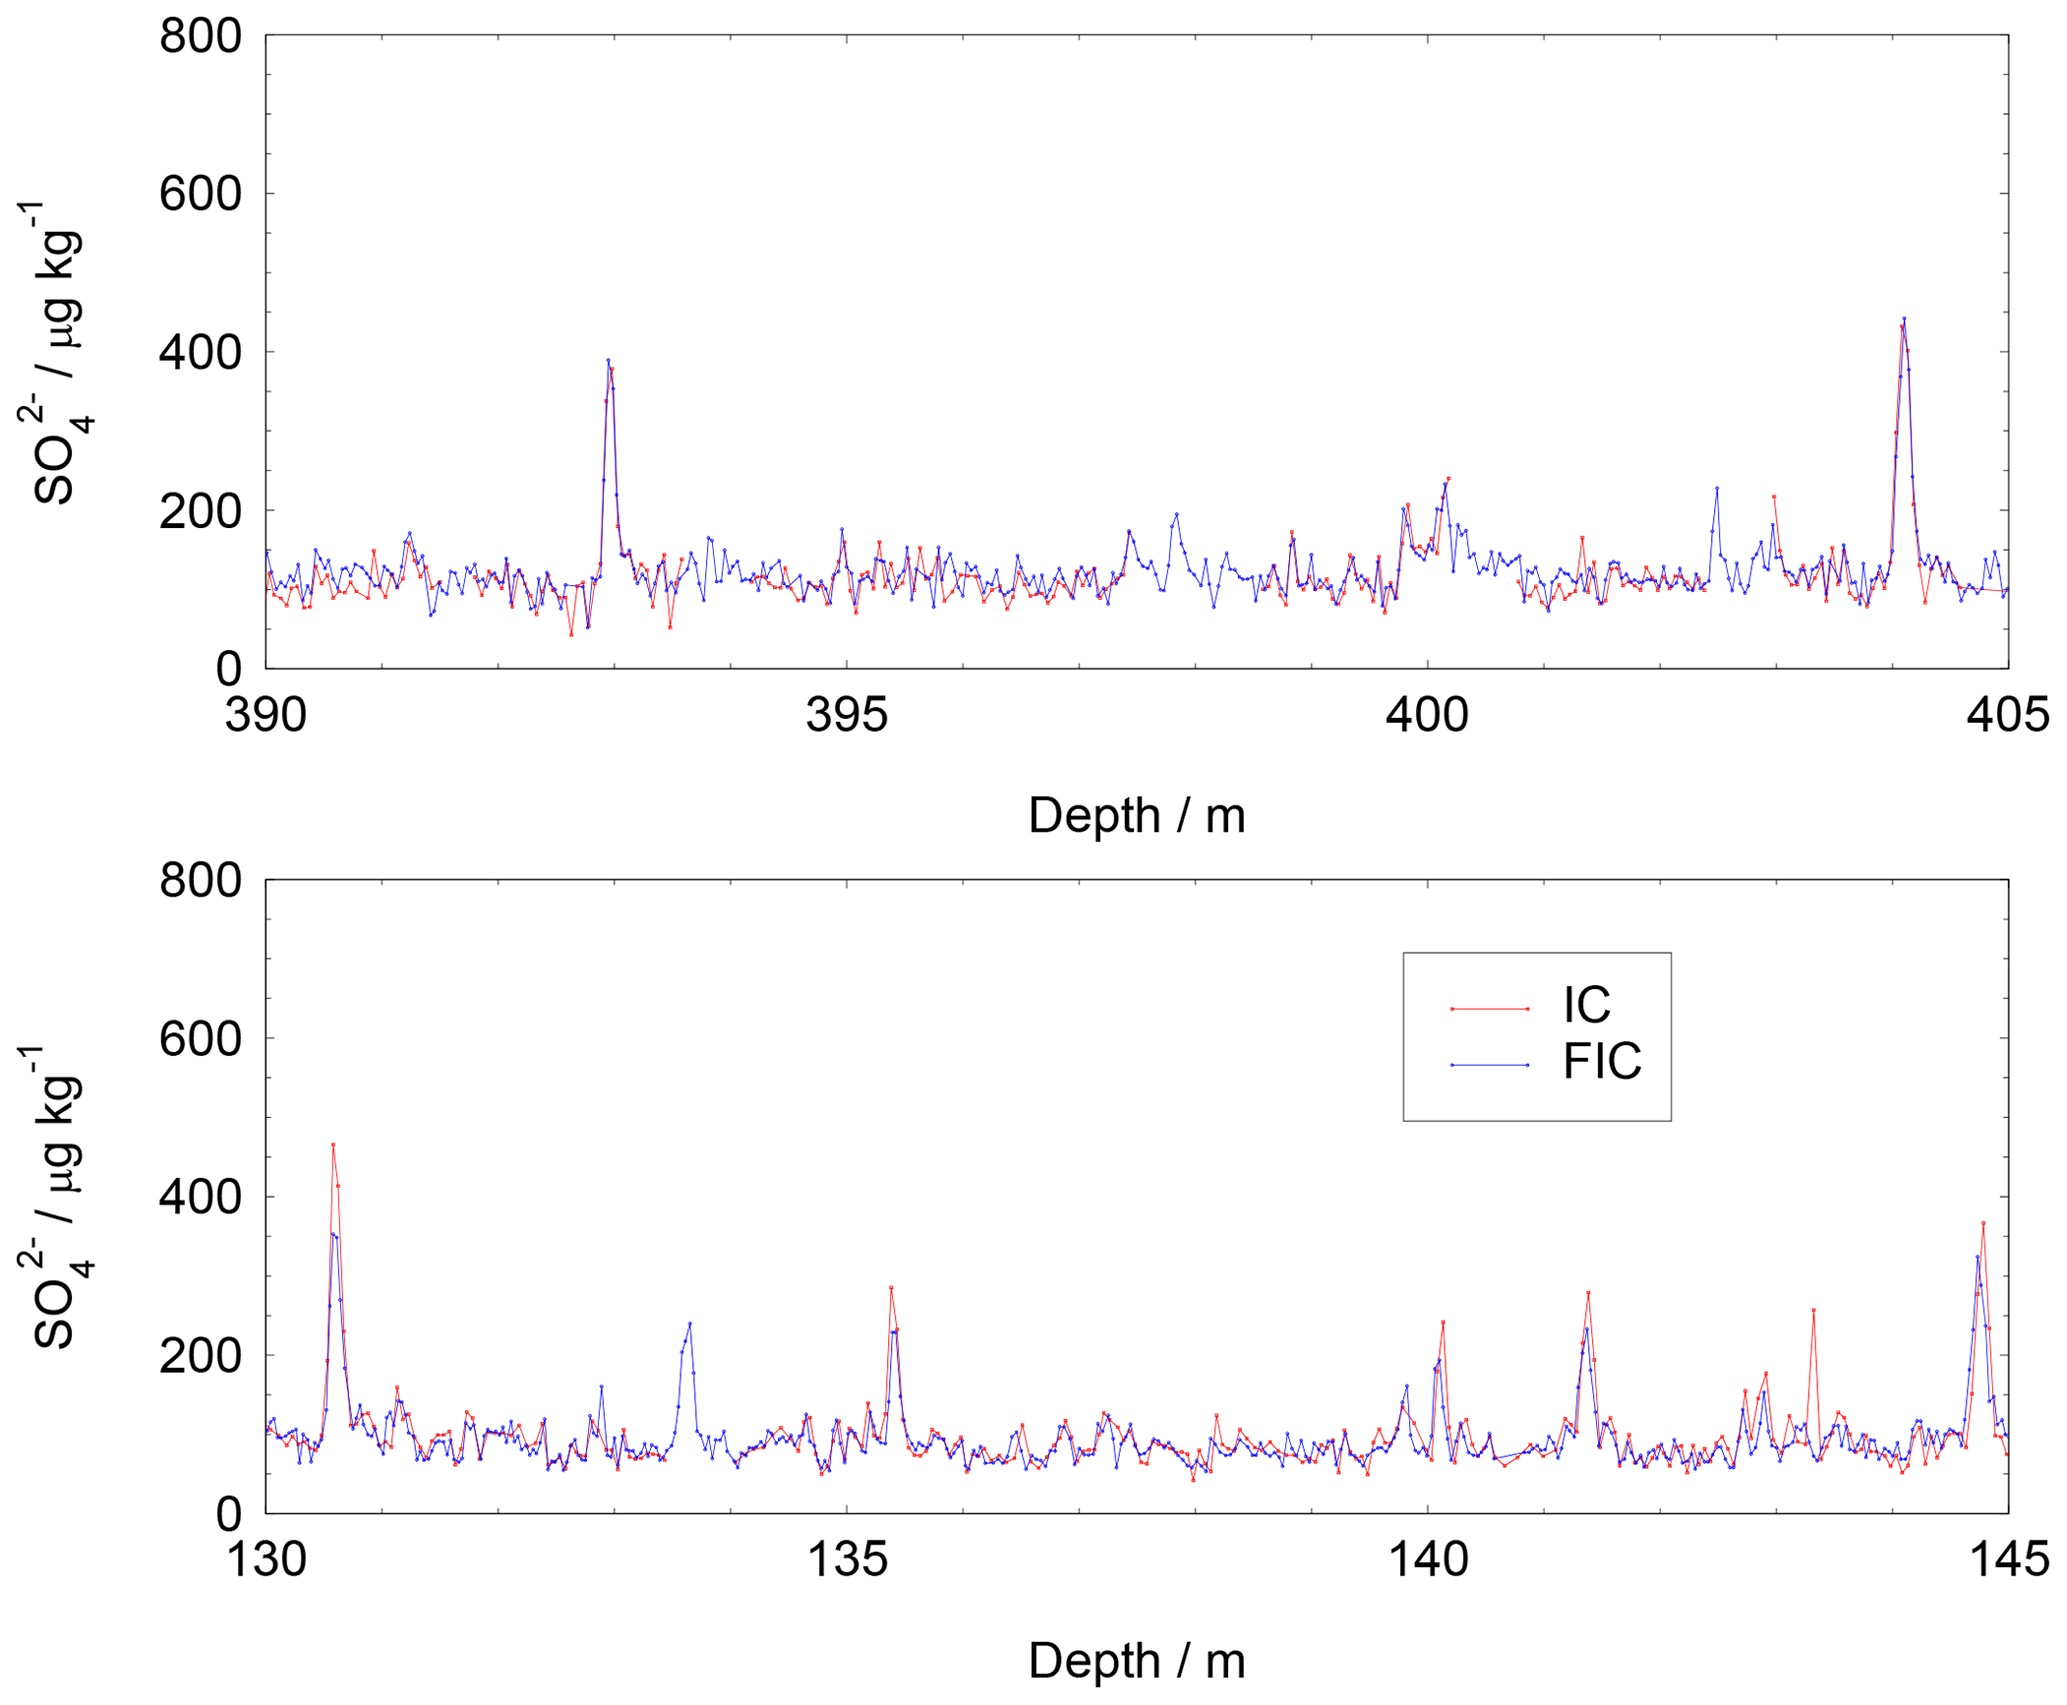
Figure 1Comparison of FIC and IC data for two sections of the EDC ice core. In the section from 130 to 150 m, FIC peaks are consistently lower than those of IC, while in the section from 390 m, the concentrations are the same in the two methods.
Despite these problems two recent papers (Cole-Dai et al., 2021; Lin et al., 2022) have attempted to assess eruption frequency. One (Cole-Dai et al., 2021) examined the number of eruptions recorded in the WAIS Divide core over the last 11 kyr, observing variability but no trend in eruption rate. A second (Lin et al., 2022) assessed eruption frequencies recorded in both Greenland and Antarctica over the period from 9–60 kyr ago and compared them with the rates in the last 2 kyr. For Greenland they found relatively constant rates of eruption through time, but with a small increase in frequency of recorded eruptions across the deglaciation (21–9 ka). This is consistent with the idea that the removal of ice from high-latitude eruption regions, with a particular emphasis on Iceland (Jull and McKenzie, 1996), would have led to an increased eruption rate recorded in Greenland. For Antarctica, using methods similar to those we describe later, the authors (Lin et al., 2022) found no significant change in eruption rate across the 60 kyr period.
In this paper we log eruption frequencies from the Antarctic ice core of EDC to 200 ka using a methodology that assesses the scale of sulfate deposition consistently with depth, age and climate period. We use this to assess the variability in recorded eruptions with time and with climate. We discuss how representative the eruption record in Antarctica is and use sulfur isotope analysis to augment this discussion.
Sulfate was measured along the EPICA Dome C (EDC) ice core by two methods, standard ion chromatography (IC) and fast ion chromatography (FIC) (Littot et al., 2002; Severi et al., 2015). FIC measurements were at higher resolution (typically 5–6 cm in the top 100 m, 3–5 cm below that to 770 m and 2 cm below 770 m) than IC measurements; additionally, there are sections of the core where IC data are not available. For these reasons FIC data were preferred.
However, although initial tests had suggested good agreement between the methods (Littot et al., 2002), a more detailed analysis suggested some calibration problems during the first field season of FIC use to a depth of 358.6 m (11 745 years before present, which is defined as 1950, on the AICC2012 age model). In this depth range we consider the well-established IC method to be more reliable. Detailed comparison of FIC and IC data was carried out where both were available. While it is impossible to diagnose exactly what the issue was, a plot of FIC data against IC data for values more than 50 µg kg−1 above the background showed a gradient of 0.70 for data between 0 and 358.6 m and a gradient of 0.94 between 360 and 720 m. This is shown in Fig. 1 and was used as justification to multiply the FIC values above background (i.e. the residual after subtracting the background) by () for data above 358.6 m (<11.7 ka) during the data processing.
Beyond 358.6 m, the data were used without correction. Volcanic peaks, standing clear of the sulfate background, remain visible beyond 200 ka. It is clear that diffusion has occurred, making peaks considerably wider in years (and consequently smaller in amplitude) than they were at the time of deposition; however, thinning seems to balance diffusion rather closely (Fig. 2). The result is that peaks remain within about a 30 cm window at all depths to 200 ka, and the resolution of the data remains adequate to estimate peak areas.
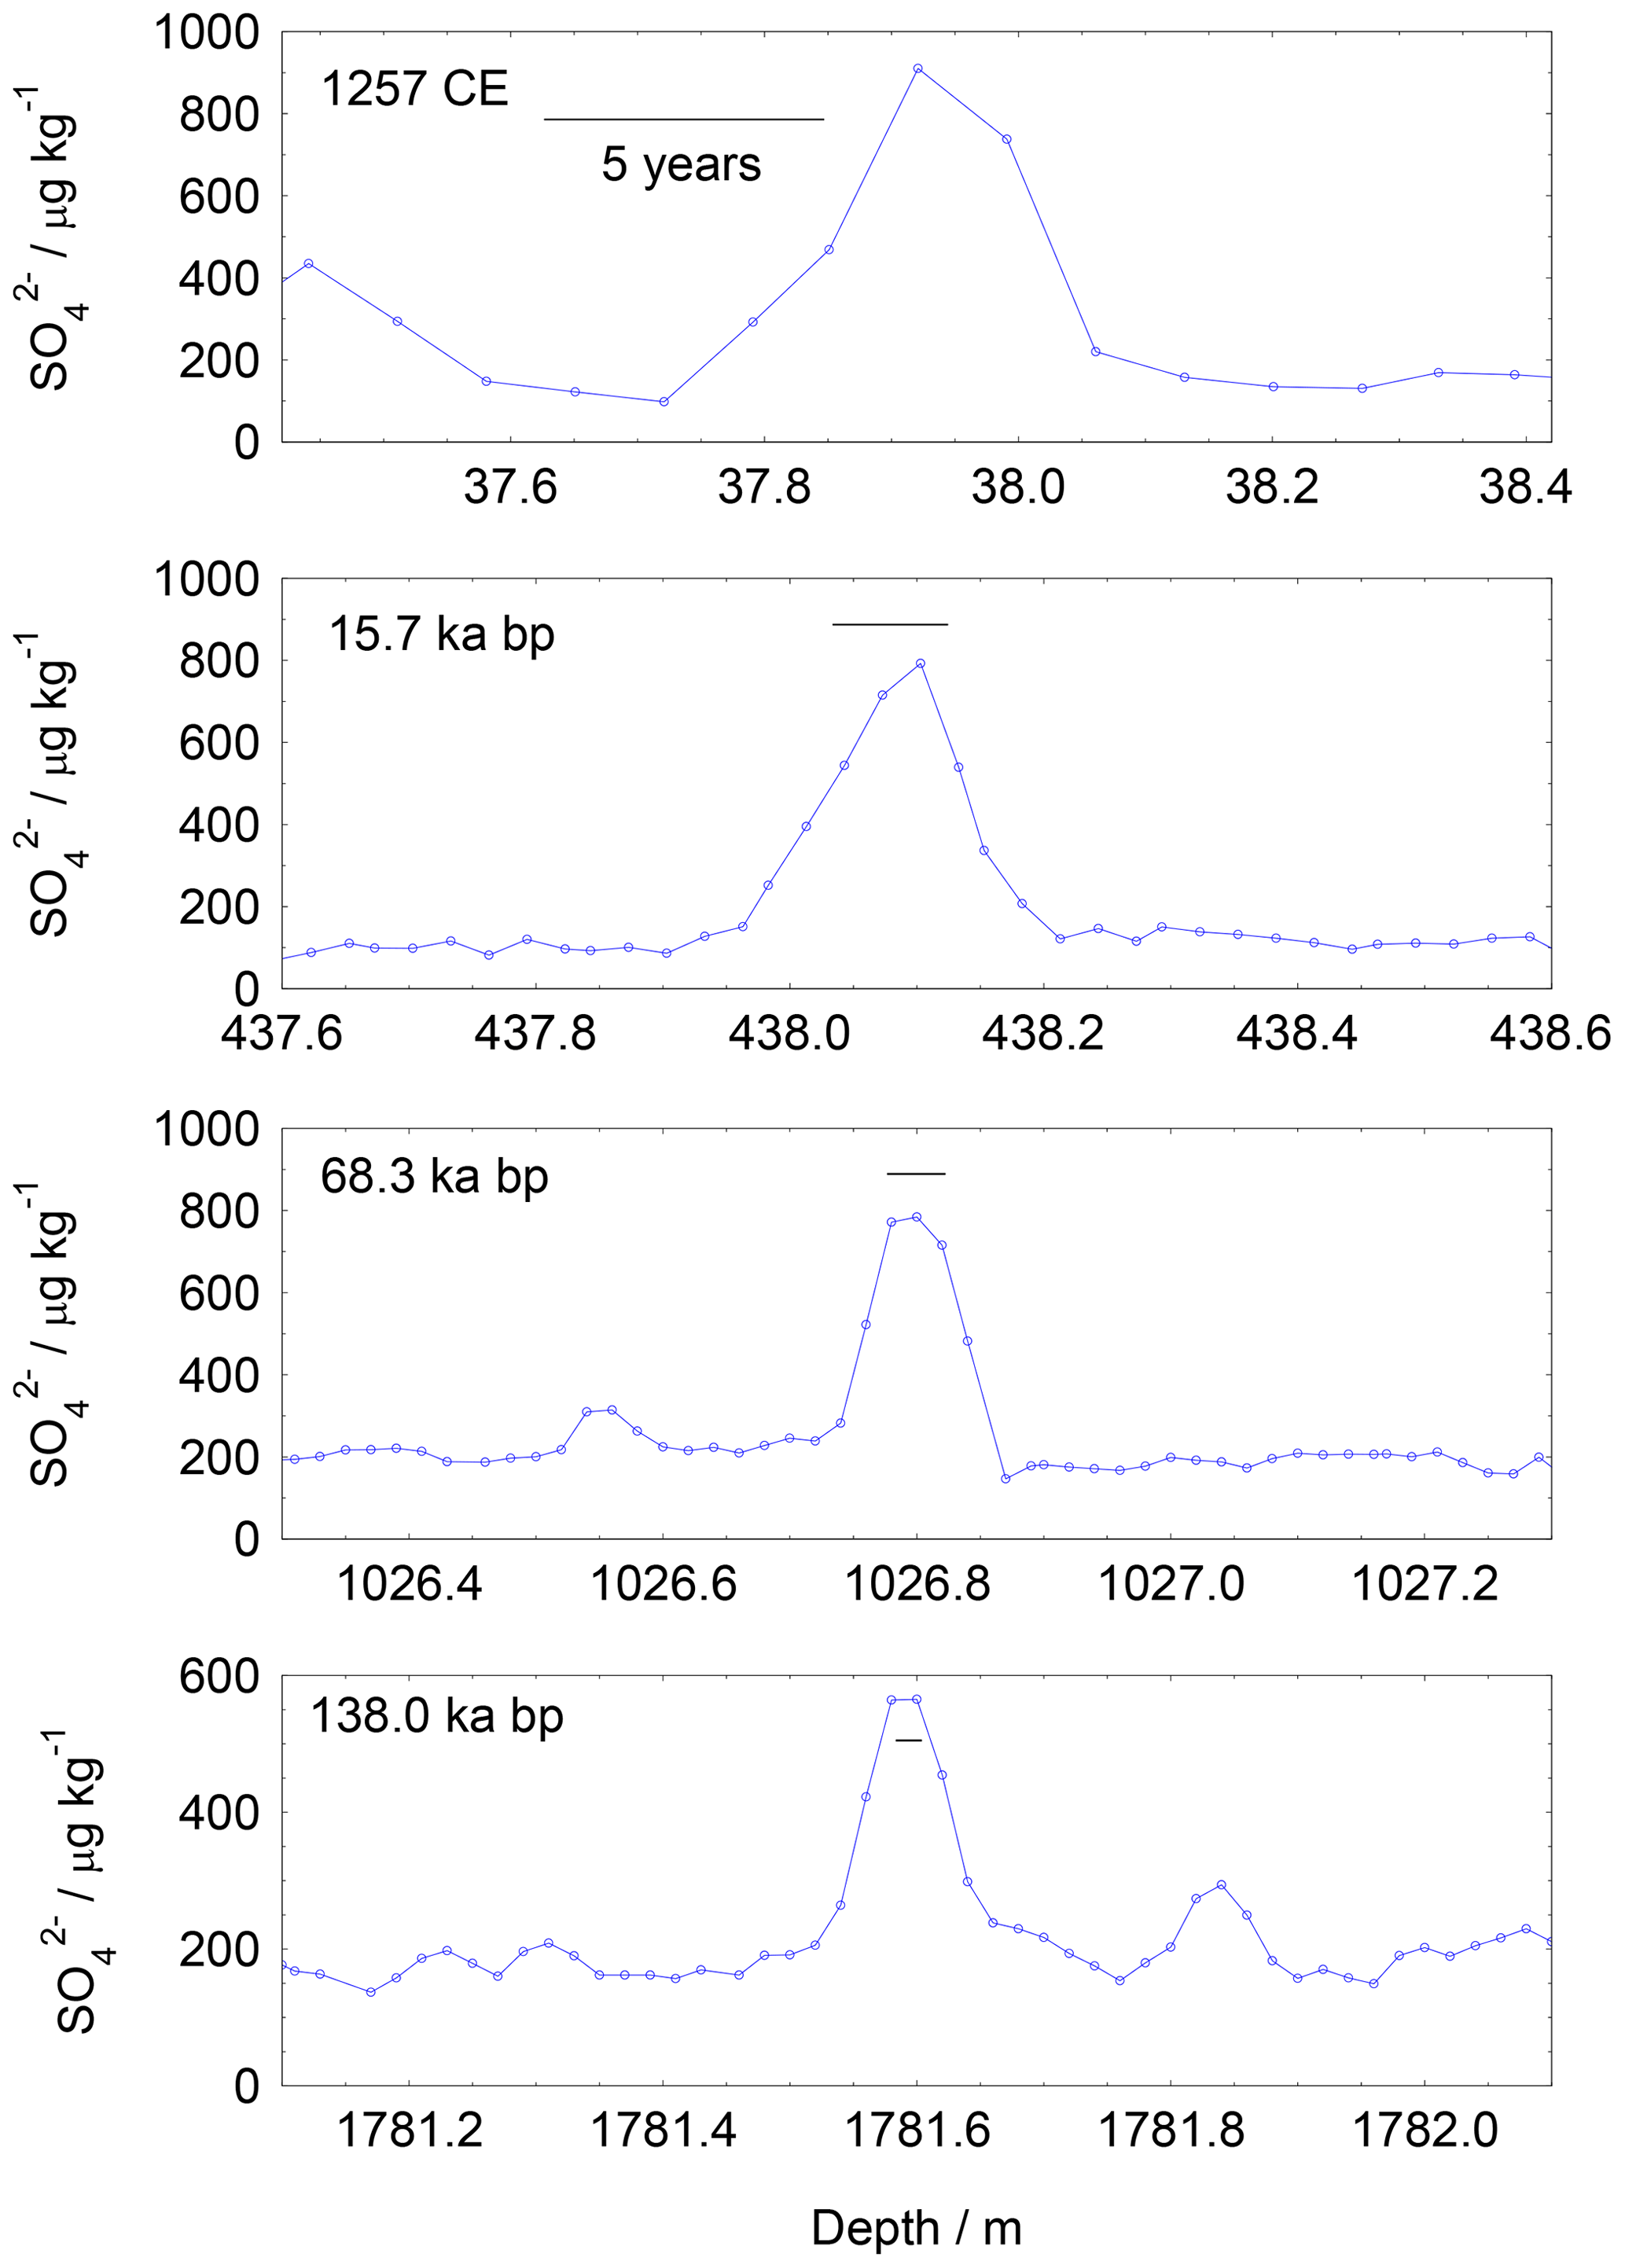
Figure 2Examples of volcanic peaks at different depths and ages. The 1257 peak (top panel) is shown after application of the correction described above. The black horizontal bar on each plot represents 5 years at each depth. Dots represent the mid-depths of individual samples.
The dataset includes sections of missing data, where no FIC sulfate data are available. Mainly this consists of short sections at the end of core lengths, but there are some longer sections where data were not taken either because of poor core quality or instrument problems. Out of 2070 m of ice, there are 25 gaps longer than 30 cm, consisting in total of 19 m of ice. We discuss our treatment of missing data in the Methods section.
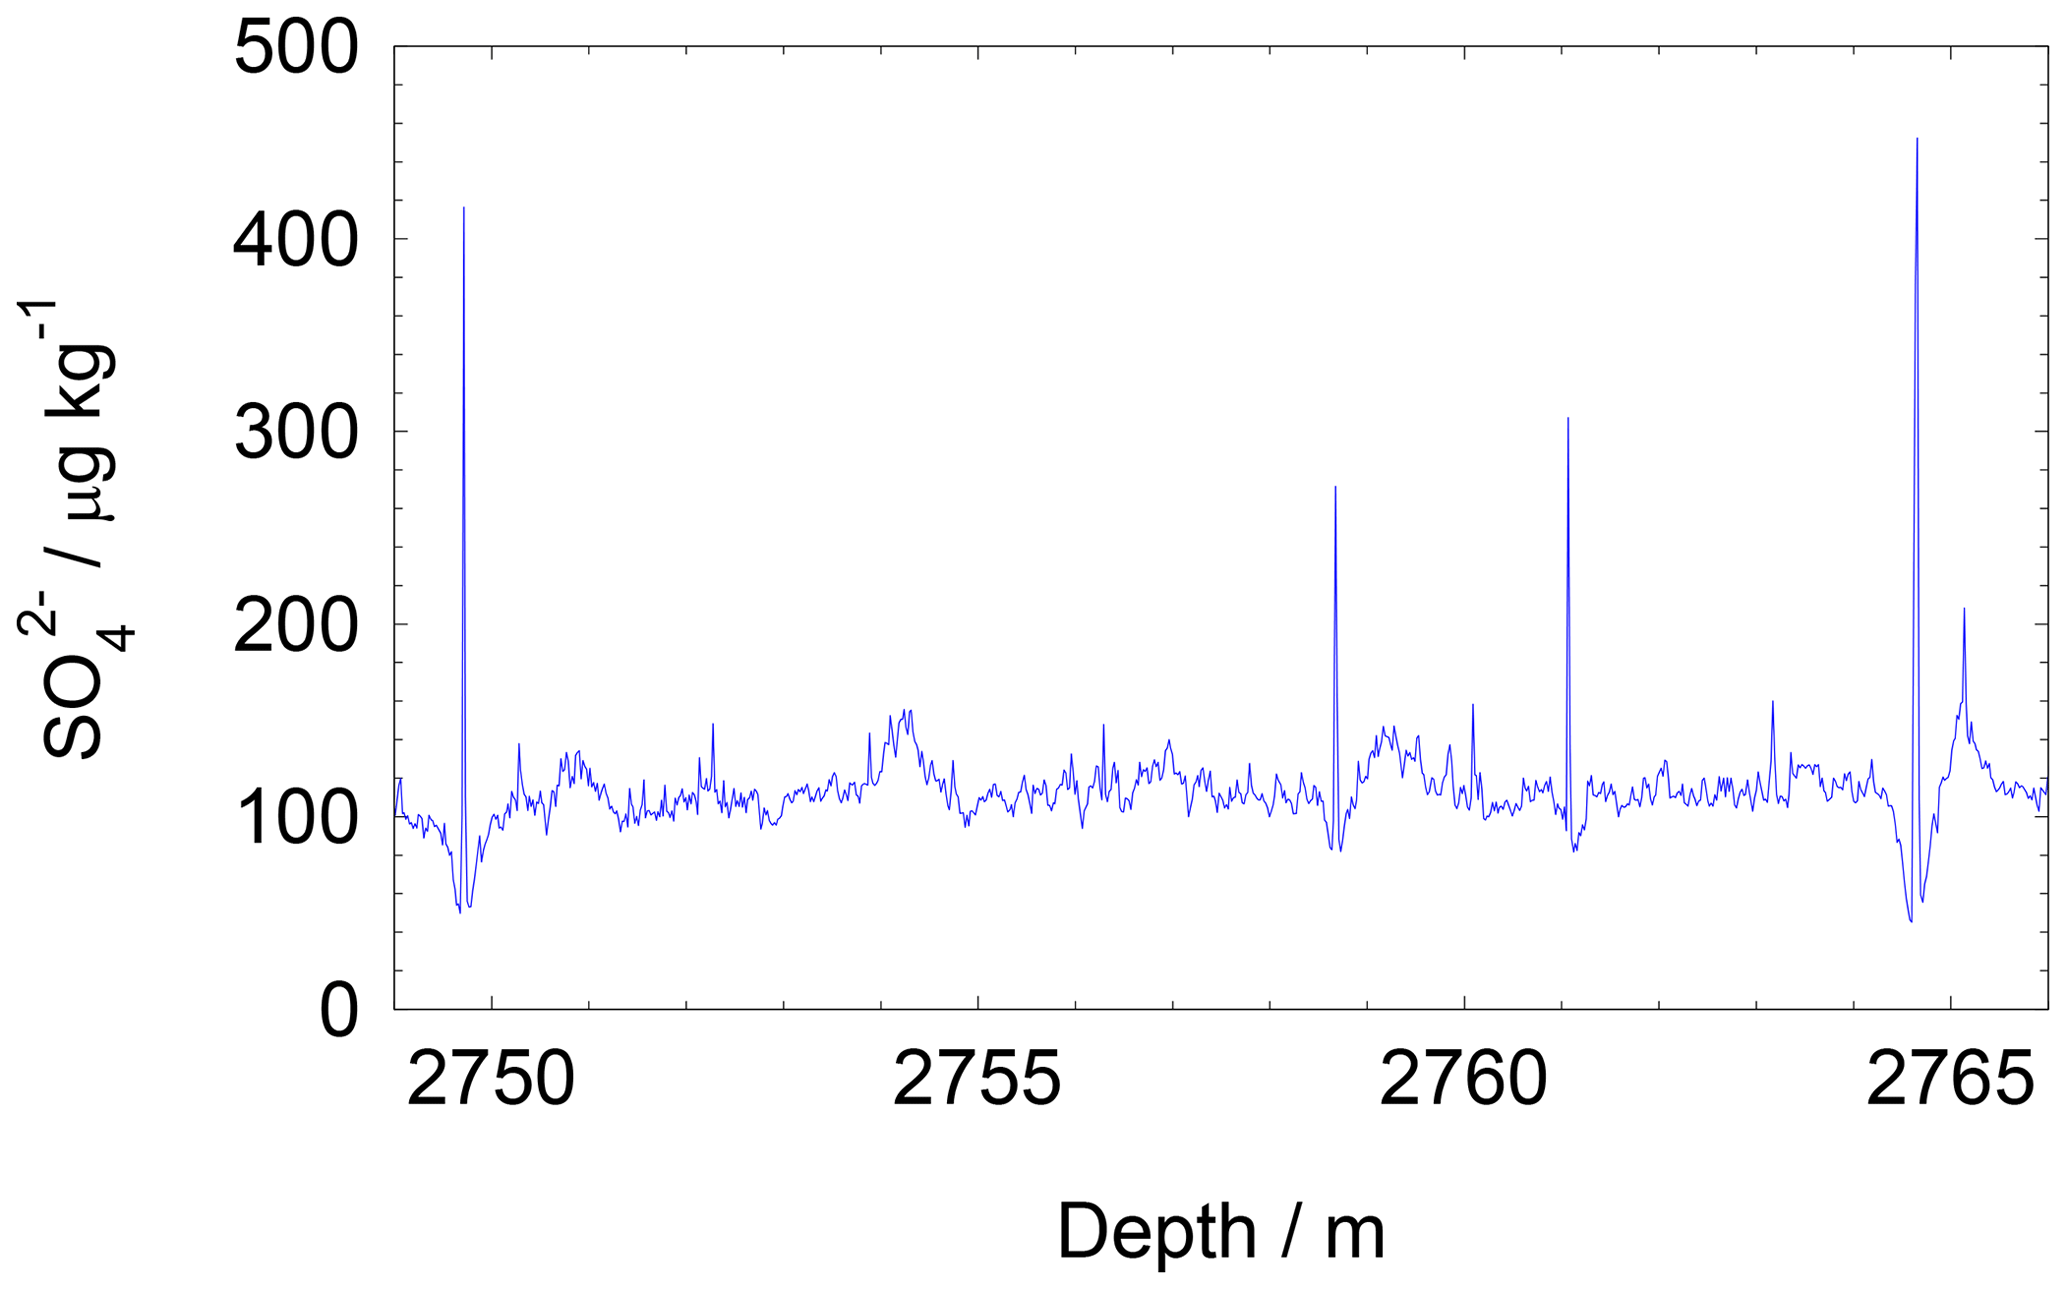
In deeper ice, it has been observed (Traversi et al., 2009) that anomalous spikes in sulfate concentration form through an as-yet uncharacterised post-depositional process. In Fig. 3 we show clear examples of this artefact at about 400 ka; sulfate appears to have been “sucked” from the surrounding background into a sharp peak. We observed signs of this behaviour as shallow as 2500 m (300 ka). To avoid any possibility of including such artefact peaks, we restrict our subsequent analysis to the past 200 kyr. This also avoids the problem of peaks becoming harder to distinguish from background with greater depth.
Material for the last few decades was not available in the EDC ice core because the top few metres were not retrieved. However, the Pinatubo period has been studied previously at Dome C using snow pits (Castellano et al., 2005). The observed peak (deposition of 10.7 mg m−2) encompassed both Pinatubo and the eruption of Mount Hudson in Chile, which could not be separated. However, the two eruptions have been resolved at the South Pole (Cole-Dai and Mosley-Thompson, 1999), allowing a fraction of deposition in the combined peak to be assigned to each eruption. Using the same fraction, we estimate 7.5 mg m−2 for the Pinatubo sulfate deposition at Dome C, which is used later as part of benchmarking our data.
We applied the following method of calculating sulfate deposition. The ice core volcanic record consists of numerous sharp spikes of sulfuric acid input superimposed on a noisy background. The background consists mainly of sulfate from oxidation of marine biogenic emissions of dimethylsulfide, with small contributions from sea salt as well as background volcanic sulfate. Based on sulfate concentration measurements (Legrand and Delmas, 1984) and measurements of δ34S in ice at the South Pole (Patris et al., 2000), the volcanic contribution to the background is estimated as less than 10 %. In order to calculate the sulfate deposition during each individual eruption event, we subtract the background and then sum the area across the peak, correcting for ice thinning.
To correct for the background, we subtracted a running median from the dataset. The median is preferred to the mean because the mean includes the volcanic peaks, while the median should, if well-chosen, exclude the peaks. The time period over which the median is calculated needs to be short enough that it follows the varying background but long enough that it will never use the values within volcanic peaks. In our standard calculations we used 200 years, but other periods were also tested in sensitivity studies. Varying the period over which the median was calculated between 100 and 400 years changed the total number of peaks above a threshold of 20 mg m−2 by up to 10 % compared to the standard case (200 years) but did not affect the profile of peaks with time.
Having subtracted the background, we calculate the total amount of sulfate deposited to the snow per unit area across the whole eruption. A key assumption is that the sulfate is mainly deposited by dry deposition, which is expected to be true at a site like Dome C with its very low snow accumulation rate. This justifies the underlying assumption that the sulfate flux scales with the amount of sulfate injected into the stratosphere. We first calculate the annual flux of sulfate in each sample (µg m−2 a−1) as , where C is the concentration in a slice of ice (µg kg−1), and A is the snow accumulation rate (kg m−2 a−1). We then calculate the total deposition in each sample (µg m−2) by multiplying the flux by the time period represented in each sample; this is done by using the accumulation rate and thinning parameter derived in the AICC2012 age model (Bazin et al., 2013) to calculate the annual layer thickness. Finally, since the FIC data are effectively averages for discrete slices, we sum the deposition (above background) in each of the samples that contribute to a particular peak to get the total deposition for an individual eruption. This method automatically corrects the flux for the ice thinning (which is already 73 % at the depth – 2090 m – of 200 ka ice).
The algorithm we use searches for local maxima in the residual (after subtraction of the background) and calculates the sum of samples across a chosen summing width across each maximum. The summing width needs to be large enough to include all the volcanic sulfate after diffusion (Barnes et al., 2003). Visual observation suggests that a width of 30 cm (i.e. samples within 15 cm of the concentration maximum) is appropriate at all depths between the surface and 2100 m (see Fig. 2). This suggests that diffusion approximately keeps pace with thinning at EDC. However, this width was also varied in sensitivity studies. Varying the integration width between 20 and 40 cm altered the total number of peaks above a threshold of 20 mg m−2 by up to 10 % compared to the standard case (30 cm) but did not affect the profile of peaks with time. At many depths, an integration width of 20 cm is clearly too narrow to capture the full peak, while 40 cm includes sections of background, so the uncertainty induced by this parameter is below 10 %.
Our method calculates numerous small peaks that are caused simply by variations around the background. To estimate this variation we also calculate “negative” peaks around our median line. We then separately sum the number of peaks and negative peaks in bins exceeding particular deposition fluxes (Fig. 4). At a deposition of 10 µg m−2, there is still a substantial number of negative peaks (441 in 200 kyr compared to 1518 positive peaks). At 20 mg m−2, there are very few negative peaks (28 in 200 kyr compared to 678 positive peaks), suggesting that 96 % of peaks we count at this level are volcanic eruption peaks and supporting our choice of 20 mg m−2 as the background threshold for counting peaks. There are no negative peaks at 40 mg m−2. This indicates that, while we could investigate volcanoes with lower deposition fluxes in some time periods, we should restrict ourselves to peaks above 20 mg m−2 in order to consistently count peaks of similar size over 200 kyr.
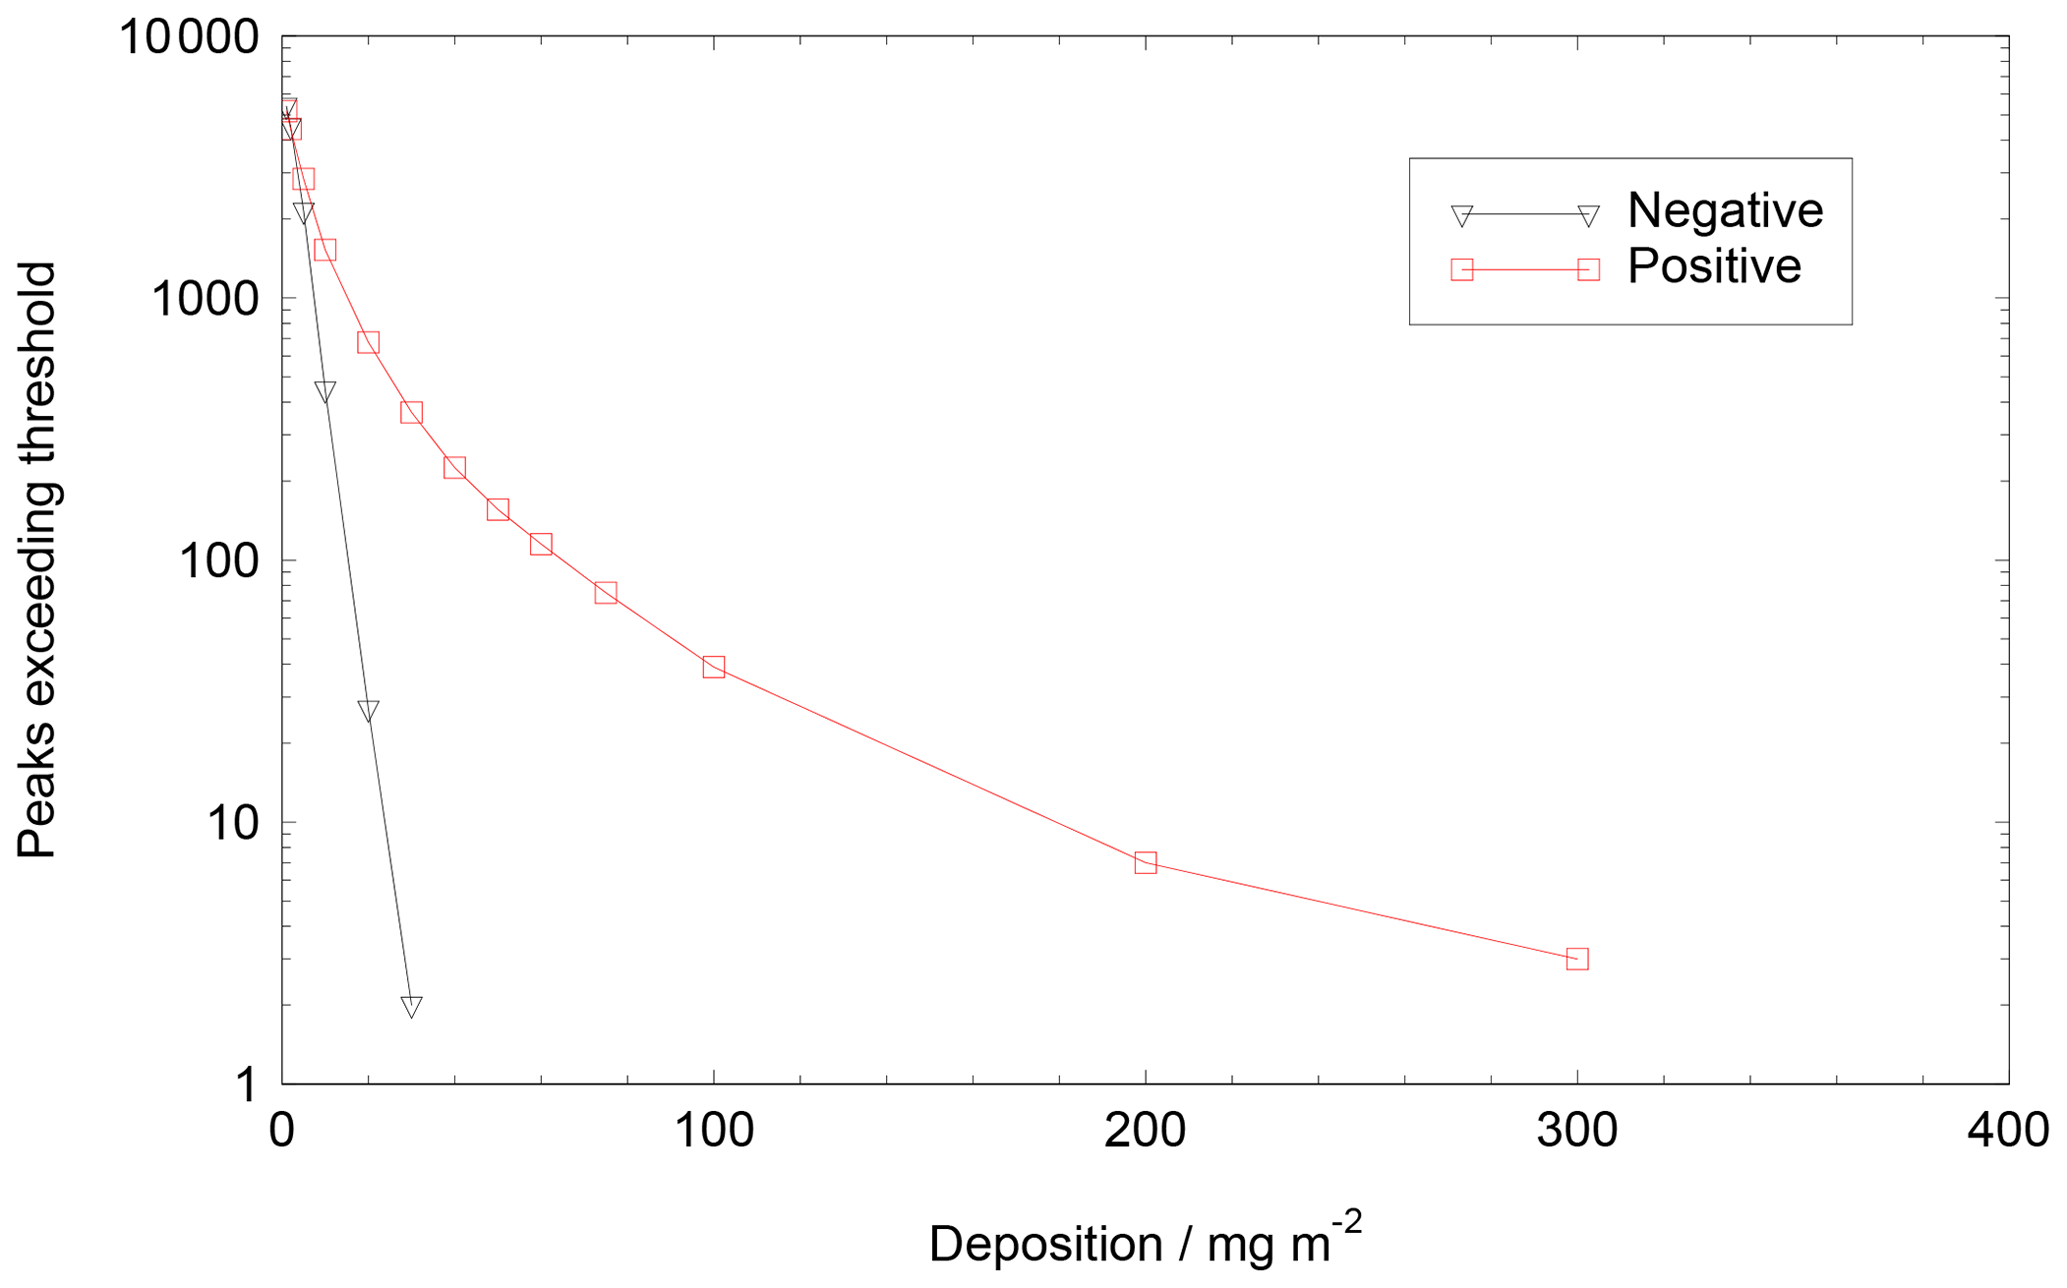
Figure 4Distribution of positive and negative peaks exceeding different deposition fluxes, summed over the past 200 kyr.
In our standard calculation we treated missing data as having the concentration of the background; i.e. those sections did not contribute to the size of volcanic peaks in which they were embedded. We also did a calculation whereby we set the value of all missing sections less than 30 cm thick to be the average of the adjacent samples: this increased the total count of peaks > 20 mg m−2 by only 11 (out of 678). It is likely that the longer sections of missing data (25 sections > 30 cm, totalling 19 m of ice) would have contained some peaks, but assuming they contain the same proportion of volcanoes as the measured parts, we probably missed fewer than 10 peaks with deposition > 20 mg m−2.
Sulfur isotopes were measured on discrete samples of ice cut at high resolution (every 2–3 cm) across 21 volcanic sulfate events from Dome C between 10.1 and 96.1 ka. These included examples of both larger and smaller volcanic peaks in the EDC core. Samples were melted and measured for concentration by ion chromatography. Based on the concentration, a volume corresponding to 20 nmol of sulfate was dried down and purified through anion exchange columns following the method previously described (Burke et al., 2019). Each sample was measured at least twice for δ34S and δ33S by multi-collector inductively coupled plasma mass spectrometry, where
and x is either 33 or 34. Mass-independent fractionation was calculated as
The uncertainty for these Δ33S measurements is 0.14 ‰ (2 SD). Only sulfate that has been in the stratosphere shows a non-zero signal of Δ33S, so if the maximum magnitude Δ33S across a peak is greater than 0.14 ‰, the eruption is considered stratospheric.
A few of the most recent sulfate layers can be correlated with specific eruptions, allowing some calibration of the record to the magnitude of explosive eruptions (Gao et al., 2008; Sigl et al., 2015), but most layers cannot be linked to a source. As a benchmark Table 1 lists four sulfate peaks in Dome C for which the eruption location and magnitude are also known, including the 1991 Pinatubo eruptions (Castellano et al., 2005). The benchmark data (all from tropical eruptions) imply that peaks above our chosen threshold of 20 mg m−2 are likely to be M>6.5 eruptions.
Table 1Identified sulfate peaks in Dome C with magnitude and estimated emission (Toohey and Sigl, 2017).
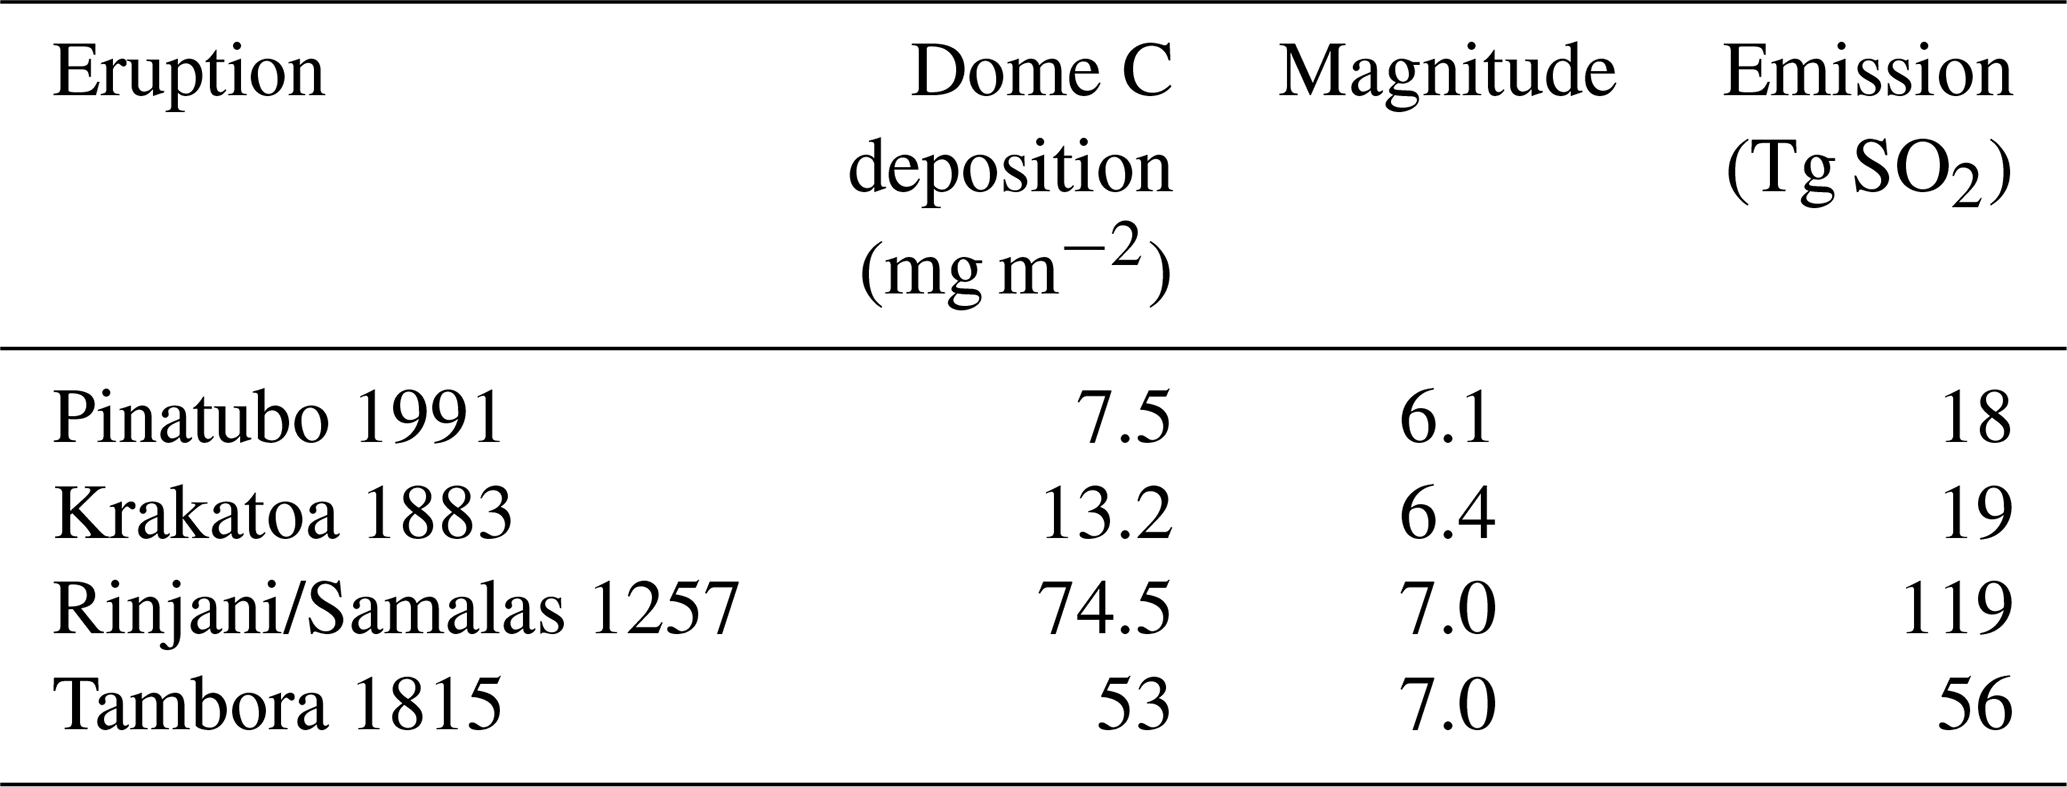
Various attempts have been made to derive SO2 emissions (in Mt or Tg of S or SO2) from ice core deposition (in mg m−2 of sulfate) (Sigl et al., 2022). However, this is difficult when there is only one ice core location and the location of the eruption is unknown. Model studies show that the ratio of deposition in Antarctica to emissions depends on latitude of eruption, the height the plume reaches and the time of year of the eruption (Marshall et al., 2021). As a rough estimate using emissions values calculated in the literature (Toohey and Sigl, 2017) we can deduce that for tropical eruptions, SO2 emissions (Tg SO2) are about 1–2 times higher than our measured EDC depositions (mg m−2) (Table 1). However, the factor should certainly be increased if eruptions occurred at high northern latitudes (Marshall et al., 2021).
It was already noted (Sigl et al., 2013, 2015) that most Icelandic eruptions (such as Laki in 1783 CE and Eldgja in 939 CE) with large deposition in Greenland cannot be identified in Antarctic cores. However, these eruptions are estimated to be below the magnitude we would associate with depositions above our chosen threshold of 20 mg m−2. An eruption at 44 BCE, which is prominent in Greenland records, was recently identified with the Alaskan Okmok eruption (McConnell et al., 2020), which has been assigned a magnitude of 6.7. The most likely candidate for this eruption in our EDC record has a deposition of 15 mg m−2, identical to the value previously noted for this eruption in Antarctica (Sigl et al., 2015). It is therefore likely that for eruptions at high northern latitudes our threshold is closer to M>7.
Using our base set of parameters (200-year median calculation, 30 cm summation of layers per volcano, missing values treated as having background concentration), we find that the last 200 kyr contain 678 volcanic events with deposition rates greater than 20 mg m−2 (Fig. 4); this gives an average of 3.4 per millennium. Although our method is identical in concept, we calculate rather more peaks greater than 20 mg m−2 (2.87 eruptions per thousand years vs. 2.21 eruptions per thousand years) for the period 9–60 ka than that estimated for EDC by previous work (Lin et al., 2022). This difference seems to arise because our method calculates higher integrals for smaller peaks, suggesting that the difference is related to the way that the background is calculated and/or the way that we deal with the width of each peak. This is supported by the fact that at the extreme of our parameter choices (20 cm peak widths and 100-year interval for calculating the median background) our estimates converge with those of the previous work (Lin et al., 2022). There are only 76 peaks with fluxes larger than that of Rinjani/Samalas (1257), making this a “once in 2500 years” event. A time series of all eruptions greater than 20 mg m−2 is shown in Fig. 5.
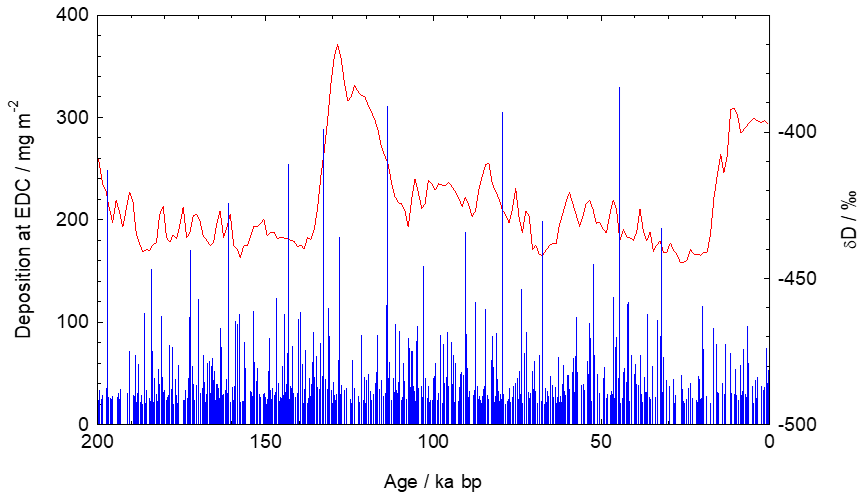
Figure 5The deposition flux of sulfate for events with deposition more than 20 mg m−2 over the last 200 kyr (blue, left axis). Antarctic δD is shown in red (right axis) to indicate the climatic context.
Our results are also consistent with independent estimates of the global magnitude–frequency relationship (Rougier et al., 2018). Based on data shown in Table 1, sulfate peaks > 20 mg m−2 should have magnitudes ≥ 6.5, while sulfate peaks > 50 mg m−2 should have magnitudes ≥ 7. The analysis of global terrestrial data (Rougier et al., 2018) gives an estimate of M≥6.5 eruptions as 2.75 eruptions per thousand years – confidence interval (CI) 1.6–4.3 – and an estimate of M≥7 eruptions as 0.8 eruptions per thousand years (CI 0.48 to 1.47). Thus, the event rates based on sulfate events at >20 mg m−2 (3.4 eruptions per thousand years) and >50 mg m−2 (0.78 eruptions per thousand years) are well within the uncertainty ranges of the estimates from the global terrestrial record.
The largest peaks in the past 200 kyr deposited around 300 mg m−2. The largest recorded eruption in the timeframe that could accommodate the Toba eruption (Crick et al., 2021; Svensson et al., 2013) has a flux of 133 mg m−2 (16th largest in our record). This raises questions as to whether, in terms of global dispersion of sulfate aerosol, Toba was the most significant volcanic climate forcing event of the past 200 kyr. However, additional data from other deep ice cores covering this time period are needed to determine this more certainly.
To assess whether there are particular periods with high or low numbers of eruptions, we plot the cumulative number of large sulfate deposition events with time (Fig. 6). Concentrating mainly on the result for eruptions greater than 20 mg m−2 because of the greater numbers involved, the trend is linear, indicating a steady state of large explosive eruptions across two glacial cycles. There is no sign of an increased slope (i.e. increased eruption frequency) at the two periods of deglaciation or interglacials. This can be seen in Fig. 7. The number of eruptions per millennium is very variable, as is to be expected from counting statistics for such small numbers. As a result the time series plot of the occurrence data is very scattered (Fig. 7). Nonetheless, it is quite obvious that, at Dome C, both periods of deglaciation tend to have eruption frequencies at the lower end of the range rather than increased rates.
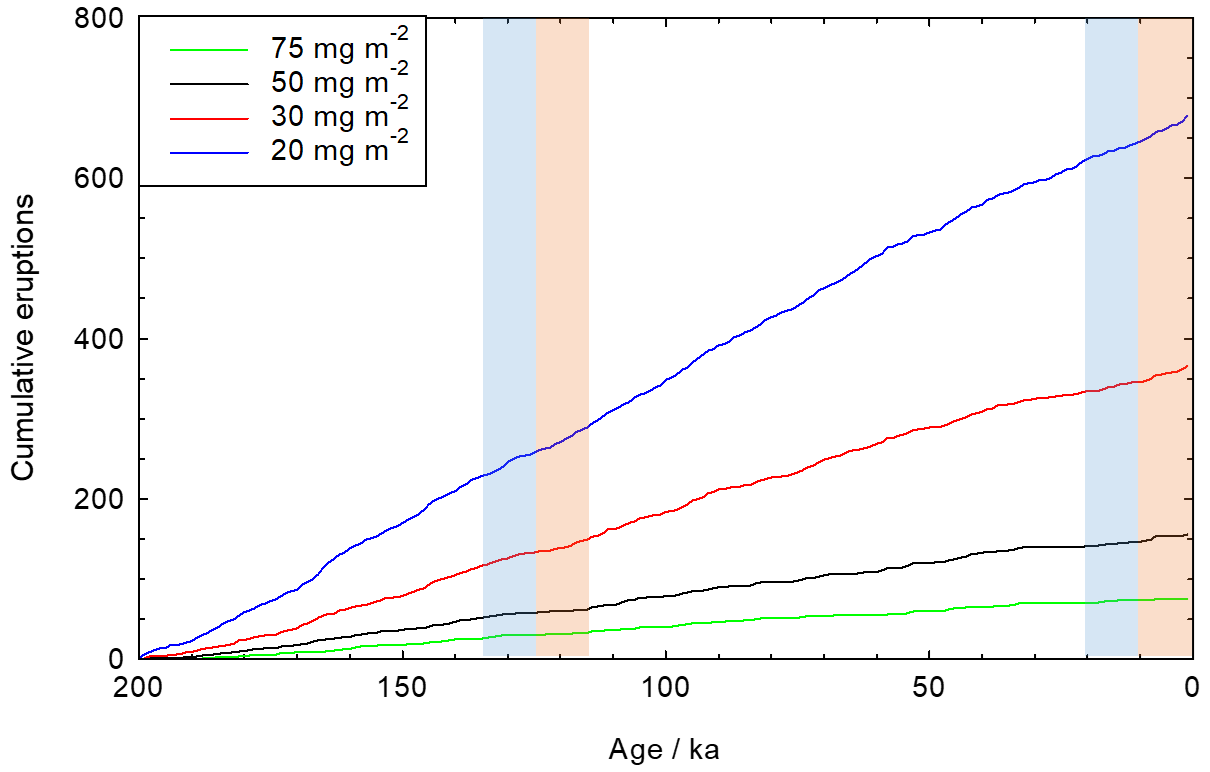
Figure 6Cumulative eruption numbers over the past 200 kyr recorded in the Dome C ice core for different eruption deposition fluxes of sulfate. Periods of deglaciation are marked with a blue bar and interglacials with an orange bar.

Figure 7Eruption numbers per millennium (red) and 5 kyr running mean (blue). Periods of deglaciation are marked with a blue bar and interglacials with an orange bar.
We explored other ways of analysing the ice core data to assess whether a climate cycle signal can be recognised. Using spectral analysis on the millennial eruption counts, we identified a possible peak corresponding to a 20 kyr period (frequency similar to precession) that emerges with weak statistical significance. This certainly needs to be confirmed in other records. Although there have been weak indications of a 23 kyr period in Mediterranean tephra data (Kutterolf et al., 2019) it is difficult to envisage a mechanism by which precession would influence global volcanism given that it leads to much weaker changes in ice sheet unloading and sea level compared to the longer (of the order of 100 kyr) period. Temperature and snow accumulation rates at the EDC site show only very weak precessional power (Jouzel et al., 2007), so precessional changes in deposition efficiency are unlikely to be strong. However, precession significantly influences tropical hydroclimate and the position and width of the Intertropical Convergence Zone (ITCZ) (Singarayer et al., 2017). These changes could affect the washout of aerosol from eruptions in tropical regions and hence their ability to reach the stratosphere. There will certainly also be an associated effect on the efficiency of the Brewer–Dobson circulation that transports aerosol to the poles through the stratosphere, although we are not aware of model simulations of this transport involving significant changes in precession (Fu et al., 2020). Thus, if the 20 kyr period is confirmed it might be ascribed to a small change in the effectiveness of transporting tropical or Northern Hemisphere eruption material to Antarctica. We emphasise that there is no significant signal at the lower Milankovitch frequency corresponding to 40 kyr. Our record is too short to make a meaningful assessment in frequency space of the ∼100 kyr cycle on which deglaciations occur, but we again emphasise that, if anything, we see lower numbers of recorded events across the two deglaciations.
As described earlier, there are several challenges when interpreting this dataset as a record of global volcanism. First, there is the difficulty of separating local tropospheric from larger-magnitude stratospheric eruptions. Mass-independent sulfur isotopes in ice cores can be used to determine whether a volcanic event was stratospheric (Baroni et al., 2008; Burke et al., 2019; Gautier et al., 2019; Savarino et al., 2003b). Isotope analysis of large sulfate peaks from the last 2600 years at Dome C (Gautier et al., 2019) indicates 11 tropospheric and 49 stratospheric events, with 4 events showing an inconclusive signal. All the largest events (>20 mg m−2 deposited at Dome C) were stratospheric. In this study, we tested if the proportion of stratospheric events recorded at Dome C was the same earlier in the record by measuring an additional 21 events from Dome C between 10.1 and 96.1 ka following previous methods (Burke et al., 2019). Mass-independent fractionation of S occurs when sulfur dioxide is photo-oxidised above the ozone layer, producing positive values of Δ33S, followed by (for reasons of mass balance) negative values so that non-zero values of either sign indicate material that has reached the stratosphere. We found (Fig. 8 and table in the Supplement) that most (18 out of 21; 15 out of 17 for deposition > 20 mg m−2) volcanic signals in Dome C are stratospheric, consistent with its isolated location away from most volcanic sources. The sulfur isotope data therefore show that more than 80 % of the volcanic events recorded at Dome C involved stratospheric input due to large explosive eruptions.
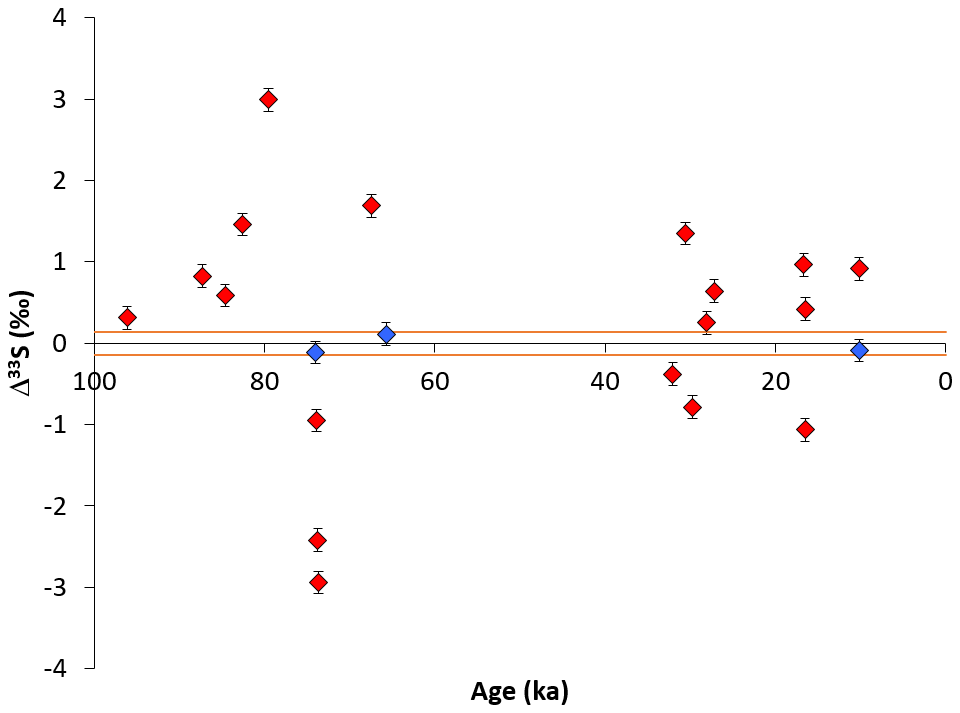
Figure 8Values of Δ33S for 21 large volcanic eruptions recorded at Dome C in the last 100 kyr. Values outside a range of ±0.14 ‰ are considered to indicate a stratospheric eruption.
Second, sulfate peak amplitudes can vary strongly between core sites that are close together, and major peaks can even be missing at a single site (Gautier et al., 2016; Wolff et al., 2005). This problem is particularly pronounced at sites with low snow accumulation where years may be missing, like Dome C (Wolff et al., 2005), but these sites must be used to investigate long records of volcanism. This issue will cause variability in measured eruption rates, which should average out over longer time periods.
Third, there will be a significant bias in the record of global explosive volcanism in Antarctica as a consequence of source locations and magnitude. Northern Hemisphere extratropical eruptions (>23∘ N) will be underrepresented and biased towards very large eruptions with the likelihood of sulfate aerosol moving into the Southern Hemisphere being a function of source latitude and magnitude (Marshall et al., 2021). Thus, the Antarctic volcanic record will be biased by larger depositional fluxes for tropical and especially Southern Hemisphere extratropical sources while exhibiting smaller depositional fluxes or even missing events for Northern Hemisphere extratropical eruptions.
The bias in source locations with extratropical Northern Hemisphere eruptions being underrepresented may result in net under-recording. The estimates of Sigl et al. (2015) suggest that around 80 % of eruptions giving the greatest global aerosol loadings are recorded in Antarctica. Our Antarctic ice core data therefore might underestimate the number of eruptions in each size class by perhaps 20 %, which is somewhat compensated for by the ∼20 % of eruptions from regional volcanoes recorded in Antarctica that are tropospheric (Gautier et al., 2019). To first order, both the over-recording due to tropospheric eruptions and the under-recording of extratropical Northern Hemisphere eruptions should operate in a similar way through time (excluding any effects of changing transport strength discussed above) and across a range of eruption magnitudes. Thus, the shape of the plots of the number of eruptions versus time and of number against sulfur deposition should be unaffected.
Finally, the ice core record in Antarctica is a record of large silicic explosive eruptions (likely mostly M>6.5). A spatial analysis of the LaMEVE database of Quaternary explosive eruptions (Fig. 1 in Brown et al., 2014) shows that the sources of these big eruptions are largely in low and middle latitudes. This spatial bias is a consequence of present-day plate boundary distributions. Tectonic settings conducive to forming large silicic magma reservoirs and characterised by caldera-forming large-magnitude explosive eruptions are typically in low and middle latitudes where deglaciation effects on melt generation are likely to be absent or greatly reduced. There are no known M>7 Quaternary eruptions from a northern high-latitude volcano (>60∘ N) (Brown et al., 2014). Thus, our findings are not necessarily in contradiction to previous findings (such as Huybers and Langmuir, 2009) because the Antarctic record is biased towards silicic explosive eruption in the Southern Hemisphere and tropical regions.
In this study we have extended the study of explosive eruptions recorded at the EDC ice core to 200 ka using a method that should consistently record large volcanic events through time. The record mainly represents large-magnitude explosive eruptions with magnitudes of 6.5 or above. We find no systematic variability through time, though there could be a small effect of transport efficiency manifested in an apparent 20 kyr period that needs to be confirmed in other cores. There is no sign of any increase in eruption frequency at deglaciations. This does not of course negate the likelihood that unloading of ice did cause increased frequencies in regions susceptible to such effects, such as Iceland. However, taking into account the S isotope evidence that most large eruptions recorded at EDC are stratospheric, our record is probably representative for the major events influencing climate through stratospheric sulfate. We cannot rule out an effect from volcanism on the balance of CO2 production and removal at deglaciation (Huybers and Langmuir, 2009), but it would have to operate only through smaller high-latitude eruptions and/or submarine volcanism. Finally, we comment that it is difficult to study volcanism in ice cores over a period longer than 200 kyr until the post-depositional effects leading to artefact peaks are better understood.
The sulfate data on which this paper is based are available from the NCEI palaeoclimate data centre at https://doi.org/10.25921/kgv8-cn35 (Severi et al., 2022); the depths and ages of large volcanic peaks in the EDC ice core that form the basis for Figs. 5–7 are listed at https://doi.org/10.1594/PANGAEA.926087 (Wolff and Severi, 2021).
The age model data, including accumulation rate and thinning factor, are available in the Supplement to Bazin et al. (2013) and in the Pangaea database at https://doi.org/10.1594/PANGAEA.824894 (Bazin et al., 2022).
The code used to identify, sum and count peaks, as well as the input data file, is attached as a Supplement to this paper.
The supplement related to this article is available online at: https://doi.org/10.5194/cp-19-23-2023-supplement.
EWW, AB and RSJS conceived the idea for this paper. MS provided the sulfate data that were analysed by the Firenze laboratory. EWW and SHM studied the ice core data to determine which samples should undergo S isotope analysis. SHM, EAD and LC prepared the samples for S isotope analysis, while AB, HMI and LC carried out those analyses. EWW developed and implemented the sulfate peak identification method and analysed and sensitivity-tested the data. AB and JWBR investigated the spectral properties of the data. RSJS and SHM advised about the nature of the volcanic record, including marine and terrestrial data. RSJS, EWW and AB prepared sections of text, and all authors edited the text.
At least one of the (co-)authors is a member of the editorial board of Climate of the Past. The peer-review process was guided by an independent editor, and the authors also have no other competing interests to declare.
Publisher's note: Copernicus Publications remains neutral with regard to jurisdictional claims in published maps and institutional affiliations.
This work is a contribution to the European Project for Ice Coring in Antarctica (EPICA), a joint European Science Foundation–European Commission (EC) scientific programme funded by the EU and by national contributions from Belgium, Denmark, France, Germany, Italy, the Netherlands, Norway, Sweden, Switzerland and the UK. The main logistic support at Dome C was provided by IPEV and PNRA. This is EPICA publication no. 321. We thank Michael Sigl for help with data on estimated emissions of SO2.
This research has been supported by the Leverhulme Trust (grant RPG-2015-246), by a Royal Society Professorship (grant no. RP/R/180003), and by a Marie Curie Career Integration Grant (CIG14-631752).
This paper was edited by Amaelle Landais and reviewed by Anders Svensson and one anonymous referee.
Barnes, P. R. F., Wolff, E. W., Mader, H. M., Udisti, R., Castellano, E., and Rothlisberger, R.: Evolution of chemical peak shapes in the Dome C, Antarctica, ice core, J. Geophys. Res., 108, 4126, https://doi.org/10.1029/2002JD002538, 2003.
Baroni, M., Savarino, J., Cole-Dai, J. H., Rai, V. K., and Thiemens, M. H.: Anomalous sulfur isotope compositions of volcanic sulfate over the last millennium in Antarctic ice cores, J. Geophys. Res.-Atmos., 113, D20112, https://doi.org/10.1029/2008jd010185, 2008.
Bazin, L., Landais, A., Lemieux-Dudon, B., Toyé Mahamadou Kele, H., Veres, D., Parrenin, F., Martinerie, P., Ritz, C., Capron, E., Lipenkov, V., Loutre, M.-F., Raynaud, D., Vinther, B., Svensson, A., Rasmussen, S. O., Severi, M., Blunier, T., Leuenberger, M., Fischer, H., Masson-Delmotte, V., Chappellaz, J., and Wolff, E.: An optimized multi-proxy, multi-site Antarctic ice and gas orbital chronology (AICC2012): 120–800 ka, Clim. Past, 9, 1715–1731, https://doi.org/10.5194/cp-9-1715-2013, 2013.
Bazin, L., Landais, A., Lemieux-Dudon, B., Toyé Mahamadou Kele, H., Veres, D., Parrenin, F., Martinerie, P., Ritz, C., Capron, E., Lipenkov, V. Y., Loutre, M. F., Raynaud, D., Vinther, B. M., Svensson, A. M., Rasmussen, S. O., Severi, M., Blunier, T., Leuenberger, M. C., Fischer, H., Masson-Delmotte, V., Chappellaz, J. A., and Wolff, E. W.: AICC2012 chronology for ice core EDC, PANGAEA [data set], https://doi.org/10.1594/PANGAEA.824894, 2022.
Brown, S. K., Crosweller, H. S., Sparks, R. S. J., Cottrell, E., Deligne, N. I., Guerrero, N. O., Hobbs, L., Kiyosugi, K., Loughlin, S. C., Siebert, L., and Takarada, S.: Characterisation of the Quaternary eruption record: analysis of the Large Magnitude Explosive Volcanic Eruptions (LaMEVE) database, J. Appl. Volcanol., 3, 5, https://doi.org/10.1186/2191-5040-3-5, 2014.
Burke, A., Moore, K. A., Sigl, M., Nita, D. C., McConnell, J. R., and Adkins, J. F.: Stratospheric eruptions from tropical and extra-tropical volcanoes constrained using high-resolution sulfur isotopes in ice cores, Earth Planet. Sc. Lett., 521, 113–119, https://doi.org/10.1016/j.epsl.2019.06.006, 2019.
Castellano, E., Becagli, S., Jouzel, J., Migliori, A., Severi, M., Steffensen, J. P., Traversi, R., and Udisti, R.: Volcanic eruption frequency over the last 45 ky as recorded in Epica-Dome C ice core (East Antarctica) and its relationship with climatic changes, Global Planet. Change, 42, 195–205, 2004.
Castellano, E., Becagli, S., Hansson, M., Hutterli, M., Petit, J. R., Rampino, M. R., Severi, M., Steffensen, J. P., Traversi, R., and Udisti, R.: Holocene volcanic history as recorded in the sulfate stratigraphy of the European Project for Ice Coring in Antarctica Dome C (EDC96) ice core, J. Geophys. Res., 110, D06114, https://doi.org/10.1029/2004JD005259, 2005.
Cole-Dai, J. and Mosley-Thompson, E.: The Pinatubo eruption in South Pole snow and its potential value to ice-core paleovolcanis records, Ann. Glaciol., 29, 99–105, 1999.
Cole-Dai, J., Ferris, D. G., Kennedy, J. A., Sigl, M., McConnell, J. R., Fudge, T. J., Geng, L., Maselli, O. J., Taylor, K. C., and Souney, J. M.: Comprehensive Record of Volcanic Eruptions in the Holocene (11,000 years) From the WAIS Divide, Antarctica Ice Core, J. Geophys. Res.-Atmos., 126, e2020JD032855, https://doi.org/10.1029/2020JD032855, 2021.
Crick, L., Burke, A., Hutchison, W., Kohno, M., Moore, K. A., Savarino, J., Doyle, E. A., Mahony, S., Kipfstuhl, S., Rae, J. W. B., Steele, R. C. J., Sparks, R. S. J., and Wolff, E. W.: New insights into the ∼74 ka Toba eruption from sulfur isotopes of polar ice cores, Clim. Past, 17, 2119–2137, https://doi.org/10.5194/cp-17-2119-2021, 2021.
Fu, Q., White, R. H., Wang, M., Alexander, B., Solomon, S., Gettelman, A., Battisti, D. S., and Lin, P.: The Brewer-Dobson Circulation During the Last Glacial Maximum, Geophys. Res. Lett., 47, e2019GL086271, https://doi.org/10.1029/2019GL086271, 2020.
Fujita, S., Parrenin, F., Severi, M., Motoyama, H., and Wolff, E. W.: Volcanic synchronization of Dome Fuji and Dome C Antarctic deep ice cores over the past 216 kyr, Clim. Past, 11, 1395–1416, https://doi.org/10.5194/cp-11-1395-2015, 2015.
Gao, C., Robock, A., and Ammann, C.: Volcanic forcing of climate over the past 1500 years: An improved ice core-based index for climate models, J. Geophys. Res., 113, D23111, https://doi.org/10.1029/2008JD010239, 2008.
Gautier, E., Savarino, J., Erbland, J., Lanciki, A., and Possenti, P.: Variability of sulfate signal in ice core records based on five replicate cores, Clim. Past, 12, 103–113, https://doi.org/10.5194/cp-12-103-2016, 2016.
Gautier, E., Savarino, J., Hoek, J., Erbland, J., Caillon, N., Hattori, S., Yoshida, N., Albalat, E., Albarede, F., and Farquhar, J.: 2600-years of stratospheric volcanism through sulfate isotopes, Nat. Commun., 10, 466, https://doi.org/10.1038/s41467-019-08357-0, 2019.
Huybers, P. and Langmuir, C.: Feedback between deglaciation, volcanism, and atmospheric CO2, Earth Planet. Sc. Lett., 286, 479–491, https://doi.org/10.1016/j.epsl.2009.07.014, 2009.
Jouzel, J., Masson-Delmotte, V., Cattani, O., Dreyfus, G., Falourd, S., Hoffmann, G., Nouet, J., Barnola, J. M., Chappellaz, J., Fischer, H., Gallet, J. C., Johnsen, S., Leuenberger, M., Loulergue, L., Luethi, D., Oerter, H., Parrenin, F., Raisbeck, G., Raynaud, D., Schwander, J., Spahni, R., Souchez, R., Selmo, E., Schilt, A., Steffensen, J. P., Stenni, B., Stauffer, B., Stocker, T., Tison, J.-L., Werner, M., and Wolff, E. W.: Orbital and millennial Antarctic climate variability over the last 800 000 years, Science, 317, 793–796, https://doi.org/10.1126/science.1141038, 2007.
Jull, M. and McKenzie, D.: The effect of deglaciation on mantle melting beneath Iceland, J. Geophys. Res.-Solid, 101, 21815–21828, https://doi.org/10.1029/96jb01308, 1996.
Kutterolf, S., Schindlbeck, J. C., Jegen, M., Freundt, A., and Straub, S. M.: Milankovitch frequencies in tephra records at volcanic arcs: The relation of kyr-scale cyclic variations in volcanism to global climate changes, Quaternary Sci. Rev., 204, 1–16, https://doi.org/10.1016/j.quascirev.2018.11.004, 2019.
Legrand, M. and Delmas, R. J.: The ionic balance of Antarctic snow: a 10-year detailed record, Atmos. Environ., 18, 1867–1874, https://doi.org/10.1016/0004-6981(84)90363-9, 1984.
Lin, J., Svensson, A., Hvidberg, C. S., Lohmann, J., Kristiansen, S., Dahl-Jensen, D., Steffensen, J. P., Rasmussen, S. O., Cook, E., Kjær, H. A., Vinther, B. M., Fischer, H., Stocker, T., Sigl, M., Bigler, M., Severi, M., Traversi, R., and Mulvaney, R.: Magnitude, frequency and climate forcing of global volcanism during the last glacial period as seen in Greenland and Antarctic ice cores (60–9 ka), Clim. Past, 18, 485–506, https://doi.org/10.5194/cp-18-485-2022, 2022.
Littot, G. C., Mulvaney, R., Rothlisberger, R., Udisti, R., Wolff, E. W., Castellano, E., de Angelis, M., Hansson, M., Sommer, S., and Steffensen, J. P.: Comparison of analytical methods used for measuring major ions in the EPICA Dome C (Antarctica) ice core, Ann. Glaciol., 35, 299–305, 2002.
Mahony, S. H., Barnard, N. H., Sparks, R. S. J., and Rougier, J. C.: VOLCORE, a global database of visible tephra layers sampled by ocean drilling, Scient. Data, 7, 330, https://doi.org/10.1038/s41597-020-00673-1, 2020.
Marshall, L. R., Schmidt, A., Johnson, J. S., Mann, G. W., Lee, L. A., Rigby, R., and Carslaw, K. S.: Unknown Eruption Source Parameters Cause Large Uncertainty in Historical Volcanic Radiative Forcing Reconstructions, J. Geophys. Res.-Atmos., 126, e2020JD033578, https://doi.org/10.1029/2020JD033578, 2021.
McConnell, J. R., Burke, A., Dunbar, N. W., Köhler, P., Thomas, J. L., Arienzo, M. M., Chellman, N. J., Maselli, O. J., Sigl, M., Adkins, J. F., Baggenstos, D., Burkhart, J. F., Brook, E. J., Buizert, C., Cole-Dai, J., Fudge, T. J., Knorr, G., Graf, H.-F., Grieman, M. M., Iverson, N., McGwire, K. C., Mulvaney, R., Paris, G., Rhodes, R. H., Saltzman, E. S., Severinghaus, J. P., Steffensen, J. P., Taylor, K. C., and Winckler, G.: Synchronous volcanic eruptions and abrupt climate change ∼17.7 ka plausibly linked by stratospheric ozone depletion, P. Natl. Acad. Sci. USA, 114, 10035–10040, https://doi.org/10.1073/pnas.1705595114, 2017.
McConnell, J. R., Sigl, M., Plunkett, G., Burke, A., Kim, W. M., Raible, C. C., Wilson, A. I., Manning, J. G., Ludlow, F., Chellman, N. J., Innes, H. M., Yang, Z., Larsen, J. F., Schaefer, J. R., Kipfstuhl, S., Mojtabavi, S., Wilhelms, F., Opel, T., Meyer, H., and Steffensen, J. P.: Extreme climate after massive eruption of Alaska's Okmok volcano in 43 BCE and effects on the late Roman Republic and Ptolemaic Kingdom, P. Natl. Acad. Sci. USA, 117, 15443–15449, https://doi.org/10.1073/pnas.2002722117, 2020.
Parrenin, F., Petit, J.-R., Masson-Delmotte, V., Wolff, E., Basile-Doelsch, I., Jouzel, J., Lipenkov, V., Rasmussen, S. O., Schwander, J., Severi, M., Udisti, R., Veres, D., and Vinther, B. M.: Volcanic synchronisation between the EPICA Dome C and Vostok ice cores (Antarctica) 0–145 kyr BP, Clim. Past, 8, 1031–1045, https://doi.org/10.5194/cp-8-1031-2012, 2012.
Patris, N., Delmas, R. J., and Jouzel, J.: Isotopic signatures of sulfur in shallow Antarctic ice cores, J. Geophys. Res.-Atmos., 105, 7071–7078, 2000.
Robock, A.: Volcanic eruptions and climate, Rev. Geophys., 38, 191–219, https://doi.org/10.1029/1998RG000054, 2000.
Rougier, J., Sparks, R. S. J., Cashman, K. V., and Brown, S. K.: The global magnitude–frequency relationship for large explosive volcanic eruptions, Earth Planet. Sc. Lett., 482, 621–629, https://doi.org/10.1016/j.epsl.2017.11.015, 2018.
Ruth, U., Barnola, J.-M., Beer, J., Bigler, M., Blunier, T., Castellano, E., Fischer, H., Fundel, F., Huybrechts, P., Kaufmann, P., Kipfstuhl, S., Lambrecht, A., Morganti, A., Oerter, H., Parrenin, F., Rybak, O., Severi, M., Udisti, R., Wilhelms, F., and Wolff, E.: “EDML1”: a chronology for the EPICA deep ice core from Dronning Maud Land, Antarctica, over the last 150 000 years, Clim. Past, 3, 475–484, https://doi.org/10.5194/cp-3-475-2007, 2007.
Savarino, J., Bekki, S., Cole-Dai, J. H., and Thiemens, M. H.: Evidence from sulfate mass independent oxygen isotopic compositions of dramatic changes in atmospheric oxidation following massive volcanic eruptions, J. Geophys. Res., 108, 4671, https://doi.org/10.1029/2003JD003737, 2003a.
Savarino, J., Romero, A., Cole-Dai, J., Bekki, S., and Thiemens, M. H.: UV induced mass-independent sulfur isotope fractionation in stratospheric volcanic sulfate, Geophys. Res. Lett., 30, 2131, https://doi.org/10.1029/2003gl018134, 2003b.
Severi, M., Becagli, S., Traversi, R., and Udisti, R.: Recovering Paleo-Records from Antarctic Ice-Cores by Coupling a Continuous Melting Device and Fast Ion Chromatography, Anal. Chem., 87, 11441–11447, https://doi.org/10.1021/acs.analchem.5b02961, 2015.
Severi, M., Udisti, R., Castellano, E., and Wolff, E. W.: NOAA/WDS Paleoclimatology – EPICA Dome C 203,000 Year High-Resolution FIC Sulfate Data, NOAA National Centers for Environmental Information [data set], https://doi.org/10.25921/kgv8-cn35, 2022.
Sigl, M., McConnell, J. R., Layman, L., Maselli, O., McGwire, K., Pasteris, D., Dahl-Jensen, D., Steffensen, J. P., Vinther, B., Edwards, R., Mulvaney, R., and Kipfstuhl, S.: A new bipolar ice core record of volcanism from WAIS Divide and NEEM and implications for climate forcing of the last 2000 years, J. Geophys. Res.-Atmos., 118, 1151–1169, https://doi.org/10.1029/2012JD018603, 2013.
Sigl, M., Winstrup, M., McConnell, J. R., Welten, K. C., Plunkett, G., Ludlow, F., Buntgen, U., Caffee, M., Chellman, N., Dahl-Jensen, D., Fischer, H., Kipfstuhl, S., Kostick, C., Maselli, O. J., Mekhaldi, F., Mulvaney, R., Muscheler, R., Pasteris, D. R., Pilcher, J. R., Salzer, M., Schupbach, S., Steffensen, J. P., Vinther, B. M., and Woodruff, T. E.: Timing and climate forcing of volcanic eruptions for the past 2,500 years, Nature, 523, 543–549, https://doi.org/10.1038/nature14565, 2015.
Sigl, M., Toohey, M., McConnell, J. R., Cole-Dai, J., and Severi, M.: Volcanic stratospheric sulfur injections and aerosol optical depth during the Holocene (past 11 500 years) from a bipolar ice-core array, Earth Syst. Sci. Data, 14, 3167–3196, https://doi.org/10.5194/essd-14-3167-2022, 2022.
Singarayer, J. S., Valdes, P. J., and Roberts, W. H. G.: Ocean dominated expansion and contraction of the late Quaternary tropical rainbelt, Scient. Rep., 7, 9382, https://doi.org/10.1038/s41598-017-09816-8, 2017.
Svensson, A., Bigler, M., Blunier, T., Clausen, H. B., Dahl-Jensen, D., Fischer, H., Fujita, S., Goto-Azuma, K., Johnsen, S. J., Kawamura, K., Kipfstuhl, S., Kohno, M., Parrenin, F., Popp, T., Rasmussen, S. O., Schwander, J., Seierstad, I., Severi, M., Steffensen, J. P., Udisti, R., Uemura, R., Vallelonga, P., Vinther, B. M., Wegner, A., Wilhelms, F., and Winstrup, M.: Direct linking of Greenland and Antarctic ice cores at the Toba eruption (74 ka BP), Clim. Past, 9, 749–766, https://doi.org/10.5194/cp-9-749-2013, 2013.
Toohey, M. and Sigl, M.: Volcanic stratospheric sulfur injections and aerosol optical depth from 500 BCE to 1900 CE, Earth Syst. Sci. Data, 9, 809–831, https://doi.org/10.5194/essd-9-809-2017, 2017.
Traversi, R., Becagli, S., Castellano, E., Marino, F., Rugi, F., Severi, M., Angelis, M. d., Fischer, H., Hansson, M., Stauffer, B., Steffensen, J. P., Bigler, M., and Udisti, R.: Sulfate Spikes in the Deep Layers of EPICA-Dome C Ice Core: Evidence of Glaciological Artifacts, Environ. Sci. Technol., 43, 8737–8743, https://doi.org/10.1021/es901426y, 2009.
Wallace, P. J. and Edmonds, M.: The Sulfur Budget in Magmas: Evidence from Melt Inclusions, Submarine Glasses, and Volcanic Gas Emissions, Rev. Mineral. Geochem., 73, 215–246, https://doi.org/10.2138/rmg.2011.73.8, 2011.
Watt, S. F. L., Pyle, D. M., and Mather, T. A.: The volcanic response to deglaciation: Evidence from glaciated arcs and a reassessment of global eruption records, Earth-Sci. Rev., 122, 77–102, https://doi.org/10.1016/j.earscirev.2013.03.007, 2013.
Wolff, E. W.: Electrical stratigraphy of polar ice cores: principles, methods, and findings, in: Physics of Ice Core Records, edited by: Hondoh, T., Hokkaido University Press, Sapporo, 155–171, ISBN 4832902822, 2000.
Wolff, E. W. and Severi, M.: Fluxes of largest volcanic peaks in the EDC sulfate record, PANGAEA [data set], https://doi.org/10.1594/PANGAEA.926087, 2021.
Wolff, E. W., Cook, E., Barnes, P. R. F., and Mulvaney, R.: Signal variability in replicate ice cores, J. Glaciol., 51, 462–468, 2005.