the Creative Commons Attribution 4.0 License.
the Creative Commons Attribution 4.0 License.
 | 10 Nov 2023
The Antarctic Ice Core Chronology 2023 (AICC2023) chronological framework and associated timescale for the European Project for Ice Coring in Antarctica (EPICA) Dome C ice core
Amaëlle Landais
Antoine Grisart
Frédéric Parrenin
Frédéric Prié
Roxanne Jacob
Elise Fourré
Emilie Capron
Dominique Raynaud
Vladimir Ya Lipenkov
Marie-France Loutre
Thomas Extier
Anders Svensson
Etienne Legrain
Patricia Martinerie
Markus Leuenberger
Wei Jiang
Florian Ritterbusch
Zheng-Tian Lu
Guo-Min Yang
The EPICA (European Project for Ice Coring in Antarctica) Dome C (EDC) ice core drilling in East Antarctica reaches a depth of 3260 m. The reference EDC chronology, the AICC2012 (Antarctic Ice Core Chronology 2012), provides an age vs. depth relationship covering the last 800 kyr (thousands of years), with an absolute uncertainty rising up to 8000 years at the bottom of the ice core. The origins of this relatively large uncertainty are twofold: (1) the δ18Oatm, and total air content (TAC) records are poorly resolved and show large gaps over the last 800 kyr, and (2) large uncertainties are associated with their orbital targets. Here, we present new highly resolved δ18Oatm, and δ15N measurements for the EDC ice core covering the last five glacial–interglacial transitions; a new low-resolution TAC record over the period 440–800 ka BP (ka: 1000 years before 1950); and novel absolute 81Kr ages. We have compiled chronological and glaciological information including novel orbital age markers from new data on the EDC ice core as well as accurate firn modeling estimates in a Bayesian dating tool to construct the new AICC2023 chronology. For the first time, three orbital tools are used simultaneously. Hence, it is possible to observe that they are consistent with each other and with the other age markers over most of the last 800 kyr (70 %). This, in turn, gives us confidence in the new AICC2023 chronology. The average uncertainty in the ice chronology is reduced from 1700 to 900 years in AICC2023 over the last 800 kyr (1σ). The new timescale diverges from AICC2012 and suggests age shifts reaching 3800 years towards older ages over marine isotope stages (MISs) 5, 11 and 19. But the coherency between the new AICC2023 timescale and independent chronologies of other archives (Italian Lacustrine succession from Sulmona Basin, Dome Fuji ice core and northern Alpine speleothems) is improved by 1000 to 2000 years over these time intervals.
- Article
(9312 KB) - Full-text XML
-
Supplement
(3258 KB) - BibTeX
- EndNote


1.1 Building age scales for deep polar ice cores
1.1.1 Motivation
Deep polar ice cores are unique archives of past climate, and their investigation is valuable to study mechanisms governing the Earth's climate variations. Precise chronologies are key to identifying the successions and lengths of climatic events, along with exploring phase relationships between the external forcing (changes in the Earth's orbit) and the diverse climatic responses (variations in temperature and atmospheric greenhouse gas concentrations). To date ice cores, we need to construct two separate chronologies: one for the ice and one for the younger air trapped in bubbles. Due to the thinning of horizontal ice layers as depth increases, a wide time span of paleoclimatic information is stored within the deepest part of the ice sheet. Therefore, many of the ice core community's ongoing efforts focus on improving deep-ice-core timescales for ice and gas phases, as well as extending them further back in time (Crotti et al., 2021; Oyabu et al., 2022). Ice cores drilled at sites characterized by a high accumulation rate of snow at the surface (10 to 30 cm a−1) can be dated by counting ice layers deposited year after year (Svensson et al., 2008; Sigl et al., 2016). In contrast, East Antarctica sites are associated with very low accumulation rates (1 to 5 cm a−1), which prevent annual layers from being identified and counted. As a consequence, chronologies of ice cores at low-accumulation sites are commonly established using ice flow and accumulation models (Nye, 1959; Schwander et al., 2001), then tied up with chronological and glaciological constraints (Veres et al., 2013; Bazin et al., 2013; Parrenin et al., 2017).
1.1.2 Glaciological modeling
Glaciological modeling has been historically used to date Greenlandic and Antarctic ice cores. A unidimensional ice flow model was first applied to the Camp Century ice core (Dansgaard and Johnsen, 1969) and later to other ice cores such as the ones drilled at EPICA (European Project for Ice Coring in Antarctica) Dome C (EDC) and Dome Fuji (EPICA Community Members, 2004; Parrenin et al., 2007a). First, water isotope (δD or δ18O) measurements provide estimates of past evolution of the accumulation rate of snow and temperature at the surface. Then, an ice flow model (Parrenin et al., 2004) takes as inputs past accumulation together with a vertical velocity–depth profile through the ice sheet to determine the thinning of annual snow/ice layers in time and therefore the ice timescale. This approach is very sensitive to some poorly known parameters including boundary conditions such as bedrock topography, geothermal properties or subglacial sliding. For this reason, the glaciological modeling approach is complemented with chronological constraints (gas or ice age known at certain depth levels).
1.1.3 Chronological constraints derived from measurements
Chronological constraints obtained either by measurement of radionuclides or by synchronization to a curve of reference are established for both ice and gas timescales. For building long chronologies, some time constraints can be obtained from the 10Be series measured in ice. The 10Be cosmogenic nuclide is produced at different rates depending on the solar activity, and its arrival on Earth is modulated by the strength of the Earth's magnetic field (Yiou et al., 1997; Raisbeck et al., 2007; Heaton et al., 2021). Some links hence exist between 10Be flux and precisely dated magnetic events such as the Laschamp excursion, an abrupt decline in the geomagnetic field magnitude occurring at about 41 ka BP and visible as a positive excursion in the 10Be flux records in ice cores (Lascu et al., 2016; Raisbeck et al., 2017). 40Ar measurements in the gas phase of Antarctic ice cores also provide dating constraints for old ice, especially for non-continuous stratigraphic sequences (Yan et al., 2019). 40Ar is produced in solid earth by the radioactive decay of 40K, leading to an increasing concentration of 40Ar in the atmosphere at a rate of 0.066±0.006 ‰ Myr−1 (Bender et al., 2008). Recently, the possibility of measuring 81Kr in ice samples of a few kilograms gave a new absolute dating tool for ice cores (Jiang et al., 2020). 81Kr is a radioactive isotope that is suitable for dating ice cores in the range from 0.03 to 1.3 Ma BP (Ma: million years before 1950), making it perfectly adapted for Antarctic ice core dating (Buizert et al., 2014; Crotti et al., 2021).
To further constrain the oldest ice core chronologies, the so-called “orbital dating” tools are also used. These tools consist of aligning some tracers measured in ice cores to the Earth orbital series, called targets, whose fluctuations in time are accurately calculated from the known variations in orbital parameters (Berger, 1978; Laskar et al., 2011). The synchronization of the orbital tracer with its target provides ice or gas age constraints. So far, three orbital dating tools have been developed: δ18O of O2 (δ18Oatm), and total air content (TAC). The δ18Oatm was typically aligned with the precession parameter (or with the 21 June insolation at 65∘ N) delayed by 5000 years because such a lag between δ18Oatm and its orbital target was observed during the last deglaciation (Shackleton, 2000; Dreyfus et al., 2007). However, variations in the phasing between δ18Oatm and precession have been suspected (Jouzel et al., 2002) and identified since (Bazin et al., 2016). In particular, millennial-scale events (as Heinrich-like events) occurring during deglaciations have been shown to delay the response of δ18Oatm to orbital forcing (Extier et al., 2018a). Because there was a significant unpredictability in the lag between δ18Oatm and its orbital target, a large uncertainty in the δ18Oatm-based tie points (up to 6000 years) was assigned in the construction of the AICC2012 (Antarctic Ice Core Chronology 2012; Bazin et al., 2013). To improve the accuracy of the gas timescale, Extier et al. (2018a) rather aligned the variations in δ18Oatm to the δ18Ocalcite recorded in absolute-dated East Asian speleothems between 640 and 100 ka BP. Indeed, the two records show similar orbital (related to the 21 July insolation at 65∘ N) and millennial variabilities, which may correspond to southward shifts in the Intertropical Convergence Zone (ITCZ) position, themselves linked to Heinrich-like events as supported by the modeling study of Reutenauer et al. (2015).
In parallel, Bender (2002) observed that the elemental ratio of air trapped in the Vostok ice core appears to vary in phase with the 21 December insolation at 78∘ S (Vostok latitude) between 400 and 160 ka BP. Subsequent observations led Bender (2002) to assert that local summer solstice insolation affects near-surface snow metamorphism and that this imprint is preserved as snow densifies in the firn and, later on, affects the ratio measured in air bubbles formed at the lock-in zone. Wiggle matching between and local summer solstice insolation has been used to construct orbital timescales for the Dome Fuji, Vostok and EDC ice cores reaching back 360, 400 and 800 ka BP, respectively, with a chronological uncertainty for each tie point estimated between 250 and 4000 years (Kawamura et al., 2007; Suwa and Bender, 2008; Bazin et al., 2013; Oyabu et al., 2022). Finally, Raynaud et al. (2007) found very similar spectral properties between the TAC record of EDC and the integrated summer insolation (ISI) at 75∘ S obtained by a summation over a year of all daily local insolation above a certain threshold over the last 440 kyr. As for , these similarities may be explained by the insolation imprint in near-surface snow well preserved down to the lock-in zone, where it could affect the air content in deep ice, although the physical mechanisms involved during the snow and firn densification for and TAC are likely different (Lipenkov et al., 2011). Lately, Bazin et al. (2013) made use of TAC to constrain Vostok and EDC ice core chronologies back to 430 ka BP with an uncertainty for each TAC tie point varying between 3000 and 7000 years. Although these three orbital tools complement each other (TAC and inferred ages agree within less than 1000 years between 390 and 160 ka BP for the Vostok ice core; Lipenkov et al., 2011), they hardly ever have been employed together. Plus, they are often associated with large uncertainties (reaching 7000 years), which lie in the choice of the appropriate orbital target, in its alignment with ice core records that can be ambiguous during periods of low eccentricity in the Earth's orbit (leading to low-amplitude insolation variations) and in the poor quality of the signals measured in the deepest section of the cores.
To connect ice and gas timescales, the estimation of the lock-in depth (LID), indicating the lowest depth where the air is trapped in enclosed bubbles, and diffusivity becomes effectively zero (Buizert et al., 2013), is used to calculate the ice–gas age difference. Measurements of δ15N from N2 yield a first estimate of this depth, and the LID can also be calculated with firn densification modeling (Goujon et al., 2003; Bréant et al., 2017).
For many years, each polar ice core was characterized by its singular timescale, which was not naturally consistent with other ice core timescales. To address this issue, other measurements provide relative dating constraints (stratigraphic links), improving the coherency between timescales of ice cores from both hemispheres. The synchronization of globally well-mixed atmospheric methane ice core records gives tie points with an accuracy of a few decades to several centuries (60–1500 years) (Lemieux-Dudon et al., 2010; Epifanio et al., 2020). Climate-independent events, such as large volcanic eruptions, can be observed in ice cores from Greenland and Antarctica via singular patterns of the distribution of sulfate. Identification of these deposits permits the precise synchronization of several ice cores (within 5 to 150 years) (Svensson et al., 2020).
1.1.4 Bayesian dating tools
In order to integrate stratigraphic matching, independent synchronization and absolute dating constraints as well as glaciological modeling to produce coherent ice core chronologies, researchers developed Bayesian dating tools such as Datice (Lemieux-Dudon et al., 2010), IceChrono1 (Parrenin et al., 2015) and Paleochrono (Parrenin et al., 2021). These tools use an inverse method combining all chronological information to provide a coherent age scale for several ice cores. These probabilistic tools adjust prior estimates of ice and gas chronologies built with a glaciological model (background scenario) so that they respect chronological constraints.
Here we focus on the chronology of the EDC deep ice core. The EPICA project provided two cores in East Antarctica, including one at Dome C (EDC). The second (and final) drilling attempt at Dome C gave the 3260 m long EDC99 core, whose drilling was willingly stopped at 15 m above bedrock due to the expected presence of meltwater. EDC furnishes the oldest continuous ice core record so far, covering the last 800 kyr (EPICA Community Members, 2004; Jouzel et al., 2007).
1.2 The AICC2012 chronology
Bazin et al. (2013) and Veres et al. (2013) used the probabilistic dating tool Datice to establish the coherent AICC2012 chronology back to 800 ka BP for five ice cores, including EDC, Vostok, EPICA Dronning Maud Land ice core (EDML), North GReenland Ice core Project (NGRIP) and Talos Dome Ice core (TALDICE). To determine the EDC age scale, they used various orbital dating constraints including 39 tie points attached to a 6000-year uncertainty derived from δ18Oatm tuning to a 5000-year delayed precession between 800 and 300 ka BP, 20 tie points associated with a 4000-year uncertainty from alignment to local summer solstice insolation between 800 and 300 ka BP, and 14 tie points linked to an uncertainty between 3000 and 7000 years using TAC synchronized to integrated summer insolation between 430 and 0 ka BP. However, due to the lack of data for the orbital dating approach, the AICC2012 1σ uncertainty is of 1700 years on average, reaching 8000 years at the bottom of the core. The origins of AICC2012 uncertainty can be divided in the following points: (i) some inherent dissimilarities between δ18Oatm, and TAC series and their curve-shaped orbital target; (ii) discontinuity and poor quality of the and TAC records; (iii) uncertainty in the phasing between δ18Oatm and precession; (iv) poor constraint on the LID scenario due to a disagreement between δ15N data and firn modeling estimates (Bréant et al., 2017).
1.3 The new AICC2023 chronology
It is now possible to address each source of uncertainty thanks to recent advances. (i) Since AICC2012, the δ18Oatm and TAC records have been extended, now covering the last 800 kyr (Extier et al., 2018b). In addition, new highly resolved δ18Oatm and measurements are available over several glacial terminations (TII, III, IV, V and VI) (Grisart, 2023). (ii) Extier et al. (2018a) recently suggested a δ18Oatm-based timescale using δ18Ocalcite of East Asian speleothems as an alternative tuning target to precession. This choice reduces the chronological uncertainty between 640 and 100 ka BP. (iii) Finally, new highly resolved δ15N data covering the terminations II to VI are available (Grisart, 2023). In parallel, firn densification models have been progressively improved, and the model described in Bréant et al. (2017) can be employed to estimate LID evolution in the past when δ15N data are still missing.
In this work, we implement new absolute age constraints spanning the last 800 kyr derived from 81Kr measured in air trapped in the EDC ice core as well as new orbital age constraints obtained by synchronizing up-to-date EDC records with their orbital target. We combine these data with recent volcanic matching and methane record synchronization, which provide additional stratigraphic links, relating EDC to other ice cores over the past 122 kyr (Baumgartner et al., 2014; Svensson et al., 2020). Finally, we propose the new chronology AICC2023 with reduced chronological uncertainties. AICC2023 is recommended as the new official age scale for the EPICA ice cores by the EPICA Scientific Steering Committee (Wolff, 2023).
2.1 Dating strategy
The Paleochrono Python software is a probabilistic dating tool similar to Datice and Icechrono1 with improved mathematical, numerical and programming capacities (Parrenin et al., 2021). The dating strategy of Paleochrono relies on the Bayesian inference of three glaciological functions forming the input background scenario: accumulation rate (A), thinning of annual ice layers (τ) and lock-in depth (LID). The three variables evolve along the ice core depth z and are used to estimate the ice (ψ) and gas (χ) age profiles as follows:
where D is the relative density of the snow/ice and the average value of in the firn when the air particle was at the lock-in depth (this parameter is usually ∼0.7; Parrenin et al., 2012). The age scales are further constrained to respect chronological constraints identified from observations. To specify the credibility of the background scenario for the age scales and the chronological constraints, the glaciological functions (accumulation, thinning and LID) and the chronological information can be mathematically expressed as probability densities, which are presumed to be Gaussian and independent (i.e., decorrelated between them). Thus, the inference is based on the least square optimization method (implying all probability densities are Gaussian). It is numerically solved using the trust region algorithm (assuming that the model is roughly linear around the solution), and the Jacobian of the model is evaluated analytically for an improved computation time. As a result, the best adjustment between the background scenario and chronological observations is found, providing the most probable scenario as a posterior evaluation of the three glaciological functions and hence chronologies for ice and air. For each ice core, the input files for Paleochrono are the following: (i) the background values of the three glaciological functions with depth; (ii) gas and ice stratigraphic links; (iii) gas- and ice-dated horizons, which are tie points derived for one core from absolute and synchronization dating methods; (iv) gas and ice intervals of known durations; and (v) depth difference estimates between the same event recorded in the gas and ice matrix (Δdepth). Specific relative or absolute uncertainties are attached to each of these parameters in each input file.
In this study, we added numerous gas- and ice-dated horizons for EDC as well as an updated background scenario for the LID. Then, to construct a new chronology for the EDC ice core that is consistent with the timescales of the Vostok, TALDICE, EDML and NGRIP ice cores, we followed the same strategy as for the construction of AICC2012. Glaciological background parameters and dating constraints for the Vostok, TALDICE, EDML, NGRIP and EDC drillings are compiled in one run of Paleochrono to obtain AICC2023. The Vostok, TALDICE, EDML and NGRIP background parameters and dating constraints are extracted from Bazin et al. (2013), except for (i) new Vostok gas age constraints determined from the alignment of δ18Oatm and East Asian δ18Ocalcite records as for EDC (see Fig. S10), (ii) new TALDICE background parameters and age constraints from Crotti et al. (2021), and (iii) corrected LID background scenarios for the Vostok and EDML sites (see Fig. S11). In order to prevent any confusion with reference ice core timescales, the new AICC2023 chronology for NGRIP is compelled to respect exactly the layer-counted GICC05 timescale through absolute tie points placed at 1 m intervals over the last 60 kyr (Andersen et al., 2006). For this reason, we did not use the methodology described by Lemieux-Dudon et al. (2015), who implemented layer counting as a constraint on the duration of events in the dating tool, inducing a slight shift (maximum 410 years) in the AICC2012 timescale. The resulting Paleochrono experiment provides the new official chronology AICC2023 for the EDC ice core. The contingent timescales obtained for the four other sites are not the subject of this study but are also provided (see “Data availability” section). We acknowledge the exclusion of the WAIS (West Antarctic Ice Sheet) Divide ice core (WDC) from the construction of the AICC2023 age scale as for the AICC2012 age scale. Over the last 60 kyr, though, we recommend the use of timescales tied to the WAIS Divide 2014 age model (WD2014; Buizert et al., 2015; Sigl et al., 2016). A correspondence between AICC2012, AICC2023 and WD2014 age models based on the volcanic synchronization of WDC and EDC using sulfate data (Buizert et al., 2018) is provided over the 0–58 ka BP period (that is to say for the section above the depth of 915 m for the EDC ice core; see “Data availability” section).
2.2 Analytical method
2.2.1 δ18Oatm, δON2 and δ15N
The measurements of the isotopic and elemental compositions of O2 and N2 were performed by Grisart (2023) at the Laboratory for Sciences of Climate and Environment (LSCE) following the method described by Bréant et al. (2019) and Extier et al. (2018a). The air trapped in the EDC ice core is extracted using the semi-automatic line, which eliminates CO2 and H2O. Samples of 30 to 40 g are prepared in a cold environment (−20 ∘C), their exterior layer (3–5 mm) is removed so that there is no exchange with atmospheric air, and each sample is cut in two replicates. Each day, three ice samples (and replicates) are placed in six flasks, and the atmospheric air is evacuated from the flasks. Samples are then melted and left at ambient temperature for approximately 1 h 30 min in order to extract the air trapped in ice samples. The extracted air is then cryogenically trapped within a dedicated manifold immersed in liquid helium (Bazin et al., 2016). Along the way to the cryogenic trap, the air goes through cold traps to remove CO2 and H2O. Two additional samples containing exterior modern air are processed through the same line every day for calibration and for monitoring the analytical set-up. Lastly, the δ15N, δ18O of O2 and of each sample are measured by a dual-inlet Delta V plus (Thermo Electron Corporation) mass spectrometer.
Classical corrections are applied on the measurements (pressure imbalance, chemical slopes, as per Landais et al., 2003). In addition, δ15N data are used to get the values of atmospheric δ18O of O2 and after gravitational fractionation occurred in the firn so that δ18Oatm=δ18O of and (Landais et al., 2003; Bazin et al., 2016; Extier et al., 2018a). Note that our samples were stored at −50 ∘C after drilling to minimize the gas loss effect. As a consequence, no correction for gas loss was applied (see Sect. S1 in the Supplement), and if gas loss may explain a slight scattering in the data, the peak positions are not affected.
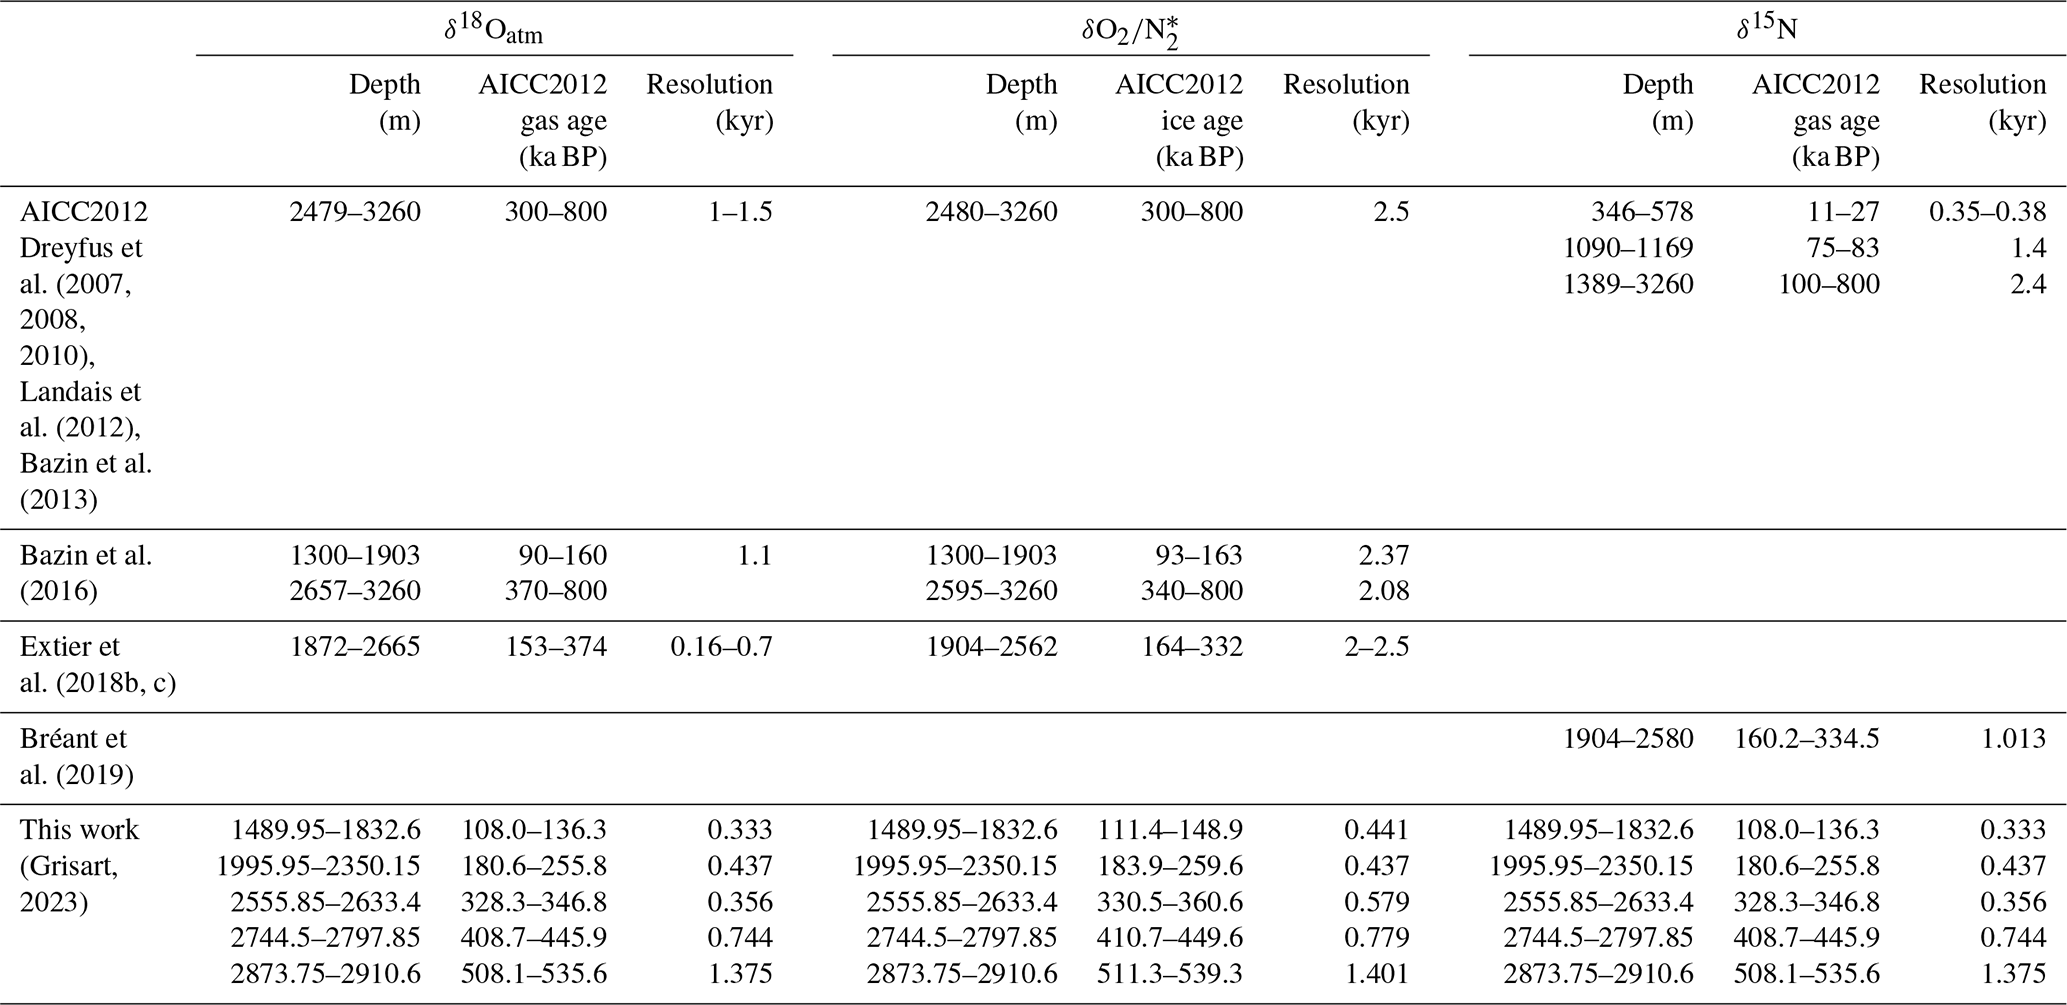
Existing and new EDC data are compiled in Table 1. The dataset's resulting pooled standard deviations for the new measurements are of 0.006 ‰, 0.03 ‰ and 0.4 ‰ for δ15N, δ18Oatm and , respectively.
Table 1Information on isotopic and elemental compositions measured in air trapped in the EDC ice core. * Details on storage and measurement conditions of δON2 are available in Sect. S1 in the Supplement.
2.2.2 Total air content
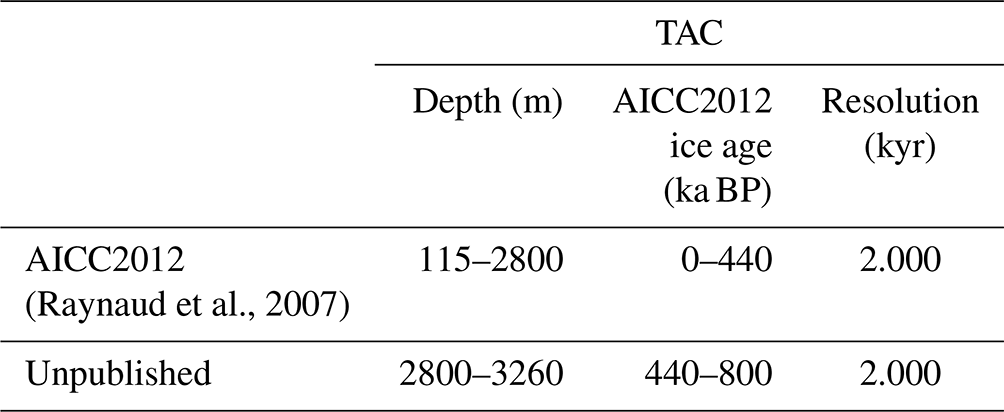
The TAC record was measured in the entire EDC ice core at the IGE (Institute of Environmental Geosciences) following the barometric method first described by Lipenkov et al. (1995). The TAC record measured in the younger part of the core (400–0 ka BP) has been published in Raynaud et al. (2007) (Table 2). TAC estimates need to be corrected for the cut-bubble effect. After correction, the uncertainty in TAC values is of about 1 %, and the analysis replicability is better than 1 %.
2.2.3 81Kr extraction and analysis
The analytical method is the same as described by Crotti et al. (2021). Three 6 kg ice samples are taken from the bottom part of EDC, and a slight shaving (1 mm) of the external layer is performed before processing. The air extraction is performed through a manual extraction line following the protocol described in Tian et al. (2019). The ice sample is placed in a 40 L stainless-steel chamber. The atmospheric air is pumped while the chamber is kept at −20 ∘C. The air is then slowly extracted, passing through a water trap, and compressed in a stainless-steel cylinder. The three cylinders are sent to the University of Science and Technology of China (USTC, Hefei, China) for krypton extraction and analysis. Krypton extraction is performed after the methodology of Dong et al. (2019), who set up an automated system for dual separation of argon and krypton, composed of a titanium getter module followed by a gas-chromatography separator module. The extracted krypton is analyzed by the Atom Trap Trace Analysis (ATTA) instrument set up at the Laser Laboratory for Trace Analysis and Precision Measurement (LLTAPM, USTC, Hefei, China), giving the 81Kr abundance R81 in the sample. R81 is determined by the number of counted 81Kr atoms in the sample as compared to the atmospheric reference. The anthropogenic 85Kr is measured simultaneously with 81Kr to control any present-day air contamination. Here, the 85Kr abundance measured in ice samples is inferior to the detection limit, so contamination has occurred.
From the 81Kr abundance, it is possible to estimate 81Kr radioactive decay and to calculate the ice sample's age. As a noble gas isotope, 81Kr is globally mixed in the atmosphere, and its decay cannot be affected by complex chemical reactions (Lu et al., 2014). The 81Kr half-life () is estimated to be kyr (Baglin, 2008). 81Kr age can be calculated as per the following equation:
The atmospheric abundance of 81Kr is not constant in the past, and its value is corrected using reconstruction of the geomagnetic field intensity (Zappala et al., 2020). The error in 81Kr age estimates is estimated from the statistical error in atom counting, from the uncertainty in 81Kr half-life (inducing a systematic age error) and from the size of the sample (larger sample resulting in a smaller uncertainty).
2.3 Firn model
Firn densification models have been progressively improved over the years (Herron and Langway, 1980; Alley, 1987; Arthern et al., 2010; Ligtenberg et al., 2011; Kuipers Munneke et al., 2015; Oraschewski and Grinsted, 2022). While these models generally explain the evolution of δ15N in time well through changes in the LID, they fail to reproduce values of δ15N in some regions, including coastal areas and cold and low-accumulation sites such as EDC (Capron et al., 2013). This disagreement can be explained by an inaccurate estimate of glacial temperature and accumulation rate at the surface (Buizert, 2021) and/or by the impossibility of tuning empirical firn models to sites with no present-day equivalent in terms of temperature and accumulation rate (Dreyfus et al., 2010; Capron et al., 2013). Recently, the firn model described in Bréant et al. (2017) was developed from the IGE model (Pimienta and Duval, 1987; Barnola et al., 1991; Arnaud et al., 2000; Goujon et al., 2003) by implementing a dependency of the firn densification rate on temperature and impurities. The temperature dependence is added to the classical formulation of the densification rate following an Arrhenius law with an activation energy Q as per , with R the perfect gas constant and T the firn temperature. Rather than using a constant activation energy (Goujon et al., 2003), Bréant et al. (2017) stated that the value of the activation energy should be contingent on the firn temperature value as observed in material science, where the temperature dependency exhibits the predominance of one physical mechanism among others for a material compaction at a specific temperature. Through several sensitivity tests, Bréant et al. (2017) adjusted three values for activation energy in three different temperature ranges to reproduce best the δ15N evolution over the last deglaciation at East Antarctic sites. The firn model also considers that firn densification is facilitated by the dissolution of impurities within the snow (Freitag et al., 2013). If the impurity content in snow (i.e., concentration of calcium ions) is greater than a certain threshold, the densification rate dependence on impurities is traduced by a relationship between the new activation energy Q′ and the concentration of calcium ions [Ca2+]: (Freitag et al., 2013). Bréant et al. (2017) assumed the impurity effect equal for all physical mechanisms and tuned β and f1 constants so that the modeled-δ15N data mismatch is minimized over the last glacial termination at cold East Antarctic sites.
As a consequence, and in addition to our new extensive δ15N dataset, we have chosen to use here the firn model approach of Bréant et al. (2017). In order to make a correct calculation of uncertainties linked to firn modeling at EDC, we ran two tests of the model with and without including the impurity concentration parameter (see Sect. S3.1).
The firn densification model takes as input scenarios of temperature and accumulation rate at the surface. It computes both the LID and the thermal gradient in the firn (ΔT) and then deduces the δ15N with Ω the thermal-fractionation coefficient (Grachev and Severinghaus, 2003). The final δ15N is calculated as δ15N = δ15Ntherm + δ15Ngrav and δ15Ngrav ≃ LID ⋅ (first-order approximation), with g the gravitational acceleration (9.8 m s−2), R the gas constant (8.314 J mol−1 K−1) and T the mean firn temperature (K).
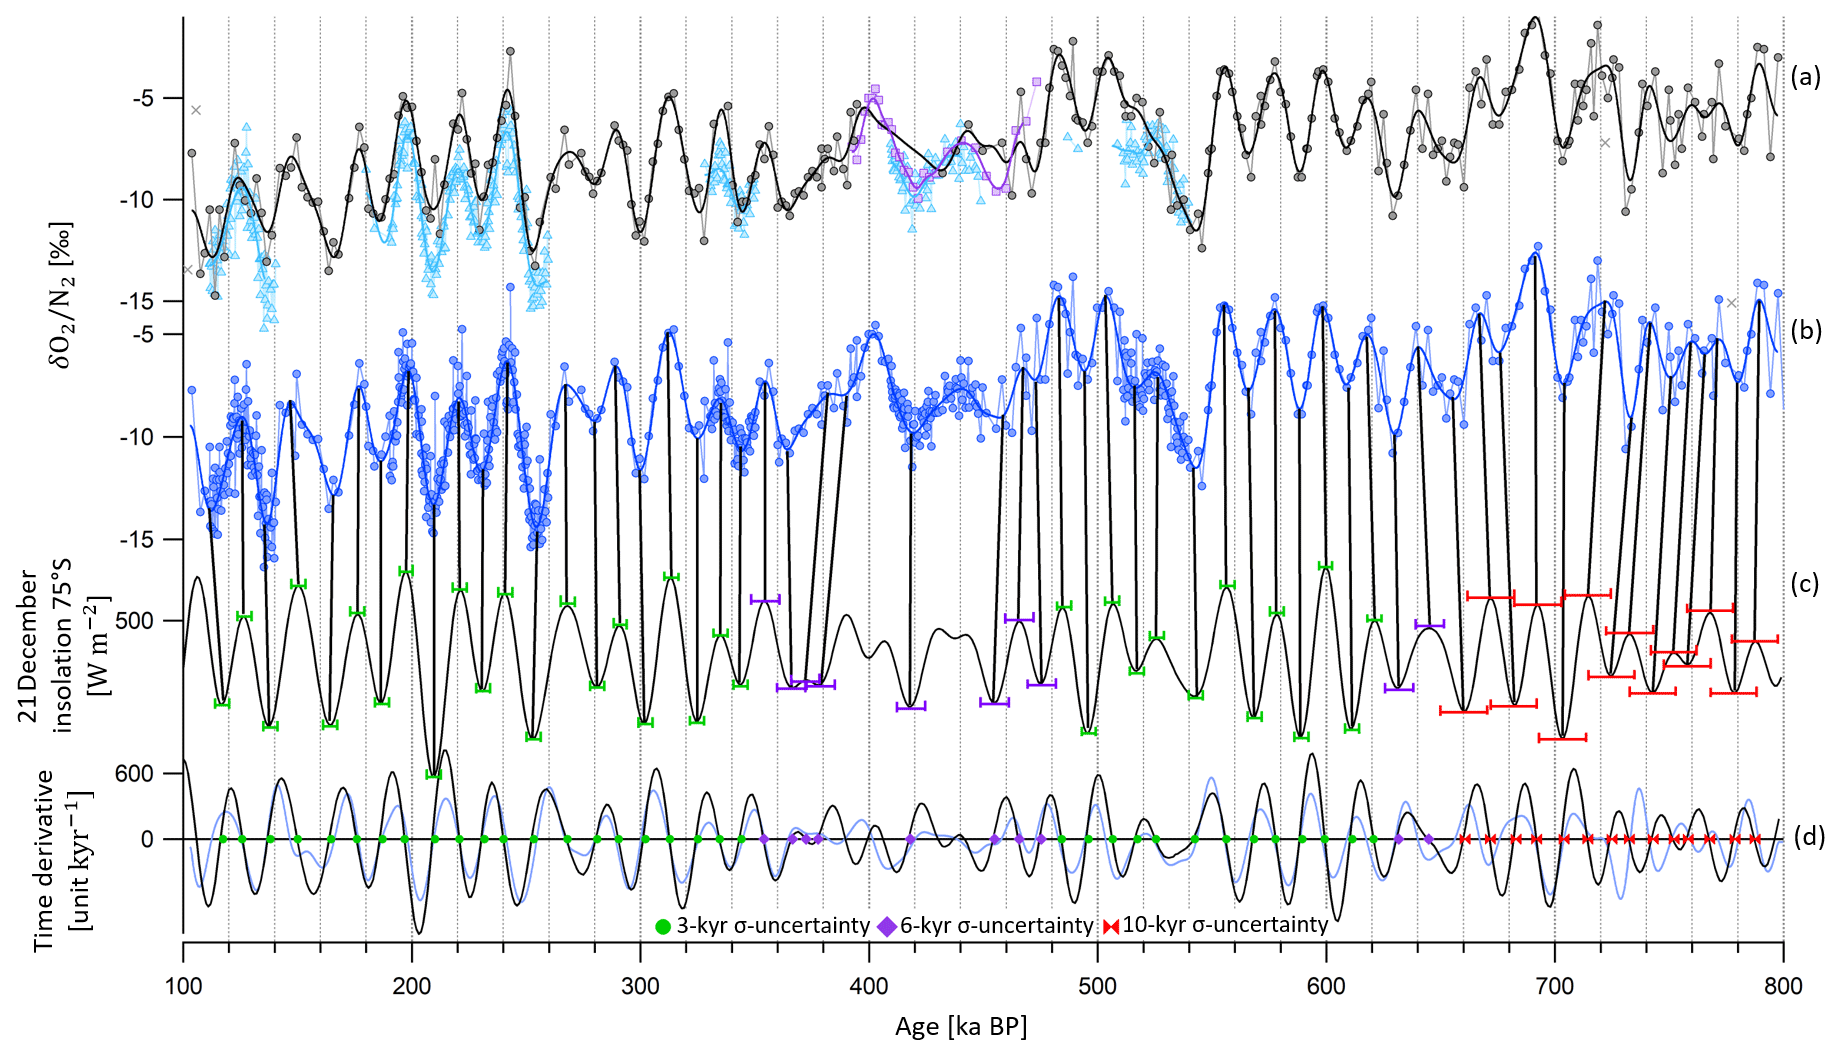
Figure 1Alignment of and insolation between 800 and 100 ka BP. (a) Old raw EDC data between 800 and 100 ka BP (black circles for data of Extier et al., 2018c, and purple squares for data of Landais et al., 2012), outliers (gray crosses) and filtered signal (black and purple lines). New raw EDC data (blue triangles, this study) and filtered signals (blue line). The data are plotted on the AICC2012 ice timescale. Zooms between 270 and 100 ka BP and between 570 and 300 ka BP are shown in Fig. S2. (b) Extrema in the compiled filtered dataset (plain blue line) are identified and matched to extrema in the (c) 21 December insolation at 75∘ S plotted on a reversed y axis and on the age scale given by Laskar et al. (2004) (black line). The peaks are matched by vertical black bars. (d) The zero value in the time derivative of insolation (black line) and of the filtered dataset (blue line) corresponds to extreme values in the signals. The determined tie points between and insolation are depicted by markers on the horizontal line. Green circles are attached to a 3 kyr 1σ uncertainty (horizontal green error bars show 2σ in panel c), purple squares are associated with a 6 kyr 1σ uncertainty (horizontal purple error bars show 2σ in panel c), and red markers are associated with a 10 kyr 1σ uncertainty (horizontal red error bars show 2σ in panel c). Between 390 and 475 ka BP, all extrema are not tuned to the target due to the poor resemblance between the signal and insolation.
3.1 81Kr age constraints
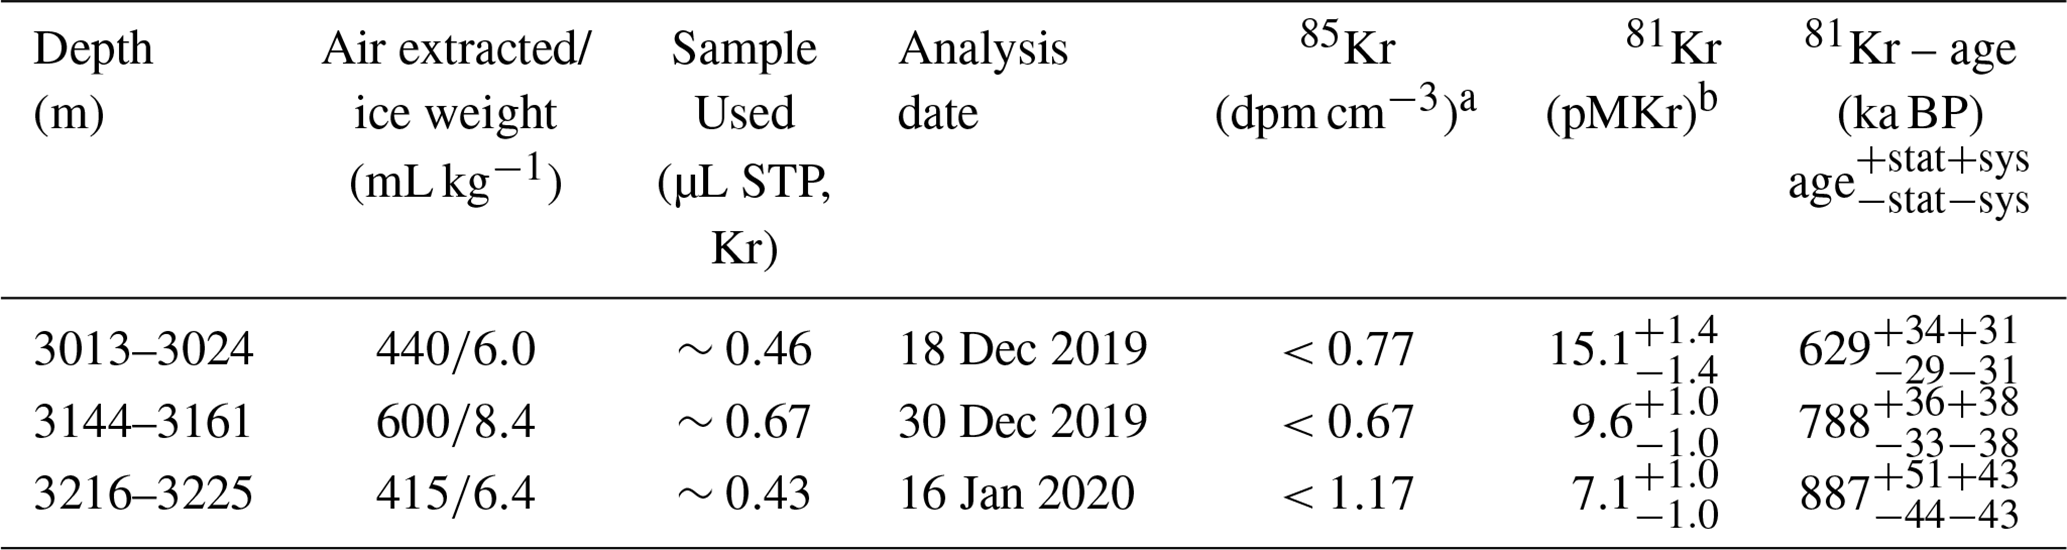
Three ice samples from the bottom part of EDC have been analyzed and provide three age estimates displayed in Table 3: 629, 788 and 887 ka BP, with statistical age uncertainties between 30 and 50 kyr and a 4.8 % systematic error due to the uncertainty in the half-life of 81Kr. The deepest sample suggests the presence of ice older than 800 ka BP below the 3200 m depth level, and further studies would be valuable in exploring whether the stratigraphy of the lowermost EDC section is continuous (Tison et al., 2015), although this is beyond the scope of this work.
Table 3Ice sample details and radio krypton dating results. Reported errors are 1σ errors. Upper limits have a 90 % confidence level. The average 85Kr activity in the Northern Hemisphere is about 75 dpm cm−3 (decays per minute per cubic centimeter) in 2017. The measured 85Kr concentrations are inferior to the detection limit, verifying that no relevant contamination with modern air has occurred. In addition to the statistical error in the 81Kr age from atom counting, a systematic error due to the uncertainty in the half-life of 81Kr is considered. This error would shift the calculated 81Kr ages up or down for all ice samples. a dpm cm−3: decays per minute per cubic centimeter standard temperature and pressure (STP) of krypton (conversion: 100 dpm cm−3 corresponds to 85Kr/Kr = 3.03×10¹¹). b pMKr: percent modern krypton.
3.2 Determination of orbital age constraints using new data
3.2.1
In this work, new highly resolved data on the EDC ice core are presented over terminations II, III, IV, V and VI (Fig. 1). As these novel measurements have been performed on ice samples stored at −50 ∘C, there is little storage effect, and they can directly be merged with the 800 kyr long record of Extier et al. (2018c) (Table 1). The new dataset improves the resolution of the long EDC record, reaching sub-millennial-scale accuracy over marine isotope stages (MISs) 5, 7 and 9 and in particular over MIS 11 and MIS 13, periods of sparsity in the ancient record (Extier et al., 2018c). Although the two datasets agree well over recent periods (last 350 kyr), they show some discrepancies during older periods (between 550 and 375 ka BP; see Fig. 1). Such dissimilarities are observed over MIS 11 (between 424 and 374 ka BP), where the sampling resolution of the previous dataset is particularly low (2500 years). In addition, MIS 11 is a period characterized by a low eccentricity in the Earth orbit, inducing subdued variations in insolation, causing changes of smaller magnitude and leading to a lower signal-to-noise ratio. Data by Landais et al. (2012) (shown by purple squares in Figs. 1 and S2) are consistent with the highly resolved data presented here, supporting the relevance of the new dataset over this period. Over termination VI (from 550 to 510 ka BP), the old dataset continuously increases, while the novel dataset shows a brief maximum at around 525 ka BP followed by a minimum at around 520 ka BP. These newly revealed variations seem in phase with insolation variations, suggesting that the new dataset shows improved agreement with insolation. Still, highly resolved measurements are needed in the lowermost part of the ice core, where noise is significantly altering the temporal signal.
Following a data processing treatment consistent with the method described in Kawamura et al. (2007), the compiled dataset is linearly interpolated every 100 years and then smoothed using a finite-duration impulse response (FIR) filter with a KaiserBessel20 window (cut-off from 16.7 to 10.0 kyr period, 559 coefficients for the 800 kyr long record) designed with the software Igor Pro in order to reject periods inferior to 10 000 years and erase the noise present in the data. Note that using a low-pass (rejecting periods below 15 kyr) or a band-pass filter (keeping periods between 100 and 15 kyr periods, used by Bazin et al., 2013) does not alter the peak positions in the curve (see Fig. S2). The noise is particularly significant for highly resolved data, and without preliminary filtering, it becomes ambiguous to identify the exact peak position (which needs to be subjectively placed on a 1000- to 2000-year interval; see Sect. S2.1).
The filter is then applied to the local summer solstice insolation curve to check that it does not induce the shift in extrema positions by more than 100 years. This condition is verified over the last 800 kyr, except for the peaks located at the endpoints of the record (respectively around 107 and 788 ka BP), which are then not used for tie point determination. Outliers in the raw dataset are discarded if they show an anomaly greater than 3.2 ‰ when compared to the low-pass-filtered signal. Five outliers are rejected out of 294 points. The is interpolated and filtered again after removal of the outliers.
The orbital target chosen is the 21 December insolation at 75∘ S, which is calculated every 100 years over the last 800 kyr (Laskar et al., 2004). The peak positions in the compiled filtered signal and in the summer solstice insolation are detected via an automated method using the zero values of the time derivatives of the and its orbital target. Each maximum is matched to an insolation minimum and each minimum to an insolation maximum. The data treatment and tie point identification method used here are consistent with the approach recently conducted by Oyabu et al. (2022) on a novel 207 kyr long record of the Dome Fuji (DF) ice core.
Some periods, such as between 450 and 350 ka BP (encompassing MIS 11) and older ages (before 600 ka BP), are characterized by a poor resemblance between the signal and the target. For instance, two or three peaks in the insolation curve only correspond, respectively, to one or two peaks in the data. This could be explained by a low eccentricity-induced subdued variability in the insolation target and hence in signal over MIS 11 and by the poor resolution of the measurements before 600 ka BP. In such cases, the uncertainty (1σ) associated with each tie point ranges from 6 to 10 kyr (precession half period), and some extrema in the target are not used to tune the record (5 extrema over MIS 11 out of 63 over the last 800 kyr). Otherwise, seems to evolve in phase with the inverse summer solstice insolation variations, and the tie point uncertainty (1σ) is set at 3 kyr. A 3–4 kyr uncertainty was evaluated by Bazin et al. (2016) on the following arguments. They examined three records from the Vostok, DF and EDC ice cores over MIS 5 and detected some site-specific high-frequency variability that could not be explained by a timescale issue. This observation, along with the presence of a 100 kyr periodicity in the EDC record and the difficulty of identifying mid-slopes and maxima because of a scattering of the signal at the millennial scale, led them to recommend the use of a 3–4 kyr uncertainty. Because our higher-resolution data give the possibility of filtering the signal with more confidence and hence reduces the uncertainty in the identification of tie points, we propose taking a 3 kyr uncertainty. The orbital tuning results in 58 new tie points over the last 800 kyr (displayed in Fig. 1 and compiled in Table S5), replacing the 20 tie points used to constrain AICC2012 between 800 and 300 ka BP that were derived from synchronizing mid-slopes of band-pass-filtered with the insolation (Bazin et al., 2013).
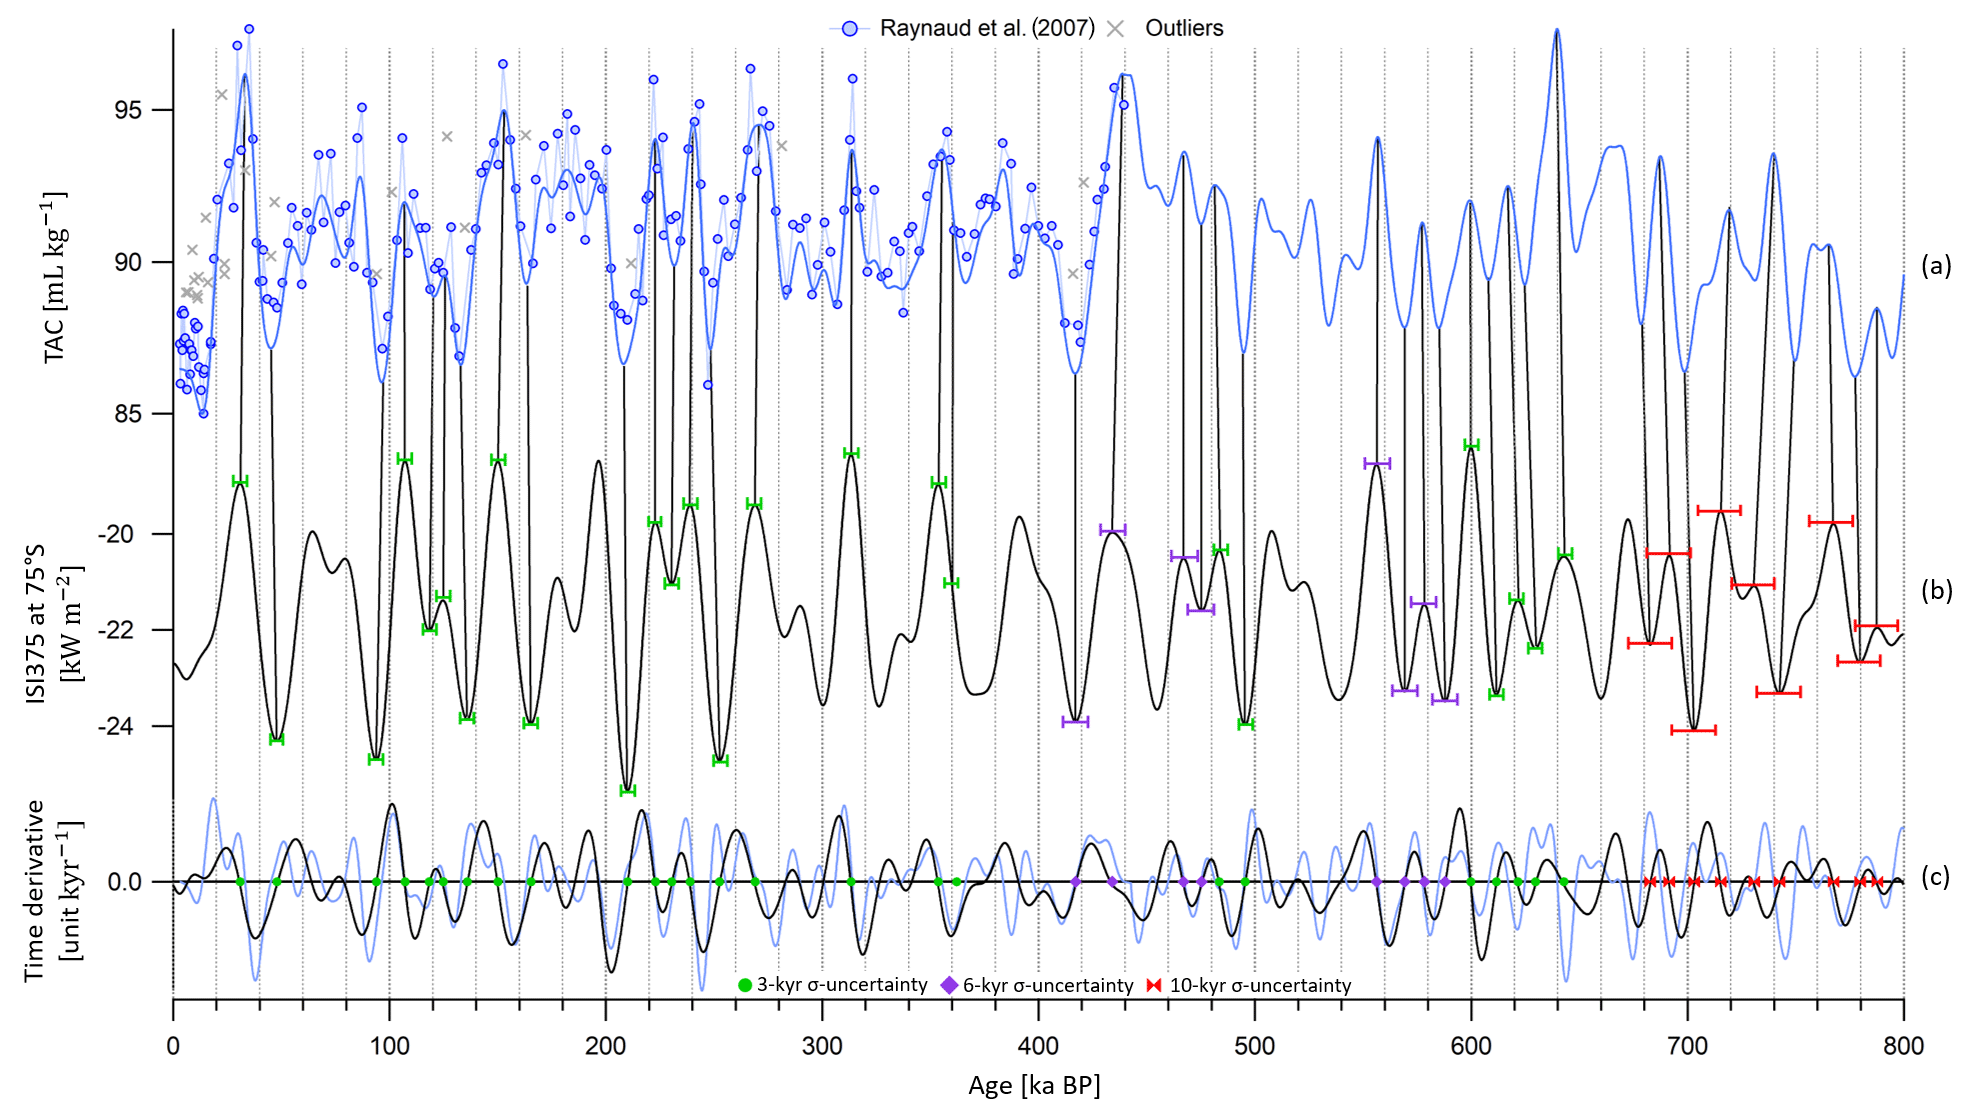
Figure 2Alignment of TAC and insolation between 800 and 0 ka BP. (a) Raw EDC TAC data (blue circles; Raynaud et al., 2007), outliers (gray crosses) and filtered signal (blue line) on the AICC2012 ice timescale. The raw data between 800 and 440 ka BP are not shown here and will be published in a separate study. (b) ISI375 at 75∘ S on a reversed axis. The peaks and mid-slopes are matched by vertical bars. (c) Temporal derivative of insolation (black line) and TAC (blue line). Its zero value corresponds to extreme values in insolation and TAC. The determined tie points between TAC and insolation are depicted by markers on the horizontal line. Green circles are attached to a 3 kyr 1σ uncertainty (horizontal green error bars show 2σ in panel c), purple squares are associated with a 6 kyr 1σ uncertainty (horizontal purple error bars show 2σ in panel c), and red markers are associated with a 10 kyr 1σ uncertainty (horizontal red error bars show 2σ in panel c).
The uncertainty arising from the filter used and from the tie point identification method can be estimated by a comparison of the peak positions identified before and after filtering of the signal with two different methods (see Sect. S2.1). The resulting uncertainty is of 700 years on average (with a standard deviation of 250 years), reaching 2100 years around 230 ka BP.
The new highly resolved data presented here enable a better description of the signal variability and a reduction in the uncertainty associated with orbital tie points.
3.2.2 Total air content
The TAC record is extended over the last 800 kyr with a mean sampling resolution of 2000 years (Fig. 2). The raw data between 800 and 440 ka BP are not shown here and will be published in a separate study. The TAC series shows a good resemblance with the integrated summer insolation (ISI, obtained by a summation over a year of all daily insolation at 75∘ S above a chosen threshold). After comparing the EDC TAC record, within its frequency domain, with ISI curves obtained using different thresholds, the ISI curve calculated for a threshold of 375 W m−2 (ISI375) exhibits the finest spectral agreement with the EDC TAC record over the past 800 kyr. The coherency between the TAC record and ISI is deficient over MIS 11 (between 430 and 370 ka BP) and in the deepest part of the core (prior to 700 ka BP), where the signal-to-noise ratio is low.
Following a data processing treatment consistent with the method described by Lipenkov et al. (2011), the 800 kyr long TAC dataset is interpolated every 100 years and then filtered with a band-pass filter rejecting periods below 15 000 and above 46 000 years (Igor Pro FIR filter with a KaiserBessel20 window, cut-off from 15 to 14 kyr and from 46 to 47 kyr, 559 coefficients). Outliers in the raw TAC dataset are discarded if they show an anomaly greater than 1.0 mL kg−1 (standard deviation of TAC record) when compared to the band-pass-filtered signal. A total of 45 outliers are rejected out of 399 data points (among which 16 outliers are identified between 100 and 0 ka BP). The TAC is interpolated and filtered again after removal of the outliers.
Tie points are mostly determined by matching variation extrema of TAC and integrated summer insolation at 75∘ S (Fig. 2). Indeed, in the case of a non-linear relationship between TAC and insolation, extrema are better indicators of TAC response to insolation forcing. Moreover, filtering the dataset induces a bias in the mid-slope position. The method employed to determine extrema position is the same as for insolation tie points. Only one of the tie points is identified by matching mid-slopes (i.e., derivative extremum) at 362 ka BP rather than minima at 375 ka BP due to the flatness of the insolation minimum, which precludes identification of an accurate tie point. Not all extrema are tuned to the target due to the poor resemblance between the signal and insolation, and 42 unambiguous tie points were kept out of 64 detected by the automated method. The tie point uncertainty finds its origin in the age errors associated with the filtering (∼700 years), tie point identification and outlier rejection (∼900 years). The 1σ uncertainty is evaluated to be 3 kyr when there is good agreement: (i) between the signal and its target, meaning that one peak in ISI375 is reflected by a singular peak in the TAC record, and (ii) between the tie points identified by the automated method and manually (age shift < 1300 years, average value) (see green circles, Fig. 2). A 6 kyr uncertainty (1σ) is attached to the tie points if the latter condition is not respected (age shift > 1300 years) (see purple squares, Fig. 2), and a 10 kyr uncertainty (1σ) (precession half period) is ascribed to the tie points if the ISI375 variations are not reflected by the TAC record, meaning that one peak in ISI375 could be associated with two peaks in the TAC record, or if the signal-to-noise ratio of the TAC record is too large (see red markers, Fig. 2). The choices of filter and orbital target have no significant impact on the chronological uncertainty; a further detailed study is thus beyond the scope of this work.
The orbital tuning results in 42 new tie points over the last 800 kyr (displayed in Fig. 2 and compiled in Table S5). They replace the 14 tie points used to constrain the EDC ice timescale in AICC2012 between 425 and 0 ka BP that were derived by directly matching mid-slope variations in unfiltered TAC and ISI target and attached to an uncertainty varying between 2.9 and 7.2 kyr.
3.2.3 δ18Oatm
In this work, new highly resolved δ18Oatm data on the EDC ice core are presented over terminations II, III, IV, V and VI (Fig. 3). The available δ18Oatm data can be sorted out in two groups: new δ18Oatm data (Grisart, 2023) at high temporal resolution (between 333 and 1375 years; see Table 1) and old measurements compiled by Extier et al. (2018b), characterized by a lower sampling resolution (between 1000 and 1500 years; see Table 1), except between 374 and 153 ka BP (resolution between 160 and 700 years; see Table 1). The new dataset improves the resolution of the long EDC record over MISs 5, 7 and 9 and in particular over MISs 11 and 13, periods of sparsity in the ancient record (Extier et al., 2018b). Although the two datasets agree well globally over the last 800 kyr, the new highly resolved dataset refines the signal between 255.5 and 243 ka BP where a lot of noise is present in the record of Extier et al. (2018b) (see inset in Fig. 3). This noise may be explained by the fact that highly resolved (mean sampling resolution of 381 years) measurements were performed on ice samples stored at −20 ∘C in the compilation by Extier et al. (2018b), while the new measurements are performed on ice stored at −50 ∘C. Therefore, we chose to remove the noisy dataset of Extier et al. (2018b) between 255.5 and 243 ka BP before combining the novel dataset with the remaining 800 kyr long record of Extier et al. (2018b).
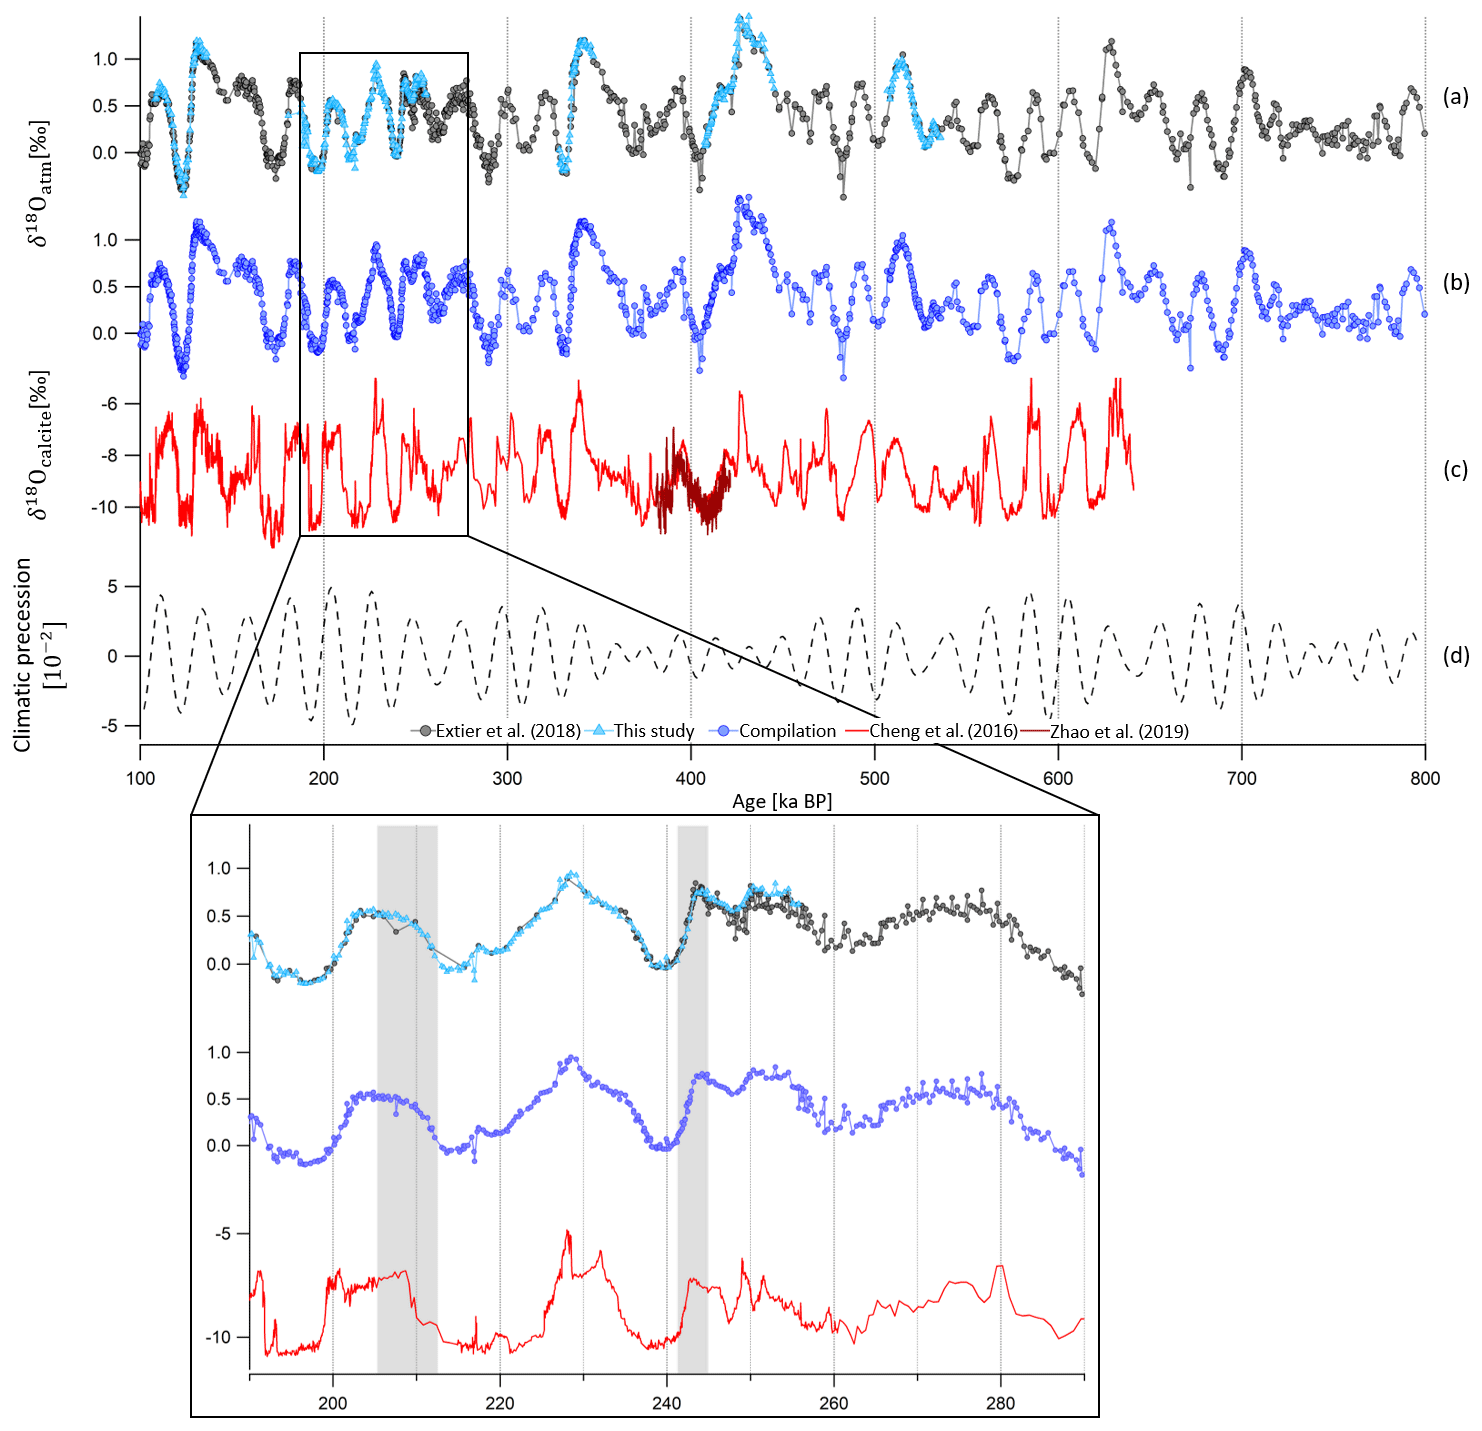
Figure 3Evolution of EDC δ18Oatm record between 800 and 100 ka BP. (a) Old raw EDC δ18Oatm data (black circles; Extier et al., 2018b) and new raw EDC δ18Oatm data (blue triangles; Grisart, 2023) on the AICC2012 gas timescale. (b) Compilation of the two datasets after removal of old measurements between 255.5 and 243 ka BP. (c) δ18Ocalcite composite record from speleothems from Sambao, Dongge, Hulu (red line) and Yongxing (brown line) caves (Cheng et al., 2016; Zhao et al., 2019) on U–Th age scales. (d) Climatic precession from Laskar et al. (2004) delayed by 5000 years. Inset is a zoom between 290 and 190 ka BP. Vertical gray rectangles highlight the improved agreement between new data of Grisart (2023) (blue triangles) and δ18Ocalcite (red line) compared to old data (gray circles) and δ18Ocalcite.
Following the dating approach proposed by Extier et al. (2018a), δ18Oatm and δ18Ocalcite are aligned using mid-slopes of their variations over the last 640 kyr. To do so, the compiled EDC δ18Oatm record and the Chinese δ18Ocalcite signal are linearly interpolated every 100 years and smoothed (25-point Savitzky–Golay) and extrema in their temporal derivative are aligned. It should be specified that synchronizing δ18Oatm and East Asian δ18Ocalcite is not always obvious due to the long residence time of oxygen in the atmosphere (1–2 kyr), which may not be compatible with abrupt δ18Ocalcite variations over glacial inceptions and terminations. In particular, the slow increase in the δ18Oatm record from 370 to 340 ka BP does not resemble the evolution of δ18Ocalcite, which is first moderate then abrupt over the same period (Fig. 4, red area). For this reason, we chose not to use the two tie points identified by Extier et al. (2018a) at 351 and 370.6 ka BP. The new highly resolved data enable the identification of five new tie points and shifting of five tie points that have been determined beforehand by Extier et al. (2018a) (Fig. 4). Between 248 and 244 ka BP, the new δ18Oatm measurements do not coincide with the δ18Ocalcite variations, and we decided to remove the tie point identified by Extier et al. (2018a) at 245.4 ka BP (Fig. 4, red area). Between 480 and 447 ka BP, the δ18Oatm variations are characterized by a low resolution (1.1 kyr) and a weak amplitude, which prevents unambiguous matching of δ18Oatm and δ18Ocalcite. The four tie points identified by Extier et al. (2018a) at 447.3, 449.9, 455.9 and 462.8 ka BP are thus rejected (Fig. 4, red area). The remaining 39 tie points defined by Extier et al. (2018a) are preserved and used here to constrain the EDC gas age. Their uncertainty (1σ) varies between 1.1 and 7.4 kyr.
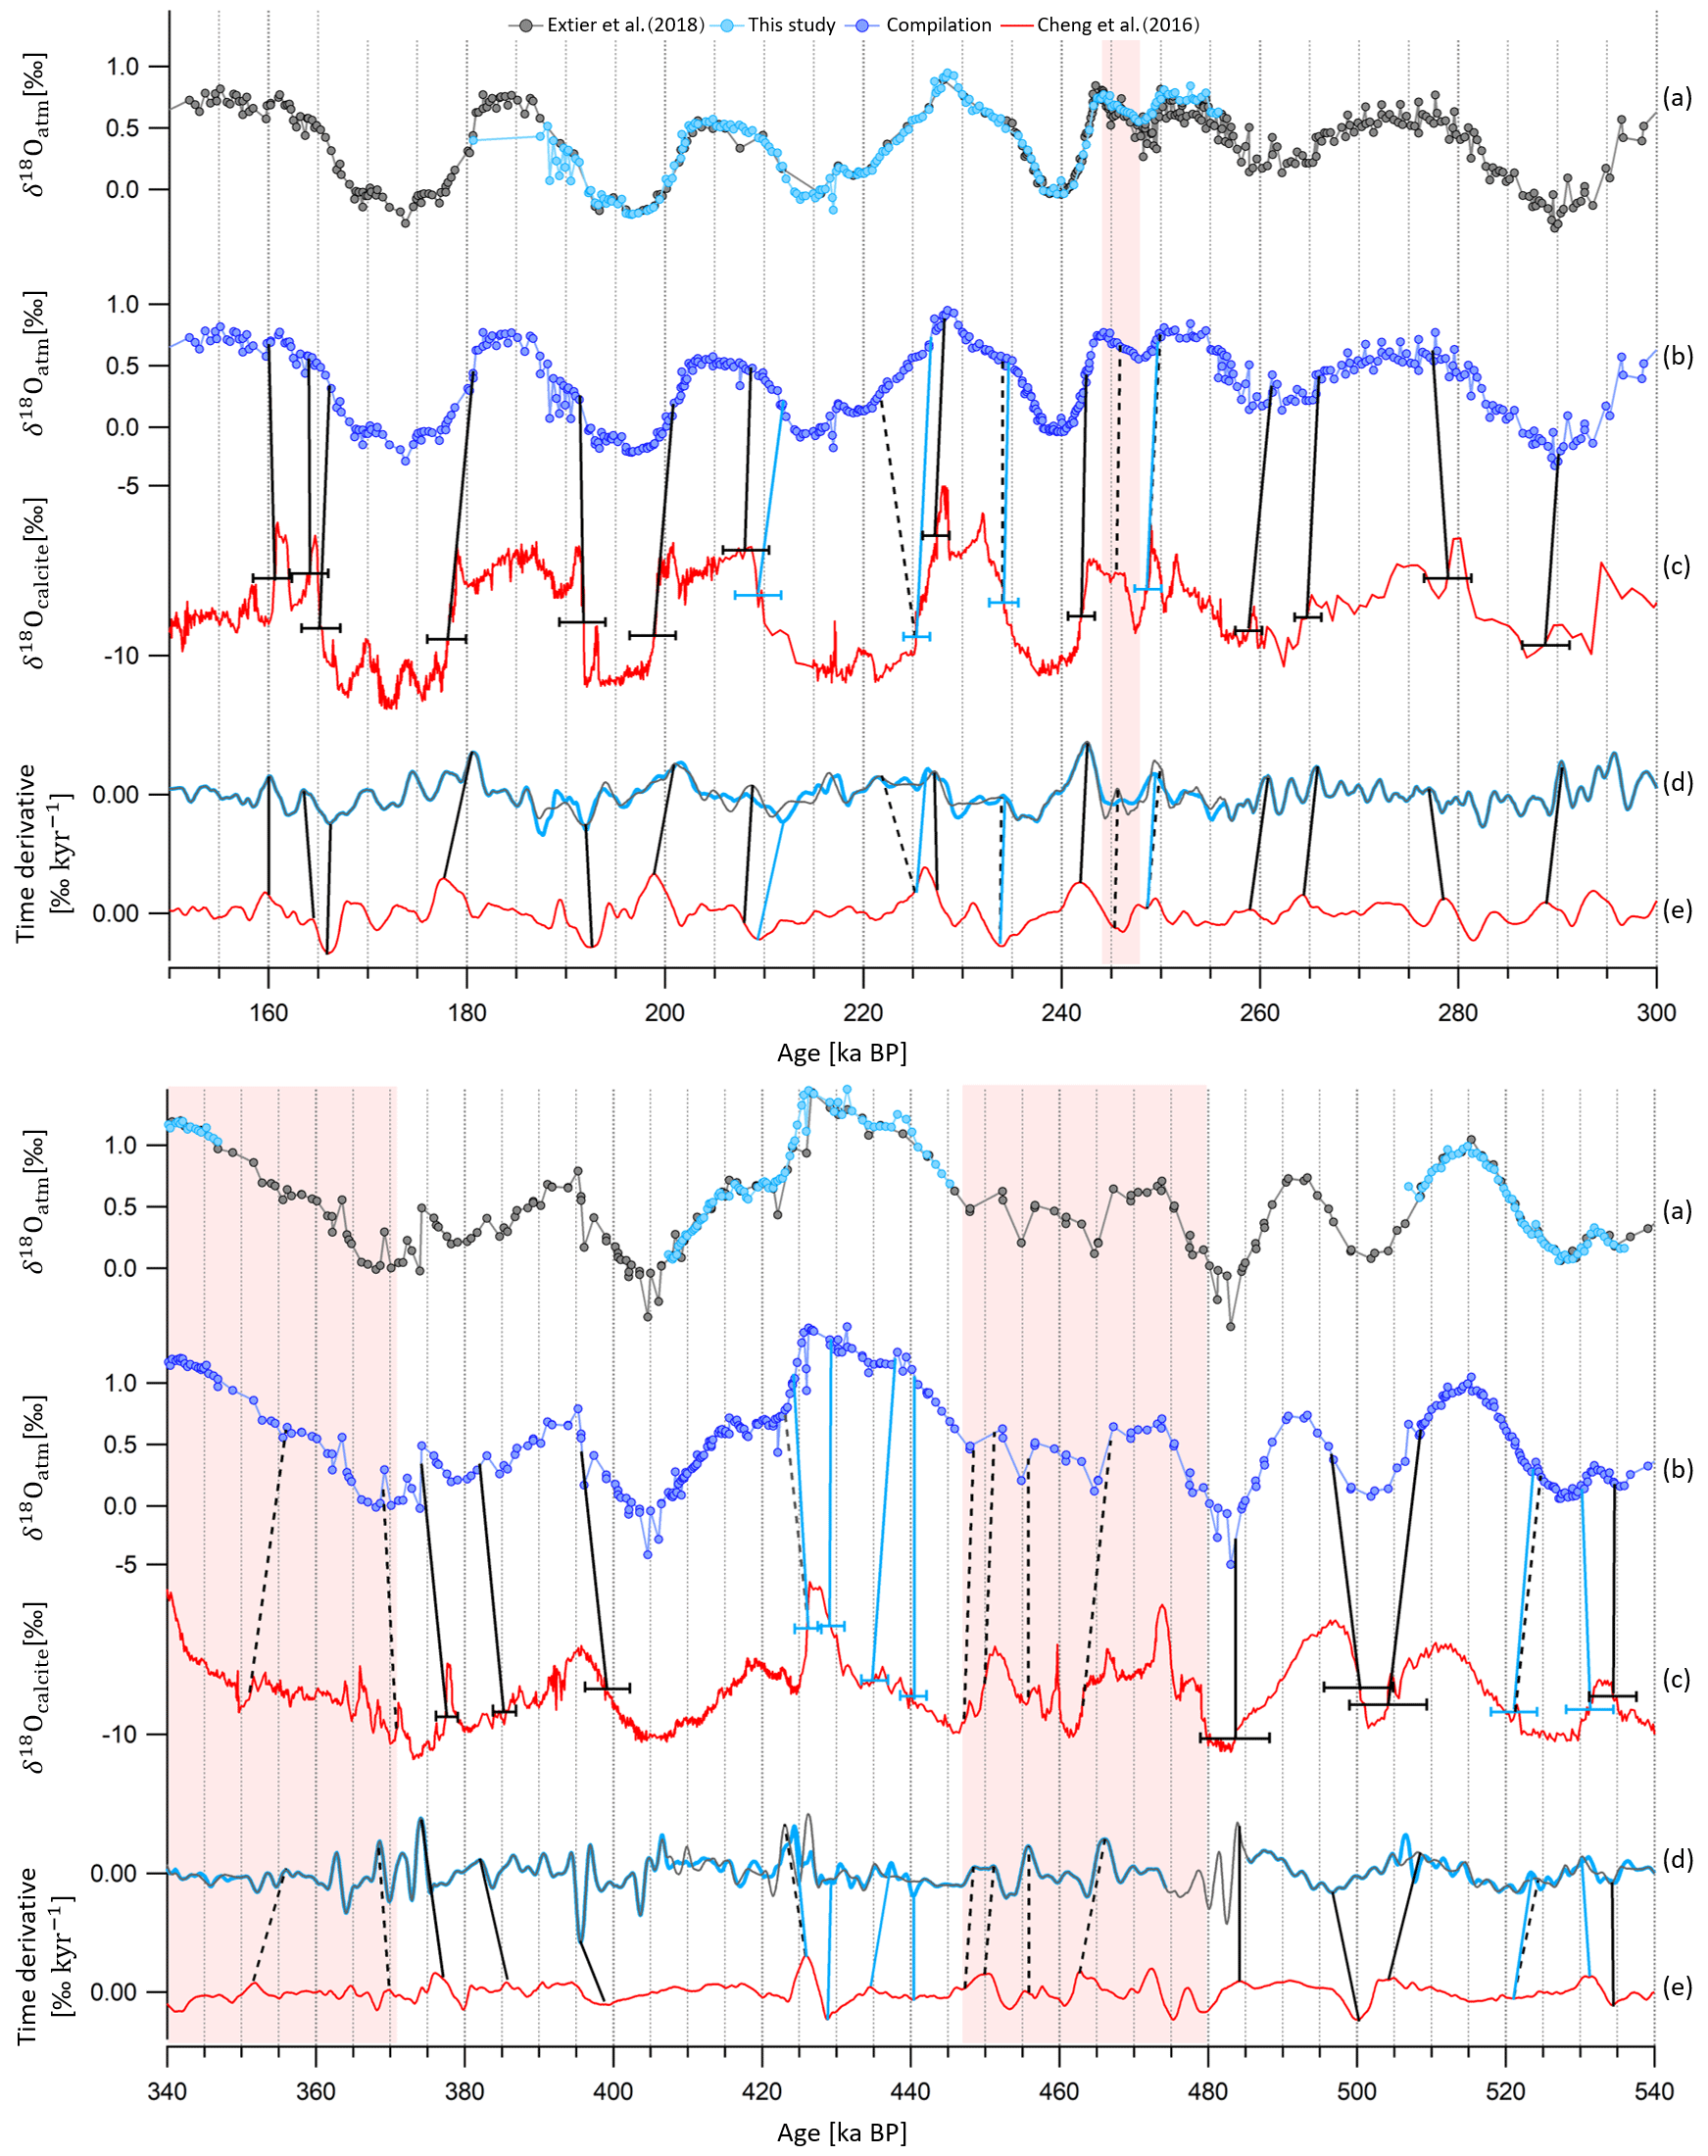
Figure 4Alignment of EDC δ18Oatm and Chinese δ18Ocalcite records over time periods where new tie points are defined. (a) New and old EDC δ18Oatm datasets on the AICC2012 gas age scale. (b) Compiled EDC δ18Oatm. (c) Chinese δ18Ocalcite on U–Th age scale (Cheng et al., 2016). (d) Temporal derivatives of compiled EDC δ18Oatm (blue curve) and of the old δ18Oatm dataset (black curve). (e) Temporal derivative of Chinese δ18Ocalcite (red curve). Extrema in temporal derivatives are matched. Tie points represented by vertical black bars are determined by Extier et al. (2018a), and those by vertical blue bars are determined by this study. Both are used in the AICC2023 chronology. Dashed vertical bars show tie points identified by Extier et al. (2018a) that are not used in AICC2023; 2σ uncertainties attached to the tie points are shown by the horizontal error bars in panel c). Vertical red areas frame periods of lacking resemblance between δ18Oatm and δ18Ocalcite variations.
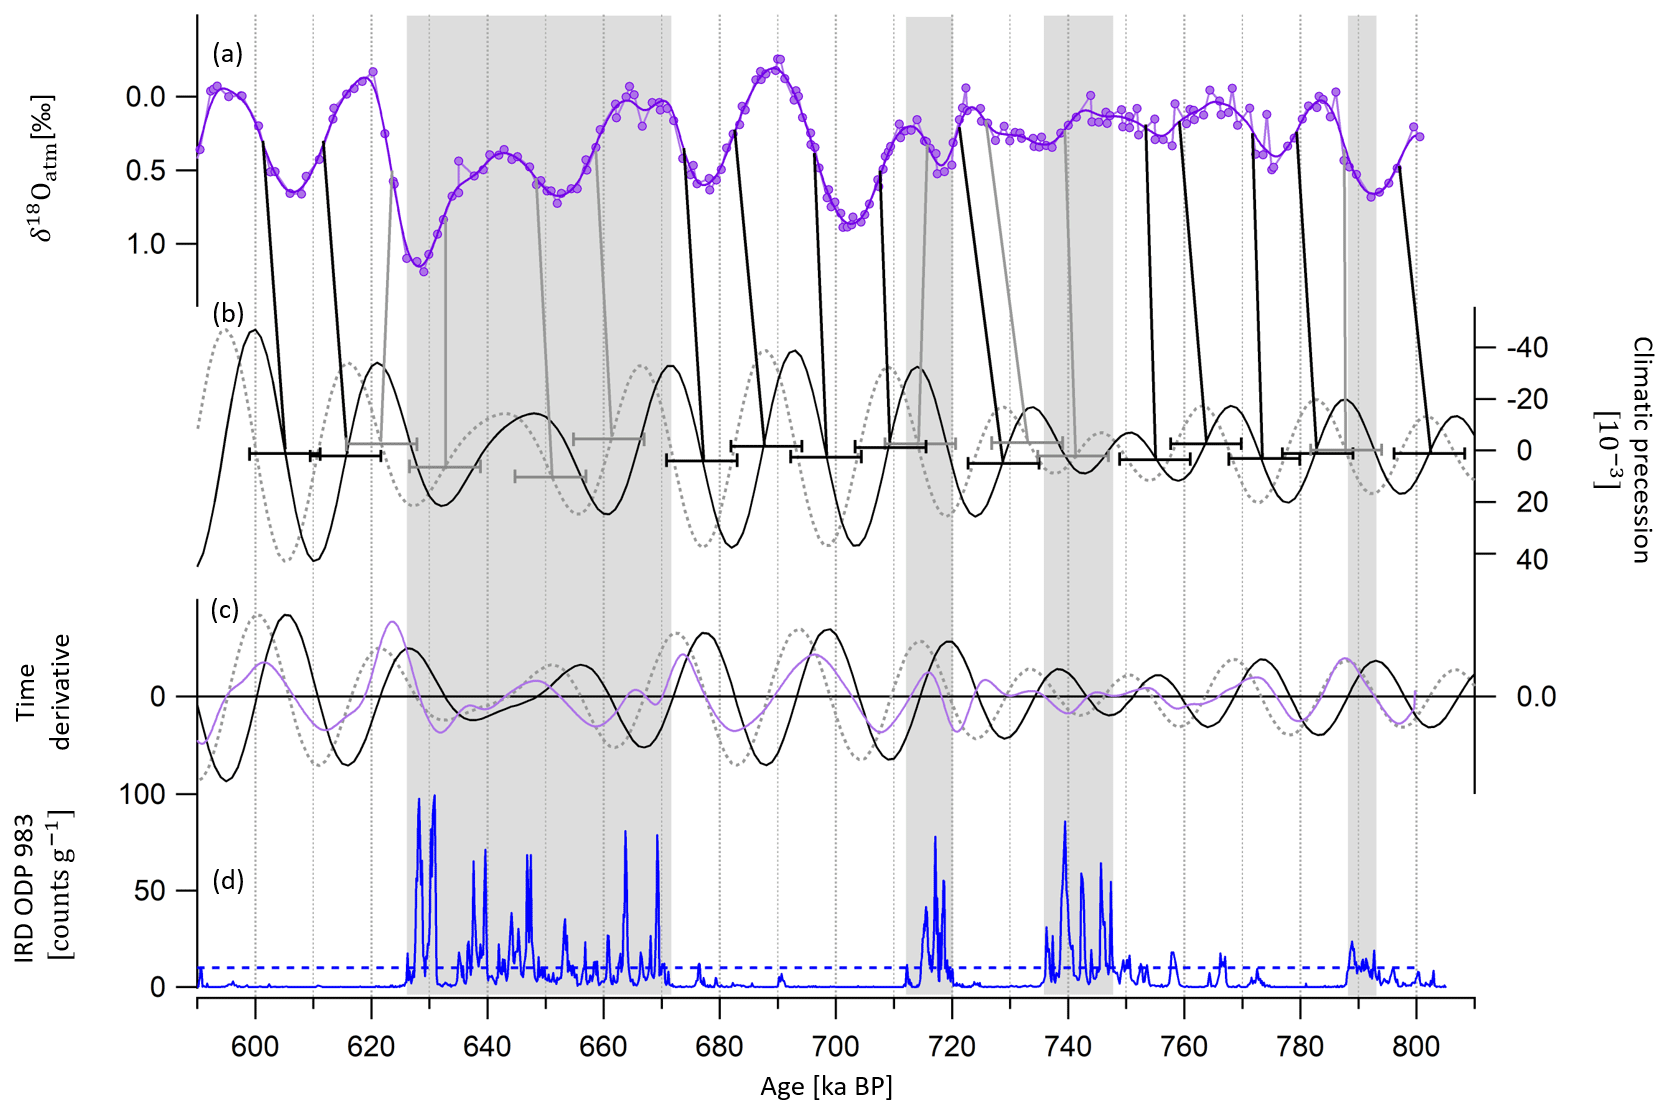
Figure 5Alignment of EDC δ18Oatm and climatic precession between 810 and 590 ka BP. (a) Compiled EDC δ18Oatm on the AICC2012 gas timescale. (b) Precession delayed by 5000 years (dashed gray line) and not delayed (black line) (Laskar et al., 2004). (c) Temporal derivative of precession (black line), delayed precession (dotted gray line) and the compiled δ18Oatm record (plain purple line). (d) Ice-rafted debris at ODP983 site (North Atlantic Ocean, southwest of Iceland) by Barker et al. (2019, 2021). The gray rectangles indicate periods where IRD counts are greater than the 10 counts per gram threshold shown by the dotted horizontal blue line. Vertical gray bars illustrate new tie points between EDC δ18Oatm and delayed precession mid-slopes (i.e., derivative extrema) when IRD counts are greater than the threshold. Vertical black bars illustrate new tie points between EDC δ18Oatm and precession mid-slopes (i.e., derivative extrema) when no Heinrich-like events are shown by the IRD record. The 12 kyr 2σ uncertainty attached to the tie points is shown by the horizontal error bars in panel (b).
Between 810 and 590 ka BP, the δ18Oatm–δ18Ocalcite dating uncertainty becomes larger than 6 kyr, and no East Asian speleothem δ18Ocalcite records are available before 640 ka BP. Over this time interval, we updated the following approach of Bazin et al. (2013): EDC δ18Oatm and 5 kyr delayed climatic precession are synchronized using mid-slopes of their variations. However, from the findings of Extier et al. (2018a), δ18Oatm should rather be aligned to precession without delay when no Heinrich-like events occur. Indeed, δ18Oatm is sensitive to both orbital- and millennial-scale variations in the low-latitude water cycle (Landais et al., 2010; Capron et al., 2012), and Heinrich-like events occurring during deglaciations delay the response of δ18Oatm to orbital forcing through southward ITCZ shifts (Extier et al., 2018a). We thus chose to align δ18Oatm to precession when no ice-rafted debris (IRD) peak is visible in the studied period in the ODP983 record (Barker et al., 2019, 2021) and keep a 5 a delay when IRD peaks are identified. This results in shifting 12 tie points of Bazin et al. (2013) by 5000 years towards older ages (Fig. 6). The eight remaining tie points of Bazin et al. (2013) that coincide with peaks in the IRD record are kept (Fig. 6). To confirm the validity of our approach, we tested three methodologies to align δ18Oatm and precession over well-dated periods when δ18Oatm–δ18Ocalcite matching was done (see Sect. S2.2.2). These tests support our approach, but in order to account for potential errors associated with this tuning method (Oyabu et al., 2022), a 6 kyr uncertainty (1σ) is attributed to the δ18Oatm-derived tie points over the period between 810 and 590 ka BP.
A total of 69 new δ18Oatm tie points are determined over the last 810 kyr (displayed in Figs. 4 and 5 and compiled in Table S5). They replace the 39 tie points used to constrain the EDC gas timescale in AICC2012 between 800 and 363 ka BP (Bazin et al., 2013). The age constraints are attached to an uncertainty varying between 1.1 and 7.4 kyr, which is the sum of the uncertainties in the speleothem 230Th dating, the δ18Oatm response to orbital forcing (1 kyr) and the δ18Oatm–δ18Ocalcite matching (0.5 kyr). The same alignment method is applied between Vostok δ18Oatm (Petit et al., 1999) and Chinese δ18Ocalcite, and 36 new tie points are determined (see Sect. S4.1.2), replacing the 35 tie points used to constrain the Vostok gas timescale in AICC2012.
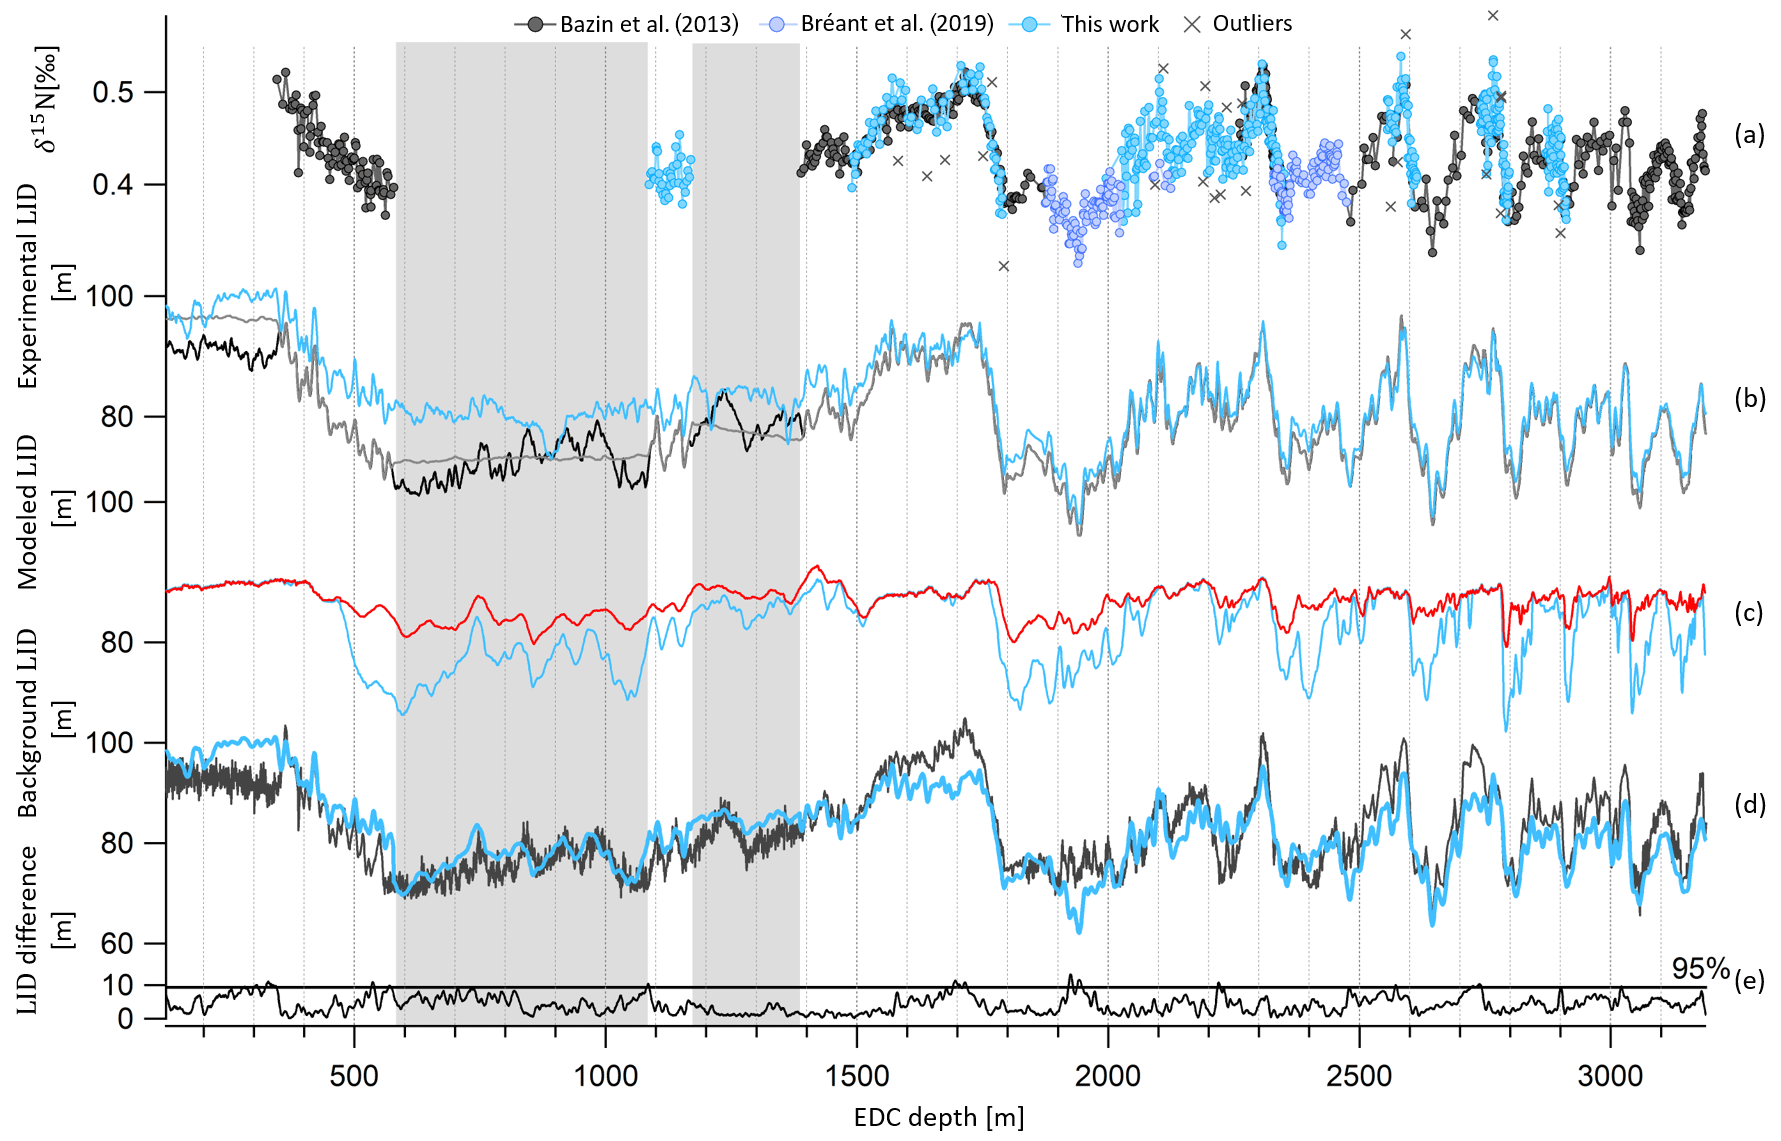
Figure 6EDC δ15N record and past LID evolution as a function of EDC depth. (a) New and highly resolved δ15N dataset (blue circles), dataset of Bréant et al. (2019) (purple circles), old dataset (black circles) and outliers (rejection criterion of 1σ) (gray crosses). (b) LID calculated as per LID ≃ δ15N for three cases: (1) δ15Ngrav=δ15N with the δ15N record constructed by interpolation between data when no data are available (gray), (2) δ15Ngrav=δ15N with the δ15N record constructed by normalization of the δD record when no data are available (black ), (3) δ15N with δ15Ntherm estimated by the firn model (Bréant et al., 2017) and the δ15N record constructed by interpolation between data when no data are available (blue). (c) Modeled LID with impurity concentration (blue) and without impurity concentration (red). (d) Background scenarios of LID used to construct AICC2012 (black) and inputs in Paleochrono to obtain AICC2023 (blue). (e) Absolute difference between prior LID of AICC2012 and AICC2023. The gray line separates the top 5 % values from the rest. The gray rectangles cover areas when no δ15N data are available.
Finally, there was a redundancy in the dating of the bottom part of the EDC ice core in AICC2012, where both δ18Oatm orbital tie points and 10Be peaks corresponding to the Matuyama–Brunhes geomagnetic reversal event were used. Indeed, the two 10Be dating constraints at 780.3 and 798.3 ka BP were directly derived from the δ18Oatm orbital dating and not obtained independently (Dreyfus et al., 2008). We thus decided to remove the 10Be age constraints.
3.3 Background scenario of LID
In this work, new highly resolved δ15N data in the EDC ice core are presented over terminations II, III, IV, V and VI (Fig. 6a). The available δ15N data can be sorted out in two groups: δ15N measured by Grisart (2023) and Bréant et al. (2019) at high temporal resolution (between 333 and 1375 years; see Table 1) and the older measurements (Bazin et al., 2013) used to estimate LID in AICC2012, characterized by a lower sampling resolution (between 1400 and 2400 years; see Table 1). The measurements of Bazin et al. (2013) and Bréant et al. (2019) have been shifted down by 0.04 ‰ to account for calibration errors. The new dataset permits the extension of the record by around 1100 m and between 1700 and 2500 m and improvement in the resolution over terminations II to VI.
Outliers are discarded if they show an anomaly greater than 0.045 ‰ when compared to the smoothed record (Savitzky–Golay algorithm with 25 points). This results in the rejection of 25 data points out of 475 measurements for the new dataset (Fig. 6). The two δ15N datasets are merged, and the compiled record is interpolated every 100 years. Then, assuming that the firn is solely a diffusive zone (i.e., no convection layer at the top) at EDC during the last 800 kyr, in agreement with current observations (Landais et al., 2006), past LID is calculated as per the first-order estimate of the barometric equation:
with T the temperature at EDC estimated from combined measurements of ice δ18O and δD after correction of the influence of the seawater δ18O (Landais et al., 2021).
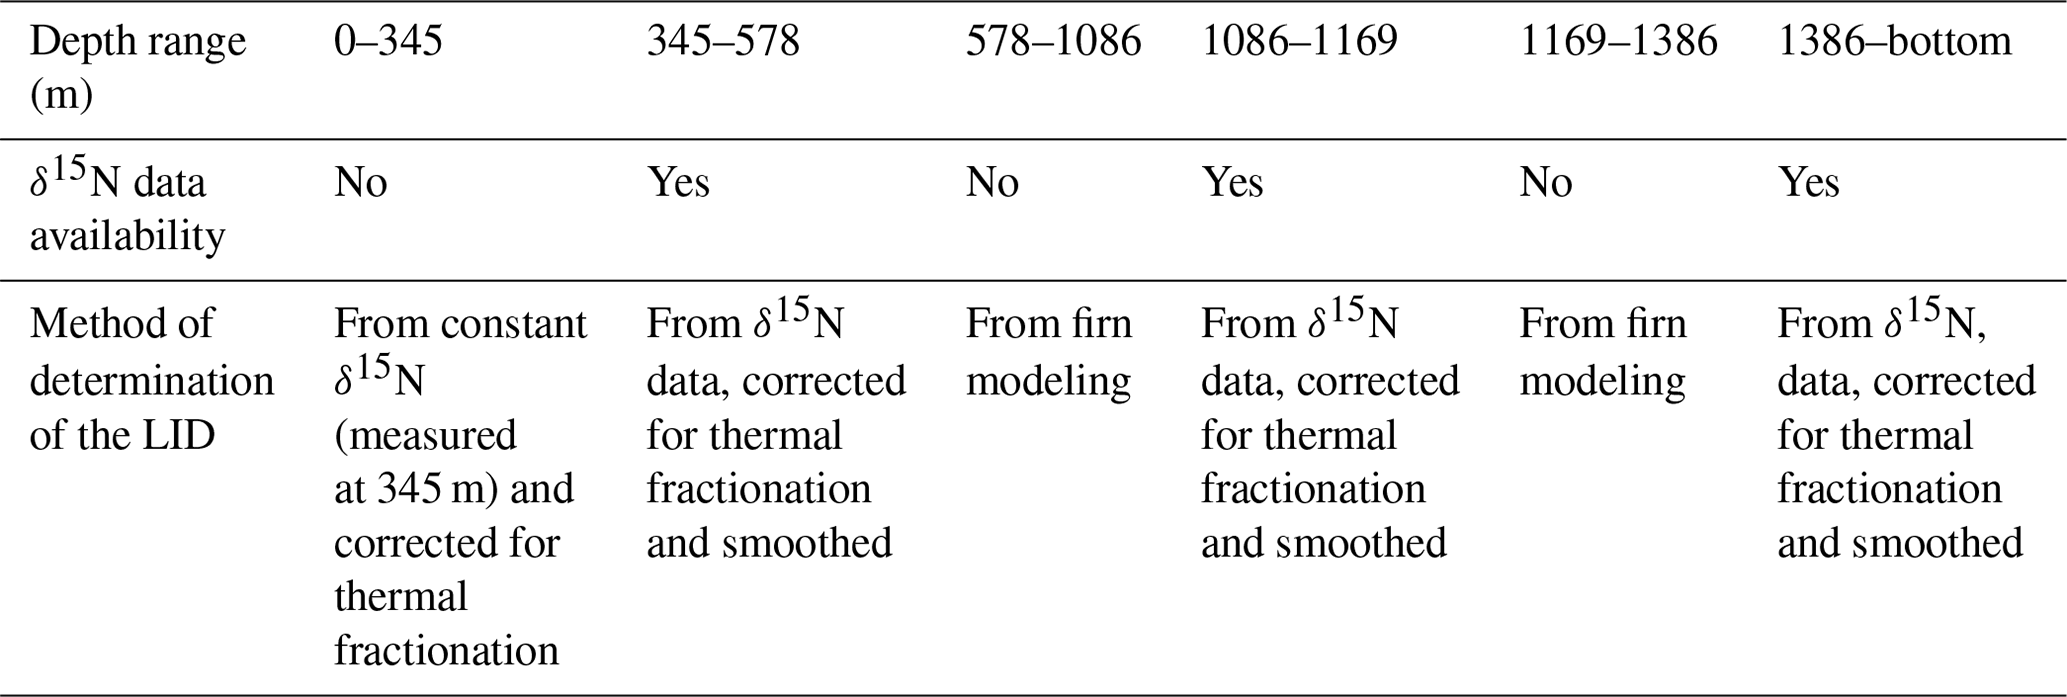
Table 4Method of determination of the background LID scenario according to the EDC depth range.
In the absence of a large thermal gradient within the firn (mostly present in Greenlandic ice cores during Dansgaard–Oeschger events), δ15N is mainly modulated by gravitational fractionation of N2 molecules occurring from the surface down to the lock-in zone, and δ15N measured in bubbles hence approximately reflects the LID (Severinghaus et al., 1996; Landais et al., 2006) and δ15Ngrav≃δ15N in Eq. (5) (gray and black lines in Fig. 6b). To account for a small temperature gradient in the firn in the Antarctic ice core, the thermal-fractionation term δ15Ntherm can be estimated by the firn model (Bréant et al., 2017). Past LID is then calculated as per Eq. (5) with δ15Ngrav=δ15N − δ15Ntherm (blue curve in Fig. 6b). Thermal fractionation represents a maximum correction of 4.2 m to the LID at EDC.
When δ15N measurements are not available, Bazin et al. (2013) used a synthetic δ15N signal based on the correlation between δ15N and δD to estimate the LID background scenario at Dome C (black curve in Fig. 6b). Indeed, for different low-accumulation Antarctic sites, it has been observed that δ15N and δD are well correlated over the last termination on a coherent timescale (Dreyfus et al., 2010; Capron et al., 2013). Since then, Bréant et al. (2019) presented new high-resolution EDC measurements of δ15N extending the signal over termination III (around 2300 m, 250 ka BP). Their study unveiled the anatomy of this atypical deglaciation: the interplay between Heinrich-like events and the bipolar seesaw mechanism induced a strong warming of Antarctic temperature, resulting in divergent δ15N and δD records. Therefore, using δD to construct a synthetic δ15N scenario should be done carefully. For this reason, the firn densification model described in Bréant et al. (2017) is employed to estimate EDC LID evolution in the past when δ15N data are missing, rather than using the δ15N–δD relationship, as was done for AICC2012. After different sensitivity tests, we chose to keep the parameterization preferred by Bréant et al. (2017) (i.e., firn densification activation energy depending on the temperature and the impurity concentration) as it is believed to give the most probable evolution of LID over the last 800 kyr (see Sect. S3.1).
The final background LID scenario is calculated as a function of EDC depth (Table 4, Fig. 6d). It has been smoothed using a Savitzky–Golay algorithm (25 points) and then provided as an input file to Paleochrono.
The other necessary input files for Paleochrono, accumulation (A) and thinning (τ) background scenarios, are the same as in Bazin et al. (2013). A is estimated from water isotopes (Parrenin et al., 2007b) and τ from unidimensional ice flow modeling (Parrenin et al., 2007a).
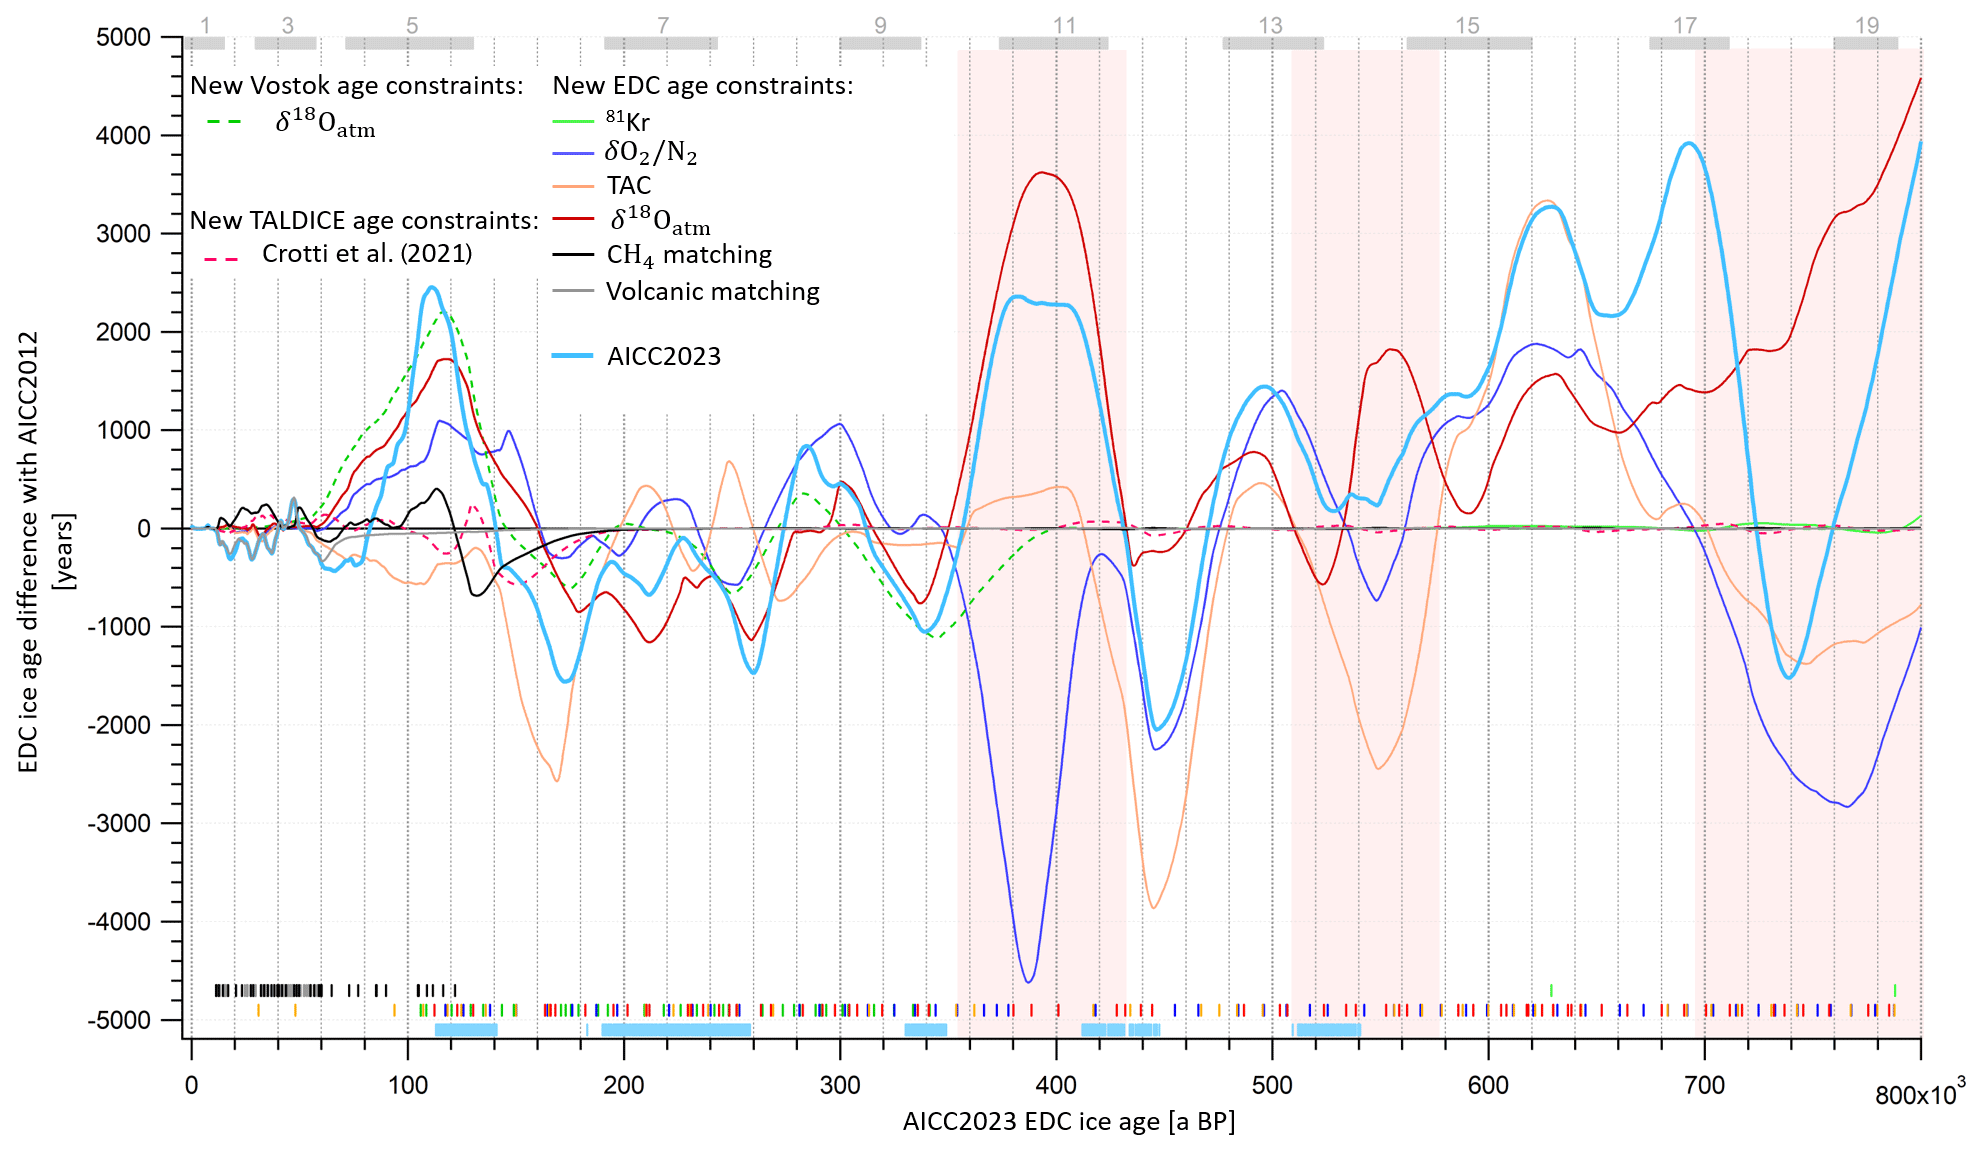
Figure 7EDC ice age difference between AICC2012 and different test chronologies obtained with Paleochrono over the last 800 kyr. The ice age difference is calculated as per test chronology − AICC2012. Two test chronologies are obtained by addition of either new Vostok δ18Oatm–δ18Ocalcite age constraints (dotted green line) or stratigraphic and absolute TALDICE constraints between 470 and 129 ka BP from Crotti et al. (2021) (dotted red line). The other “test chronologies” are constructed by replacing AICC2012 constraints by either (1) 81Kr (green); (2) (purple); (3) TAC (orange); (4) δ18Oatm (red); (5) CH4 tie points with NGRIP, EDML, TALDICE and Vostok (black); or (6) volcanic matching points with EDML and NGRIP (gray). Vertical bars represent the corresponding age horizons. AICC2023 is obtained by implementing the new constraints all together (light-blue line). Vertical light-blue bars show new data collected by Grisart (2023) and presented in this work. The three largest inconsistencies between , TAC and δ18Oatm chronologies are shown by red areas. Gray rectangles indicate interglacials from MIS 19 to MIS 1.
3.4 New stratigraphic links between the EDC and other ice cores
EDC can be linked to other ice cores via ice and gas stratigraphic links identified during abrupt climate changes recorded in Greenlandic and Antarctic ice cores. To establish AICC2012, Bazin et al. (2013) used 255 gas stratigraphic tie points coming from the matching of CH4 (or δ15N when CH4 is not available at NGRIP) or δ18Oatm variations between EDC, EDML, Vostok, NGRIP and TALDICE. Here we revise some of these tie points using the synchronization of CH4 series of EDC, Vostok and TALDICE to up-to-date, highly resolved records from EDML and NGRIP ice cores over the last interglacial offset and the last glacial period (Baumgartner et al., 2014). From 122 to 10 ka BP, Baumgartner et al. (2014) identified 39 stratigraphic links between EDML and NGRIP by matching mid-points of the CH4 abrupt changes with a precision of 300 to 700 years. When they also detected such rapid variations in lower-resolution CH4 records of the TALDICE, Vostok and EDC ice cores, they extended the stratigraphic links to the five ice cores but assigned them a larger uncertainty (up to 1500 years). AICC2012 was further constrained by 534 ice stratigraphic links identified from volcanic matching and synchronization of cosmogenic isotopes between the five ice cores. Here we replace some of the stratigraphic links between NGRIP, EDML and EDC by highly resolved volcanic matching points (Svensson et al., 2020). The application of volcanic proxies and annual layer counting helped them identify large volcanic eruptions that left a specific signature in both Greenland and Antarctica. Such a signature is defined by sulfate patterns (indicating singular volcanic events separated by the same time interval in ice cores from both poles). Their study spotted 82 large bipolar volcanic eruptions over the second half of the last glacial period (from 60 to 12 ka BP), providing as many ice stratigraphic links synchronizing EDC with EDML and EDML with NGRIP within a small relative uncertainty (i.e., ranging from 1 to 50 years, 12 years on average). Between 43 and 40 ka BP, five cosmogenic tie points associated with the Laschamp geomagnetic excursion (Raisbeck et al., 2017) replace the volcanic matching over this period (Svensson et al., 2013), shifting the tie points by ∼30 years.
4.1 New AICC2023 chronology
4.1.1 Impact of absolute age constraints
A large uncertainty is linked with 81Kr dating; therefore 81Kr age estimates do not significantly change the chronology (maximum 200 years) (Fig. 7). 81Kr age estimates are systematically older than the new timescale (by 25 to 36 kyr; see Fig. 8). This observation could also indicate an undervaluation of 81Kr half-life.
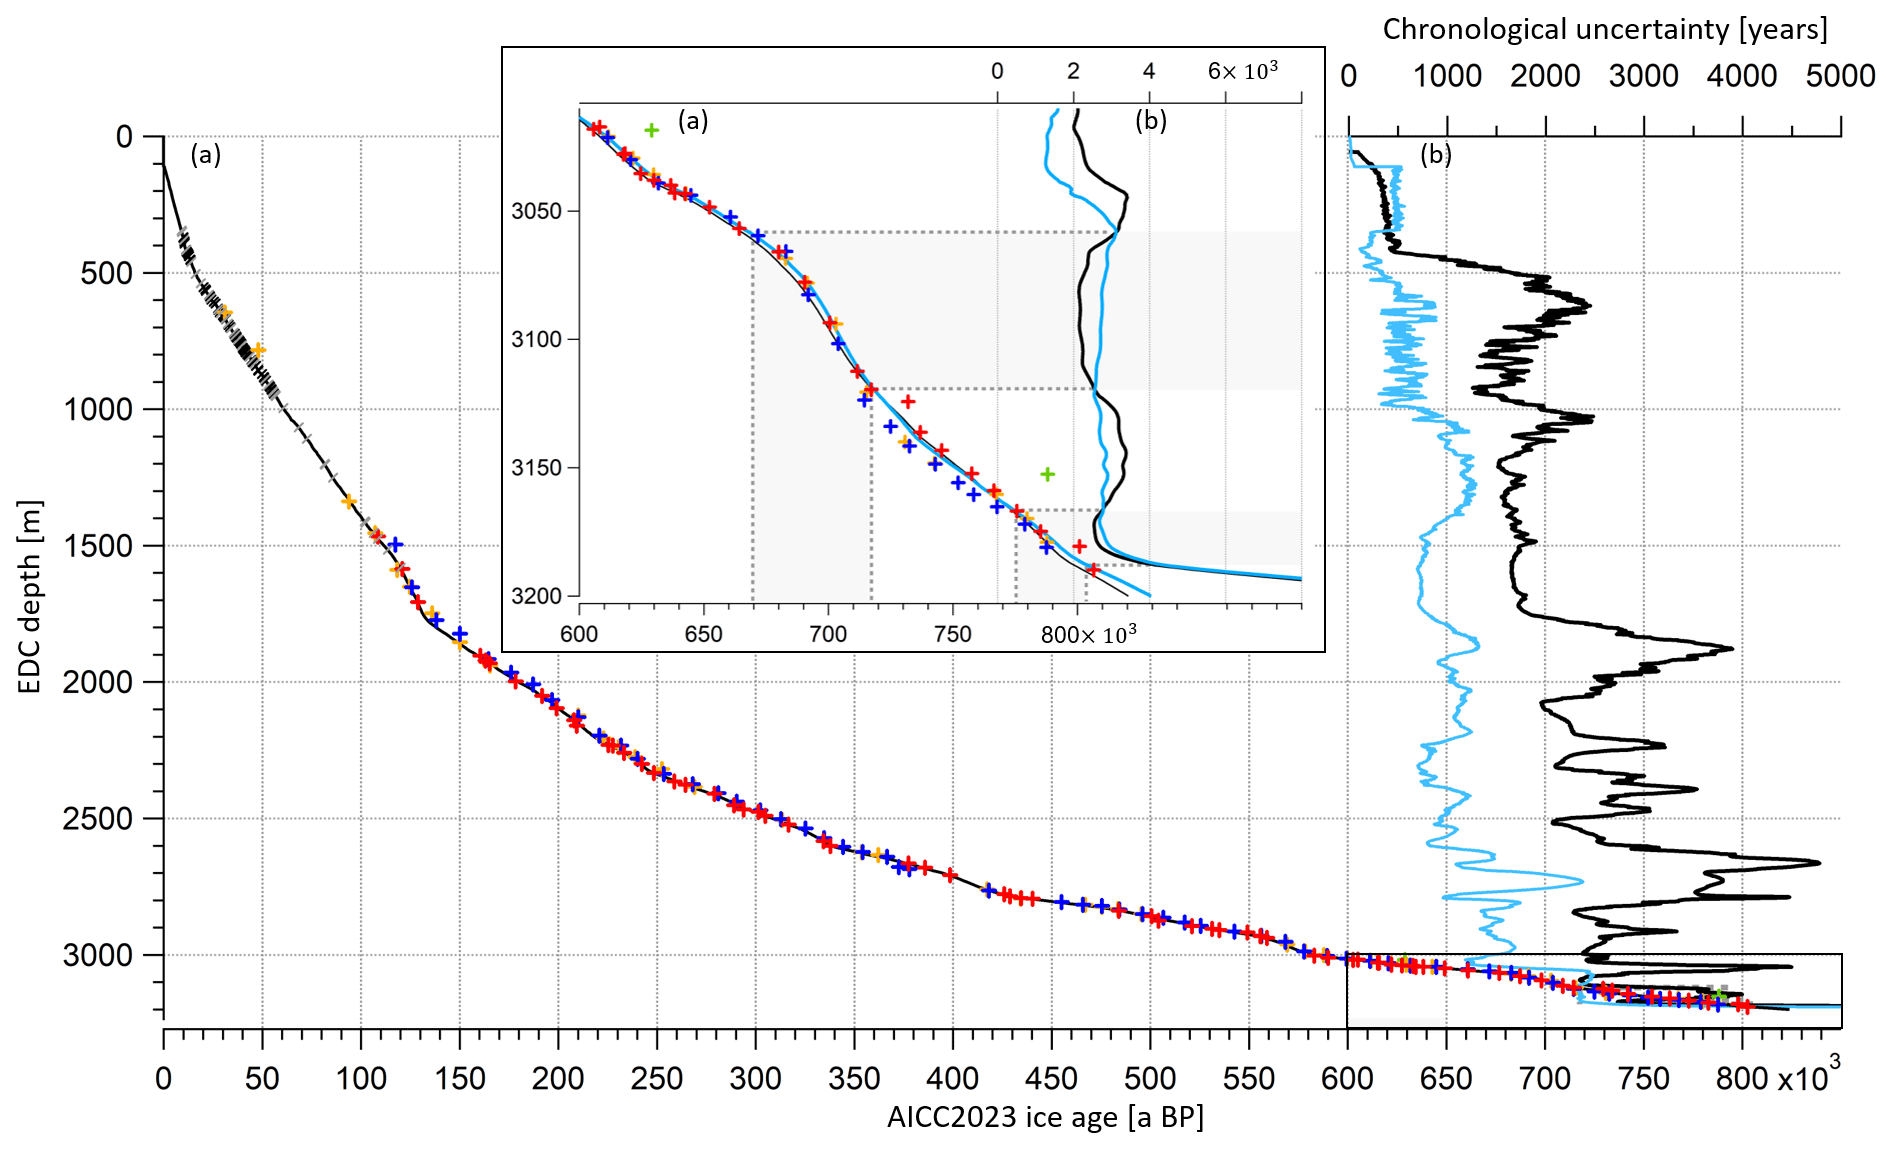
Figure 8EDC ice age and uncertainty as a function of the depth. (a) EDC ice age (AICC2012 in black, AICC2023 in blue), (b) 1σ uncertainty (AICC2012 in black, AICC2023 in blue). Crosses and slashes represent new age constraints (ice stratigraphic links in black, gas stratigraphic links in gray, δ18Oatm in red, in blue, TAC in orange, 81Kr in green). Inset is a zoom in between 800 and 600 ka BP. Gray rectangles frame periods where the new AICC2023 uncertainty is larger than the AICC2012 uncertainty. See Fig. S13 for EDC gas age profile.
4.1.2 Consistency between orbital age constraints
To evaluate the consistency between the orbital age constraints, several “test chronologies” are produced. Each test chronology of the EDC ice core is obtained by running one multi-site (EDC, Vostok, EDML, TALDICE, NGRIP) experiment of Paleochrono. In each of these tests, we implemented one category of new age constraints presented in this work while keeping AICC2012 parameters for other categories. Several test chronologies are thus constructed: the 81Kr-, -, TAC-, δ18Oatm-, CH4-matching- and volcanic-matching-based chronologies (Fig. 7). Two additional test chronologies are obtained by implementing and modifying age constraints either on Vostok or TALDICE with respect to the AICC2012 chronology, as explained in Sect. 2.1 (Fig. 7, dotted lines). The EDC ice age difference between each test chronology and the AICC2012 timescale is represented in Fig. 7 so that it is possible to read which type of dating tool suggests shifting the background chronology towards either older or younger ages.
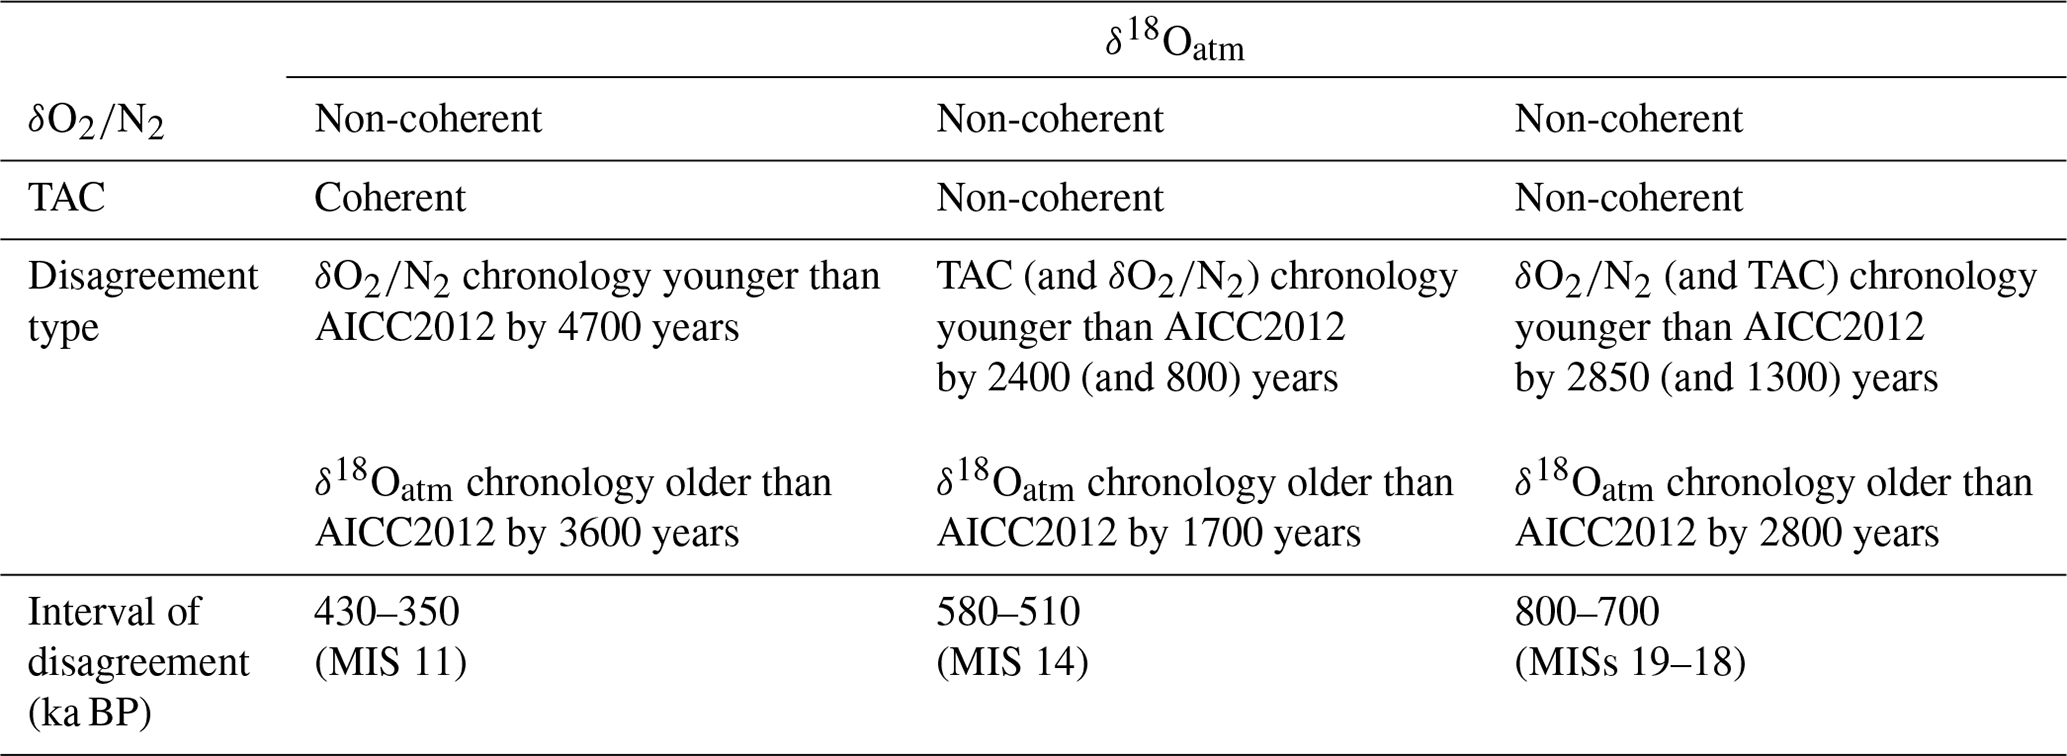
Although the three orbital dating tools globally agree with each other over the last 800 kyr, meaning that they all tend to shift the background chronology towards either older or younger ages over a certain period of time, they are sometimes inconsistent (Fig. 7). The three largest inconsistencies involve age differences between -, TAC- and δ18Oatm-based chronologies reaching 4.15 to 8.3 kyr (Table 5). At 390 ka BP, a large 8.3 kyr discrepancy is observed between - and δ18Oatm-based chronologies. Over this period, the low-resolution record variations do not match its orbital target variations (two insolation minima against one maximum; see Fig. 1). For this reason, the age constraints identified between 480 and 350 ka BP were attached to a 6 kyr uncertainty (quarter of a recession period; Fig. 1). In contrast, the δ18Oatm record agrees well with δ18Ocalcite (Fig. 3), and the uncertainty attached to the δ18Ocalcite inferred tie points over this interval is smaller. Hence, the new AICC2023 chronology suggests shifting AICC2012 towards older ages by 2.2 kyr, as per the δ18Oatm-based chronology (Fig. 7). Around 550 ka BP, the TAC- and δ18Oatm-based chronologies strongly diverge. This may be caused by the absence of TAC tie points due to the non-coincidence of TAC and ISI375 extrema (Fig. 3), while there is good agreement between δ18Oatm and δ18Ocalcite records. Therefore, we decide to increase the uncertainty attached to the four TAC age constraints between 600 and 550 ka BP up to 6 kyr (Fig. 2), and AICC2023 follows the δ18Oatm-based chronology, inducing older ages than AICC2012. At 765 ka BP, the discordance between - (and TAC-) and δ18Oatm-based chronologies is likely due to the poor quality of the records from the lowermost part of the core. Over these oldest time periods, δ18Oatm, TAC and were tied up, respectively, with precession, integrated insolation and insolation with a large uncertainty (6 to 10 kyr). This leads to a final chronology AICC2023, suggesting a larger chronological uncertainty than AICC2012 as well as younger ages (as per TAC and chronologies) over MIS 18 and then older ages (as per δ18Oatm chronology) over MIS 19.
Table 5Description of the inconsistencies between -, TAC- and δ18Oatm-based chronologies. The age shift suggested by each dating tool with respect to AICC2012 age is detailed. The age position of the disagreement is given as per AICC2023. We did not highlight inconsistencies between - and TAC-based chronologies as they remain within their respective orbital uncertainty.
4.1.3 Final chronology and uncertainty
The new AICC2023 chronology suggests significant age shifts when compared to AICC2012 over old periods, including 3.8 and 5 kyr shifts towards older ages around 800 and 690 ka BP as well as a 2.1 kyr shift towards younger ages around 730 ka BP. The chronology is also modified over MIS 5 and MIS 11, where AICC2023 is about 2 kyr older than AICC2012. These 2 kyr shifts are induced by and δ18Oatm dating constraints and stratigraphic links over MIS 5 and by TAC and δ18Oatm constraints over MIS 11. When averaged over the past 800 kyr, the chronological uncertainty is reduced from 1.7 kyr for AICC2012 to 900 years here. Still, it remains significant (above 2 kyr) over MIS 11 and in the lowermost part of the core, between 800 and 650 ka BP. Specifically, between 800 and 670 ka BP, the uncertainty associated with the new AICC2023 timescale is sometimes larger than the AICC2012 uncertainty (Fig. 8). This is caused by a larger relative error attached to and TAC age constraints as well as by the exclusion of the two redundant 10Be age constraints at 780.3 and 798.3 ka BP associated with the Matuyama–Brunhes geomagnetic reversal event.
The age difference between ice and gas timescales (Δage) is 3 kyr on average, reaching its largest values (∼4 kyr) during the cold eras of MISs 12, 8, 6 and 4 (at 440, 260, 145 and 70 ka BP, respectively; Fig. 9). A 4 kyr Δage is obtained at around 160 ka BP (Fig. 9), consistent with the use of new δ15N data of Bréant et al. (2019), leading to a background scenario of LID that is 13 m smaller than the prior LID scenario used in AICC2012 between the depths of 1900 and 2000 m (Fig. 6). Using the definition of an interglacial period implying an EDC δD value surpassing the threshold of −403 ‰ (EPICA Community Members, 2004), we identify 10 substages of interglacials (MISs 1, 5e, 7a, 7c, 7e, 9e, 11c, 15a, 15e and 19; Fig. 9). The average duration of these substages is reduced by 320 years with the new AICC2023 timescale in comparison with the AICC2012 chronology (Fig. 9). More specifically, MISs 5e to 15a are shorter, while only MIS 15e and MIS 19 are longer. The largest decreases in duration affect the Last Interglacial (MIS 5e) and MIS 11c, whose lengths are decreased from 16.3 to 15.1 kyr and from 31.1 to 30.1 kyr, respectively, in agreement with the durations of 14.8 and 29.7 kyr proposed by Extier et al. (2018a).
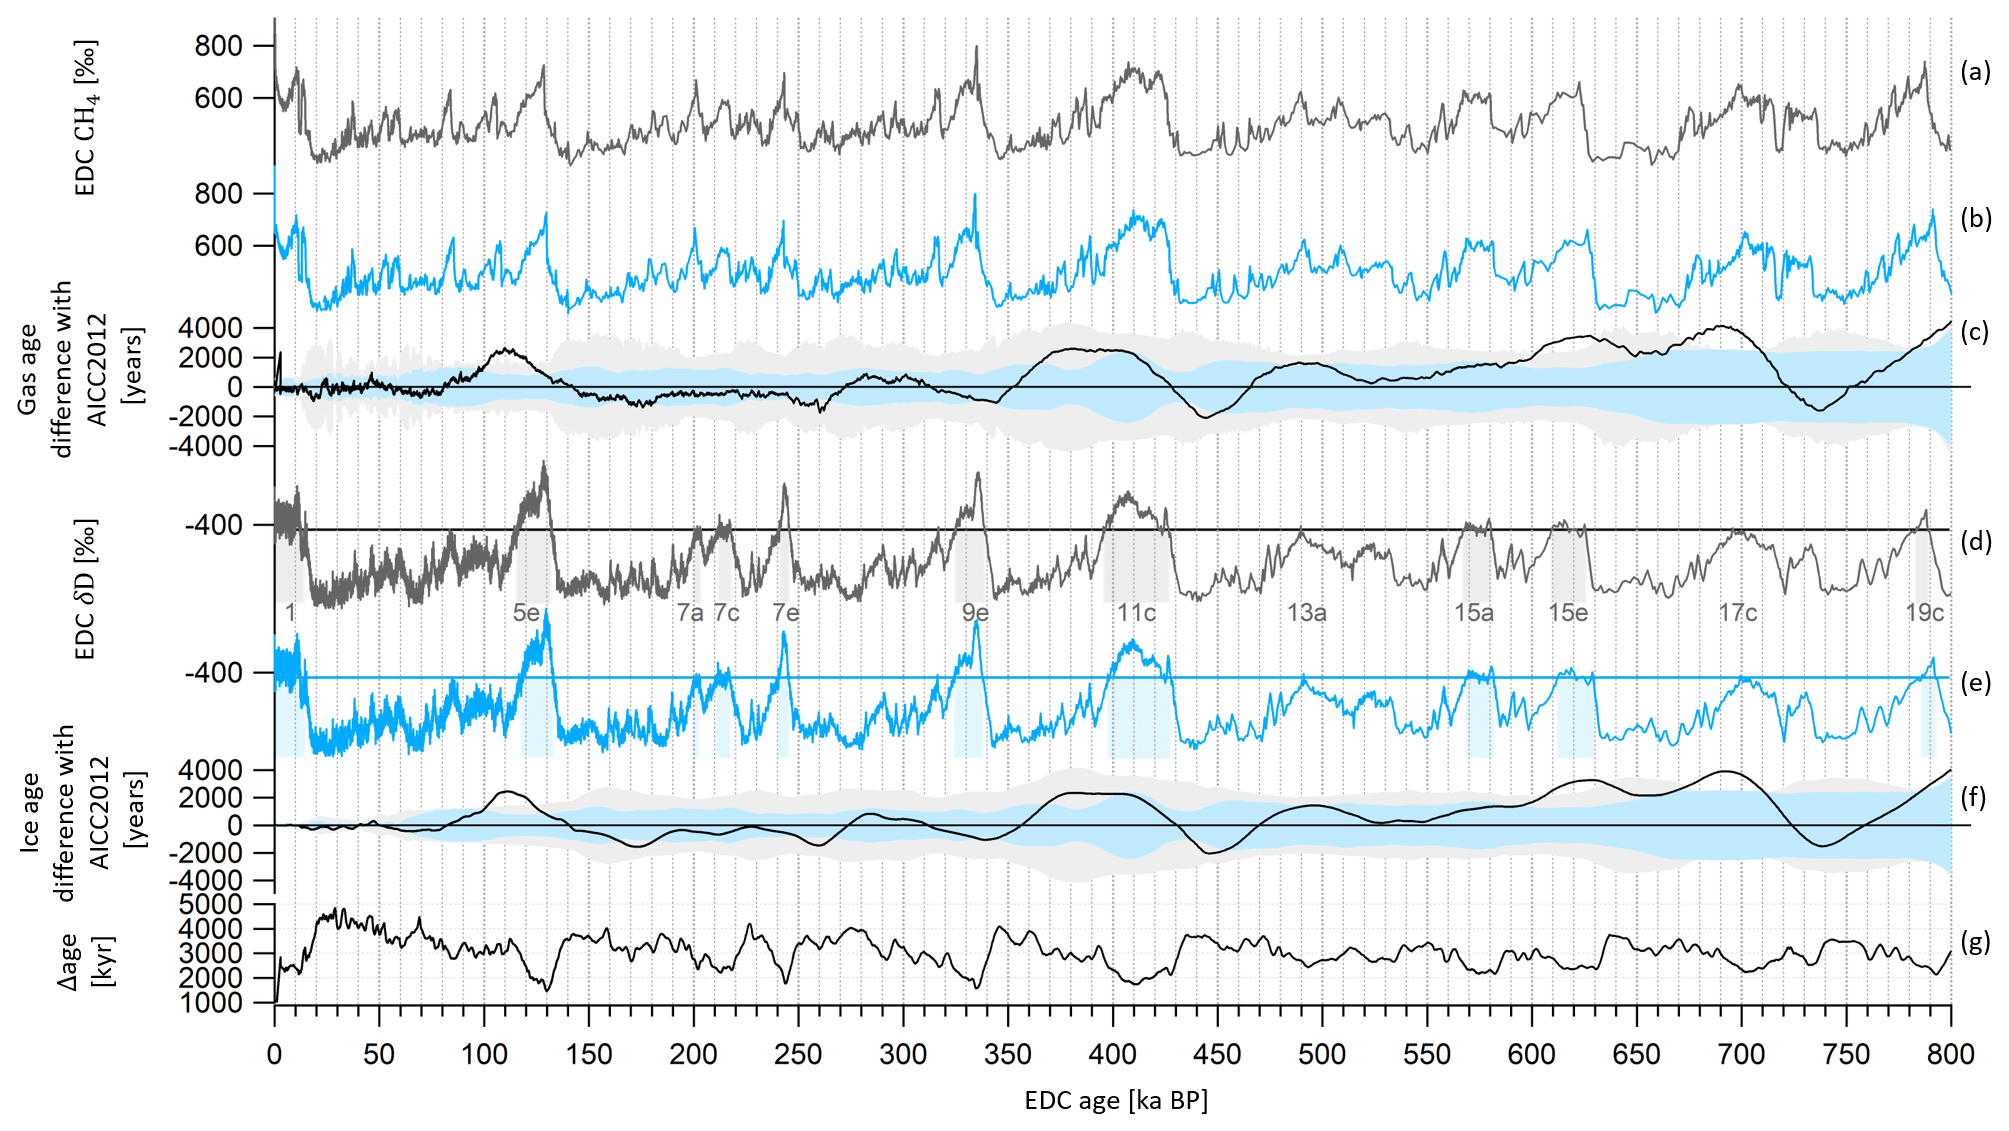
Figure 9EDC gas and ice records on AICC2023 (blue) and AICC2012 (black) timescales over the last 800 kyr. (a) EDC CH4 (Loulergue et al., 2008) on AICC2012 and (b) AICC2023 gas timescales. (c) Gas age difference AICC2023–AICC2012. Gray and blue envelopes are AICC2012 and AICC2023 chronological 1σ uncertainties, respectively. (d) EDC δD (Jouzel et al., 2007) on AICC2012 and (e) AICC2023 ice timescales. Gray and blue rectangles indicate interglacial periods defined when δD is greater than the threshold of −403 ‰ (horizontal lines) (EPICA Community Members, 2004). Interglacials are numbered from MISs 1 to 19 (Berger et al., 2016). (f) Ice age difference AICC2023–AICC2012. (g) Age difference between ice and gas AICC2023 timescales (Δage).
4.2 Comparison with other chronologies
4.2.1 MIS 5 (from 130 to 80 ka BP)
When Veres et al. (2013) presented the AICC2012 chronology over the last climatic cycle, they identified a disagreement with the Greenland timescale GICC05-modelext between 115 and 100 ka BP. The comparison between the Greenland δ18Oice record and the δ18Ocalcite from U–Th-dated Alpine speleothems showed a delay of up to 2.7 kyr during the Dansgaard–Oeschger (D–O) events 23, 24 and 25. Later, this disagreement between abrupt changes in δ18Oice from NGRIP (Greenland surface temperature) and δ18Ocalcite from the Alps was re-evaluated based on a different use of δ18Oatm in ice core chronology, and Extier et al. (2018a) presented better agreement between the two records with an older NGRIP timescale than AICC2012 by ∼2200 years for D–O 23 to 25.
In Fig. 11, the NGRIP δ18Oice record is represented on the AICC2023 timescale and is compared to ancient and novel records of δ18Ocalcite from speleothems that grew along the northern rim of the Alps (NALPS; Boch et al., 2011; Moseley et al., 2020). Thanks to new and δ18Oatm age constraints, the new AICC2023 chronology is also older than AICC2012 between 115 and 100 ka BP and leads to improved agreement between the records along with a reduction in the uncertainty. This amelioration is particularly visible over D–O warmings 23 and 24, where the difference between NALPS and NGRIP chronologies is reduced from ∼2000 years (AICC2012) to 430 and 325 years (AICC2023), respectively (Table 6).
Table 6Timing of D–O warmings 23 and 24 and D–O 25 rebound event onset. The GICC05-modelext age uncertainty is undetermined.
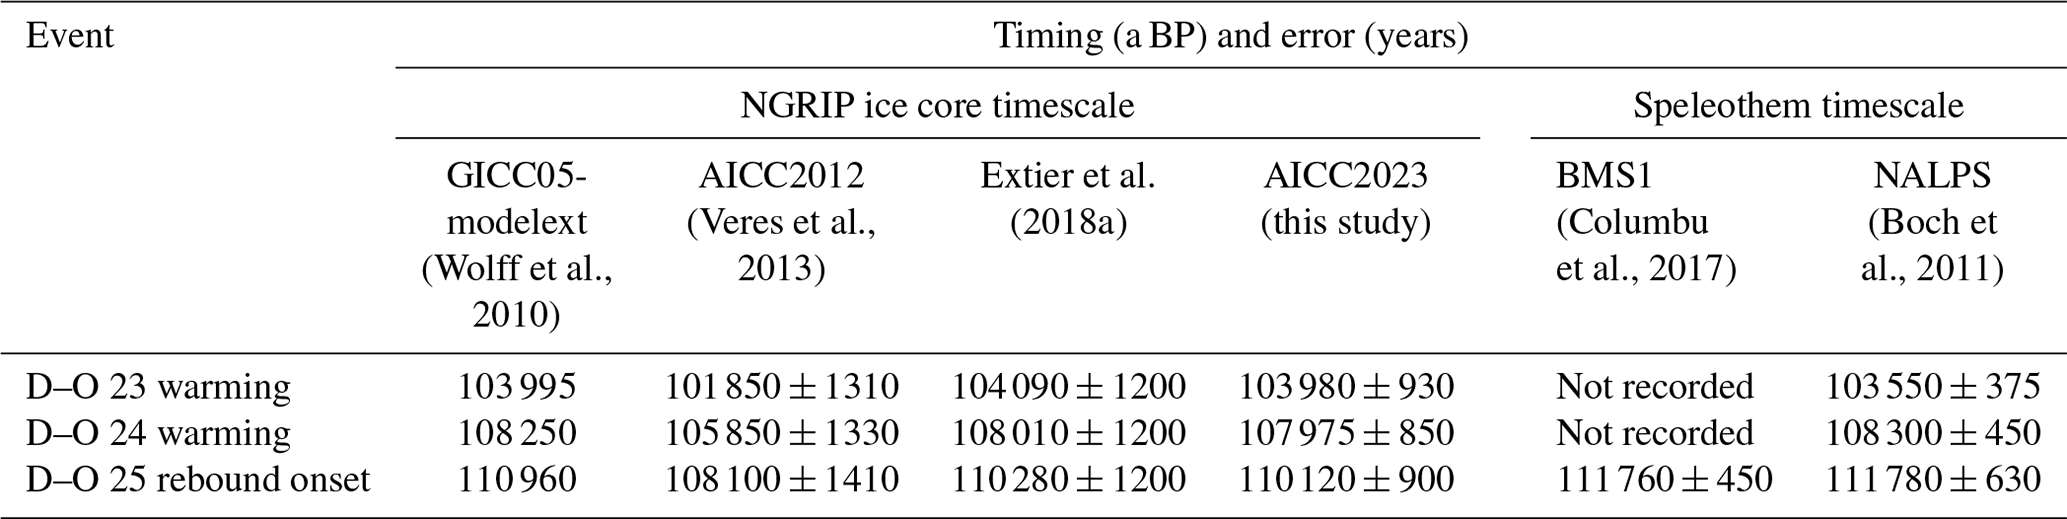
The Greenland Interstadial (GI) 25 can be subdivided in three substages: GI-25a, GI-25-b and GI-25-c, where GI-25a is the earliest glacial so-called “rebound event” (Capron et al., 2010). This latter consists of a brief warm–wet excursion during the slow cooling trend of the longer GI-25 period before jumping back to a cool–dry climate. The GI-25a warm–wet interval corresponds to a temperature increase in Greenland and continental Europe and is hence identified by a positive excursion in NGRIP and NALPS δ18O records (D–O 25 rebound) (Boch et al., 2011; Capron et al., 2012). At lower latitudes, this rebound likely affected the rainfall amount variations, as exhibited by the abrupt decrease in the δ18Ocalcite from a U–Th-dated Sardinian stalagmite from Bue Marino Cave (BMS1; Columbu et al., 2017). The 2 kyr shift in the new AICC2023 chronology towards older ages improves the coherency between NALPS, NGRIP and BMS1 timescales over the GI-25a onset (traceable in the δ18O series; Fig. 10). The age discrepancy is reduced from ∼3600 years (between AICC2012 and BMS1 timescale) to 1640 years (between AICC2023 and BMS1 timescale; Table 6).
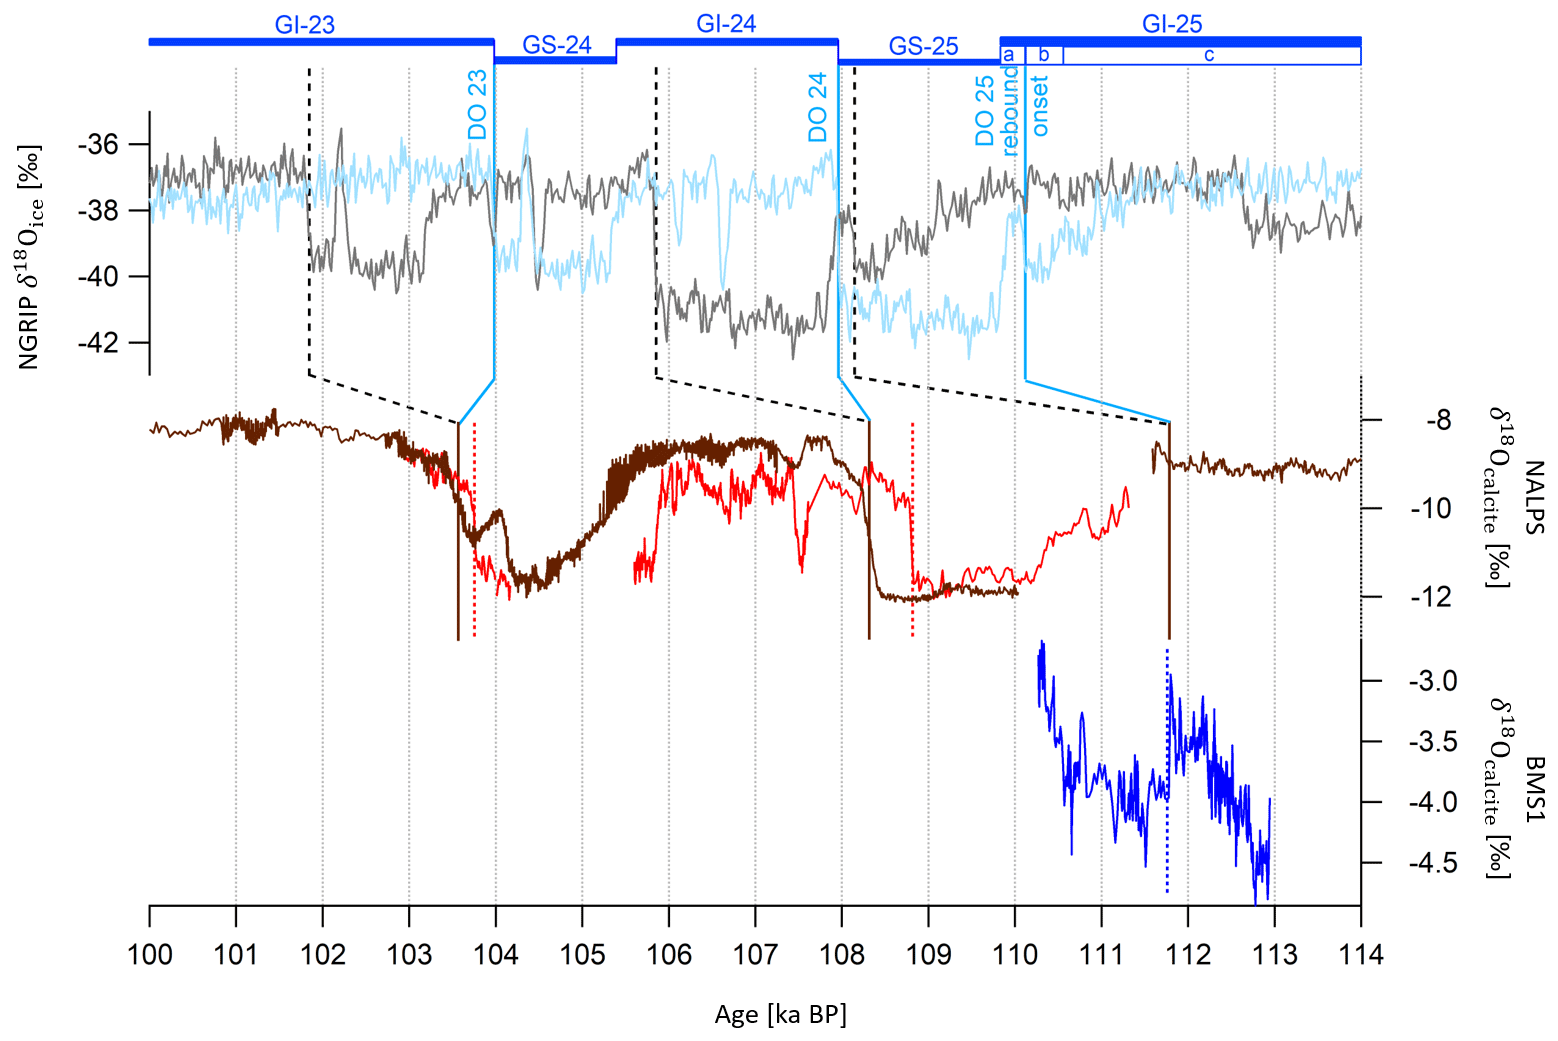
Figure 10Northern Alpine speleothems (NALPS) and Bue Marino stalagmite (BMS1) δ18Ocalcite records and NGRIP δ18Oice evolution between 114 and 100 ka BP. NGRIP δ18Oice data by Andersen et al. (2004) on AICC2012 (gray) and AICC2023 (blue) chronologies. NALPS δ18Ocalcite data by Moseley et al. (2020) (red) and Boch et al. (2011) (brown). BMS1 δ18Ocalcite data by Columbu et al. (2017) (dark blue). Vertical bars indicate D–O 25 rebound, D–O 24 and D–O 23 warmings at the onset of the GI-25a warm–wet substage, GI-24, and GI-23. They correspond to abrupt increases in the NALPS δ18Ocalcite and NGRIP δ18Oice records and to a decrease in the BMS1 δ18Ocalcite series (for the GI-25a onset). Dashed black bars and blue bars show increases in δ18Oice, respectively, on AICC2012 and AICC2023 chronologies. Brown bars and dotted red bars show increases in NALPS δ18Ocalcite datasets. The dotted blue bar indicates the decrease in BMS1 δ18Ocalcite. GI–GS (Greenland stadial) boundaries and GI-25 subdivision are indicated on the new AICC2023 chronology by horizontal bars.
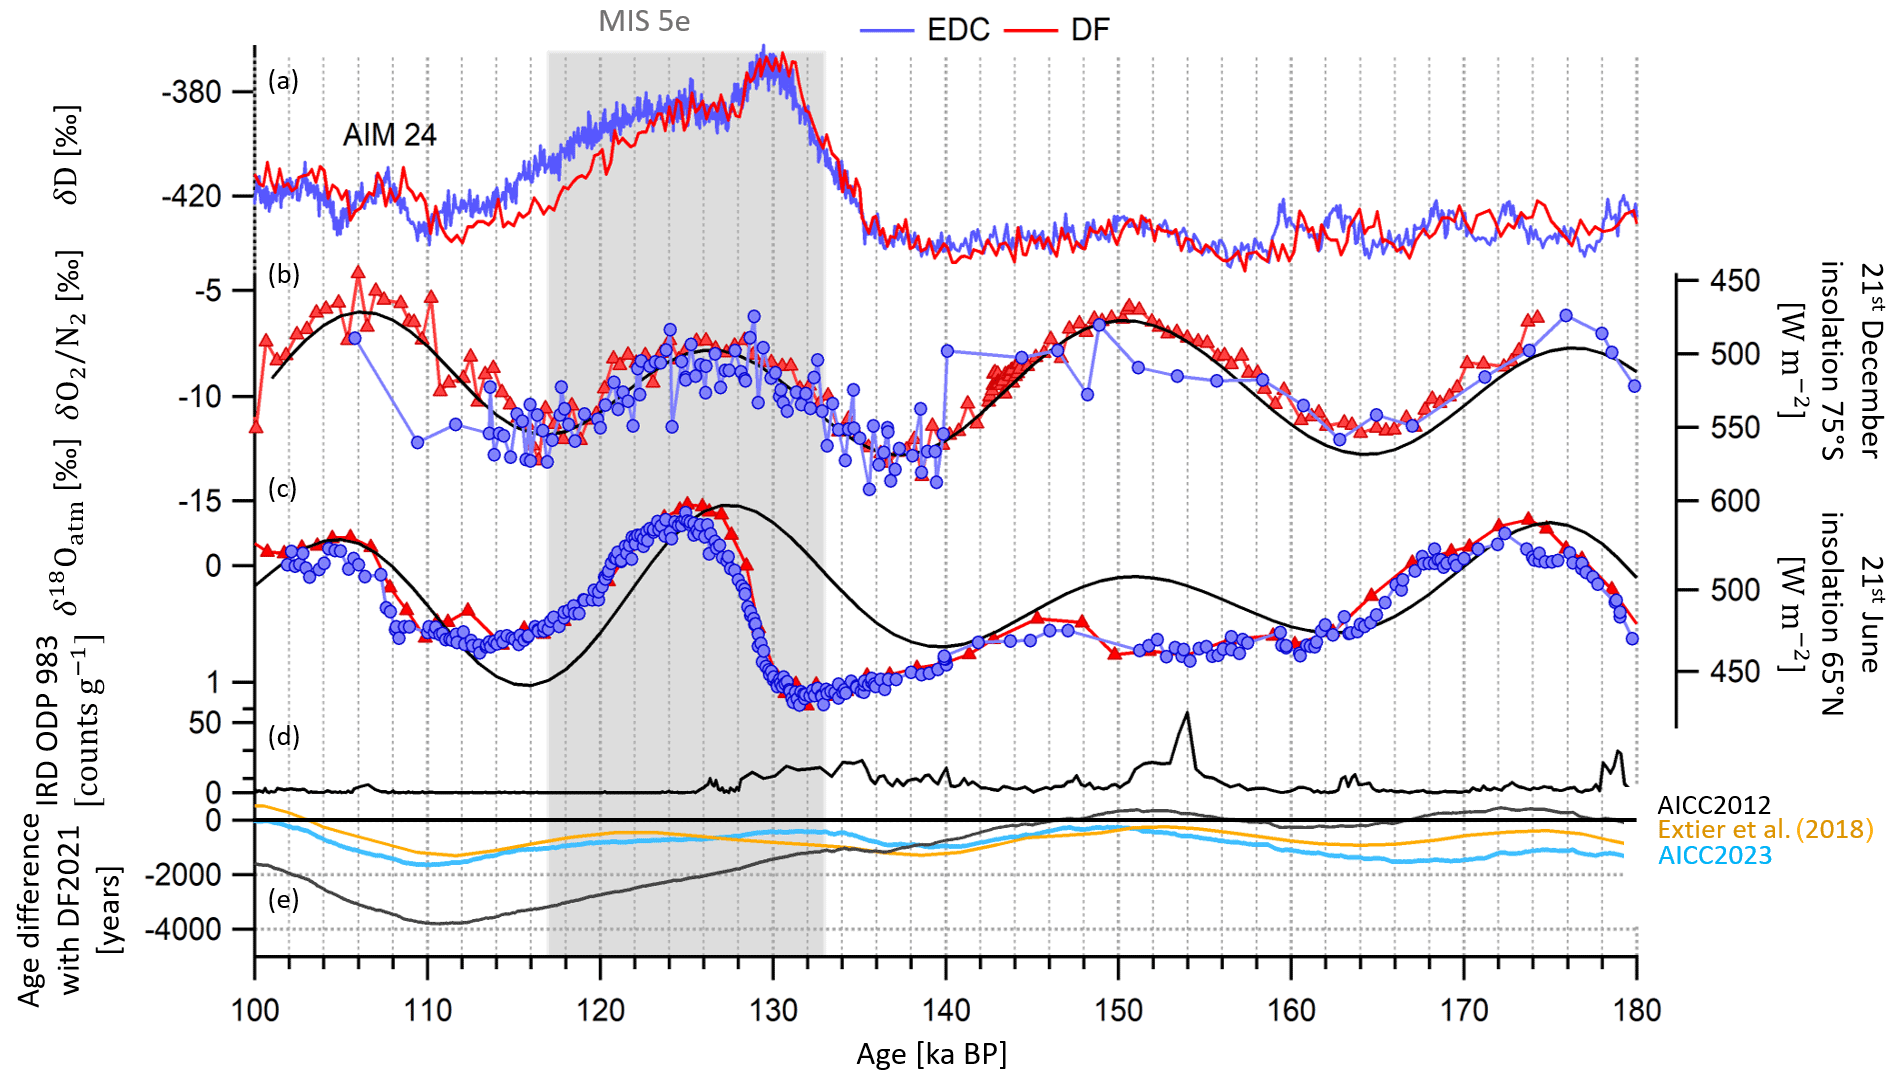
Figure 11Evolution of EDC and DF records on AICC2023 and DF2021 chronologies between 180 and 100 ka BP. (a) δD records from DF (red; Uemura et al., 2018) and EDC (purple; Jouzel et al., 2007). (b) records from DF (red triangles; Oyabu et al., 2022) and EDC (purple circles; this work). (c) δ18Oatm records from DF (red triangles; Kawamura et al., 2007) and EDC (purple circles; this work). DF and EDC records are represented on DF2021 and AICC2023 timescales. (d) IRD from ODP 983 (Barker et al., 2019, 2021). (e) Ice age difference between DF2021 and (i) AICC2023 (blue), (ii) Extier et al. (2018a) chronology (orange) and (iii) AICC2012 (black). The age difference is calculated as per EDC age − DF2021 age. DF2021 age is transferred onto the EDC ice core via the volcanic synchronization of Fujita et al. (2015). The gray rectangle indicates MIS 5e.
Between 128 and 103 ka BP, the comparison between the AICC2012 timescale and the novel Dome Fuji ice core DF2021 chronology indicates that AICC2012 is likely too young by up to 4 kyr. Here, thanks to new highly resolved data and to the alignment of δ18Oatm and δ18Ocalcite records, we improve the consistency between AICC2023 and DF2021, now agreeing within 1.7 kyr over MIS 5e (Fig. 11). With the new chronologies, the records of δ18Oatm and from the Dome Fuji and EDC ice cores show synchronous variations between 140 and 115 ka BP, although the measurements from EDC are more scattered than DF data due to the use of smaller samples (see Sect. S1 in the Supplement). However, δD records are still slightly discordant, and the EDC record lags DF by up to 1700 years over MIS 5e and at the onset of the Antarctic Isotope Maximum (AIM) 24 (Fig. 11), suggesting some remaining chronology problems (AIM 24 onset) or regional climatic differences (δD decrease over MIS 5e). Between 180 and 150 ka BP, AICC2012 shows better agreement with the DF2021 chronology than the new AICC2023 chronology, which suggests younger ages as per TAC and δ18Oatm dating constraints.
4.2.2 MIS 11 (from 425 to 375 ka BP)
Over the time interval from 430 to 360 ka BP, encompassing MIS 11, the new AICC2023 chronology predicts older ages than AICC2012 (by up to 2 kyr) with a diminished uncertainty (from 3.9 to 1.7 kyr). This shift towards older ages is induced by δ18Oatm–δ18Ocalcite (Hulu, Sambao and Dongge caves) tie points at 377.3, 385.7 and 398.5 ka BP and by the TAC age constraint at 362.1 ka BP (Figs. 7 and 12). As a result, two major rises in the EDC atmospheric CO2 and CH4 concentration records (corresponding to carbon dioxide jumps CDJ+ 11a.3 and 11a.4, labeled as per Nehrbass-Ahles et al., 2020) occur at 385.6±1.4 and 389.8±1.5 ka BP (Fig. 12). These two rapid jumps in CO2 and CH4 are better aligned with two abrupt decreases in the highly resolved δ18Ocalcite record of Zhao et al. (2019) from Yongxing cave (independently dated with 230Th at 386.4±3.1 and 390.0±3.0 ka BP) than when using the AICC2012 chronology (improvement by ∼800 years). Such millennial-scale synchronicity is expected between CH4 and δ18Ocalcite series from Chinese speleothems as they are both influenced by Asian monsoon area displacements (and associated methane emissions from wetlands) (Sánchez Goñi et al., 2008).
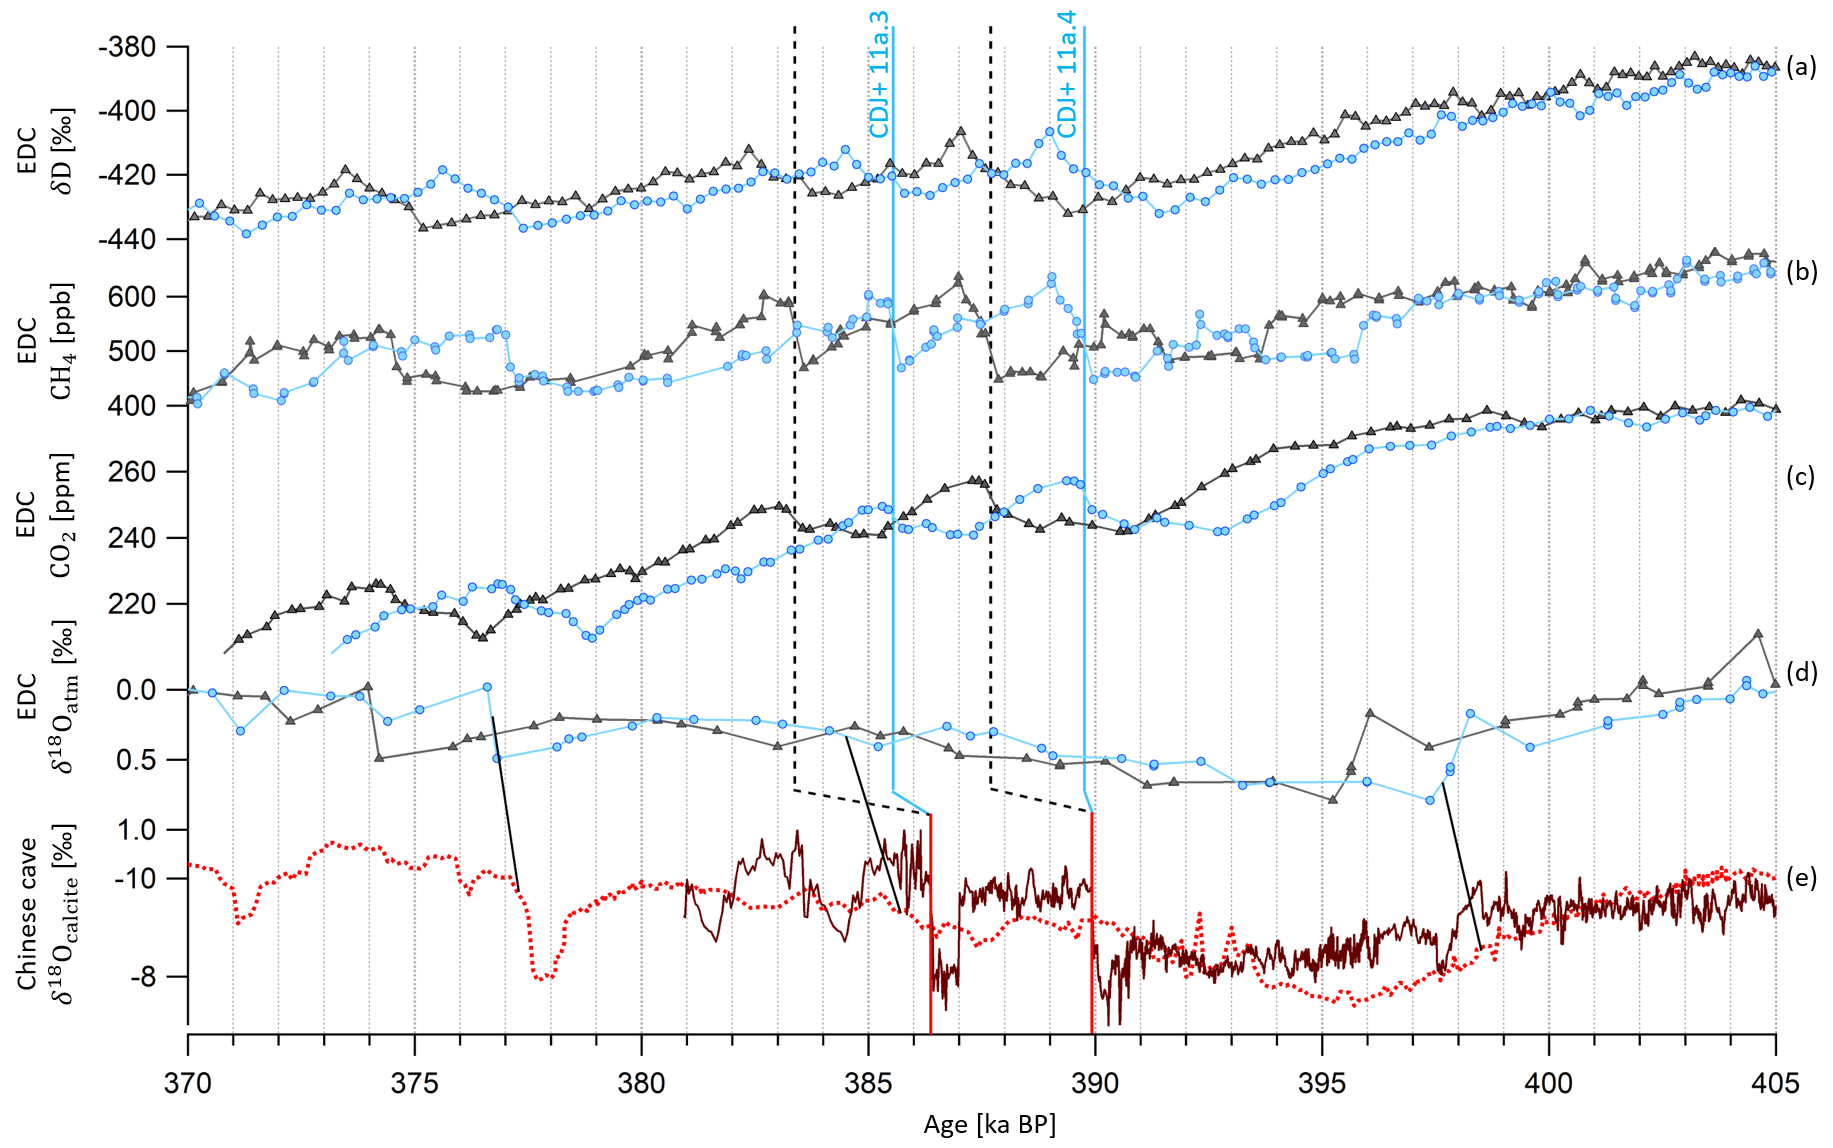
Figure 12Evolution of climate tracers from the EDC ice core and Yongxing cave stalagmites between 405 and 370 ka BP. EDC records of (a) δD, (b) CH4 (Nehrbass-Ahles et al., 2020), (c) CO2 (Nehrbass-Ahles et al., 2020) and (d) δ18Oatm on AICC2012 (gray triangles) and AICC2023 (blue circles) chronologies. (e) Speleothem δ18Ocalcite from Hulu, Dongge and Sambao cave, used to constrain AICC2023 (dashed red curve; Cheng et al., 2016), and from Yongxing cave, independently dated with 230Th dating and annual band counting (plain brown curve; Zhao et al., 2019). CDJ+ is labeled as per Nehrbass-Ahles et al. (2020). Vertical dashed black and blue bars show jumps in CO2 on AICC2012 and AICC2023 chronologies, respectively; vertical red bars show corresponding decreases in δ18Ocalcite. Black lines show the three tie points between δ18Oatm and δ18Ocalcite (Cheng et al., 2016) used to constrain AICC2023.
4.2.3 MIS 19 (from 780 to 760 ka BP)
The Matuyama–Brunhes event (geomagnetic field reversal) is reflected by a globally synchronous event in the 10Be signal: an abrupt termination of the large 10Be peak following a long-term increasing trend recorded in both ice and sedimentary cores (Giaccio et al., 2023). The 40Ar/39Ar age-constrained chronology of a lacustrine succession from Sulmona basin (Giaccio et al., 2023) gives an age of 770.9±1.6 ka BP for the 10Be peak termination. The new AICC2023 chronology provides an estimate of 767.3±3 ka BP for the same 10Be peak termination, an age which is closer to the 40Ar/39Ar age evaluation than the AICCC2012 chronology estimate (766.2±3 ka BP; Fig. 13). The new AICC2023 chronology indeed indicates an increasingly older age than AICC2012 over MIS 19 (from 790 to 761 ka BP) due to the new δ18Oatm-based timescale (Fig. 7).
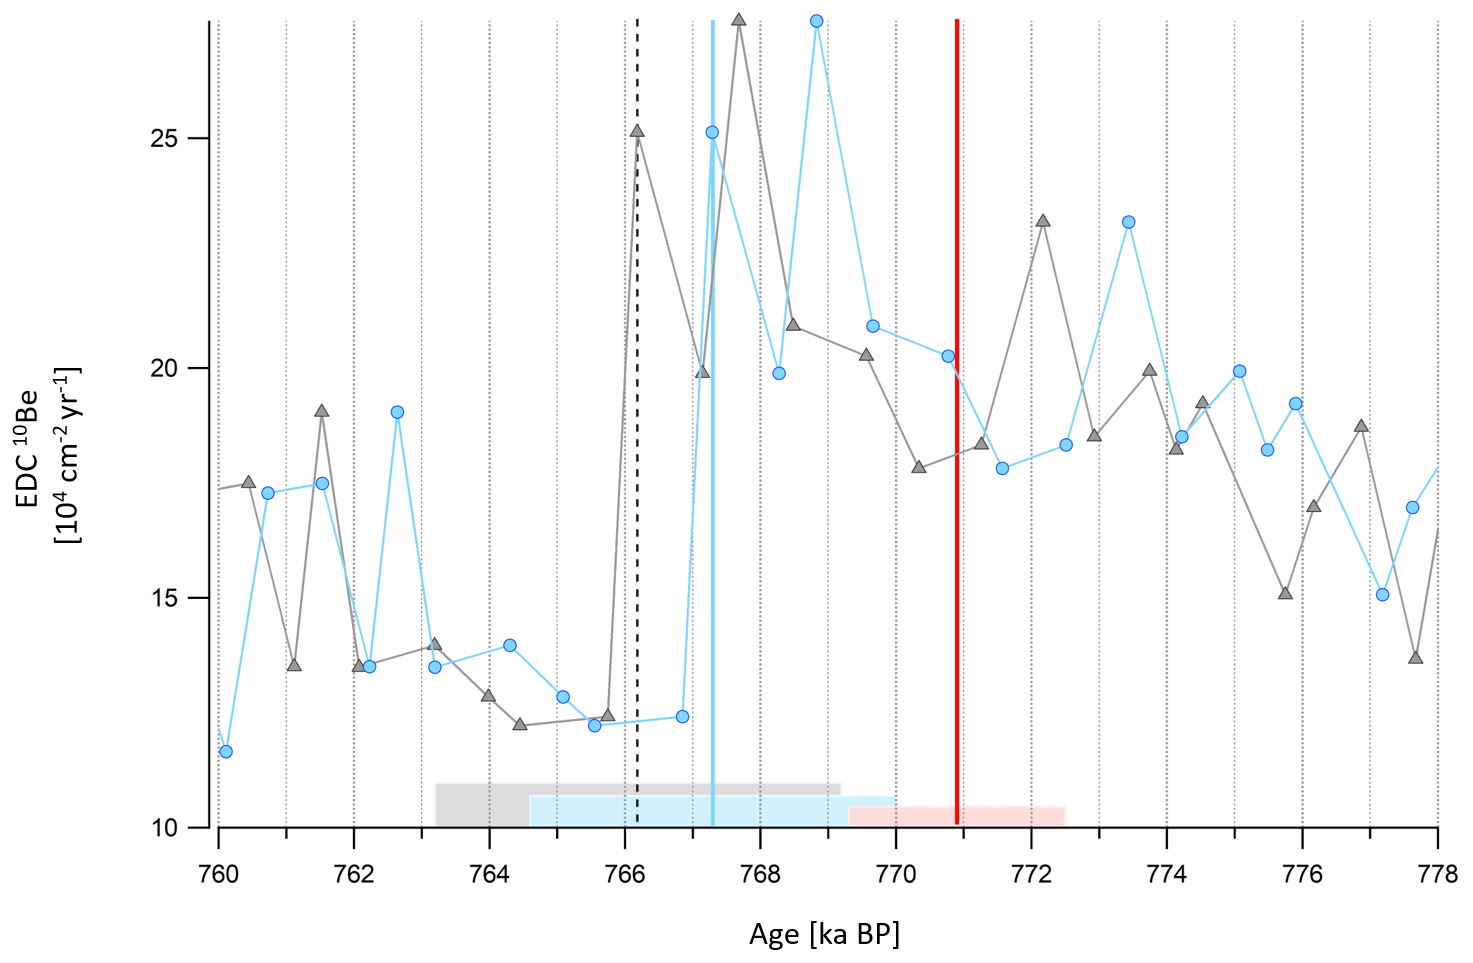
Figure 13EDC 10Be record on AICC2012 and AICC2023 chronologies between 778 and 760 ka BP. Vertical gray and blue bars indicate the age of the abrupt EDC 10Be peak termination on AICC2012 (gray triangles) and AICC2023 (blue circles) chronologies, respectively. The horizontal gray and blue rectangles correspond to AICC2012 and AICC2023 2σ confidence intervals (±3 and ±2.7 ka, respectively). The vertical red bar and horizontal rectangle show the 10Be peak termination age and its 2σ confidence interval (770.9±1.6 ka BP; Giaccio et al., 2023).
We acknowledge that the Chiba composite section also provides a high-resolution 10Be record, as the Montalbano Jonico marine section (Simon et al., 2017), the Sulmona basin succession and the EDC ice core do. Although the 10Be flux records of Sulmona and EDC show a similar pattern and the same asymmetrical shape (i.e., slow increase followed by an abrupt 10Be peak termination), the sharp termination is less obvious in the Montalbano Jonico and Chiba records. In addition, the Chiba and Montalbano Jonico records are shallow marine deposits; hence expression of paleoclimatic proxies can be amplified and/or hampered by fluvial input (Nomade et al., 2019). Finally, substantial adjustments, up to 10.2±5.5 kyr (i.e., exceeding the related uncertainty), are required to fit the millennial-scale variability in the Chiba record within the Sulmona radioisotopic-based chronology. Giaccio et al. (2023) point out that, despite these relatively large temporal offsets for the Chiba record, the Sulmona-based age model is more linear and describes a simpler, and likely more realistic, history of sediment accumulation. Therefore, we rather use the Sulmona succession to compare with AICC2023.
In this study, we have established a new reference chronology for the EDC ice core, AICC2023, covering the last 800 kyr, which is consistent with the official GICC05 timescale over the last 60 kyr. A valuable update of the chronology construction has been the compilation of chronological and glaciological information, including new age markers from recent high-resolution measurements on the EDC ice core. As a result, the chronological uncertainty is reduced from 1.7 kyr in AICC2012 (standard deviation of 995 years) to 900 years on average in AICC2023 (standard deviation of 720 years). A total of 90 % of the new AICC2023 timescale is associated with an uncertainty lower than 2 kyr, compared to only 60 % in the AICC2012 chronology. First, the distinct orbital chronologies derived from , TAC and δ18Oatm are coherent within their respective uncertainties except over three periods, including MIS 11 and MIS 19. Second, new δ15N measurements along with new sensitivity tests with the firn densification model described by Bréant et al. (2017) and adapted for the EDC ice core provide the most plausible evolution of LID at EDC over the last 800 kyr.
The majority of the age disparities observed between the AICC2023 and AICC2012 chronologies are smaller than 500 years (median), hence minor given the average uncertainty in AICC2012 (1.7 kyr). Exceptions are significant age shifts reaching 3.4, 3.8 and 5 kyr towards older ages suggested over MIS 15, MIS 17 and MIS 19, respectively. However, most of these age discrepancies lead to an improved coherency between the new EDC timescale and independent absolute chronologies derived for other climate archives, especially over the following periods: MIS 5, MIS 11 and MIS 19.
We have identified time intervals where building the chronology is more complicated, such as termination VI (from 540 to 456 ka BP) and from 800 to 600 ka BP, corresponding to the lowermost section of the core, and we would like to draw attention to the requirement for new measurements over these periods. In particular, the links between the variability in and TAC records and their orbital targets are not obvious over the 800–600 ka BP period (Fig. 1). This may be due to bad quality of the ice and/or diffusion of gases through the ice matrix (Bereiter et al., 2009). The imprecision of the signal may also be partially explained by the limited temporal resolution of the existing dataset in this deep section. To address these issues, highly resolved and TAC measurements are needed in the lowermost section of the EDC ice core. In addition, from ice samples over the period covering TVI should also be analyzed to investigate the mismatch between old and new datasets (Fig. 1).
A final important aspect would be to further extend the Paleochrono dating experiment by implementing other ice cores such as Dome Fuji, WAIS Divide and NEEM (North Greenland Eemian), for which a large amount of chronological and glaciological information is now available.
The input and output files created during this study to obtain the new AICC2023 chronology are available on Zenodo (https://doi.org/10.5281/zenodo.10091515; Bouchet et al., 2023a). They include both updated and old age markers.
A folder is available for each site in the PANGAEA data repository (Bouchet et al., 2023b). It includes new gas and ice age scales and their uncertainties as well as new gas data along with background and analyzed scenarios for accumulation rate, thinning function and LID. A correspondence between AICC2023 and WD2014 age models is also given (https://doi.org/10.1594/PANGAEA.961017; Bouchet et al., 2023b). The new δ18Oatm and δON2 datasets for EDC are also available in the PANGAEA data repository (https://doi.org/10.1594/PANGAEA.961023; Bouchet et al., 2023c).
The supplement related to this article is available online at: https://doi.org/10.5194/cp-19-2257-2023-supplement.
MB wrote the manuscript with the contribution of all co-authors. AL and FP contributed to the conceptualization of the study and the methodology. Measurements on the EDC ice core were performed at the LSCE by AG, FP, RJ and EF. EC, DR, VYL and MFL contributed to the collection, analysis and interpretation of the TAC record. ML provided resources. The krypton analysis was conducted by WJ, FR, ZTL and GMY. TE, AS, EL and PM contributed to the validation of the study.
At least one of the (co-)authors is a member of the editorial board of Climate of the Past. The peer-review process was guided by an independent editor, and the authors also have no other competing interests to declare.
Publisher's note: Copernicus Publications remains neutral with regard to jurisdictional claims made in the text, published maps, institutional affiliations, or any other geographical representation in this paper. While Copernicus Publications makes every effort to include appropriate place names, the final responsibility lies with the authors.
This article is part of the special issue “Ice core science at the three poles (CP/TC inter-journal SI)”. It is a result of the IPICS 3rd Open Science Conference, Crans-Montana, Switzerland, 2–7 October 2022.
Krypton analysis has been supported by the Innovation Program for Quantum Science and Technology (2021ZD0303101) and by the National Natural Science Foundation of China (41727901). Development of the Paleochrono model was funded by CNRS/INSU/LEFE projects IceChrono and CO2Role. Emilie Capron and Etienne Legrain acknowledge financial support from the French National Research Agency under the “Programme d'Investissements d'Avenir” (ANR-19-MPGA-0001), through the Make Our Planet Great Again HOTCLIM project, as well as the financial support from the AXA research fund. We also acknowledge the assistance from the European Union FP5-EESD program (grant agreement no. EVK2-CT-2000-00077; EPICA), the French National Research Agency program “NEANDROOTS” (ANR-19-CE27-0011) and the French Polar Institute project no. 902 (GLACIOLOGIE CONCORDIA). Our special thanks go to Markus Grimmer, Marcel Haeberli, Daniel Baggenstos, Jochen Schmitt, Matthias Baumgartner, Hubertus Fischer, Kenji Kawamura and Ikumi Oyabu for sharing their thoughts and data and sustaining the discussion on the construction of new ice core age scales and to Sébastien Nomade and Alison Pereira for providing advice and expertise in geochronology.
This research has received funding from the European Research Council under the European Union Horizon 2020 Excellent Science program (H2020/20192024)/ERC grant agreement no. 817493 (ERC ICORDA).
This paper was edited by Christo Buizert and reviewed by two anonymous referees.
Alley, R. B.: Firn densification by grain-boundary sliding: a first model, Journal de Physique Colloque, 48, 1–249, https://doi.org/10.1051/JPHYSCOL:1987135, 1987.
Andersen, K. K., Azuma, N., Barnola, J.-M., Bigler, M., Biscaye, P., Caillon, N., Chappellaz, J., Clausen, H. B., Dahl-Jensen, D., Fischer, H., Flückiger, J., Fritzsche, D., Fujii, Y., Goto-Azuma, K., Grønvold, K., Gundestrup, N. S., Hansson, M., Huber, C., Hvidberg, C. S., Johnsen, S. J., Jonsell, U., Jouzel, J., Kipfstuhl, S., Landais, A., Leuenberger, M., Lorrain, R., Masson-Delmotte, V., Miller, H., Motoyama, H., Narita, H., Popp, T., Rasmussen, S. O., Raynaud, D., Rothlisberger, R., Ruth, U., Samyn, D., Schwander, J., Shoji, H., Siggard-Andersen, M.-L., Steffensen, J. P., Stocker, T., Sveinbjörnsdóttir, A. E., Svensson, A., Takata, M., Tison, J.-L., Thorsteinsson, Th., Watanabe, O., Wilhelms, F., White, J. W. C., and N. G. I. C. P. members: High-resolution record of Northern Hemisphere climate extending into the last interglacial period, Nature, 431, 147–151, https://doi.org/10.1038/nature02805, 2004.
Andersen, K. K., Svensson, A., Johnsen, S. J., Rasmussen, S. O., Bigler, M., Röthlisberger, R., Ruth, U., Siggaard-Andersen, M.-L., Peder Steffensen, J., Dahl-Jensen, D., Vinther, B. M., and Clausen, H. B.: The Greenland Ice Core Chronology 2005, 15–42 ka. Part 1: constructing the time scale, Quaternary Sci. Rev., 25, 3246–3257, https://doi.org/10.1016/j.quascirev.2006.08.002, 2006.
Arnaud, L., Barnola, J. M., and Duval, P.: Physical modeling of the densification of snow/firn and ice in the upper part of polar ice sheets, Physics of Ice Core Records, 285–305, http://hdl.handle.net/2115/32472 (last access: 9 November 2023), 2000.
Arthern, R. J., Vaughan, D. G., Rankin, A. M., Mulvaney, R., and Thomas, E. R.: In situ measurements of Antarctic snow compaction compared with predictions of models, J. Geophys. Res.-Earth, 115, 3011, https://doi.org/10.1029/2009JF001306, 2010.
Baglin, C. M.: Nuclear Data Sheets for A=81, Nucl. Data Sheets, 109, 2257–2437, https://doi.org/10.1016/J.NDS.2008.09.001, 2008.
Barker, S., Knorr, G., Conn, S., Lordsmith, S., Newman, D., and Thornalley, D.: Early interglacial legacy of deglacial climate instability, Paleoceanogr. Paleoclimatol., 34, 1455–1475, https://doi.org/10.1029/2019PA003661, 2019.
Barker, S., Zhang, X., Jonkers, L., Lordsmith, S., Conn, S., and Knorr, G.: Strengthening Atlantic inflow across the mid-Pleistocene transition, Paleoceanogr. Paleoclimatol., 36, 2021e2020PA004200, https://doi.org/10.1029/2020PA004200, 2021.
Barnola, J. -M, Pimienta, P., Raynaud, D., and Korotkevich, Y. S.: CO2-climate relationship as deduced from the Vostok ice core: a re-examination based on new measurements and on a re-evaluation of the air dating, Tellus B, 43, 83–90, https://doi.org/10.1034/J.1600-0889.1991.T01-1-00002.X, 1991.
Baumgartner, M., Kindler, P., Eicher, O., Floch, G., Schilt, A., Schwander, J., Spahni, R., Capron, E., Chappellaz, J., Leuenberger, M., Fischer, H., and Stocker, T. F.: NGRIP CH4 concentration from 120 to 10 kyr before present and its relation to a δ15N temperature reconstruction from the same ice core, Clim. Past, 10, 903–920, https://doi.org/10.5194/cp-10-903-2014, 2014.
Bazin, L., Landais, A., Lemieux-Dudon, B., Toyé Mahamadou Kele, H., Veres, D., Parrenin, F., Martinerie, P., Ritz, C., Capron, E., Lipenkov, V., Loutre, M.-F., Raynaud, D., Vinther, B., Svensson, A., Rasmussen, S. O., Severi, M., Blunier, T., Leuenberger, M., Fischer, H., Masson-Delmotte, V., Chappellaz, J., and Wolff, E.: An optimized multi-proxy, multi-site Antarctic ice and gas orbital chronology (AICC2012): 120–800 ka, Clim. Past, 9, 1715–1731, https://doi.org/10.5194/cp-9-1715-2013, 2013.
Bazin, L., Landais, A., Capron, E., Masson-Delmotte, V., Ritz, C., Picard, G., Jouzel, J., Dumont, M., Leuenberger, M., and Prié, F.: Phase relationships between orbital forcing and the composition of air trapped in Antarctic ice cores, Clim. Past, 12, 729–748, https://doi.org/10.5194/cp-12-729-2016, 2016.
Bender, M. L.: Orbital tuning chronology for the Vostok climate record supported by trapped gas composition, Earth Planet. Sc. Lett., 204, 275–289, https://doi.org/10.1016/S0012-821X(02)00980-9, 2002.
Bender, M. L., Barnett, B., Dreyfus, G., Jouzel, J., and Porcelli, D.: The contemporary degassing rate of 40Ar from the solid Earth, P. Natl. Acad. Sci. USA, 105, 8232–8237, https://doi.org/10.1073/PNAS.0711679105, 2008.
Bereiter, B., Schwander, J., Lüthi, D., and Stocker, T. F.: Change in CO2 concentration and ratio in ice cores due to molecular diffusion, Geophys. Res. Lett., 36, 2009L05703, https://doi.org/10.1029/2008GL036737, 2009.
Berger, A.: Long-Term Variations of Daily Insolation and Quaternary Climatic Changes, J. Atmos. Sci., 35, 2362–2367, https://doi.org/10.1175/1520-0469(1978)035<2362:LTVODI>2.0.CO;2, 1978.
Berger, B., Crucifix, M., Hodell, D. A., Mangili, C., McManus, J. F., Otto-Bliesner, B., Pol, K., Raynaud, D., Skinner, L. C., Tzedakis, P. C., Wolff, E. W., Yin, Q. Z., Abe-Ouchi, A., Barbante, C., Brovkin, V., Cacho, I., Capron, E., Ferretti, P., Ganopolski, A., Grimalt, J. O., Hönisch, B., Kawamura, K. A., Landais, A., Margari, V., Martrat, B., Masson-Delmotte, V., Mokeddem, Z., Parrenin, F., Prokopenko, A. A., Rashid, H., Schulz, M., and Vazquez Riveiros, N.: Interglacials of the last 800,000 years, Rev. Geophys., 54, 162–219, https://doi.org/10.1002/2015RG000482, 2016.
Boch, R., Cheng, H., Spötl, C., Edwards, R. L., Wang, X., and Häuselmann, P.: NALPS: a precisely dated European climate record 120–60 ka, Clim. Past, 7, 1247–1259, https://doi.org/10.5194/cp-7-1247-2011, 2011.
Bouchet, M., Parrenin, F., and Landais, A.: AICC2023 dating experiment using Paleochrono model, Zenodo [code], https://doi.org/10.5281/zenodo.10091515, 2023a.
Bouchet, M., Landais, A., Grisart, A., Parrenin, F., Prié, F., Jacob, R., Fourré, E., Capron, E., Raynaud, D., Lipenkov, V. Y., Loutre, M.-F., Extier, T., Svensson, A. M., Martinerie, P., Leuenberger, M. C., Jiang, W., Ritterbusch, F., Lu, Z.-T., and Yang, G.-M.: The Antarctic ice core chronology (AICC2023), PANGAEA [data set], https://doi.org/10.1594/PANGAEA.961017, 2023b.
Bouchet, M., Grisart, A., Landais, A., Prié, F., Jacob, R., and Fourré, E.: δON2 and δ18O of O2 from EPICA Dome C ice core (Antarctica) (0–800 ka), PANGAEA [data set], https://doi.org/10.1594/PANGAEA.961023, 2023c.
Bréant, C., Martinerie, P., Orsi, A., Arnaud, L., and Landais, A.: Modelling firn thickness evolution during the last deglaciation: constraints on sensitivity to temperature and impurities, Clim. Past, 13, 833–853, https://doi.org/10.5194/cp-13-833-2017, 2017.
Bréant, C., Landais, A., Orsi, A., Martinerie, P., Extier, T., Prié, F., Stenni, B., Jouzel, J., Masson-Delmotte, V., and Leuenberger, M.: Unveiling the anatomy of Termination 3 using water and air isotopes in the Dome C ice core, East Antarctica, Quaternary Sci. Rev., 211, 156–165, https://doi.org/10.1016/J.QUASCIREV.2019.03.025, 2019.
Buizert, C.: The Ice Core Gas Age-Ice Age Difference as a Proxy for Surface Temperature, Geophys. Res. Lett., 48, e2021GL094241, https://doi.org/10.1029/2021GL094241, 2021.
Buizert, C., Sowers, T., and Blunier, T.: Assessment of diffusive isotopic fractionation in polar firn, and application to ice core trace gas records, Earth Planet. Sc. Lett., 361, 110–119, https://doi.org/10.1016/J.EPSL.2012.11.039, 2013.
Buizert, C., Baggenstos, D., Jiang, W., Purtschert, R., Petrenko, V. V., Lu, Z. T., Müller, P., Kuhl, T., Lee, J., Severinghaus, J. P., and Brook, E. J.: Radiometric 81Kr dating identifies 120,000-year-old ice at Taylor Glacier, Antarctica, P. Natl. Acad. Sci. USA, 111, 6876–6881, https://doi.org/10.1073/pnas.1320329111, 2014.
Buizert, C., Cuffey, K. M., Severinghaus, J. P., Baggenstos, D., Fudge, T. J., Steig, E. J., Markle, B. R., Winstrup, M., Rhodes, R. H., Brook, E. J., Sowers, T. A., Clow, G. D., Cheng, H., Edwards, R. L., Sigl, M., McConnell, J. R., and Taylor, K. C.: The WAIS Divide deep ice core WD2014 chronology – Part 1: Methane synchronization (68–31 ka BP) and the gas age–ice age difference, Clim. Past, 11, 153–173, https://doi.org/10.5194/cp-11-153-2015, 2015.
Buizert, C., Sigl, M., Severi, M., Markle, B. R., Wettstein, J. J., McConnell, J. R., Pedro, J. B., Sodemann, H., Goto-Azuma, K., Kawamura, K., Fujita, S., Motoyama, H., Hirabayashi, M., Uemura, R., Stenni, B., Parrenin, F., He, F., Fudge, T. J., and Steig, E.: Abrupt ice-age shifts in southern westerly winds and Antarctic climate forced from the north, Nature, 563, 681–685, https://doi.org/10.1038/s41586-018-0727-5, 2018.
Capron, E., Landais, A., Chappellaz, J., Schilt, A., Buiron, D., Dahl-Jensen, D., Johnsen, S. J., Jouzel, J., Lemieux-Dudon, B., Loulergue, L., Leuenberger, M., Masson-Delmotte, V., Meyer, H., Oerter, H., and Stenni, B.: Millennial and sub-millennial scale climatic variations recorded in polar ice cores over the last glacial period, Clim. Past, 6, 345–365, https://doi.org/10.5194/cp-6-345-2010, 2010.
Capron, E., Landais, A., Chappellaz, J., Buiron, D., Fischer, H., Johnsen, S. J., Jouzel, J., Leuenberger, M., Masson-Delmotte, V., and Stocker, T. F.: A global picture of the first abrupt climatic event occurring during the last glacial inception, Geophys. Res. Lett., 39, L15703, https://doi.org/10.1029/2012GL052656, 2012.
Capron, E., Landais, A., Buiron, D., Cauquoin, A., Chappellaz, J., Debret, M., Jouzel, J., Leuenberger, M., Martinerie, P., Masson-Delmotte, V., Mulvaney, R., Parrenin, F., and Prié, F.: Glacial-interglacial dynamics of Antarctic firn columns: Comparison between simulations and ice core air-δ15N measurements, Clim. Past, 9, 983–999, https://doi.org/10.5194/cp-9-983-2013, 2013.
Cheng, H., Edwards, R. L., Sinha, A., Spötl, C., Yi, L., Chen, S., Kelly, M., Kathayat, G., Wang, X., Li, X., Kong, X., Wang, Y., Ning, Y., and Zhang, H.: The Asian monsoon over the past 640,000 years and ice age terminations, Nature, 534, 640–646, https://doi.org/10.1038/nature18591, 2016.
Columbu, A., Drysdale, R., Capron, E., Woodhead, J., De Waele, J., Sanna, L., Hellstrom, J., and Bajo, P.: Early last glacial intra-interstadial climate variability recorded in a Sardinian speleothem, Quaternary Sci. Rev., 169, 391–397, https://doi.org/10.1016/J.QUASCIREV.2017.05.007, 2017.
Crotti, I., Landais, A., Stenni, B., Bazin, L., Parrenin, F., Frezzotti, M., Ritterbusch, F., Lu, Z. T., Jiang, W., Yang, G. M., Fourré, E., Orsi, A., Jacob, R., Minster, B., Prié, F., Dreossi, G., and Barbante, C.: An extension of the TALDICE ice core age scale reaching back to MIS 10.1, Quaternary Sci. Rev., 266, 107078, https://doi.org/10.1016/J.QUASCIREV.2021.107078, 2021.
Dansgaard, W. and Johnsen, S. J.: A Flow Model and a Time Scale for the Ice Core from Camp Century, Greenland, J. Glaciol., 8, 215–223, https://doi.org/10.3189/S0022143000031208, 1969.
Dong, X. Z., Ritterbusch, F., Chu, Y. Q., Gu, J. Q., Hu, S. M., Jiang, W., Lu, Z. T., Yang, G. M., and Zhao, L.: Dual Separation of Krypton and Argon from Environmental Samples for Radioisotope Dating, Anal. Chem., 91, 13576–13581, https://doi.org/10.1021/ACS.ANALCHEM.9B02716, 2019.
Dreyfus, G. B., Parrenin, F., Lemieux-Dudon, B., Durand, G., Masson-Delmotte, V., Jouzel, J., Barnola, J. M., Panno, L., Spahni, R., Tisserand, A., Siegenthaler, U., and Leuenberger, M.: Anomalous flow below 2700 m in the EPICA Dome C ice core detected using δ18O of atmospheric oxygen measurements, Clim. Past, 3, 341–353, https://doi.org/10.5194/cp-3-341-2007, 2007.
Dreyfus, G. B., Raisbeck, G. M., Parrenin, F., Jouzel, J., Guyodo, Y., Nomade, S., and Mazaud, A.: An ice core perspective on the age of the Matuyama–Brunhes boundary, Earth Planet. Sc. Lett., 274, 151–156, https://doi.org/10.1016/J.EPSL.2008.07.008, 2008.
Dreyfus, G. B., Jouzel, J., Bender, M. L., Landais, A., Masson-Delmotte, V., and Leuenberger, M.: Firn processes and δ15N: potential for a gas-phase climate proxy, Quaternary Sci. Rev., 29, 28–42, https://doi.org/10.1016/j.quascirev.2009.10.012, 2010.
EPICA Community Members: Augustin, L., Barbante, C., Barnes, P. R. F., Barnola, J. M., Bigler, M., Castellano, E., Cattani, O., Chappellaz, J., Dahl-Jensen, D., Delmonte, B., Dreyfus, G., Durand, G., Falourd, S., Fischer, H., Flückiger, J., Hansson, M. E., Huybrechts, P., Jugie, G., Johnsen, S. J., Jouzel, J., Kaufmann, P., Kipfstuhl, J., Lambert, F., Lipenkov, V. Y., Littot, G. C., Longinelli, A., Lorrain, R., Maggi, V., Masson-Delmotte, V., Miller, H., Mulvaney, R., Oerlemans, J., Oerter, H., Orombelli, G., Parrenin, F., Peel, D. A., Petit, J. R., Raynaud, D., Ritz, C., Ruth, U., Schwander, J., Siegenthaler, U., Souchez, R., Stauffer, B., Steffensen, J. P., Stenni, B., Stocker, T. F., Tabacco, I. E., Udisti, R., van de Wal, R. S. W., van den Broeke, M., Weiss, J., Wilhelms, F., Winther, J. G., Wolff, E. W., and Zucchelli, M.: Eight glacial cycles from an Antarctic ice core, Nature, 429, 623–628, https://doi.org/10.1038/nature02599, 2004.
Epifanio, J. A., Brook, E. J., Buizert, C., Edwards, J. S., Sowers, T. A., Kahle, E. C., Severinghaus, J. P., Steig, E. J., Winski, D. A., Osterberg, E. C., Fudge, T. J., Aydin, M., Hood, E., Kalk, M., Kreutz, K. J., Ferris, D. G., and Kennedy, J. A.: The SP19 chronology for the South Pole Ice Core – Part 2: Gas chronology, Δage, and smoothing of atmospheric records, Clim. Past, 16, 2431–2444, https://doi.org/10.5194/cp-16-2431-2020, 2020.
Extier, T., Landais, A., Bréant, C., Prié, F., Bazin, L., Dreyfus, G., Roche, D. M., and Leuenberger, M.: On the use of δ18Oatm for ice core dating, Quaternary Sci. Rev., 185, 244–257, https://doi.org/10.1016/J.QUASCIREV.2018.02.008, 2018a.
Extier, T., Landais, A., Bréant, C., Prié, F., Bazin, L., Dreyfus, G., Roche, D. M., and Leuenberger, M. C.: δ18Oatm records between 100–800 ka from EPICA Dome C ice core, PANGAEA [data set], https://doi.org/10.1594/PANGAEA.887323, 2018b.
Extier, T., Landais, A., Bréant, C., Prié, F., Bazin, L., Dreyfus, G., Roche, D. M., and Leuenberger, M. C.: records between 100–800 ka from EPICA Dome C ice core, PANGAEA [data set], https://doi.org/10.1594/PANGAEA.887326, 2018c.
Freitag, J., Kipfstuhl, S., Laepple, T., and Wilhelms, F.: Impurity-controlled densification: a new model for stratified polar firn, J. Glaciol., 59, 1163–1169, https://doi.org/10.3189/2013JOG13J042, 2013.
Fujita, S., Parrenin, F., Severi, M., Motoyama, H., and Wolff, E. W.: Volcanic synchronization of Dome Fuji and Dome C Antarctic deep ice cores over the past 216 kyr, Clim. Past, 11, 1395–1416, https://doi.org/10.5194/cp-11-1395-2015, 2015.
Giaccio, B., Zanchetta, G., Galli, P., Nomade, S., Regattieri, E., and Sagnotti, L.: The Quaternary evolution of Sulmona basin, central Italy, https://inquaroma2023.org/wp-content/uploads/2022/01/5-Post.pdf (last access: 10 September 2023), 2023.
Goujon, C., Barnola, J. M., and Ritz, C.: Modeling the densification of polar firn including heat diffusion: Application to close-off characteristics and gas isotopic fractionation for Antarctica and Greenland sites, J. Geophys. Res.-Atmos., 108, 4792, https://doi.org/10.1029/2002JD003319, 2003.
Grachev, A. M. and Severinghaus, J. P.: Determining the thermal diffusion factor for 40Ar/36Ar in air to aid paleoreconstruction of abrupt climate change, J. Phys. Chem. A, 107, 4636–4642, https://doi.org/10.1021/JP027817U, 2003.
Grisart, A.: Étude à haute résolution des cycles hydrologiques et climatiques à partir d'une carotte de glace d'Antarctique avec un focus sur les déglaciations, Université Paris-Saclay, https://theses.hal.science/tel-04042459 (last access: 9 November 2023), 2023.
Heaton, T. J., Bard, E., Ramsey, C. B., Butzin, M., Köhler, P., Muscheler, R., Reimer, P. J., and Wacker, L.: Radiocarbon: A key tracer for studying Earth's dynamo, climate system, carbon cycle, and Sun, Science, 374, 6568, https://doi.org/10.1126/SCIENCE.ABD7096, 2021.
Herron, M. M. and Langway, C. C.: Firn densification: an empirical model, J. Glaciol., 25, 373–385, https://doi.org/10.3189/S0022143000015239, 1980.
Jiang, W., Hu, S. M., Lu, Z. T., Ritterbusch, F., and Yang, G.: min: Latest development of radiokrypton dating – A tool to find and study paleogroundwater, Quatern. Int., 547, 166–171, https://doi.org/10.1016/J.QUAINT.2019.04.025, 2020.
Jouzel, J., Hoffmann, G., Parrenin, F., and Waelbroeck, C.: Atmospheric oxygen 18 and sea-level changes, Quaternary Sci. Rev., 21, 307–314, https://doi.org/10.1016/S0277-3791(01)00106-8, 2002.
Jouzel, J., Masson-Delmotte, V., Cattani, O., Dreyfus, G., Falourd, S., Hoffmann, G., Minster, B., Nouet, J., Barnola, J. M., Chappellaz, J., Fischer, H., Gallet, J. C., Johnsen, S., Leuenberger, M., Loulergue, L., Luethi, D., Oerter, H., Parrenin, F., Raisbeck, G., Raynaud, D., Schilt, A., Schwander, J., Selmo, E., Souchez, R., Spahni, R., Stauffer, B., Steffensen, J. P., Stenni, B., Stocker, T. F., Tison, J. L., Werner, M., and Wolff, E. W.: Orbital and millennial antarctic climate variability over the past 800,000 years, Science, 317, 793–796, https://doi.org/10.1126/SCIENCE.1141038, 2007.
Kawamura, K., Parrenin, F., Lisiecki, L., Uemura, R., Vimeux, F., Severinghaus, J. P., Hutterli, M. A., Nakazawa, T., Aoki, S., Jouzel, J., Raymo, M. E., Matsumoto, K., Nakata, H., Motoyama, H., Fujita, S., Goto-Azuma, K., Fujii, Y., and Watanabe, O.: Northern Hemisphere forcing of climatic cycles in Antarctica over the past 360,000 years, Nature, 448, 912–916, https://doi.org/10.1038/nature06015, 2007.
Kuipers Munneke, P., Ligtenberg, S. R. M., Noël, B. P. Y., Howat, I. M., Box, J. E., Mosley-Thompson, E., McConnell, J. R., Steffen, K., Harper, J. T., Das, S. B., and Van Den Broeke, M. R.: Elevation change of the Greenland Ice Sheet due to surface mass balance and firn processes, 1960–2014, The Cryosphere, 9, 2009–2025, https://doi.org/10.5194/tc-9-2009-2015, 2015.
Landais, A., Chappellaz, J., Delmotte, M., Jouzel, J., Blunier, T., Bourg, C., Caillon, N., Cherrier, S., Malaizé, B., Masson-Delmotte, V., Raynaud, D., Schwander, J., and Steffensen, J. P.: A tentative reconstruction of the last interglacial and glacial inception in Greenland based on new gas measurements in the Greenland Ice Core Project (GRIP) ice core, J. Geophys. Res.-Atmos., 108, 4563, https://doi.org/10.1029/2002JD003147, 2003.
Landais, A., Barnola, J. M., Kawamura, K., Caillon, N., Delmotte, M., Van Ommen, T., Dreyfus, G., Jouzel, J., Masson-Delmotte, V., Minster, B., Freitag, J., Leuenberger, M., Schwander, J., Huber, C., Etheridge, D., and Morgan, V.: Firn-air δ15N in modern polar sites and glacial–interglacial ice: a model-data mismatch during glacial periods in Antarctica?, Quaternary Sci. Rev., 25, 49–62, https://doi.org/10.1016/J.QUASCIREV.2005.06.007, 2006.
Landais, A., Dreyfus, G., Capron, E., Masson-Delmotte, V., Sanchez-Goñi, M. F., Desprat, S., Hoffmann, G., Jouzel, J., Leuenberger, M., and Johnsen, S.: What drives the millennial and orbital variations of δ18Oatm?, Quaternary Sci. Rev., 29, 235–246, https://doi.org/10.1016/J.QUASCIREV.2009.07.005, 2010.
Landais, A., Dreyfus, G., Capron, E., Pol, K., Loutre, M. F., Raynaud, D., Lipenkov, V. Y., Arnaud, L., Masson-Delmotte, V., Paillard, D., Jouzel, J., and Leuenberger, M.: Towards orbital dating of the EPICA Dome C ice core using , Clim. Past, 8, 191–203, https://doi.org/10.5194/cp-8-191-2012, 2012.
Landais, A., Stenni, B., Masson-Delmotte, V., Jouzel, J., Cauquoin, A., Fourré, E., Minster, B., Selmo, E., Extier, T., Werner, M., Vimeux, F., Uemura, R., Crotti, I., and Grisart, A.: Interglacial Antarctic–Southern Ocean climate decoupling due to moisture source area shifts, Nat. Geosci., 14, 918–923, https://doi.org/10.1038/s41561-021-00856-4, 2021.
Lascu, I., Feinberg, J. M., Dorale, J. A., Cheng, H., and Edwards, R. L.: Age of the Laschamp excursion determined by U-Th dating of a speleothem geomagnetic record from North America, Geology, 44, 139–142, https://doi.org/10.1130/G37490.1, 2016.
Laskar, J., Robutel, P., Joutel, F., Gastineau, M., Correia, A. C. M., and Levrard, B.: A long-term numerical solution for the insolation quantities of the Earth, Astron. Astrophys., 428, 261–285, https://doi.org/10.1051/0004-6361:20041335, 2004.
Laskar, J., Fienga, A., Gastineau, M., and Manche, H.: La2010: a new orbital solution for the long-term motion of the Earth, Astron. Astrophys., 532, A89, https://doi.org/10.1051/0004-6361/201116836, 2011.
Lemieux-Dudon, B., Blayo, E., Petit, J. R., Waelbroeck, C., Svensson, A., Ritz, C., Barnola, J. M., Narcisi, B. M., and Parrenin, F.: Consistent dating for Antarctic and Greenland ice cores, Quaternary Sci. Rev., 29, 8–20, https://doi.org/10.1016/J.QUASCIREV.2009.11.010, 2010.
Lemieux-Dudon, B., Bazin, L., Landais, A., Toyé Mahamadou Kele, H., Guillevic, M., Kindler, P., Parrenin, F., and Martinerie, P.: Implementation of counted layers for coherent ice core chronology, Clim. Past, 11, 959–978, https://doi.org/10.5194/cp-11-959-2015, 2015.
Ligtenberg, S. R. M., Helsen, M. M., and Van Den Broeke, M. R.: An improved semi-empirical model for the densification of Antarctic firn, The Cryosphere, 5, 809–819, https://doi.org/10.5194/tc-5-809-2011, 2011.
Lipenkov, V., Candaudap, F., Ravoire, J., Dulac, E., and Raynaud, D.: A new device for the measurement of air content in polar ice, J. Glaciol., 41, 423–429, https://doi.org/10.3189/S0022143000016294, 1995.
Lipenkov, V. Y., Raynaud, D., Loutre, M. F., and Duval, P.: On the potential of coupling air content and O2/N2 from trapped air for establishing an ice core chronology tuned on local insolation, Quaternary Sci. Rev., 30, 3280–3289, https://doi.org/10.1016/J.QUASCIREV.2011.07.013, 2011.
Loulergue, L., Schilt, A., Spahni, R., Masson-Delmotte, V., Blunier, T., Lemieux, B., Barnola, J. M., Raynaud, D., Stocker, T. F., and Chappellaz, J.: Orbital and millennial-scale features of atmospheric CH4 over the past 800,000 years, Nature, 453, 383–386, https://doi.org/10.1038/nature06950, 2008.
Lu, Z. T., Schlosser, P., Smethie, W. M., Sturchio, N. C., Fischer, T. P., Kennedy, B. M., Purtschert, R., Severinghaus, J. P., Solomon, D. K., Tanhua, T., and Yokochi, R.: Tracer applications of noble gas radionuclides in the geosciences, Earth Sci. Rev., 138, 196–214, https://doi.org/10.1016/J.EARSCIREV.2013.09.002, 2014.
Moseley, G. E., Spötl, C., Brandstätter, S., Erhardt, T., Luetscher, M., and Lawrence Edwards, R.: NALPS19: Sub-orbital-scale climate variability recorded in northern Alpine speleothems during the last glacial period, Clim. Past, 16, 29–50, https://doi.org/10.5194/cp-16-29-2020, 2020.
Nehrbass-Ahles, C., Shin, J., Schmitt, J., Bereiter, B., Joos, F., Schilt, A., Schmidely, L., Silva, L., Teste, G., Grilli, R., Chappellaz, J., Hodell, D., Fischer, H., and Stocker, T. F.: Abrupt CO2 release to the atmosphere under glacial and early interglacial climate conditions, Science, 369, 1000–1005, https://doi.org/10.1126/SCIENCE.AAY8178, 2020.
Nomade, S., Bassinot, F., Marino, M., Simon, Q., Dewilde, F., Maiorano, P., Isguder, G., Blamart, D., Girone, A., Scao, V., Pereira, A., Toti, F., Bertini, A., Combourieu-Nebout, N., Peral, M., Bourlès, D. L., Petrosino, P., Gallicchio, S., and Ciaranfi, N.: High-resolution foraminifer stable isotope record of MIS 19 at Montalbano Jonico, southern Italy: A window into Mediterranean climatic variability during a low-eccentricity interglacial, Quaternary Sci. Rev., 205, 106–125, https://doi.org/10.1016/j.quascirev.2018.12.008, 2019.
Nye, J. F.: The motion of ice sheets and glaciers, J. Glaciol., 3, 493–507, https://doi.org/10.3189/S002214300001724X, 1959.
Oraschewski, F. M. and Grinsted, A.: Modeling enhanced firn densification due to strain softening, The Cryosphere, 16, 2683–2700, https://doi.org/10.5194/tc-16-2683-2022, 2022.
Oyabu, I., Kawamura, K., Buizert, C., Parrenin, F., Orsi, A., Kitamura, K., Aoki, S., and Nakazawa, T.: The Dome Fuji ice core DF2021 chronology (0–207 kyr BP), Quaternary Sci. Rev., 294, 107754, https://doi.org/10.1016/J.QUASCIREV.2022.107754, 2022.
Parrenin, F., Rémy, F., Ritz, C., Siegert, M. J., and Jouzel, J.: New modeling of the Vostok ice flow line and implication for the glaciological chronology of the Vostok ice core, J. Geophys. Res.-Atmos., 109, D20102, https://doi.org/10.1029/2004JD004561, 2004.
Parrenin, F., Dreyfus, G., Durand, G., Fujita, S., Gagliardini, O., Gillet, F., Jouze, J., Kawamura, K., Lhomme, N., Masson-Delmotte, V., Ritz, C., Schwander, J., Shoji, H., Uemura, R., Watanabe, O., and Yoshida, N.: 1-D-ice flow modelling at EPICA Dome C and Dome Fuji, East Antarctica, Clim. Past, 3, 243–259, https://doi.org/10.5194/cp-3-243-2007, 2007a.
Parrenin, F., Barnola, J.-M., Beer, J., Blunier, T., Castellano, E., Chappellaz, J., Dreyfus, G., Fischer, H., Fujita, S., Jouzel, J., Kawamura, K., Lemieux-Dudon, B., Loulergue, L., Masson-Delmotte, V., Narcisi, B., Petit, J.-R., Raisbeck, G., Raynaud, D., Ruth, U., Schwander, J., Severi, M., Spahni, R., Steffensen, J. P., Svensson, A., Udisti, R., Waelbroeck, C., and Wolff, E.: The EDC3 chronology for the EPICA Dome C ice core, Clim. Past, 3, 485–497, https://doi.org/10.5194/cp-3-485-2007, 2007b.
Parrenin, F., Barker, S., Blunier, T., Chappellaz, J., Jouzel, J., Landais, A., Masson-Delmotte, V., Schwander, J., and Veres, D.: On the gas-ice depth difference (Δdepth) along the EPICA Dome C ice core, Clim. Past, 8, 1239–1255, https://doi.org/10.5194/cp-8-1239-2012, 2012.
Parrenin, F., Bazin, L., Capron, E., Landais, A., Lemieux-Dudon, B., Masson-Delmotte, V., Parrenin, F., Bazin, L., Capron, E., Landais, A., Lemieux-Dudon, B., and Masson-Delmotte, V.: IceChrono1: a probabilistic model to compute a common and optimal chronology for several ice cores, Geosci. Model Dev., 8, 1473–1492, https://doi.org/10.5194/gmd-8-1473-2015, 2015.
Parrenin, F., Bazin, L., Capron, É., Landais, A., Lemieux-Dudon, B., and Masson-Delmotte, V.: Icechrono1: un modèle probabiliste pour calculer une chronologie commune et optimale pour plusieurs carottes de glace, Quaternaire, 28, 179–184, https://doi.org/10.4000/QUATERNAIRE.8121, 2017.
Parrenin, F., Bazin, L., Buizert, C., Capron, E., Chowdry Beeman, J., Corrick, E., Drysdale, R., Kawamura, K., Landais, A., Mulvaney, R., Oyabu, I., and Rasmussen, S.: The Paleochrono probabilistic model to derive a consistent chronology for several paleoclimatic sites, EGUGA, EGU21-822, https://doi.org/10.5194/EGUSPHERE-EGU21-822, 2021.
Petit, J. R., Jouzel, J., Raynaud, D., Barkov, N. I., Barnola, J. M., Basile, I., Bender, M., Chappellaz, J., Davis, M., Delaygue, G., Delmotte, M., Kotiyakov, V. M., Legrand, M., Lipenkov, V. Y., Lorius, C., Pépin, L., Ritz, C., Saltzman, E., and Stievenard, M.: Climate and atmospheric history of the past 420,000 years from the Vostok ice core, Antarctica, Nature, 399, 429–436, https://doi.org/10.1038/20859, 1999.
Pimienta, P. and Duval, P.: Rate controlling processes in the creep of polar glacier ice, Journal de Physique Colloques, 48, C1-243–C1-248, https://doi.org/10.1051/jphyscol:1987134, 1987.
Raisbeck, G. M., Yiou, F., Jouzel, J., and Stocker, T. F.: Direct north–south synchronization of abrupt climate change record in ice cores using Beryllium 10, Clim. Past, 3, 541–547, https://doi.org/10.5194/cp-3-541-2007, 2007.
Raisbeck, G. M., Cauquoin, A., Jouzel, J., Landais, A., Petit, J. R., Lipenkov, V. Y., Beer, J., Synal, H. A., Oerter, H., Johnsen, S. J., Steffensen, J. P., Svensson, A., and Yiou, F.: An improved north–south synchronization of ice core records around the 41 kyr 10Be peak, Clim. Past, 13, 217–229, https://doi.org/10.5194/cp-13-217-2017, 2017.
Raynaud, D., Lipenkov, V., Lemieux-Dudon, B., Duval, P., Loutre, M. F., and Lhomme, N.: The local insolation signature of air content in Antarctic ice. A new step toward an absolute dating of ice records, Earth Planet. Sc. Lett., 261, 337–349, https://doi.org/10.1016/J.EPSL.2007.06.025, 2007.
Reutenauer, C., Landais, A., Blunier, T., Bréant, C., Kageyama, M., Woillez, M. N., Risi, C., Mariotti, V., and Braconnot, P.: Quantifying molecular oxygen isotope variations during a Heinrich stadial, Clim. Past, 11, 1527–1551, https://doi.org/10.5194/cp-11-1527-2015, 2015.
Sánchez Goñi, M. F., Landais, A., Fletcher, W. J., Naughton, F., Desprat, S., and Duprat, J.: Contrasting impacts of Dansgaard–Oeschger events over a western European latitudinal transect modulated by orbital parameters, Quaternary Sci. Rev., 27, 1136–1151, https://doi.org/10.1016/J.QUASCIREV.2008.03.003, 2008.
Schwander, J., Jouzel, J., Hammer, C. U., Petit, J. R., Udisti, R., and Wolff, E.: A tentative chronology for the EPICA Dome Concordia Ice Core, Geophys. Res. Lett., 28, 4243–4246, https://doi.org/10.1029/2000GL011981, 2001.
Severinghaus, J. P., Bender, M. L., Keeling, R. F., and Broecker, W. S.: Fractionation of soil gases by diffusion of water vapor, gravitational settling, and thermal diffusion, Geochim. Cosmochim. Ac., 60, 1005–1018, https://doi.org/10.1016/0016-7037(96)00011-7, 1996.
Shackleton, N. J.: The 100,000-year ice-age cycle identified and found to lag temperature, carbon dioxide, and orbital eccentricity, Science, 289, 1897–1902, https://doi.org/10.1126/SCIENCE.289.5486.1897, 2000.
Sigl, M., Fudge, T. J., Winstrup, M., Cole-Dai, J., Ferris, D., McConnell, J. R., Taylor, K. C., Welten, K. C., Woodruff, T. E., Adolphi, F., Bisiaux, M., Brook, E. J., Buizert, C., Caffee, M. W., Dunbar, N. W., Edwards, R., Geng, L., Iverson, N., Koffman, B., Layman, L., Maselli, O. J., McGwire, K., Muscheler, R., Nishiizumi, K., Pasteris, D. R., Rhodes, R. H., and Sowers, T. A.: The WAIS Divide deep ice core WD2014 chronology – Part 2: Annual-layer counting (0–31 ka BP), Clim. Past, 12, 769–786, https://doi.org/10.5194/cp-12-769-2016, 2016.
Simon, Q., Bourlès, D. L., Bassinot, F., Nomade, S., Marino, M., Ciaranfi, N., Girone, A., Maiorano, P., Thouveny, N., Choy, S., Dewilde, F., Scao, V., Isguder, G. and Blamart, D., Authigenic ratio signature of the Matuyama–Brunhes boundary in the Montalbano Jonico marine succession, Earth Planet. Sc. Lett., 460, 255–267, https://doi.org/10.1016/j.epsl.2016.11.052, 2017.
Suwa, M. and Bender, M. L.: Chronology of the Vostok ice core constrained by ratios of occluded air, and its implication for the Vostok climate records, Quaternary Sci. Rev., 27, 1093–1106, https://doi.org/10.1016/J.QUASCIREV.2008.02.017, 2008.
Svensson, A., Andersen, K. K., Bigler, M., Clausen, H. B., Dahl-Jensen, D., Davies, S. M., Johnsen, S. J., Muscheler, R., Parrenin, F., Rasmussen, S. O., Röthlisberger, R., Seierstad, I., Steffensen, J. P., and Vinther, B. M.: A 60 000 year Greenland stratigraphic ice core chronology, Clim. Past, 4, 47–57, https://doi.org/10.5194/cp-4-47-2008, 2008.
Svensson, A., Bigler, M., Blunier, T., Clausen, H. B., Dahl-Jensen, D., Fischer, H., Fujita, S., Goto-Azuma, K., Johnsen, S. J., Kawamura, K., Kipfstuhl, S., Kohno, M., Parrenin, F., Popp, T., Rasmussen, S. O., Schwander, J., Seierstad, I., Severi, M., Steffensen, J. P., Udisti, R., Uemura, R., Vallelonga, P., Vinther, B. M., Wegner, A., Wilhelms, F., and Winstrup, M.: Direct linking of Greenland and Antarctic ice cores at the Toba eruption (74 ka BP), Clim. Past, 9, 749–766, https://doi.org/10.5194/cp-9-749-2013, 2013.
Svensson, A., Dahl-Jensen, D., Steffensen, J. P., Blunier, T., Rasmussen, S. O., Vinther, B. M., Vallelonga, P., Capron, E., Gkinis, V., Cook, E., Kjær, H. A., Muscheler, R., Kipfstuhl, S., Wilhelms, F., Stocker, T. F., Fischer, H., Adolphi, F., Erhardt, T., Sigl, M., Landais, A., Parrenin, F., Buizert, C., McConnell, J. R., Severi, M., Mulvaney, R., and Bigler, M.: Bipolar volcanic synchronization of abrupt climate change in Greenland and Antarctic ice cores during the last glacial period, Clim. Past, 16, 1565–1580, https://doi.org/10.5194/cp-16-1565-2020, 2020.
Tian, L., Ritterbusch, F., Gu, J. Q., Hu, S. M., Jiang, W., Lu, Z. T., Wang, D., and Yang, G. M.: 81Kr Dating at the Guliya Ice Cap, Tibetan Plateau, Geophys. Res. Lett., 46, 6636–6643, https://doi.org/10.1029/2019GL082464, 2019.
Tison, J.-L., de Angelis, M., Littot, G., Wolff, E., Fischer, H., Hansson, M., Bigler, M., Udisti, R., Wegner, A., Jouzel, J., Stenni, B., Johnsen, S., Masson-Delmotte, V., Landais, A., Lipenkov, V., Loulergue, L., Barnola, J.-M., Petit, J.-R., Delmonte, B., Dreyfus, G., Dahl-Jensen, D., Durand, G., Bereiter, B., Schilt, A., Spahni, R., Pol, K., Lorrain, R., Souchez, R., and Samyn, D.: Retrieving the paleoclimatic signal from the deeper part of the EPICA Dome C ice core, The Cryosphere, 9, 1633–1648, https://doi.org/10.5194/tc-9-1633-2015, 2015.
Uemura, R., Motoyama, H., Masson-Delmotte, V., Jouzel, J., Kawamura, K., Goto-Azuma, K., Fujita, S., Kuramoto, T., Hirabayashi, M., Miyake, T., Ohno, H., Fujita, K., Abe-Ouchi, A., Iizuka, Y., Horikawa, S., Igarashi, M., Suzuki, K., Suzuki, T., and Fujii, Y.: Asynchrony between Antarctic temperature and CO2 associated with obliquity over the past 720,000 years, Nat. Commun., 9, 1–11, https://doi.org/10.1038/s41467-018-03328-3, 2018.
Veres, D., Bazin, L., Landais, A., Toyé Mahamadou Kele, H., Lemieux-Dudon, B., Parrenin, F., Martinerie, P., Blayo, E., Blunier, T., Capron, E., Chappellaz, J., Rasmussen, S. O., Severi, M., Svensson, A., Vinther, B., and Wolff, E. W.: The Antarctic ice core chronology (AICC2012): an optimized multi-parameter and multi-site dating approach for the last 120 thousand years, Clim. Past, 9, 1733–1748, https://doi.org/10.5194/cp-9-1733-2013, 2013.
Wolff, E.: Recommendation of AICC2023 by EPICA SSC, https://doi.org/10.5194/egusphere-2023-1081-CC1, 2023.
Wolff, E. W., Chappellaz, J., Blunier, T., Rasmussen, S. O., and Svensson, A.: Millennial-scale variability during the last glacial: The ice core record, Quaternary Sci. Rev., 29, 2828–2838, https://doi.org/10.1016/J.QUASCIREV.2009.10.013, 2010.
Yan, Y., Bender, M. L., Brook, E. J., Clifford, H. M., Kemeny, P. C., Kurbatov, A. v., Mackay, S., Mayewski, P. A., Ng, J., Severinghaus, J. P., and Higgins, J. A.: Two-million-year-old snapshots of atmospheric gases from Antarctic ice, Nature, 574, 663–666, https://doi.org/10.1038/s41586-019-1692-3, 2019.
Yiou, F., Raisbeck, G. M., Baumgartner, S., Beer, J., Hammer, C., Johnsen, S., Jouzel, J., Kubik, P. W., Lestringuez, J., Stiévenard, M., Suter, M., and Yiou, P.: Beryllium 10 in the Greenland Ice Core Project ice core at Summit, Greenland, J. Geophys. Res.-Oceans, 102, 26783–26794, https://doi.org/10.1029/97JC01265, 1997.
Zappala, J. C., Baggenstos, D., Gerber, C., Jiang, W., Kennedy, B. M., Lu, Z. T., Masarik, J., Mueller, P., Purtschert, R., and Visser, A.: Atmospheric 81Kr as an Integrator of Cosmic-Ray Flux on the Hundred-Thousand-Year Time Scale, Geophys. Res. Lett., 47, e2019GL086381, https://doi.org/10.1029/2019GL086381, 2020.
Zhao, X., Cheng, H., Sinha, A., Zhang, H., Baker, J. L., Chen, S., Kong, X., Wang, Y., Edwards, R. L., Ning, Y., and Zhao, J.: A High-Resolution Speleothem Record of Marine Isotope Stage 11 as a Natural Analog to Holocene Asian Summer Monsoon Variations, Geophys. Res. Lett., 46, 9949–9957, https://doi.org/10.1029/2019GL083836, 2019.