the Creative Commons Attribution 4.0 License.
the Creative Commons Attribution 4.0 License.
 | 01 Nov 2023
Reconstructing 15 000 years of southern France temperatures from coupled pollen and molecular (branched glycerol dialkyl glycerol tetraether) markers (Canroute, Massif Central)
Léa d'Oliveira
Lucas Dugerdil
Guillemette Ménot
Allowen Evin
Serge D. Muller
Salomé Ansanay-Alex
Julien Azuara
Colline Bonnet
Laurent Bremond
Mehmet Shah
Odile Peyron
Climatic changes in southern Europe during the Holocene are characterized by a strong spatial and temporal heterogeneity whose patterns are still poorly understood, notably the presence or not of a Holocene thermal maximum (HTM; 10 000–6000 cal BP). The climatic patterns also differ according to the proxies used (e.g. pollen, chironomid) and the latitude of the record. Here, a multi-proxy approach combining pollen and lipid biomarkers (branched glycerol dialkyl glycerol tetraethers, brGDGTs) is applied to the Canroute sedimentological sequence (Massif Central, France) to reconstruct the climatic variation over the last 15 000 years in southern Europe. This area is poorly documented in terms of vegetation and climate change. To provide reliable climate reconstructions, we have (1) performed a multi-method approach applied to pollen (modern analogue technique, MAT; weighted averaging partial least squares regression, WA-PLS; boosted regression trees, BRT; and random forest, RF) and molecular biomarkers brGDGTs (five calibrations) and (2) investigated the role of modern databases and calibrations in climate reconstructions. Three different databases were tested for pollen data: one global database based on a Eurasian pollen database and two regional databases corresponding to Mediterranean–Temperate Europe and Temperate Europe–Scandinavian databases respectively. Five global calibrations were tested for lipid biomarkers including four for soil and one for peat. Results show that the use of different modern databases highlights the importance of considering environmental and ecological constraints when using transfer functions on pollen sequences. Pollen- and brGDGT-inferred climate trends are consistent, notably for the Late Glacial and the Early and Late Holocene. However, the reconstructions notably differ concerning the presence of a Holocene thermal maximum with the MAT pollen-based method, but no difference is apparent with the BRT pollen method nor brGDGT. The temperature reconstructions estimated from the two independent pollen and lipid proxies are then compared to regional climate signals (chironomids, pollen, molecular biomarkers) to better understand global regional climatic patterns in southern Europe. Altogether, our results from the Canroute sequence and those already available in southern Europe reveal that for the Late Glacial and Early Holocene, the regional climate trends are consistent between sites and proxies, supporting the reliability of their reconstructions despite some discrepancies. During the Holocene, the temperature signal of Canroute does not indicate the clear presence of a pronounced HTM, but rather stable temperatures.
- Article
(10288 KB) - Full-text XML
- BibTeX
- EndNote


The Holocene epoch (last 11 700 cal BP) is considered to be a stable climatic period compared to the previous Late Glacial period, which corresponds to the deglaciation between ca. 15 000 and 11 700 cal BP and alternating phases of rapid warming and cooling (Mayewski et al., 2004). However, the Holocene demonstrates regional climate oscillations at millennial and centennial timescales (Smith et al., 2016). In Europe, at a millennial scale, palaeoclimatological studies have indicated the occurrence of a Middle Holocene thermic optimum called the “Holocene thermal maximum” (HTM) (Liu et al., 2014) dated between 10 000 and 6000 cal BP (e.g. Renssen et al., 2012; Marcott et al., 2013; Kaufman et al., 2020; Cartapanis et al., 2022). The temperature trends during this optimum show strong latitudinal patterns which differ between regions (Herzschuh et al., 2023). Marine proxies record an optimum in southern Europe and the Mediterranean region (Kaufman et al., 2020; Marriner et al., 2022), but this optimum is not clear for terrestrial proxies. Several studies suggest major differences according to region and latitude, as well as the proxy or seasonal parameter studied (Samartin et al., 2017; Erb et al., 2022). Pollen-based palaeoclimate studies have highlighted the Holocene climate heterogeneity in southern Europe and suggest for the Middle Holocene similar or cooler conditions than the current ones (Cheddadi et al., 1997; Davis et al., 2003; Mauri et al., 2015; Marsicek et al., 2018; Erb et al., 2022; Herzschuh et al., 2023). However, these climate patterns are not supported by atmospheric climate model outputs, which indicate a clear warming of northern and southern Europe during the Holocene (Mauri et al., 2014; Liu et al., 2014; Erb et al., 2022). This highlights the need for further palaeoclimatic studies in this region based on independent proxies, particularly in southern Europe, for which the past climate remains poorly understood (Peyron et al., 2013, 2017; Samartin et al., 2017).
Terrestrial records provide especially useful information on climate change. However, terrestrial records can be influenced by environmental factors (e.g. erosion on detrital activity, elevation), which makes the responses of continental ecosystems to climate change difficult to interpret (Martin et al., 2020). Erosion has an impact on the detrital contribution to terrestrial archives; its dynamics are linked to, but not solely to, climate changes. Land clearing, for example, can increase detrital activity and so impact the terrestrial record (van Andel et al., 1990). Peatlands are powerful environmental archives, used in palaeoecology for their capacity to conserve palaeoclimatic markers (Moore, 1989). The accumulation and preservation of pollen and other proxies in peatlands make it possible to reconstruct quantitatively variations in climatic parameters, such as mean annual and/or seasonal temperatures and/or precipitation (Salonen et al., 2019). Peatlands are particularly rich in organic matter, conducive to the presence of lipid biomarkers such as glycerol dialkyl glycerol tetraethers (GDGTs) (Naafs et al., 2019), whose distribution and abundance are partly governed by environmental (e.g. pH) and climatic (e.g. temperature) factors, making them ideal proxies for palaeoclimatic reconstructions in the continental domain (Raberg et al., 2022). However, little research based on GDGTs has been conducted on the continental realm thus far, with the majority focused on lacustrine environments (c.f., Sun et al., 2011; Sinninghe Damsté, 2016; Russell et al., 2018).
In recent years, quantitative reconstructions of temperature based on branched GDGTs (brGDGTs) were proposed in both marine and continental ecosystems (e.g. Schouten et al., 2013; Zheng et al., 2015, 2018; Ardenghi et al., 2019; Rodrigo-Gámiz et al., 2022; Dugerdil et al., 2021a, b). Transmembrane lipids, synthesized by Archaea or Bacteria (Weijers et al., 2009; Pearson and Ingalls, 2013), have been identified in a wide range of environments including soils, peat, and lake and marine sediments (Hopmans et al., 2004; Weijers et al., 2006; Huguet et al., 2010; Pearson et al., 2011; Peterse et al., 2012; De Jonge et al., 2014b; Li et al., 2016; Naafs et al., 2017a, b). Two main families of GDGTs can be distinguished: isoprenoid GDGTs (isoGDGTs) and brGDGTs. Although the archaeal (Thaumarchaeota) origin of isoGDGTs has been validated, the brGDGTs' source remains a subject of debate and investigation (Sahonero-Canavesi et al., 2022; Zeng et al., 2022). However, recent studies have shown GDGT production in bacterial culture (Chen et al., 2022; Halamka et al., 2023), supporting a bacterial origin for brGDGTs. A relationship between the structure of biomolecules synthesized by organisms and environmental conditions to maintain cell viability has been demonstrated (Weijers et al., 2004; Naafs et al., 2021). More specifically, relationships between the degree of methylation and temperature (MBT) as well as between the degree of cyclization (CBT) and pH have been documented (Weijers et al., 2004, 2007). Furthermore, studies showed the presence of methyl isomers at the C6 position (6-methyl isomer), which when excluded from the MBT index resulted in the better-temperature-correlated MBT'5Me index (Naafs et al., 2017b), and a novel C7 position (7-methyl isomer) that co-elute with the 5- and 6-methyl brGDGTs (Ding et al., 2016). De Jonge et al. (2019) revealed that brGDGTs had a varied relationship with temperature and pH in “warm” and “cold” bacterial communities, demonstrating that those correlations are also reliant on the bacterial population. A “community index” (CI ratio; De Jonge et al., 2019) has been defined to assess whether there is a change between the bacterial community and temperature or pH. De Jonge et al. (2019) determined a threshold value of 0.64 to separate the two groups of bacterial communities. If the CI ratio threshold is exceeded, a shift in the bacterial communities might be predicted, perhaps affecting the relationship between brGDGTs and temperature or pH (De Jonge et al., 2021). Furthermore, edaphic factors such as anoxic or oxic conditions have an impact on GDGT production and bacterial communities (Weber et al., 2018). Because crenarchaeol and GDGT-0 can be derived from Group I Crenarchaeota, the GDGT-0 crenarchaeol ratio can be used to investigate the presence of methanogenic Archaea that thrive in anoxic conditions in sediments, whereas methanogenic Archaea synthesize GDGT-0, but no crenarchaeol (Blaga et al., 2009). The lower the ratio, the lower the anoxic conditions. Indices and calibrations have been developed to allow quantitative reconstruction of palaeotemperatures based on archive type and region (Weijers et al., 2007; Peterse et al., 2012; De Jonge et al., 2014b; Naafs et al., 2017a, b; Dearing Crampton-Flood et al., 2020). These calibrations were developed from global databases that group together surface samples, for which the current climatic conditions are known, from distinct types of substrates: soils (Peterse et al., 2012; De Jonge et al., 2014b; Naafs et al., 2017b; Dearing Crampton-Flood et al., 2020), lake sediments (Russell et al., 2018; Martinez-Sosa et al., 2021; Raberg et al., 2021; Zhao et al., 2023), and peat (Naafs et al., 2017a).
The use of brGDGTs to reconstruct annual temperatures in Europe during the Late Glacial and/or the Holocene is still rare (e.g. Martin et al., 2020; Robles et al., 2023; Rodrigo-Gámiz et al., 2022; Ramos-Roman et al., 2022). Due to the complexity and number of interactions throughout each ecosystem (Birks and Birks, 2006), it is advisable to use several independent proxies to obtain reliable temperature reconstructions (e.g. Ponel et al., 2022). The general assumption is that all proxies used to reconstruct climate changes are to some extent dependent on climatic parameters, but other factors, including human activities, biological processes, edaphic conditions, pH shift, and so on, can influence their distribution and/or abundance (Sugita et al., 2006; Huguet et al., 2010; Martin et al., 2020; De Jonge et al., 2021). In peat, this local environmental context can be understood through geochemical and sedimentary analyses based on X-ray fluorescence analysis (XRF) or loss on ignition (LOI) to investigate mineral inputs and organic matter content. However, the pollen record can also be influenced by anthropogenic, biological, and environmental processes which can alter pollen production, dispersal, and preservation (Sugita et al., 2006). Production of molecular biomarkers, such as brGDGTs, may also differ depending on the source, edaphic parameters (e.g. anoxic or oxic conditions), soil type, and vegetation (Weber et al., 2018; De Jonge et al., 2021; Robles et al., 2022). Human activities, like deforestation and agriculture, can disturb the natural record of the vegetation–climate interaction, resulting in a biased quantitative reconstruction of climatic parameters from pollen data (Seppä and Bennett, 2003; Birks and Seppä, 2004). Furthermore, several studies document anthropogenic impacts on bacterial communities, demonstrating that reconstructions based on brGDGTs might be disrupted by human intervention in specific contexts, such as watersheds (Martin et al., 2019). In addition, due to the still significant calibration errors (±3.8 to ±5.5 ∘C), brGDGT-based palaeoclimate quantification should be interpreted with caution for periods with small temperature changes (<2 ∘C), as is the case for the Late Holocene (last 2000 years) (Naafs et al., 2019). In this sense, multi-proxy approaches are one of the best ways to estimate the reliability of quantitative climate reconstructions, as it is easier to disentangle local from regional events (Ponel et al., 2022). Although some studies compare palaeoclimatic reconstructions based on pollen and brGDGTs, allowing complementary and more robust interpretations to be reached (Martin et al., 2020; Dugerdil et al., 2021a, b; Robles et al., 2022, 2023; Ramos-Roman et al., 2022; Watson et al., 2018), very few have been carried out on peat sequences, with none of them concerning south-western Europe and the Mediterranean region nor covering the entire last 15 000 years.
The aim of this study is (1) to address Holocene regional climate variability within the context of the Holocene thermal maximum in southern Europe from a peat sequence extracted in southern Massif Central (Canroute peatland) using a pollen–brGDGTs multi-proxy approach; (2) to contribute to palaeoclimatic reconstructions based on brGDGTs extracted from peat, which are still very little addressed in the field of biogeochemistry; and (3) to improve the reliability of the climate signal obtained from pollen data thanks to a multi-method approach (i.e. using four different methods including recent machine learning such as boosted regression trees) and the use of three modern pollen databases (regional to global).
2.1 Study area
The Canroute peatland ( N, E; 790 m altitude; Fig. 1a) is located in the south of the Massif Central (France), in the Monts de Lacaune. This soligenous Sphagnum peatland is supplied by several streams and small springs (Muller et al., 2018; Fig. 1b) and harbours a diversified vegetation including several species associated with the western Atlantic Ocean influence. The peatland is located at the confluence of three distinct climatic regimes: Mediterranean influence from the south; the influence of the Atlantic Ocean from the west due to Atlantic air masses arriving from the country's west coast, which are not prevented by any topographical obstacles in the Aquitaine Basin; and a mountainous regime from the north (Fig. 1a). These influences result in an average annual temperature of 9.5 ∘C, a temperature seasonality (TS; standard deviation of the monthly mean temperatures) of 0.5 ∘C (WorldClim 2.0; Fick and Hijmans, 2017), higher summer temperatures, and an average annual rainfall of 895 mm with a slightly drier summer period (Fig. 1c and Table A1; CRU TS version 4.06; Harris et al., 2020) and a precipitation seasonality (SoP; standard deviation of the monthly precipitation) of 21 (WorldClim 2.0; Fick and Hijmans, 2017).
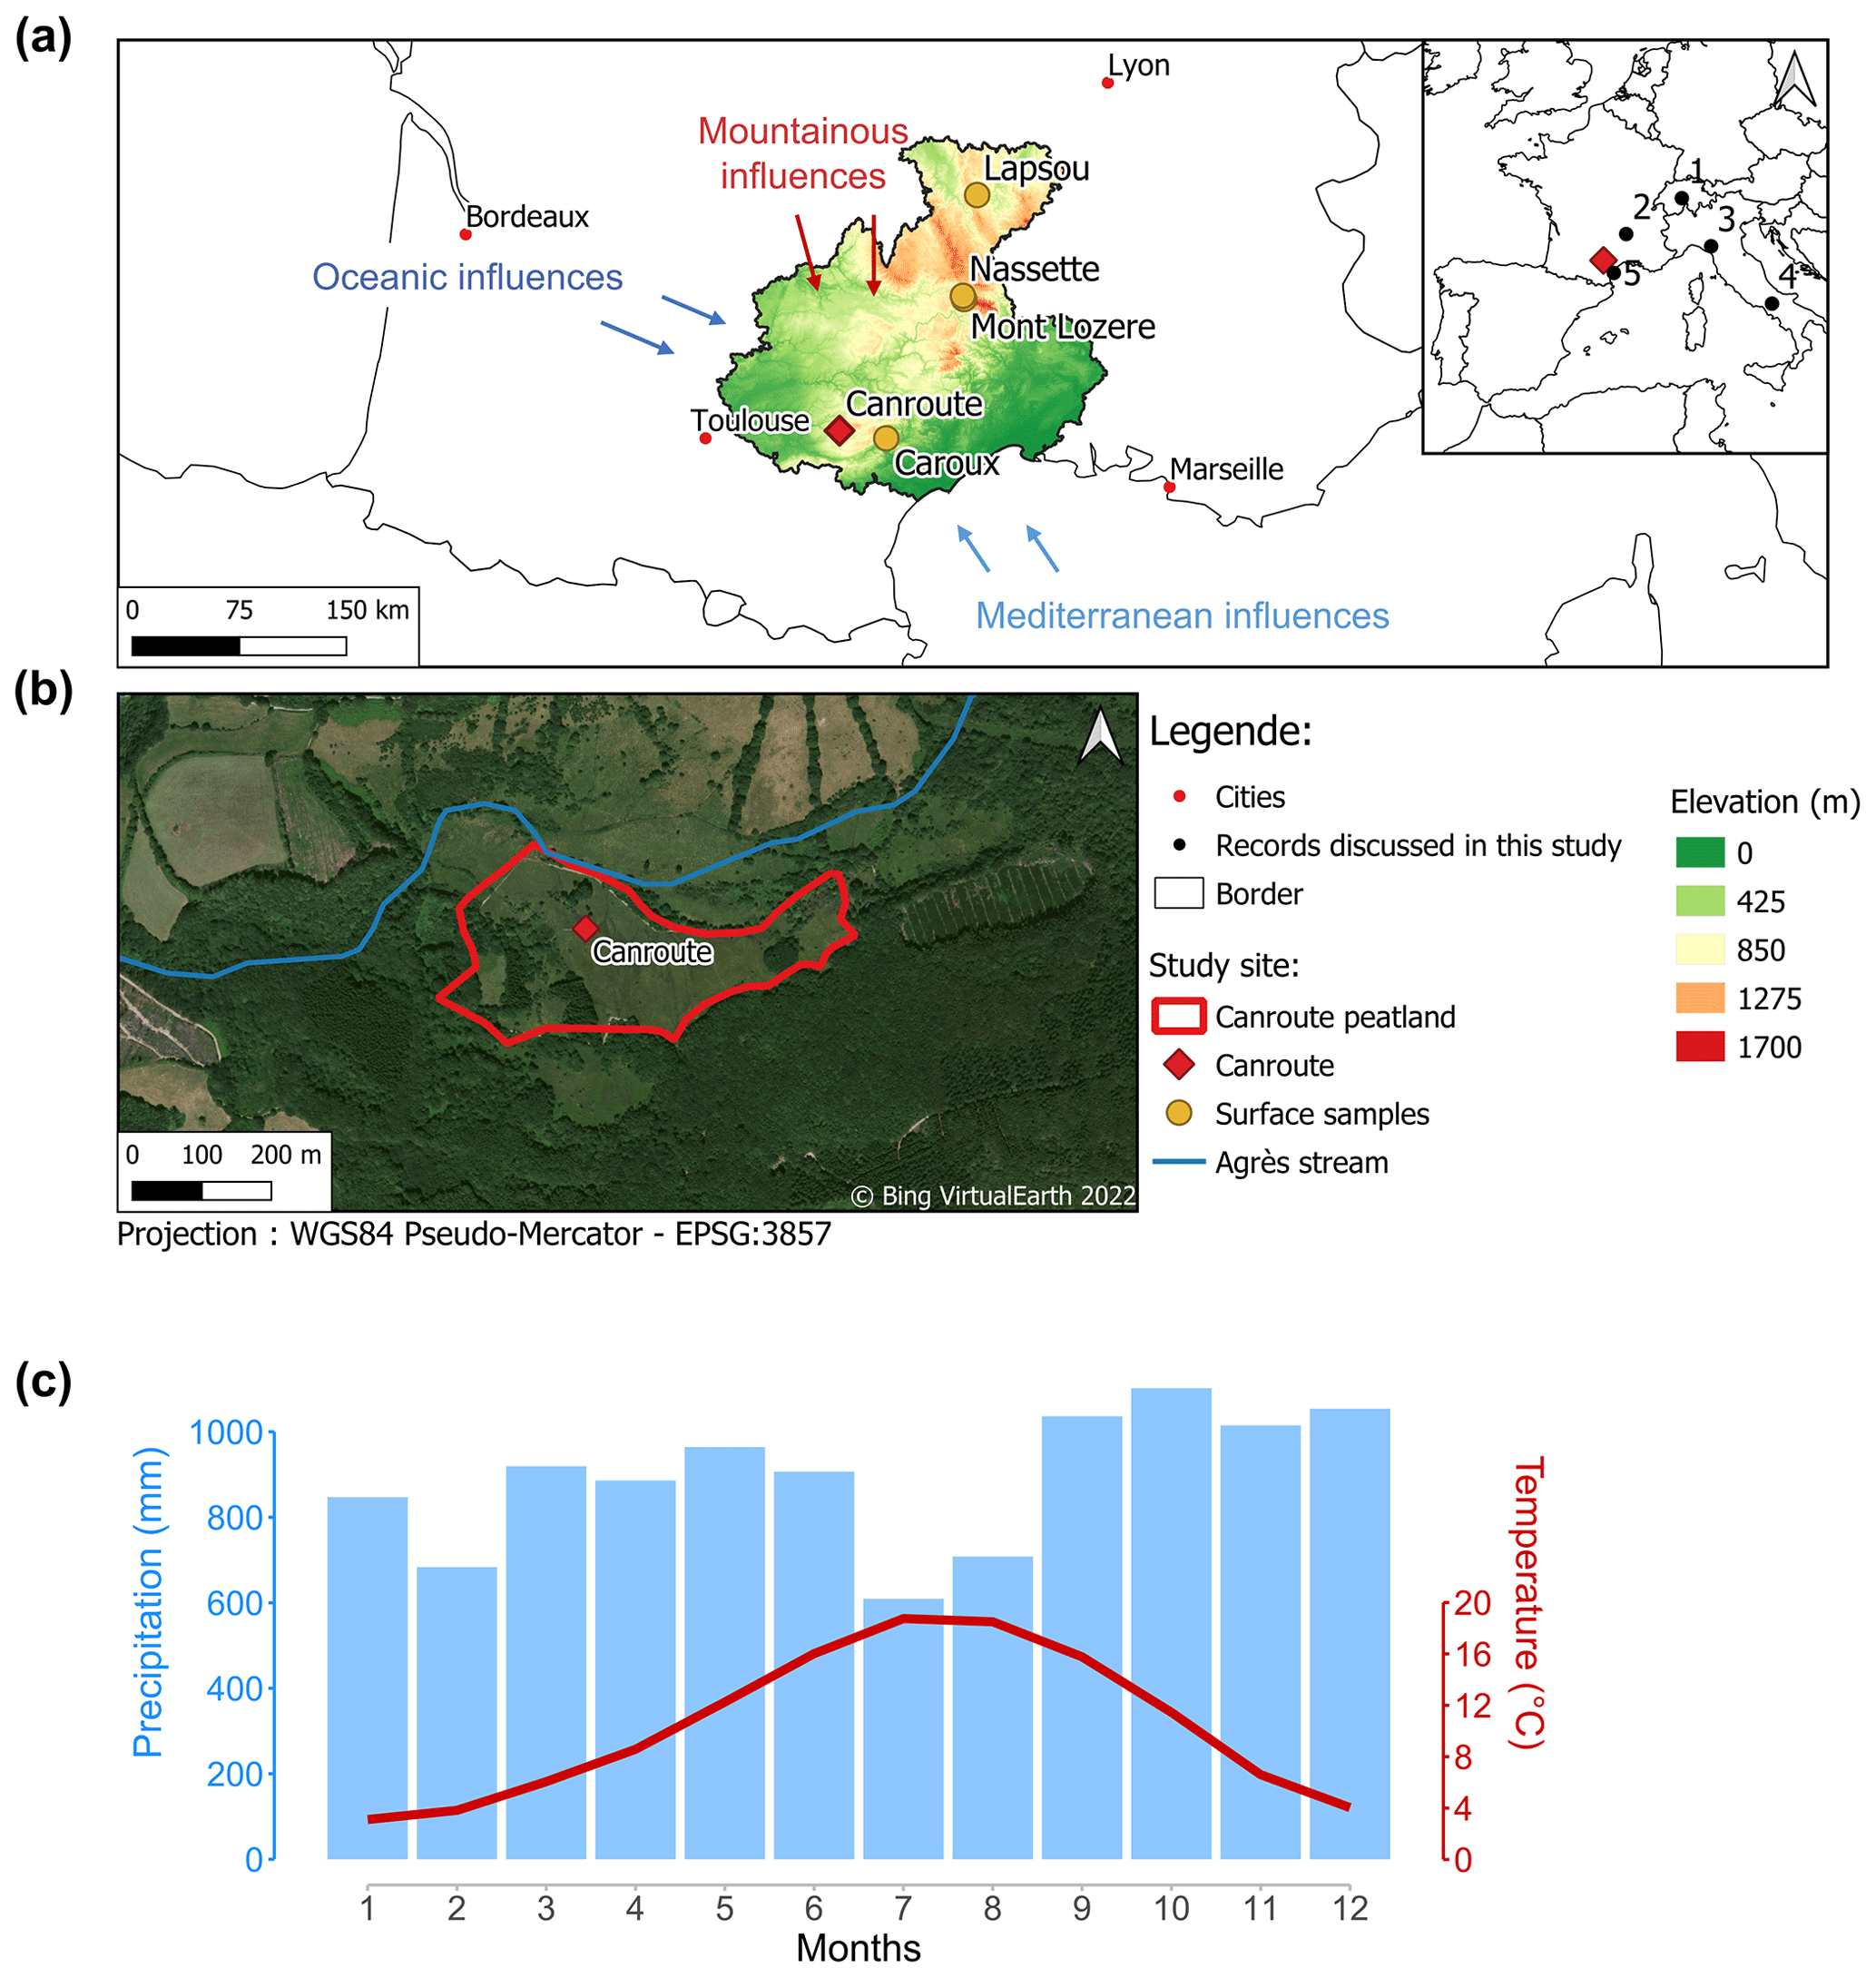
Figure 1(a) Location and altitude of the Canroute peatland and modern surface samples (NASA JPL, 2013). Elevations of the sample departments (Aveyron, Gard, Hérault, Haute-Loire, Lozère, and Tarn). The palaeoclimate records discussed in the text are represented by black dots in the inset map on the right (1: Swiss Alps, Heiri et al., 2003; 2: Lake St Front (Massif Central), Martin et al., 2020; 3: lakes Gemini and Verdarolo (northern Apennines), Samartin et al., 2017; 4: Lake Matese (Italy), Robles, 2022; 5: Gulf of Lion, Jalali et al., 2016). The south-western Europe climate reconstruction provided by Davis et al. (2003) is based on numerous pollen records (extracted from the European Pollen Database, EPD), which are not shown for clarity. (b) Aerial view of Canroute peatland. (c) Current annual conditions (precipitation and temperature) of Canroute (Monts de Lacaune).
2.2 Coring and sampling
The Canroute core (CAN02) extraction was carried out in 2019 using a 100 cm long Russian corer. Two 100 cm sections were taken, spaced 20 cm apart, to cover a total depth of 169 cm.
Six peat surface samples from the Massif Central were taken to refine the selection of calibrations for the reconstruction based on brGDGTs (Fig. 1a and Table A1).
2.3 Age–depth model
Radiocarbon dating of the CAN02 sequence was carried out by the Poznań Radiocarbon Laboratory (Poland) on 16 peat samples (bulk). The calibration and the age–depth model (Table 2 and Fig. 2) were performed with the R language (Posit team, 2023) and the R Studio software (Posit team, 2023) with the Clam package (Blaauw et al., 2022) using the IntCal20 calibration (Reimer et al., 2020). No reservoir effect corrections were performed on the 14C measurements.
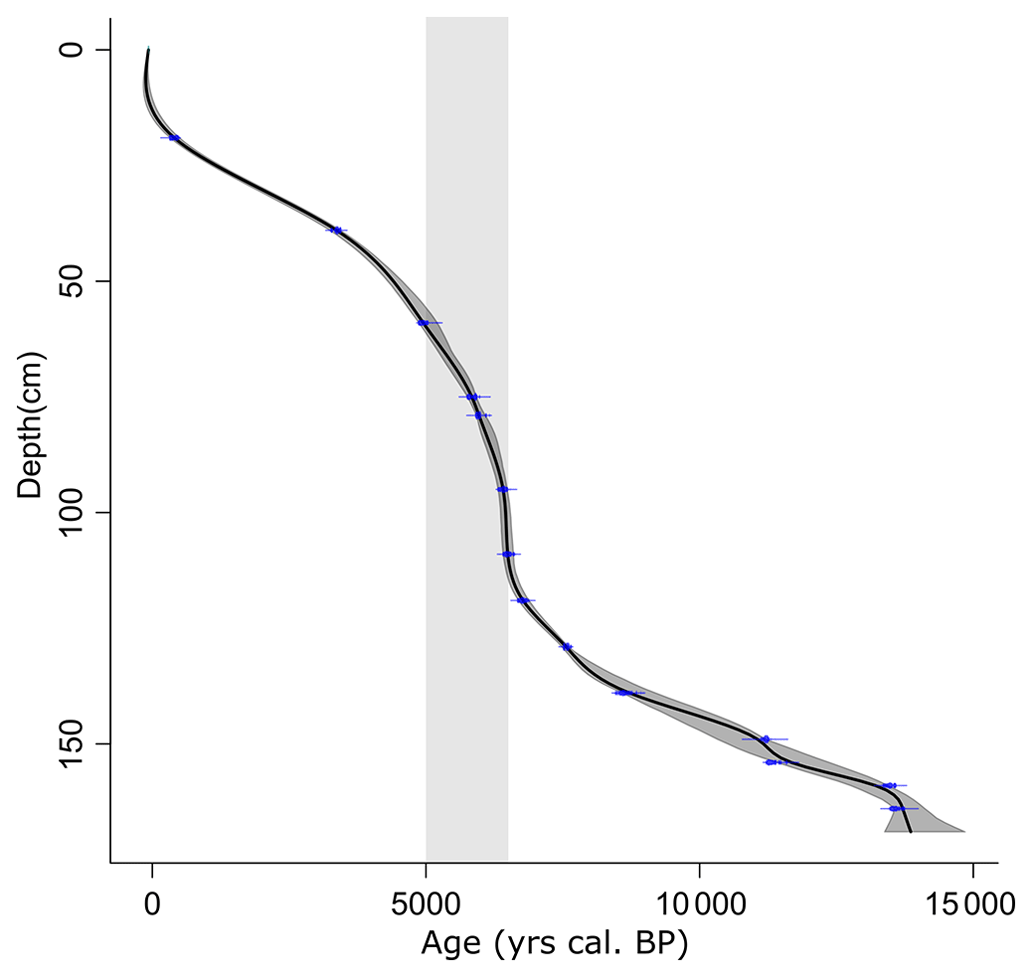
Figure 2Age–depth model from the CAN02 sequence, built with Clam (Blaauw et al., 2022) in R (R Core Team, 2022). The shaded period corresponds to the interval of accumulation rate increase between 110 and 60 cm depth (6500–5000 cal BP).
2.4 Sedimentological analysis
The CAN02 sequence was analysed by energy-dispersive X-ray fluorescence (ED-XRF) spectrometry using a Delta InnovX DP4000 portable spectrometer. The analyses were conducted on bulk sediments to preserve as much material as possible for other palaeoenvironmental studies. A three-beam “soil” analytical method was used to measure the contents of trace elements (Pb, Zn, Rb, Sr, Zr, Ba) and of Ti. The element contents of Si, K, Ca, and Fe were measured using a two-beam “minerai +” analytical mode.
The organic matter content (OMC) was measured by loss on ignition (LOI) at 550 ∘C (Ball, 1964). For this study, 16 samples of 1 cm3 were taken every 10 cm. Each sample was weighed after drying for 12 h at 150 ∘C. Then, a calcination at 550 ∘C for 5 h was performed to estimate the OMC (percent of dry mass) (Decorsiere et al., 2019).
2.5 GDGT analysis and indexes
2.5.1 GDGT analysis
GDGT analysis was carried out in the LGL-TPE ENS (Laboratoire de Géologie de Lyon: Terre, Planète, Environnement, Ecole Normale Supérieure de Lyon) laboratory in Lyon on 75 samples of the CAN02 core with a sampling step of 2 to 4 cm and on the six surface samples (Fig. 1a). Sampling was carried out using a 1 cm3 brass cutter (about 1 g), and then samples were freeze-dried for 24 to 72 h. After grinding and homogenization, the total lipid fraction was extracted twice by microwave (MARS 6 CEM) at 70 ∘C with 10 mL of a dichloromethane (DCM)–methanol (MeOH) mixture (3:1, ) and then filtered on a solid-phase extraction (SPE) cartridge; 1000 ng of C46 GDGT (99 % n-hexane : 1 % isopropanol) was then added to the total liquid extract (TLE) to serve as an internal standard (Huguet et al., 2006). The TLE was then separated into polar and apolar fractions on a silica column with 5 mL of hexane–DCM (1:1) and 10 mL of DCM–MeOH (1:1) respectively. The samples were then analysed in hexane–isopropanol (99.8:0.2) by high-performance liquid chromatography with mass spectrometry (HPLC-MS; Agilent 1200). Ions in selected ion monitoring (SIM) are detected for mass-to-charge ratios (): 744 for the internal standard C46, 1302, 1300, 1298, 1296, 1294, and 1292 for isoGDGTs and then 1050, 1048, 1046, 1036, 1034, 1032, 1022, 1020, and 1018 for brGDGTs (Hopmans et al., 2016; Davtian et al., 2021). The high-performance liquid chromatography allowed for the separation of the 5-, 6-, and 7-methyl brGDGTs isomers (Ding et al., 2016; Naafs et al., 2017b). Concentrations are expressed in milligrammes per gramme of sediment (). The relative abundances of each GDGT (iso and br) are determined by the ratio of the proportion of the compound to the sum of all iso- or brGDGTs (n=6 and 19 respectively). Four samples with contrasting GDGT compositions were measured and integrated five times to establish the reproducibility of the analytical set-up.
2.5.2 Indexes calculations
Different indices such as MBT'5Me, CBT5Me, CBT', Index1, GDGT-0 crenarchaeol, IR (isomer ratio), and CI ratio (community index) were calculated for the CAN02 sequence and surface samples (Table 1). The mean annual temperature (MAAT) was reconstructed from three types of calibrations: the linear relationship between methylation indices (MBT'5Me) (De Jonge et al., 2014a; Naafs et al., 2017b) and Index1 (De Jonge et al., 2014a), multiple regression (mr) between MAAT and fractional abundances of selected brGDGTs (De Jonge et al., 2014a), and Bayesian calibration (Dearing Crampton-Flood et al., 2020; ). Due to the removal of the pH-dependent 6-methyl brGDGTs, MBT'5Me- and Index1-based calibrations allow the substantial correlation between MBT and soil pH to be overcome (De Jonge et al., 2014a). Multiple regression connects the MAAT with the fractional abundance of tetra- and penta-methylated brGDGTs and shows a little accuracy improvement over MBT'5Me-based calibration (De Jonge et al., 2014a). Bayesian-based calibration allows the intuitive reasoning of the relationship between MBT'5Me and MAAT to be respected (i.e. brGDGT-producing Bacteria respond to temperature changes, not the other way around) (Dearing Crampton-Flood et al., 2020). The Bayesian calibration employed in this study refers to the threshold-based calibration of Dearing Crampton-Flood et al. (2020), which calibrates the MBT'5Me index to the average temperature of all months with an average temperature above freezing.
Table 1Formulae used for computation of brGDGT indices, MAAT, and pH calibrations and RMSE (in degrees Celsius for MAAT).
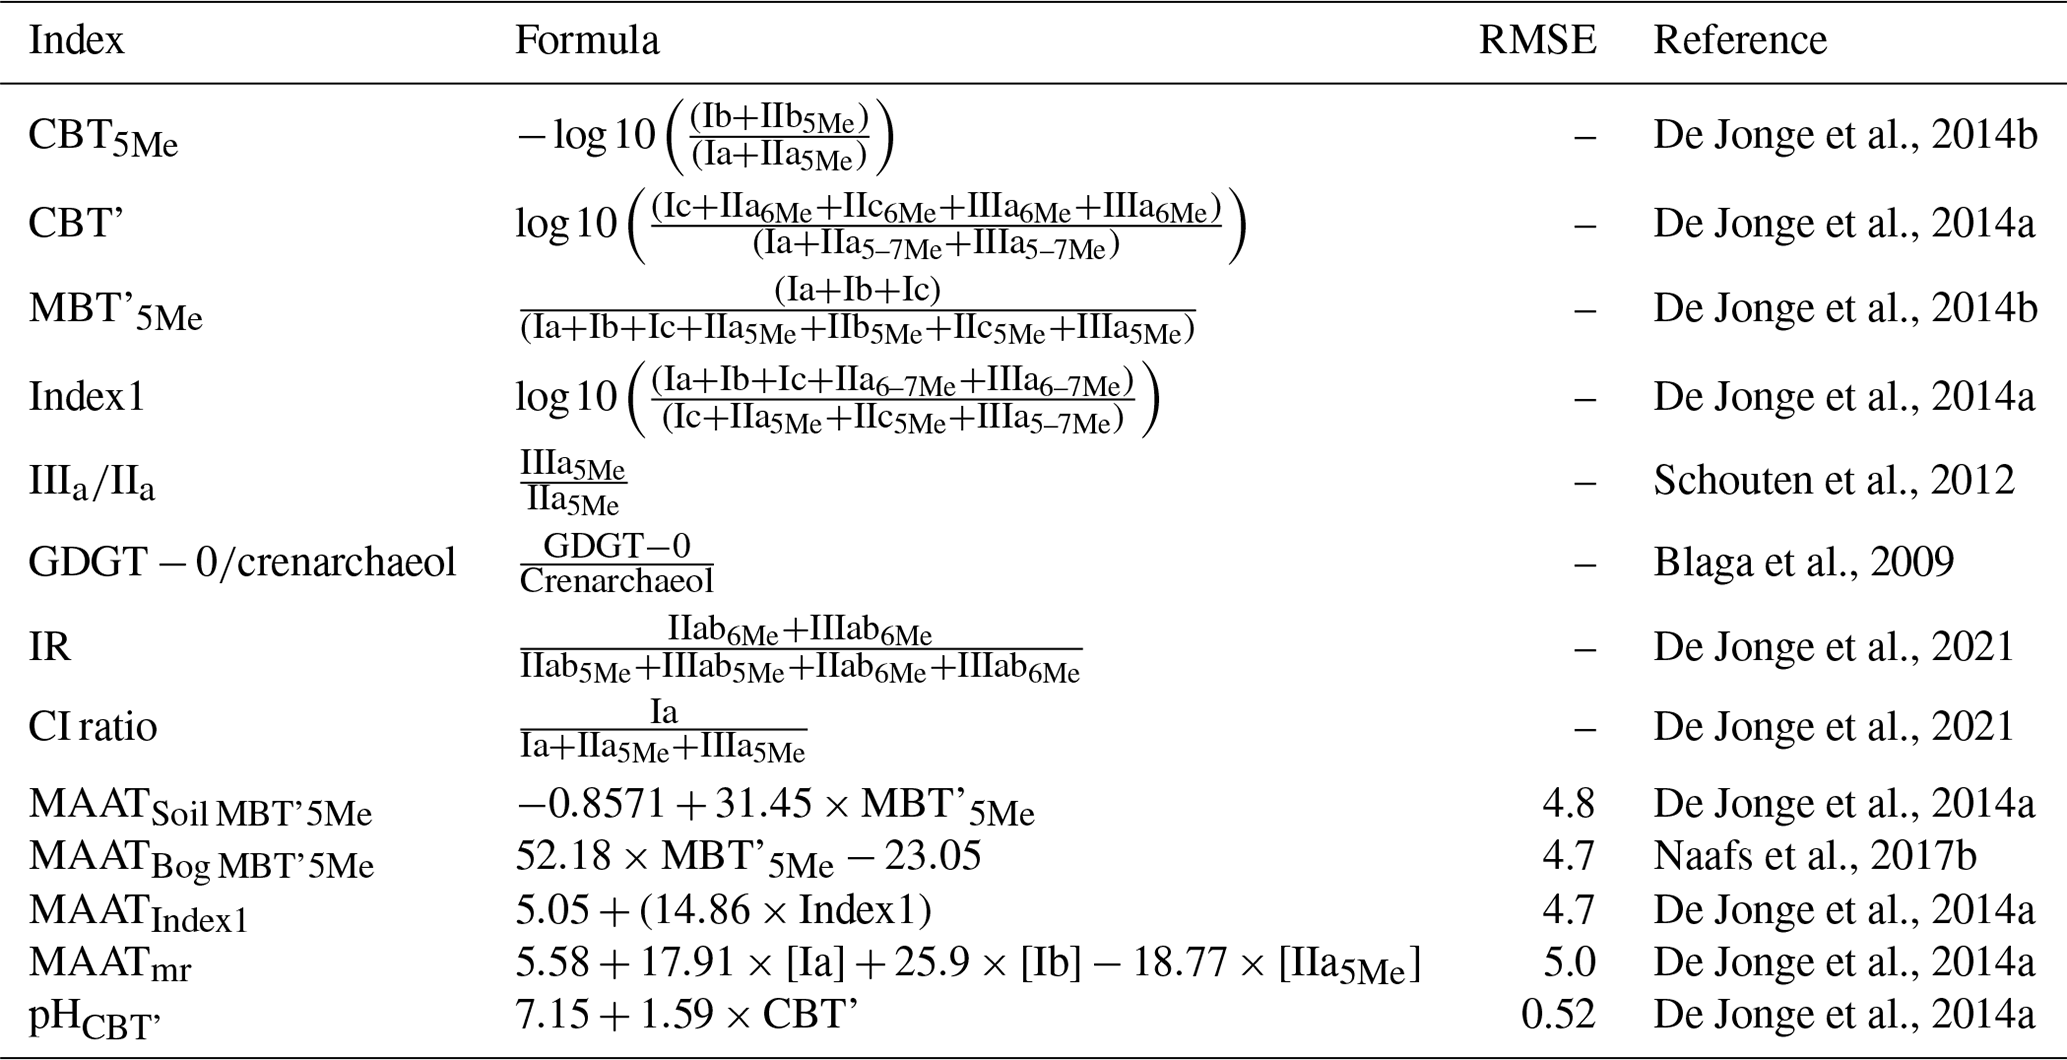
Changes in peat pH can have a significant impact on brGDGT-based temperature; hence pH reconstruction based on brGDGTs has been examined (De Jonge et al., 2021). The CBT'-based calibration was utilized (De Jonge et al., 2014a).
2.6 Pollen analysis and reconstruction of climate parameters from pollen assemblages
2.6.1 Pollen analysis
A total of 65 samples have been analysed (sampling interval of 1 cm for 159–138 cm, 2 cm for 138–128 cm, and 4 cm for 128–0 cm), and the pollen was identified and counted under an optical microscope under a light microscope at a standard magnification of ×400. Pollen sums are at least 500 grains per sample and exclude spores; 148 taxa were identified, but here, a simplified pollen diagram was made to represent the vegetation variability over the last 15 000 years. The pollen data are presented as a function of age in calibrated years before present (Fig. 6).
2.6.2 Quantitative reconstruction of climate parameters: a multi-method approach
Various methods have been developed to quantify climatic parameters from the pollen signal (see the review of Chevalier et al., 2020), and multi-method approaches have been developed to increase the reliability of palaeoclimatic reconstructions (Brewer et al., 2008; Peyron et al., 2005, 2011, 2013, 2017; Salonen et al., 2019; Robles et al., 2022, 2023). These methods were initially developed to calibrate the relationship between modern pollen data (soils, mosses) and current climate parameters. Our multi-method approaches include (1) transfer functions based on linear regressions (weighted averaging partial least squares regression, WA-PLS) between pollen taxa and climate parameters, (2) assemblage approaches based on the analogy principle between fossil and modern assemblages (modern analogue technique, MAT), and (3) recent machine learning techniques with regression trees (random forest, RF, and boosted regression trees, BRT) to quantify the climate parameters on the CAN02 sequence.
The MAT method, developed by Guiot (1990), is a method often used due to its simplicity of use, performance, and sensitivity. The MAT is based on measuring the degree of dissimilarity between a fossil pollen assemblage and modern pollen assemblages with known environmental characteristics to draw inferences about the temporal sequences of fossil samples with unknown environmental characteristics.
The WA-PLS method (ter Braak and Juggins, 1993) is a transfer function and is also a method often used; it assumes that the relationship between pollen proportion and climate is unimodal, where the abundance of a plant species is directly related to its environmental tolerance. WA-PLS estimates the climatic optimum of a species from calibration data by calculating the average climatological conditions in which a species occurs, weighted by the abundance of that species (Chevalier et al., 2020).
The other two methods (RF and BRT) have been developed more recently in palaeoclimatology and are based on machine learning (Salonen et al., 2019). These methods use regression trees to divide pollen data by successive separations of samples according to their abundance in the pollen spectrum. The random forest method (Breiman, 2001; Prasad et al., 2006) is based on the estimation and combination of many regression trees; each tree is estimated from a set of pollen samples by bootstrapping (Chevalier et al., 2020). Boosted regression trees (De'Ath, 2007; Elith et al., 2008) differ from RF in the definition of the modern database. For RF, each sample has the same probability of being selected; for BRT the under-represented samples in the previous tree have a higher probability of being selected. This approach is called “boosting” and increases the model's performance concerning the least well-predicted elements (Salonen et al., 2019). Due to the regression tree signal variation, the BRT method's final signal is an average of 15 independent runs of the BRT algorithm.
For these four methods, local taxa and hydrophytes were not used in the reconstruction of climate parameters as they could not be strictly related to the regional climate.
The role of the modern pollen database in the reliability of climate reconstructions is also investigated here. The Eurasian Pollen Database (EAPDB; Fig. B1a), compiled by Peyron et al. (2013, 2017) and updated by Dugerdil et al. (2021a), was used as the first modern pollen database. In addition, two other modern pollen databases were used, originating from a sub-sampling of the EAPDB database, grouping sites from the Mediterranean–Temperate Europe (MEDTEMP; Fig. B1c) database and sites originating from the Temperate Europe–Scandinavian (TEMPSCAND; Fig. B1b) database. The temperatures reconstructed from those two sub-sampled databases are compared to the temperature reconstructed from the EAPDB (Fig. 7).
Here, we reconstruct the mean annual temperature (MAAT) from the Canroute pollen record as the MAAT is the only comparable parameter between pollen and brGDGT reconstructions. We also reconstruct the precipitations (MAP) to better discuss the links with the pH variations.
The reliability of pollen-inferred climate reconstruction methods was estimated by bootstrapping cross-validation by calculating the correlation coefficient values between the variables (R2) and those of the root mean square error (RMSE) criterion.
2.7 Statistical treatments
A principal component analysis (PCA) of the correlation matrix has been conducted on XRF and brGDGTs with the FactoMineR package (Lê et al., 2008). The PCA aims to illustrate the components that explain the most variations across samples and thus allows the exploration of relationships between the variables. For both PCA, a k-means clustering allowed the highlight of subgroups in the data, with a chosen value of a cluster number (k) determined with a within-cluster sum of squares method. The clustering analysis has been performed with the Factoextra package (Kassambara and Mundt, 2020). For XRF data used on for the PCA, due to the low detection signal of a part of the data, a regularized imputation of the missing values has been applied, using the missMDA (Josse and Husson, 2016) and FactoMineR (Lê et al., 2008) packages. Missing-value imputation reduces the loss of information caused by missing values, lowering the ability to discern patterns (Dray and Josse, 2015). Regularized imputation entails filling in missing values with values selected from a Gaussian distribution, with mean and standard deviation estimated from observed values (Josse and Husson, 2016). Additionally, element counts have been normalized over the Ti element (Davies et al., 2015).
Climate reconstructions and reliability tests (R2 and RMSE criterion) were performed with the rioja (Juggins, 2023), randomForest (Liaw and Wiener, 2002), and dismo (Hijmans et al., 2022) packages. All analyses were performed in R Studio (Posit team, 2023), using the ggplot2 (Wickham, 2016) package for plot creation and the rioja package (Juggins, 2023) for the pollen diagram with a CONISS (constrained incremental sum-of-squares agglomerative clustering) hierarchy classification method described by Grimm (1987).
3.1 Radiocarbon dating and age–depth model
The CAN02 sequence covers the Late Glacial from ca. 15 000 cal BP (171 cm depth) to −80 cal BP (surface) (Fig. 2 and Table 2). The average accumulation rate is 0.01 cm yr−1 between 170–113 cm and 10 times higher between 110–85 cm (0.13 cm yr−1), with a maximum value of 0.18 cm yr−1 at 95 cm depth (Fig. 2, shaded period). The accumulation rate drops back to initial values between 85–15 cm. It increases again to 0.03 cm yr−1 from 15 to the core top.
Table 2Dating of the 16 samples of the Canroute core with mention of their depth in centimetres. AMS (accelerator mass spectroscopy) radiocarbon dating and calibrated 2σ age interval of the CAN02 core.
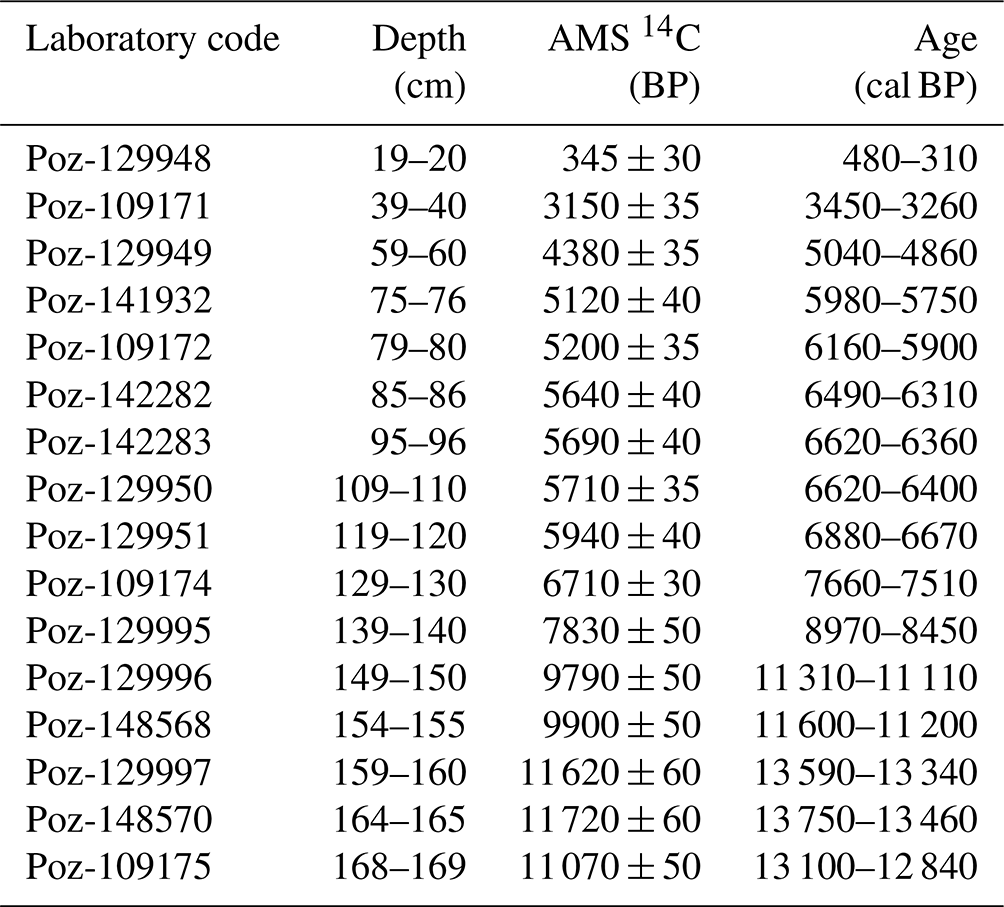
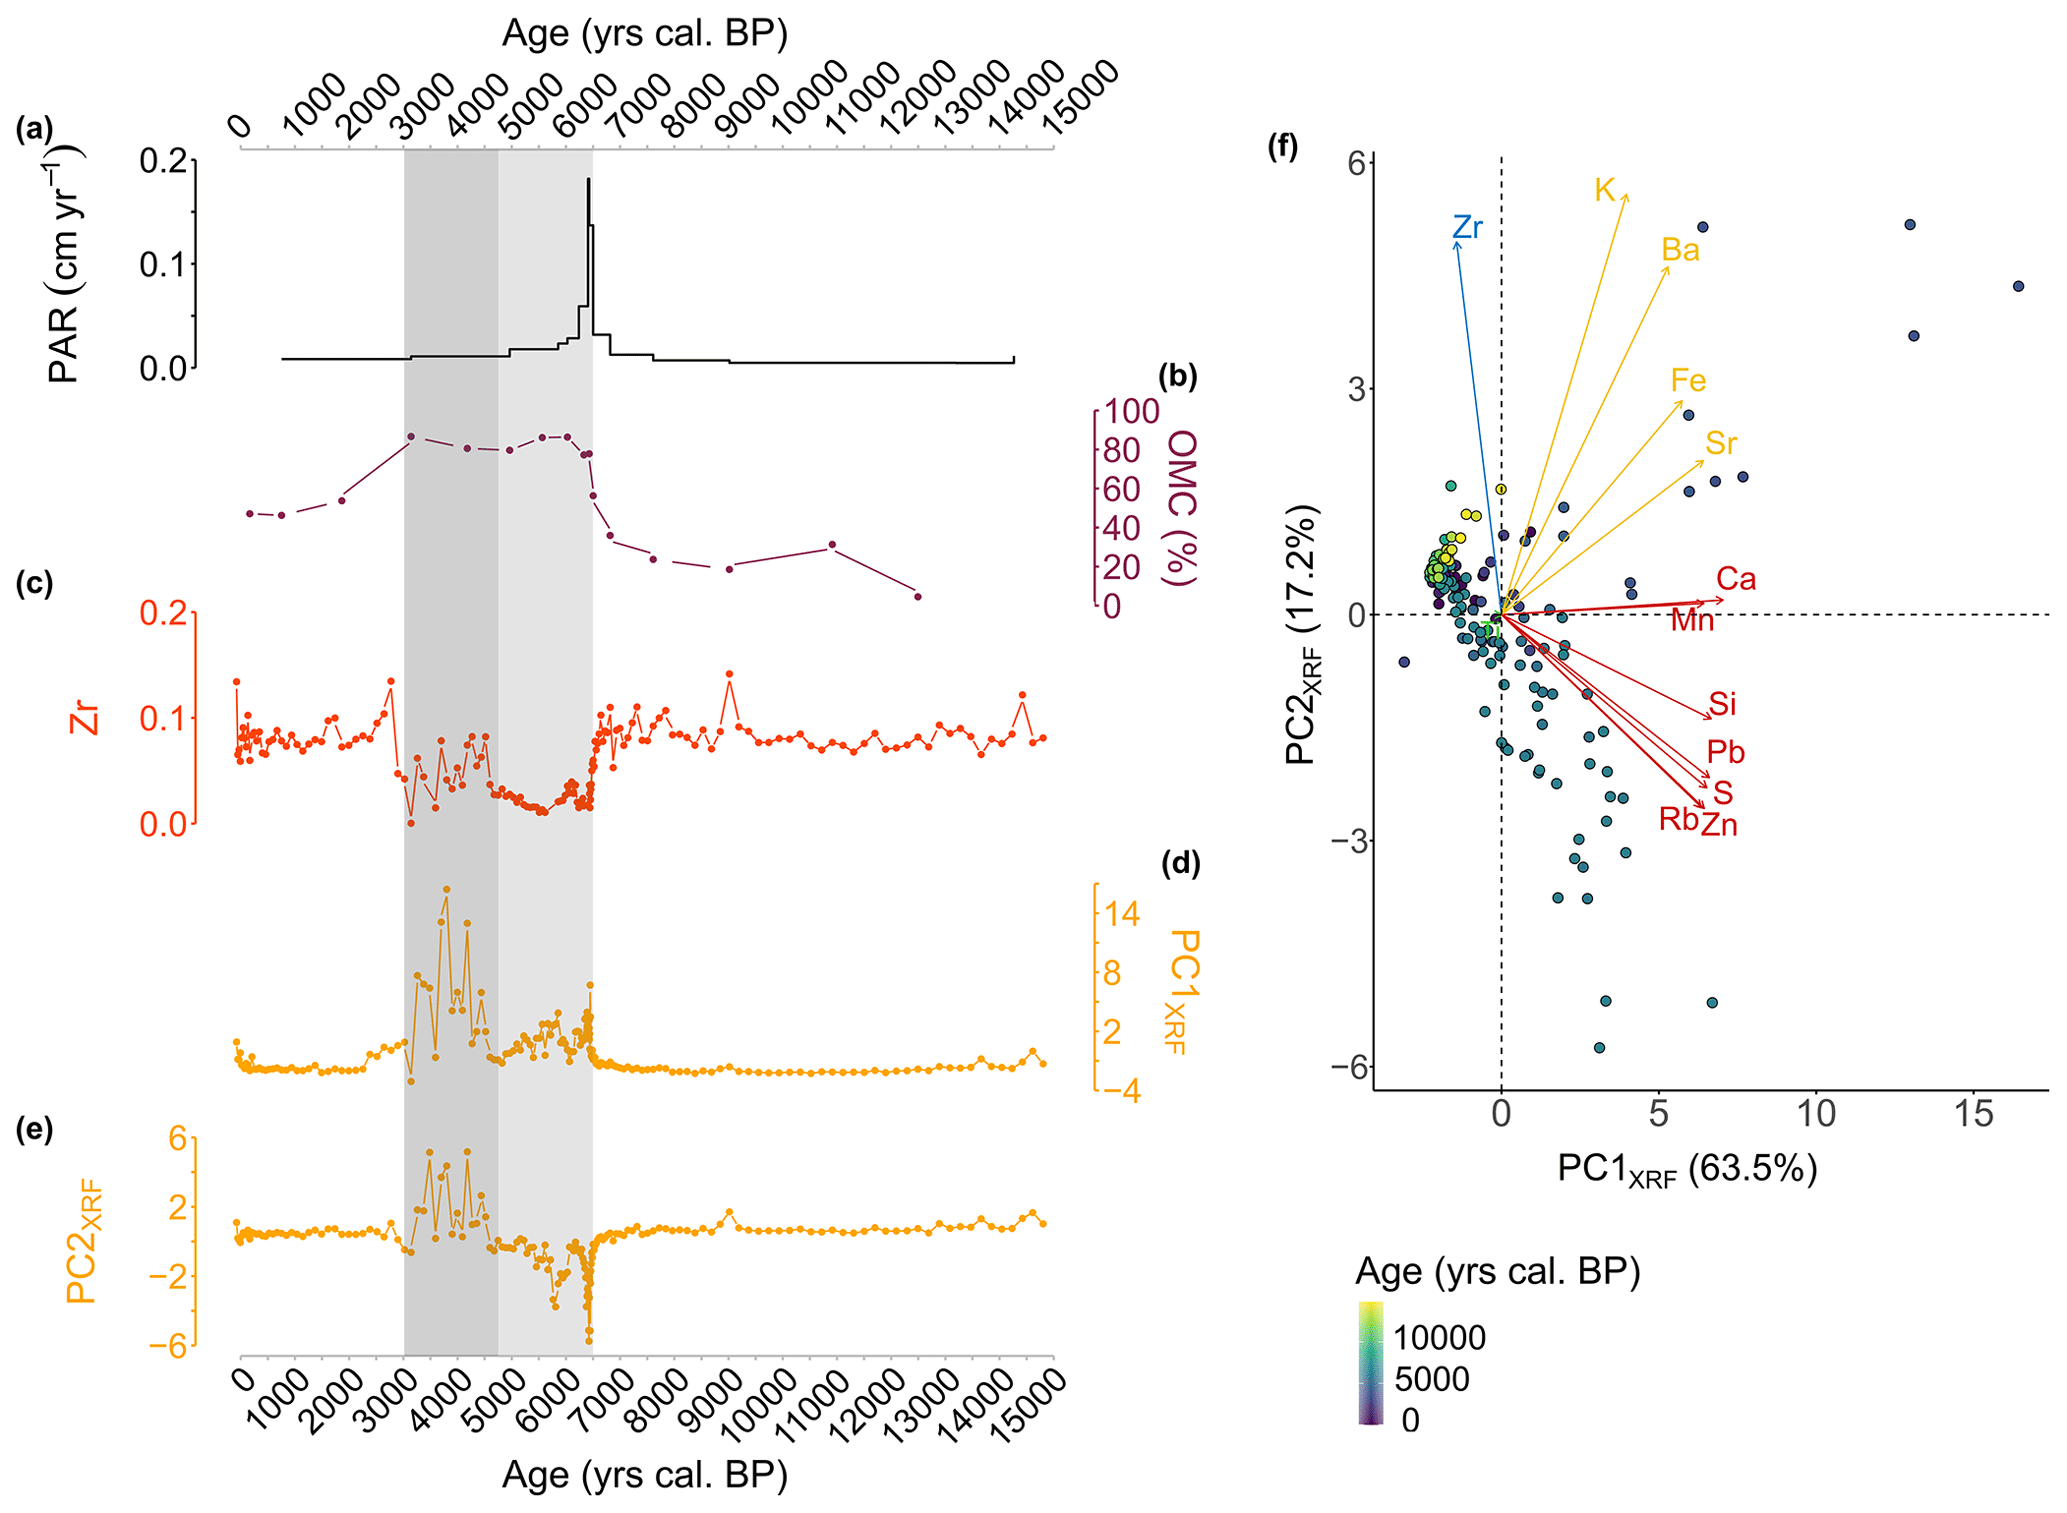
Figure 3Geochemical data from the CAN02 sequence. (a) Peat accumulation rate (PAR) calculated from the age–depth model (cm yr−1). (b) Organic matter content (OMC; %) derived from loss on ignition (LOI). (c) Zr relative counts, standardized according to Ti. (d) First dimension (PC1XRF) extracted from the principal component analysis (PCA) performed on the XRF data. (e) Second dimension (PC2XRF) extracted from the principal component analysis (PCA) performed on the XRF data. (f) Principal component analysis (PCA) of the XRF signal. The principal components are grouped into three clusters. Samples are coloured according to the age gradient (yrs cal BP). In (a) to (e), the shaded period corresponds to the period between 6600 and 4700 cal BP, when the accumulation rate increases, and detrital activity decreases (light-grey period), and between 4700 and 3000 cal BP, when detrital activity increases, and detrital input dynamics changes (dark-grey period).
3.2 Sedimentological analysis
The peat accumulation rate (PAR; Fig. 3a) ranges from 0.01 to 0.18 cm yr−1 with a maximum value between 6500–6340 cal BP. The first two principal components PC1XRF and PC2XRF explain 63.5 % and 17.2 % of the total elemental variation (Fig. 3d and e). All elements are positively correlated with PC1XRF, except the Zr element. The PC2XRF illustrates two groups of elements: elements such as Si, Pb, S, Zn, and Rb on the negative side and Ca, Mn, Sr, Fe, Ba, K, and Zr on the positive side (Fig. 3d and e). The Zr element (Fig. 3c) traces the detrital activity: the higher the value, the higher the lithogenic inputs (Silva-Sanchez et al., 2014). At Canroute, Zr ranges from 0 to 0.14. High values of Zr are present from 15 000 to 6600 cal BP (0.05–0.14), revealing important detrital inputs, followed by a progressive lowering of detrital inputs. From 6600 to 3000 cal BP, very low values of Zr are present (0–0.08), revealing the quasi-absence of detrital inputs. From 3000 cal BP onward, the values slowly increase to previous values (0.04–0.13), translating a recovery of detrital inputs. The OMC estimated from the LOI (Fig. 3b) indicates low values (under 60 %) from 15 000 to 6600 cal BP. After this period, the OMC increases up to 90 % from 6600 to 3000 cal BP, after which it decreases to lower values (around 60 %). In more detail, from 6600 to 3000 cal BP two dynamics are observed, highlighted by Zr, PC1XRF and PC2XRF axes. The first dynamic extends from 6600 to 4700 cal BP, during which the values of Zr and both PCXRF axes are at their lowest, and indicates a low variability (Fig. 3c–e, in light grey). The second dynamic extends from 4700 to 3000 cal BP and is characterized by higher values and variability in Zr and both PCXRF axes (Fig. 3c–e, in dark grey). During this second period, the PC2XRF values become positive, meaning that the origin of detrital inputs may have changed between the light- and dark-grey area.
3.3 GDGT analysis
3.3.1 Compound concentrations
In surface samples, the average concentrations of iso- and brGDGTs are 0.6 ± 0.5 (–0.4 ) and 0.8 ± 0.6 (–2.2 ) respectively. The CAN02 core samples have higher average concentrations of iso- and brGDGTs than the surface samples: 2.1 ± 2.0 (53.0–1.5 ) and 2.4 ± 2.0 (143.6–29.7 ) respectively.
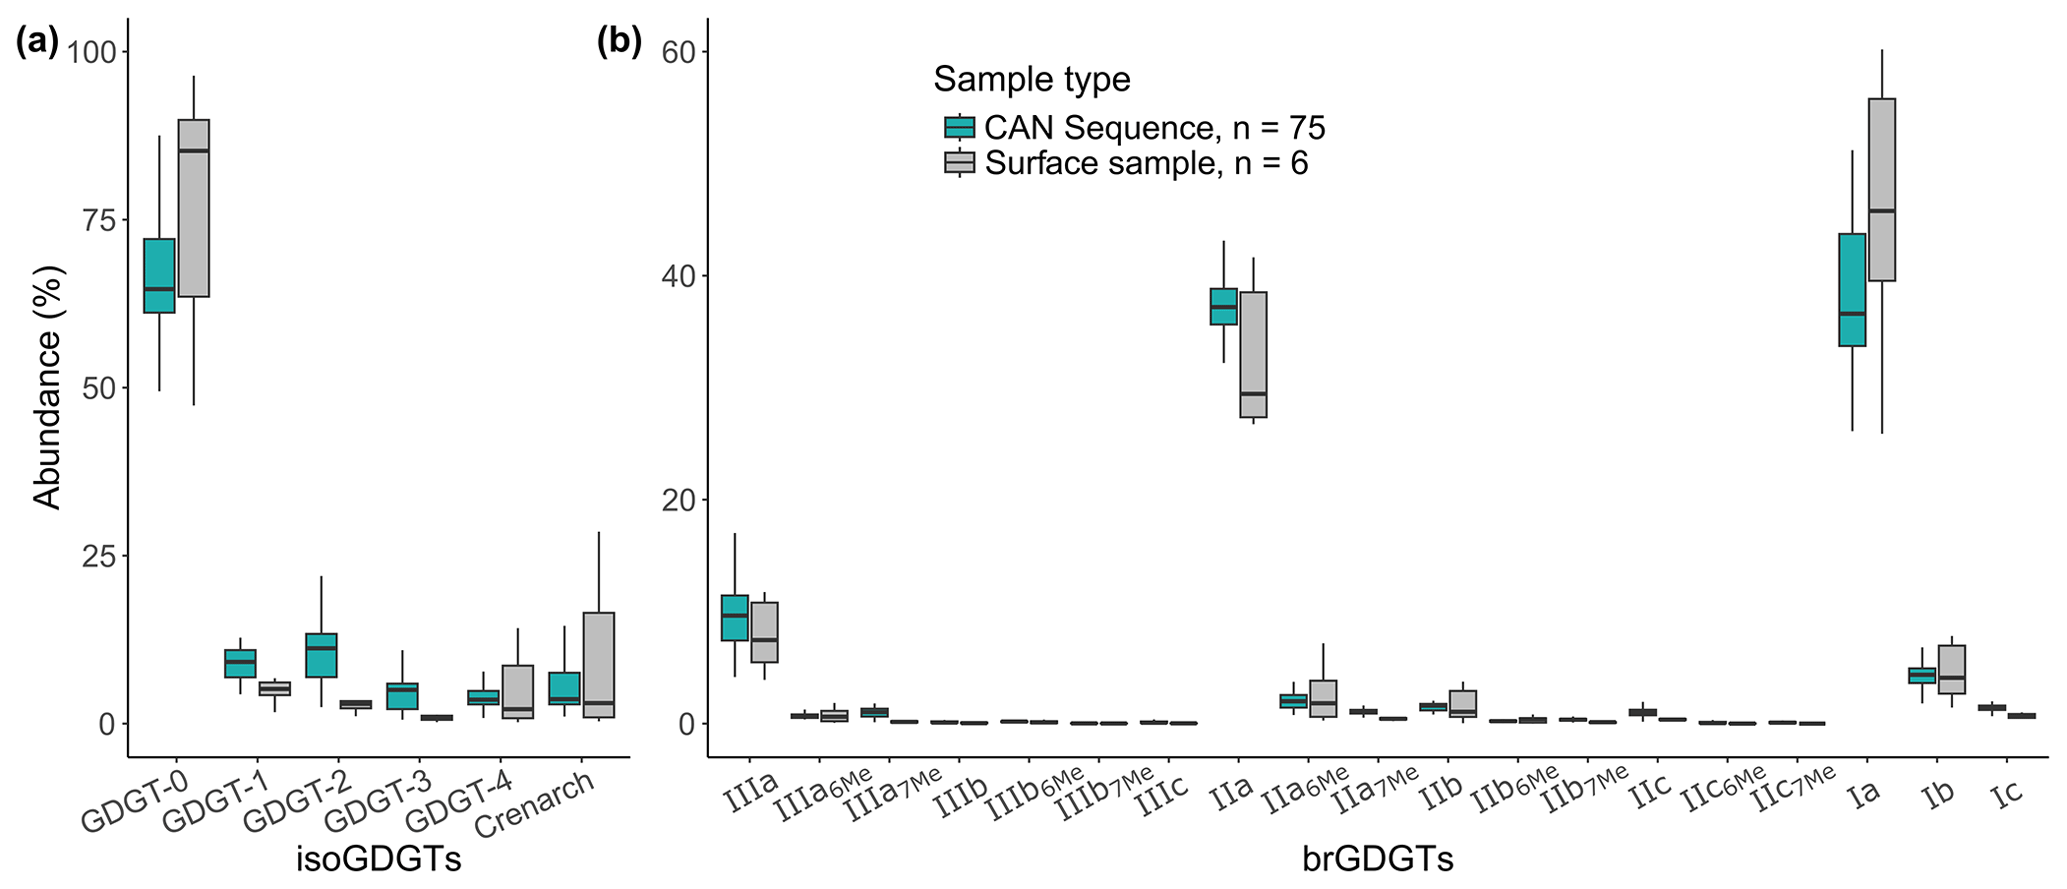
Figure 4GDGT results: fractional abundances (%) of (a) isoGDGT and (b) brGDGT compounds for the CAN02 sequence (n=75, blue) and surface samples (n=6, grey).
3.3.2 Relative abundances
Average analytical errors are calculated from the averaged standard deviations of replicate measurements for br- and isoGDGTs (SD=2 % and 4 % respectively, n=75). BrGDGTs are predominant over isoGDGTs in the seven surface samples (including CAN0) (average abundance of 92 % and 7 % respectively). IsoGDGTs of surface samples are dominated by GDGT-0 (between 47 % and 96 %; Fig. 4a). BrGDGT relative abundances in surface samples show the dominance of tetramethylated (Ia) and pentamethylated (IIa) (36 % and 37 % respectively; Fig. 4b). For CAN02 downcore samples, average relative abundances of iso- and brGDGTs show mean values of 12 % and 88 % respectively. Downcore samples are also dominated by GDGT-0 (isoGDGTs) and tetramethylated and pentamethylated (brGDGTs) (Fig. 4a and b). Double isomers are present in very low abundances and are present only between 7800 and 6420 cal BP at two occurrences for the IIIa7Me and one occurrence for the IIa7Me.
Penta- and hexamethylated brGDGTs show similar trends: a decrease between 15 000–6600 cal BP followed by an increase between 6600–6100 cal BP and a further decrease between 6100 and −80 cal BP (Fig. 5a). Tetramethylated brGDGTs show the opposite trend: an increase between 13 800–6600, followed by a sharp decrease between 6600–6300 cal BP and then a gradual increase between 6300 and −80 cal BP. Pentamethylated brGDGTs dominate between 15 000–5000 cal BP, whereas tetramethylated brGDGTs dominate from 5000 cal BP onwards. The tetramethylated-dominated period can be divided into two subperiods, both surrounded by lower values: 5000–2300 cal BP and 2300 cal BP onward. The CBT' index ranges from −1.58 to −0.98 (SD=0.05, n=75; Fig. 5b) and shows a slight continuous decrease over time. The MBT'5Me index varies between 0.32 and 0.55 (SD=0.01, n=75) and shows a slightly increasing trend over time (Fig. 5c), with two periods of rapid decrease between 6500–600 cal BP and between 290 and −80 cal BP, and two well-differentiated periods: 15 000–6500 and 4700–290 cal BP.
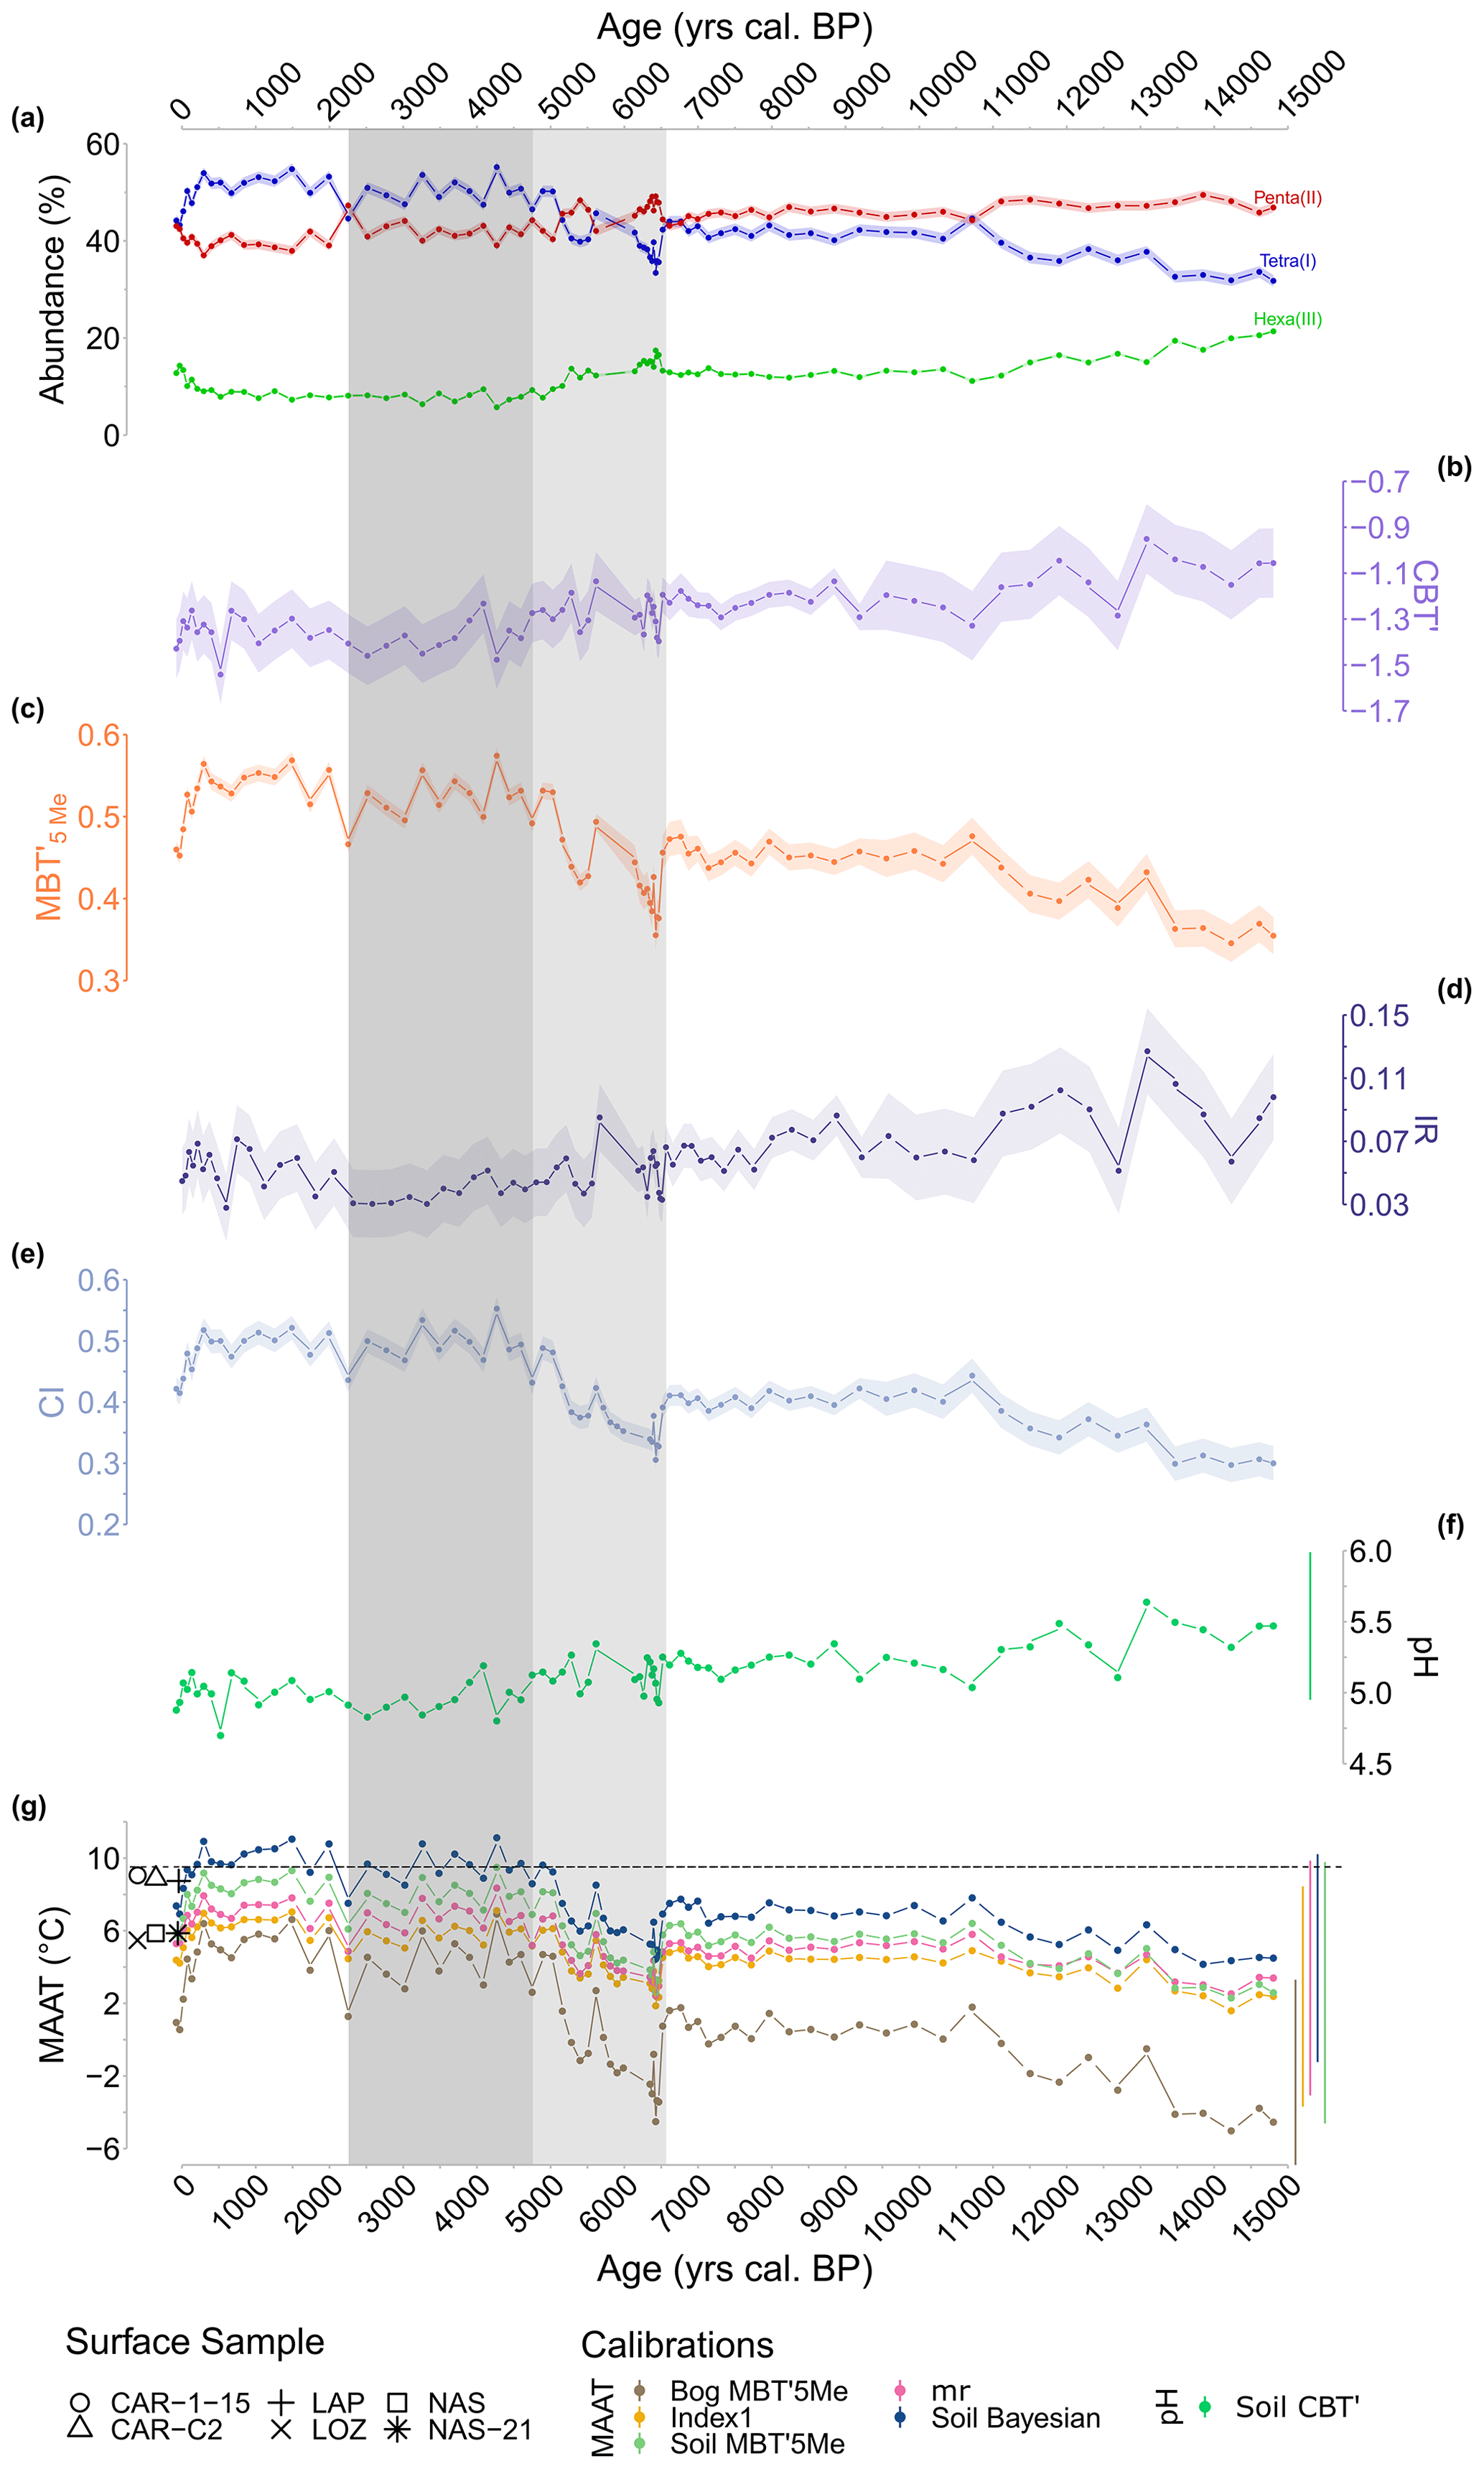
Figure 5(a) Relative abundances of tetra-, penta-, and hexamethylated brGDGTs in the CAN02 sequence. (b) Index of the degree of cyclization (CBT'). (c) Index of the degree of methylation (MBT'5Me). (d) Isomer ratio (IR) through time. (e) Bacterial community index (CI) through time. (f) The pH reconstruction based on global calibration of De Jonge et al., (2014b; Soil CBT'). (g) Annual mean temperature (MAAT) reconstructions based on global calibrations of De Jonge et al. (2014a, b) (Index1, Soil MBT'5Me, mr), Naafs et al. (2017b) (Bog MBT'5Me), and Dearing Crampton-Flood et al. (2020) (Soil Bayesian). Calibration errors are represented by the lateral lines on the right side. Shaded periods highlight the significant decrease in the abundance of tetramethylated brGDGTs and a shift in accumulation rate from 6600 to 4700 cal BP (light-grey area) and the decrease in IR from 4700 to 2300 cal BP (dark-grey area). Symbols: modern MAATs of surface samples. Dashed black line: current calculated MAAT at Canroute.
The isomer ratio (IR) values range from 0.03 to 0.13, with the lowest values obtained between 4700 and 2300 cal BP (Fig. 5d). Throughout the record, the community index (CI) values range from 0.30 to 0.55 and are less than 0.65 (Fig. 5e). The period from 15 000 to 4700 cal BP has mean CI values of 0.38, but the period from 4700 to −80 cal BP has higher mean CI values of 0.49. The pH varies from 4.6 to 5.6 and shows a little continuous decline over time (Fig. 5f).
PCA of brGDGT relative abundances reveals that PC1brGDGTs and PC2brGDGTs account for more than 58 % of the variance in brGDGT compounds (PC1brGDGTs: 45.6 %; PC2brGDGTs: 13.1 %; Fig. C1b and c). The cluster analysis revealed three cluster (Fig. C1d), delimited by depth (cluster 1: 15 000–5400 cal BP; cluster 2: 5400–2300 cal BP; cluster 3: 2300–0 cal BP), and demonstrated that the lower half of the sequence (cluster 1) is positively correlated with most brGDGT compounds (except Ia, Ib, and Ic), while the upper half (cluster 2 and 3) is negatively correlated. That is, the lower half of the sequence (15 000–5400 cal BP) has a high abundance of most brGDGT compounds, whereas the upper half (especially 5400–2300 cal BP) has a high abundance of primarily Ia.
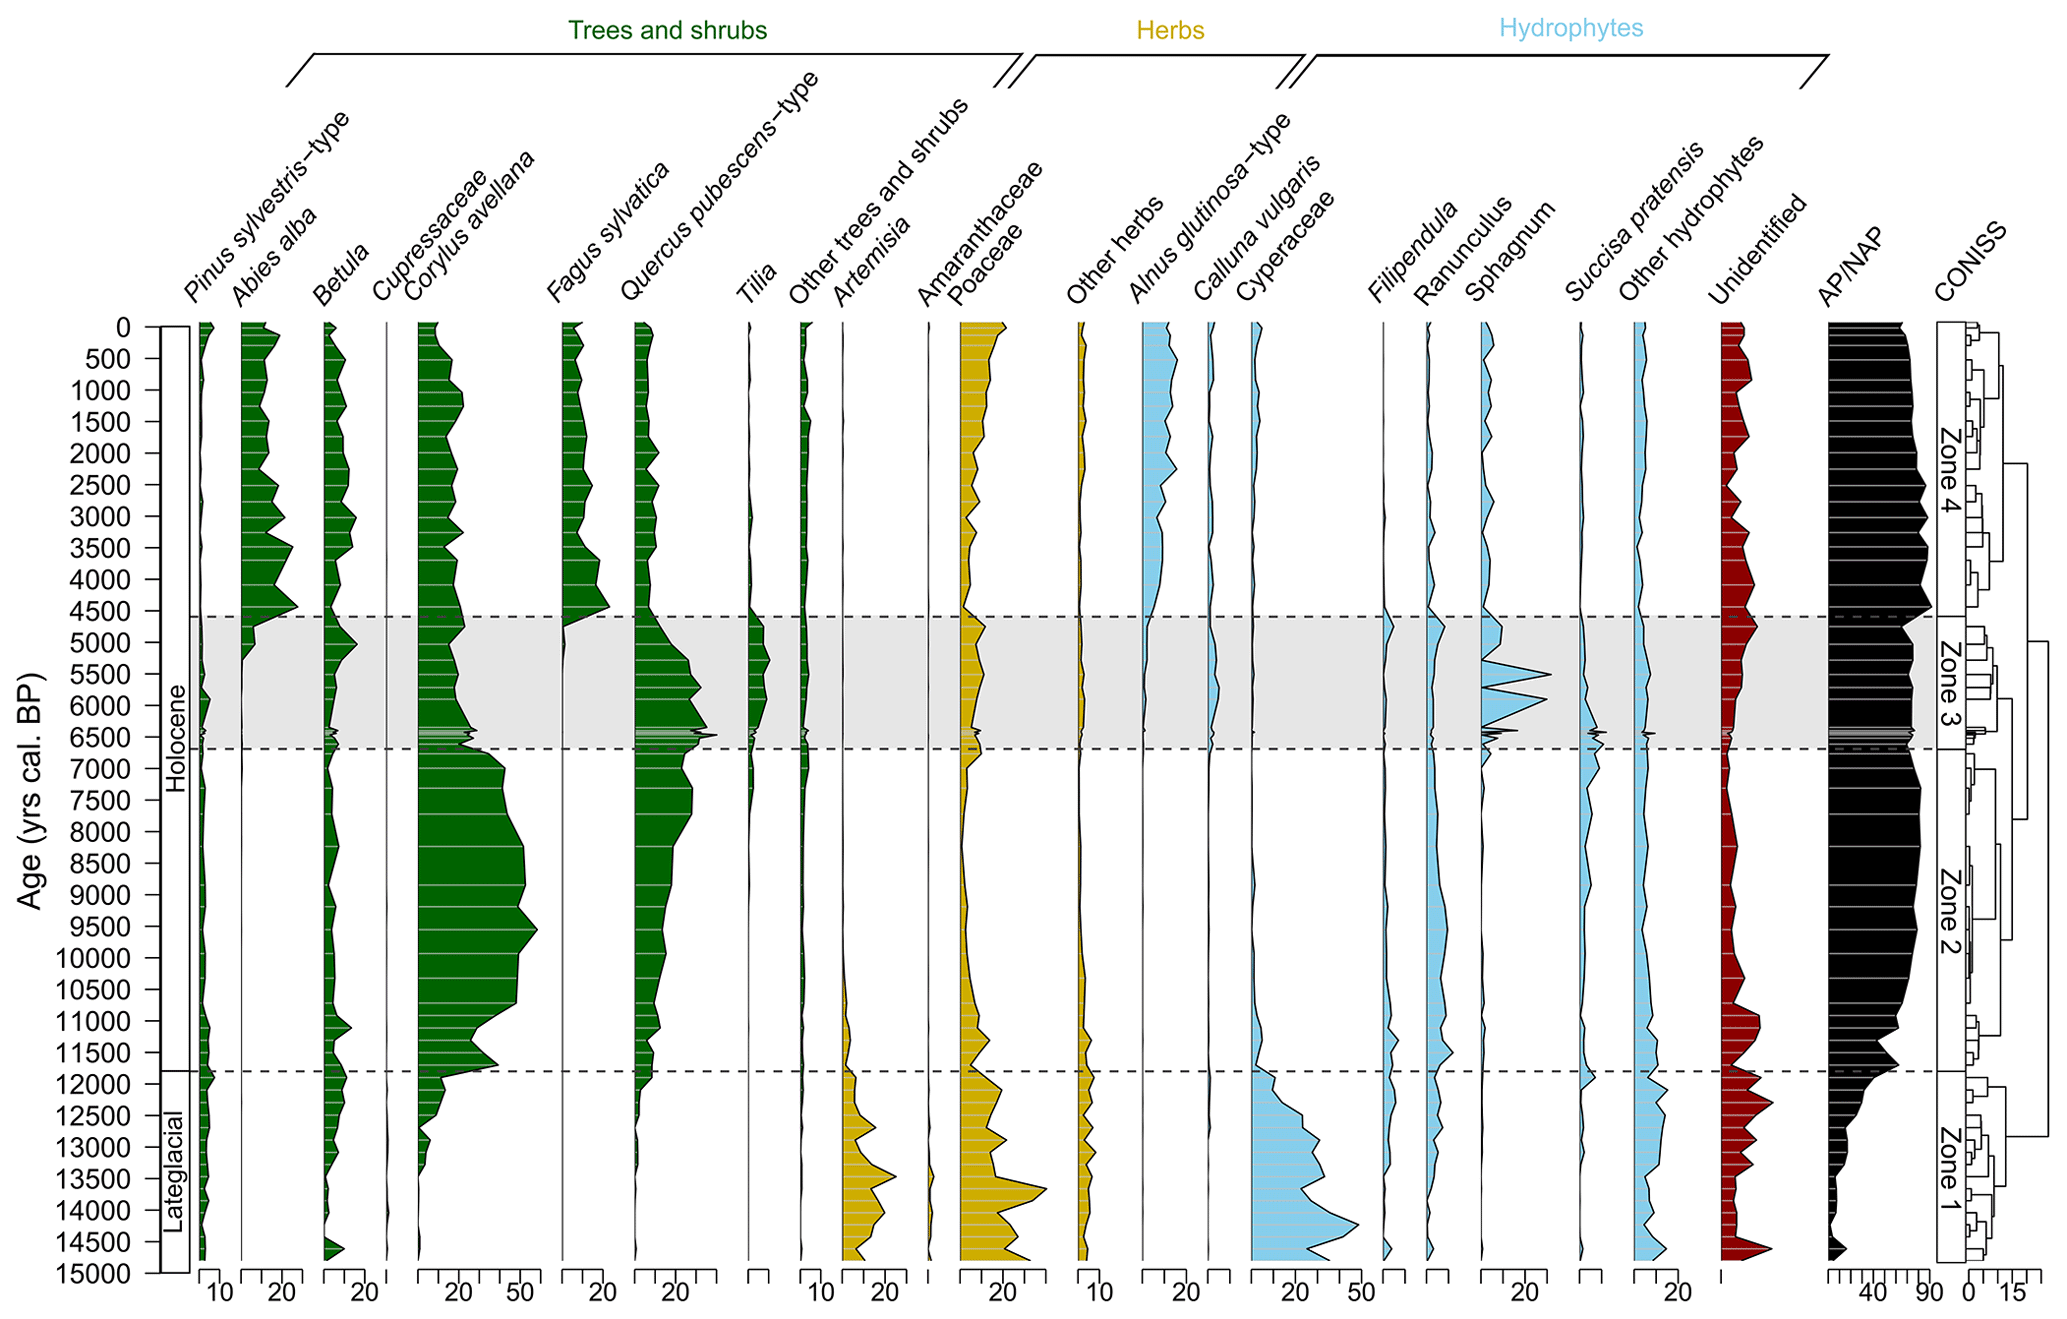
Figure 6Simplified pollen diagram of the CAN02 sequence grouping selected tree taxa (green), herbaceous taxa (yellow), hydrophytes (blue), and AP/NAP ratio (black). Percentages were calculated on pollen sums excluding spores. The dashed black lines delineate four zones based on CONISS. The shaded period highlights the period of decrease in megaphorb taxa to the benefit of Calluna vulgaris and Sphagnum (6600–4500 cal BP).
3.3.3 Palaeotemperature reconstruction
All calibrations show similar trends during the Holocene, i.e. (1) cold conditions between 15 000–11 500 cal BP, followed by (2) warmer conditions until 6600 cal BP (Fig. 5c). This stable period ends with (3) a drop in temperature between 6600–5000 cal BP and is followed by (4) a new warming until 300 cal BP before (5) a new last drop in temperature (Fig. 5c). Despite similar and synchronous trends, the absolute values of temperature are different between calibrations. From the Late Glacial to the present, the peat calibration shows the lowest MAAT values, ranging from −5.0 to 6.9 ∘C (SD=0.5 ∘C, n=75), whereas multiple regression (mr), Index1, MBT'5Me, and Bayesian calibrations are associated with higher MAAT values ranging from 1.59 to 11.51 ∘C (SD=0.3 ∘C, n=75). Among all calibrations, the multiple regression, the Bayesian calibration, and the calibration based on Index1 show the lowest variations (respectively 7.2, 6.9, and 5.5 ∘C) compared to the peat calibrations and those based on methylation indexes (respectively 11.5 and 12.9 ∘C).
3.4 Pollen analysis
Zone 1 (from 15 000 to ca. 11 700 cal BP) of the pollen diagram (Fig. 6) is dominated by steppe taxa (Artemisia, Amaranthaceae, Poaceae), peatland (Cyperaceae up to 50 %), and megaphorb (Filipendula, Ranunculus, Succisa pratensis) but contains some occurrences (mostly of long-distance origin) of Betula, Corylus avellana, the Pinus sylvestris type, and the Quercus pubescens type. At the end of this period, the arboreal pollen represents ca. 45 % of the pollen sum, indicating the gradual replacement of the steppe vegetation by forests.
Zone 2 (from 11 700 to 6600 cal BP) is dominated by Corylus avellana (up to 60 %) and to a lesser extent by the Quercus pubescens type (<30 %) that progressively increases. During this period, the record of steppe taxa decreases, but hydrophytes are still present.
Zone 3 (from 6600 to ca. 4500 cal BP) is marked by an increase in the Quercus pubescens type and Tilia at the expense of Corylus avellana. This period is also marked by the decrease in megaphorb taxa and by the record of Poaceae, Calluna vulgaris, and Sphagnum.
Finally, Zone 4 (from ca. 4500 to −80 cal BP) is characterized by the mesophilous Abies alba and Fagus sylvatica, and the hydrophyte Alnus glutinosa type. Corylus avellana and the Quercus pubescens type continue to decrease, while Tilia is only slightly recorded.
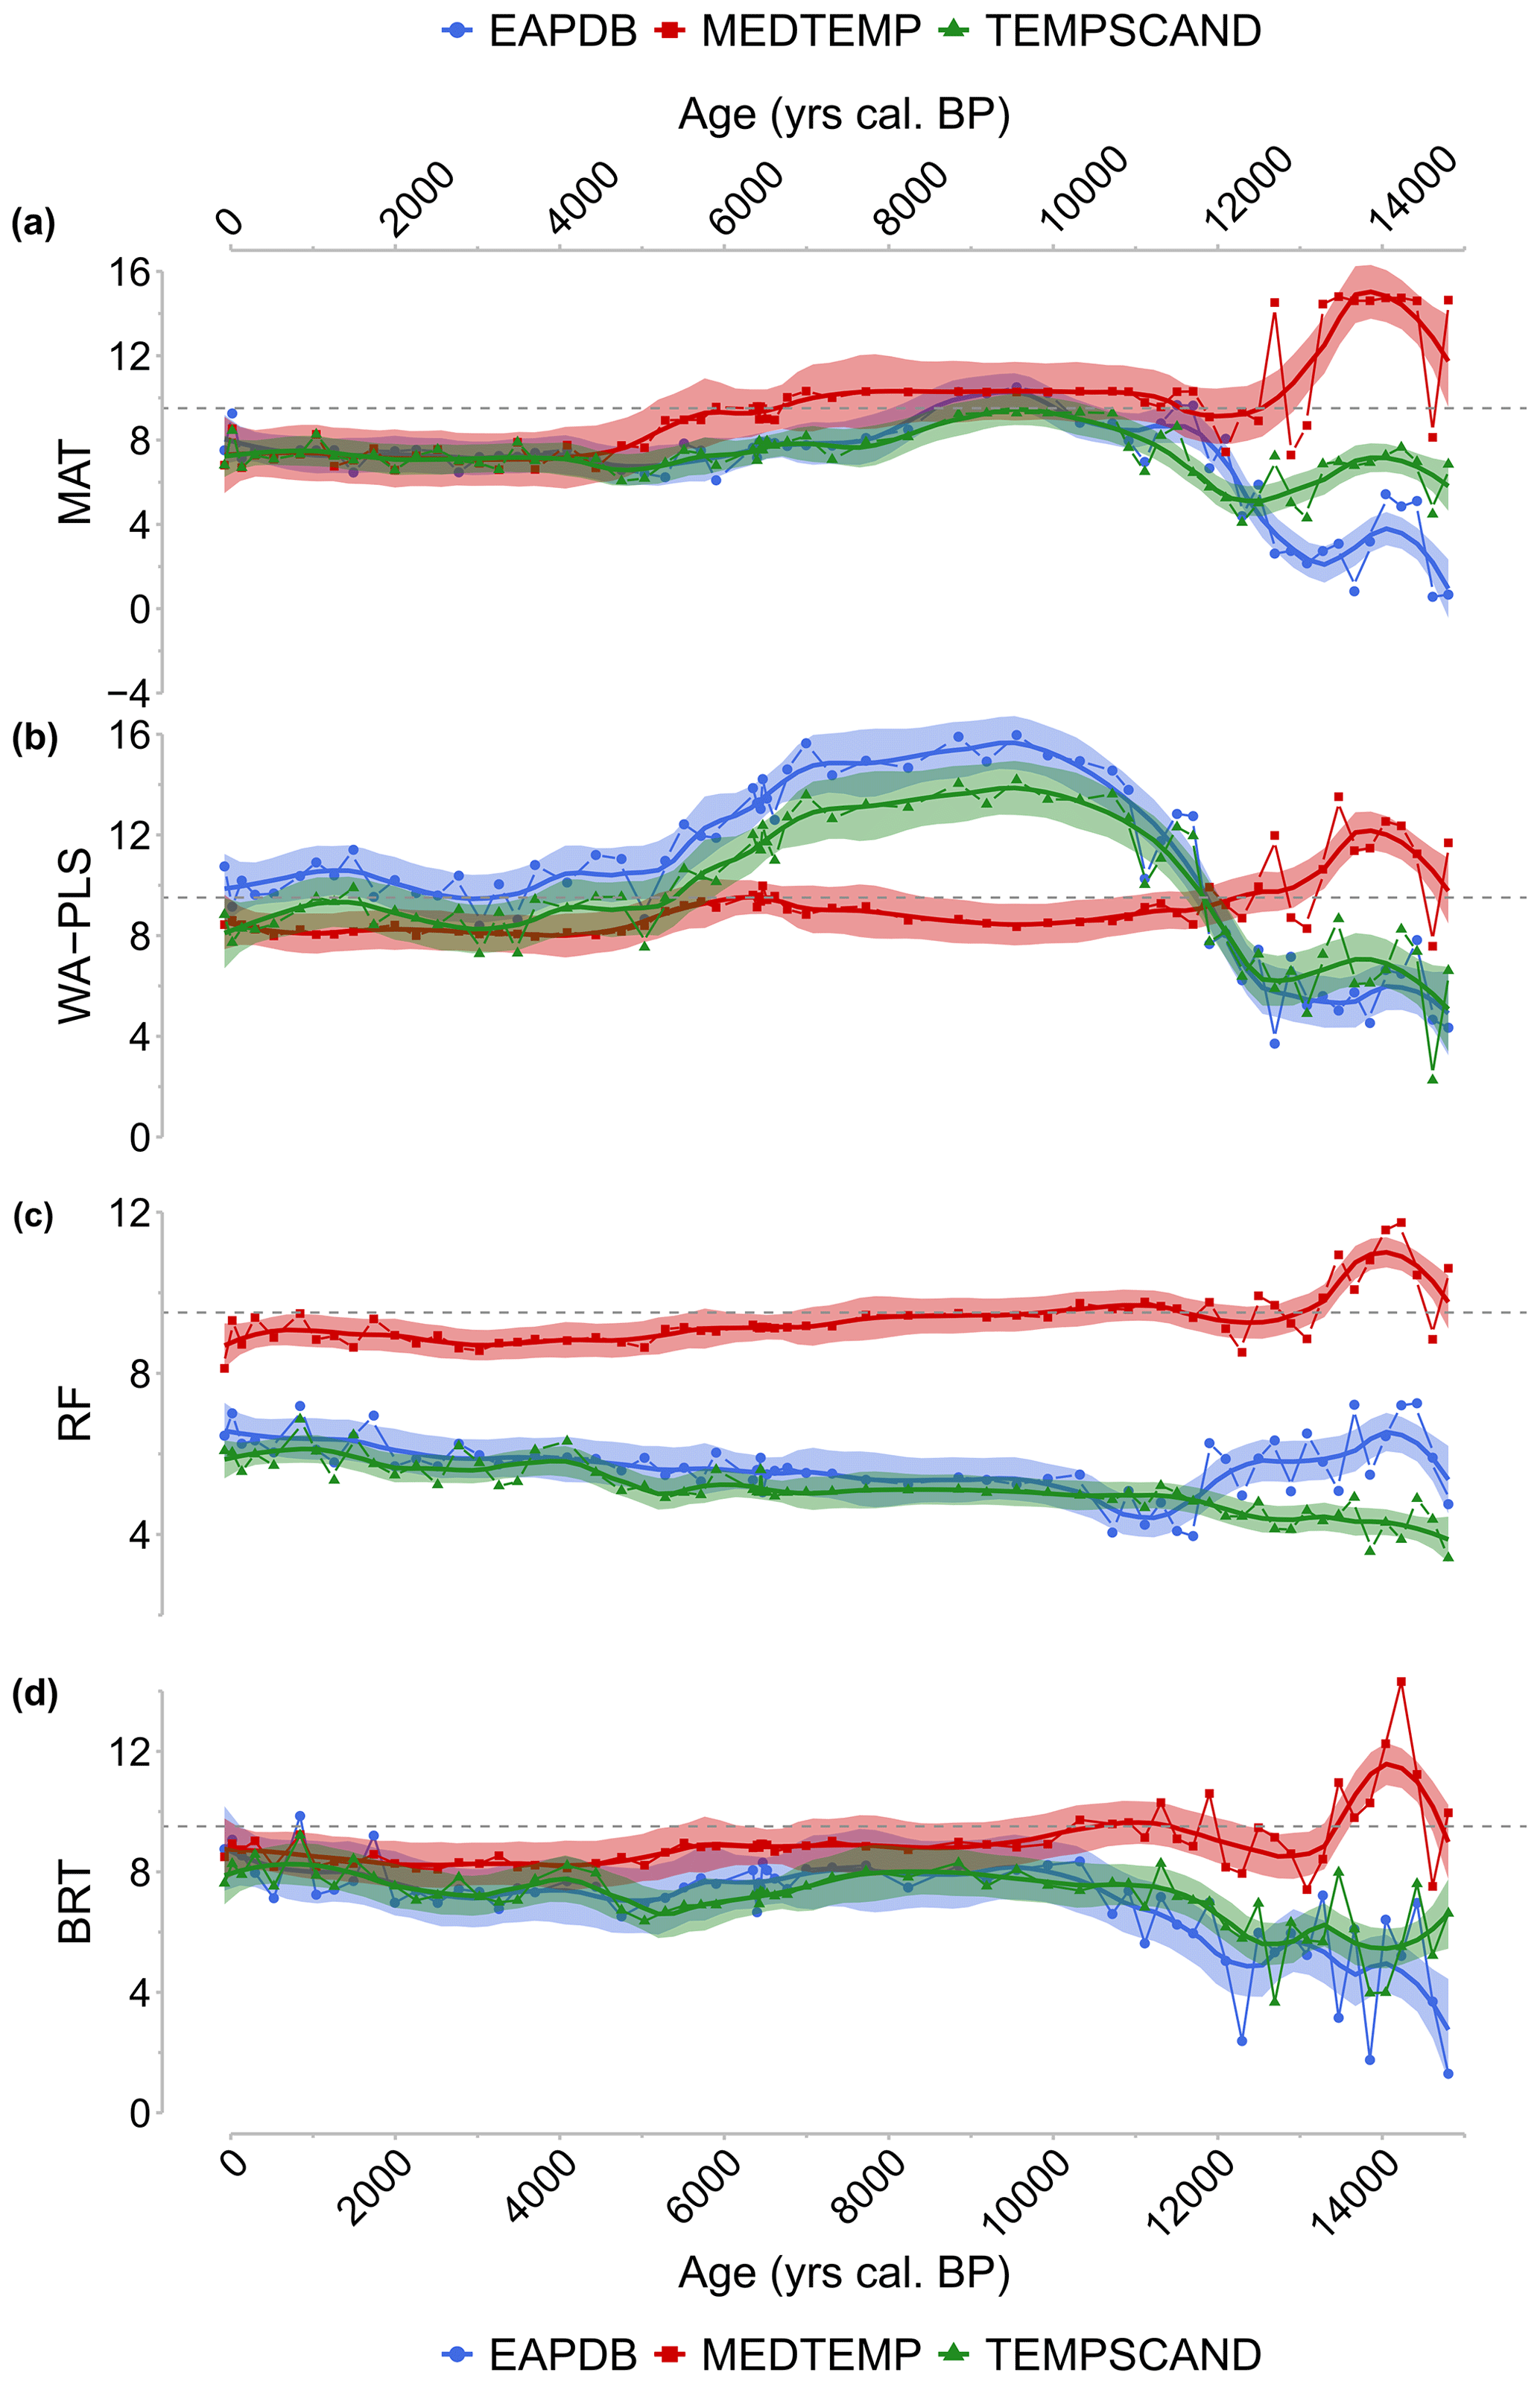
Figure 7Climate signal from the three calibration sets EAPDB (blue circles and curves), MEDTEMP (red squares and curves), and TEMPSCAND (green triangle and curve) for the MAT (a), the WA-PLS (b), the RF (c), and the BRT (d) methods. Black dashes: current MAAT at Canroute.
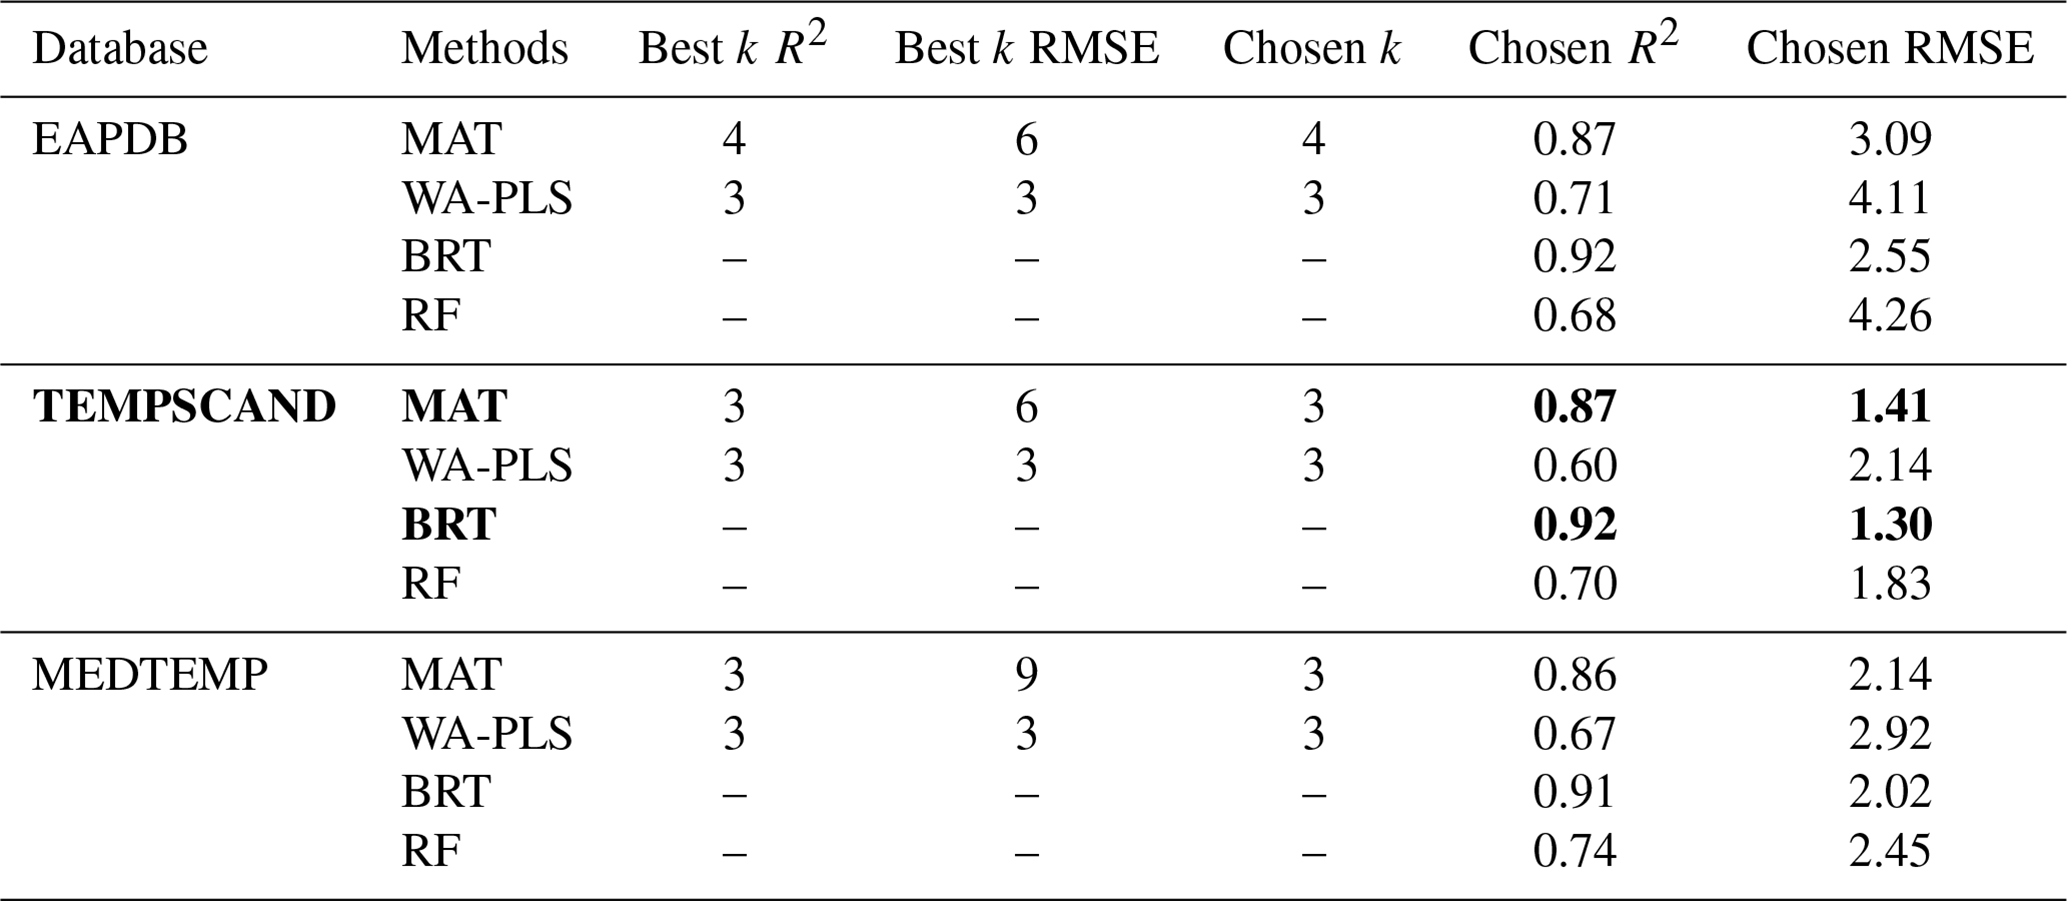
Table 3Performance results of the MAT, WA-PLS, BRT, and RF methods applied to three different modern pollen databases – the modern Eurasian (EAPDB), Temperate Europe–Scandinavian (TEMPSCAND), and Mediterranean–Temperate Europe (MEDTEMP) databases – for mean annual air temperature (MAAT; ∘C); k is the number of parameters used in the methods (e.g. number of analogues for the MAT method or the number of PLS components for the WA-PLS method). The best k corresponds to the number of parameters that infer the best R2 and calibration error (RMSE) values. The chosen k corresponds to the lowest number of parameters associated with the best R2 and RMSE values. In bold: selected database and methods associated with their respective R2 and calibration error (RMSE) values.
3.5 Pollen-inferred mean annual temperature
To provide reliable climate reconstruction, we applied a multi-method approach tested here with three different modern pollen databases to the Canroute pollen assemblages. The results based on the global EAPDB and regional TEMPSCAND databases broadly indicate the same temperature trends, but with smaller amplitudes for the TEMPSCAND calibration. The MEDTEMP regional calibration shows opposite trends compared to the other two databases, particularly during the Late Glacial (Fig. 7). The EAPDB and TEMPSCAND databases are associated with higher values of R2 than the MEDTEMP ones (Table 3).
For the EAPDB and TEMPSCAND modern pollen datasets, three of the methods (MAT, WA-PLS, and BRT) show a similar climatic signal (Fig. 7a, b, and d) characterized by (1) cold temperatures during the Late Glacial, followed by (2) a warming through the Early Holocene, resulting in a thermic optimum accentuated depending on the methods used, then (3) a sudden cooling around 6000 cal BP, again followed by (4) a slight warming for 5000 cal BP onward. Cold conditions (MAAT around 2.3 to 8.7 ∘C) are evidenced from 15 000 to 11 700 cal BP. The first warming occurs between 11 700 and 6000 cal BP. The WA-PLS (and the MAT) indicate high values for this thermal optimum (Fig. 7a and b), while the BRT method indicates a warming of 1.5 ∘C between 12 000 and 6500 cal BP (Fig. 7d). The duration of the cooling observed around 7000–6500 cal BP is method-dependent. The cooling reconstructed with the MAT and WA-PLS is progressive, with a variation in the MAAT of −2.1 and −4.5 ∘C respectively, and is shorter for the MAT than for the WA-PLS (Fig. 7a and b). The BRT indicates a slight cooling between 6400 and 4700 cal BP, less marked than for the other two methods, with a variation of −0.9 ∘C (Fig. 7d). The last period is characterized by a slight warming trend that is particularly marked for the BRT and WA-PLS methods, with an increase of +2.4 and +2.6 ∘C respectively. The MAT indicates a warming of 1.9 ∘C (Fig. 7c). BRT, MAT, and WA-PLS are the three methods with the largest temperature amplitudes. The RF shows a much less contrasting climate signal over time (3.4 ∘C variations between 15 000 cal BP and present; Fig. 7c), a climate pattern that is different than from the results obtained with the MAT, WA-PLS, and BRT methods. Contrary to the EAPDB and TEMPSCAND, the results obtained with the MEDTEMP show a warm Late Glacial and the absence of the thermic optimum for the four methods (Fig. 7).
The BRT method shows higher values of R2 (Table 3; R2=0.92, RMSE=1.30), and the RF method shows lower values of R2=0.70 (RMSE=1.83).
4.1 Past vegetation, peat accumulation, and detrital activity
The Late Glacial steppe environment, dominated by Artemisia, Poaceae, and to a lesser extent Amaranthaceae (including the ex-Chenopodiaceae), reveals cold and dry conditions. However, the records of Cupressaceae (only represented by Juniperus at that time) and especially Betula reveal the first afforestation dynamics supported by the slight warming of the Bølling–Allerød period. The end of the Late Glacial is characterized by the early expansion of temperate deciduous forests of Corylus avellana and the Quercus pubescens type, surprisingly contemporaneous with the Younger Dryas cooling event (12 900–11 700 cal BP; e.g. Broecker et al., 2010; Denton et al., 2010). Although the whole Younger Dryas is well recorded in northern regions (e.g. Duprat-Oualid et al., 2022), only the onset of the period is marked at Canroute by a peak of Artemisia and Amaranthaceae and a punctual decrease in both Corylus avellana and the Quercus pubescens type. This pattern could be the result of a lack of accumulation, as the low PAR indicates during this period (Fig. 3a), or it could be due to a Younger Dryas event in this region that is not very marked.
The beginning of the Holocene is marked by a strong dominance of Corylus avellana that constituted woodland, whose open character can be associated with a dominant mechanic erosion of the soil (Mohammad and Adams, 2010), allowing the strong detrital activity revealed by XRF until 9000 cal BP. After this date, the progressive decrease in detrital activity may be attributed to the slow expansion of deciduous oaks, which replaced hazelnut open woodland across southern France and reduced the mechanic erosion. However, the slower establishment of dense deciduous forests compared to the southern Alps (de Beaulieu, 1977; de Beaulieu and Reille, 1983) suggests the influence of unfavourable climate conditions which slowed oak progression.
The emergence of a dense mature oak forest is attested between 6600 and 4500 cal BP by both the maximal pollen record of the Quercus pubescens type and Tilia (Fig. 6) and the decrease in mineral input (Fig. 3b and c) that reveals the reduced detrital activity. Such a vegetation change occurring on the surrounding slopes is likely to have triggered hydrological changes within the studied wetland, which effectively experienced several contemporaneous changes: an abrupt acceleration of peat accumulation (Fig. 3a), an increase in organic matter content (from less than 40 % to more than 80 %; Fig. 3d; Joosten, 2015), and a replacement of the previous megaphorb by a bog-type peatland dominated by Calluna vulgaris and Sphagnum (Fig. 6). These changes are consistent with a loss of water runoff on the wetland surface, the result of either a reduced water supply resulting from a change in the river system or the natural rise in peatland surface that progressively isolated peat-forming vegetation from groundwater. Finally, change affecting both the local hydrophytic vegetation and the surrounding landscape occurs at ca. 4500 cal BP, when the open peatland system is replaced by an alder swamp dominated by A. glutinosa (the only Alnus species present in the Massif Central), and the deciduous oak forest declines in favour of a mixed fir–beech forest. While this change could be interpreted as an environmental shift towards “mountainous” conditions, the contemporaneous pollen record of Plantago (not seen in Canroute) and the late Neolithic date (Miras et al., 2005) could also suggest anthropogenic impact, which likely destabilized the competitive equilibrium in favour of the mixed forest onset.
4.2 Climate signal from pollen
Different studies underline the importance of the modern pollen database used for the reconstruction of climate parameters (Turner et al., 2021) and point out the advantage of regional calibration databases (Dugerdil et al., 2021a, b). The results obtained with the Eurasian pollen database (EAPDB) and regional Temperate Europe–Scandinavian pollen database (TEMPSCAND) broadly indicate similar temperature trends at Canroute, while those based on the Mediterranean–Temperate Europe pollen database (MEDTEMP) shows opposite trends (Fig. 7). These discrepancies can be explained by the dominance in this period of taxa such as Artemisia, Amaranthaceae, and Poaceae (Fig. 6), able to constitute physiognomically and floristically similar arid steppes, both in the southern Mediterranean and Irano-Turanian warm context (e.g. Le Houérou, 2001) and in the north-eastern Eurasian cold context (e.g. Yurtsev, 1982). From 11 700 cal BP onwards, the methods performed on the three databases show similar trends but with different amplitudes. Signals obtained with the EAPDB and TEMPSCAND databases are particularly close, especially for the MAT and BRT methods (Fig. 7a and d), while climate results based on the MEDTEMP dataset appear as non-reliable due to the absence of Mediterranean taxa in the pollen sequence (Fig. 6), as well as the poor R2 and RMSE values (Table 3).
Among the four methods, RF and WA-PLS appear as the least reliable (low R2 and high RMSE; Table 3), so the MAATs reconstructed by these two methods will not be considered in the following discussion. For the MAT and BRT methods, the TEMPSCAND database calibration seems to produce a signal as reliable as the one produced with the EAPDB calibration set (close R2 and RMSE values; Table 3). The TEMPSCAND calibration produces a particularly close signal between the two methods, exhibits less variability, and has better R2 and RMSE values, bolstering the reliability of the reconstructions based on this calibration database. Furthermore, calibrations employing regional datasets appear to be more reliable than those using global datasets (Dugerdil et al., 2021a), and because the TEMPSCAND modern dataset is more regional than the EAPDB one, it is taken into account in the subsequent discussion.
MAT and BRT are two methods based on different mathematical and ecological concepts (Chevalier et al., 2020), so their similar reconstructed trend supports the reliability of the methods and calibrations. However, the MAT shows a larger temperature range and in particular a slight thermal optimum in the Early Holocene, between 11 700–8000 cal BP (Fig. 7a). A similar pattern, although marked by more pronounced positive anomalies, is shown by Martin et al. (2020) for Lake St Front, where high percentages of Corylus (<55 %) are also recorded. Such a high proportion of Corylus does not exist in the modern pollen database assemblages of the TEMPSCAND dataset. The highest proportion (25 %–35 %) is associated with sites located in Italy, Ireland, and Albania, explaining the bias in the signal towards higher temperatures for the EAPDB- and TEMPSCAND-based calibrations. In the CAN02 pollen sequence, the Early Holocene is also characterized by high Corylus percentages (up to 60 %; Fig. 6), which could explain the large temperature variation between the Late Glacial and Early Holocene proposed by the MAT, the only method based on the similarity of present-day and fossil assemblages. For the 10 700–6600 cal BP period, it can be suggested that the MAT method is less efficient than the BRT one because Early Holocene hazelnut woodland has no modern analogue. Nevertheless, both the MAT and BRT methods calibrated on the TEMPSCAND database can be retained in the following discussion because of the good reliability of their reconstructions.
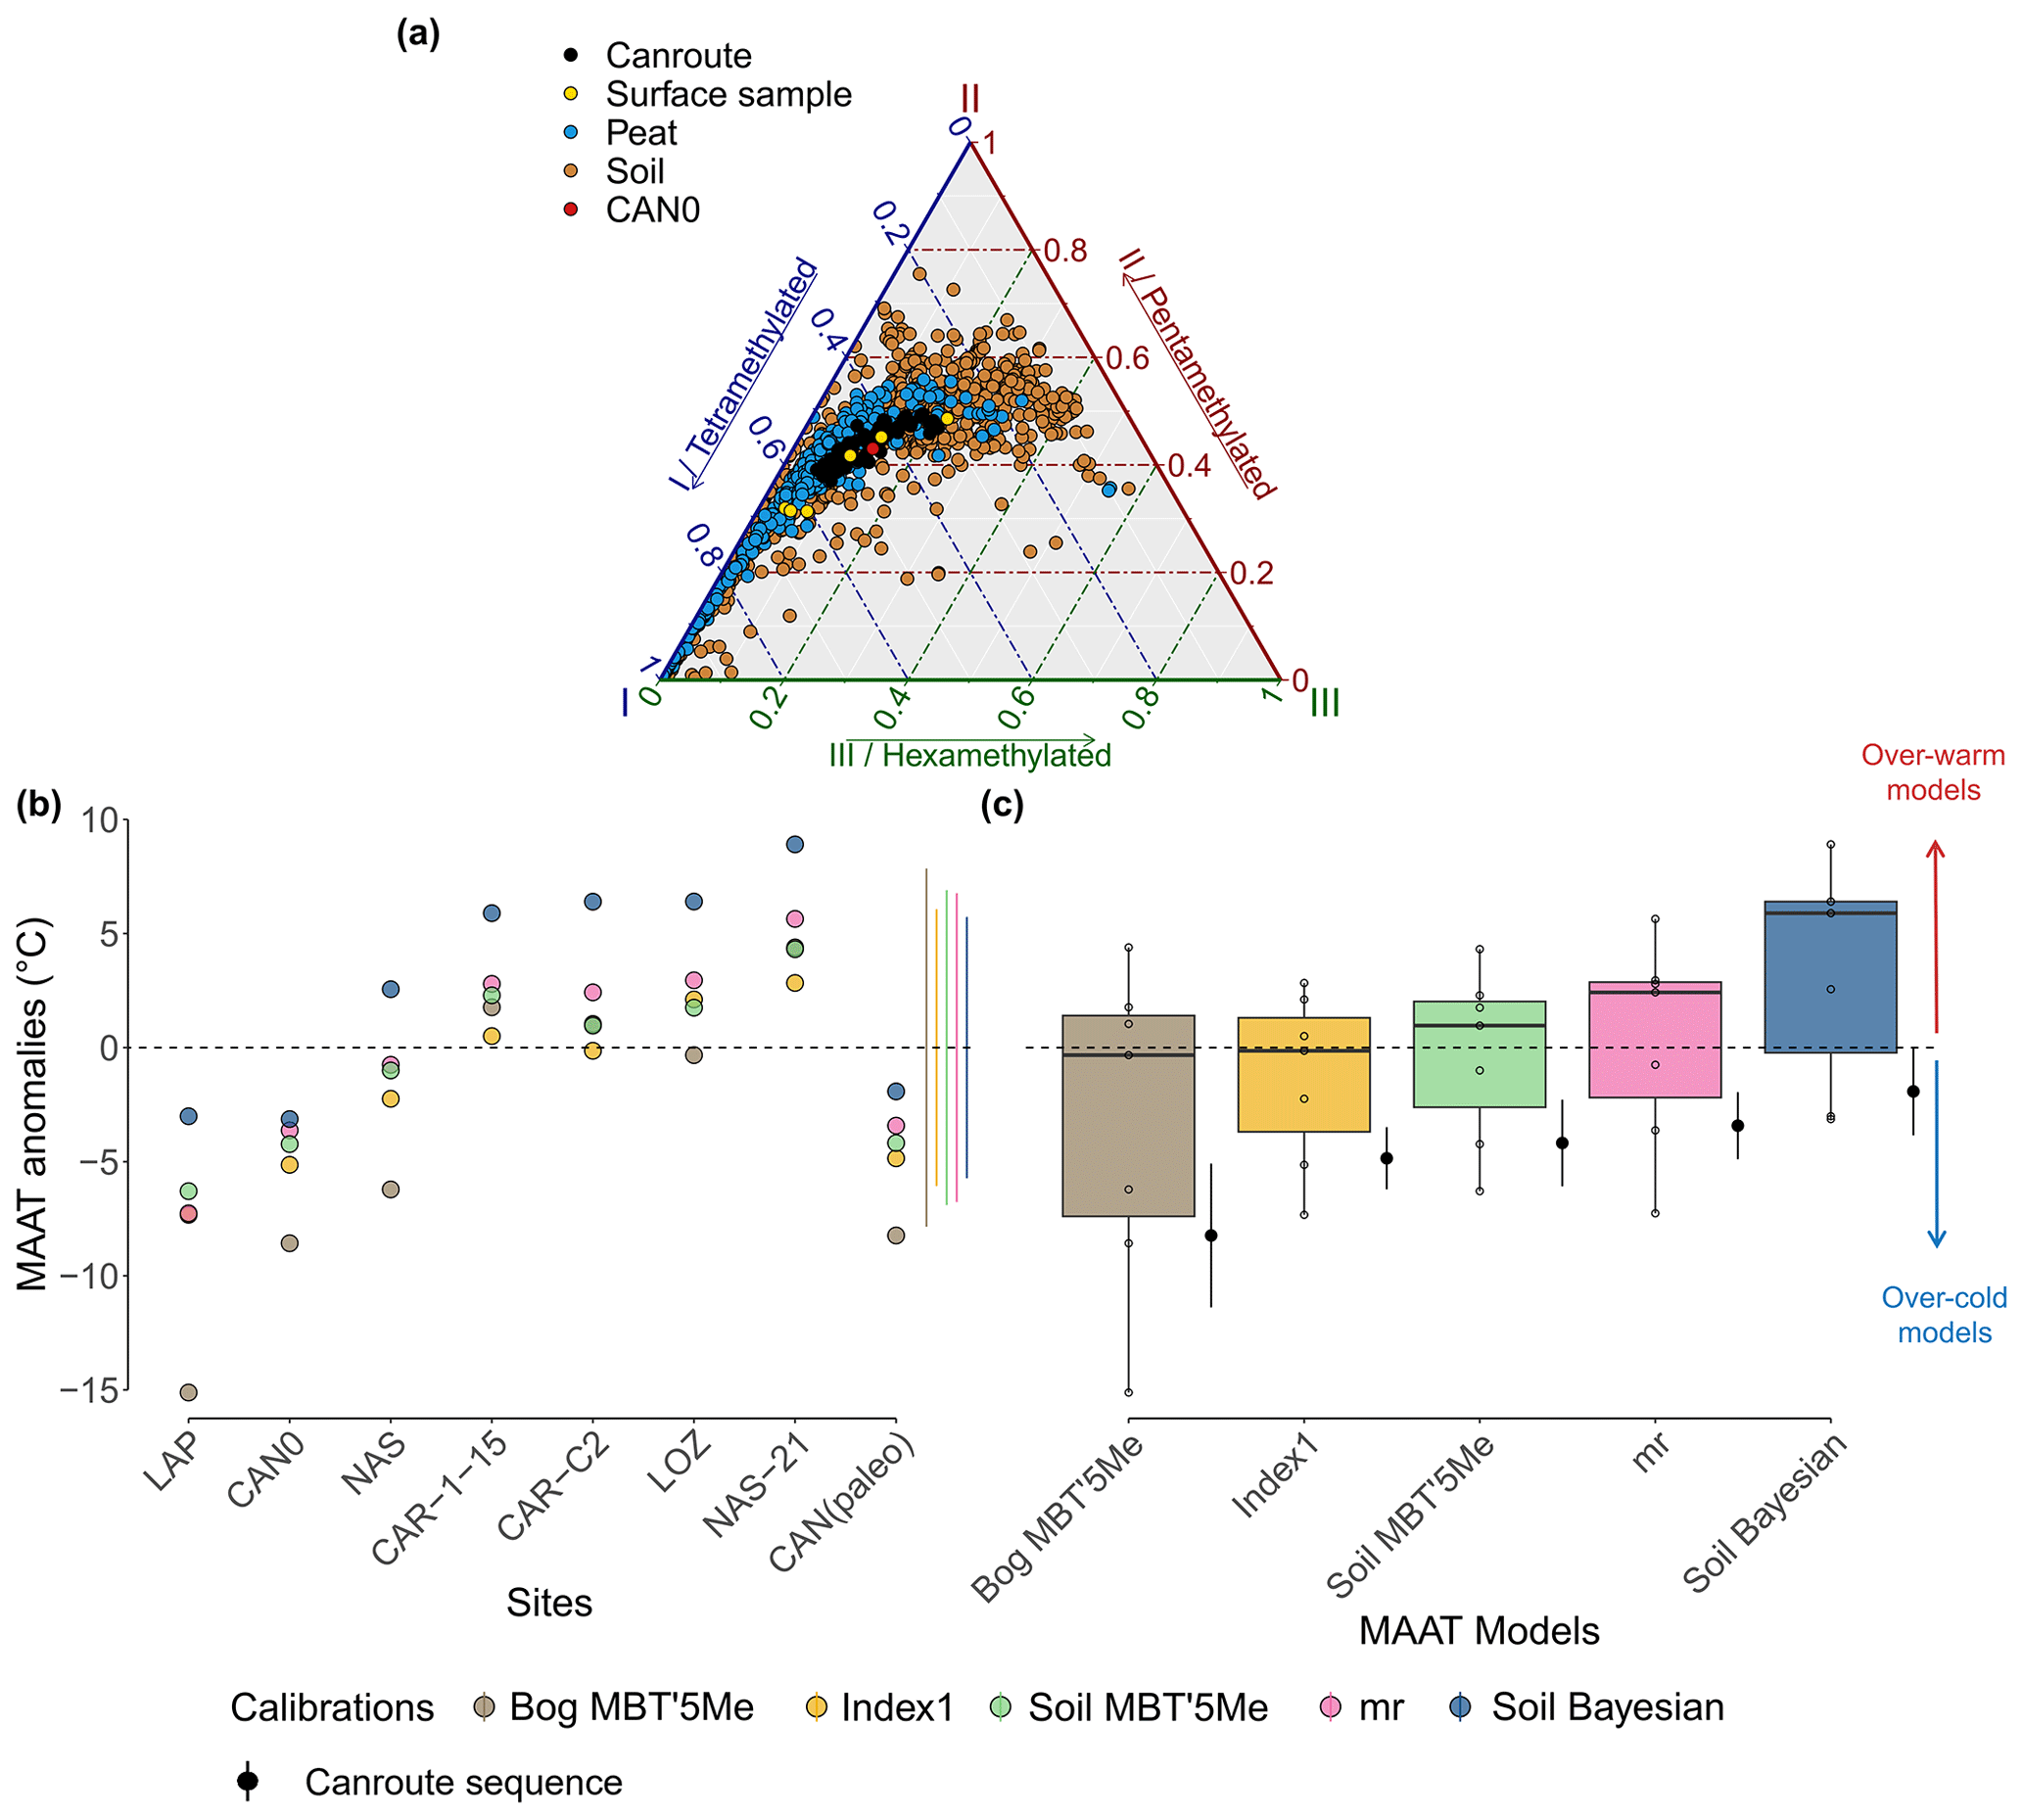
Figure 8(a) Ternary plot of fractional abundances of tetra-, penta-, and hexamethylated brGDGTs for CAN02 core samples (in black) and Massif Central surface samples (in yellow and red) and for global peat (Naafs et al., 2017a; in blue) and soil databases (Yang et al., 2014; Naafs et al., 2017b; Dearing Crampton-Flood et al., 2020; in brown). (b and c) Testing of soil and peat calibrations on surface samples and CAN02 core samples. (b) Reconstructed MAAT from each calibration expressed as anomalies with respect to the mean annual temperatures measured at the sites. The standard deviation of each calibration applied to the CAN02 sequence (palaeo) is represented by the lateral lines on the right side. (c) Boxplot representing the results of the calibrations applied to the surface samples (n=6). Black points with error bars next to each calibration correspond to temperature anomalies of CAN02 core samples.
4.3 Temperature signal from brGDGTs
4.3.1 Consistency of brGDGTs relative abundances with peat and soils databases
The Canroute fossil samples and the surface samples from Massif Central are consistent with the global peat and soil databases that are globally dominated by tetra- and pentamethylated brGDGTs (Fig. 8a; Yang et al., 2014; Naafs et al., 2017a, b; Dearing Crampton-Flood et al., 2020). The use of both types of calibrations (peat and soil) therefore appears to be consistent with the brGDGT assemblages observed in the CAN02 sequence.
4.3.2 Selection of the most relevant brGDGT calibrations
The brGDGT relative abundances in the surface samples of Nassette (NAS), Lapsou (LAP), and Canroute (CAN0) are close to that of the Canroute (CAN02) sequence. For these three samples, the Bayesian calibration (Soil Bayesian; Dearing Crampton-Flood et al., 2020), the one based on MBT'5Me (Soil MBT'5Me), Index1 (Index1), and multi-regression (mr) (De Jonge et al., 2014a) show more reliable reconstructed MAAT anomalies compared to the current MAAT of their respective location (Fig. 8b). For the samples from the Caroux site (CAR-1-15 and CAR-C2), which is also a soligenous peatland and is geographically the closest site to Canroute (Fig. 1a), the calibrations based on Index1 and multi-regression appear to be the most reliable compared to their current MAAT (Fig. 8b). For the Canroute surface sample (CAN0), the calibration based on the MBT'5Me (Soil MBT'5Me) and the Bayesian calibration (Soil Bayesian) provide temperature values closer to the present temperatures at Canroute (Fig. 8b). Soil calibrations based on Index1, MBT'5Me, multi-regression, and Bayesian calibration produced the most suitable MAATs: both the Index1 and the multi-regression calibrations show a good estimate of the current MAAT, with a low scatter and a current MAAT close to the observed climatic conditions at Canroute (Fig. 8c). When applied to the whole sequence (CAN02), these two calibrations (Index 1 and mr) have the lowest standard deviations (respectively SD=1.4 and 1.5 ∘C, n=75; Fig. 8c). Regarding the Bayesian and MBT'5Me calibrations, they show a less reliable estimate of the current MAAT and have a close standard deviation when applied to the CAN02 sequence (SD=1.9 ∘C, n=75; Fig. 8c). However, the Bayesian calibration is associated with a lower error than the MBT'5Me-based one (RMSE=3.8 and 4.8 ∘C respectively; Fig. 8b).
Ultimately, among the five calibrations tested, three of them (Bayesian, Index1, and mr) are retained for the interpretation of the climate trend at Canroute, due to the low RMSE of the Bayesian calibration and the low standard deviations of Index1 and multi-regression (mr) calibration reconstruction.
4.3.3 Interpretation of the climate signal
According to various studies in peatlands, communities of brGDGT-producing Bacteria as well as brGDGT composition are controlled by local hydrological conditions (Rao et al., 2022), vegetation composition (Xiong et al., 2016), and pH (De Jonge et al., 2021), whose changes are thus likely to affect temperature reconstructions (De Jonge et al., 2019). Furthermore, edaphic factors such as anoxic or oxic conditions have an impact on GDGT production and bacterial communities (Weber et al., 2018). Because crenarchaeol and GDGT-0 can be derived from Group I Crenarchaeota, the GDGT-0 crenarchaeol ratio can be used to investigate the presence of methanogenic Archaea that thrive in anoxic conditions in sediments, whereas methanogenic Archaea synthesize GDGT-0, but no crenarchaeol (Blaga et al., 2009). The lower the ratio, the lower the anoxic conditions. Crenarchaeol is also an indicator of the water-table level, which refers to the limits between the acrotelm and catotelm in peatlands and therefore is an indicator of anaerobic conditions (Yang et al., 2019). In the CAN02 sequence, the abundance GDGT-0 decreases in favour of crenarchaeol over time (Fig. C1a). This points to less anoxic conditions, indicating that the Canroute water-table level lowers over time, making the peatland surface drier. Furthermore, the brGDGT index IIIa/IIa, which investigates brGDGTs sources (Xiao et al., 2016), exhibits a significant shift in its values throughout the sequence (0.12 to 0.46), demonstrating the effect of environmental change on brGDGT composition. This correlates well with other proxies such as geochemical and pollen data that evidence a hydroseral succession from a water-demanding megaphorb to peatland and alder-swamp plant communities. Past vegetation and detrital activity showed the presence of three different local conditions in the peat, which can result in large pH fluctuations because plants influence soil and peat pH (De Jonge et al., 2021). Changes in pH can alter the fractional composition of brGDGTs and the bacterial community, influencing the MBT'5Me-based temperature. CBT' and IR show the increase in 6-methyl brGDGTs as pH increases. IR and CBT' values in the CAN02 sequence are at their lowest from 5000 to 2300 cal BP (Figs. 3b and 5d, dark-grey shaded area), resulting in a modest decrease in pH values (Fig. 3e). There is no change in the MBT'5Me during this time period, indicating that the change in brGDGT composition has no effect on the MBT'5Me employed for the temperature quantification. Soil and peat pH is also related to global climate patterns via precipitation, meaning that changes in precipitation dynamics over time might cause pH variations (De Jonge et al., 2021). Pollen-based precipitation changes (MAP) at Canroute can be compared to brGDGT-based pH reconstruction to try to differentiate the effects of climate and bacterial communities on pH variation (Fig. 9). The same methods and calibration as MAAT were utilized for the MAP signal, namely the BRT and MAT methods with the TEMPSCAND calibration. The MAP and pH signals do not appear to correspond well, as the wettest periods (from 11 500–8500 cal BP and 4500 cal BP onwards) are not associated with a noticeable decrease in pH (Fig. 9). This shows that precipitation dynamics have little effect on pH in Canroute peatland. Precipitation, which is normally acidic, can cause a low pH in ombrotrophic peatland (water supplied primarily by precipitation) (Sennès, 2004). Canroute, on the other hand, is a soligenous peatland, and because most of its water supply originates from streams and springs (Julve, 1994), its local vegetation is less affected by precipitation dynamics. This shows that pH variations are produced mostly by local vegetation and detrital changes, which are influenced by local hydrological conditions.
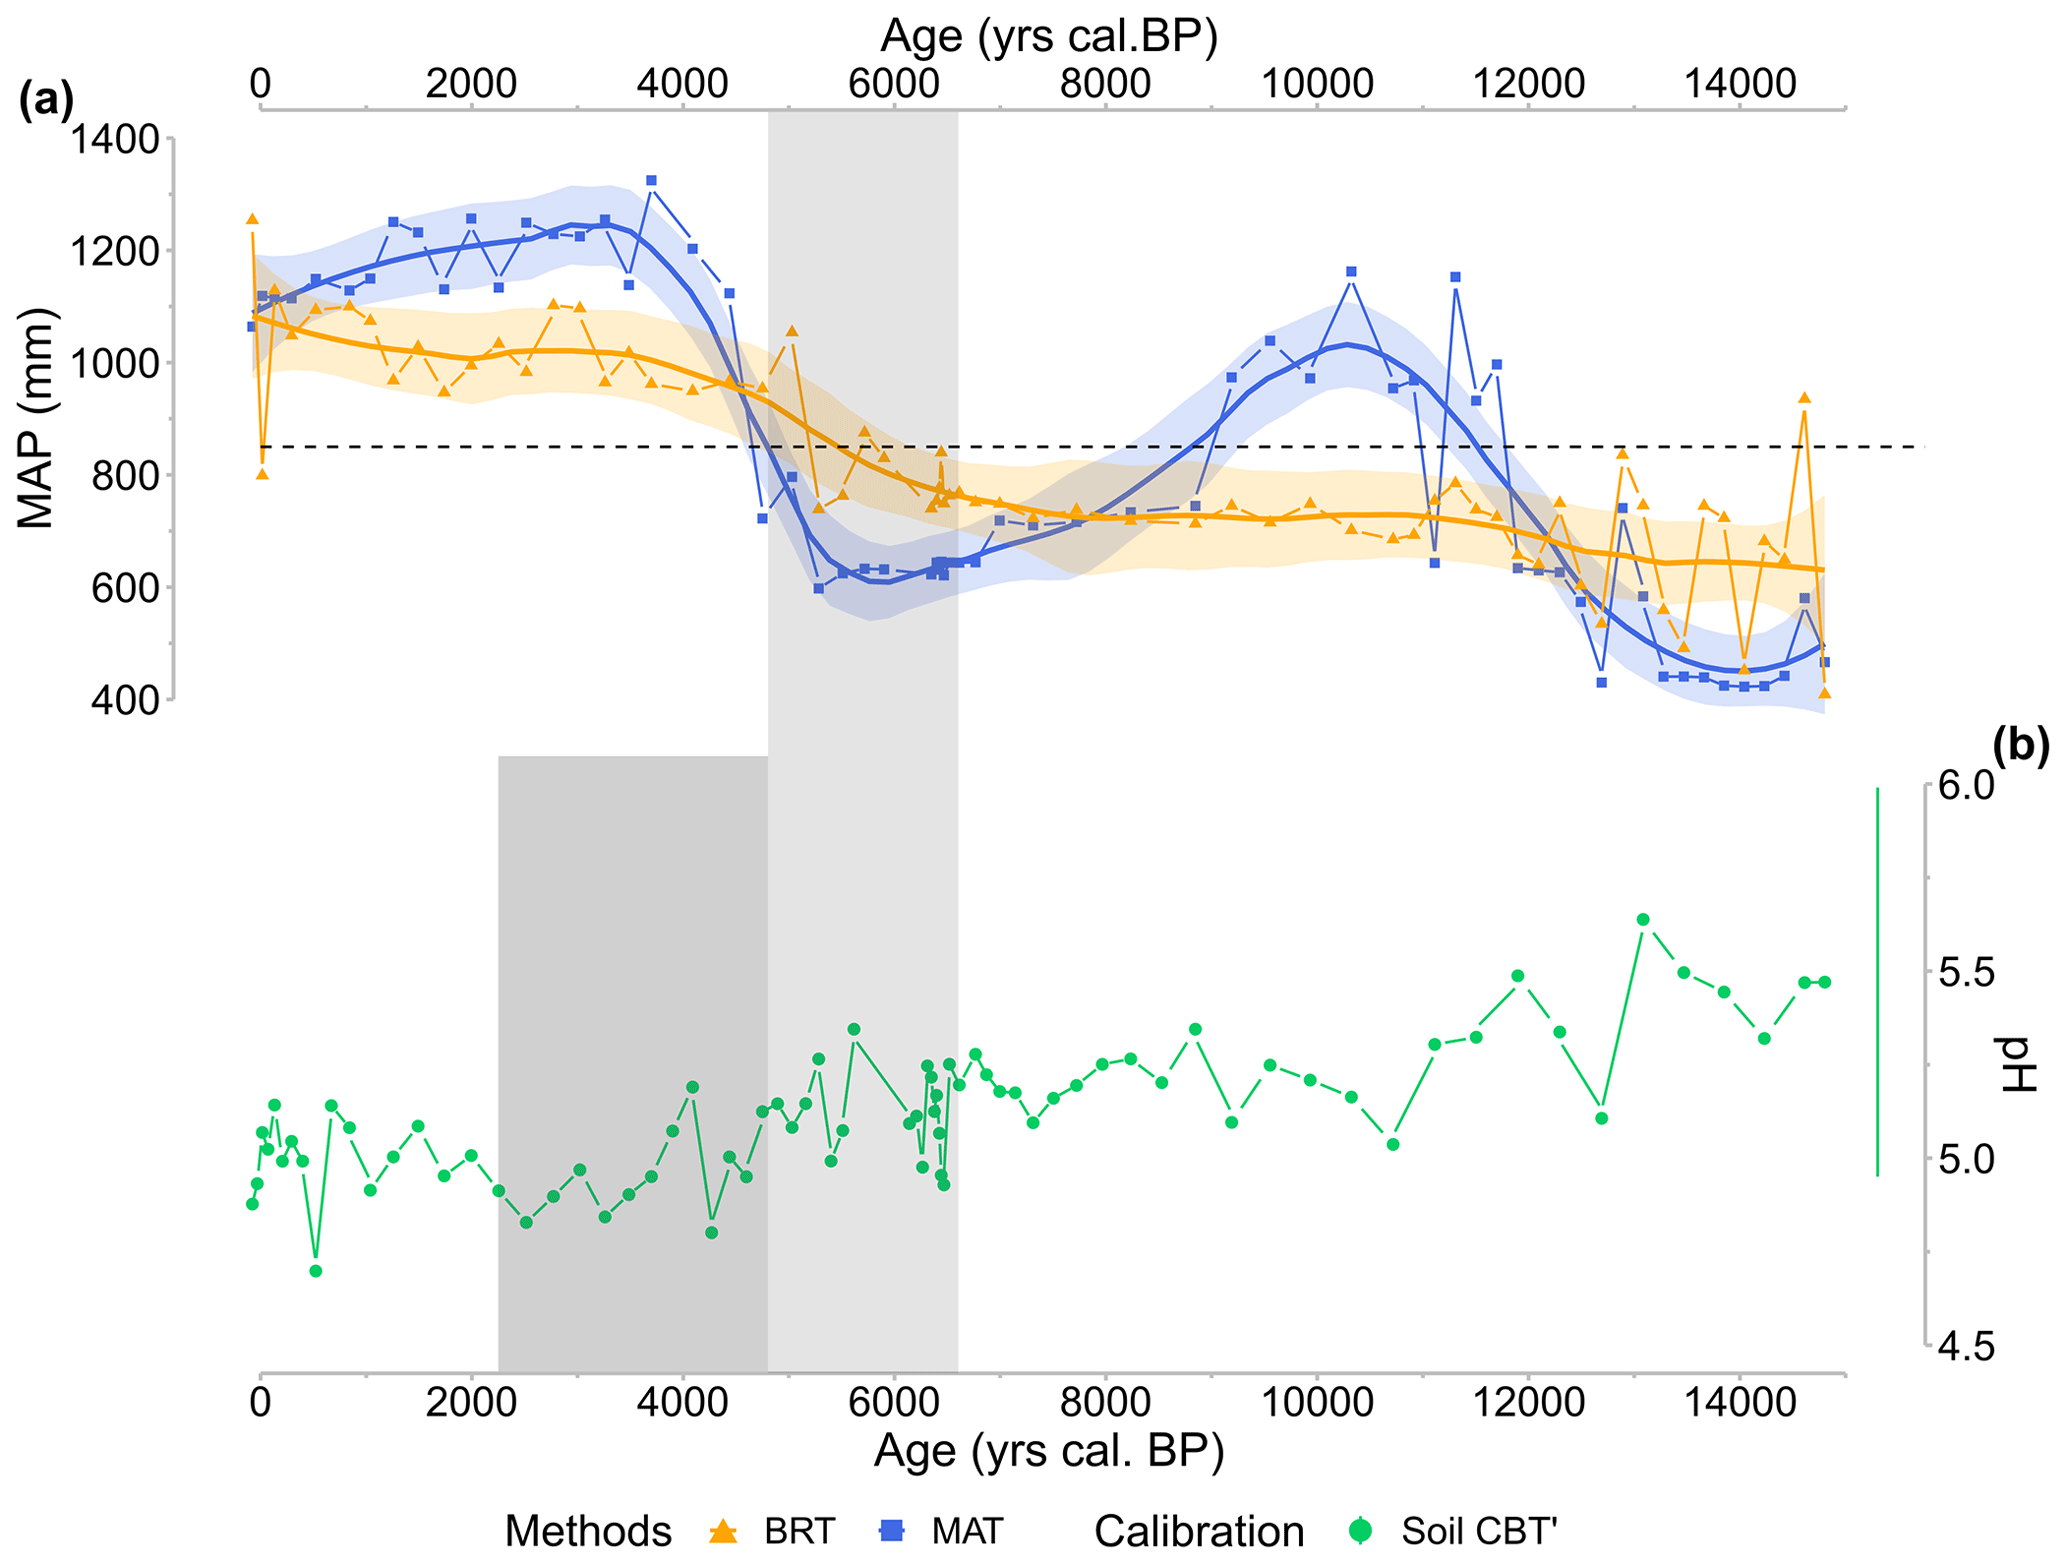
Figure 9CAN02 (a) pollen-inferred reconstructions of the annual precipitation (MAP; in millimetres) obtained with BRT (yellow squares and curve) and MAT (blue triangles and curve) methods based on the TEMPSCAND calibration. The solid line corresponds to locally estimated scatterplot smoothing (loess) regression curves; the shaded area corresponds to its 95 % confidence interval. The dashed black line corresponds to Canroute's current calculated MAP. (b) CBT'-based pH reconstruction (green circles and line; De Jonge et al., 2021). On the right, the lateral line represents calibration error (RMSE). The time highlighted in light grey reveals a large fall in tetramethylated brGDGT abundance and a shift in accumulation rate (6600–4700 cal BP). The era shown in dark grey highlights the decrease in CBT' and IR values (4700–2300 cal BP).
Temperature reconstructions can be affected by changes in the bacterial community of brGDGT producers (De Jonge et al., 2019), which can be studied using variations in CI values (De Jonge et al., 2021). Although the CI values in the CAN02 sequence do not exceed the 0.65 thresholds established by De Jonge et al. (2021), a significant shift in value indicates a potential change in bacterial community composition from 6600 to 4700 cal BP (Fig. 5e), implying that the temperature interpretation during this period should be done with caution.
Dearing Crampton-Flood et al. (2020) used two indicators of the presence or absence of climate seasonality, in terms of precipitation (SoP) and temperature (TS), to investigate a possible bias in the production of brGDGT compounds. The SoP index can aid in interpreting whether a region presents a potential production bias due to variability in the timing of precipitation (Dearing Crampton-Flood et al., 2020). A low SoP value is indicative of a relatively constant MAP throughout the year. Canroute is associated with a low SoP value (21) and therefore does not show a heterogeneous precipitation pattern, which can create a bias in the production of brGDGTs. A region associated with a TS value over 20 is considered to have high-temperature seasonality, which biases the proxy toward summer temperatures (Dearing Crampton-Flood et al., 2020). At Canroute, the TS value results in monthly mean temperature variability under 20 ∘C, which indicates a low-temperature seasonality, without bias.
Consequently, the climate signal reconstructed by brGDGTs does not seem to be drastically impacted by the changing environmental context before and after the 6500–4700 cal BP period. However, during the 6500–4700 cal BP period, the shift from a running-water-demanding vegetation to a less-demanding one (Fig. 6) seems to induce a shift in brGDGT indexes and bacterial communities. The temperature values reconstructed for this period (Fig. 5g, light-grey shaded area) thus must be interpreted with caution.
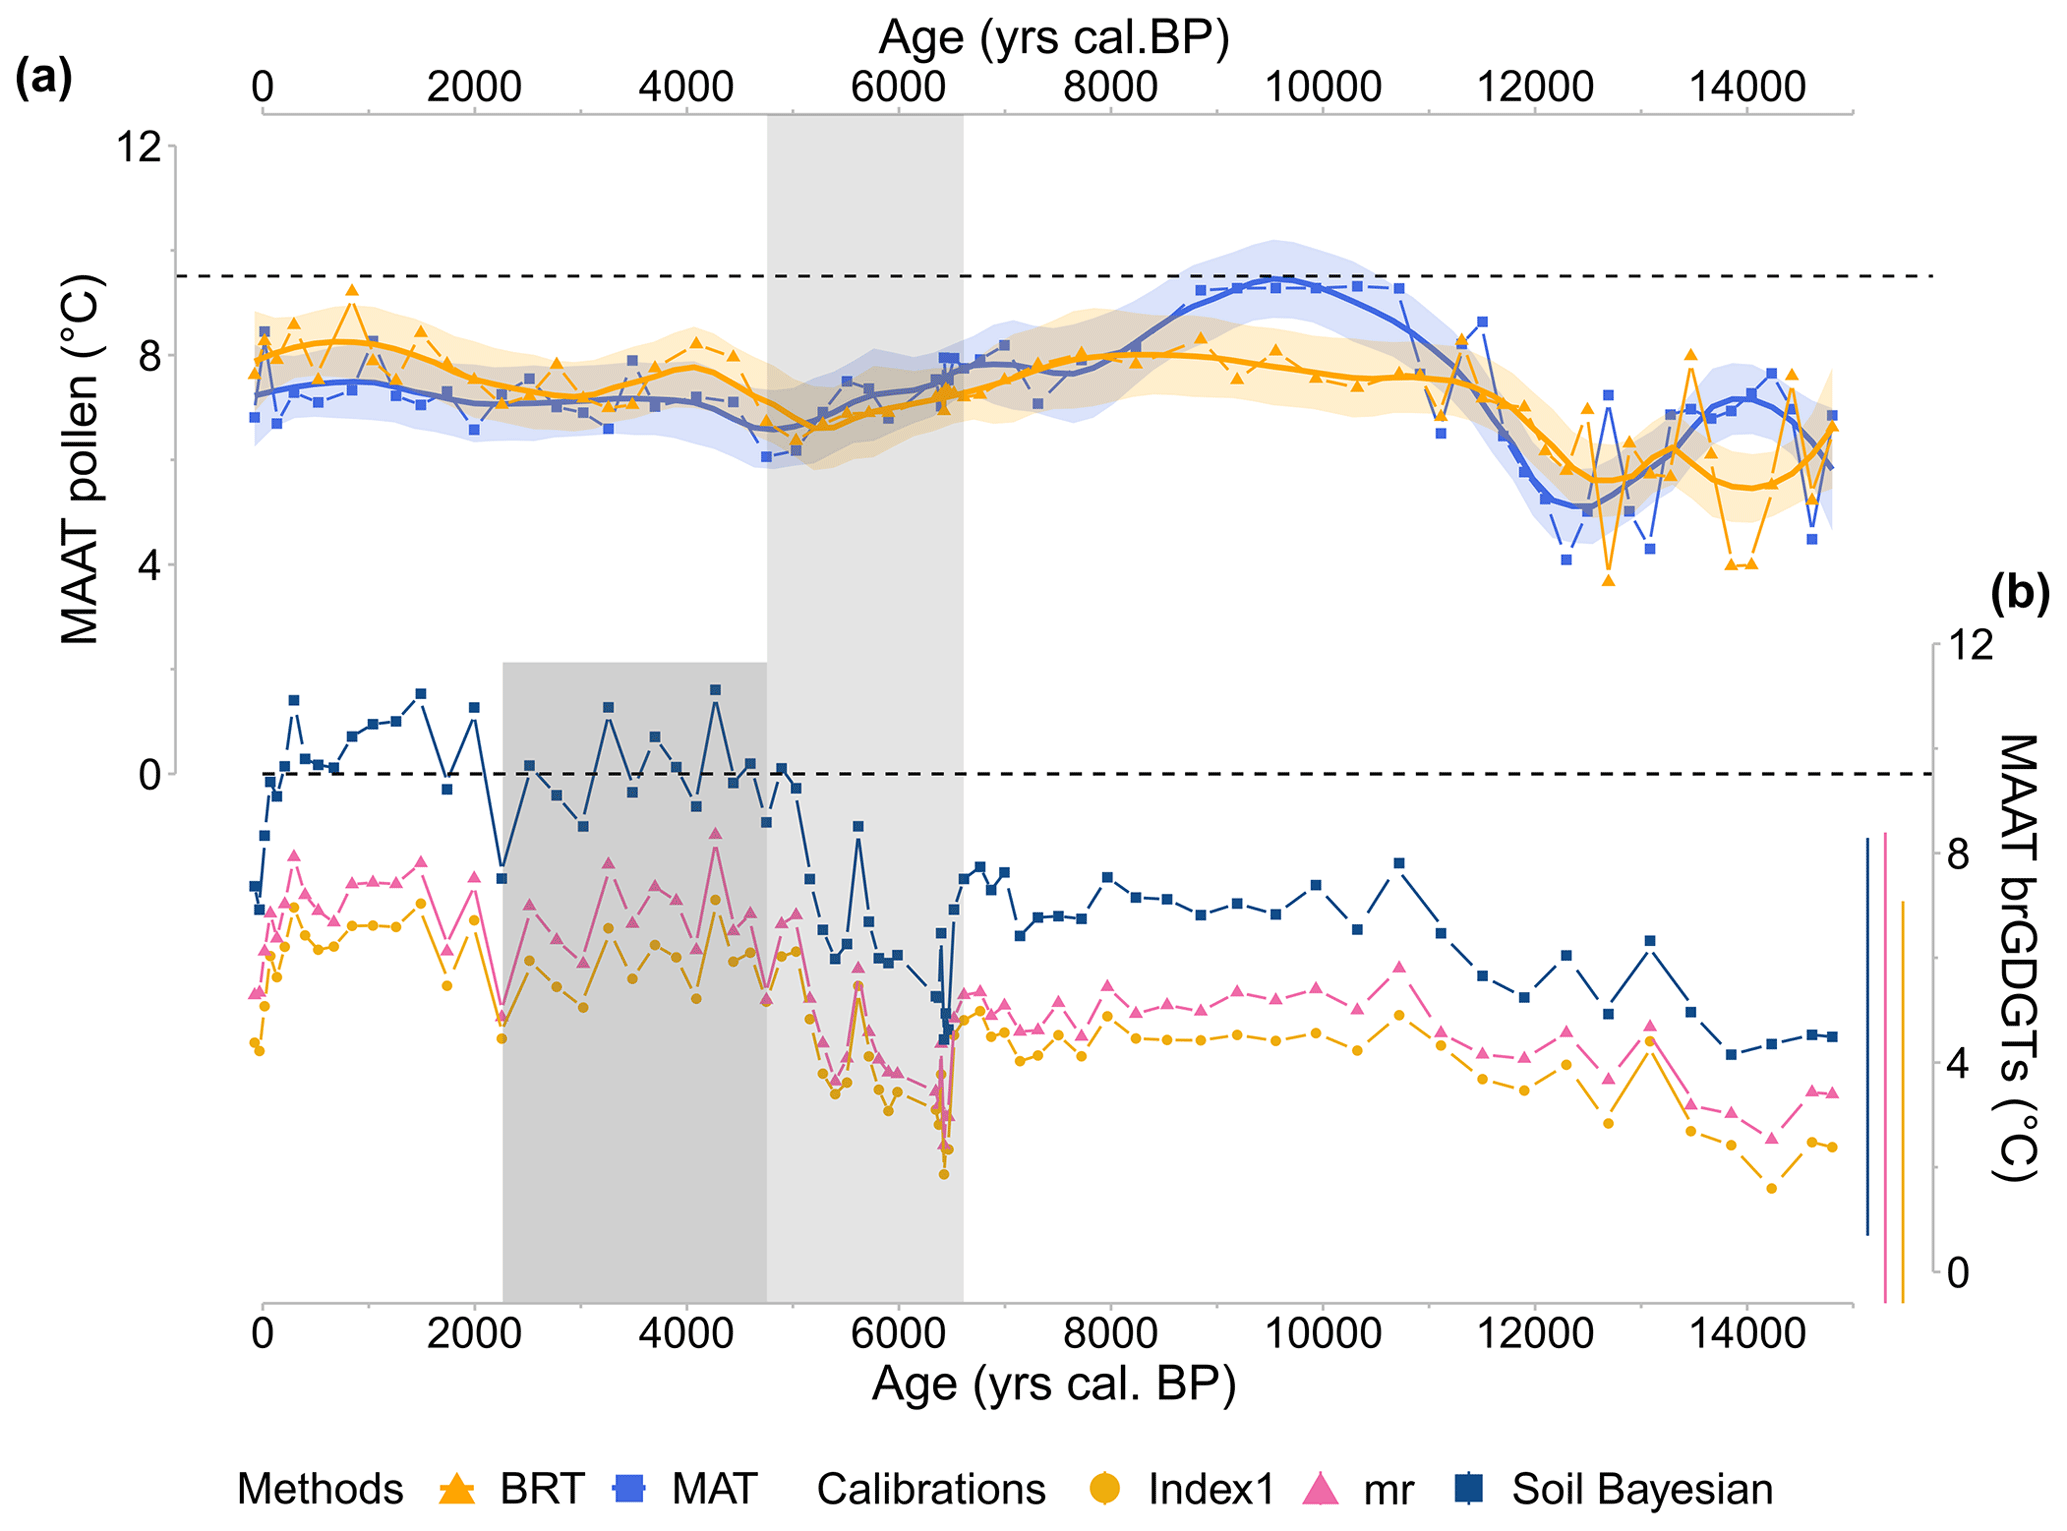
Figure 10CAN02 temperature reconstructions (MAAT; ∘C) obtained from (a) pollen assemblages using BRT (yellow triangles and curve) and MAT (blue squares and curve) methods based on the TEMPSCAND calibration. The solid line corresponds to locally estimated scatterplot smoothing (loess) regression curves, and the shaded area corresponds to its 95 % confidence interval. (b) The brGDGT signal for the three selected soil calibrations: Soil Bayesian (dark-blue squares and line; Dearing Crampton-Flood et al., 2020), mr (triangle symbol and pink line; De Jonge et al., 2014a), and Index1 (yellow circle and line; De Jonge et al., 2014a). On the right, lateral lines represent calibration errors (RMSE). Finally, the dashed black line corresponds to Canroute's modern MAAT. The time highlighted in light grey reveals a large fall in tetramethylated brGDGT abundance (6600–4700 cal BP) and a shift in accumulation rate. The era shown in dark grey highlights the significant decrease in IR (4700–2300 cal BP).
4.4 Temporality of proxies' resilience to environmental changes
There are two distinct periods for which proxy records are impacted by environmental influences, notably a hydrological change in the peatland (Figs. 3 and 6, shaded areas). The record of vegetation (Fig. 6), detrital signal (Fig. 3), and brGDGT compounds (Fig. 5) all show a first response to a loss of water runoff on the wetland surface between 6600–4700 cal BP, the result of either a reduced water supply from a change in the river system or the natural rise in peatland surface that gradually isolated peat-forming vegetation from groundwater. Two of the three proxies (detrital signal and brGDGT compounds) exhibit a second response to the hydrological shift between 4700 and 3000 cal BP for the detrital signal and 2300 cal BP for the brGDGT compounds (Figs. 3, 5, and C1, dark-grey area). To explain the timing in the proxies' responses to environmental changes, a distinct resilience, depending on the proxy, might thus be postulated. Walker et al. (2004) defines resilience as the system's ability to absorb disturbance and reorganize while experiencing change in order to retain essentially the same function, structure, identity, and feedback. In this study, vegetation appears to be more resilient than the detrital signal and brGDGT compounds, returning to equilibrium faster. Both the sedimentological and brGDGT signals demonstrate a synchronous reaction to vegetation, as well as a second response after the vegetation is back to equilibrium. Furthermore, brGDGTs appear to have less resilience than sedimentological signals because the return to equilibrium is not recorded before 2300 cal BP, whereas the detrital signal is recorded before 3000 cal BP. However, it is unknown if this second response to environmental changes affects brGDGT distribution and bacterial community composition.
4.5 Temperatures changes in the northern Mediterranean basin since the Late Glacial: a synthesis
4.5.1 Local climate from the CAN02 record based on two independent proxies
The temperatures inferred from pollen data (BRT method, TEMPSCAND modern database) and brGDGT data (Bayesian, mr, and Index1 calibrations) show very similar trends through the Holocene (Fig. 10). During the Late Glacial, cold conditions are evidenced from 15 000 to 11 700 cal BP followed by warmer conditions (plateau) with temperatures lower than those observed today from 10 500 to 6600 cal BP. Contrary to the BRT and brGDGT signal, the MAT method based on the TEMPSCAND modern database shows a slight thermic optimum from 10 500 to 8000. After the thermic optimum, the onset of a cooling trend until 6600 cal BP is evidenced (Fig. 10a). Due to a possible bias in the shaded area, the 6600–4700 cal BP period is not discussed. From 4700 to 200 cal BP, a slight warming trend is reconstructed for both proxies. Finally, from 200 cal BP onward, an abrupt cooling characterizes the brGDGT signal (Fig. 10b), while the pollen signal shows only a slight cooling trend (Fig. 10a).
Early to Middle Holocene temperatures cooler than the present-day ones and followed by a Late Holocene warming (i.e. the inverse of the HTM followed by a Late Holocene cooling), inferred by two independent proxies, appear as a robust reconstruction of mean annual temperatures for Canroute. This climate pattern is consistent with both atmospheric climate model outputs (Mauri et al., 2014; Liu et al., 2014; Wanner, 2021; Erb et al., 2022) and pollen-based palaeoclimatic studies (Herzschuh et al., 2023), which depicted the absence of a thermic optimum for the same latitudes. According to several studies, the presence of the HTM can result from a seasonality bias toward summer temperatures (Liu et al., 2014; Samartin et al., 2017; Wanner, 2021; Herzschuh et al., 2023).
4.5.2 Regional climate of the northern Mediterranean basin during the last 15 000 years
The Canroute climate reconstruction indicates cold conditions for the Late Glacial and a warming for the Early Holocene (about +5 ± 1 ∘C; Fig. 11a). A similar climatic trend for this period is reconstructed from chironomid data in northern Italy (Fig. 11a), with increasing summer temperatures between 14 000 and 10 000 cal BP of the same order of magnitude (ca. +6.5 ∘C; Samartin et al., 2017). The brGDGT signal from Canroute indicates an abrupt warming around 13 500 cal BP, which is also observed in southern Italy from the Lake Matese brGDGT record (Fig. 11a; Robles et al., 2023). The Late Glacial climatic changes estimated from the CAN02 sequence are consistent with observations from southern Europe, notably with the temperature signal of the Lapsou sequence proposed by Duprat-Oualid et al. (2022), located in Cantal (central part of Massif Central). The comparison between the pollen signals from Canroute and Lapsou reveals some similarities (e.g. the chronology of the Bølling–Allerød between 14 600 and 12 900 cal BP) and some discrepancies (e.g. the dynamics of Younger Dryas are clearly less marked at Canroute). Typical millennial Late Glacial events, such as the Bølling–Allerød and Younger Dryas, cannot, however, be seen on both proxies since the brGDGT signal does not reflect such abrupt events (Fig. 11a). The lack of typical Late Glacial events can be attributed to a low resolution of the record, possibly caused by bioturbation smoothing abrupt events (Bradley, 2015), a low accumulation rate (Fig. 3a), or a Late Glacial in the region that is not very marked. Overall, the Late Glacial climate signal trend of Canroute fits well with the more regional signal when confronted with different sites and proxies for southern Europe.
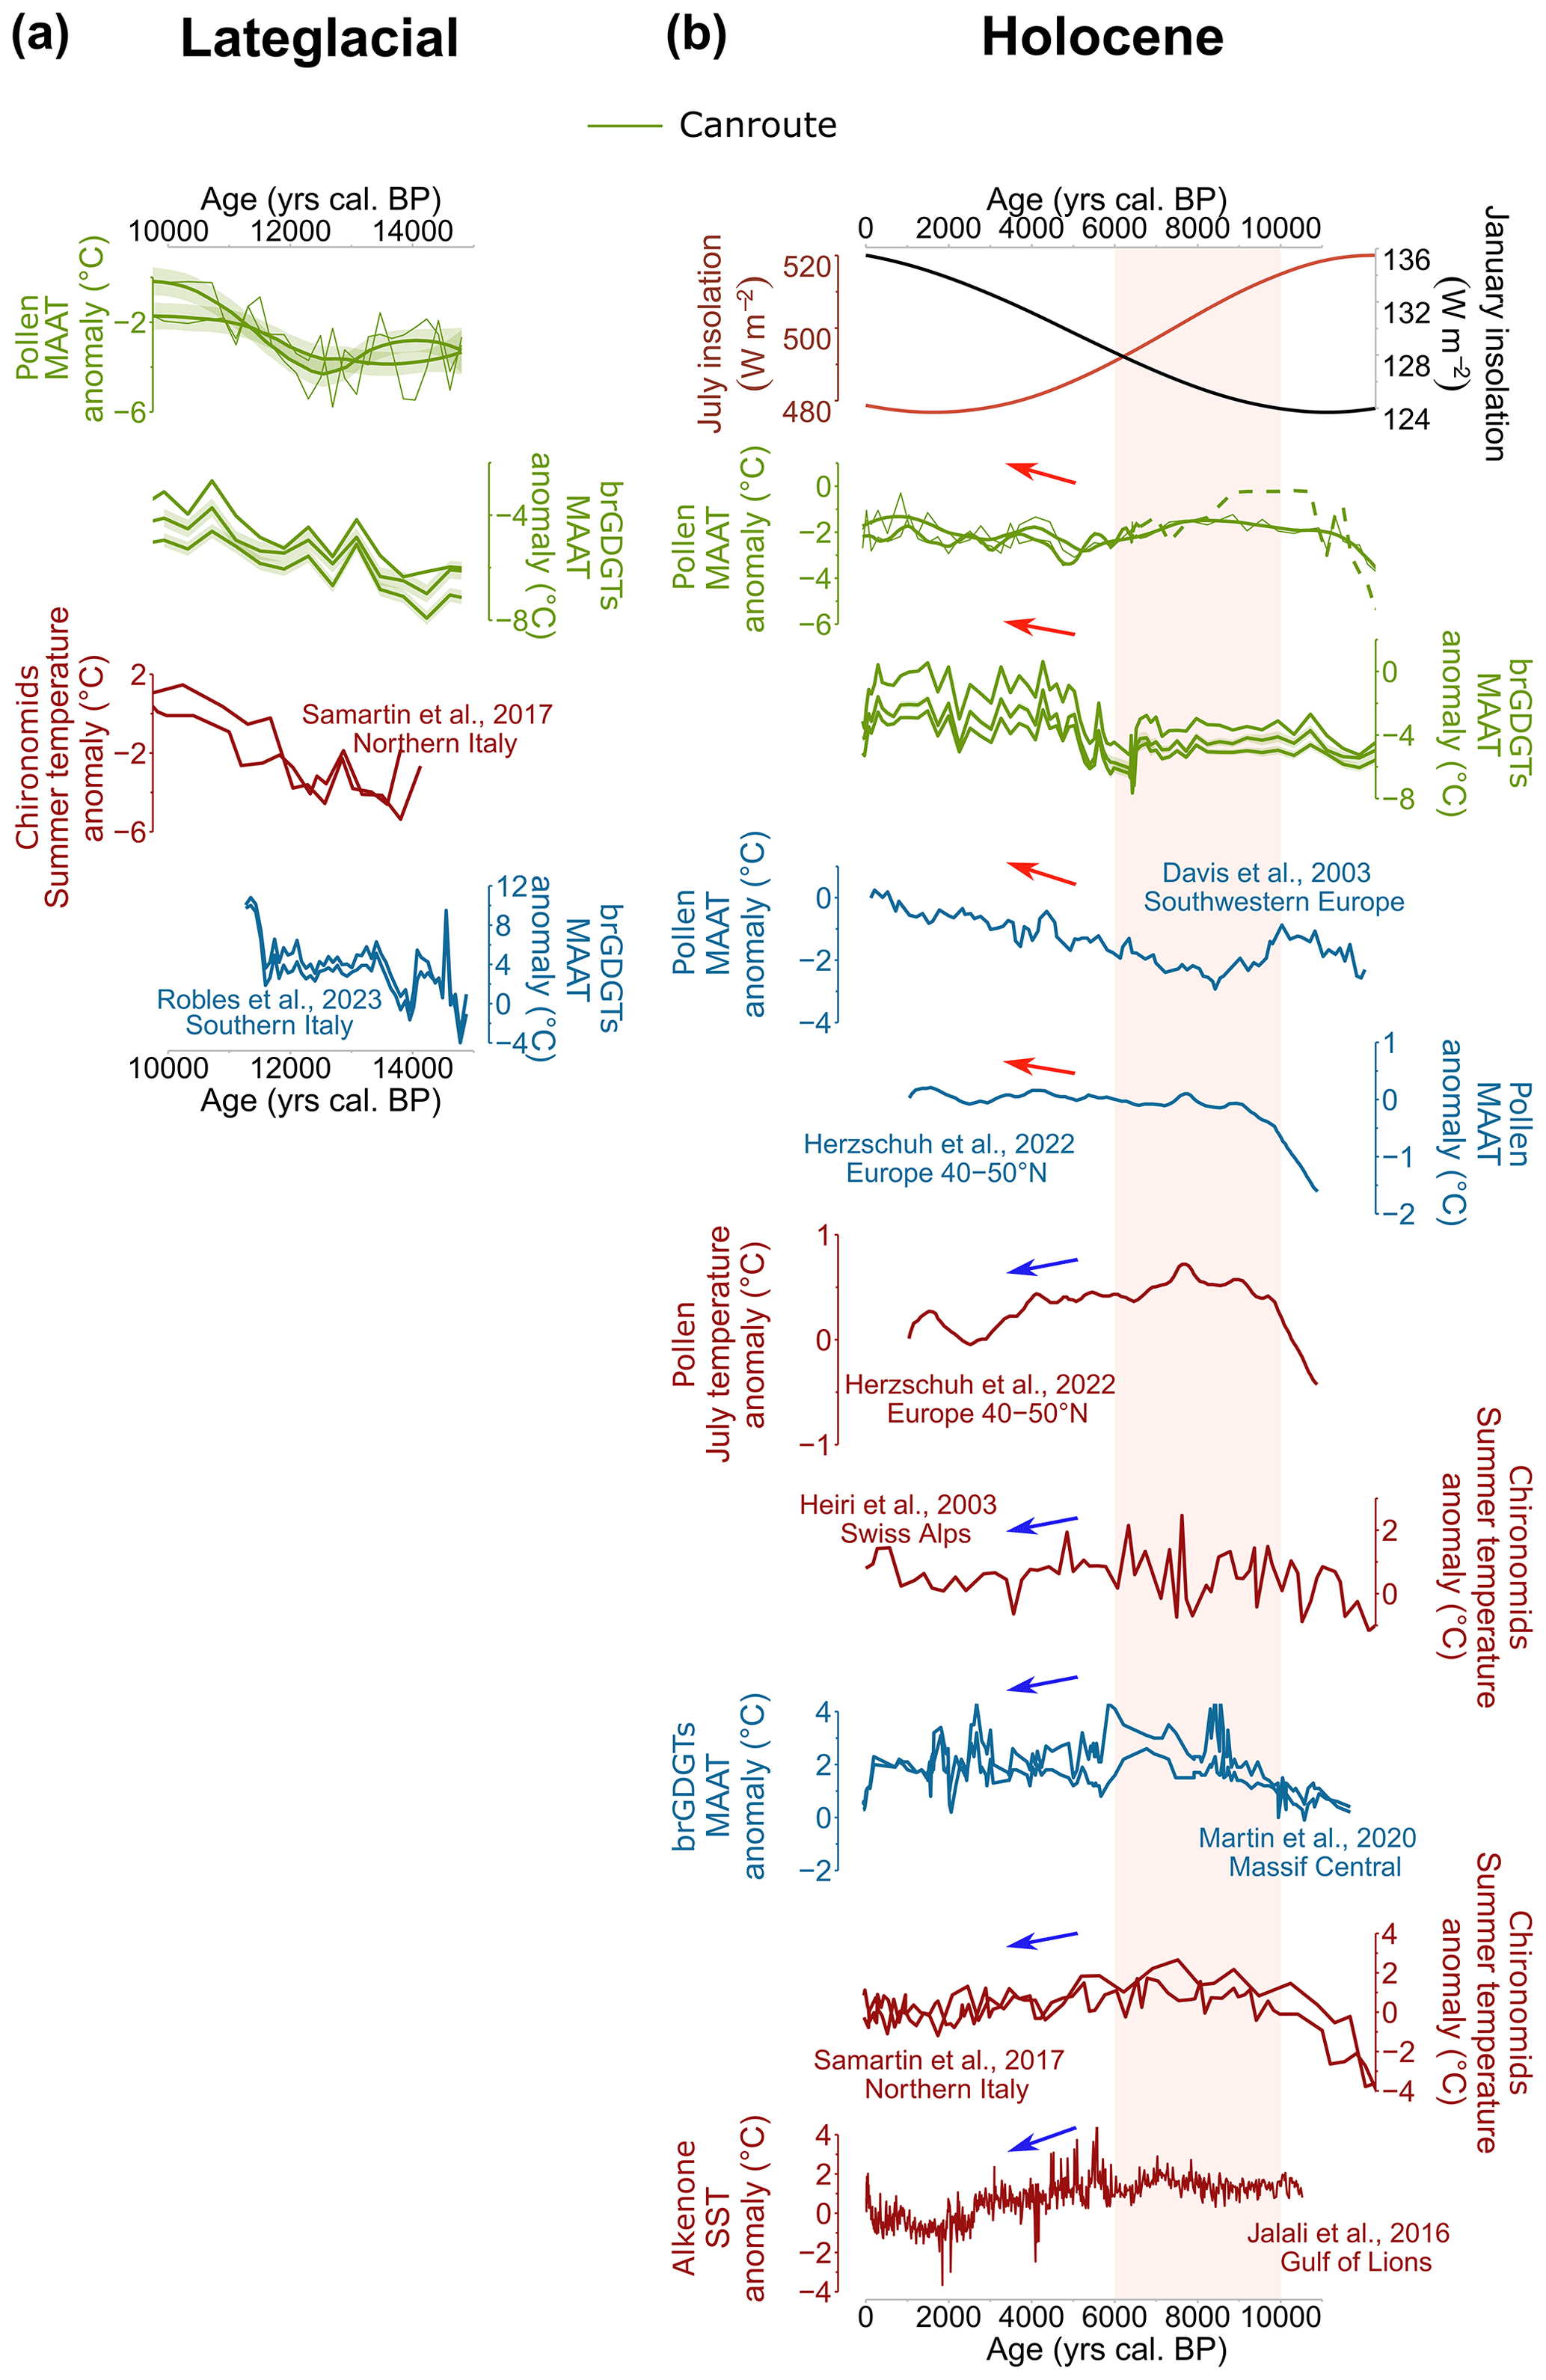
Figure 11Selected palaeoenvironmental records from southern Europe. (a) Late Glacial climate changes: pollen- and brGDGT-based MAATs (Fig. 10), chironomid-based July temperatures from northern Italy (Samartin et al., 2017), brGDGT-based MAATs from Lake Matese (southern Italy) (Robles et al., 2023). (b) Holocene climate changes: July and January insolation for 44∘ N (W m−2) (Laskar et al., 2004), MAATs inferred from CAN02 pollen assemblages (the dashed part corresponds to the period where Corylus strongly impacts the results obtained with the MAT and over warmed the HTM) and from brGDGTs, MAAT and summer temperature of the European region (40–50∘ N) from pollen data (Herzschuh et al., 2023), MAATs based on brGDGTs (Martin et al., 2020), chironomid-based July temperature (Heiri et al., 2003; Samartin et al., 2017), pollen-based MAAT for south-western Europe (Davis et a., 2003), sea surface temperature (SST) values of the Gulf of Lions (Jalali et al., 2016). The green (Canroute) and blue curves correspond to annual reconstructed temperatures. The red curves correspond to seasonal (summer) reconstructed temperatures. The red box marks the Holocene thermal maximum of the Northern Hemisphere (HTM). Temperature values are expressed as anomalies from the modern climate conditions at each site.
For the Holocene, a spatio-temporal heterogeneity of climate patterns is observed at the northern Mediterranean region scale depending on sequences and proxies (Fig. 11). Most of the records indicate, despite a temporal disparity, the presence of a Holocene thermal maximum (HTM) between 10 000 and 6000 cal BP. Summer and annual temperatures, reconstructed from the Swiss Alps, Gulf of Lions, Europe (40–50∘ N), northern Italy, and Massif Central (Heiri et al., 2003; Jalali et al., 2016; Samartin et al., 2017; Martin et al., 2020; Herzschuh et al., 2023; Fig. 11b), suggest a HTM between 10 700 and 5500 cal BP. The pollen-based annual temperature reconstruction by Herzchuh et al. (2023) indicates warm conditions for southern Europe (40–50∘ N) but not really a HTM (Fig. 11b). When compared to those sequences, only the pollen-based MAT method reconstructs a clear HTM between 10 000 and 8000 cal BP at Canroute, although it is less marked in terms of anomalies and probably biased by the high percentages of Corylus without modern analogues (Fig. 6).
The BRT method and brGDGT-based reconstructions both indicate a plateau, closer to the annual climate signal proposed by Herzschuh et al. (2023) for Europe (40–50∘ N) with the WA-PLS (Fig. 11b). From the Middle Holocene (ca. 6000 cal BP) onward, the reconstructions from Canroute indicate a warming trend in agreement with the larger synthesis by Davis et al. (2003) and Herzschuh et al. (2023). In contrast, the data from Massif Central (brGDGTs; Martin et al., 2020), the Swiss Alps (chironomids; Heiri et al., 2003), northern Italy (chironomids; Samartin et al., 2017), and the Mediterranean (alkenones; Jalali et al., 2016; Fig. 11b) indicate a cooling trend following the HTM. The presence of different patterns in the different reconstructions can be explained by the type of parameter reconstructed (SST; mean temperature of the warmer month, MTWA; MAAT; etc.); by the method used (local, regional, or area-average reconstructions) (Erb et al., 2022); by the proxy itself; or by local conditions, which can largely influence the proxy record over time. For example, the two reconstructions based on brGDGTs (Fig. 11b) do not indicate the same climate signal. Such a difference for the same proxy in the same region (Massif Central) may be due to several factors used to reconstruct the signal: local environment (peatland vs. lake) and altitude (790 vs. 1234 m). On the other hand, summer temperature proxies support the cooling trend that typically follows the HTM (Herzschuh et al., 2023; Heiri et al., 2003; Samartin et al., 2017; Jalali et al., 2016). In the case of the SSTs of the Gulf of Lion proposed by Jalali et al. (2016), the signal is based on the alkenone record, which could also be biased towards seasonal temperatures (Bader et al., 2020). Additionally, when Canroute's BRT-based signal is compared to the two signals from Herzschuh et al. (2023), i.e. the annual and July signal, only the annual signal appears consistent with Canroute's signal, the seasonal signal indicating a different trend from 8000 cal BP onward (Fig. 11b). This supports the hypothesis of the influence of the seasonal (summer) temperatures in the cooling trend following the presence of the HTM in the Mediterranean region in many studies (Wanner, 2021).
To conclude, in this study, the influence of seasonal temperature in different reconstructions, with independent proxies, is a solid hypothesis to explain the presence of different climatic patterns during the Holocene, particularly for the presence of the Holocene thermic maximum (HTM) in the Mediterranean region.
The palaeoclimatic reconstruction of the last 15 000 years based on the CAN02 sequence has allowed us to compare the southern Massif Central climate changes to the southern Europe one. The Late Glacial and Early Holocene temperature patterns at Canroute are consistent with reconstructions in Italy that show cold conditions during the Late Glacial and a warming for the Early Holocene. The brGDGT and pollen climate signal shows the presence of a Middle Holocene plateau followed by a Late Holocene warming instead of a clear Middle Holocene thermal maximum (HTM). The similar trends between the two independent proxies support the reliability of their respective reconstructions. Our study also highlights the potential causes of the differences between the reconstructions from independent proxies. The influence of local context changes, such as a decrease in water input, on the vegetation and brGDGT records has been assessed from geochemical, pollen, and brGDGT records. The multi-proxy approach points out the importance of investigating changes in the local environmental context for a better interpretation of the reconstructed climate parameters, as those changes could impact pollen and brGDGT records and thus the quality of the reconstructed climate parameters.
Whether for pollen or brGDGTs, the choice of (1) the method, (2) the modern dataset, and (3) the calibration is a key step to reconstruct climate parameters and has a significant role in the reliability of reconstructions. Our study corroborates the role of regional calibration in the reliability of reconstructed MAATs. For brGDGTs, a selection of European surface samples from the global peat and soil calibrations could improve the reliability of MAAT reconstructions.
Table A1Location and mean current climate values of sites associated with surface samples for brGDGT analysis. The current climate parameters were extracted with the geographic information system (GIS) software QGIS (QGIS.org, 2022) from the interpolated database WorldClim2.0 (averaged over the period 1970–2000; Fick and Hijmans, 2017) for annual temperature (MAAT) and precipitation (MAP) data and the CRU TS (version 4.06) measured database (Harris et al., 2020) for monthly temperature and precipitation data (Fig. 1c).
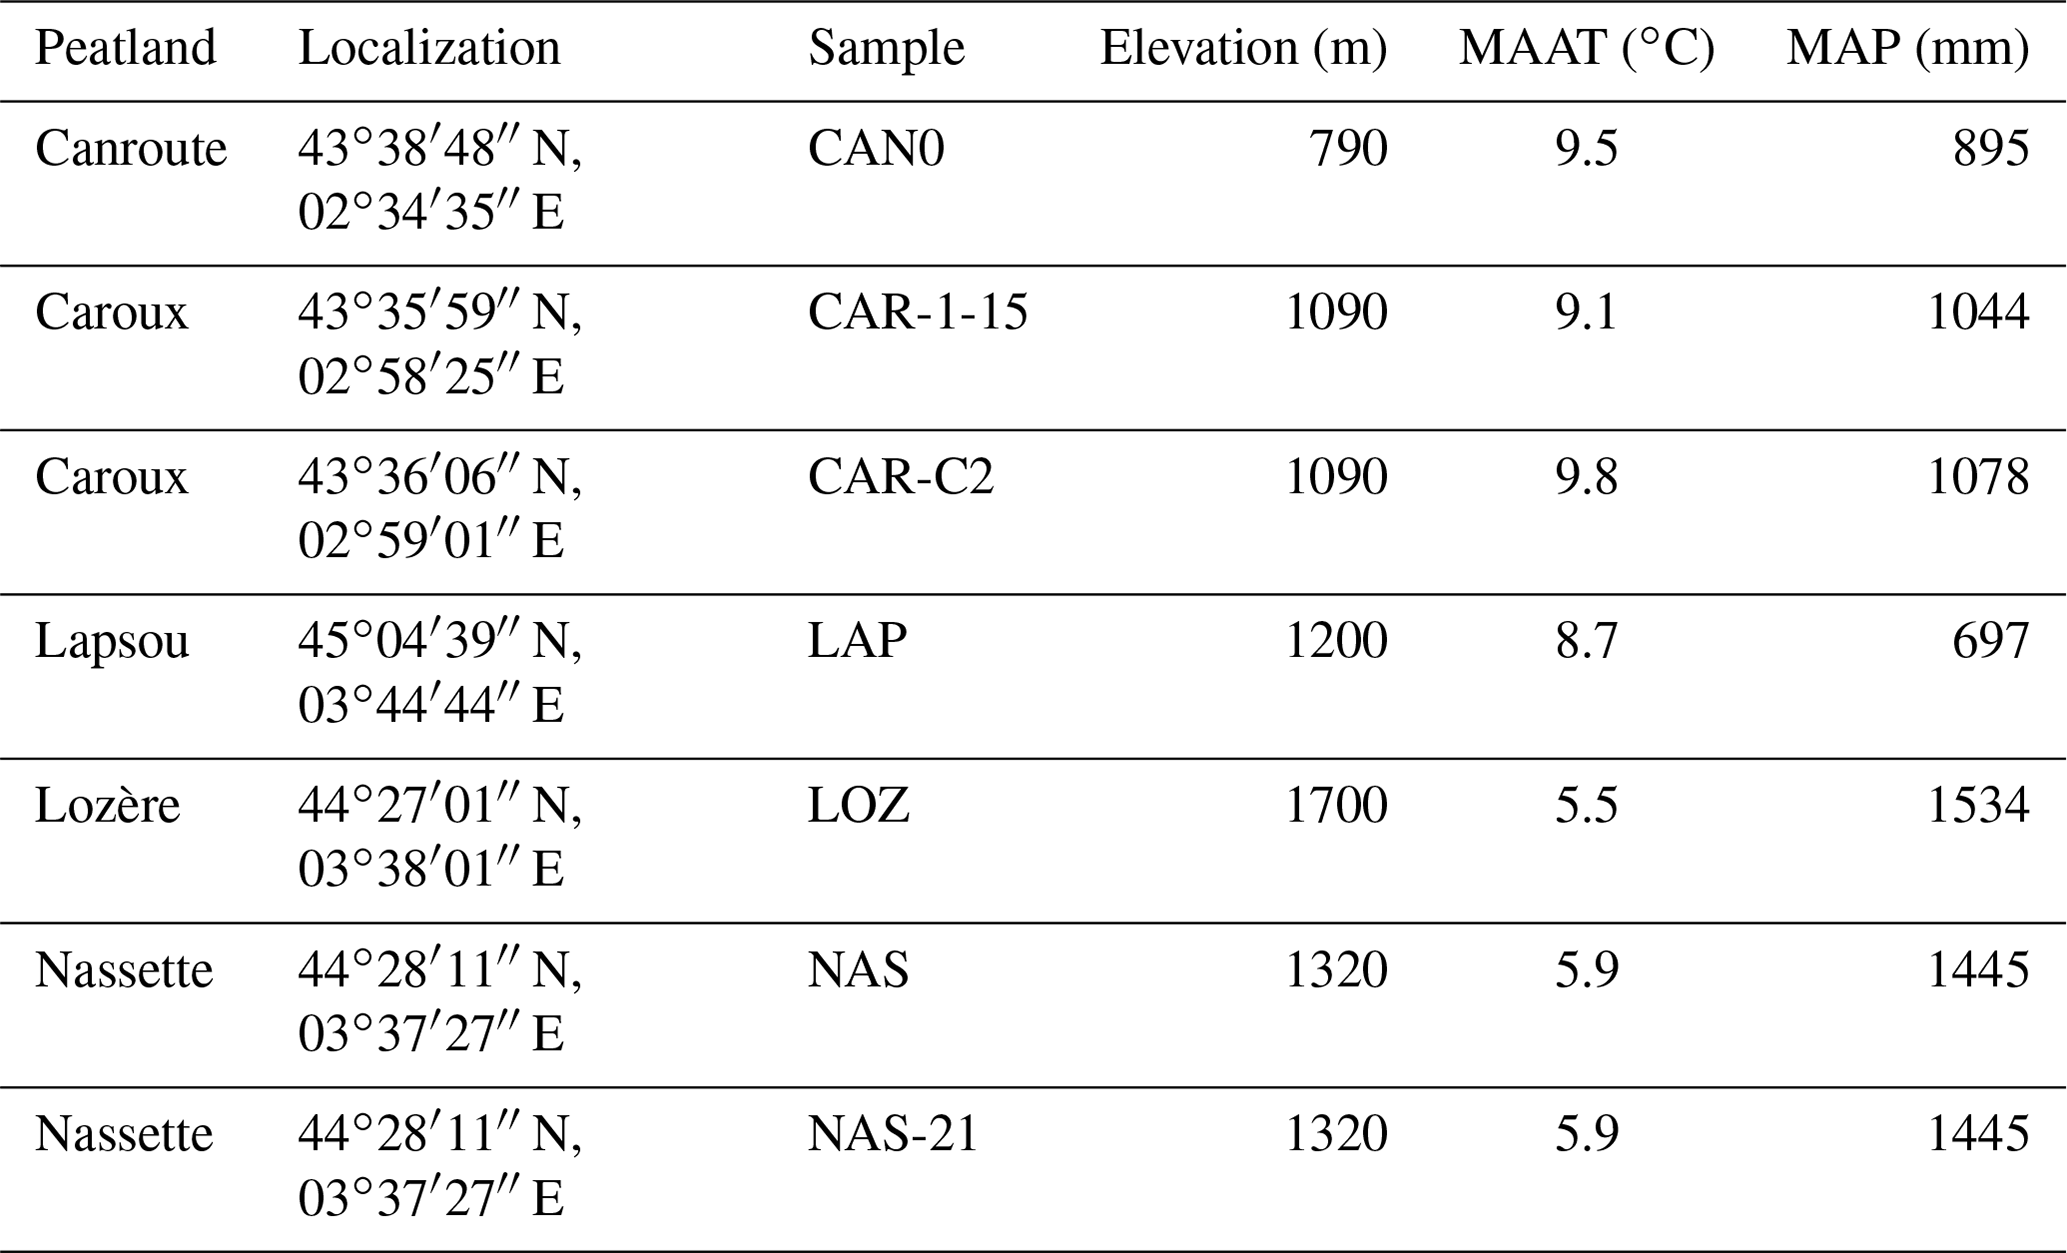
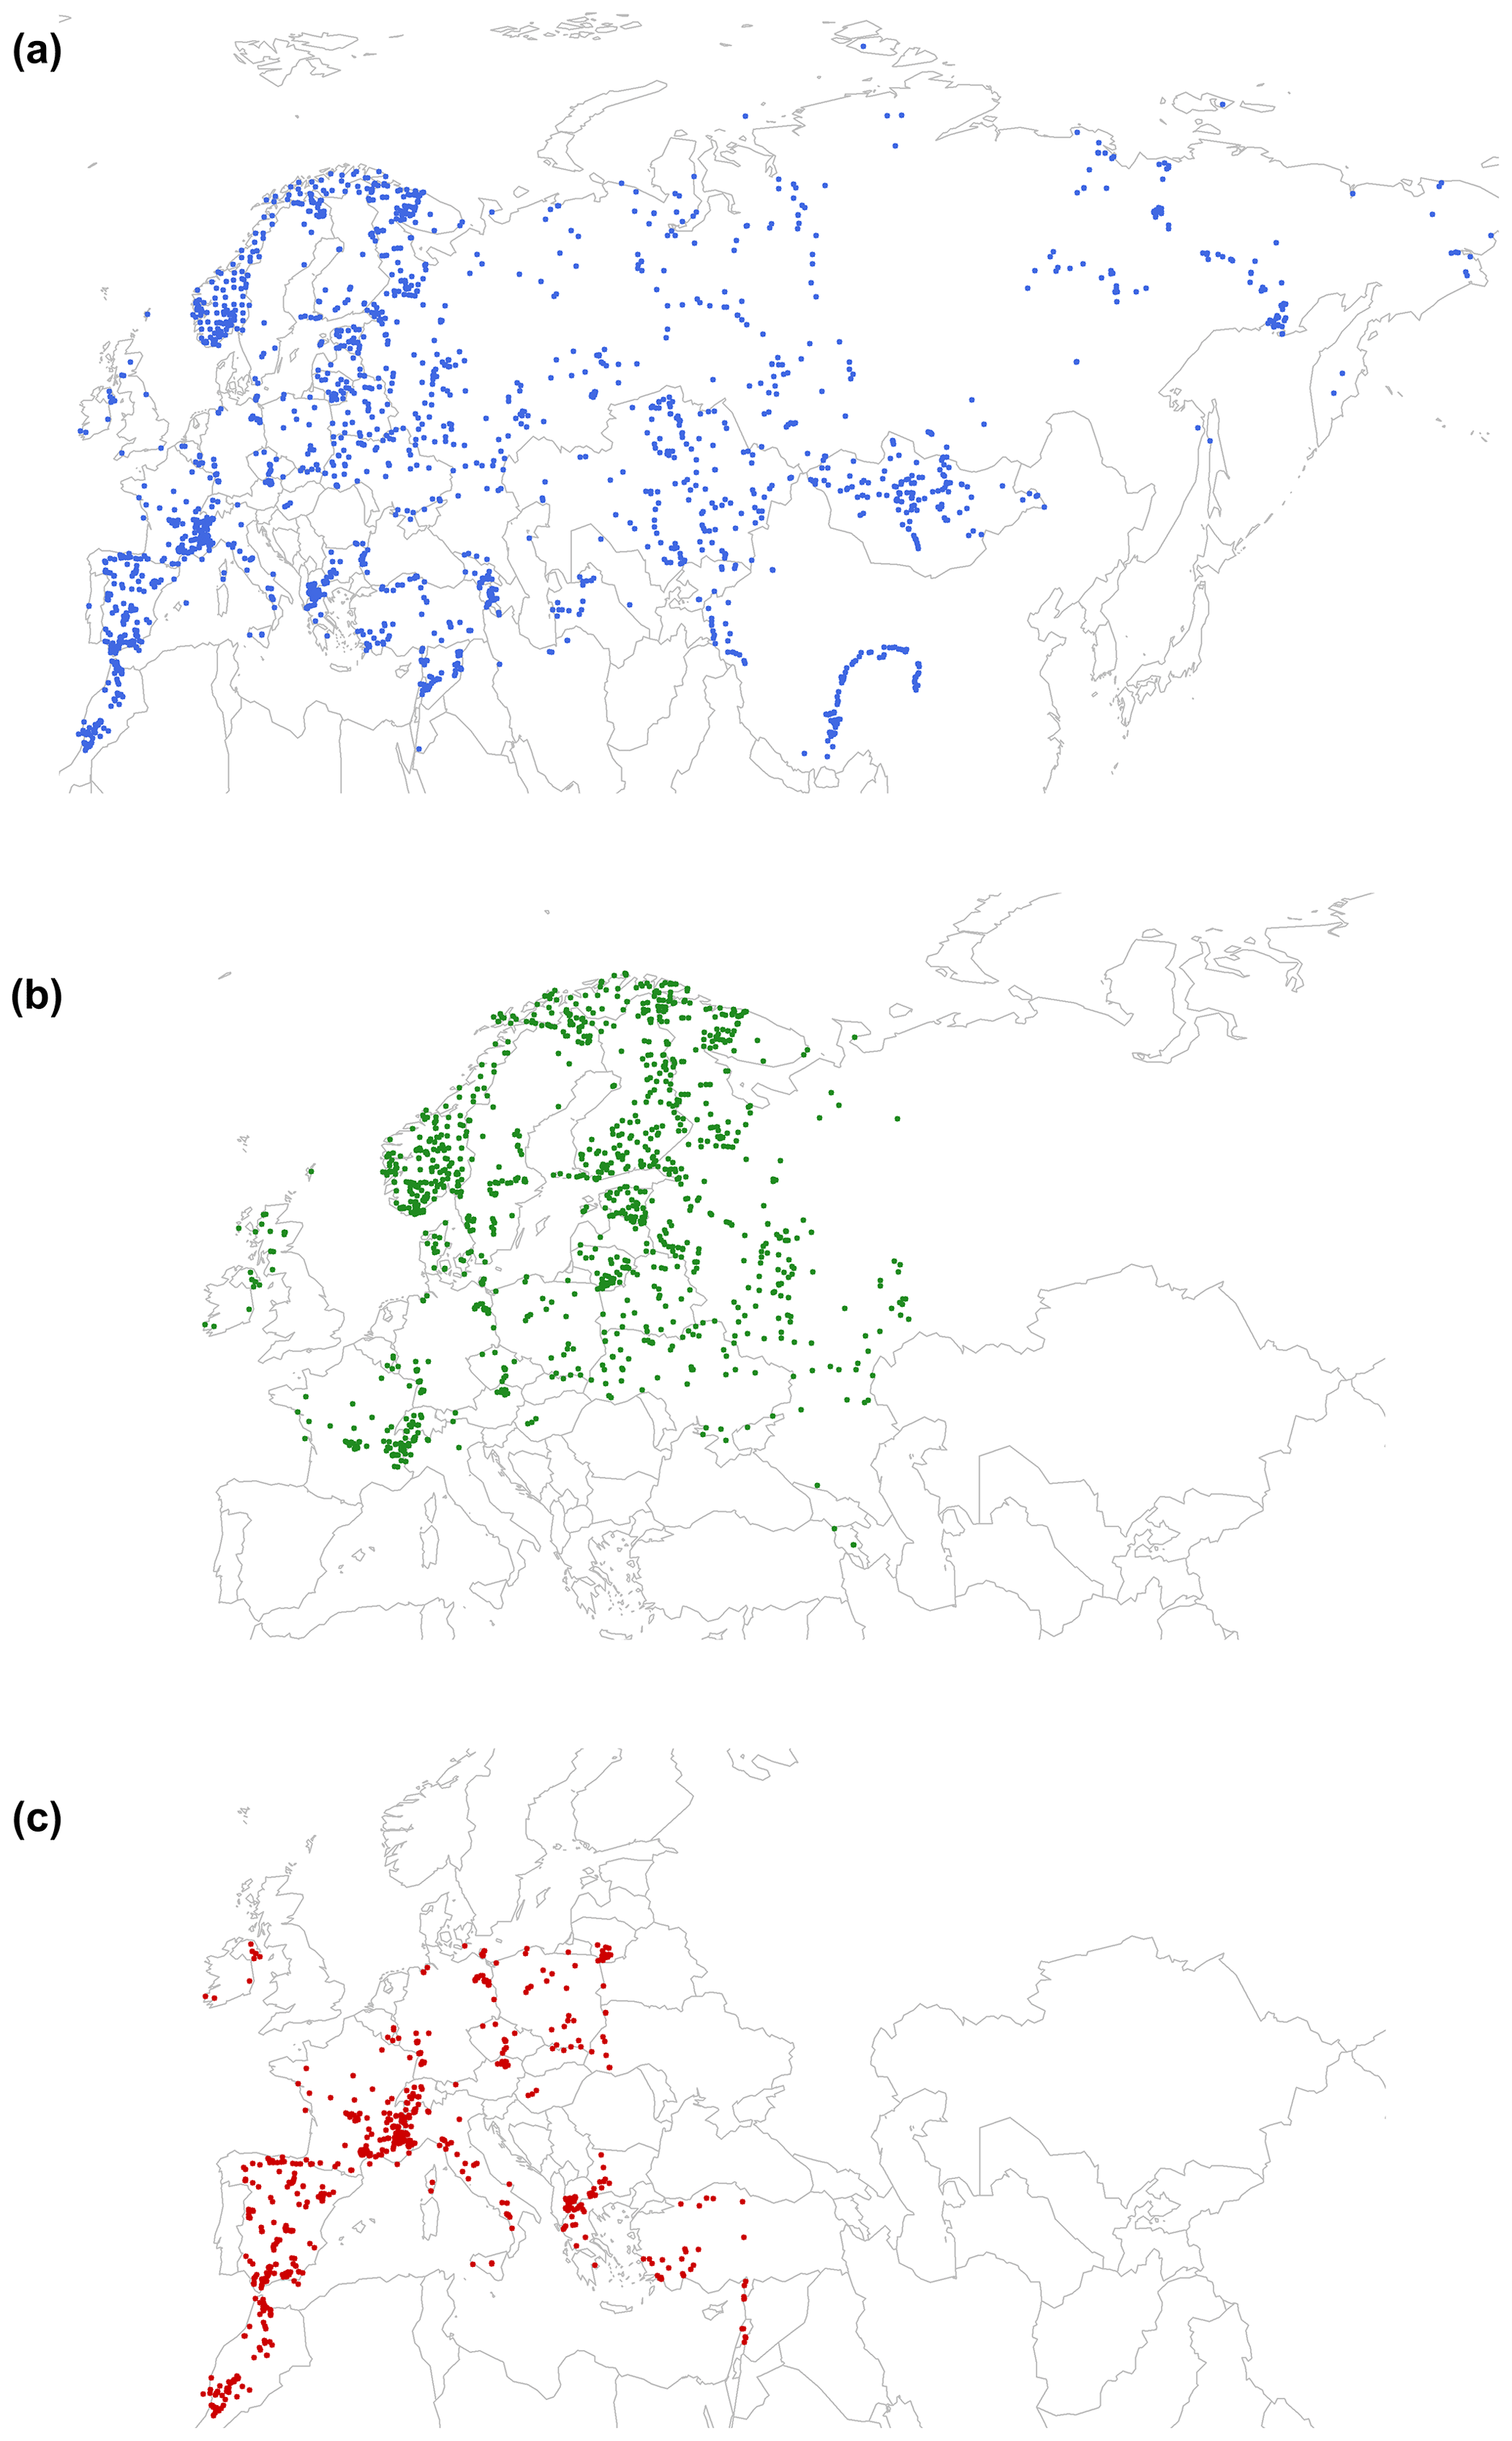
Figure B1Location of surface sites used in (a) the Eurasian Pollen Database (EAPDB) compiled by Peyron et al. (2013, 2017), (b) the TEMPSCAND (Temperate Europe–Scandinavian) database, and (c) the MEDTEMP (Mediterranean–Temperate Europe) database.
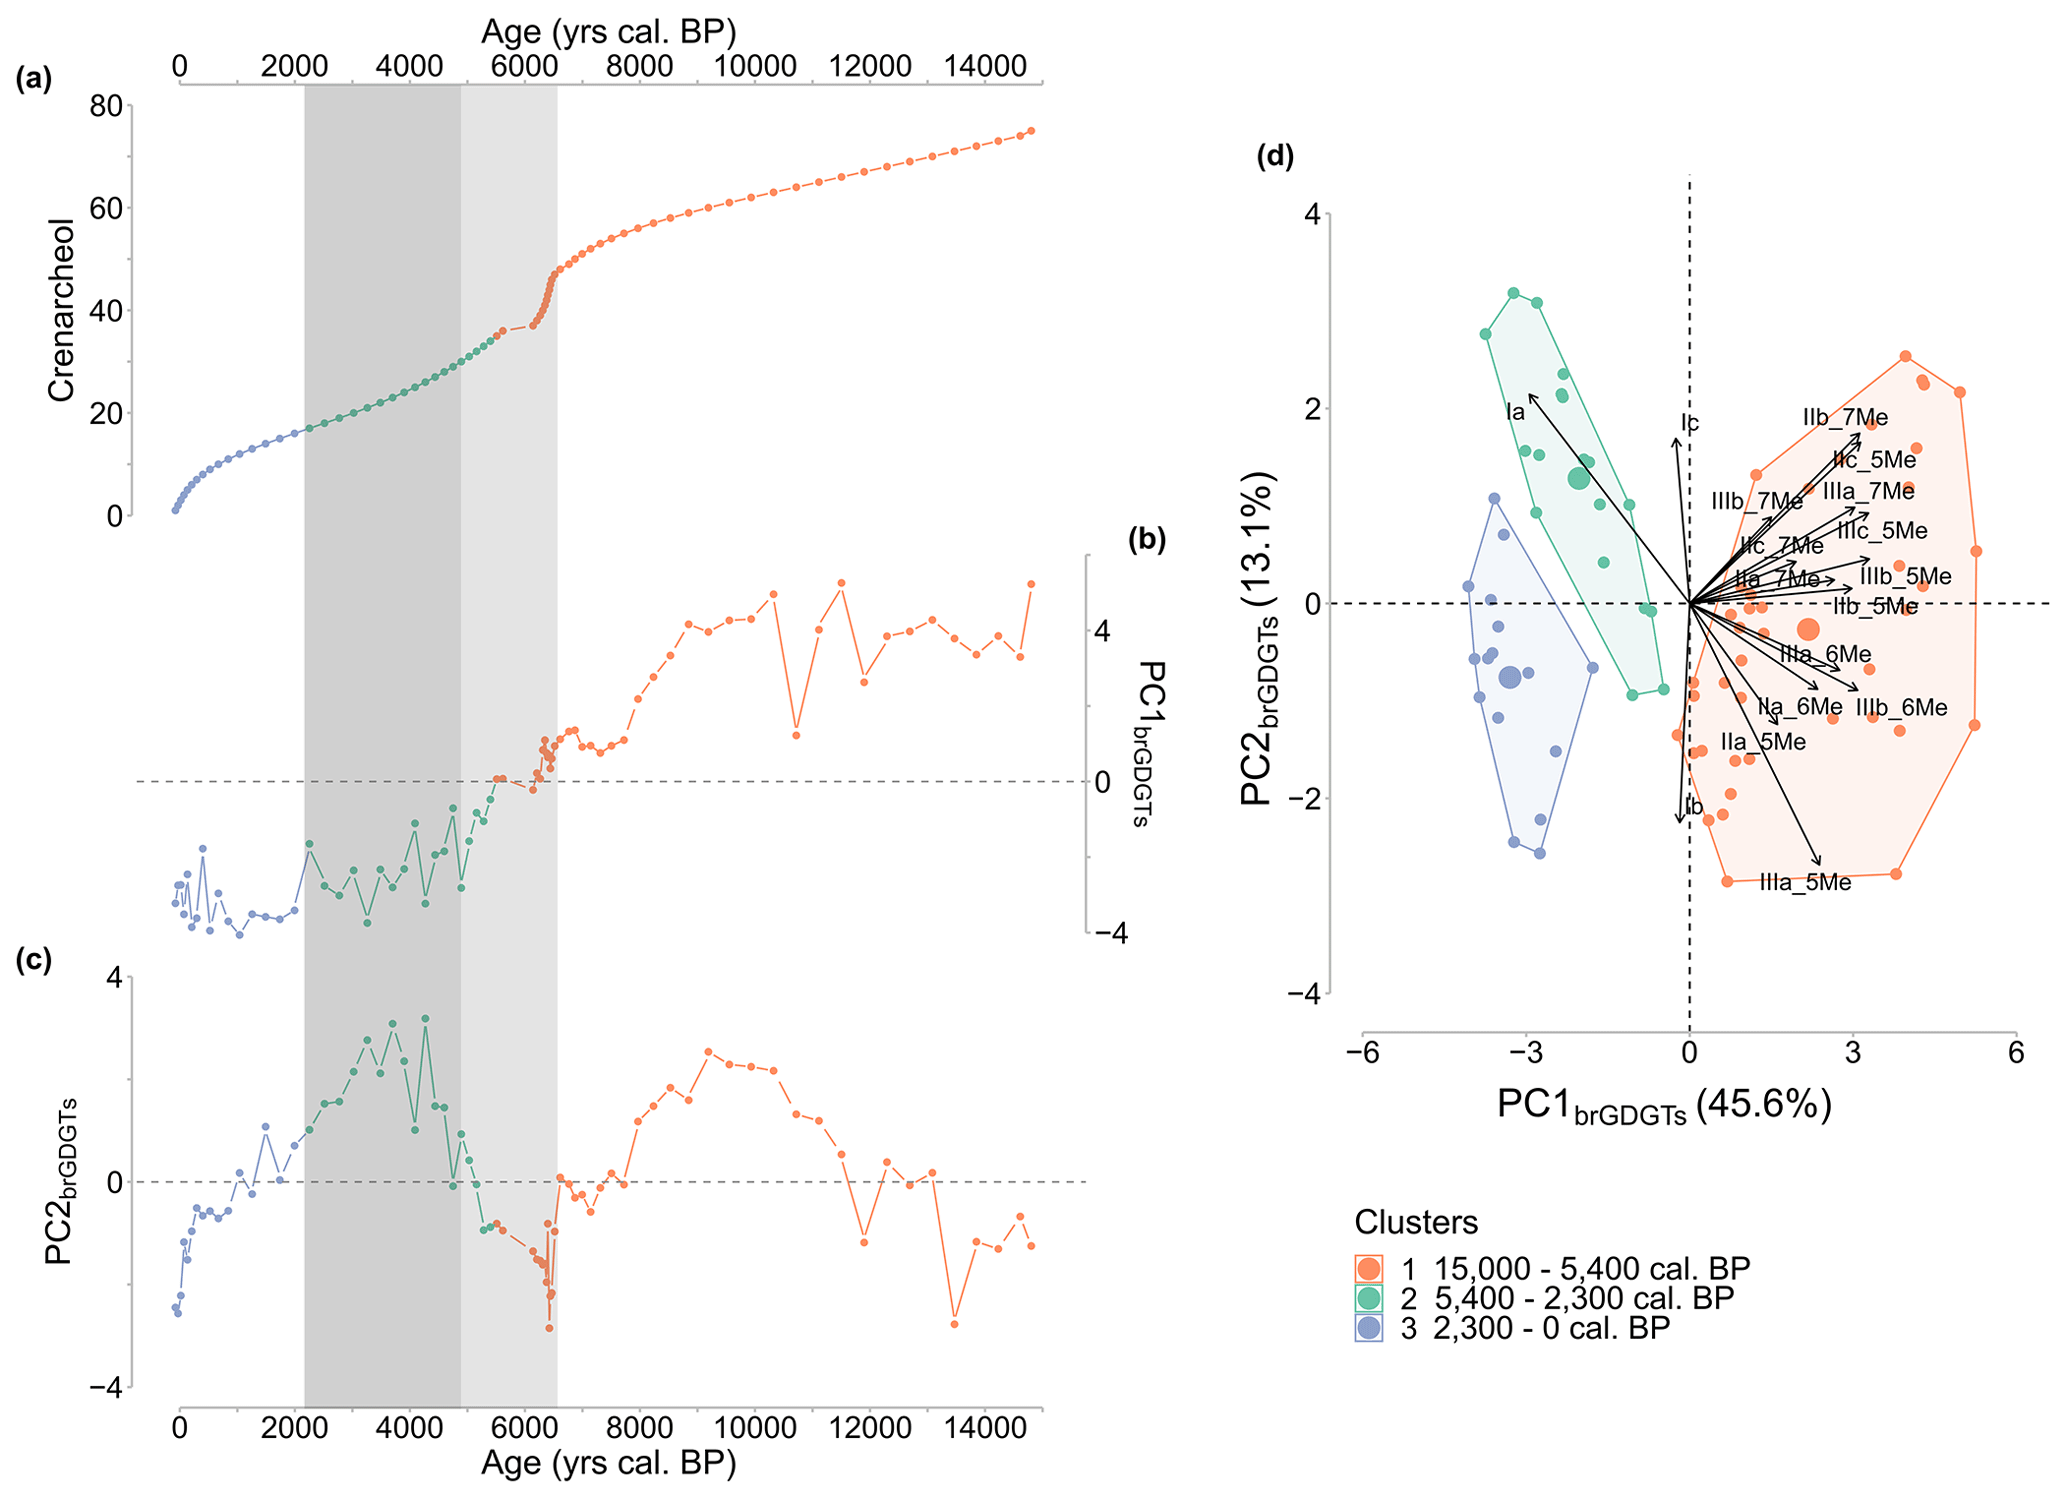
Figure C1(a) Crenarchaeol. (b) PC1brGDGTs of the PCA performed on the brGDGT relative abundances of the Canroute sequence. (c) PC2brGDGTs of the PCA performed on the brGDGT relative abundances of the Canroute sequence, (d) PCA results with samples coloured according to the cluster to which they belong.
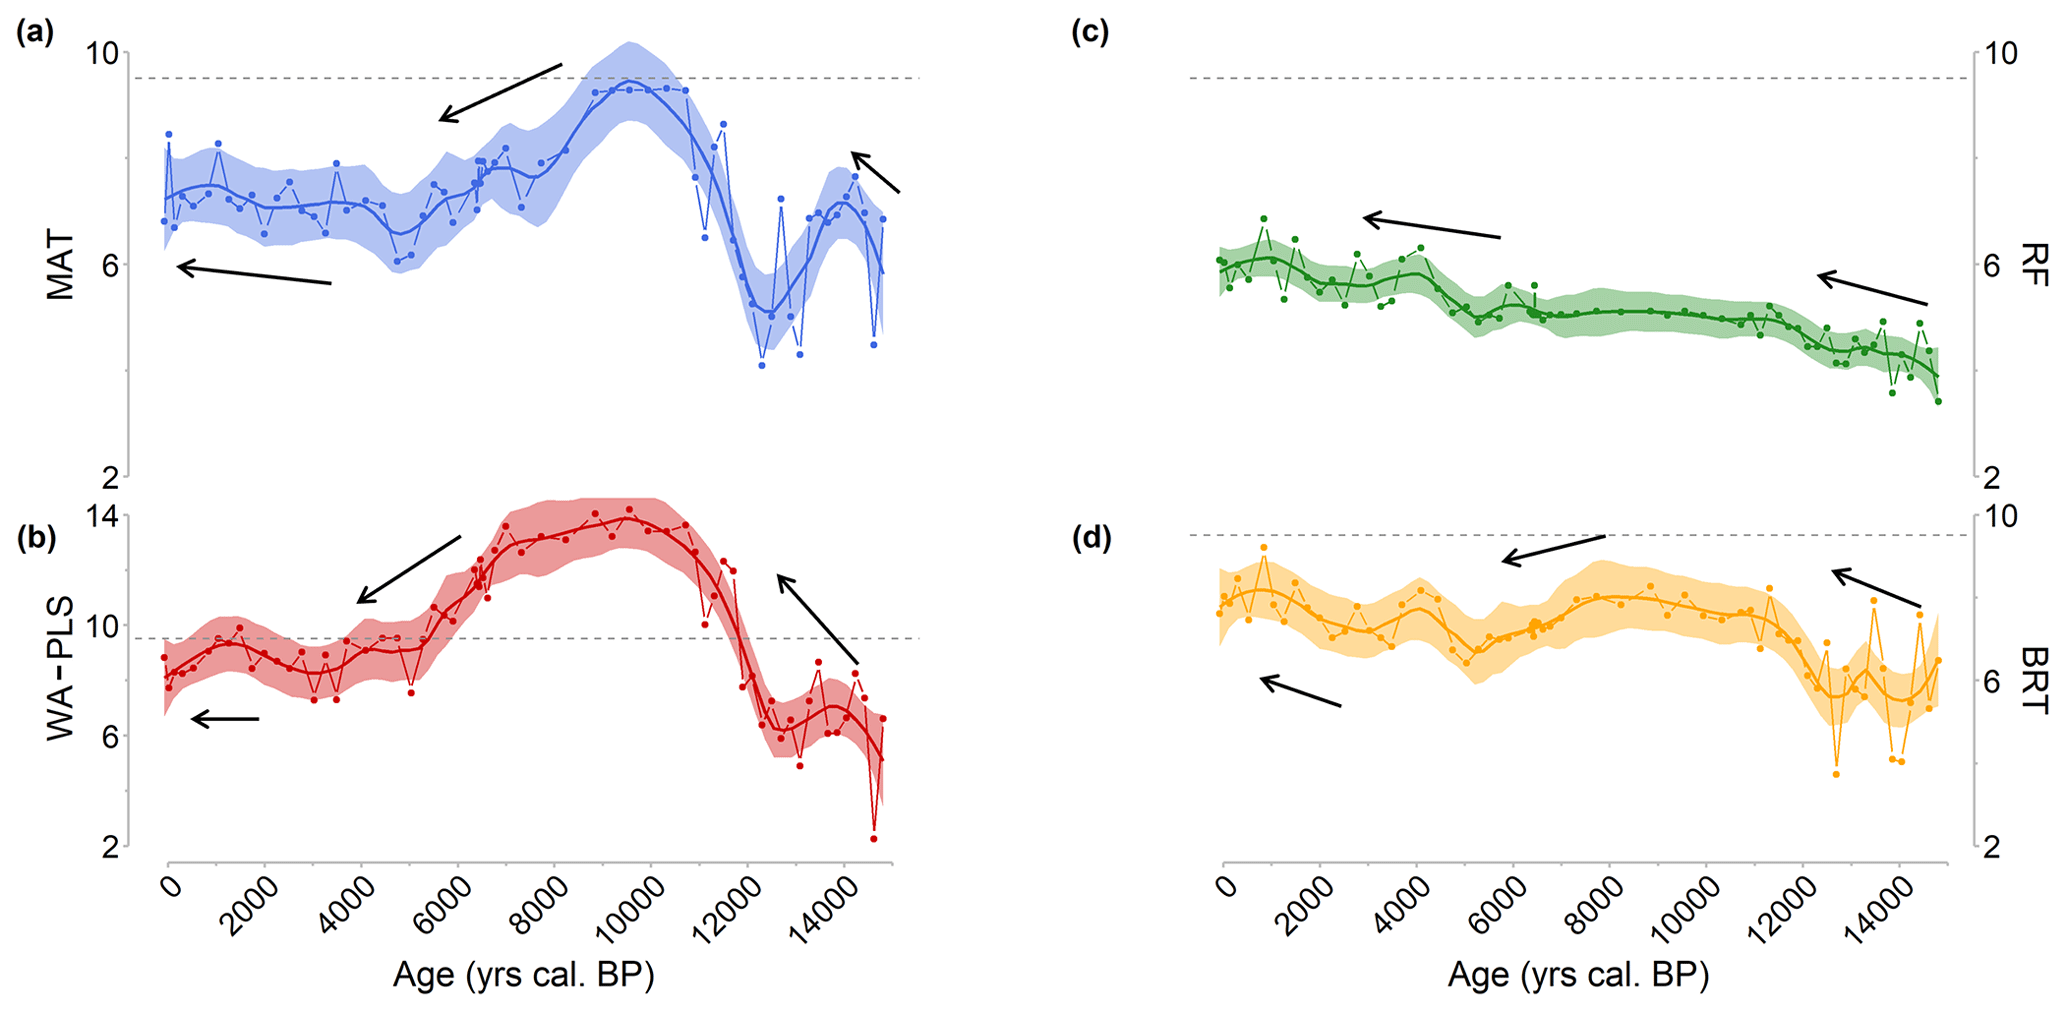
Figure D1Reconstruction of the mean annual air temperature (MAAT) based on Canroute pollen sequence signal for the four methods used with the TEMPSCAND modern pollen database (a MAT, b WA-PLS, c RF, d BRT). The plain line corresponds to locally estimated scatterplot smoothing (loess) regression curves, and the shaded area corresponds to the confidence interval used for the model (95 %). The black arrows represent the direction of the climate trends for the different periods considered. Dashed black line: current MAAT at Canroute.
BrGDGT analysis and pollen-inferred climate reconstruction will be fully available on PANGAEA; the pollen counts will be shared thanks to open international databases such as the EPD and Neotoma.
Ld'O performed the analytical work, and LD and JA designed the R codes. Ld'O, LD, GM, AE, and OP designed the study. LD, GM, AE, and OP supervised the study. SDM and LB provided the study material (CAN02 sequence). SDM, CB, LB, SAA, and MS contributed to data analysis. AE provided financial support for the project. All authors contributed to the writing of the manuscript.
The contact author has declared that none of the authors has any competing interests.
Publisher's note: Copernicus Publications remains neutral with regard to jurisdictional claims made in the text, published maps, institutional affiliations, or any other geographical representation in this paper. While Copernicus Publications makes every effort to include appropriate place names, the final responsibility lies with the authors.
The sampling of peat cores and surface samples was performed during mentored field research of the University of Montpellier, as part of ORPAM teaching modules. The authors thank Frédéric Néri and the CEN Languedoc-Roussillon for fieldwork facilities; ISEM for financial contribution to radiocarbon dating; Sandrine Canal for the preparation and treatment of pollen samples; and Jean-Frédéric Terral, Vincent Girard, and ORPAM students for help with fieldwork and with the preliminary study of the Canroute peatland. This is ISEM contribution ISEM 2023-199.
This research is a part of the DEMETER project and has been supported by the European Research Council (ERC) under the European Union's Horizon 2020 research and innovation programme (grant agreement no. 852573, PI Allowen Evin).
This paper was edited by Nathalie Combourieu Nebout and reviewed by Cindy De Jonge and one anonymous referee.
Ardenghi, N., Mulch, A., Koutsodendris, A., Pross, J., Kahmen, A., and Niedermeyer, E. M.: Temperature and moisture variability in the eastern Mediterranean region during Marine Isotope Stages 11–10 based on biomarker analysis of the Tenaghi Philippon peat deposit, Quaternary Sci. Rev., 225, 105977, https://doi.org/10.1016/j.quascirev.2019.105977, 2019.
Bader, J., Jungclaus, J., Krivova, N., Lorenz, S., Maycock, A., Raddatz, T., Schmidt, H., Toohey, M., Wu, C.-J., and Claussen, M.: Global temperature modes shed light on the Holocene temperature conundrum, Nat. Commun., 11, 4726, https://doi.org/10.1038/s41467-020-18478-6, 2020.
Ball, D. F.: Loss-on-ignition as an estimate of organic matter and organic carbon in non-calcareous soils, J. Soil Sci., 15, 84–92, https://doi.org/10.1111/j.1365-2389.1964.tb00247.x, 1964.
Birks, H. H. and Birks, H. J. B.: Multi-proxy studies in palaeolimnology, Veg. Hist. Archaeobot., 15, 235–251, https://doi.org/10.1007/s00334-006-0066-6, 2006.
Birks, H. J. B. and Seppä, H.: Pollen-based reconstructions of late-Quaternary climate in Europe – progress, problems, and pitfalls, Acta Palaeobotanica, 44, 317–334, 2004.
Blaauw, M., Christen, J. A., Vázquez, J. E., and Goring, S.: clam: Classical Age-Depth Modelling of Cores from Deposits, RCRAN, https://doi.org/doi:10.1016/j.quageo.2010.01.002, 2022.
Blaga, C. I., Reichart, G.-J., Heiri, O., and Sinninghe Damsté, J. S.: Tetraether membrane lipid distributions in water-column particulate matter and sediments: a study of 47 European lakes along a north–south transect, J. Paleolimnol., 41, 523–540, https://doi.org/10.1007/s10933-008-9242-2, 2009.
Bradley, R. S.: Paleoclimatology: reconstructing climates of the quaternary, 3rd Edn., Elsevier Academic Press, Amsterdam, 675 pp., https://doi.org/10.1016/C2009-0-18310-1, 2015.
Breiman, L.: Random Forests, Mach. Learn., 45, 5–32, https://doi.org/10.1023/A:1010933404324, 2001.
Brewer, S., Guiot, J., Sánchez-Goñi, M. F., and Klotz, S.: The climate in Europe during the Eemian: a multi-method approach using pollen data, Quaternary Sci. Rev., 27, 2303–2315, https://doi.org/10.1016/j.quascirev.2008.08.029, 2008.
Broecker, W. S., Denton, G. H., Edwards, R. L., Cheng, H., Alley, R. B., and Putnam, A. E.: Putting the Younger Dryas cold event into context, Quaternary Sci. Rev., 29, 1078–1081, 2010.
Cartapanis, O., Jonkers, L., Moffa-Sanchez, P., Jaccard, S. L., and de Vernal, A.: Complex spatio-temporal structure of the Holocene thermal maximum, Nat. Commun., 13, 5662, https://doi.org/10.1038/s41467-022-33362-1, 2022.
Cheddadi, R., Yu, G., Guiot, J., Harrison, S. P., and Prentice, I. C.: The climate of Europe 6000 years ago, Clim. Dynam., 13, 1–9, https://doi.org/10.1007/s003820050148, 1997.
Chen, Y., Zheng, F., Yang, H., Yang, W., Wu, R., Liu, X., Liang, H., Chen, H., Pei, H., Zhang, C., Pancost, R. D., and Zeng, Z.: The production of diverse brGDGTs by an Acidobacterium providing a physiological basis for paleoclimate proxies, Geochim. Cosmochim. Ac., 337, 155–165, https://doi.org/10.1016/j.gca.2022.08.033, 2022.
Chevalier, M., Davis, B. A. S., Heiri, O., Seppä, H., Chase, B. M., Gajewski, K., Lacourse, T., Telford, R. J., Finsinger, W., Guiot, J., Kühl, N., Maezumi, S. Y., Tipton, J. R., Carter, V. A., Brussel, T., Phelps, L. N., Dawson, A., Zanon, M., Vallé, F., Nolan, C., Mauri, A., de Vernal, A., Izumi, K., Holmström, L., Marsicek, J., Goring, S., Sommer, P. S., Chaput, M., and Kupriyanov, D.: Pollen-based climate reconstruction techniques for late Quaternary studies, Earth-Sci. Rev., 210, 33, 2020.
Davies, S. J., Lamb, H. F., and Roberts, S. J.: Micro-XRF Core Scanning in Palaeolimnology: Recent Developments, in: Micro-XRF Studies of Sediment Cores: Applications of a non-destructive tool for the environmental sciences, edited by: Croudace, I. W. and Rothwell, R. G., Springer Netherlands, Dordrecht, 189–226, https://doi.org/10.1007/978-94-017-9849-5_7, 2015.
Davis, B. A. S., Brewer, S., Stevenson, A. C., and Guiot, J.: The temperature of Europe during the Holocene reconstructed from pollen data, Quaternary Sci. Rev., 22, 1701–1716, https://doi.org/10.1016/S0277-3791(03)00173-2, 2003.
Davtian, N., Bard, E., Darfeuil, S., Ménot, G., and Rostek, F.: The Novel Hydroxylated Tetraether Index RI-OH′ as a Sea Surface Temperature Proxy for the 160–45 ka BP Period Off the Iberian Margin, Palaeoceanography and Palaeoclimatology, 36, e2020PA004077, https://doi.org/10.1029/2020PA004077, 2021.
de Beaulieu, J.-L.: Contribution pollenanalytique à l'histoire tardiglaciaire et holocène des Alpes méridionales françaises, Doctoral thesis, Université d'Aix-Marseille III, France, 358 pp., 490842065, 1977.
Dearing Crampton-Flood, E., Tierney, J. E., Peterse, F., Kirkels, F. M. S. A., and Sinninghe Damsté, J. S.: BayMBT: A Bayesian calibration model for branched glycerol dialkyl glycerol tetraethers in soils and peats, Geochim. Cosmochim. Ac., 268, 142–159, https://doi.org/10.1016/j.gca.2019.09.043, 2020.
De'Ath, G.: Boosted Trees for Ecological. Modelling and Prediction, Ecology, 88, 243–251, https://doi.org/10.1890/0012-9658(2007)88[243:BTFEMA]2.0.CO;2, 2007.
de Beaulieu, J.-L. and Reille, M.: Paléoenvironnement tardiglaciaire et holocène des lacs de Pelléautier et Siguret (Hautes-Alpes, France). I. Histoire de la végétation d'après les analyses polliniques, Ecologia Mediterranea, 9, 19–36, 1983.
Decorsiere, J., Delamare-Deboutteville, J., and Lecerf, C.: Reconstitution de 13 500 ans d'histoire d'une tourbière dans le Sud de la France, Orpalm Synthesis, 12, 29–39, 2019.
De Jonge, C., Hopmans, E. C., Zell, C. I., Kim, J.-H., Schouten, S., and Sinninghe Damsté, J. S.: Occurrence and abundance of 6-methyl branched glycerol dialkyl glycerol tetraethers in soils: Implications for palaeoclimate reconstruction, Geochim. Cosmochim. Ac., 141, 97–112, https://doi.org/10.1016/j.gca.2014.06.013, 2014a.
De Jonge, C., Stadnitskaia, A., Hopmans, E. C., Cherkashov, G., Fedotov, A., and Sinninghe Damsté, J. S.: In situ produced branched glycerol dialkyl glycerol tetraethers in suspended particulate matter from the Yenisei River, Eastern Siberia, Geochim. Cosmochim. Ac., 125, 476–491, https://doi.org/10.1016/j.gca.2013.10.031, 2014b.
De Jonge, C., Radujković, D., Sigurdsson, B. D., Weedon, J. T., Janssens, I., and Peterse, F.: Lipid biomarker temperature proxy responds to abrupt shift in the bacterial community composition in geothermally heated soils, Org. Geochem., 137, 103897, https://doi.org/10.1016/j.orggeochem.2019.07.006, 2019.
De Jonge, C., Kuramae, E. E., Radujković, D., Weedon, J. T., Janssens, I. A., and Peterse, F.: The influence of soil chemistry on branched tetraether lipids in mid- and high latitude soils: Implications for brGDGT-based palaeothermometry, Geochim. Cosmochim. Ac., 310, 95–112, https://doi.org/10.1016/j.gca.2021.06.037, 2021.
Denton, G. H., Anderson, R. F., Toggweiler, J. R., Edwards, R. L., Schaefer, J. M., and Putnam, A. E.: The Last Glacial Termination, Science, 328, 1652–1656, 2010.
Ding, S., Schwab, V. F., Ueberschaar, N., Roth, V.-N., Lange, M., Xu, Y., Gleixner, G., and Pohnert, G.: Identification of novel 7-methyl and cyclopentanyl branched glycerol dialkyl glycerol tetraethers in lake sediments, Org. Geochem., 102, 52–58, https://doi.org/10.1016/j.orggeochem.2016.09.009, 2016.
Dray, S. and Josse, J.: Principal component analysis with missing values: a comparative survey of methods, Plant Ecol., 216, 657–667, https://doi.org/10.1007/s11258-014-0406-z, 2015.
Dugerdil, L., Joannin, S., Peyron, O., Jouffroy-Bapicot, I., Vannière, B., Boldgiv, B., Unkelbach, J., Behling, H., and Ménot, G.: Climate reconstructions based on GDGT and pollen surface datasets from Mongolia and Baikal area: calibrations and applicability to extremely cold–dry environments over the Late Holocene, Clim. Past, 17, 1199–1226, https://doi.org/10.5194/cp-17-1199-2021, 2021a.
Dugerdil, L., Ménot, G., Peyron, O., Jouffroy-Bapicot, I., Ansanay-Alex, S., Antheaume, I., Behling, H., Boldgiv, B., Develle, A.-L., Grossi, V., Magail, J., Makou, M., Robles, M., Unkelbach, J., Vannière, B., and Joannin, S.: Late Holocene Mongolian climate and environment reconstructions from brGDGTs, NPPs and pollen transfer functions for Lake Ayrag: Palaeoclimate implications for Arid Central Asia, Quaternary Sci. Rev., 273, 107235, https://doi.org/10.1016/j.quascirev.2021.107235, 2021b.
Duprat-Oualid, F., Bégeot, C., Peyron, O., Rius, D., Millet, L., and Magny, M.: High-frequency vegetation and climatic changes during the Lateglacial inferred from the Lapsou pollen record (Cantal, southern Massif Central, France), Quatern. Int., 636, 69–80, https://doi.org/10.1016/j.quaint.2022.04.012, 2022.
Elith, J., Leathwick, J. R., and Hastie, T.: A working guide to boosted regression trees, J. Anim. Ecol., 77, 802–813, https://doi.org/10.1111/j.1365-2656.2008.01390.x, 2008.
Erb, M. P., McKay, N. P., Steiger, N., Dee, S., Hancock, C., Ivanovic, R. F., Gregoire, L. J., and Valdes, P.: Reconstructing Holocene temperatures in time and space using paleoclimate data assimilation, Clim. Past, 18, 2599–2629, https://doi.org/10.5194/cp-18-2599-2022, 2022.
Fick, S. E. and Hijmans, R. J.: WorldClim 2: new 1 km spatial resolution climate surfaces for global land areas, Int. J. Climatol., 37, 4302–4315, https://doi.org/10.1002/joc.5086, 2017.
Grimm, E. C.: CONISS: a FORTRAN 77 program for stratigraphically constrained cluster analysis by the method of incremental sum of squares, Comput. Geosci.-UK, 13, 13–35, https://doi.org/10.1016/0098-3004(87)90022-7, 1987.
Guiot, J.: Methodology of the last climatic cycle reconstruction in France from pollen data, Palaeogeogr. Palaeocl., 80, 49–69, https://doi.org/10.1016/0031-0182(90)90033-4, 1990.
Halamka, T. A., Raberg, J. H., McFarlin, J. M., Younkin, A. D., Mulligan, C., Liu, X., and Kopf, S. H.: Production of diverse brGDGTs by Acidobacterium Solibacter usitatus in response to temperature, pH, and O2 provides a culturing perspective on br GDGT proxies and biosynthesis, Geobiology, 21, 102–118, https://doi.org/10.1111/gbi.12525, 2023.
Harris, I., Osborn, T. J., Jones, P., and Lister, D.: Version 4 of the CRU TS monthly high-resolution gridded multivariate climate database, Sci. Data, 7, 109, https://doi.org/10.1038/s41597-020-0453-3, 2020.
Heiri, O., Lotter, A. F., Hausmann, S., and Kienast, F.: A chironomid-based Holocene summer air temperature reconstruction from the Swiss Alps, Holocene, 13, 477–484, https://doi.org/10.1191/0959683603hl640ft, 2003.
Herzschuh, U., Böhmer, T., Chevalier, M., Hébert, R., Dallmeyer, A., Li, C., Cao, X., Peyron, O., Nazarova, L., Novenko, E. Y., Park, J., Rudaya, N. A., Schlütz, F., Shumilovskikh, L. S., Tarasov, P. E., Wang, Y., Wen, R., Xu, Q., and Zheng, Z.: Regional pollen-based Holocene temperature and precipitation patterns depart from the Northern Hemisphere mean trends, Clim. Past, 19, 1481–1506, https://doi.org/10.5194/cp-19-1481-2023, 2023.
Hijmans, R. J., Phillips, S., Leathwick, J., and Elith, J.: dismo: Species Distribution Modeling, RCRAN, https://CRAN.R-project.org/package=dismo (last access: March 2023), 2022.
Hopmans, E. C., Weijers, J. W. H., Schefuß, E., Herfort, L., Sinninghe Damsté, J. S., and Schouten, S.: A novel proxy for terrestrial organic matter in sediments based on branched and isoprenoid tetraether lipids, Earth Planet. Sc. Lett., 224, 107–116, https://doi.org/10.1016/j.epsl.2004.05.012, 2004.
Hopmans, E. C., Schouten, S., and Sinninghe Damsté, J. S.: The effect of improved chromatography on GDGT-based palaeoproxies, Org. Geochem., 93, 1–6, https://doi.org/10.1016/j.orggeochem.2015.12.006, 2016.
Huguet, A., Fosse, C., Laggoun-Défarge, F., Toussaint, M.-L., and Derenne, S.: Occurrence and distribution of glycerol dialkyl glycerol tetraethers in a French peat bog, Org. Geochem., 41, 559–572, https://doi.org/10.1016/j.orggeochem.2010.02.015, 2010.
Huguet, C., Hopmans, E. C., Febo-Ayala, W., Thompson, D. H., Sinninghe Damsté, J. S., and Schouten, S.: An improved method to determine the absolute abundance of glycerol dibiphytanyl glycerol tetraether lipids, Org. Geochem., 37, 1036–1041, https://doi.org/10.1016/j.orggeochem.2006.05.008, 2006.
Jalali, B., Sicre, M.-A., Bassetti, M.-A., and Kallel, N.: Holocene climate variability in the North-Western Mediterranean Sea (Gulf of Lions), Clim. Past, 12, 91–101, https://doi.org/10.5194/cp-12-91-2016, 2016.
Joosten, H.: Current soil carbon loss and land degradation globally: where are the hotspots and why there?, CABI Books, 224–234, https://doi.org/10.1079/9781780645322.0224, 2015.
Josse, J. and Husson, F.: missMDA: A Package for Handling Missing Values in Multivariate Data Analysis, J. Stat. Softw., 70, 1–31, https://doi.org/10.18637/jss.v070.i01, 2016.
Juggins, S.: rioja: Analysis of Quaternary Science Data, RCRAN, https://cran.r-project.org/package=rioja (last access: March 2023), 2023.
Julve, P.: Les tourbières de France : répartition, caractères biogéographiques, fonctionnement écologique et dynamique, valeur patrimoniale (French Peat-bogs : localisation, biogeographic characters, ecological functionning, patrimonial value), Bulletin de l'Association de géographes français, 71, 287–293, https://doi.org/10.3406/bagf.1994.1748, 1994.
Kassambara, A. and Mundt, F.: factoextra: Extract and Visualize the Results of Multivariate Data Analyses, RCRAN, https://CRAN.R-project.org/package=factoextra (last access: July 2023), 2020.
Kaufman, D., McKay, N., Routson, C., Erb, M., Dätwyler, C., Sommer, P. S., Heiri, O., and Davis, B.: Holocene global mean surface temperature, a multi-method reconstruction approach, Sci. Data, 7, 201, https://doi.org/10.1038/s41597-020-0530-7, 2020.
Laskar, J., Robutel, P., Joutel, F., Gastineau, M., Correia, A. C. M., and Levrard, B.: A long-term numerical solution for the insolation quantities of the Earth, Astron. Astrophys., 428, 261–285, https://doi.org/10.1051/0004-6361:20041335, 2004.
Lê, S., Josse, J., and Husson, F.: FactoMineR: A Package for Multivariate Analysis, J. Stat. Softw., 25, 1-18, 2008.
Le Houérou, H.-N.: Biogeography of the arid steppeland north of the Sahara, J. Arid Environ., 48, 103–128, 2001.
Li, J., Pancost, R. D., Naafs, B. D. A., Yang, H., Zhao, C., and Xie, S.: Distribution of glycerol dialkyl glycerol tetraether (GDGT) lipids in a hypersaline lake system, Org. Geochem., 99, 113–124, https://doi.org/10.1016/j.orggeochem.2016.06.007, 2016.
Liaw, A. and Wiener, M.: Classification and Regression by randomForest, R News, 2, 18–22, 2002.
Liu, Z., Zhu, J., Rosenthal, Y., Zhang, X., Otto-Bliesner, B. L., Timmermann, A., Smith, R. S., Lohmann, G., Zheng, W., and Elison Timm, O.: The Holocene temperature conundrum, P. Natl. Acad. Sci. USA, 111, E3501–E3505, https://doi.org/10.1073/pnas.1407229111, 2014.
Marcott, S. A., Shakun, J. D., Clark, P. U., and Mix, A. C.: A Reconstruction of Regional and Global Temperature for the Past 11 300 Years, Science, 339, 1198–1201, https://doi.org/10.1126/science.1228026, 2013.
Marriner, N., Kaniewski, D., Pourkerman, M., and Devillers, B.: Anthropocene tipping point reverses long-term Holocene cooling of the Mediterranean Sea: A meta-analysis of the basin's Sea Surface Temperature records, Earth-Sci. Rev., 227, 103986, https://doi.org/10.1016/j.earscirev.2022.103986, 2022.
Marsicek, J., Shuman, B. N., Bartlein, P. J., Shafer, S. L., and Brewer, S.: Reconciling divergent trends and millennial variations in Holocene temperatures, Nature, 554, 19, https://doi.org/10.1038/nature25464, 2018.
Martin, C., Ménot, G., Thouveny, N., Davtian, N., Andrieu-Ponel, V., Reille, M., and Bard, E.: Impact of human activities and vegetation changes on the tetraether sources in Lake St Front (Massif Central, France), Org. Geochem., 135, 38–52, https://doi.org/10.1016/j.orggeochem.2019.06.005, 2019.
Martin, C., Ménot, G., Thouveny, N., Peyron, O., Andrieu-Ponel, V., Montade, V., Davtian, N., Reille, M., and Bard, E.: Early Holocene thermal maximum recorded by branched tetraethers and pollen in Western Europe (Massif Central, France), Quaternary Sci. Rev., 228, 106109, https://doi.org/10.1016/j.quascirev.2019.106109, 2020.
Martínez-Sosa, P., Tierney, J. E., Stefanescu, I. C., Dearing Crampton-Flood, E., Shuman, B. N., and Routson, C.: A global Bayesian temperature calibration for lacustrine brGDGTs, Geochim. Cosmochim. Ac., 305, 87–105, https://doi.org/10.1016/j.gca.2021.04.038, 2021.
Mauri, A., Davis, B. A. S., Collins, P. M., and Kaplan, J. O.: The influence of atmospheric circulation on the mid-Holocene climate of Europe: a data–model comparison, Clim. Past, 10, 1925–1938, https://doi.org/10.5194/cp-10-1925-2014, 2014.
Mauri, A., Davis, B. A. S., Collins, P. M., and Kaplan, J. O.: The climate of Europe during the Holocene: a gridded pollen-based reconstruction and its multi-proxy evaluation, Quaternary Sci. Rev., 112, 109–127, https://doi.org/10.1016/j.quascirev.2015.01.013, 2015.
Mayewski, P. A., Rohling, E. E., Curt Stager, J., Karlén, W., Maasch, K. A., Meeker, L. D., Meyerson, E. A., Gasse, F., van Kreveld, S., Holmgren, K., Lee-Thorp, J., Rosqvist, G., Rack, F., Staubwasser, M., Schneider, R. R., and Steig, E. J.: Holocene climate variability, Quaternary Res., 62, 243–255, https://doi.org/10.1016/j.yqres.2004.07.001, 2004.
Miras, Y., Vergne, V., Guenet, P., and Surmely, F.: Le Massif central: premières traces d'anthropisation révélées par l'analyse pollinique des zones humides corrélées aux données archéologiques, in: Néolithisation précoce. Premières traces d'anthropisation du couvert végétal à partir des données polliniques, edited by: Richard, H., Presses Universitaires de Franche-Comté, 89–106, https://hal.science/hal-00267413 (last access: October 2023), 2005.
Mohammad, A. G. and Adam, M. A.: The impact of vegetative cover type on runoff and soil erosion under different land uses, CATENA, 81, 97–103, https://doi.org/10.1016/j.catena.2010.01.008, 2010.
Moore, P. D.: The ecology of peat-forming processes: a review, Int. J. Coal Geol., 12, 89–103, 1989.
Muller, S. D., Brémond, L., Girard, V., and Terral, J.-F.: Végétation de la tourbière de Canroute, dans les Monts de Lacaune (Le Margnès, Tarn), Orpalm Synthesis, 11, 9–13, 2018.
Naafs, B. D. A., Gallego-Sala, A. V., Inglis, G. N., and Pancost, R. D.: Refining the global branched glycerol dialkyl glycerol tetraether (brGDGT) soil temperature calibration, Org. Geochem., 106, 48–56, https://doi.org/10.1016/j.orggeochem.2017.01.009, 2017a.
Naafs, B. D. A., Inglis, G. N., Zheng, Y., Amesbury, M. J., Biester, H., Bindler, R., Blewett, J., Burrows, M. A., Del Castillo Torres, D., Chambers, F. M., Cohen, A. D., Evershed, R. P., Feakins, S. J., Gałka, M., Gallego-Sala, A., Gandois, L., Gray, D. M., Hatcher, P. G., Honorio Coronado, E. N., Hughes, P. D. M., Huguet, A., Könönen, M., Laggoun-Défarge, F., Lähteenoja, O., Lamentowicz, M., Marchant, R., McClymont, E., Pontevedra-Pombal, X., Ponton, C., Pourmand, A., Rizzuti, A. M., Rochefort, L., Schellekens, J., De Vleeschouwer, F., and Pancost, R. D.: Introducing global peat-specific temperature and pH calibrations based on brGDGT bacterial lipids, Geochim. Cosmochim. Ac., 208, 285–301, https://doi.org/10.1016/j.gca.2017.01.038, 2017b.
Naafs, B. D. A., Inglis, G. N., Blewett, J., McClymont, E. L., Lauretano, V., Xie, S., Evershed, R. P., and Pancost, R. D.: The potential of biomarker proxies to trace climate, vegetation, and biogeochemical processes in peat: A review, Global Planet. Change, 179, 57–79, https://doi.org/10.1016/j.gloplacha.2019.05.006, 2019.
Naafs, B. D. A., Oliveira, A. S. F., and Mulholland, A. J.: Molecular dynamics simulations support the hypothesis that the brGDGT paleothermometer is based on homeoviscous adaptation, Geochim. Cosmochim. Ac., 312, 44–56, https://doi.org/10.1016/j.gca.2021.07.034, 2021.
NASA JPL: NASA Shuttle Radar Topography Mission Global 1 arc second, NASA EOSDIS Land Processes DAAC [data set], https://doi.org/10.5067/MEaSUREs/SRTM/SRTMGL1.003, 2013.
Pearson, A. and Ingalls, A. E.: Assessing the Use of Archaeal Lipids as Marine Environmental Proxies, Annu. Rev. Earth Pl. Sc., 41, 359–384, https://doi.org/10.1146/annurev-earth-050212-123947, 2013.
Pearson, E. J., Juggins, S., Talbot, H. M., Weckström, J., Rosén, P., Ryves, D. B., Roberts, S. J., and Schmidt, R.: A lacustrine GDGT-temperature calibration from the Scandinavian Arctic to Antarctic: Renewed potential for the application of GDGT-palaeothermometry in lakes, Geochim. Cosmochim. Ac., 75, 6225–6238, https://doi.org/10.1016/j.gca.2011.07.042, 2011.
Peterse, F., van der Meer, J., Schouten, S., Weijers, J. W. H., Fierer, N., Jackson, R. B., Kim, J.- H., and Sinninghe Damsté, J. S.: Revised calibration of the MBT–CBT palaeotemperature proxy based on branched tetraether membrane lipids in surface soils, Geochim. Cosmochim. Ac., 96, 215–229, https://doi.org/10.1016/j.gca.2012.08.011, 2012.
Peyron, O., Bégeot, C., Brewer, S., Heiri, O., Magny, M., Millet, L., Ruffaldi, P., Van Campo, E., and Yu, G.: Late-Glacial climatic changes in Eastern France (Lake Lautrey) from pollen, lake-levels, and chironomids, Quaternary Res., 64, 197–211, https://doi.org/10.1016/j.yqres.2005.01.006, 2005.
Peyron, O., Goring, S., Dormoy, I., Kotthoff, U., Pross, J., de Beaulieu, J.-L., Drescher-Schneider, R., Vannière, B., and Magny, M.: Holocene seasonality changes in the central Mediterranean region reconstructed from the pollen sequences of Lake Accesa (Italy) and Tenaghi Philippon (Greece), Holocene, 21, 131–146, https://doi.org/10.1177/0959683610384162, 2011.
Peyron, O., Magny, M., Goring, S., Joannin, S., de Beaulieu, J.-L., Brugiapaglia, E., Sadori, L., Garfi, G., Kouli, K., Ioakim, C., and Combourieu-Nebout, N.: Contrasting patterns of climatic changes during the Holocene across the Italian Peninsula reconstructed from pollen data, Clim. Past, 9, 1233–1252, https://doi.org/10.5194/cp-9-1233-2013, 2013.
Peyron, O., Combourieu-Nebout, N., Brayshaw, D., Goring, S., Andrieu-Ponel, V., Desprat, S., Fletcher, W., Gambin, B., Ioakim, C., Joannin, S., Kotthoff, U., Kouli, K., Montade, V., Pross, J., Sadori, L., and Magny, M.: Precipitation changes in the Mediterranean basin during the Holocene from terrestrial and marine pollen records: a model–data comparison, Clim. Past, 13, 249–265, https://doi.org/10.5194/cp-13-249-2017, 2017.
Ponel, P., Guiter, F., Gandouin, E., Peyron, O., and Beaulieu, J.-L. D.: Late-Glacial palaeotemperatures and palaeoprecipitations in the Aubrac Mountains (French Massif Central) reconstructed from multiproxy analyses (Coleoptera, chironomids and pollen), Quatern. Int., 636, 39–51, https://doi.org/10.1016/j.quaint.2022.02.005, 2022.
Posit team: RStudio: Integrated Development Environment for R, Posit Software, PBC, Boston, MA, http://www.posit.co/ (last access: July 2023), 2023.
Prasad, A. M., Iverson, L. R., and Liaw, A.: Newer Classification and Regression Tree Techniques: Bagging and Random Forests for Ecological Prediction, Ecosystems, 9, 181–199, https://doi.org/10.1007/s10021-005-0054-1, 2006.
QGIS.org: QGIS Geographic Information System, QGIS Association, https://www.qgis.org/ (last access: February 2023), 2022.
Raberg, J. H., Harning, D. J., Crump, S. E., de Wet, G., Blumm, A., Kopf, S., Geirsdóttir, Á., Miller, G. H., and Sepúlveda, J.: Revised fractional abundances and warm-season temperatures substantially improve brGDGT calibrations in lake sediments, Biogeosciences, 18, 3579–3603, https://doi.org/10.5194/bg-18-3579-2021, 2021.
Raberg, J. H., Miller, G. H., Geirsdóttir, Á., and Sepúlveda, J.: Near-universal trends in brGDGT lipid distributions in nature, Sci. Adv., 8, eabm7625, https://doi.org/10.1126/sciadv.abm7625, 2022.
Ramos-Román, M. J., De Jonge, C., Magyari, E., Veres, D., Ilvonen, L., Develle, A.-L., and Seppä, H.: Lipid biomarker (brGDGT)- and pollen-based reconstruction of temperature change during the Middle to Late Holocene transition in the Carpathians, Global Planet. Change, 215, 103859, https://doi.org/10.1016/j.gloplacha.2022.103859, 2022.
Rao, Z., Guo, H., Wei, S., Cao, J., and Jia, G.: Influence of water conditions on peat brGDGTs: A modern investigation and its palaeoclimatic implications, Chem. Geol., 606, 120993, https://doi.org/10.1016/j.chemgeo.2022.120993, 2022.
R Core Team: R: A language and environment for statistical computing, R Foundation for Statistical Computing, Vienna, Austria, https://www.R-project.org (last access: August 2023), 2022.
Reimer, P. J., Austin, W. E. N., Bard, E., Bayliss, A., Blackwell, P. G., Bronk Ramsey, C., Butzin, M., Cheng, H., Edwards, R. L., Friedrich, M., Grootes, P. M., Guilderson, T. P., Hajdas, I., Heaton, T. J., Hogg, A. G., Hughen, K. A., Kromer, B., Manning, S. W., Muscheler, R., Palmer, J. G., Pearson, C., van der Plicht, J., Reimer, R. W., Richards, D. A., Scott, E. M., Southon, J. R., Turney, C. S. M., Wacker, L., Adolphi, F., Büntgen, U., Capano, M., Fahrni, S. M., Fogtmann-Schulz, A., Friedrich, R., Köhler, P., Kudsk, S., Miyake, F., Olsen, J., Reinig, F., Sakamoto, M., Sookdeo, A., and Talamo, S.: The IntCal20 Northern Hemisphere Radiocarbon Age Calibration Curve (0–55 cal kBP), Radiocarbon, 62, 725–757, https://doi.org/10.1017/RDC.2020.41, 2020.
Renssen, H., Seppä, H., Crosta, X., Goosse, H., and Roche, D. M.: Global characterization of the Holocene thermal maximum, Quaternary Sci. Rev., 48, 7–19, https://doi.org/10.1016/j.quascirev.2012.05.022, 2012.
Robles, M., Peyron, O., Brugiapaglia, E., Ménot, G., Dugerdil, L., Ollivier, V., Ansanay-Alex, S., Develle, A.-L., Tozalakyan, P., Meliksetian, K., Sahakyan, K., Sahakyan, L., Perello, B., Badalyan, R., Colombié, C., and Joannin, S.: Impact of climate changes on vegetation and human societies during the Holocene in the South Caucasus (Vanevan, Armenia): A multiproxy approach including pollen, NPPs and brGDGTs, Quaternary Sci. Rev., 277, 107297, https://doi.org/10.1016/j.quascirev.2021.107297, 2022.
Robles, M., Peyron, O., Ménot, G., Brugiapaglia, E., Wulf, S., Appelt, O., Blache, M., Vannière, B., Dugerdil, L., Paura, B., Ansanay-Alex, S., Cromartie, A., Charlet, L., Guédron, S., de Beaulieu, J.-L., and Joannin, S.: Climate changes during the Late Glacial in southern Europe: new insights based on pollen and brGDGTs of Lake Matese in Italy, Clim. Past, 19, 493–515, https://doi.org/10.5194/cp-19-493-2023, 2023.
Rodrigo-Gámiz, M., García-Alix, A., Jiménez-Moreno, G., Ramos-Román, M. J., Camuera, J., Toney, J. L., Sachse, D., Anderson, R. S., and Sinninghe Damsté, J. S.: Palaeoclimate reconstruction of the last 36 kyr based on branched glycerol dialkyl glycerol tetraethers in the Padul palaeolake record (Sierra Nevada, southern Iberian Peninsula), Quaternary Sci. Rev., 281, 107434, https://doi.org/10.1016/j.quascirev.2022.107434, 2022.
Russell, J. M., Hopmans, E. C., Loomis, S. E., Liang, J., and Sinninghe Damsté, J. S.: Distributions of 5- and 6-methyl branched glycerol dialkyl glycerol tetraethers (brGDGTs) in East African lake sediment: Effects of temperature, pH, and new lacustrine palaeotemperature calibrations, Org. Geochem., 117, 56–69, https://doi.org/10.1016/j.orggeochem.2017.12.003, 2018.
Sahonero-Canavesi, D. X., Siliakus, M. F., Abdala Asbun, A., Koenen, M., Von Meijenfeldt, F. A. B., Boeren, S., Bale, N. J., Engelman, J. C., Fiege, K., Strack Van Schijndel, L., Sinninghe Damsté, J. S., and Villanueva, L.: Disentangling the lipid divide: Identification of key enzymes for the biosynthesis of membrane-spanning and ether lipids in Bacteria, Sci. Adv., 8, eabq8652, https://doi.org/10.1126/sciadv.abq8652, 2022.
Salonen, J. S., Korpela, M., Williams, J. W., and Luoto, M.: Machine-learning based reconstructions of primary and secondary climate variables from North American and European fossil pollen data, Sci. Rep.-UK, 9, 15805, https://doi.org/10.1038/s41598-019-52293-4, 2019.
Samartin, S., Heiri, O., Joos, F., Renssen, H., Franke, J., Brönnimann, S., and Tinner, W.: Warm Mediterranean mid-Holocene summers inferred from fossil midge assemblages, Nat. Geosci., 10, 207–212, https://doi.org/10.1038/ngeo2891, 2017.
Schouten, S., Rijpstra, W. I. C., Durisch-Kaiser, E., Schubert, C. J., and Sinninghe Damsté, J. S.: Distribution of glycerol dialkyl glycerol tetraether lipids in the water column of Lake Tanganyika, Org. Geochem., 53, 34–37, https://doi.org/10.1016/j.orggeochem.2012.01.009, 2012.
Schouten, S., Hopmans, E. C., and Sinninghe Damsté, J. S.: The organic geochemistry of glycerol dialkyl glycerol tetraether lipids: A review, Org. Geochem., 54, 19–61, https://doi.org/10.1016/j.orggeochem.2012.09.006, 2013.
Sennès, V.: Les tourbières de l'Europe de l'ouest, Travaux du Laboratoire de Géographie Physique Appliquée, 22, 11–25, https://doi.org/10.3406/tlgpa.2003.1008, 2004.
Seppä, H. and Bennett, K. D.: Quaternary pollen analysis: recent progress in palaeoecology and palaeoclimatology, Prog. Phys. Geog., 27, 548–579, 2003.
Silva-Sánchez, N., Martínez Cortizas, A., and López-Merino, L.: Linking forest cover, soil erosion and mire hydrology to late-Holocene human activity and climate in NW Spain, Holocene, 24, 714–725, https://doi.org/10.1177/0959683614526934, 2014.
Sinninghe Damsté, J. S.: Spatial heterogeneity of sources of branched tetraethers in shelf systems: The geochemistry of tetraethers in the Berau River delta (Kalimantan, Indonesia), Geochim. Cosmochim. Ac., 186, 13–31, https://doi.org/10.1016/j.gca.2016.04.033, 2016.
Smith, A. C., Wynn, P. M., Barker, P. A., Leng, M. J., Noble, S. R., and Tych, W.: North Atlantic forcing of moisture delivery to Europe throughout the Holocene, Sci. Rep.-UK, 6, 24745, https://doi.org/10.1038/srep24745, 2016.
Sugita, S., Parshall, T., and Calcote, R.: Detecting differences in vegetation among paired sites using pollen records, Holocene, 16, 1123–1135, 2006.
Sun, Q., Chu, G., Liu, M., Xie, M., Li, S., Ling, Y., Wang, X., Shi, L., Jia, G., and Lü, H.: Distributions and temperature dependence of branched glycerol dialkyl glycerol tetraethers in recent lacustrine sediments from China and Nepal, J. Geophys. Res.-Biogeo., 116, G01008, https://doi.org/10.1029/2010JG001365, 2011.
ter Braak, C. J. F. and Juggins, S.: Weighted averaging partial least squares regression (WA-PLS): an improved method for reconstructing environmental variables from species assemblages | SpringerLink, Hydrobiologia, 269/270, 485–502, 1993.
Turner, M. G., Wei, D., Prentice, I. C., and Harrison, S. P.: The impact of methodological decisions on climate reconstructions using WA-PLS, Quaternary Res., 99, 341–356, https://doi.org/10.1017/qua.2020.44, 2021.
van Andel, T. H., Zangger, E., and Demitrack, A.: Land Use and Soil Erosion in Prehistoric and Historical Greece, J. Field Archaeol., 17, 379–396, 1990.
Walker, B., Holling, C. S., Carpenter, S. R., and Kinzig, A. P.: Resilience, Adaptability and Transformability in Social-ecological Systems, Ecol. Soc., 9, art5, https://doi.org/10.5751/ES-00650-090205, 2004.
Wanner, H.: Late-Holocene: Cooler or warmer?, Holocene, 31, 1501–1506, https://doi.org/10.1177/09596836211019106, 2021.
Watson, B. I., Williams, J. W., Russell, J. M., Jackson, S. T., Shane, L., and Lowell, T. V.: Temperature variations in the southern Great Lakes during the last deglaciation: Comparison between pollen and GDGT proxies, Quaternary Sci. Rev., 182, 78–92, https://doi.org/10.1016/j.quascirev.2017.12.011, 2018.
Weber, Y., Sinninghe Damsté, J. S., Zopfi, J., De Jonge, C., Gilli, A., Schubert, C. J., Lepori, F., Lehmann, M. F., and Niemann, H.: Redox-dependent niche differentiation provides evidence for multiple bacterial sources of glycerol tetraether lipids in lakes, P. Natl. Acad. Sci. USA, 115, 10926–10931, https://doi.org/10.1073/pnas.1805186115, 2018.
Weijers, J. W. H., Schouten, S., Linden, M., Geel, B., and Sinninghe Damsté, J. S.: Water table related variations in the abundance of intact archaeal membrane lipids in a Swedish peat bog, FEMS Microbiol. Lett., 239, 51–56, https://doi.org/10.1016/j.femsle.2004.08.012, 2004.
Weijers, J. W. H., Schouten, S., Spaargaren, O. C., and Sinninghe Damsté, J. S.: Occurrence and distribution of tetraether membrane lipids in soils: Implications for the use of the TEX86 proxy and the BIT index, Org. Geochem., 37, 1680–1693, https://doi.org/10.1016/j.orggeochem.2006.07.018, 2006.
Weijers, J. W. H., Schouten, S., van den Donker, J. C., Hopmans, E. C., and Sinninghe Damsté, J. S.: Environmental controls on bacterial tetraether membrane lipid distribution in soils, Geochim. Cosmochim. Ac., 71, 703–713, https://doi.org/10.1016/j.gca.2006.10.003, 2007.
Weijers, J. W. H., Panoto, E., van Bleijswijk, J., Schouten, S., Rijpstra, W. I. C., Balk, M., Stams, A. J. M., and Damsté, J. S. S.: Constraints on the Biological. Source(s) of the Orphan Branched Tetraether Membrane Lipids, Geomicrobiol. J., 26, 402–414, https://doi.org/10.1080/01490450902937293, 2009.
Wickham, H.: Data Analysis, in: ggplot2: Elegant Graphics for Data Analysis, edited by: Wickham, H., Springer International Publishing, Cham, 189–201, https://doi.org/10.1007/978-3-319-24277-4_9, 2016.
Xiao, W., Wang, Y., Zhou, S., Hu, L., Yang, H., and Xu, Y.: Ubiquitous production of branched glycerol dialkyl glycerol tetraethers (brGDGTs) in global marine environments: a new source indicator for brGDGTs, Biogeosciences, 13, 5883–5894, https://doi.org/10.5194/bg-13-5883-2016, 2016.
Xiong, Q., Pan, K., Zhang, L., Wang, Y., Li, W., He, X., and Luo, H.: Warming and nitrogen deposition are interactive in shaping surface soil microbial communities near the alpine timberline zone on the eastern Qinghai–Tibet Plateau, southwestern China, Appl. Soil Ecol., 101, 72–83, https://doi.org/10.1016/j.apsoil.2016.01.011, 2016.
Yang, H., Pancost, R. D., Dang, X., Zhou, X., Evershed, R. P., Xiao, G., Tang, C., Gao, L., Guo, Z., and Xie, S.: Correlations between microbial tetraether lipids and environmental variables in Chinese soils: Optimizing the palaeo-reconstructions in semi-arid and arid regions, Geochim. Cosmochim. Ac., 126, 49–69, https://doi.org/10.1016/j.gca.2013.10.041, 2014.
Yang, H., Xiao, W., Słowakiewicz, M., Ding, W., Ayari, A., Dang, X., and Pei, H.: Depth-dependent variation of archaeal ether lipids along soil and peat profiles from southern China: Implications for the use of isoprenoidal GDGTs as environmental tracers, Org. Geochem., 128, 42–56, https://doi.org/10.1016/j.orggeochem.2018.12.009, 2019.
Yurtsev, B. A.: 9 – Relics of the xerophyte vegetation in Beringia in northeastern Asia, in: Paleoecology of Beringia, edited by: Hopkins, D. M., Matthews, J. V., Schweger, C. E., and Young, S. B., Academic Press, 157–177, https://doi.org/10.1016/B978-0-12-355860-2.50018-1, 1982.
Zeng, Z., Chen, H., Yang, H., Chen, Y., Yang, W., Feng, X., Pei, H., and Welander, P. V.: Identification of a protein responsible for the synthesis of archaeal membrane-spanning GDGT lipids, Nat. Commun., 13, 1545, https://doi.org/10.1038/s41467-022-29264-x, 2022.
Zhao, B., Russell, J. M., Tsai, V. C., Blaus, A., Parish, M. C., Liang, J., Wilk, A., Du, X., and Bush, M. B.: Evaluating global temperature calibrations for lacustrine branched GDGTs: Seasonal variability, paleoclimate implications, and future directions, Quaternary Sci. Rev., 310, 108124, https://doi.org/10.1016/j.quascirev.2023.108124, 2023.
Zheng, Y., Li, Q., Wang, Z., Naafs, B. D. A., Yu, X., and Pancost, R. D.: Peatland GDGT re- cords of Holocene climatic and biogeochemical responses to the Asian Monsoon, Org. Geochem., 87, 86–95, https://doi.org/10.1016/j.orggeochem.2015.07.012, 2015.
Zheng, Y., Pancost, R. D., Naafs, B. D. A., Li, Q., Liu, Z., and Yang, H.: Transition from a warm and dry to a cold and wet climate in NE China across the Holocene, Earth Planet. Sc. Lett., 493, 36–46, https://doi.org/10.1016/j.epsl.2018.04.019, 2018.