the Creative Commons Attribution 4.0 License.
the Creative Commons Attribution 4.0 License.
 | 10 Oct 2023
Estimating summer sea ice extent in the Weddell Sea during the early 19th century
Eleanor Love
Over the past 3 decades, discordant trends in sea ice extent have been observed between the Arctic and Antarctic regions. Arctic sea ice extent has been characterised by a rapid decline, whereas Antarctic sea ice extent, while highly variable interannually, has tended to increase. Climate models have so far failed to capture these trends. Coupled with the limited pre-1970 sea ice dataset, this poses a significant challenge to quantifying the mechanisms responsible for driving such trends. However, historical records from early Antarctic expeditions contain a wealth of information regarding the nature and concentration of sea ice. Such records have been underutilised, and their analysis may enhance our understanding of recent Antarctic sea ice variability. For the purpose of this study, nine records from eight Antarctic expeditions have been examined. Summer sea ice positions recorded during 1820–1843 have been compared to satellite observations from 1987–2017, as well as historical data for the period 1897–1917. Through analysis of these three time series, estimates for the northern limits of summer sea ice in the Weddell Sea during the early 19th century have been produced. The key findings of this study indicate a 19th century average core summer northernmost sea ice latitude in much of the Weddell Sea that was further north than during the modern era, with 19th century February having significantly more sea ice by all measures. However, late summer sea ice was most extensive in the early years of the 20th century.
- Article
(1283 KB) - Full-text XML
- BibTeX
- EndNote


During the last 3 decades, unique trends in sea ice extent (SIE) have been observed around the Antarctic continent. Specifically, pan-Antarctic SIE has been characterised by a weak and insignificant positive trend from 1978–2022, with record winter maxima observed in 2012, 2013 and 2014 (Turner and Comiso, 2017; Landrum et al., 2017) but record spring–summer minima observed in 2016 and 2017 (Parkinson and DiGirolamo, 2021). Particularly large increases have been observed in the Ross Sea in the winter and the Weddell Sea in the summer, but significant declines in extent in the Bellingshausen Sea in summer and the Weddell Sea in winter have also been observed. This tendency for regional change is reflected in the significant interannual variability seen in the otherwise weak hemispheric trend (Fig. 1).
These trends have persisted despite expectations of sea ice decline in a warming world (Polvani and Smith, 2013; Parkinson and DiGirolamo, 2016; Riihelä et al., 2021) and in stark contrast to those observed in the Northern Hemisphere (Yu et al., 2017; Parkinson and DiGirolamo, 2021). Arctic SIE has exhibited a rapid decline since the late 1970s, with a net loss of approximately 50 % of summer sea ice throughout the region (Turner and Comiso, 2017). This decline can be largely attributed to global warming trends and the loss of significant amounts of multiyear sea ice (Wadhams, 2012; Herzfeld et al., 2015). In addition, complex positive feedback mechanisms have amplified surface warming in the Arctic region, giving rise to the term “Arctic amplification” (Chen et al., 2019). Figure 1 presents SIE trends for the Arctic and Antarctic regions and demonstrates the discordance between the two hemispheres.
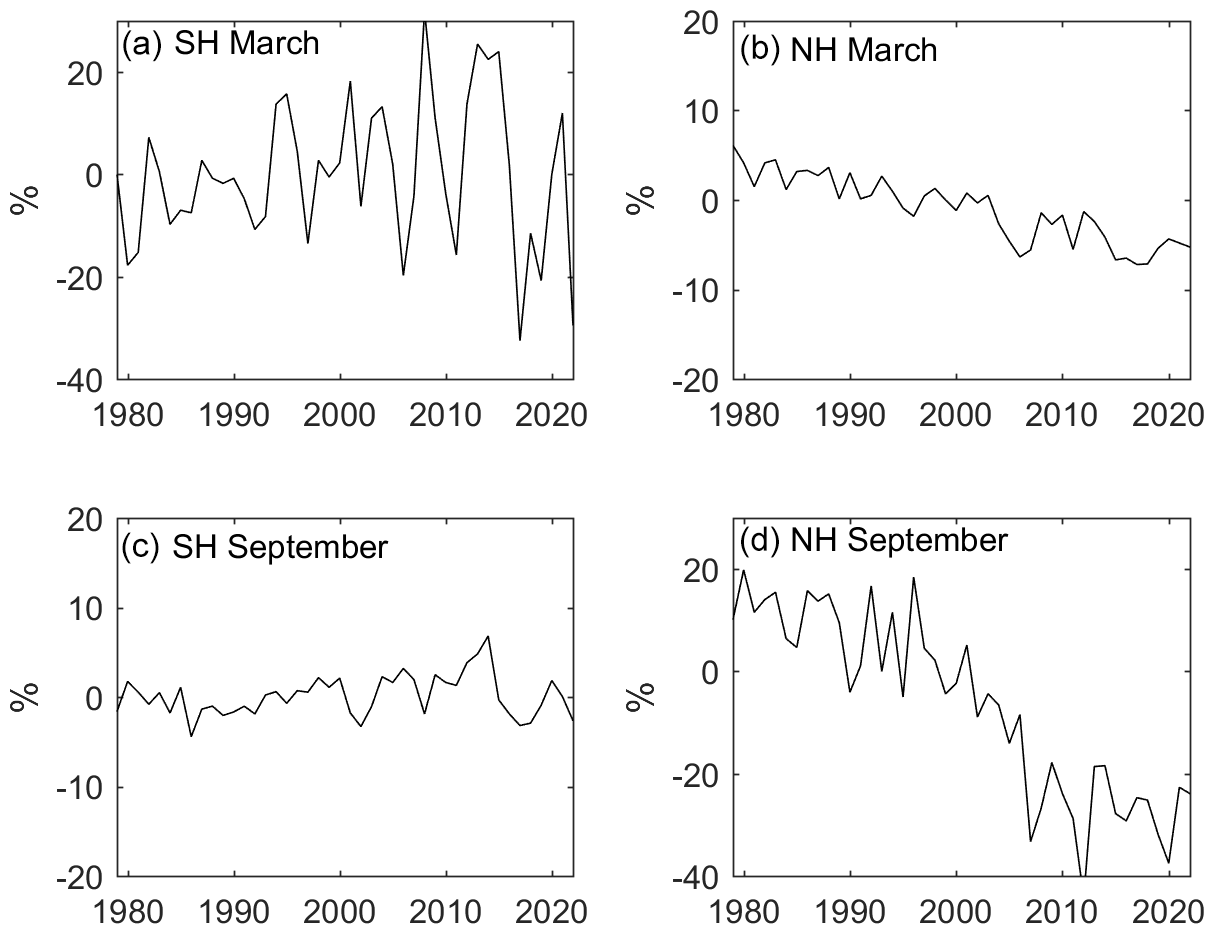
Figure 1Antarctic ((a) summer and (c) winter) and Arctic ((b) winter and (d) summer) sea ice extent over 1979–2022, relative to the 1981–2010 means.
The polar regions' response to climate change is critical in defining the future of the global climate. Sea ice may play a vital role in modulating climate on a global scale by controlling climatically influential mechanisms (Morioka et al., 2017; Shao and Ke, 2015; Yu et al., 2017). Specifically, sea ice formation controls ocean–atmosphere exchanges and influences deep-water formation and surface albedo (Yuan et al., 2017; Parmentier et al., 2017). Quantifying the response of sea ice to climate change is very important; thus, the unique trends in Antarctic SIE have sparked significant interest within the scientific community. The fundamental question remains of whether these trends are simply the result of natural variability or of external driving mechanisms such as anthropogenic forcing? In particular, explaining the greater variability in Antarctic SIE trends relative to those observed in the Arctic, quantifying the role of anthropogenic forcing in driving such trends and establishing whether the recent decline in Antarctic SIE marks a long-term shift are prominent areas in need of addressing (Turner and Comiso, 2017; Li et al., 2020). The primary focus of sea ice research should thus be to establish and quantify the mechanisms responsible for driving sea ice trends on seasonal to multidecadal timescales.
However, research has been made challenging due to the failure of climate models to reproduce pan-Antarctic sea ice trends (Polvani and Smith, 2013; Turner et al., 2013; Roach et al., 2020). In addition, models are failing to simulate the observed asymmetry in SIE trends between the Arctic and Antarctic regions (Rosenblum and Eisenman, 2017; Fox-Kemper et al., 2021). Far from observed trends, climate models appear to simulate a decline (although moderate) in Antarctic sea ice extent (Rosenblum and Eisenman, 2017; Roach et al., 2020), and there is little confidence in the long-term predictions of Antarctic sea ice change from climate modelling (Fox-Kemper et al., 2021). Research is largely dependent on modelling due to the limited set of sea ice data records prior to the satellite era (Edinburgh and Day, 2016; Fogt et al., 2022). Without accurate model simulations, our ability to quantify the primary drivers of Antarctic sea ice trends, particularly the role of anthropogenic forcing as a driving mechanism, is considerably restricted.
To assist in the resolution of this issue, it has been proposed that the temporal range of sea ice records must be extended beyond the satellite era or reconstruction period (Yang et al., 2021; Fogt et al., 2022), specifically through utilising ship records (Wilkinson, 2014). Within many of these records, there is a wealth of invaluable information regarding meteorological observations. Importantly, such information includes, but is not limited to, the nature and concentration of sea ice from observations around the globe (Wilkinson, 2014). Careful analysis of such information may provide the data necessary to enhance our understanding of the natural variability in the Antarctic sea ice. In recent years, there has been a concerted effort, through projects such as the Climatological Database for the World's Oceans (CLIWOC) and Recovery of Logbooks and International Marine data project (RECLAIM), to recover meteorological data from historical records, which are primarily ship logbooks and meteorological registers (Konnen and Koek, 2005). These records are particularly informative, as they contain daily observations regarding environmental conditions. Owing to projects such as CLIWOC and RECLAIM, it is possible to access data from thousands of historical records dating back to the 18th century, as many have now been digitised, or the data have been extracted and compiled into extensive databases (Konnen and Koek, 2005). Such databases have been made readily available to the general public. There is increasing acknowledgement that extending satellite-derived data through utilising historical records may be beneficial not only in relation to sea ice extent but also for a range of environmental research (Kingsland, 2017).
The focus of this research has therefore been to extract and analyse information regarding sea ice observations in the relatively well-sampled Weddell Sea sector from historical records and ultimately produce estimates for a proxy for SIE, namely the northernmost sea ice limit, during the first half of the 19th century. More specifically, records utilised ship logbooks, meteorological registers, charts and journals recorded from various Antarctic expeditions. Information extracted from these records has been used to estimate sea ice edge position in the Weddell Sea sector during the period 1820–1843 CE. Due to the restriction of sailing-era access to the Southern Ocean to the summer season, estimates will be produced only for months during the austral summer, namely December, January, February and March (DJFM).
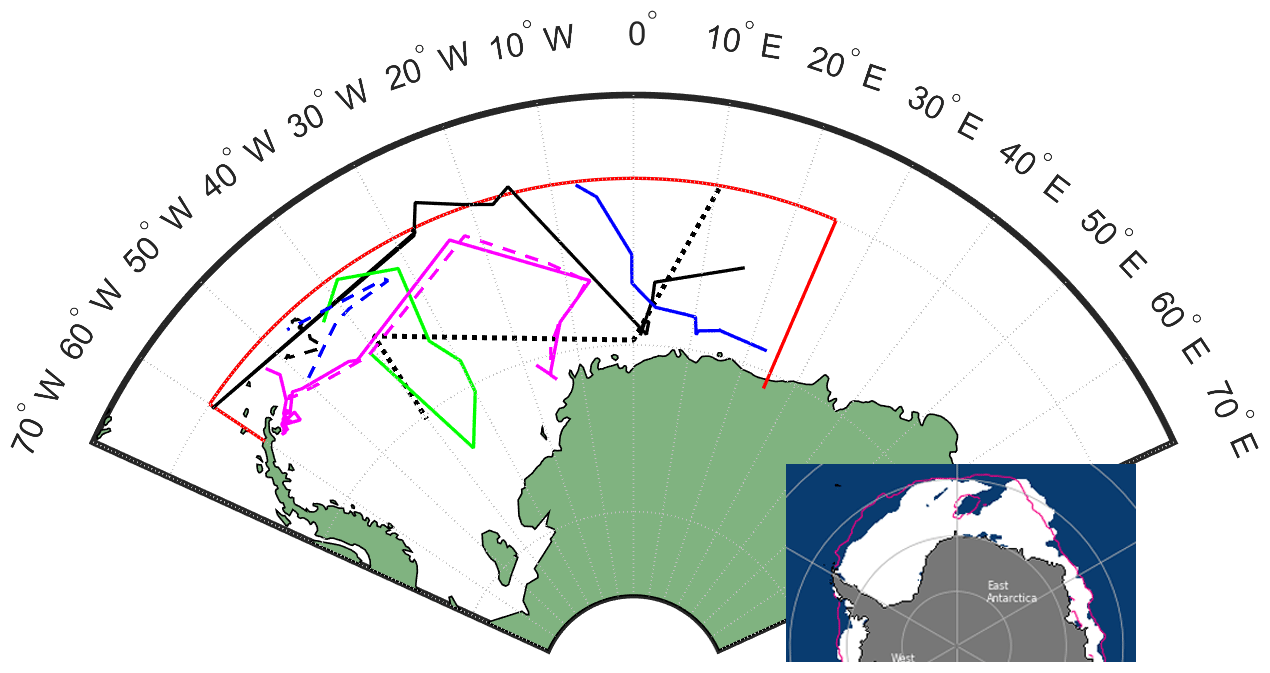
Figure 2Map showing region of interest in the Weddell Sea (outlined by red lines) and the paths of the various vessels whose data are used here. Black and green lines date from the 1820s (solid black – Bellingshausen; dashed black – Powell; dotted black – Morrell; green – Weddell), blue from the 1830s (solid – Biscoe; dashed – Dumont) and magenta from the 1840s (solid – Crozier; dashed – Ross). The inset shows the sea ice extent in December 2022 for context (from National Snow and Ice Data Center monthly sea ice extent animation). Note that the pink line in the inset is the median December sea ice extent over 1981–2010.
The primary aim of this project is to produce reliable estimations of summer northern sea ice limits in the Weddell Sea sector during the early 19th century. This information may be useful in furthering our understanding of recent sea ice trends in the Weddell Sea, specifically regarding how far trends are the result of internal variability or anthropogenic forcing. To complete this aim, the methodology has been partly adapted from work conducted by Edinburgh and Day (2016). Focussing on the Heroic Age of Antarctic exploration (1897–1917), Edinburgh and Day (2016) produced estimates for pan-Antarctic summer sea ice limits.
2.1 Region and time period of study
While the completion of estimates for summer SIE on a pan-Antarctic scale is desirable, it was decided to concentrate on a restricted, but more sampled, area; thus, the Weddell Sea sector (60∘ W–20∘ E, 76–60∘ S) was selected as the region of study, but note that Bellingshausen's route wobbles slightly in and out of the northern limit of this notional study area (Fig. 2). Over the past century, the Weddell Sea has exhibited highly variable sea ice trends, making it of significant interest (Yang et al., 2021; Fogt et al., 2022). In addition, following the early expeditions of explorers such as Cook and Bransfield, routes through which vessels could navigate the treacherous Southern Ocean became well established, particularly within the Weddell Sea. As a result, there exists a wealth of historic records containing data and observations for the Weddell Sea, thus making it an ideal region of study.
Two factors determined the selection of the time period for this project. One was the pre-existing literature, and the other was the availability of historical records that were deemed suitable for this study, according to the project criteria (outlined in Sect. 2.2). Very few studies have examined records from the 18th and early 19th century (Parkinson, 1990; Wu et al., 1999; Martin et al., 2022; Martin, 2023). Given the recent effort to digitise historical marine records, there are now many more available from this time period than there were prior to 2000. Research conducted by Edinburgh and Day (2016) consisted of an analysis of the records from 1897–1917, so here we attempted to extend their work backwards to the first half of the 19th century, namely over 1820–1843 CE. A future study will consider a comparison of this record with those from the first circum-Antarctic navigation of Cook and Furneaux in the 1770s. Modern-day satellite remote sensing data were used for comparison with the historical reconstructions.
2.2 Satellite data
The bootstrap algorithm and satellite-derived sea ice concentration dataset, obtained through the National Snow and Ice Data Center (NSIDC, 2017), was selected for this study. This global dataset comprises daily ice concentration data recorded at a 25 km resolution. Data used in this study were available from 1978–2017. With a dataset of this nature, it is common practice to define the sea ice edge using a threshold of 15 % concentration (Edinburgh and Day, 2016). The selection of this dataset was partly based on a study conducted by Worby and Comiso (2004). Their study highlighted the potential for an offset in sea ice edge position, as recorded by qualified human observers and satellite imagery. As detected via satellite imagery, the sea ice edge position was found to be approximately to the south, relative to in situ observation. The bootstrap algorithm was chosen for this study, as it delivers the greatest consistency between satellite-derived ice edge position and in situ observation (Worby and Comiso, 2004; Edinburgh and Day, 2016). However, it is important to acknowledge any errors that may exist within this dataset; therefore, this offset will be considered following the completion of the statistical analysis.
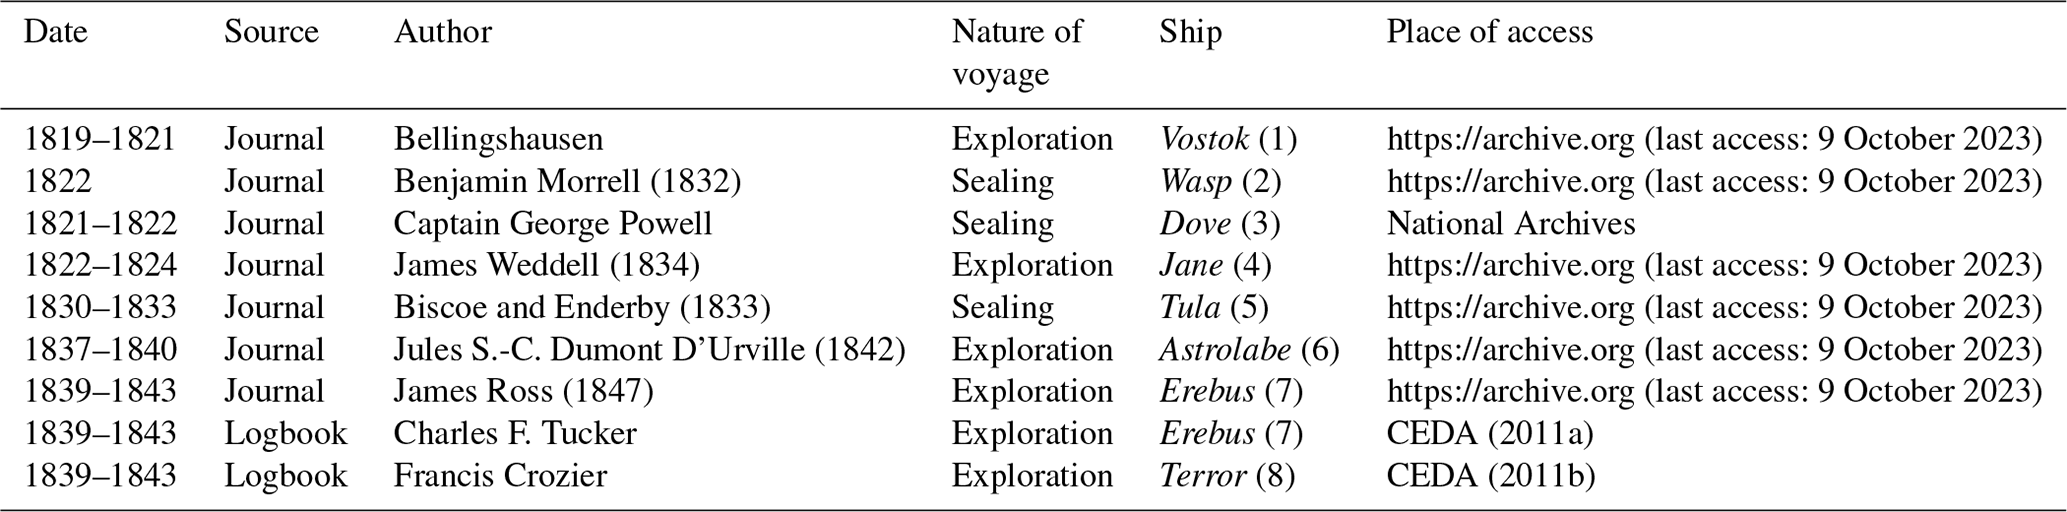
Table 1Details of the historical records used in this study (CEDA, Centre for Environmental Data Analysis). The “Ship” column also includes the expedition number for this study. The Bellingshausen voyage (Debenham, 2010) and the D'Urville voyage (Rosenman, 1987) are available in translation.
2.3 Historical data
A total of nine records from eight Antarctic expeditions have been utilised in this study; the details of each record have been presented in Table 1. Specifically, these records comprise ship logbooks, meteorological registers, charts and journals. These records were selected based on their fitting of five criteria. These criteria are as follows:
-
Records must come from expeditions that took place, at least in part, through the Weddell Sea sector.
-
Records must contain frequent and detailed sea ice observations.
-
Records must contain a regular log of the ship position and time of day. Importantly, the meridian with respect to which ship positions were measured must be clearly stated.
-
Records must be legible in whichever format they are available.
-
Records must be accessible to the general public. In the instance of a record being inaccessible, the relevant authority must have granted permission to this record for the purpose of this study.
Prior to completing any data extraction, some preparatory work was involved. First, the journal kept by Dumont D'Urville aboard the Astrolabe required translating from French to English. A translated account of this journal is available (Rosenman, 1987); however, to include information that may have been omitted in this translated edition, the original journal was also utilised. Then, in analysing historical records, it is important to understand precisely what kind of information is held within each record. Therefore, familiarisation with the format of ship logbooks and meteorological registers, as well as the nautical language typically found in these records, was an important first stage.
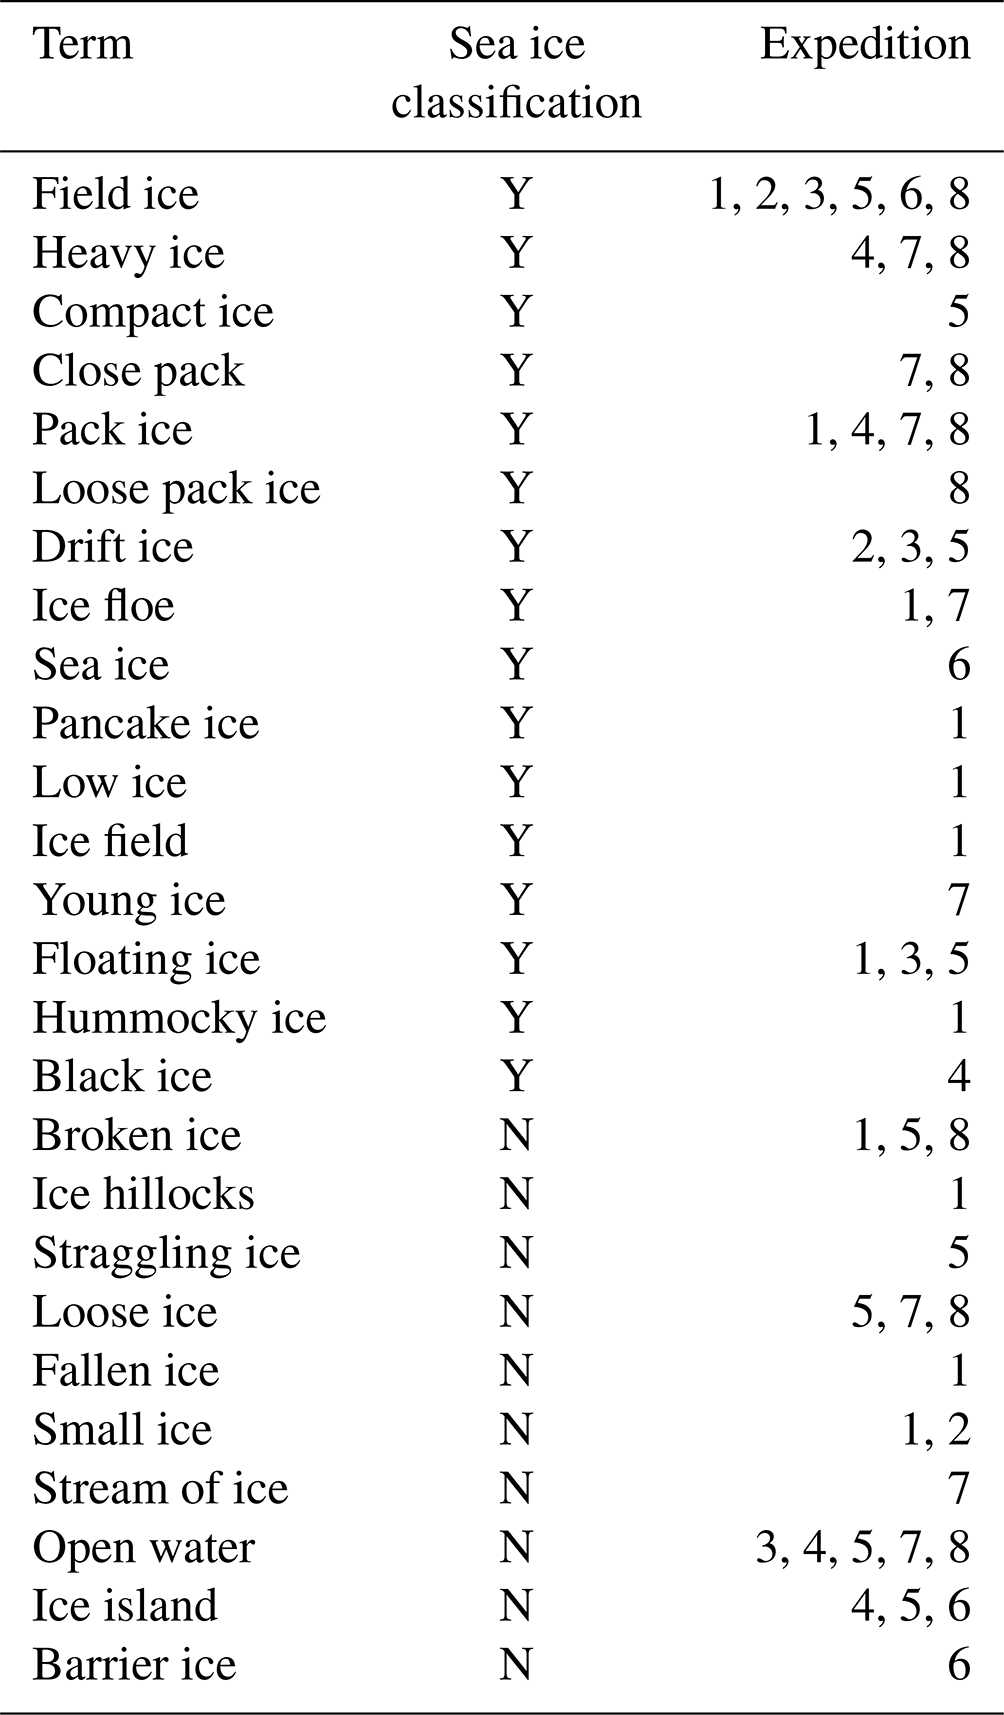
Additionally, prior to extracting information regarding sea ice observations, the various terminology used in each record was analysed and established as being representative of sea ice or not. Within each record, a variety of terms are used in place of sea ice, which was only identified once in one journal account. Interpretation of these various terms can be challenging due to the often ambiguous way in which they are used. However, through context, it was possible to deduce the meaning of different terms and thus distinguish between observations relating to sea ice and other ice forms, such as icebergs or shelf ice. In cases where the meaning can be clearly deduced, the term has been allocated its relevant meaning (“sea ice” or “not sea ice”). A list of these terms and their classification is presented in Table 2. It should be noted that where the use of a term was ambiguous, it was classified as “not sea ice” to keep errors to a minimum.
Table 2Terms identified in historic records and their classification as representing sea ice or not. Y is for yes (sea ice), and N is for no (not sea ice). The “Expedition” column in this table refers to the expedition from which records containing each terminology originated; these are labelled from 1–8 (see Table 1 for the key).
A sea ice index was created using the data extracted from each historical record. The aim of the index was to collate relevant sea ice information from each record and ultimately produce a set of summer sea ice edge position data points to be used for statistical analysis, as will be outlined in Sect. 2.5. From each record in which a sea ice observation was logged, five key points were noted.
These points are as follows:
-
the time of day (usually noon) and ship's position at the time of the observation;
-
the calendar date on which the observation was made;
-
a detailed description of the sea ice observed;
-
the term(s) used to represent sea ice in the observation; and
-
any remarks made by the author that compared their observations of sea ice with observations made on previous expeditions.
Following the data extraction, it was necessary to make certain adjustments to make the data uniform and improve data accuracy. First, longitudes logged on board the Astrolabe were done so with respect to the Paris meridian, whereas all other longitudes were measured with respect to the Greenwich meridian. The Paris meridian is located approximately 2∘20′14′′ E of the Greenwich meridian; therefore, all longitudes measured from the Astrolabe were adjusted accordingly.
Next, the method of recording ship position was noted upon analysing each record. It is important to know exactly how ship positions were recorded so as to estimate the accuracy with which this was done. For example, it is well established that where the method of dead reckoning has been used, there are likely to be significant errors in the recorded longitude (Jackson et al., 2000). However, it was established that each ship position included in the sea ice index was recorded using a chronometer, which is generally a very accurate instrument and capable of leading to longitude estimates with an error of 6–19 km (Sobel, 1996). To validate the accuracy of these positions, each route was divided into “legs”, with each leg comprising a section of the route between landmarks (for which an estimated position was always noted). Then, using a British Antarctic Survey digital map of the Antarctic region, each landmark's true latitudinal and longitudinal positions were ascertained and compared to those indicated in the historical record. Where there were inaccuracies, positions along the next leg of the route were adjusted accordingly. Perhaps surprisingly, the majority of positions were very accurate, meaning that the routes needed minimal adjustment. The only route that required significant adjustment was that of the ship Tula.
Following these adjustments, the data regarding sea ice observations were compiled to create the sea ice index and a set of 173 summer sea ice position data points. Of these data points, 76 were subsequently used for statistical analysis. Only data points relating to explicit sea ice observations were used for analysis. The full index is stored at the UK Polar Data Centre at https://doi.org/10.5285/53000D3B-3069-494B-8FA9-F9C7504CAE25 (Love and Bigg, 2023). It is worth noting here that the sea ice positions recorded from ship are invariably northernmost ice edges and do not contain information about potential open water or polynyas further south in the Weddell Sea at the time of any specific observation. The Weddell Sea is well known now to have such open-water regions within the sea ice extremes (e.g. see Martin et al., 2022, for a recent example and the inset in Fig. 2), but the early explorers were unaware of this and assumed that reaching sea ice pack stopped any further poleward travel.
Limitations of the ship observations
One limitation is that journal accounts contain misinformation. One journal examined for this study, that of Benjamin Morrell, who captained the Wasp, has been highlighted for containing inaccurate information (Stommel, 2017). Specifically, it is believed that Morrell embellished accounts of his Antarctic expedition in relation to observations of land sightings and the most southerly latitude to which the Wasp was able to sail (Stommel, 2017). Data were extracted from Morrell's journal for use in this study, yet discrepancies over the accuracy of this record call into question the reliability of the data. Examining multiple records from the same expedition may be a way to validate data to an extent, or studying a period during which several expeditions occurred is another way to validate the information. The journal accounts of James Ross, Jules Dumont D'Urville, Thaddeus Bellingshausen and James Weddell all contain details of specific locations whereby the track of their vessel has crossed the path of a previous expedition, and often comparisons were made regarding sea ice observations. Yet it is not always possible to do this. An additional source of error is the risk of misinterpretation or misreading of information within original historical records or the uncertainty of whether observations referred to sea ice or something else. However, these issues have been kept in mind during data processing.
2.4 Route reconstructions
As outlined above, each record utilised in this study contains specific information regarding the time of day, latitude and longitude, which are noted at regular intervals. It is therefore possible, using this information, to reconstruct each route taken through the Weddell Sea. To complete this task, each ship position falling within the Weddell Sea sector was logged in each historical record, and adjustments were made where necessary, as outlined in Sect. 2.3. Using Google Maps, each route was then delineated onto a basemap using the mapping tool. Within many of the historical records were original sketches of the expedition route with corresponding values for latitude and longitude. Therefore, these maps were used, where possible, to validate the route reconstructions. The reconstruction of the routes of the eight voyages is shown in Fig. 2.
2.5 Sea ice edge latitude analysis
The initial requirement of this work was to produce estimates for summer sea ice edge position across the Weddell Sea sector, according to the month and decade of the 19th century (1820–1843) time series. These positions were then compared to those from the recent satellite (1987–2017) time series and the early 20th century time series comprising data obtained from Edinburgh and Day (2016). The methodology associated with estimating summer sea ice edge position, as adapted from that developed by Edinburgh and Day (2016), comprises three key stages. The three stages are as follows:
-
obtaining relevant satellite-derived data;
-
isolating satellite data points for the paired analysis; and
-
paired analysis.
2.5.1 Stage 1
The satellite-derived sea ice concentration dataset comprised global daily sea ice concentration data extracted for the Weddell Sea sector. For each day of the time series, the average ice edge position was calculated, and defined as the contour connecting the northernmost pixels, with a sea ice concentration below 15 %. Each pixel represents an area of 25 km2; however, to reduce the number of latitudinal data points that comprised each contour, the data were averaged over 2∘ longitude bands across the Weddell Sea.
2.5.2 Stage 2
In order to conduct the paired analysis, a number of stages was first required. For each historical ship-observed sea ice position, a satellite-derived sea ice edge latitude value for the corresponding day for each year within the satellite time series was obtained. This involved checking, for each longitude value and taking into account the sphericity of the Earth, the distance to the ship-observed position and selecting the point closest in geographical distance for that specific day. The latitude with the smallest distance from the ship-observed position was thus identified. The result was a set of 30 latitudinal points (as the satellite time series spans 30 years) corresponding to each ship-observed position. At the end of this stage, a set of satellite-derived ice edge latitudes had been calculated, corresponding to the relevant position and time of year, of each of the 76 historical ship-observed positions. These sets of latitudinal values were then used for the paired analysis, as will be outlined next.
2.5.3 Stage 3
The final stage was to conduct paired analysis between the historical ship-observed ice edge positions and each of their corresponding 30 satellite-derived ice edge positions. The Wilcoxon-signed rank test was the selected form of statistical testing, as this does not assume a normal distribution of the data and allows for a comparison of the means within each dataset. Ultimately, each ship-observed position was analysed against its 30 satellite-derived ice edge latitude points. The 30 results were then averaged for each ship-observed position and grouped by the decade and month of the study period.
Taking the same approach, data from the 19th century time series were also compared to data obtained from Edinburgh and Day (2016) for the Weddell Sea sector. Edinburgh and Day (2016) completed pan-Antarctic estimates for summer sea ice edge latitudes during the period 1897–1917; therefore, their dataset for only the Weddell Sea is fairly limited. Specifically, the dataset comprises 15 ship-observed data points, and they possess no data for sea ice observations during December or January. Despite this, a comparison between the time periods allows for a more holistic examination of summer sea ice trends.
2.6 Sea ice extent analysis
An estimate of the Weddell Sea SIE was also made from the historical ship observations. For each historical ship observation, the mean sea ice edge latitude difference – calculated from the paired analysis – was assumed to occur across the mean sea ice edge boundary of the Weddell basin for that day of the year, leading to a first-order estimate for the change in SIE between the modern era and the date of each ship-observed sea ice position. By combining the values for each month, or each decade, first-order estimates of mean SIE change between the early 19th century and today can be calculated.
Table 3Paired analysis results comparing the summer ice edge latitudes (IEL) between the relevant days from the modern, satellite, time series and each decade of the 19th century time series. In the “Mean difference” row, positive numbers represent degrees north from today, and values significant at the 95 % level are indicated in bold.
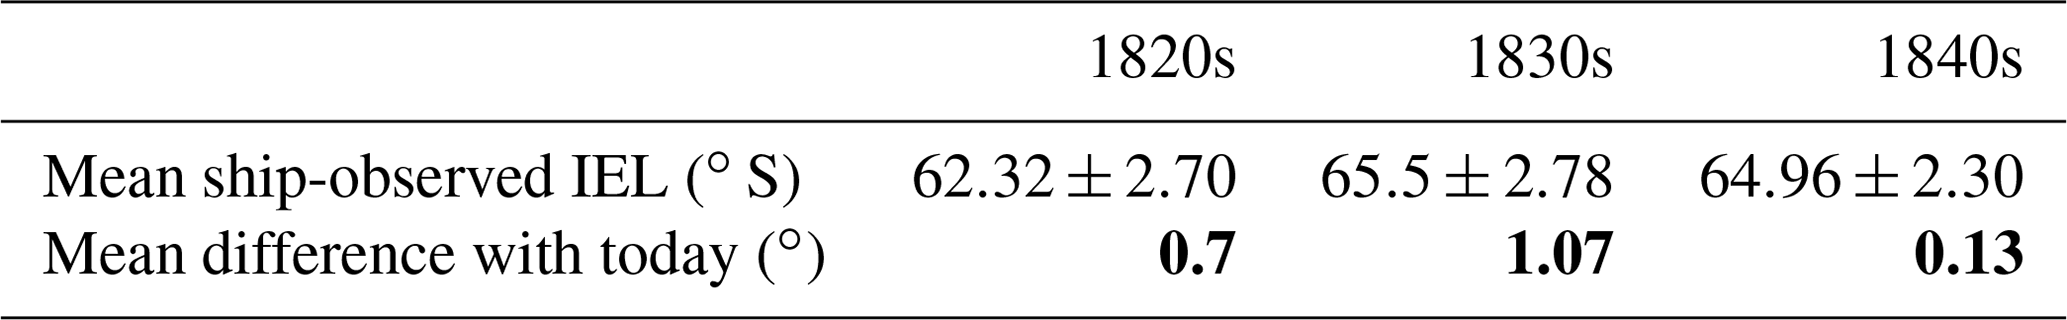
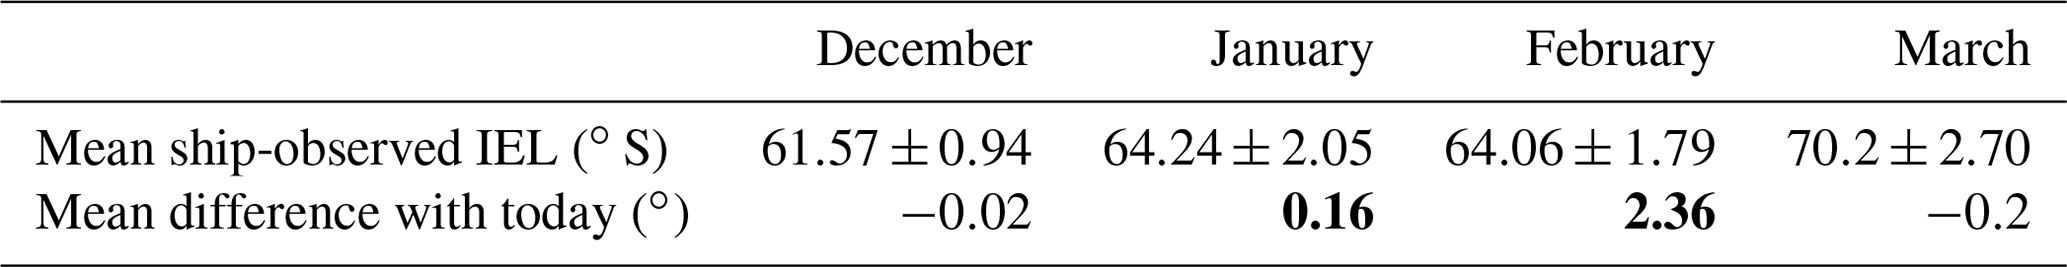
Table 4Paired analysis results comparing summer ice edge latitudes between the modern time series and each month of the 19th century time series. In the “Mean difference” row, positive numbers represent degrees north from today, and values significant at the 95 % level are indicated in bold.
3.1 Data available per month and decade
The highest numbers of ice edge positions were recorded during January (43 values), followed by February (16 values), and then December (11 values), and the lowest number of positions was recorded during March (6 values). Figure 3 presents the number of observations made per decade, including the number of those observations recorded during each given month. The highest number of ship-observed ice edge positions was recorded during the 1840s (47 values), including observations from January, February and March. During the 1820s, 21 positions were recorded, including observations from all months. Finally, the lowest number of ship-observed positions was recorded during the 1830s (eight values), including observations from January and February only.
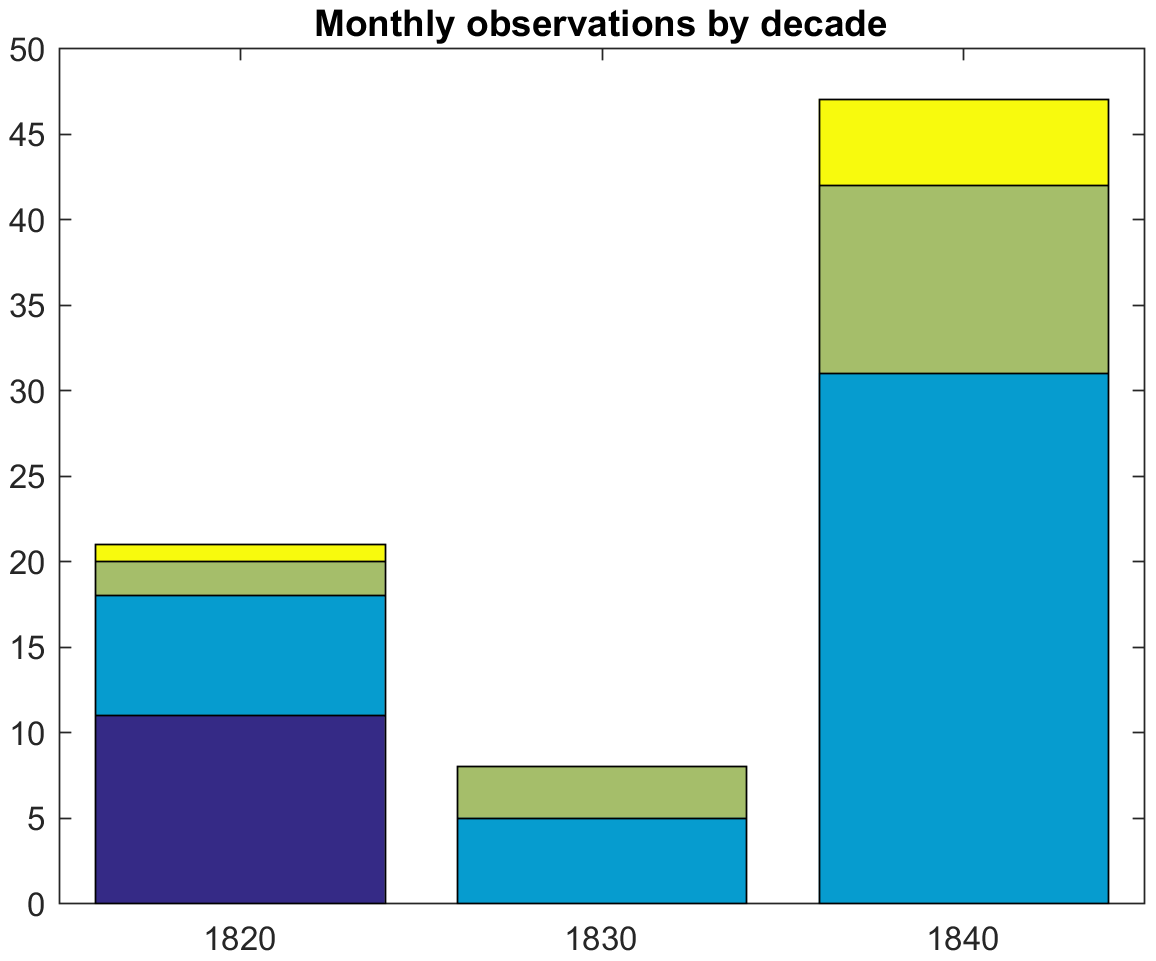
Figure 3The 19th century monthly observations by decade and month (December – dark blue; January – light blue; February – green; March – yellow).
3.2 Sea ice edge comparison: 1820–1843 with modern
Table 3 and Fig. 4 present the results of the paired analysis for a comparison of the summer sea ice edge position between the 19th century and modern time series for each decade. Table 3 shows that, on average, the summer ice edge position was further north in each decade of the 19th century time series relative to today. All results were significant at the 95 % confidence level. The greatest difference in the summer ice edge latitude between the two time series occurred during the 1830s, although there were far fewer observations in that decade. Figure 4 illustrates the position of each ship-observed ice edge point in relation to the average satellite-derived ice edge position. Mostly, the ship-observed ice edge data points fall north of the satellite-derived ice edge as expected, given the paired analysis results (Table 3). However, this is not consistently so for either decade or longitude, so it is instructive to examine the monthly comparisons to explore the historical contrast further.
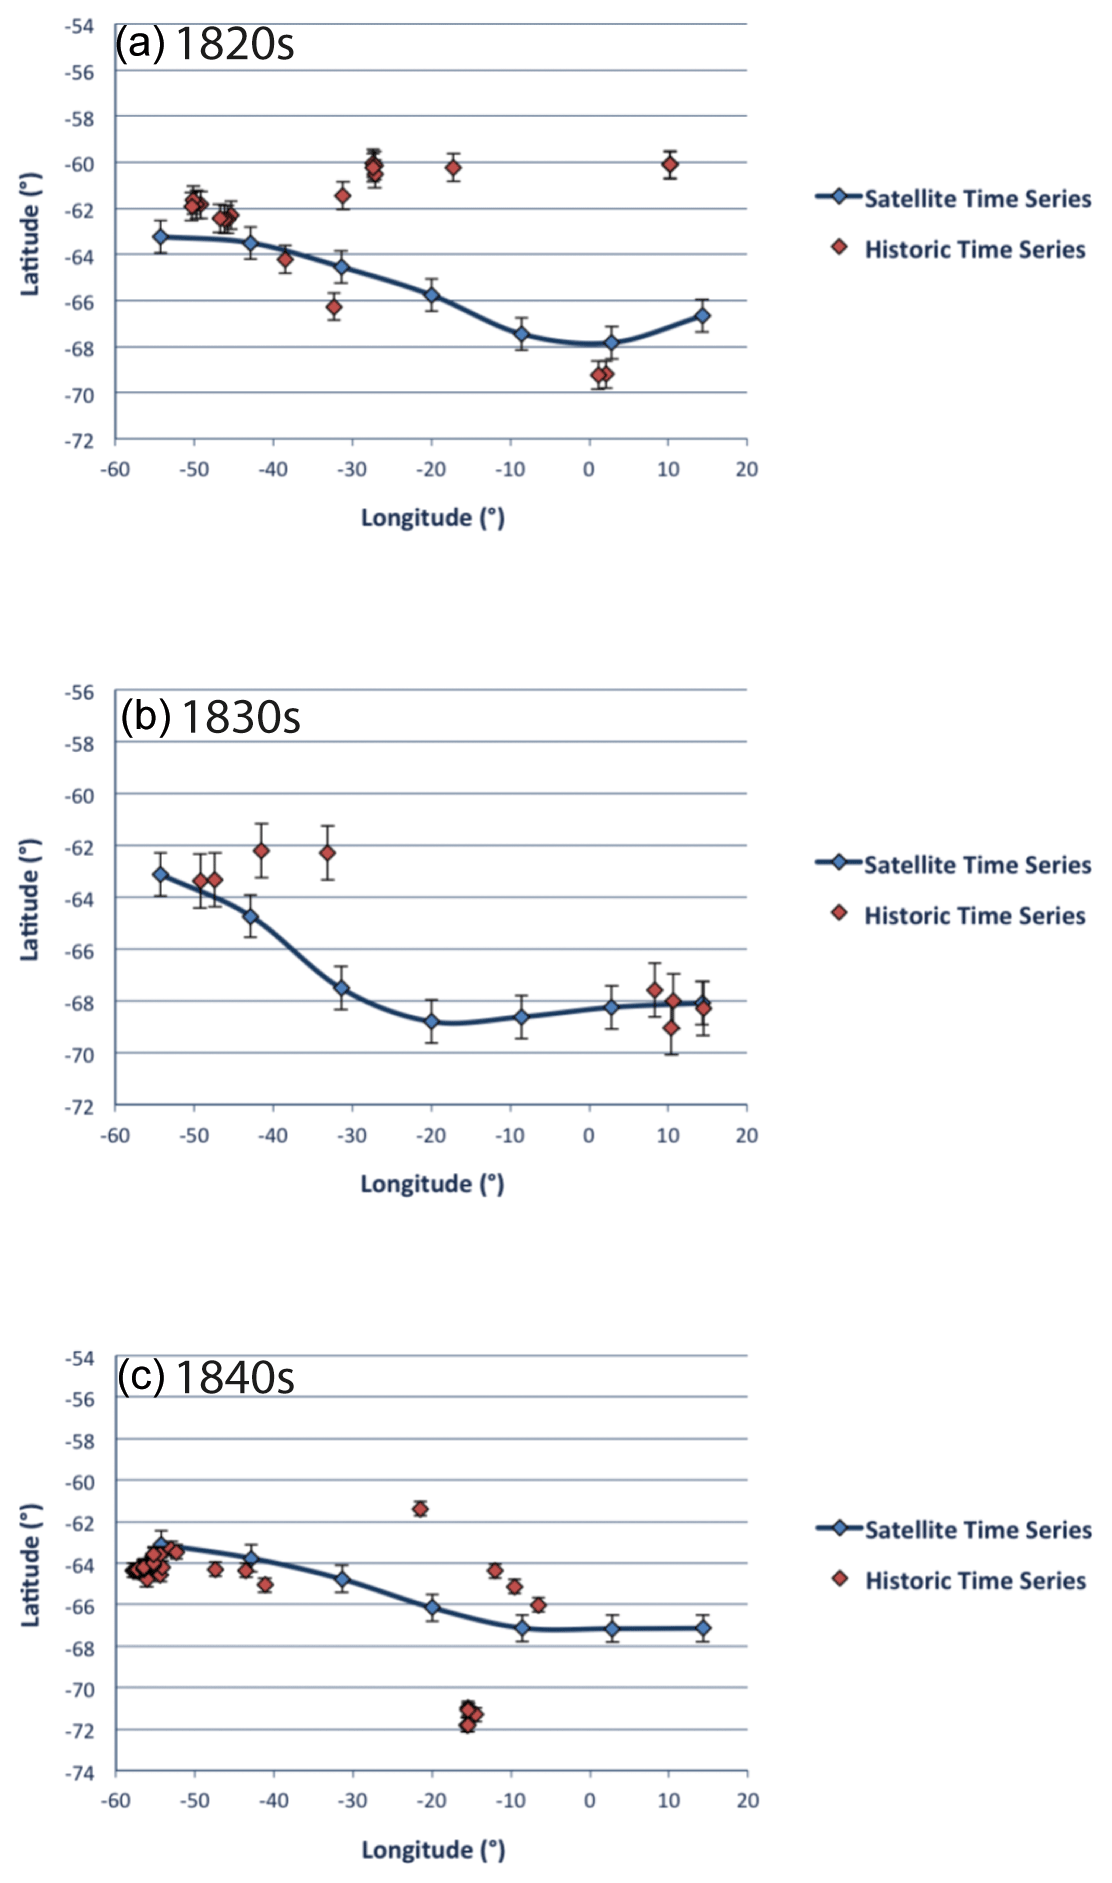
Figure 4Decadal comparison of satellite time series with 19th century data, namely the (a) 1820s, (b) 1830s and (c) 1840s. Satellite data error bars show standard deviation for sea ice latitude at times of the year with 19th century data. Historic data error bars give an estimate of the relative accuracy of latitude location each decade.
Table 4 and Fig. 5 present the results of the paired analysis for a comparison of summer sea ice edge position between the satellite and historical time series for each month of the historical time series (DJFM). Results in Table 4 show that during December and March the 19th century ice edge latitude was essentially similar to that of the modern time series across the Weddell Sea. However, during January and February, the ice edge in the 19th century time series was further north by a statistically significant 0.16 and 2.36∘, respectively. However, Fig. 5 shows that the ship-observed ice edge data points that fall north of the satellite-derived ice edge in January and February are essentially from the central part of the Weddell Sea rather than its western or eastern peripheries, meaning that in the core Weddell Sea the sea ice melted much slower in the 19th century decades than today.
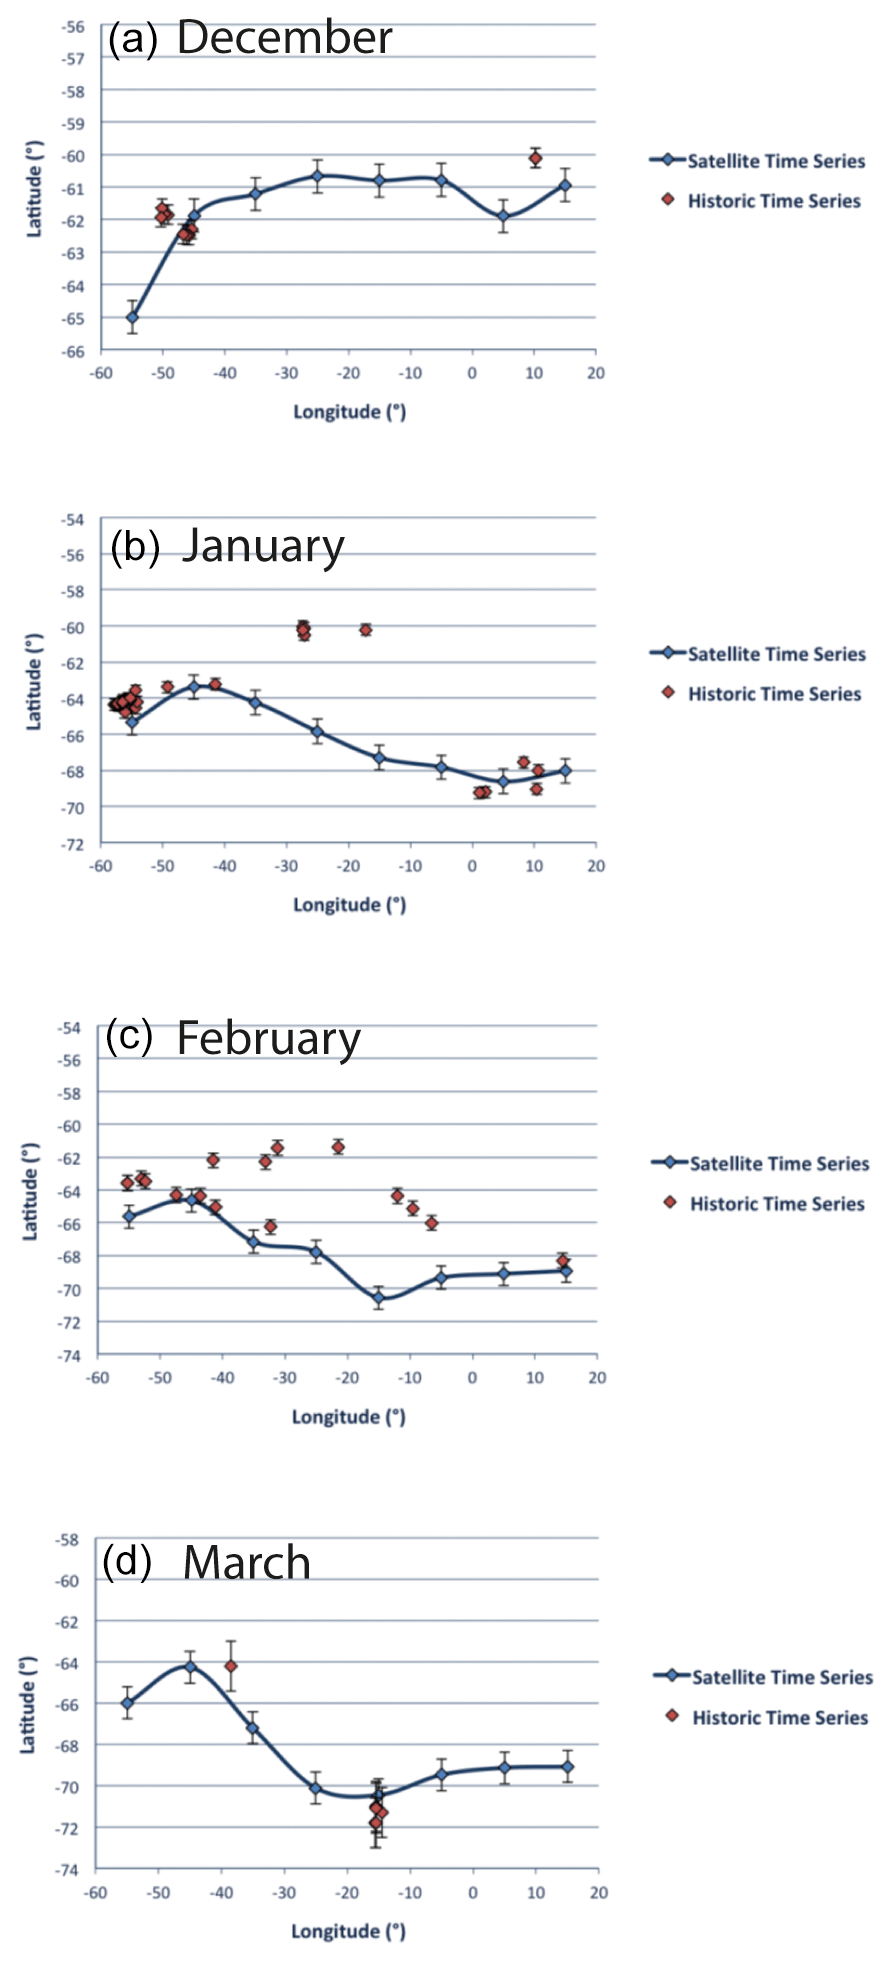
Figure 5Monthly comparison of satellite time series with 19th century data for (a) December, (b) January, (c) February and (d) March. Satellite data error bars show the standard deviation for sea ice latitude at times of the year with 19th century data. Historic data error bars give an estimate of the relative accuracy of the latitude location for each decade.
Table 5Paired analysis results comparing the summer ice edge latitudes during the months of February and March between the 19th and 20th century time series. In the “Mean difference” row, positive numbers represent the degrees north from the Heroic Age (1897–1917).
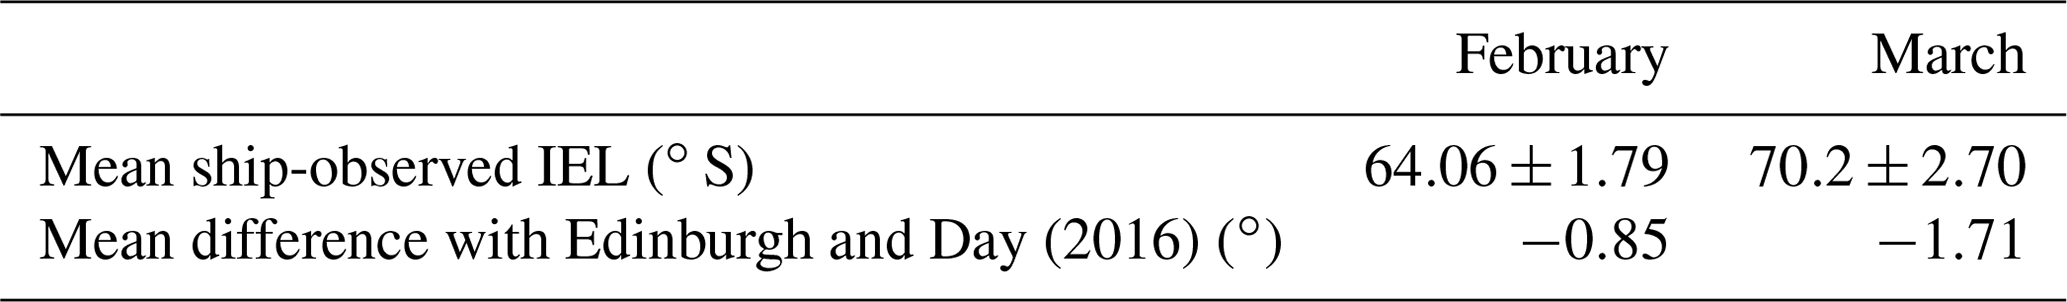
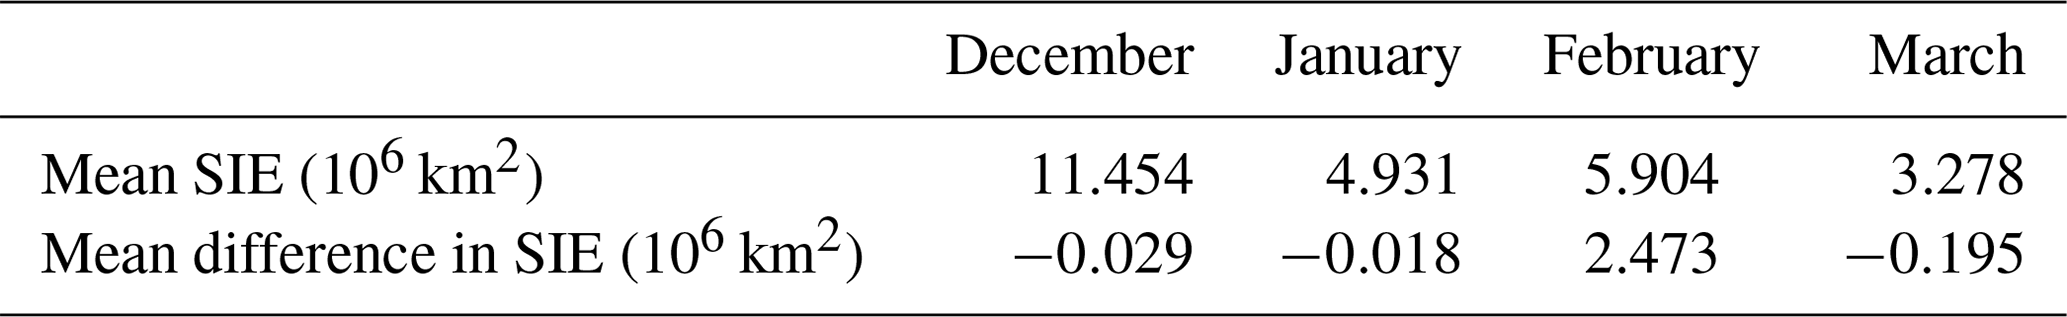
Table 6Sea ice extent estimations for each month of the 19th century time series. Also presented are estimated differences between these values and sea ice extent averaged over the satellite period.
3.3 Sea ice edge comparison: 1820–1843 with 1897–1917
There is a limited amount of ship-observed sea ice latitude data from the Weddell Sea in the Heroic Age, and it is from only 3 years, some of which may have been exceptionally ice-heavy due to a simultaneous El Niño event (Edinburgh and Day, 2016). However, Edinburgh and Day (2016) found the Weddell Sea sector sea ice to be significantly further north than during the satellite era; this is also the case when comparing with the observations considered here. Only the months of February and March have sufficient data to be comparable, but the Heroic Age sea ice latitude is significantly further north than either the 1820s–1840s or the modern era (Table 5).
3.4 Sea ice extent comparison: 1820–1843 with modern era
The sea ice extent (SIE) estimates presented here, whose methodology was explained in Sect. 2.6, are approximate and rely on local, 1 d differences being representative of that day for the whole Weddell Sea sector. However, they are generally consistent with the sea ice edge latitude analysis. For the months of December–March, only the relatively well-observed month of February had a 19th century SIE greater than today's mean, while the other 19th century summer months had a similar SIE to today (Table 6). Nevertheless, all 3 decades of the 19th century time series had marginally to significantly greater SIEs, on average, than today (Table 7).
Table 7Sea ice extent estimations for each decade of the 19th century time series. Also presented are estimated differences between these values and sea ice extent averaged over the satellite period.
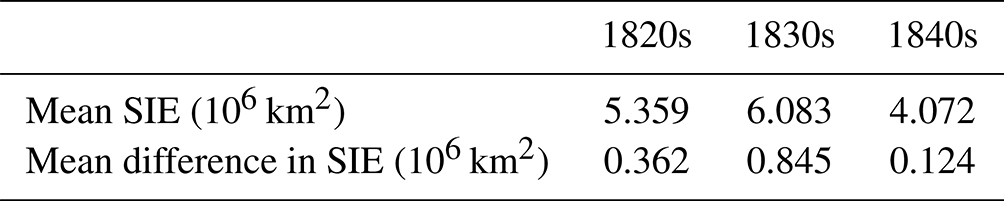
The paired analysis of Sect. 3.2 indicates that, per decade, all ice edge latitudes were further north during the 19th century, relative to the satellite era. However, Table 3 suggests the 1820s had more extensive sea ice than either of the other decades studied. Furthermore, the inclusion of the Worby and Comiso (2004) offset does not impact the outcome of these results; i.e. on average, the summer sea ice edge position remains further north in the 19th century series relative to the satellite-era time series.
Interestingly, the mean satellite-derived ice edge latitudes display a similar decadal trend, as the difference between ship-observed and satellite ice edges remains roughly the same over time. Between satellite data corresponding to data from the 1820s and that corresponding to the 1830s, there is a retreat of the ice edge latitude of 3.55∘. Between satellite data corresponding to data from the 1830s and that corresponding to the 1840s, there is an advance in ice edge latitude of 1.48∘. It should be kept in mind that, when conducting this analysis, only values from the satellite-derived dataset from days corresponding to historical observations were included. It is perhaps also important to note that within the historical dataset, ship-observed ice edge values during the 1830s were only recorded during January and February. Within the austral summer, the greatest retreats in ice edge would be expected to occur during these months, particularly in February (Turner et al., 2013). However, Table 4 suggests the largest sea ice retreat in the first half of the 19th century occurs in the late austral summer, with March showing the furthest south ship-observed sea ice latitude. It needs to be noted, however, that the lowest number of ship-observed data points was obtained during March (Fig. 5), although these match well the satellite-era sea ice positions near the few observed longitudes.
Our comparison with the limited Weddell Sea Heroic Age data suggested that the 19th century ice edge latitude was further south during both February and March, which are the 2 months with Heroic Age data. Variability on quasi-quadrennial to interdecadal scales is typical within the Weddell Sea (Gloersen et al., 1993); therefore, these comparisons over almost 200 years, from the 1820s through 1900 to the 2010s, do not indicate any clear trend from the underlying inherent decadal variability.
Today, the minimum SIE is typically observed in February (Turner et al., 2013). However, the monthly average SIE estimates produced in this study show the smallest 19th century monthly extent to occur during March, with the February estimate (Table 6) being anomalously high. It is difficult to interpret this result without obtaining additional data to validate the estimation, particularly as there are relatively few February and March observations (Fig. 3). This being said, a number of studies has demonstrated monthly variability SIE on a range of broader temporal scales. Parkinson (1992) and Morioka et al. (2017) have demonstrated interannual monthly variability in SIE. De Santis et al. (2017) demonstrated interdecadal monthly variability in SIE. Furthermore, Turner et al. (2013) identified an increase in SIE during February and March in model simulations run with historical forcing (1850s–2005). Thus, the 19th century average SIE may simply be part of the variability in monthly average SIE on broader temporal scales.
This analysis has shown that while the period 1820–1843 experienced relatively more sea ice in the Weddell Sea than in the satellite era, the general tendency for Weddell Sea summer sea ice extent over the last 200 years is dominated by decadal variability, with other periods likely experiencing even more sea ice than the first half of the 19th century (Table 5). This is consistent with several other studies of the 20th century alone (Murphy et al., 2014; Yang et al., 2021; Fogt et al., 2022). Nevertheless, both Edinburgh and Day (2016), in their study of the Heroic Age and the present 19th century study, suggest that the seasonal sea ice minimum formerly occurred later in the austral summer compared to today.
There are limitations in this analysis, as has been discussed in Sects. 2 and 3, that are principally related to the interpretation of the journal entries and more particularly to the limited, and seasonally varying, number of ship observations of sea ice edge. Much relies on using the modern record for the days of the year actually observed in the Weddell Sea in 1820–1843. Nevertheless, the often statistically significant results and the consistency with the decadal variability tendency shown by other studies give confidence in the primary outcome of the analysis of a more extensive Weddell Sea sea ice cover in the 19th century and a later seasonal minimum when compared to today. Further study will be made in future of the pan-Antarctic voyages in order to give general Southern Ocean sea ice reconstructions of the period.
The full dataset of transcribed 19th century documentary references in the source logbooks and journals is available through the UK Polar Data Centre at https://doi.org/10.5285/53000D3B-3069-494B-8FA9-F9C7504CAE25 (Love and Bigg, 2023).
The document transcribing and statistical analysis were carried out by EL, under the supervision of GRB, for a dissertation as part of EL's master's degree in geography. The text was written by both EL and GRB, with the diagrams and tables used in the paper prepared by GRB.
The contact author has declared that neither of the authors has any competing interests.
Publisher's note: Copernicus Publications remains neutral with regard to jurisdictional claims in published maps and institutional affiliations.
The authors thank Théo Michelot for his help in translating the journal of Dumont D'Urville. The authors would also like to acknowledge the Bartlett Library at the Royal Maritime Museum, Falmouth, UK, for generously donating the use of their microfilm reader and for their support in enabling an international library loan with the New Bedford Whaling Museum, New Bedford, Massachusetts, USA. Much of this work formed the master's dissertation of Eleanor Love.
This research has been supported by the Leverhulme Trust (grant no. EM-2022-042).
This paper was edited by Irina Rogozhina and reviewed by Seelye Martin and one anonymous referee.
Biscoe, J. and Enderby, M.: Recent discoveries in the Antarctic Ocean, https://archive.org/details/jstor-1797601 (last access: 9 October 2023), 1833.
CEDA: HMS Erebus ship logbook, http://data.ceda.ac.uk/badc/corral/images/metobs/ (last access: 9 October 2023), 2011a.
CEDA: HMS Terror ship logbook, http://data.ceda.ac.uk/badc/corral/images/metobs/ (last access: 9 October 2023), 2011b.
Chen, J.-L., Kang, S.-C., Meng, X.-H., and You, Q.-L.: Assessments of the Arctic amplification and the changes in the Arctic sea surface, Adv. Clim. Change Res., 10, 193–202, https://doi.org/10.1016/j.accre.2020.03.002, 2019.
Debenham, F. X.: The voyage of Captain Bellingshausen to the Antarctic Seas, 1819–21, https://books.google.co.uk/books?id=pnWncQAACAAJ&dq=the+voyage+of+captain+bellingshausen+to+the+antarctic+seas&hl=en&sa=X&ved=0ahUKEwjnr9Sq39rYAhXJJcAKHXbdBOIQ6AEINzAD (last access: 9 October 2023), 2010.
De Santis, A., Maier, E., Gomez, R., and Gonzalez, I.: Antarctica, 1979–2016 sea ice extent: total versus regional trends, anomalies, and correlation with climatological variables, Int. J. Remote Sens., 38, 7566–7584, https://doi.org/10.1080/01431161.2017.1363440, 2017.
Dumont D'Urville, J. S.-C.: Voyage au pol sud dans l'Océanie sur les corvettes l'Astrolabe et la Zélée, https://archive.org/details/Voyageaupolesudc1Dumo (last access: 9 October 2023), 1842.
Edinburgh, T. and Day, J. J.: Estimating the extent of Antarctic summer sea ice during the Heroic Age of Antarctic Exploration, The Cryosphere, 10, 2721–2730, https://doi.org/10.5194/tc-10-2721-2016, 2016.
Fogt, R. L., Sleinkofer, A. M., Raphael, M. N., and Handcock, M. S.: A regime shift in seasonal total Antarctic sea ice extent in the twentieth century, Nat. Clim. Change, 12, 54–62, https://doi.org/10.1038/s41558-021-01254-9, 2022.
Fox-Kemper, B., Hewitt, H. T., Xiao, C., Aðalgeirsdóttir, G., Drijfhout, S. S., Edwards, T. L., Golledge, N. R., Hemer, M., Kopp, R. E., Krinner, G., Mix, A., Notz, D., Nowicki, S., Nurhati, I. S., Ruiz, L., Sallée, J.-B., Slangen, A. B. A., and Yu, Y.: Ocean, Cryosphere and Sea Level Change, in: Climate Change 2021: The Physical Science Basis, Contribution of Working Group I to the Sixth Assessment Report of the Intergovernmental Panel on Climate Change, edited by: Masson-Delmotte, V., Zhai, P., Pirani, A., Connors, S. L., Péan, C., Berger, S., Caud, N., Chen, Y., Goldfarb, L., Gomis, M. I., Huang, M., Leitzell, K., Lonnoy, E., Matthews, J. B. R., Maycock, T. K., Waterfield, T., Yelekçi, O., Yu, R., and Zhou, B., Cambridge University Press, Cambridge, UK, 1211–1362, https://doi.org/10.1017/9781009157896.011, 2021.
Gloersen, P., Campbell, W. J., Cavalieri, D. J., Comiso, J. C., Parkinson, C. L., and Zwally, H. J.: Satellite passive microwave observations and analysis of Arctic and Antarctic sea ice, 1978–1987, Ann. Glaciol., 17, 149–154, https://doi.org/10.3189/S0260305500012751, 1993.
Herzfeld, U. C., Hunke, E. C., McDonald, B. W., and Wallin, B. F.: Sea ice deformation in Fram Strait – comparison of CICE simulations with analysis and classification of airborne remote-sensing data, Cold Reg. Sci. Technol., 117, 19–33, https://doi.org/10.1016/j.coldregions.2015.05.001, 2015.
Jackson, A., Jonkers, A. R. T., and Walker, M. R.: Four centuries of geomagnetic secular variation from historical records, Philos. T. Roy. Soc. Lond. A, 358, 957–990, https://doi.org/10.1098/rsta.2000.0569, 2000.
Kingsland, S.: The importance of history and historical records for understanding the Anthropocene, Bull. Ecol. Soc. Am., 98, 64–71, https://doi.org/10.1002/bes2.1296, 2017.
Konnen, G. P. and Koek, F. B.: Description of the CLIWOC database, Climatic Change, 73, 117–130, https://doi.org/10.1007/s10584-005-6946-4, 2005.
Landrum, L. L., Holland, M. M., Raphael, M. N. and Polvani, L. M.: Stratospheric ozone depletion: An unlikely driver of the regional trends in Antarctic sea ice in Austral fall in the late Twentieth Century, Geophys. Res. Lett., 44, 11062–11070, https://doi.org/10.1002/2017GL075618, 2017.
Li, S., Cai, W., and Wu, L.: Attenuated interannual variability of austral winter Antarctic sea ice over recent decades, Geophys. Res. Lett., 47, e2020GL090590, https://doi.org/10.1029/2020GL090590, 2020.
Love, E. and Bigg, G. R.: Documentary extracts from journals of Weddell Sea voyages, 1820–1843 (Version 1.0), NERC EDS UK Polar Data Centre [data set], https://doi.org/10.5285/53000D3B-3069-494B-8FA9-F9C7504CAE25, 2023.
Martin S.: The 1789 Christmas Eve collision of the HMS Guardian with an iceberg in the southwest Indian Ocean, Ann. Glaciol., https://doi.org/10.1017/aog.2023.8, in press, 2023.
Martin, S., Long, D. G., and Schodlok, M. P.: Comparison of Antarctic iceberg observations by Cook in 1772–75, Halley in 1700, Bouvet in 1739 and Riou in 1789 with modern data, J. Glaciol., 69, 911–918, https://doi.org/10.1017/jog.2022.111, 2022.
Morioka, Y., Engelbrecht, F., and Behera, S. K.: Role of Weddell Sea ice in South Atlantic atmospheric variability, Clim. Res., 74, 171–184, https://doi.org/10.3354/cr01495, 2017.
Morrell, B.: A narrative of four voyages to the South Sea, https://archive.org/details/anarrativefourv00morrgoog (last access: 9 October 2023), 1832.
Murphy, E. J., Clarke, A., Abram, N. J., and Turner, J.: Variability of sea-ice in the northern Weddell Sea during the 20th Century, J. Geophys. Res.-Oceans, 119, 4549–4572, https://doi.org/10.1002/2013JC009511, 2014.
NSIDC: Satellite derived sea ice extent data, https://nsidc.org/data/nsidc-0051/versions/2 (last access: 9 October 2023), 2017.
Parkinson, C. L.: Search for the Little Ice Age in Southern Ocean sea-ice records, Ann. Glaciol., 14, 221–225, https://doi.org/10.3189/S0260305500008624, 1990.
Parkinson, C. L.: Interannual variability of monthly Southern Ocean sea ice distributions, J. Geophys. Res.-Oceans, 97, 5349–5363, https://doi.org/10.1029/92JC00153, 1992.
Parkinson, C. L. and DiGirolamo, N. E.: New visualisations highlight new information on the contrasting Arctic and Antarctic se-ice trends since the late 1970's, Remot Sens. Environ., 183, 198–204, https://doi.org/10.1016/j.rse.2016.05.020, 2016.
Parkinson, C. L. and DiGirolamo, N. E.: Sea ice extents continue to set new records: Arctic, Antarctic, and global results, Remote Sens. Environ., 267, 112753, https://doi.org/10.1016/j.rse.2021.112753, 2021.
Parmentier, F-J. W., Christensen, T. R., Rysgaard, S., Bendtsen, J., Glud, R. N., Else, B., Huissteden, J. V., Sachs, T., Vonk, J. E., and Sejr, M. K.: A synthesis of the Arctic terrestrial and marine carbon cycles under pressure from a dwindling Cryosphere, Ambio, 46, 53–69, https://doi.org/10.1007/s13280-016-0872-8, 2017.
Polvani, L. M. and Smith, K. L.: Can natural variability explain observed Antarctic sea ice trends? New modelling evidence from CMIP5, Geophys. Res. Lett., 40, 3195–3199, https://doi.org/10.1002/grl.50578, 2013.
Riihelä, A., Bright, R. M., and Anttila, K.: Recent strengthening of snow and ice albedo feedback driven by Antarctic sea-ice loss, Nat. Geosci., 14, 832–836, https://doi.org/10.1038/s41561-021-00841-x, 2021.
Roach, L. A., Dörr, J., Holmes, C. R., Massonet, F., Blockley, E. W., Notz, D., Rackow, T., Raphael, M. N., O'Farrell, S. P., Bailey, D. A., and Bitz, C. M.: Antarctic sea ice area in CMIP6, Geophys. Res. Lett., 47, e2019GL086729, https://doi.org/10.1029/2019GL086729, 2020.
Rosenblum, E. and Eisenman, I.: Sea ice trends in climate models only accurate in runs with biased global warming, J. Climate, 30, 6265–6278, https://doi.org/10.1175/JCLI-D-16-0455.1, 2017.
Rosenman, H.: An account in two volumes of two voyages to the South Seas, by Captain Jules S-C Dumont D'Urville, Melbourne University Press, Melbourne, Australia, ISBN 0522843387, 1987.
Ross, J.: Voyage in the Southern and Antarctic regions, https://archive.org/details/in.ernet.dli.2015.181831 (last access: 9 October 2023), 1847.
Shao, Z.-D. and Ke, C.-Q.: Spring-summer albedo variations of Antarctic sea ice from 1982 to 2006, Environ. Res. Lett., 10, 064001, https://doi.org/10.1088/1748-9326/10/6/064001, 2015.
Sobel, D.: Longitude, Fourth Estate Limited, London, ISBN 0007214227, 1996.
Stommel, H.: Lost Islands: the story of islands that have vanished from nautical charts, Dove Publications, New York, USA, ISBN 0486784673, 2017.
Turner, J. and Comiso, J.: Solving Antarctica's sea-ice puzzle, Nature, 547, 275–277, https://doi.org/10.1038/547275a, 2017.
Turner, J., Bracegirdle, T. J., Phillips, T., Marshall, G. J., and Hosking, J. S.: An initial assessment of Antarctic sea ice extent in the CMIP5 models, J. Climate, 26, 1473–1484, https://doi.org/10.1175/JCLI-D-12-00068.1, 2013.
Wadhams, P.: Arctic ice cover, ice thickness, and tipping points, Ambio, 41, 23–33, https://doi.org/10.1007/s13280-011-0222-9, 2012.
Weddell, J.: A voyage to the South Pole, performed in the years 1822–24. Containing … a visit to Tierra del Fuego, with a particular account of the Inhabitants, https://archive.org/details/avoyagetowardss01weddgoog (last access: 9 October 2023), 1834.
Wilkinson, C.: Sources of historic sea-ice observations for the Southern Hemisphere, http://icoads.noaa.gov/reclaim/Southern Ocean/Reports/Sources of Historic Sea_Ice_v2014_01.pdf (last access: 9 October 2023), 2014.
Worby, A. P. and Comiso, J. C.: Studies of the Antarctic sea ice edge and ice extent from satellite and ship observations, Remote Sens. Envirion., 92, 98–111, https://doi.org/10.1016/j.rse.2004.05.007, 2004.
Wu, X., Budd, W. F., and Jacka, T. H.: Simulations of Southern Hemisphere warming and Antarctic sea-ice changes using global climate models, Ann. Glaciol., 29, 61-65, https://doi.org/10.3189/172756499781821517, 1999.
Yang, J., Xiao, C., Liu, J., Li, S., and Qin, D.: Variability of Antarctic sea ice extent over the past 200 years, Sci. Bull., 66, 2394–2404, https://doi.org/10.1016/j.scib.2021.07.028, 2021.
Yu, L., Zhong, S., Winkler, J. A., Zhou, M., Lenschow, D. H., Li, B., Wang, X., and Yang, Q.: Possible connections of the opposite trends in Arctic and Antarctic sea-ice cover, Sci. Rep., 7, 45804, https://doi.org/10.1038/srep45804, 2017.
Yuan, N., Ding, M., Ludescher, J., and Bunde. A.: Increase of the Antarctic sea ice extent is highly significant only in the Ross Sea, Sci. Rep., 7, 41096, https://doi.org/10.1038/srep41096, 2017.