the Creative Commons Attribution 4.0 License.
the Creative Commons Attribution 4.0 License.
 | 15 Sep 2023
Atmosphere–cryosphere interactions during the last phase of the Last Glacial Maximum (21 ka) in the European Alps
Costanza Del Gobbo
Renato R. Colucci
Giovanni Monegato
Manja Žebre
Filippo Giorgi
Evidence that during the Last Glacial Maximum (LGM) glaciers extended well into the piedmont plains is still identifiable in the alpine foreland as a system of well-preserved moraines. Glaciers are strongly controlled by temperature and precipitation, and therefore, they are excellent indicators of climate change. Here, we use a regional climate model (RCM) to investigate some of the physical processes sustaining Alpine glaciers during the last phase of the LGM during Greenland Stadial 2 at 21 ka. We find a predominance of convection during summer and increased southwesterly stratiform precipitation over the southern Alps when compared to pre-industrial (PI) conditions. This precipitation pattern, along with lower temperatures, determined summer snowfall extending to low elevations, with a consequent substantial drop of the equilibrium line altitude (ELA), which is consistent with the estimated LGM glacier extent. Our RCM-based estimates of 21 ka ELA at the LGM yield excellent consistency with Alpine ELA reconstructions, further demonstrating the great potential of this technique for use in palaeoclimate studies.
- Article
(10749 KB) - Full-text XML
-
Supplement
(11396 KB) - BibTeX
- EndNote


The Last Glacial Maximum (LGM) was a period of maximum global ice volume (Hughes et al., 2013) during the last glacial cycle (0 to 150 ka; Lisiecki and Stern, 2016), and it extended approximately from 26.5 to 19 ka (Clark et al., 2009). It is conventionally defined by a minimum in global sea level (Peltier and Fairbanks, 2006; Lambeck et al., 2014) and a maximum in marine oxygen isotope records (Mix et al., 2001). However, although the LGM is considered to be a global event, there is evidence (Hughes et al., 2013; Clark et al., 2009; Monegato et al., 2017) that it did not occur synchronously worldwide, with mountain glaciers and ice sheets reaching their maximum extent at different times and being out of phase with respect to the signal of marine isotope records (Hughes et al., 2013).
The European Alps have been widely affected by the LGM glacier advance. The Alps' interconnected valley glaciers, ice fields (Kelly et al., 2004; Ivy-Ochs et al., 2022; Monegato et al., 2022), and piedmont lobes (Salcher et al., 2010; Monegato et al., 2007; Preusser et al., 2011; Kamleitner et al., 2022) released a large set of well-preserved moraines and landforms on the ground, testifying to major advances at 26.5 to about 20 ka (Monegato et al., 2007; Wirsig et al., 2016; Kamleitner et al., 2022). The size of the glacier piedmont lobes was different across sectors and not always corresponding to large accumulation areas (Ivy-Ochs et al., 2022). The largest glaciers were located in the northern and western regions of the Alps (Rhône, Rhine, Isar–Loisach, Inn, and Salzach), whereas piedmont lobes were smaller to the south, with only a few exceeding 250 km2 (Ivrea, Verbano, Lario, Garda, and Tagliamento). In fact, they remained confined into the valleys of the southwestern and eastern Alpine sectors (Durance and Drau were, respectively, the largest trunk glaciers). The LGM Alpine glaciers started their collapse (not synchronously) from 20 to 18 ka, with stillstand phases and short readvances (Monegato et al., 2017; Wirsig et al., 2016; Ivy-Ochs et al., 2004; Fontana et al., 2014; Ravazzi et al., 2014; Kamleitner et al., 2022).
During the LGM, atmospheric and environmental conditions were drastically different from today. The mean sea level dropped by about 120 m (Clark et al., 2009; Lambeck et al., 2014; Yokoyama et al., 2000) as a consequence of the sustained growth of ice sheets and mountain glaciers worldwide, and this led to the exposure of areas that were previously submerged. A typical example is the North Adriatic region, which was characterized by a transition from the semi-arid Adriatic alluvial plain to wide, braided proglacial rivers in the Alpine piedmont area (Peresani et al., 2021). Global surface air temperature during the LGM was 1.7 to 8.2 ∘C lower than in present conditions (Schmittner et al., 2011; Annan and Hargreaves, 2013; Snyder, 2016; Tierney et al., 2020; Annan et al., 2022), although a large discrepancy still exists between model simulations and proxy data (Jost et al., 2005; Kageyama et al., 2006; Ramstein et al., 2007).
During the LGM, air masses followed different patterns compared to today, thereby modifying global and regional precipitation regimes. In particular, most model simulations (Laîné et al., 2009; Merz et al., 2015; Pinto and Ludwig, 2020; Strandberg et al., 2011; Raible et al., 2021) and proxy records (Monegato et al., 2017; Luetscher et al., 2015) show evidence of a southward shift in the Atlantic storm track caused by the expansion of the North American ice sheets. Laîné et al. (2009) noted a thinning of the storm track in the northwestern Atlantic associated with an intensified baroclinicity between the Azores islands and Iberian Peninsula. This led to a relatively wet climate in southwestern Europe and dry conditions north of the Alps. The differential insolation and temperature between the subtropical regions and the mid to high latitudes, together with a semi-permanent blocking high over the Fennoscandian ice sheet, determined a marked latitudinal pressure gradient likely responsible for Rossby wave-breaking west of the Alps (Ludwig et al., 2016; Luetscher et al., 2015; Florineth and Schlüchter, 2000). This, in turn, induced a latitudinal flow of moist air from the subtropics towards the Alpine range, where air masses were forced to rise and release abundant precipitation, thus triggering ice build-up on the upwind slopes (Monegato et al., 2017; Luetscher et al., 2015; Florineth and Schlüchter, 2000). Increased precipitation in the southern Alps and western Mediterranean may also be ascribed to the intense and frequent cyclogenesis in the Gulf of Genoa, due to polar air outbreaks over the warm Mediterranean Sea (Kuhlemann et al., 2008).
The atmospheric circulation during the LGM over Europe has been widely studied (e.g. Becker et al., 2016; Ludwig et al., 2016; Kuhlemann et al., 2008; Florineth and Schlüchter, 2000). However, a large uncertainty still exists about the main mechanisms sustaining the expansion of Alpine glaciers during the LGM. The analysis of speleothems sampled in the Siebenhengste cave system in the Bernese Alps suggests that the LGM glacier expansion was predominantly fed by precipitation occurring between spring and autumn (Luetscher et al., 2015). Conversely, recent research (Spötl et al., 2021) relating cryogenic cave carbonate formation from the Obir caves in the northern Karawanks with precipitation and permafrost suggests that the LGM glacier advance in the Alps was determined by intense snowfall during autumn and early winter. One of the major challenges in palaeoclimatic reconstruction (from both models and proxies) is thus to reduce the uncertainties in estimated LGM precipitation patterns, especially at small spatial scales in areas of complex orography (Kirtman et al., 2013). This challenge can be addressed with the use of regional climate models (RCMs), which allow one to carry out simulations at resolutions of a few tens of kilometres or even fewer (e.g. Giorgi, 2019). However, regardless of the fine scale of the RCMs, the simulated precipitation patterns can still show substantial biases (Ban et al., 2014; Velasquez et al., 2020; Gómez-Navarro et al., 2018; Casanueva et al., 2016; Rajczak and Schär, 2017), which may affect hydrological and glacier models being forced by RCM data (e.g. Imhof, 2021; García-Valdecasas Ojeda et al., 2022). Thus, a bias correction can be required in order to correct RCM errors (Velasquez et al., 2020).
In recent years, the number of studies using RCMs for palaeoclimatic applications has notably increased, providing a great deal of information about the LGM circulation in the North Atlantic and Europe. For example, Pinto and Ludwig (2020) explored the extratropical cyclones in the North Atlantic region; Schaffernicht et al. (2020) and Ludwig et al. (2021) analysed high-resolution climate simulations to study dust cycles and loess deposition; Imhof (2021) forced a hybrid ice sheet model with high-resolution (2 km) climate data to model the LGM Alpine ice fields; and Ludwig et al. (2017) and Velasquez et al. (2021, 2022) studied the role of sea surface temperatures, vegetation, and ice sheet topography in the Alpine climate during glacial times (LGM and MIS4).
Here, we use the regional model RegCM4 (Giorgi et al., 2012), nested into the Earth system model developed by the Max Planck Institute for Meteorology in palaeo mode (MPI-ESM-P; Stevens et al., 2013), to investigate possible atmosphere–cryosphere interactions leading to the expansion of the LGM glaciers in the European Alps, particularly with respect to the seasonality and spatial variability in atmospheric circulation and associated precipitation. In this regard, in order to be consistent with the periods of available MPI-ESM-P fields providing the initial and boundary conditions to run our RCM, here the simulated LGM corresponds to 21 ka, the last phase of the actual LGM, which is considered to be the standard in palaeoclimate modelling according to the Palaeoclimate Modelling Intercomparison Project (PMIP3) protocol (Braconnot et al., 2012).
A glacier's sensitivity to changes in the climate conditions is reflected by the equilibrium line altitude (ELA); i.e. the line separating the accumulation area from the ablation one (Haeberli et al., 2007; Lie et al., 2003; Mcgrath et al., 2017; Zemp et al., 2008; Kuhlemann et al., 2008). More precisely, the ELA is defined as the spatially averaged altitude of the set of points on the surface of the glacier at which the ice mass balance is zero at a given time (Cogley et al., 2011). When the ELA is inferred at a regional scale without considering the effects of the morphology of the surface (i.e. shading, avalanching, snow drifting, glacier geometry, or debris cover), and it is averaged over at least some decades, it is called the environmental ELA (envELA), which represents the theoretical altitude at which a glacier can form and be sustained in a region (Anderson et al., 2018). Therefore, changes in ELA are especially powerful indicators of climate–glacier interactions. Here, we estimate the envELA of Alpine glaciers at 21 ka and for pre-industrial (PI) times, following the method developed by Žebre et al. (2021). We calculate the envELA using a simple parametric equation based on the theory of mass and energy conservation, which relates simulated summer temperature and annual precipitation (Ohmura and Boettcher, 2018) and disregards the local topographic effects acting on glaciers. An advantage of this method is that it does not require elaborate input datasets as seen in more sophisticated approaches which include the glacier dynamics driven by mass balance processes (e.g. Huss and Hock, 2015; Zekollari et al., 2020). Finally, we assess the different contributions to the 21 ka glacier envELA, particularly the concurrent action of low temperatures, reduced snowmelt, and evaporation, increased southerly moist air advection towards the southern Alps, intensified cyclogenesis in the Tyrrhenian region, and convection during the warmer months.
2.1 Experimental design
In our experiments, we use a double-nesting approach. The large-scale driving fields are produced by the Max Planck Institute for Meteorology Earth system model in palaeo mode (MPI-ESM-P; Stevens et al., 2013), compliant with the PMIP3–CMIP5 (Palaeoclimate Modelling Intercomparison Project and Coupled Model Intercomparison Project; Braconnot et al., 2012) protocol for two 20-year time slices extracted from 150-year-long simulations at the LGM standard (21 ka; Greenland Stadial 2 or GS2; Rasmussen et al., 2014) and PI. Then, the International Centre for Theoretical Physics RCM, RegCM4 (Elguindi et al., 2014; Giorgi et al., 2012), is nested into the MPI-ESM-P model with an intermediate 50 km resolution domain, which in turn drives a high-resolution domain at 12 km grid spacing. The 20-year-long RCM data are then post-processed by removing an initial 1-year spin-up period and the four-grid-point-wide lateral buffer zone, an area on the edge of the domain where the MPI-ESM-P forcing conditions are assimilated by the RegCM4 (e.g. Giorgi, 2019). The resulting 19-year-long simulations over the interior of the domain are then used for the analysis. Note that this is the first application of the RegCM4 model to palaeoclimate simulations over the Alpine region.
The MPI-ESM-P has already been successfully employed in the study of the LGM (e.g. Pinto and Ludwig, 2020; Stadelmaier et al., 2021), showing a northward shift in the upper-level North Atlantic jet stream when compared with the multi-model mean of the CMIP5–PMIP3 and CMIP6–PMIP4 projects (Kageyama et al., 2021). This behaviour is possibly associated with a strong influence of the Scandinavian ice sheet in central Europe. Overall, however, the behaviour of the MPI-ESM-P is in line with that of other models (Ludwig et al., 2016), and given the agreement of this model with proxy records (permafrost and ground cracking extent; Stadelmaier et al., 2021), we can assume that the LGM large-scale circulation is represented in a reasonably accurate way by the MPI-ESM-P, thereby providing realistic forcing data for the RegCM4. We evaluated both models against observations (Climatic Research Unit – CRU; Harris et al., 2014) and reanalysis data (ERA-Interim; Dee et al., 2011) after customizing the RegCM4 and providing it with a tailored land use reconstruction. The greenhouse gas (GHG) concentrations used in both the global and regional simulations are compliant with the CMIP5–PMIP3 protocol (Braconnot et al., 2012) for 21 ka and the PI conditions. The MPI-ESM-P uses orbital parameters and ice sheet reconstruction from the same protocol, while the orbital parameters for the RegCM4 are calculated following the equation proposed by Berger (1978). Note that even though the atmosphere and glaciers are transient systems, a 20-year-long simulation represents a relatively short interval within the longer temporal framework of the LGM and of the evolution of extended glaciers, and therefore, the analysis assumes steady-state conditions.
2.2 Domain of study
The lower-resolution RegCM4 simulations (∼ 50 km) extend from 37.5 to 51.0∘ N and 3.8 to 23.0∘ E, whereas the high-resolution RegCM4 simulations (∼ 12 km) are carried out over a domain extending between 38.4 to 50.1∘ N and 5.3 and 20.4∘ E, including the Alpine and Balkan mountain ranges in their full extent, along with the north-central Apennines (Fig. S1 in the Supplement). However, our focus for the envELA calculations is on the greater Alpine region (∼ 43.5 to 48.5∘ N and ∼ 4 to 16∘ E), where bias correction is applied to temperature and precipitation data produced by RegCM4 (Eqs. 1 and 2), based on two observational datasets covering this area.
2.3 Land use and topography reconstruction
During the LGM, the land surface conditions were quite different from the present, and this information needs to be fed into the model, as it may affect the regional climate (Ludwig et al., 2017). These conditions may be reconstructed using available proxies and palaeoclimate archives. First, for LGM conditions, we modified the present-day model topography (GMTED2010; Danielson and Gesch, 2011) and bathymetry (ETOPO1; Amante and Eakins, 2009) by decreasing the sea level by 120 m (Peltier and Fairbanks, 2006) and changed the land–sea mask in order to account for the corresponding variation in the coastline. The resulting dataset was then interpolated by the RegCM4 preprocessor tool onto the desired grids at 12 and 50 km. This caused a smoothing of the topography that in particular affected the smallest orographic features, such as mountaintops and narrow valleys. Finally, we added a two-dimensional representation of the LGM glaciers based on Ehlers et al. (2011). Because of the topography smoothing and the relatively coarse RegCM4 resolution, the Alpine glacier thickness is not considered in the topography representation, although Merz et al. (2015), Imhof (2021), and Velasquez et al. (2022) highlighted the importance of including the topography of glaciers in global and regional palaeoclimate models. Concerning LGM vegetation cover, we constructed a high-resolution dataset (Del Gobbo, 2021) based on proxy data (Watts et al., 1996; Monegato et al., 2015; Sirocko et al., 2016; Duprat-Oualid et al., 2017), using an association of plant types in each region with altitude and latitude, which was modulated by a random spatial distribution within each region. Every plant type is characterized by an annual cycle in the leaf and steam area index.
2.4 Bias correction
Despite the fine resolution used and the model customization, biases can still affect RCM output data due to initial and boundary conditions from the driving global climate model (GCM; the MPI-ESM-P is characterized by a northward shift in the upper-level North Atlantic jet stream; Ludwig et al., 2017) and the parameterization of processes occurring at finer scales than the resolution of the simulations (Velasquez et al., 2020). Since we need absolute temperature and precipitation values to reconstruct the envELA, we thus applied a first-order bias correction to our data in order to account for model biases, such as a cold bias in temperature over the Alpine range and a wet bias in precipitation over the western Alps (Figs. S2 and S3). We first calculated the bias by comparing observations and pre-industrial RegCM4 data for both variables. Then we applied a correction to the RegCM4 PI and 21 ka temperature and precipitation, assuming that the biases between the model and observations are the same in the two time periods. Precipitation is thus corrected by applying a linear scaling approach, as follows:
where Py,LAPREC is the annual accumulated precipitation from the Long-term Alpine Precipitation Reconstruction (LAPrec) observation dataset (Auer et al., 2007; Isotta et al., 2014) averaged over the period 1871–1900. Py,PI is the annual accumulated precipitation from the pre-industrial RegCM4 simulation averaged over 19 years, and Py,RCM is the simulated annual accumulated precipitation (PI or 21 ka) which needs to be corrected. Similarly, temperature is corrected as
where Tm,RCM is the simulated summer monthly mean temperature (PI and 21 ka) that we want to correct, Tm,PI is the summer monthly mean temperature from the PI RegCM4 simulation averaged over 19 years, and Tm,HIST is the summer monthly mean temperature from the HISTALP dataset (Auer et al., 2007) averaged over the period 1871–1900.
2.5 Environmental equilibrium line altitude
We calculated the envELA, defined as the regional altitude of zero mass balance determined only by climatic factors (Anderson et al., 2018). The envELA is calculated following an inverse approach, based on bias-corrected annual precipitation and summer temperature (Eqs. 1 and 2), and is averaged over the 19 years of the model simulations, since we assume that glaciers are at a steady state during the simulation time. The calculation uses the method adopted by Žebre et al. (2021), which is based on an empirical equation relating mean summer temperature and accumulated annual precipitation at the envELA. This equation relates glacier and climate conditions; it was first introduced by Ahlmann (1924) in the form of a precipitation and temperature diagram ( diagram) and then recently updated by Ohmura and Boettcher (2018), who used temperature, precipitation, and solar radiation data from 104 glaciers worldwide. The curve can be approximated by a quadratic function and is based on the principles of mass and energy conservation, as follows:
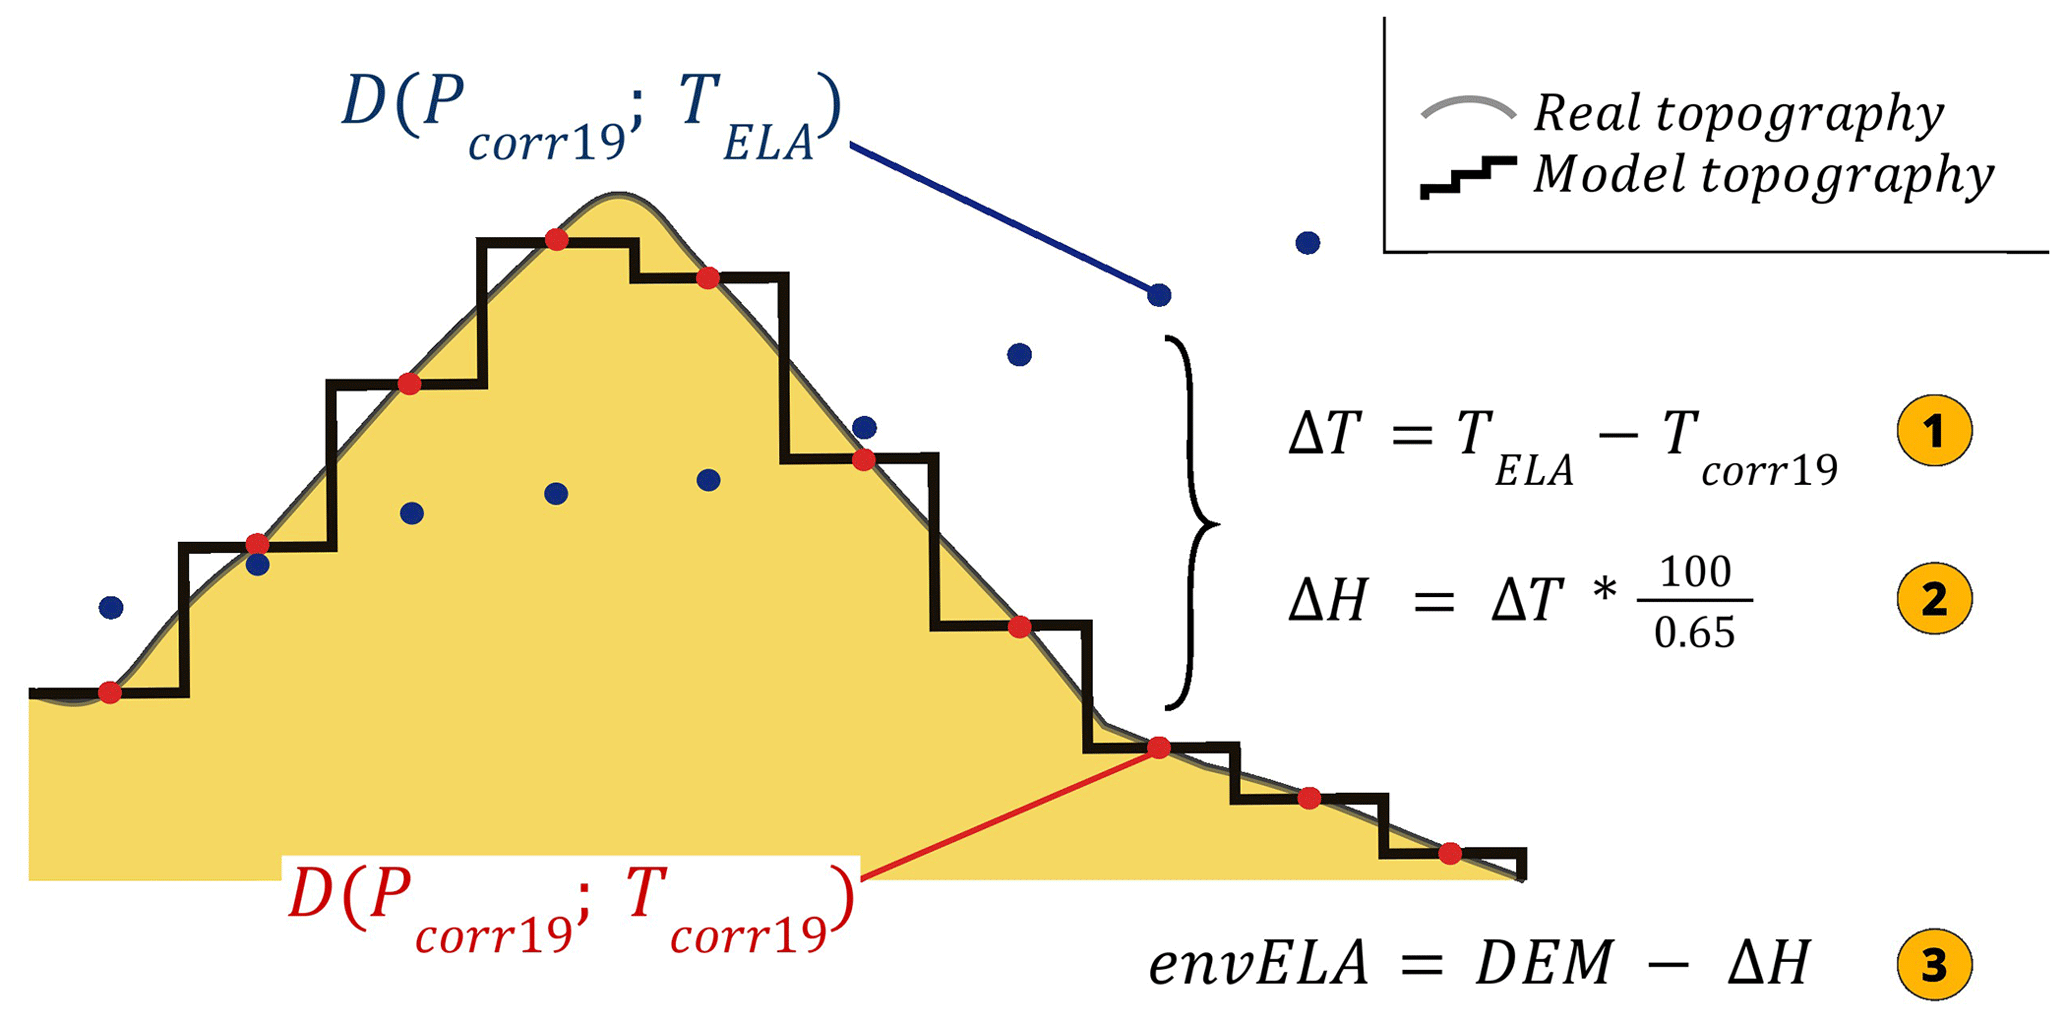
Figure 1Graphical explanation of the envELA calculation. The black thick line represents the model topography (DEM); red dots refer to the RegCM4 data (e.g. temperature and precipitation) on the model topography, while blue dots refer to the envELA. The temperature, corresponding to blue dots, is calculated with Eq. (3), while precipitation is the RegCM4 one. Subsequently, the equations marked with yellow circles are applied. These equations are merged into Eq. (4) in the text.
Pcorr19 is expressed in millimetres and TELA in degrees Celsius. The standard error of the method is 648 mm. Equation (3), representing the diagram, is solved for TELA, using Pcorr19, which is the RegCM4 bias-corrected accumulated annual precipitation averaged over the 19 years. Proceeding with an inverse approach, we assume that only precipitation (Pcorr19), but not temperature, refers to the envELA level. Then, we use bias-corrected RegCM4 precipitation (Pcorr19), assumed at the envELA level, to calculate the envELA temperature (TELA) with Eq. (3). Subsequently, we convert the temperature difference between the envELA and the topography (TELA−Tcorr19) into an altitude difference, using an environmental lapse rate of 0.65 (Rolland, 2003; Rubel et al.2017). Finally, the resulting elevation difference is subtracted from the topography (digital elevation model or DEM) in order to obtain the envELA for every grid cell (Fig. 1) as
A further assumption implicit in this approach is that temperature, but not precipitation, varies vertically.
The reference topography for the 21 ka and PI envELA calculations is the PI topography, after the application of a correction accounting for the 120 m elevation difference between the two periods due to the sea level decrease. This facilitates the comparison of the envELA datasets for the two periods with the ELA values obtained from geomorphological reconstructions. The envELA computations for both 21 ka and the PI are performed using three different topographies, namely the RegCM4, the HISTALP, and LAPrec topographies. The three resulting envELA datasets are then averaged. Because the observational and simulated datasets do not use the same horizontal grid, we remapped the RegCM4 and LAPrec data onto the HISTALP 5 arcmin resolution grid.
This method has already been validated for the Alpine region by Žebre et al. (2021), who used the following two different ELA datasets: (i) the Fluctuations of Glaciers (FoG) database of the World Glacier Monitoring Service (WGMS), from which geographically and climatologically distributed end-of-mass-balance-year ELA values over the Alps were selected for the period 1948–2017; and (ii) the annual highest end-of-summer snowline altitude (SLA) derived from Landsat data for the western Alps for the period 2006–2019, which was analysed using a semi-automated remote sensing method (Racoviteanu et al., 2019).
For the sake of clarity, we emphasize that the envELA is the lowest boundary of the climatic glaciation, and therefore areas in which the envELA is lower than the model topography indicate conditions (RegCM4 precipitation and temperature) that support the existence of glaciers.
3.1 The large-scale framework: the MPI-ESM-P simulation
The MPI-ESM-P global model run at the Max Planck Institute is used to drive our RegCM4 simulations (see Sect. 2). This model (not shown in the figure) has already been analysed in other studies (e.g. Ludwig et al., 2016) and correctly reproduces the large-scale conditions at 21 ka (GS2) in terms of the jet stream position and strength, temperature, and precipitation anomalies, although the LGM upper-level North Atlantic jet stream is stronger over the northern parts of the North Atlantic compared to other models (Ludwig et al., 2016). The 21 ka European climate simulated by the MPI-ESM-P is on average 9 ∘C colder and overall drier than at the PI time period over our broad region of interest, particularly over central and northern Europe (−30 %). The southern flank of the Alps, however, is somewhat wetter than, or has similar precipitation levels to, that at the PI time. The main upper-troposphere circulation over the area of interest is westerly and northwesterly, both at 21 ka and PI. The 21 ka minus PI anomaly in the MPI-ESM-P model highlights a southward shift in the Atlantic jet stream, which at 21 ka generated strong winds in the Mediterranean region. The Scandinavian ice sheet at 21 ka generated a semi-permanent high-pressure system responsible for blocking and deflecting the westerly air masses around the southern margin of the ice sheet.
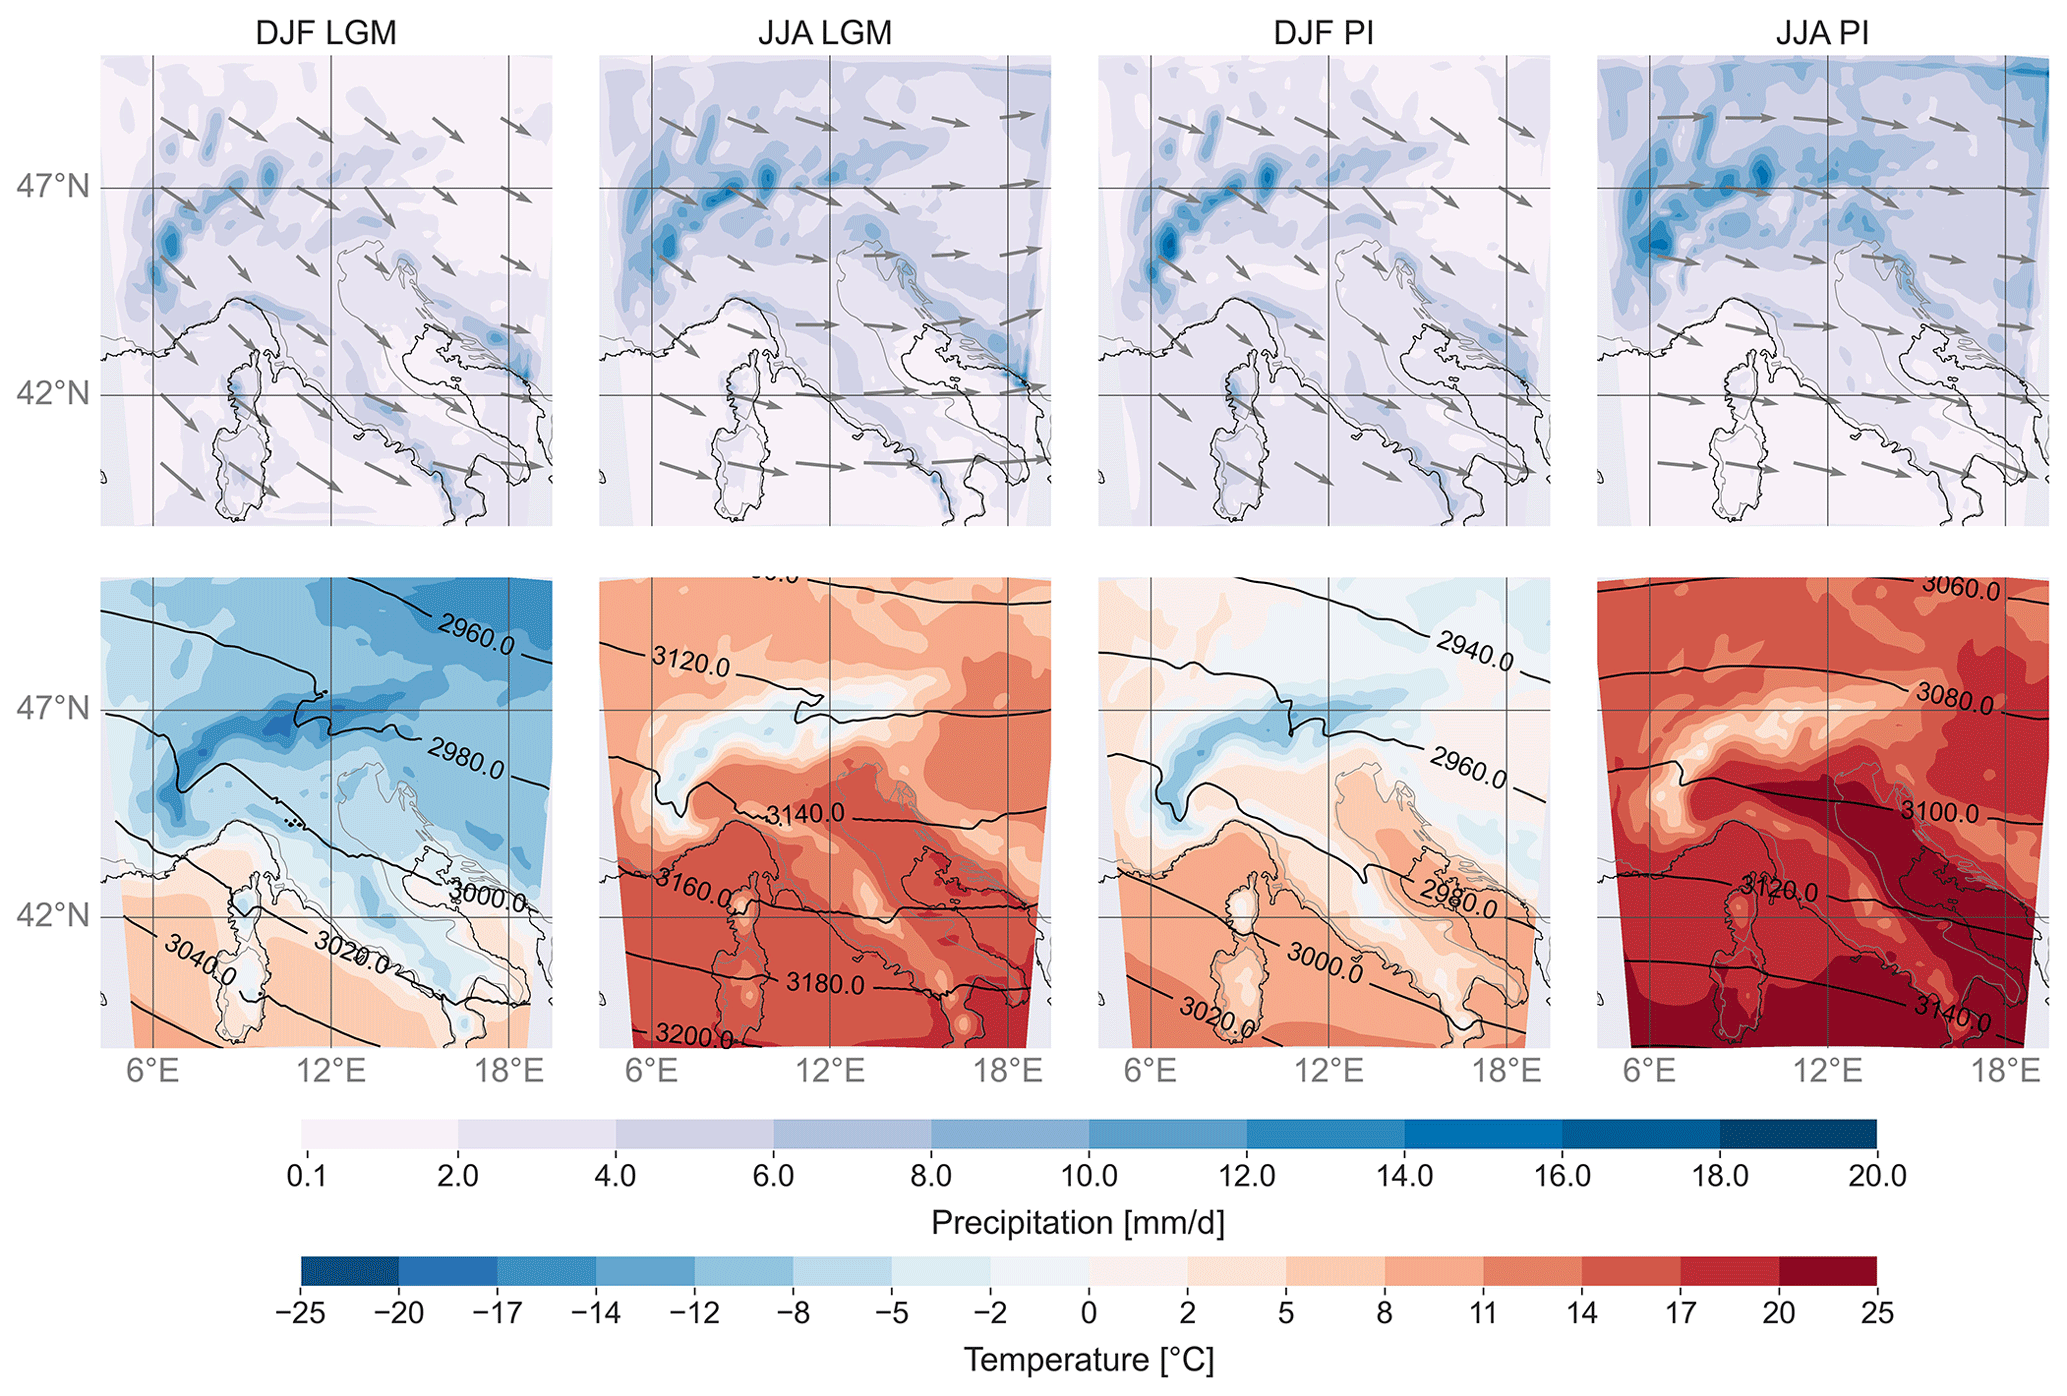
Figure 2The 21 ka and PI mean winter and mean summer synoptic conditions averaged over 19 years. In the first row is the 700 hPa average wind field (arrows) and precipitation. In the second row is the temperature and 700 hPa geopotential (black lines). Temperature and precipitation are not bias corrected. These data represent the average summer and winter situation.
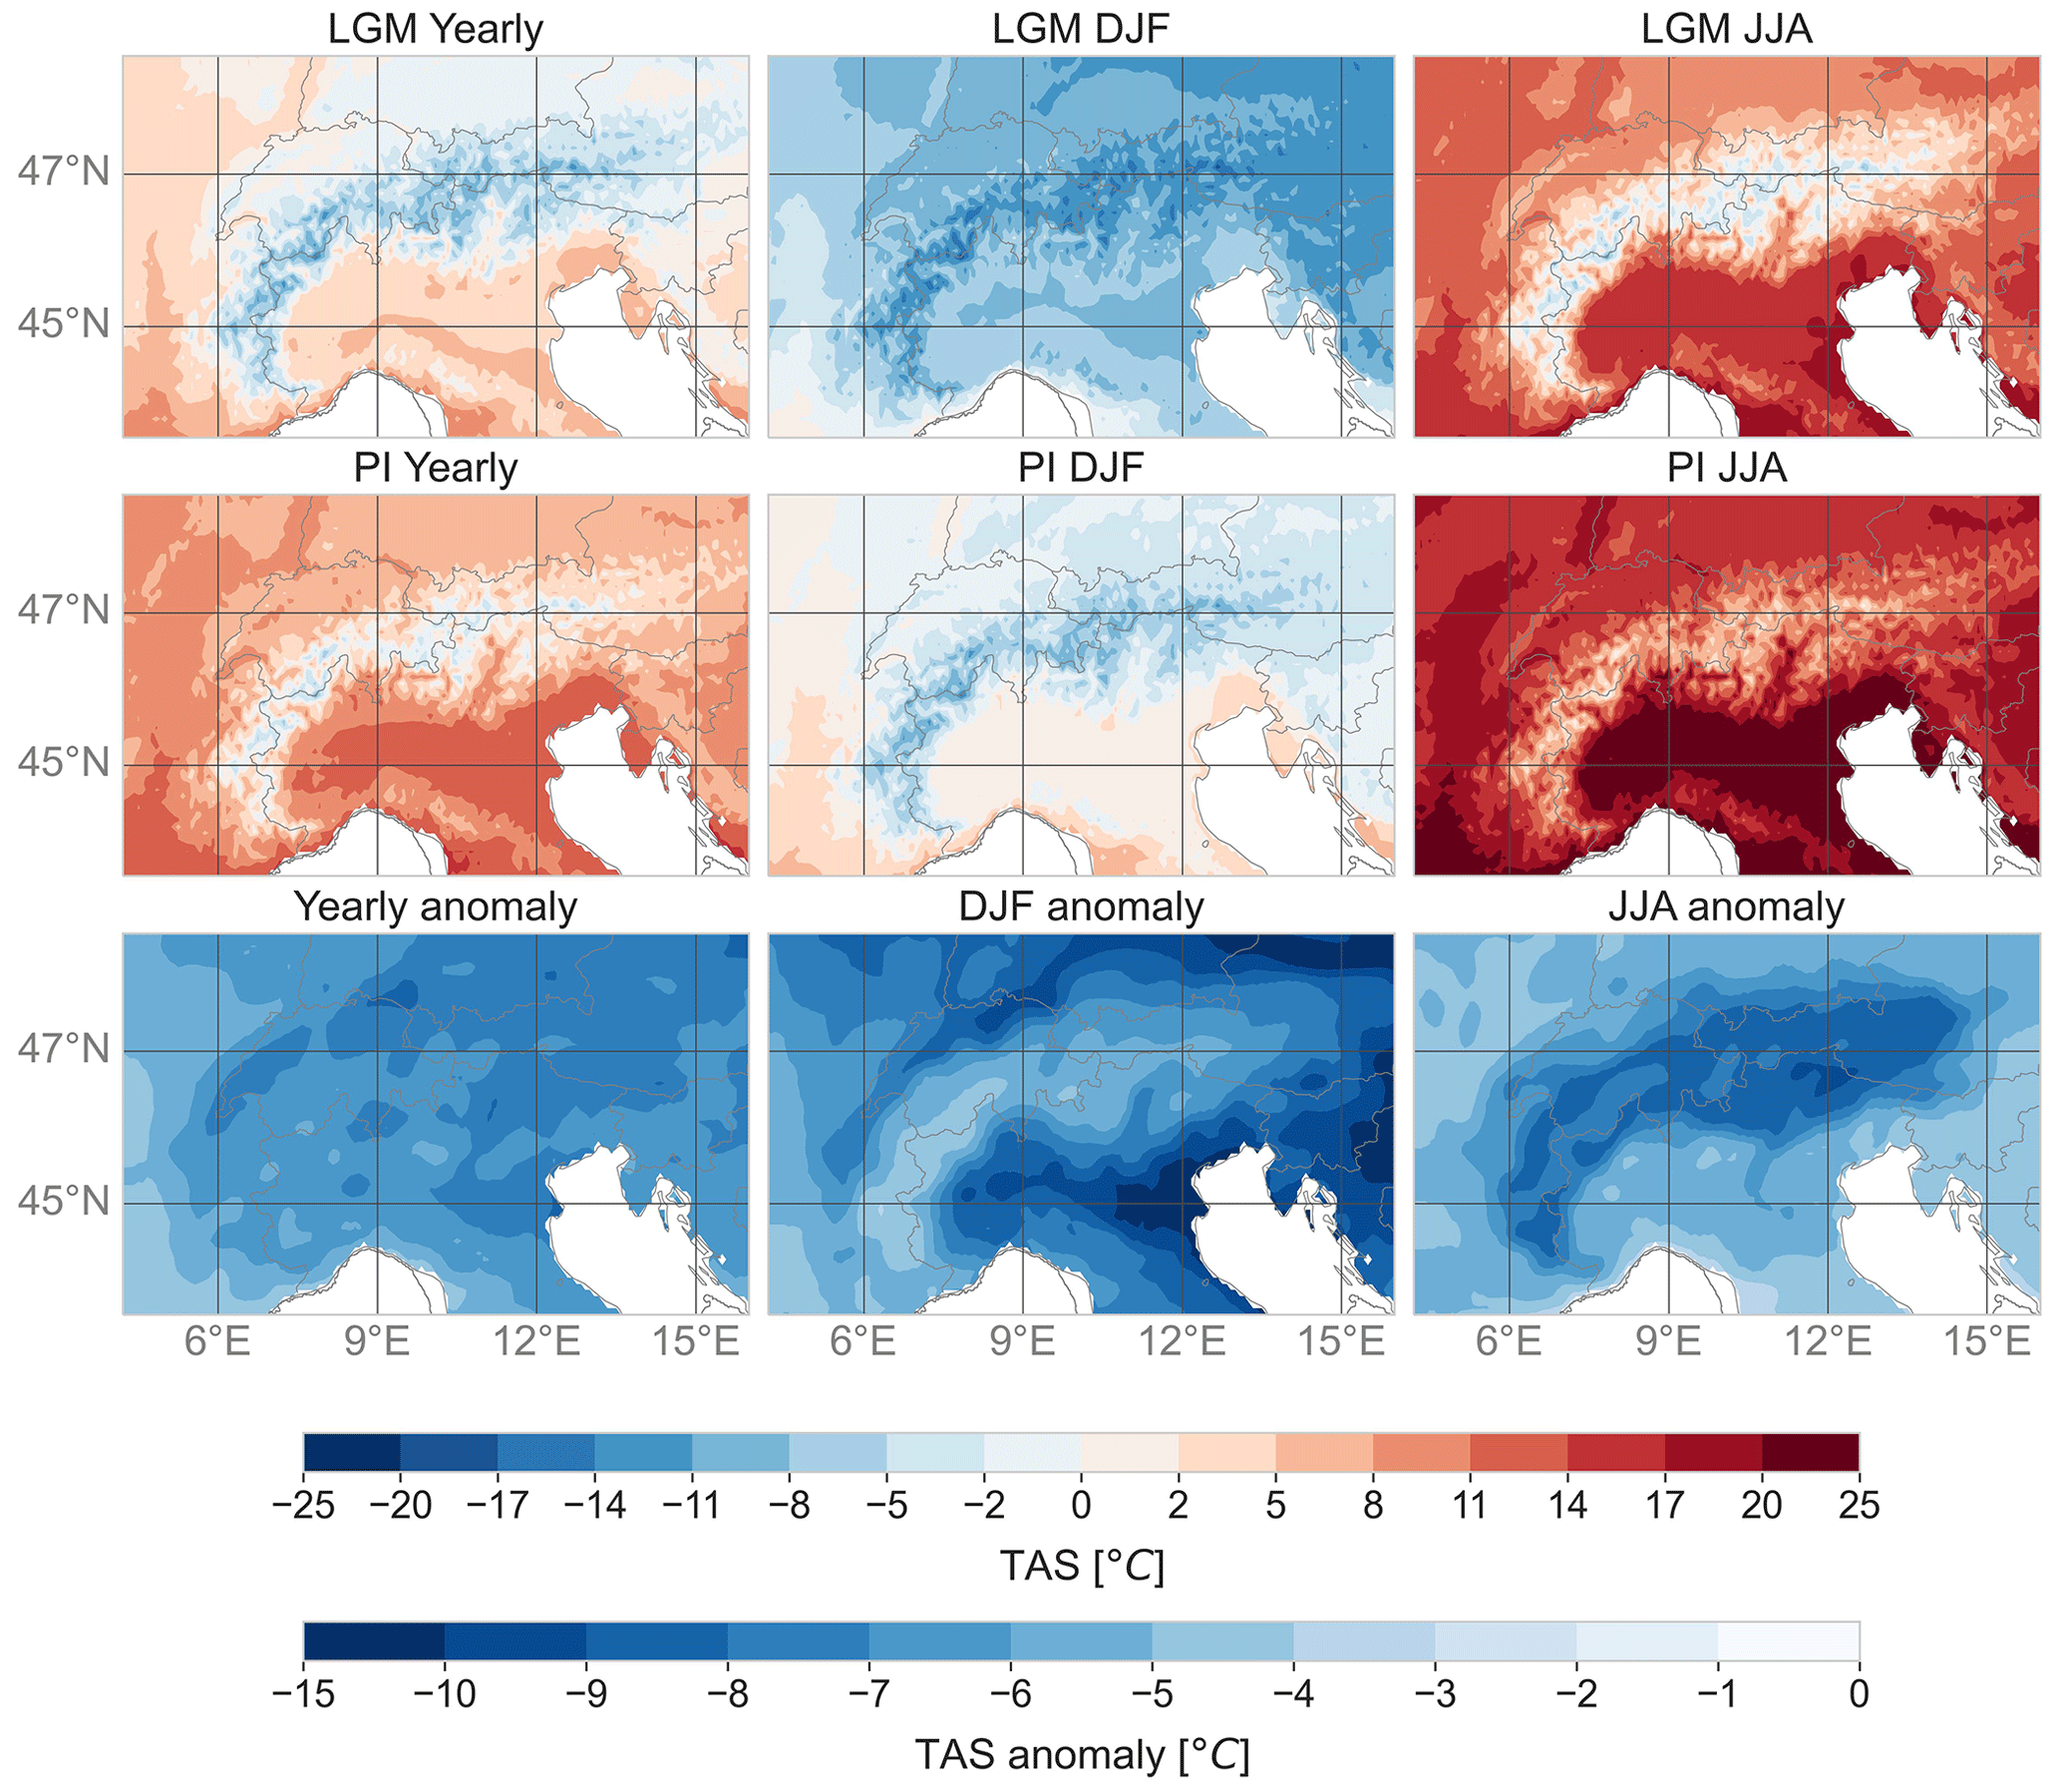
Figure 3The 21 ka and PI temperature and anomaly. Yearly, winter, and summer values averaged over 19-year-long RegCM4 bias-corrected temperature data.
3.2 Regional climate model (RegCM4): atmospheric circulation
3.2.1 Synoptic conditions
The 21 ka high-resolution RegCM4 simulation shows the presence of a more pronounced NE–SW pressure gradient compared to the PI, with a maximum in the northeastern sector of the domain and a minimum over the Tyrrhenian and the Mediterranean seas, which is particularly evident in the coldest months (Fig. 2). A similar pattern is shown by the annual temperature anomaly, with lower values northeast of the Alps and higher values over the Tyrrhenian region (Fig. 3). The largest temperature anomaly between 21 ka and the PI occurs in winter (−8.30 ∘C on average), especially northeast of the Alps and in the northern Adriatic. During winter, the monthly mean anomaly is smaller in the Alpine region than in the rest of the domain, while during summer the anomaly is larger over the Alps.
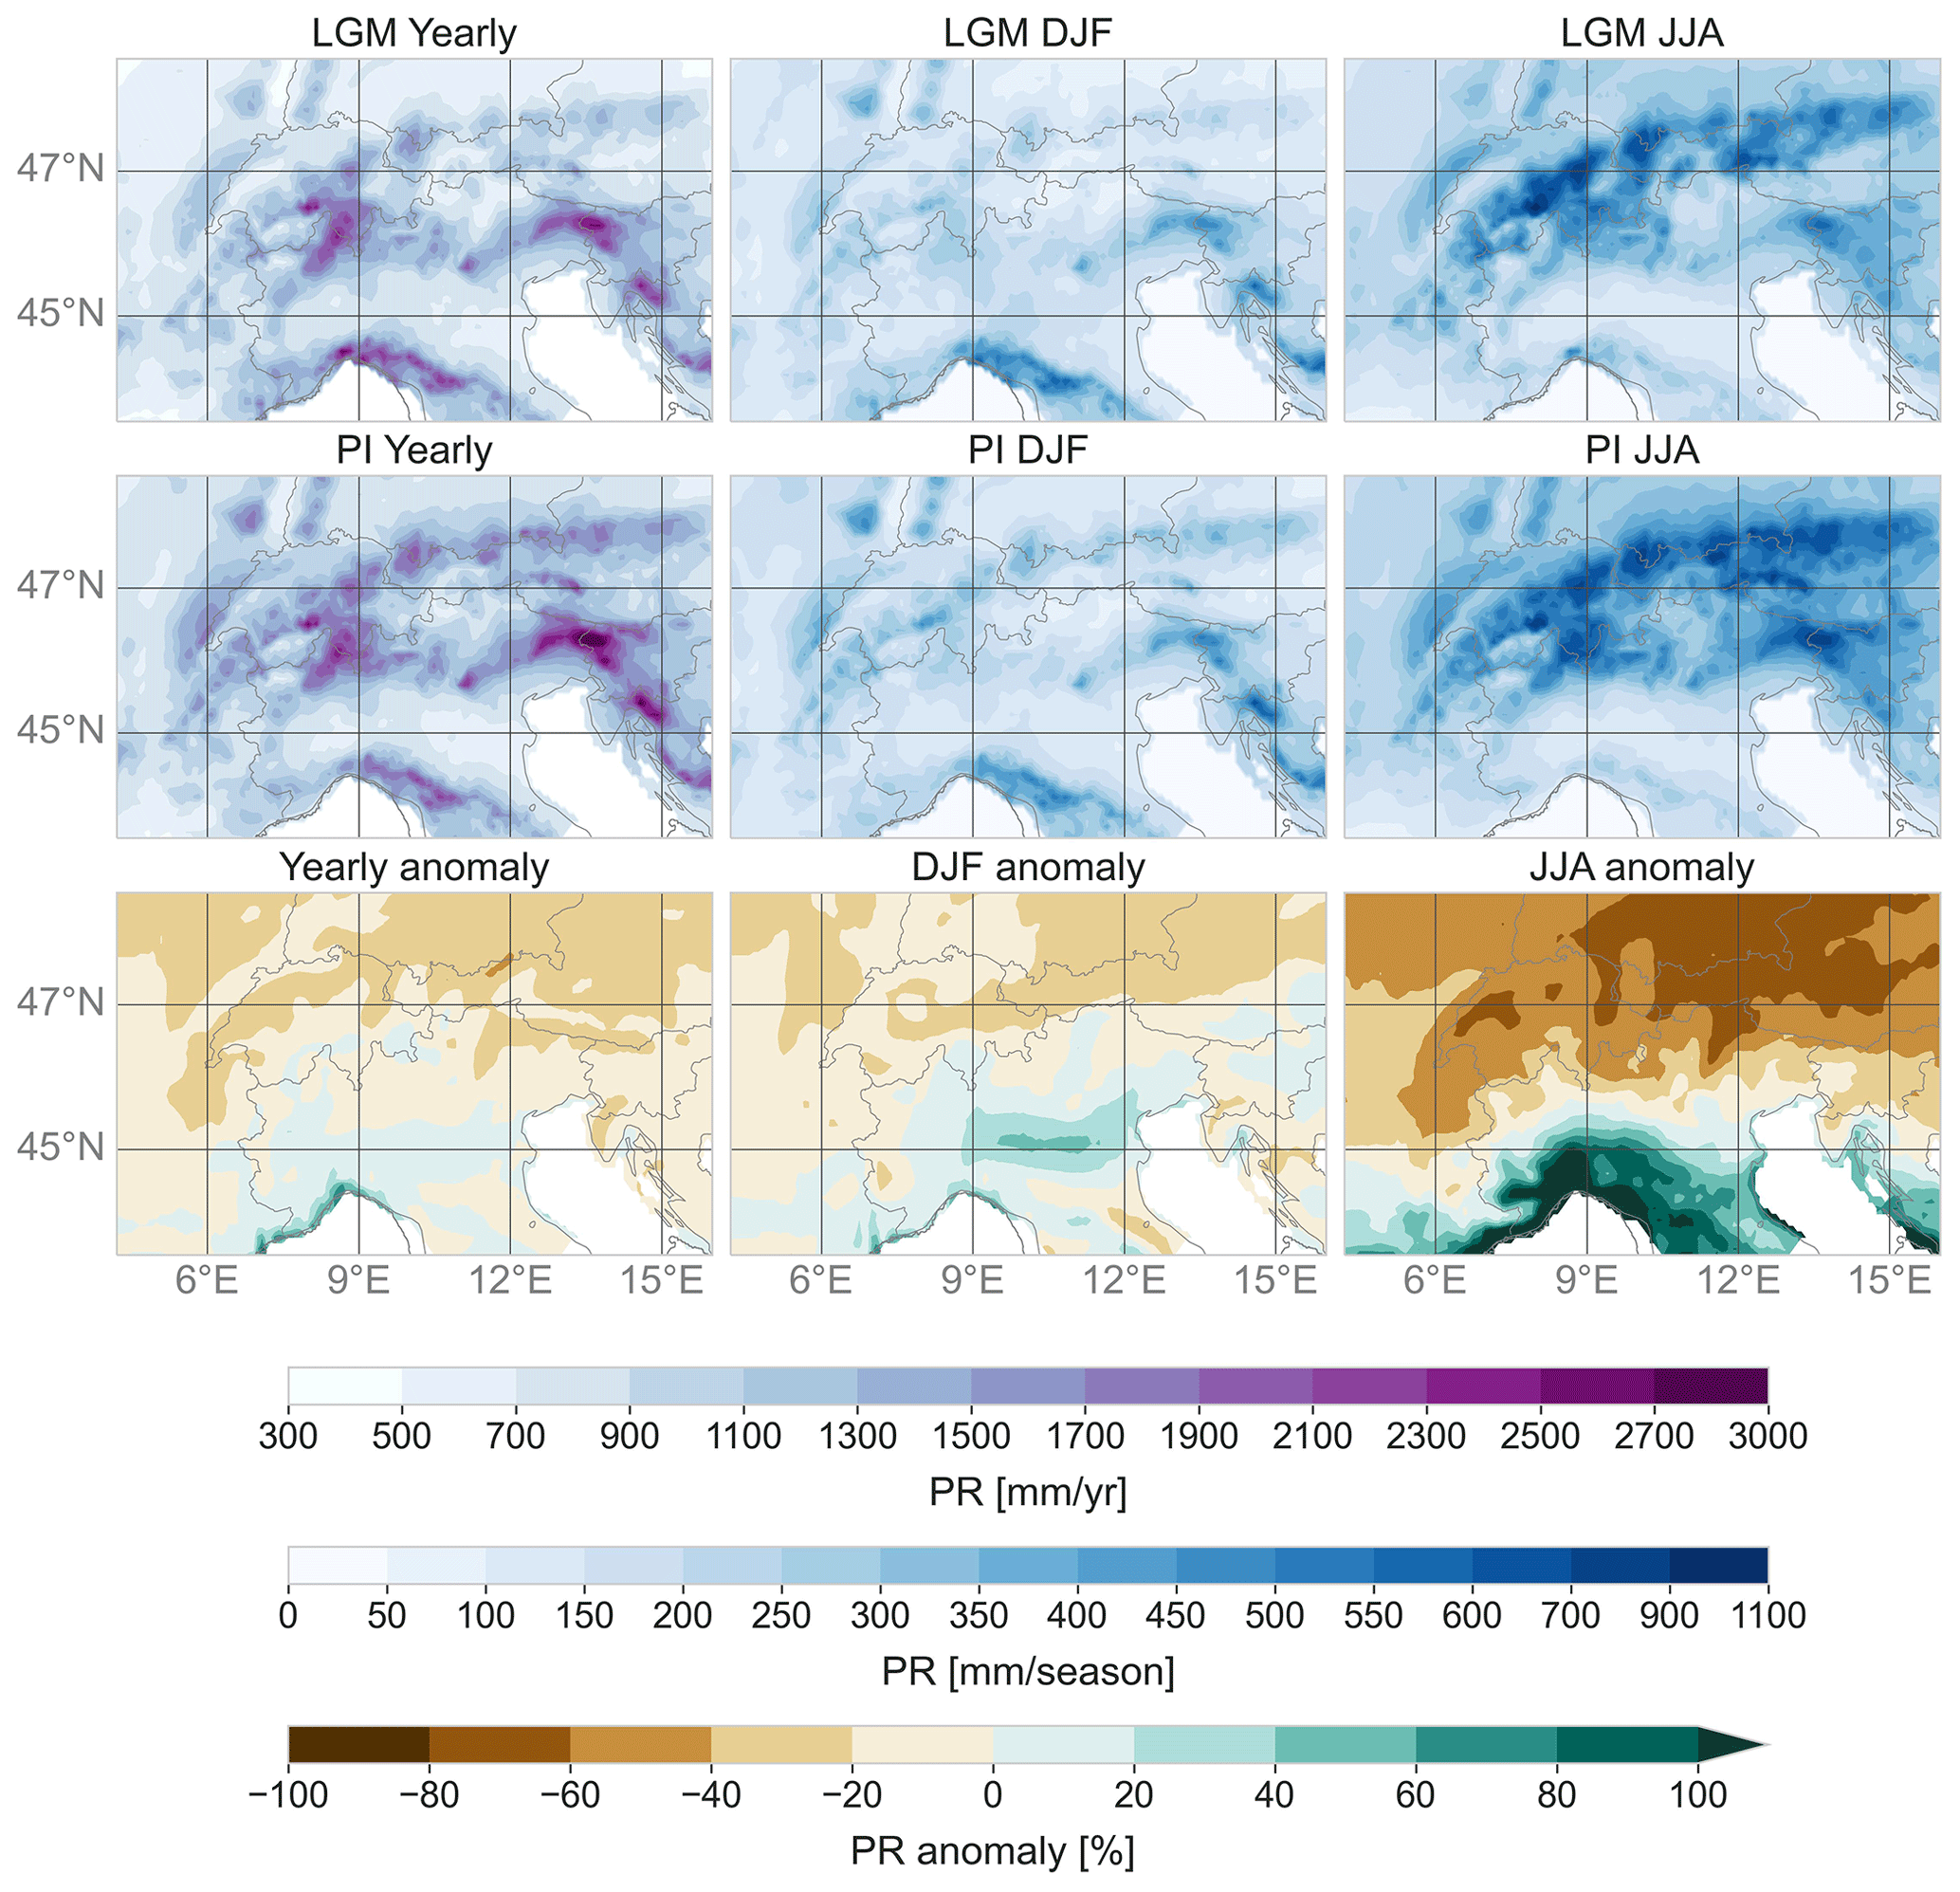
Figure 4The 21 ka and PI precipitation and anomaly. Yearly, winter, and summer values averaged over 19-year-long RegCM4 bias-corrected precipitation data.
The 700 hPa winds (Fig. 2) indicate that the Tyrrhenian region at 21 ka during winter is characterized by advection of cold air descending the Italian Peninsula from the northwest. The PI shows a similar pattern in the southern part of the domain, but north of the Alps the main wind direction presents a more zonal component. During the warmer months at 21 ka, the air masses coming from the northwest are deflected eastward over the Tyrrhenian Sea. This often generates a cyclonic circulation over the Gulf of Genoa, which occasionally leads to a northeasterly flow. At the PI, the average summer flow does not show this northeasterly curvature but is east-southeast oriented. Generally, south of the Alps, the circulation is stronger at 21 ka than at PI, while it is weaker north of the Alps.
3.2.2 Temperature, precipitation, and winds
Compared to the PI time, the simulated LGM conditions are colder, with a lower average temperature of ∼ 6.8 ∘C (Fig. 3) and annual precipitation reduced by ∼ 14.5 % (Fig. 4) over the Alps, with the most pronounced cooling and drying occurring in summer (−7.3 ∘C of cooling and −38.1 % of drying). Despite the overall drier conditions characterizing the LGM, we find some relatively wetter areas in the southeastern Alps, the Dinaric range, the Ticino region, and the northern Apennines (Fig. 4). The RegCM4 simulations thus highlight the important role played by Alpine orography, which determines two distinct climate regimes north and south of the Alps. At 21 ka, central Europe is 20 % to 40 % drier than at PI, while the southern Alpine flanks present some wetter areas (up to 20 % in the yearly anomaly) during the simulated LGM. Summer anomalies are always more pronounced than winter anomalies in both regions (Fig. 4).
The use of RegCM4 allows us to distinguish between convective and stratiform precipitation. The former dominates over the sea and at the lowest elevations during the warmer months but shows a marked reduction in the at 21 ka due to the lower temperatures. For example, in central Europe and over the Alps, convective precipitation at 21 ka is reduced by about 50 % compared to the PI. Conversely, stratiform precipitation deriving from larger-scale circulations presents positive anomalies at 21 ka compared to PI almost everywhere and all year round. In the Alpine region during the PI, convection is always dominant, while at 21 ka it dominates only during summer. The yearly maximum of stratiform precipitation over the Alps corresponds to the maximum of total precipitation, which occurs in September. Our data also show increased 21 ka cyclonic activity compared to the PI in all seasons over the Italian Peninsula.
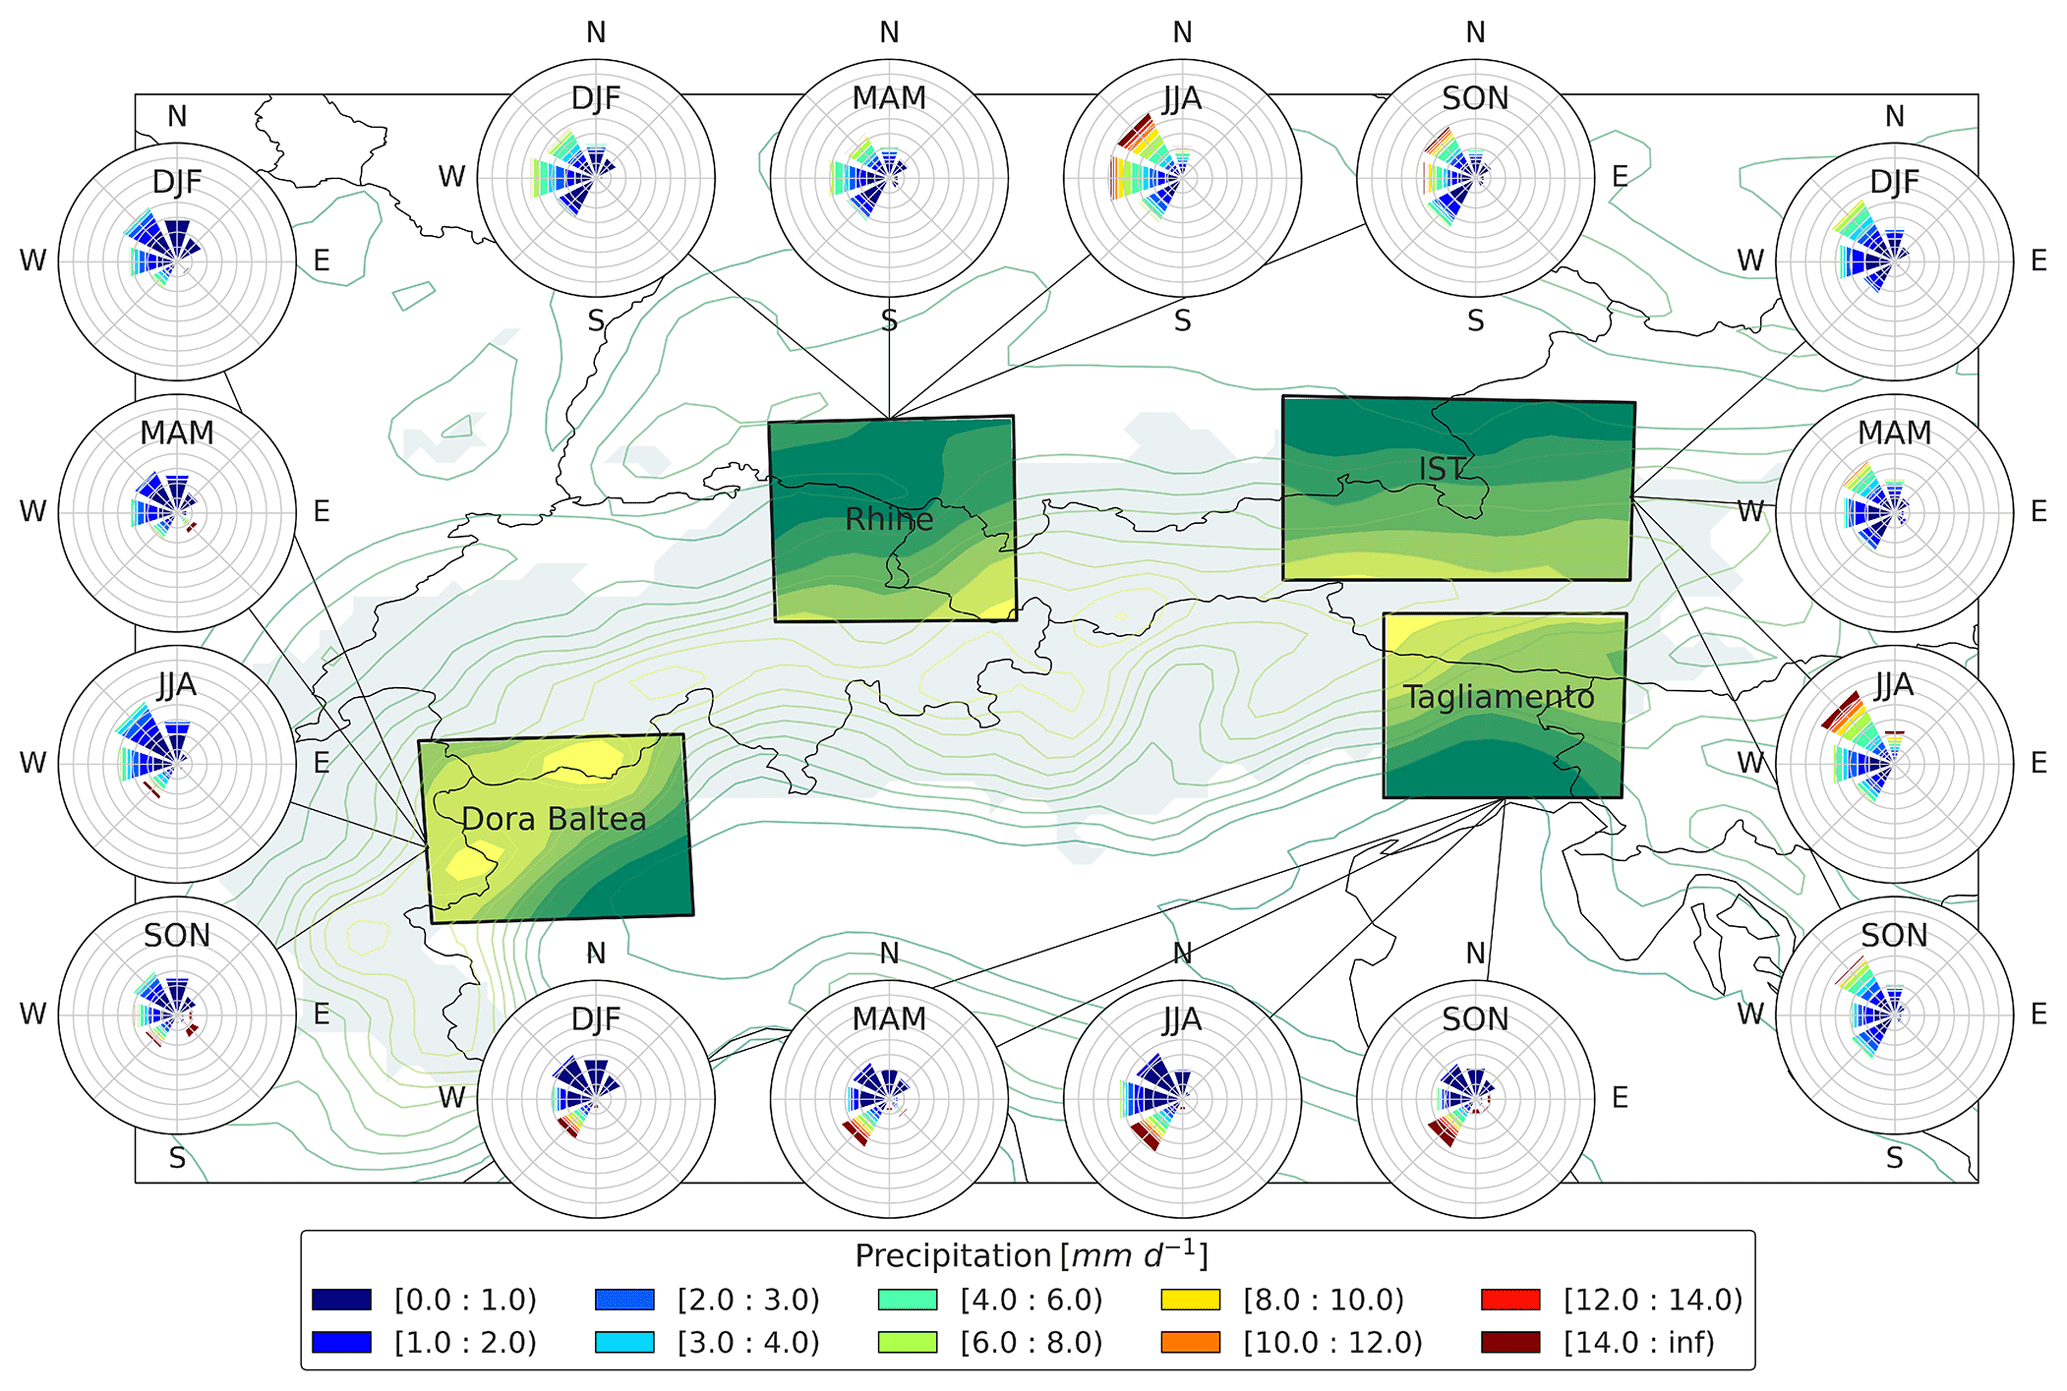
Figure 5The 21 ka seasonal wind origins associated with each of the 19 simulated years of precipitation events. This has been done for the Rhine, Inn–Salzach–Traun (IST), Tagliamento, and Dora Baltea glacier subdomains. Wind roses show the main wind directions under the condition that precipitation events occur. Colours represent precipitation intensity in millimetres, and the colour band width is the frequency of a given precipitation intensity per wind direction. The shadow in the map is the glacier extension (Ehlers et al., 2011), the coloured lines and the fully coloured-in boxes represent the topography (yellow for higher elevation and green for the lower elevation), and the black line is the present-day political boundary.
In Fig. 4, we analyse wind direction and associated precipitation for four subdomains corresponding to LGM Alpine piedmont glaciers, namely the Rhine and Inn–Salzach–Traun glaciers in the northern Alps and the Dora Baltea and Tagliamento glaciers in the southern Alps. We used daily data from the 19 simulated years in order to calculate the frequency and intensity of the precipitation associated with the given wind directions. The two glaciers north of the Alps are mainly affected by precipitation brought by northwesterly and westerly air masses. At 21 ka, northwesterly winds dominate, especially in summer, while at the PI, westerlies occur more frequently. At 21 ka, more precipitation events are low intensity (darkest blue in Fig. 5) as northerly and northwesterly (dry) winds reach the northern rim of the Alps. In the southern Alps, the Dora Baltea and Tagliamento glaciers present quite different precipitation and wind patterns. The Dora Baltea glacier is affected mainly by winds from the northwest and southwest; however, the events from the west and northwest are often dry, while the most intense precipitation comes from the southwest and southeast.
The southern Alps at 21 ka receive much more precipitation than the northern Alps. The Tagliamento glacier is shielded by the Alpine topography barrier from precipitation coming from the northern and eastern quadrants, while precipitation is supplied by southwesterly winds. This precipitation is more abundant at 21 ka than at the PI (Figs. 5 and S4), and the frequency of the intense precipitation is the highest across the domain. At 21 ka, precipitation associated with southwesterly air masses is intense throughout the year, which is an important difference compared to the glaciers in the northern rim of the Alps showing only one rainy season (June–August or JJA).
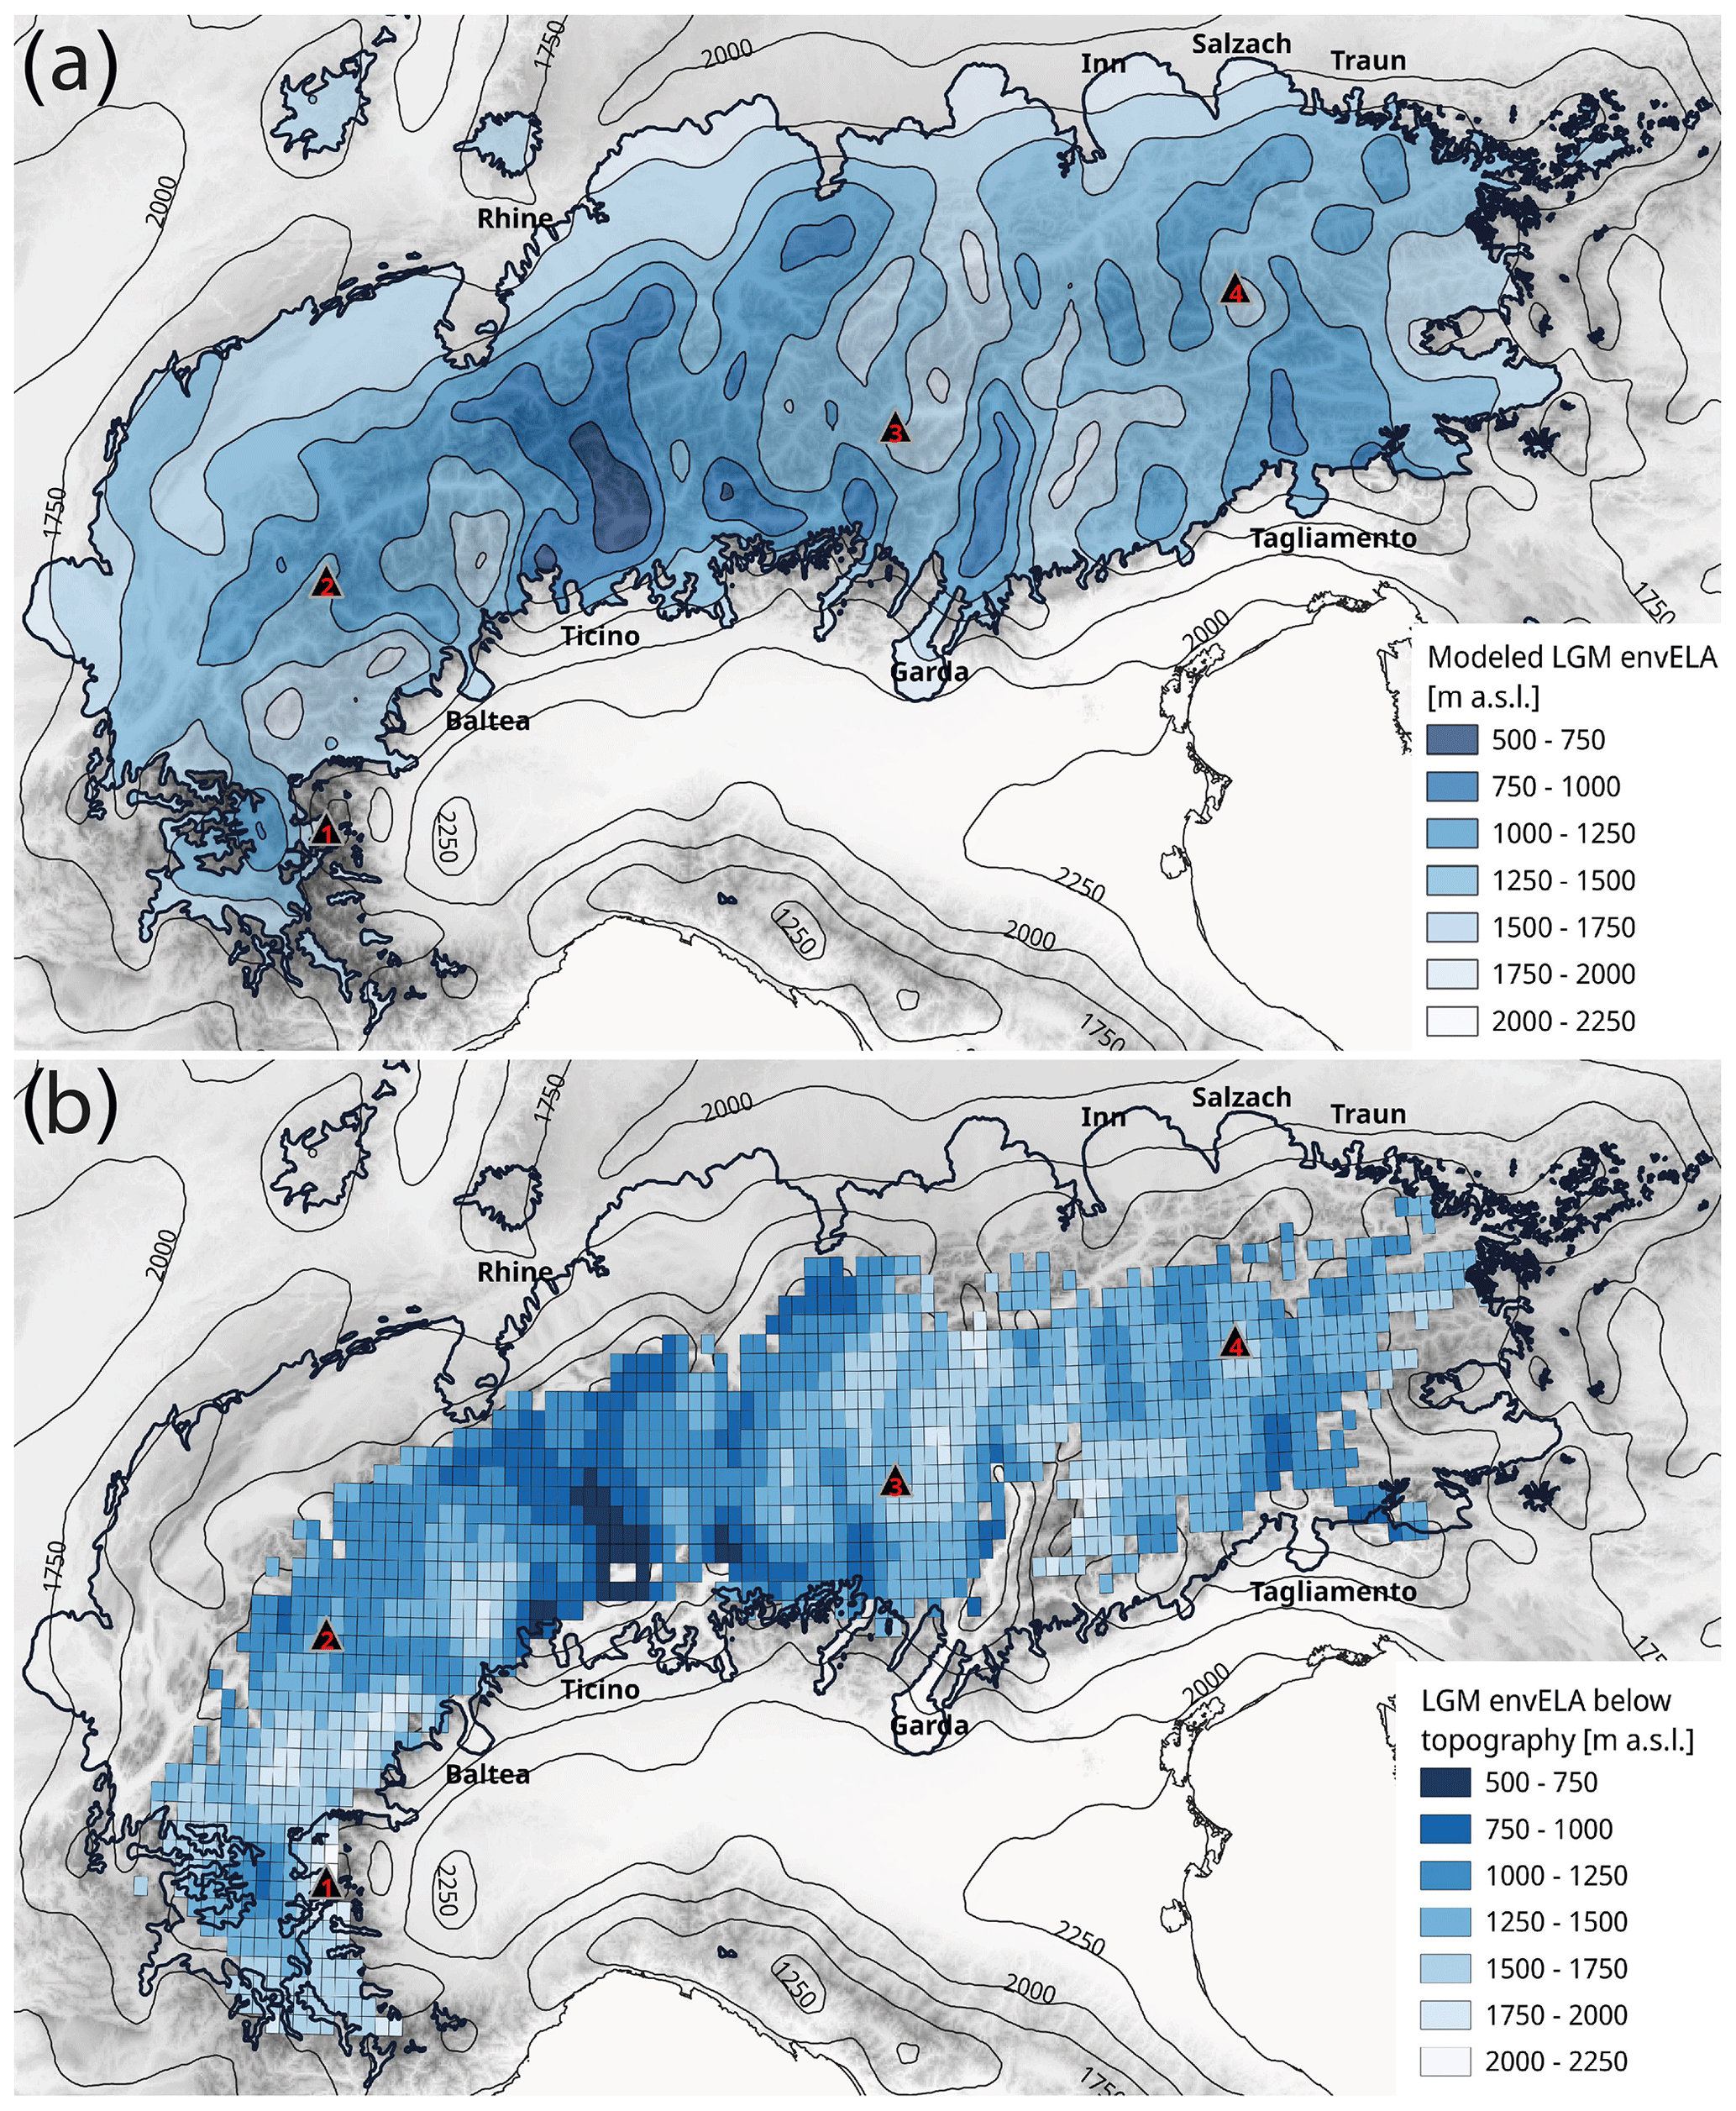
Figure 6(a) The 21 ka envELA calculated following the method of Žebre et al. (2021). (b) The comparison between 21 ka envELA and topography. The grid cells in which the envELA is lower than the topography are shown in the map. The black thick line represents the extension of the geomorphological reconstruction of the LGM glaciers (Ehlers et al., 2011). The black triangles indicate (1) Monviso, (2) Mont Blanc, (3) Ortler, and (4) Großglockner.
3.3 Equilibrium line altitude
The envELA calculations were performed following the method proposed by Žebre et al. (2021; Eqs. 3 and 4; see Sect. 2). At 21 ka over the greater Alpine region, the average envELA is 1444 (above sea level; Fig. 6), while at the PI it is 2435 (Fig. S5); i.e. there is a drop of 991 m at 21 ka (Fig. S6). The southwestern and northeastern Alps show the highest envELA values, while the Ticino, southeastern Alps, and the rest of northern Alps present the lowest values both at 21 ka (Fig. 6a) and PI (Fig. S5). The calculated 21 ka envELA is between 1000 and 1250 over the Julian Alps, which is between 1250 and 1750 in the Pennine Alps and Graian Alps and between 1500 and 2250 in the Maritime Alps. In the western Alps, the envELA decreases northward; in the central Alps it is lower on the southern rim because of high precipitation in the Ticino region, while in the eastern Alps no significant north–south gradient in envELA is found.
By comparing the envELA with the model topography (Figs. 6b and S7), we investigate whether the RegCM4 is able to reproduce the correct combination of temperature, precipitation, and orography to support the existence of glaciers. At the PI, only a few grid cells in the western Alps show an envELA lower than the model topography, while the 21 ka envELA is lower than the topography over a large section of the Alps, falling within the reconstructed glacier front (Ehlers et al., 2011).
The RegCM4 simulations also allow us to investigate the different elements affecting the hydrological and glaciological cycles. The lower 21 ka temperatures led to longer winters; as a consequence, this resulted in a more abundant snow amount on the ground that lasted until May over most of the Alpine region. Minimum snow amounts over the Alps are reached between August and September, when the first abundant snowfalls end the melting season. Despite the lower temperatures, the 21 ka melting snow is important due to the large amounts of snow persisting throughout the summer and leading to a permanent snow limit at about 1300
4.1 envELA – comparison with other studies
The model resolution presented here is among the highest found in palaeoclimate studies (Imhof, 2021; Ludwig et al., 2021; Velasquez et al., 2020; Velasquez et al., 2021). Therefore, the simulations provide more detailed information about PI and 21 ka climates compared to the MPI-ESM-P, particularly concerning the effect of complex topography. After a bias correction is applied to the model output using present-day observations, the precipitation and temperature patterns for 21 ka show good consistency with proxy records (Table S1 in the Supplement; Bartlein et al., 2010; Wu et al., 2007; Monegato et al., 2015) and other RCM studies (Strandberg et al., 2011; Ludwig et al., 2021; Kageyama et al., 2021; Stadelmaier et al., 2021). In the bias-corrected domain, few proxies are available for evaluating the simulated climate (Wu et al., 2007; Pini et al., 2022). The RegCM4 data show cooler and drier conditions for 21 ka, which is in agreement with the temperature and precipitation pollen-based reconstructions for the coldest and warmest months of the LGM (Wu et al., 2007). In line with other model studies, absolute values of simulated temperature and temperature anomalies underestimate the proxy values (Pini et al., 2022). This is possibly caused by model shortcomings or by the higher proxy sensitivity to climate extremes than to climatological mean states (Kageyama et al., 2006; Velasquez et al., 2021). However, our envELA reconstruction (Fig. 6) compares generally well with other local estimations for the LGM (e.g. Kuhlemann et al., 2008; Monegato, 2012; Rettig et al., 2021, 2023; Federici et al., 2017; Cossart et al., 2012).
Previous model-based studies providing extensive reconstructions of Alpine glaciers at the LGM directly model the glacier behaviour by considering the dynamics and ice rheology (Becker et al., 2016; Seguinot et al., 2018; Višnjević et al., 2020). Conversely, our method is based on an empirical equation which calculates the envELA from temperature and precipitation (Ohmura and Boettcher, 2018), and therefore, from the glaciological point of view, it is simpler than a glacier-model-based approach. Nevertheless, input data simulated with an RCM are more physically based and specific for the Alpine region.
The reconstruction of a higher envELA in the eastern and southwestern Alps, which has not yet been fully resolved in previous studies (Becker et al., 2016; Jouvet et al., 2017; Seguinot et al., 2018; Višnjević et al., 2020), is more consistent with geomorphological evidence. According to geomorphological records (Ehlers et al., 2011) in these two sectors, which host the Mur, Drava, Durance, and Maritime Alpine glaciers, a previous model-based reconstruction (Seguinot et al., 2018) apparently overestimated the glaciation by tens of kilometres. Likewise, an underestimation of the glacier extent was also found in previous studies for the Rhône Glacier complex, the Jura Mountains, the Lyon lobe, and the Adda, Garda and Piave sectors (Seguinot et al., 2018). Our results show a drop in the envELA in these sectors, which is more consistent with the geological reconstructions (Ehlers et al., 2011; Fig. 6). Similarly, the application of a constant climate forcing to an ice flow model (Becker et al., 2016) produced simulated glacier extents not consistent with the geological reconstructions of LGM moraine systems in the northern, eastern, and western Alps, although this model captured the meridional shift in the precipitation patterns across the Alps.
The use of high-resolution envELA information produced by the models can therefore integrate the understanding of glacier cycles and extent in the Alps. In fact, our palaeoclimate simulations describe the zonal and meridional temperature and precipitation gradients implied by the envELA calculations in great detail. Despite the different time responses of envELA and the glacier extension to changes in climate, since the envELA is directly related to temperature and precipitation while the glacier extension has a lag due to ice dynamics, according to Žebre et al. (2021), the envELA variations can be associated with variations in the front position and the effective ELA of glaciers (i.e. the ELA calculated from geodetic or direct glaciological mass balance measurements). Also, the envELA calculations allow a more detailed discussion of local differences in the geological reconstructions over the Alpine region.
4.2 Limitations of the experimental set-up
Our results are necessarily limited by uncertainties driving the large-scale climate forcing and by the intrinsic complexity of the glacier mass balance processes. In order to at least partially address these errors, a bias correction was applied to the RegCM4 output. However, further uncertainties can be introduced by calculating the correction function from limited observations, which may suffer from the rain gauge undercatch and the misrepresentation of high-altitude regions (Frei and Schär, 1998). In addition, the application of the same bias correction method to very different climate states may also add errors. For example, the assumption of stationarity in the biases does not consider variations in albedo (e.g. glacier extension and vegetation) and near-surface fluxes and moisture (Velasquez et al., 2020) from the PI to 21 ka.
Concerning the ELA, its distribution is determined by multiple factors that still cannot be entirely disentangled and represented with a model, e.g. avalanches, wind drifts, dust deposition, or debris fraction. A further uncertainty in the envELA calculations is due to liquid precipitation, which represents a potential mass loss (Žebre et al., 2021) and the applied lapse rate. As a matter of fact, our method calculates the envELA only from climate fields, which can provide accurate information when considering the whole Alpine chain but cannot capture the effects related to local topo-climatic conditions. As we are interested in the climate fields, the steady-state assumption and the ELA averaging over the whole simulation time masks the effects of outlier-anomalous years. Indeed, as shown by Žebre et al. (2021), a year-by-year envELA computation would reflect these events. Conversely, the effective ELA does not react quickly to extreme events, which is the result of snow accumulation and metamorphism also from previous years. In this framework, the envELA averaged over the 19 years of our simulations can provide a more reliable estimation of the effective ELA in terms of absolute values and temporal evolution. In fact, Žebre et al. (2021) pointed out that the envELA averaged over a long climate period shows a good match with the effective ELA of glaciers that are particularly susceptible to avalanches and windblown snow. Thus, the steady-state assumption enables us to at least reduce part of the deviation between effective and environmental ELA. On the other hand, the steady-state assumption implies that the dynamical and transient aspects of climate–glacier interactions are overlooked.
Our LGM simulation refers to 21 ka. This time does not correspond to the maximum glacier extension during the LGM, which occurred between 26.5 and 23 ka, although individual Alpine glaciers reached their maximum extent and started their retreat at different times in different sectors (Monegato et al., 2017; Seguinot et al., 2018). Because the withdrawal of the Alpine glacier had not yet started at 21 ka, we assume that 21 ka is a good approximation for average conditions during the LGM. In particular, radiocarbon dating and cosmogenic isotope dating (Ivy-Ochs et al., 2022; Kamleitner et al., 2022) show a late retreat (∼ 18 ka) for some glaciers in the southern Alps (Garda and Ticino), for which our calculations indicate a low envELA (Fig. 6), while the Dora Riparia, Dora Baltea, Piave, and Tagliamento glaciers started withdrawing earlier.
A possible uncertainty in our results is related to the model resolution and glacier thickness. In particular, the latter can modify not only the temperature patterns but also precipitation and wind fields. Due to the topography smoothing in the RegCM4 and the model's relatively coarse resolution, we did not include ice thickness in the simulations. This is in contrast with the approach followed by Merz et al. (2015), Imhof (2021), and Velasquez et al. (2022). However, in contrast to our work, these studies are based on climate data at a much higher resolution (2 km for Imhof, 2021, and Velasquez et al., 2022) or focused on regions with a very different topography compared to the Alps (Laurentide ice sheet and North Atlantic for Merz et al., 2015), where, at the LGM, the ice build-up generated a 4000 m high orographic barrier over a previously ice-free region. Conversely, during the LGM, the Alps were characterized by ice domes and valley glaciers (Kelly et al., 2004; Ivy-Ochs et al., 2022) generally narrower than our model resolution (12 km), and they did not strongly modify the main Alpine range profile. However, where the valleys are larger (Garda and Rhône), this approach might introduce some uncertainty in the envELA estimations. The RegCM4 model cannot capture the multitude of small glaciers present at the PI over the whole Alpine region but can identify areas in which the envELA is lower than the model topography, which mostly occur in the western Alps (Fig. S7). Conversely, at 21 ka, the larger glacier systems are better captured by the model (Fig. 6b).
4.3 Links between glacier behaviour and topography
Our results suggest a particularly low envELA (750–1250 ) in the Rhine, Rhône, and Ticino valley knot (Fig. 6), which is where the Rhine and Rhône ice domes are located (Kelly et al., 2004) at an elevation higher than 4000 To the south, the reconstructed glaciers originated from a largely glaciated area (about 5500 km2), including the Verbano and Ossola branches, with contributions from the Rhône glacier in the northern Alps (Kamleitner et al., 2022; Preusser et al., 2011; Scapozza et al., 2014). The accumulation basin of these glaciers is asymmetric and characterized by an elevated (< 4000 m) Ossola valley and a large but lower-elevation Ticino valley network. A low envELA (Fig. 6) is common between the Ossola and Verbano glaciers and the Rhône and Rhine glaciers to the north, which formed the largest piedmont lobes of the Alps. The northern Alpine glaciers were often characterized by large lobes with respect to the accumulation basins, while in the southern and eastern Alps, the piedmont lobes are smaller but with large basins (Dora Baltea, Ticino, Adda, Adige–Sarca, and Drau). The asymmetry of the lobe of the glaciers between the northern and southern Alps is evident also in Fig. 6b, where we show only the grid cells for which the envELA lies below the topography (i.e. where the model supports the formation and maintenance of a glacier). The LGM glacier extent reconstructed by Ehlers et al. (2011) in the northern Alpine foreland is much farther from the lowest glaciated areas than in the southern Alps, which is the consequence of the topography, accumulation basin, and climatology driving the development of the piedmont lobes.
By comparing our results with Seguinot et al. (2018) and Becker et al. (2016), it emerges that the distribution and dimension of Alpine glaciers is determined by a multitude of factors which also regulate the ELA distribution. Thus, it is not straightforward to associate the accumulation basin dimension and elevation with the ELA distribution. This can help us to understand the discrepancies between palaeoglaciological models and ground-based data.
4.4 envELA and geological reconstructions
In the Julian Alps and Carnic Alps, our envELA calculations indicate values at 21 ka of about 1000–1250 (Fig. 6), which are consistent with reconstructions spanning the range of 1130 to 1300 (Kuhlemann et al., 2008; Monegato, 2012; Rettig et al., 2021). In the Pennine Alps and Graian Alps, our estimates are in the range of 1250 to 1750 , with good consistency with the values of 1500 found by Forno et al. (2010). Our data show a particularly high envELA (2000–2250 ) in the Monviso area, characterized by high-elevation (3841 ) but small LGM glaciers. In the Maritime Alps, our envELA is between 1500 and 2250 , matching the range values of 1685 to 1845 proposed by Federici et al. (2017).
The envELA estimates for the PI (Fig. S5) can be compared with different studies of the Little Ice Age (LIA). For example, Colucci (2016) placed the ELA in the Julian Alps at 2275 for the Canin glacier and at 2486 for the Triglav Glacier, while our results yield lower values of 1750–2000 The ELA in the Ecrins group and Maritime Alps has been estimated at 3000–3100 and 2841–2818 , respectively (Federici et al., 2017; Cossart et al., 2012), which is in agreement with our results of 2750–3000 Our estimate for the envELA in the Val Viola area, central Italian Alps, is in the range of 2500–2750 , while Scotti et al. (2017) place it at 2815–2850 It is important to stress that the envELA calculated here is based on temperature and precipitation only and is completely independent of the local physiography of the site of the glacier, while the reconstructions take into account local geomorphological evidence and are dependent on the site. This may at least partially explain the differences between our estimates and the reconstructed ones. Discrepancies with field reconstructions could also depend on dust, cloud cover, and, more in general, on radiation-related fields, which are not taken into account in this work.
The decrease in envELA at the LGM compared to PI (Fig. S7) averaged over the Alpine region is 991 m, which is close to the values of 996 and 1000–1200 m suggested by Federici et al. (2017) and Ivy-Ochs et al. (2006), respectively. The western and eastern Alps (east of about 13∘ E) show smaller envELA decreases, mostly lower than 1000 m, while in the central Alps (west of about 13∘ E), the decrease ranges between 1040 and 1126 m. This longitudinal gradient is in agreement with values provided by Federici et al. (2017) and Ivy-Ochs et al. (2006). In particular, palaeo reconstructions show that in the southern Alps there was a substantial decrease in envELA over the Tagliamento glaciers and in the Ticino region. Differently from Višnjević et al. (2020), in the central Alps we find a north–south ELA gradient, with the ELA increasing from south to north, while in the eastern Alps there is almost no gradient, and in the western Alps, the ELA decreases from west to east. This result may be explained by the seasonality of precipitation in the different sectors (Fig. 5) driven by the annual shifting of the polar front.
4.5 Atmospheric circulation
At 21 ka the Alps essentially separated dry and cold central Europe from the milder and relatively wetter southern Alpine region (Figs. 2 and 3). The overall cooling and drying over Europe during the LGM are a typical response of LGM climate model simulations (e.g. Ludwig et al., 2017; Stadelmaier et al., 2021; Velasquez et al., 2021). The RegCM4 simulations suggest that the reduced precipitation in the northern Alps during the LGM was caused by the interplay of lower temperatures inhibiting convection, as also hypothesized by Velasquez et al. (2022), by the southward displacement of the North Atlantic storm track, the main source of moisture for Europe (Florineth and Schlüchter, 2000; Laîné et al., 2009; Ludwig et al., 2016, 2017; Raible et al., 2021), and by the drying effect of the Scandinavian ice sheet (Schaffernicht et al., 2020). In agreement with previous studies (Ludwig et al., 2016; Stadelmaier et al.; 2021), we also found reduced westerly winds and increased north-northeasterly winds in central Europe (Figs. 2, 5, and S4), which are eventually caused by the anticyclonic circulation triggered by the permanent high-pressure system over the Scandinavian ice sheet and are also responsible for enhanced dust storm activity and loess deposition (Schaffernicht et al., 2020; Raible et al., 2021).
Our results suggest that during the LGM, the southern portion of the European region is characterized by increased wind activity, particularly over the Mediterranean areas, with meridional flows during winter and zonal flows during summer (Fig. 2), as suggested by Kuhlemann et al. (2008). These average patterns possibly reflect the influence of seasonal variations in the polar front position. In the RegCM4 simulations, winters show dominant northwesterly winds driven by enhanced meridional geostrophic circulation due to the marked temperature and sea level pressure gradients between the northern and southern parts of the domain at 21 ka. Conversely, the warmer months are characterized by a more frequent cyclonic circulation over the Gulf of Genoa, which leads to southwesterly winds in the southeastern Alps. This wind pattern supports the hypothesis of Kuhlemann et al. (2008), which suggests more frequent and/or persistent polar air outbreaks over the western Mediterranean, causing recurring cyclogenesis over the Gulf of Genoa. In agreement with Kuhlemann et al. (2008) and differently from other climate model studies (Laîné et al., 2009; Velasquez et al., 2022), our simulations do not support a purely zonal and generally drier LGM atmospheric circulation south of the Alps but identify the alternation of winter and summer conditions. Also, Ludwig et al. (2016) reported more frequent westerly and cyclonic circulation weather types compared to the PI for southern Europe, and Ludwig et al. (2018) suggest that this region, particularly the Gulf of Genoa, was wetter compared to central Europe and to adjacent periods. Our results show that in the southern sector of the Po plain, towards the northern Apennines, a wide area of a positive winter precipitation anomaly (Fig. 4) is likely linked to “stau” effects and orographic precipitation due to frequent easterly–northeasterly bora wind events (Ludwig et al., 2021).
When cold polar air crossing the western Alps reaches the warmer Tyrrhenian Sea, the thermal contrast destabilizes the lower troposphere, leading to the development of lee-side cyclonic circulations and convective phenomena (Kuhlemann et al., 2008) along a storm track extending in the eastern–northeastern direction. Our 21 ka RegCM4 simulations, in agreement with Luetscher et al. (2015) and Ludwig et al. (2016), indeed, show high precipitation rates from May to September on the upwind side of the circulations with respect to the Mediterranean jet in the Apennines, Balkans, and southern Alps. These regions, despite their low latitude, low elevation, and southern exposure, hosted several glaciers during the LGM (Rettig et al., 2023). In particular, the Tagliamento glacier (Fig. 5) received heavy precipitation from the southwest, which occurred at higher rates during the warmer months. This contradicts the findings of Velasquez et al. (2021, 2022), who, when analysing high-resolution LGM climate simulations over the Alps, obtained significantly heavier precipitation rates during winter than during summer, with maxima in the western Alps. Winter precipitation anomalies in the work of both Velasquez et al. (2021, 2022) and our study present negative values north of the Alps and positive values in the south. Conversely, differently from Velasquez et al. (2021, 2022), during summer we find a positive precipitation anomaly in the southern part of the domain (Fig. 4). This result suggests increased convection and cyclonic circulation in the northern Tyrrhenian region at 21 ka. The discrepancies with Velasquez et al. (2022) are possibly caused by differences in the driving GCM, in the way convection is represented in the RCMs, and in the bias correction applied in this study. In addition, also during the colder months, lee-side cyclones in the Tyrrhenian Sea led to heavy precipitation on the southern Alpine slopes (Figs. 5 and 7). Similarly, Ludwig et al. (2016) found only a slight decrease in precipitation occurring during the LGM south of the Alps, which was explained by enhanced LGM cyclonic activity compensating for the reduced precipitation from other circulation weather types.
We find that in the southern Alps at 21 ka, stratiform precipitation originated from a cyclonic circulation that prevailed during the coldest months and at the highest elevations, while in summer, convection was more frequent and often in the form of snowfall. This type of precipitation plays a critical role in preserving the glacier from summer melting and lowering the ELA.
The mechanism suggested by our simulations is that at 21 ka, a well-defined southerly displacement of the westerlies led to a colder and drier central Europe and a relatively wetter southern European region, which is in agreement with Monegato et al. (2017), Luetscher et al. (2015), Kuhlemann et al. (2008), and Ludwig et al. (2016). The envELA over the Alps was substantially lowered, with values increasing from south to north over the central Alps (Ivy-Ochs et al., 2006). Such a pattern is sustained by increased summer snowfall often reaching low elevations and feeding the Alpine glaciers (Rettig et al., 2023). In the southern Alpine region, summer precipitation was mainly of convective origin, while during the rest of the year stratiform precipitation prevailed, often originating from a cyclonic circulation that developed over the Tyrrhenian Sea. In the northern Alps, precipitation was modest and occurred mainly in summer when the polar front moved northward and some limited convection occurred.
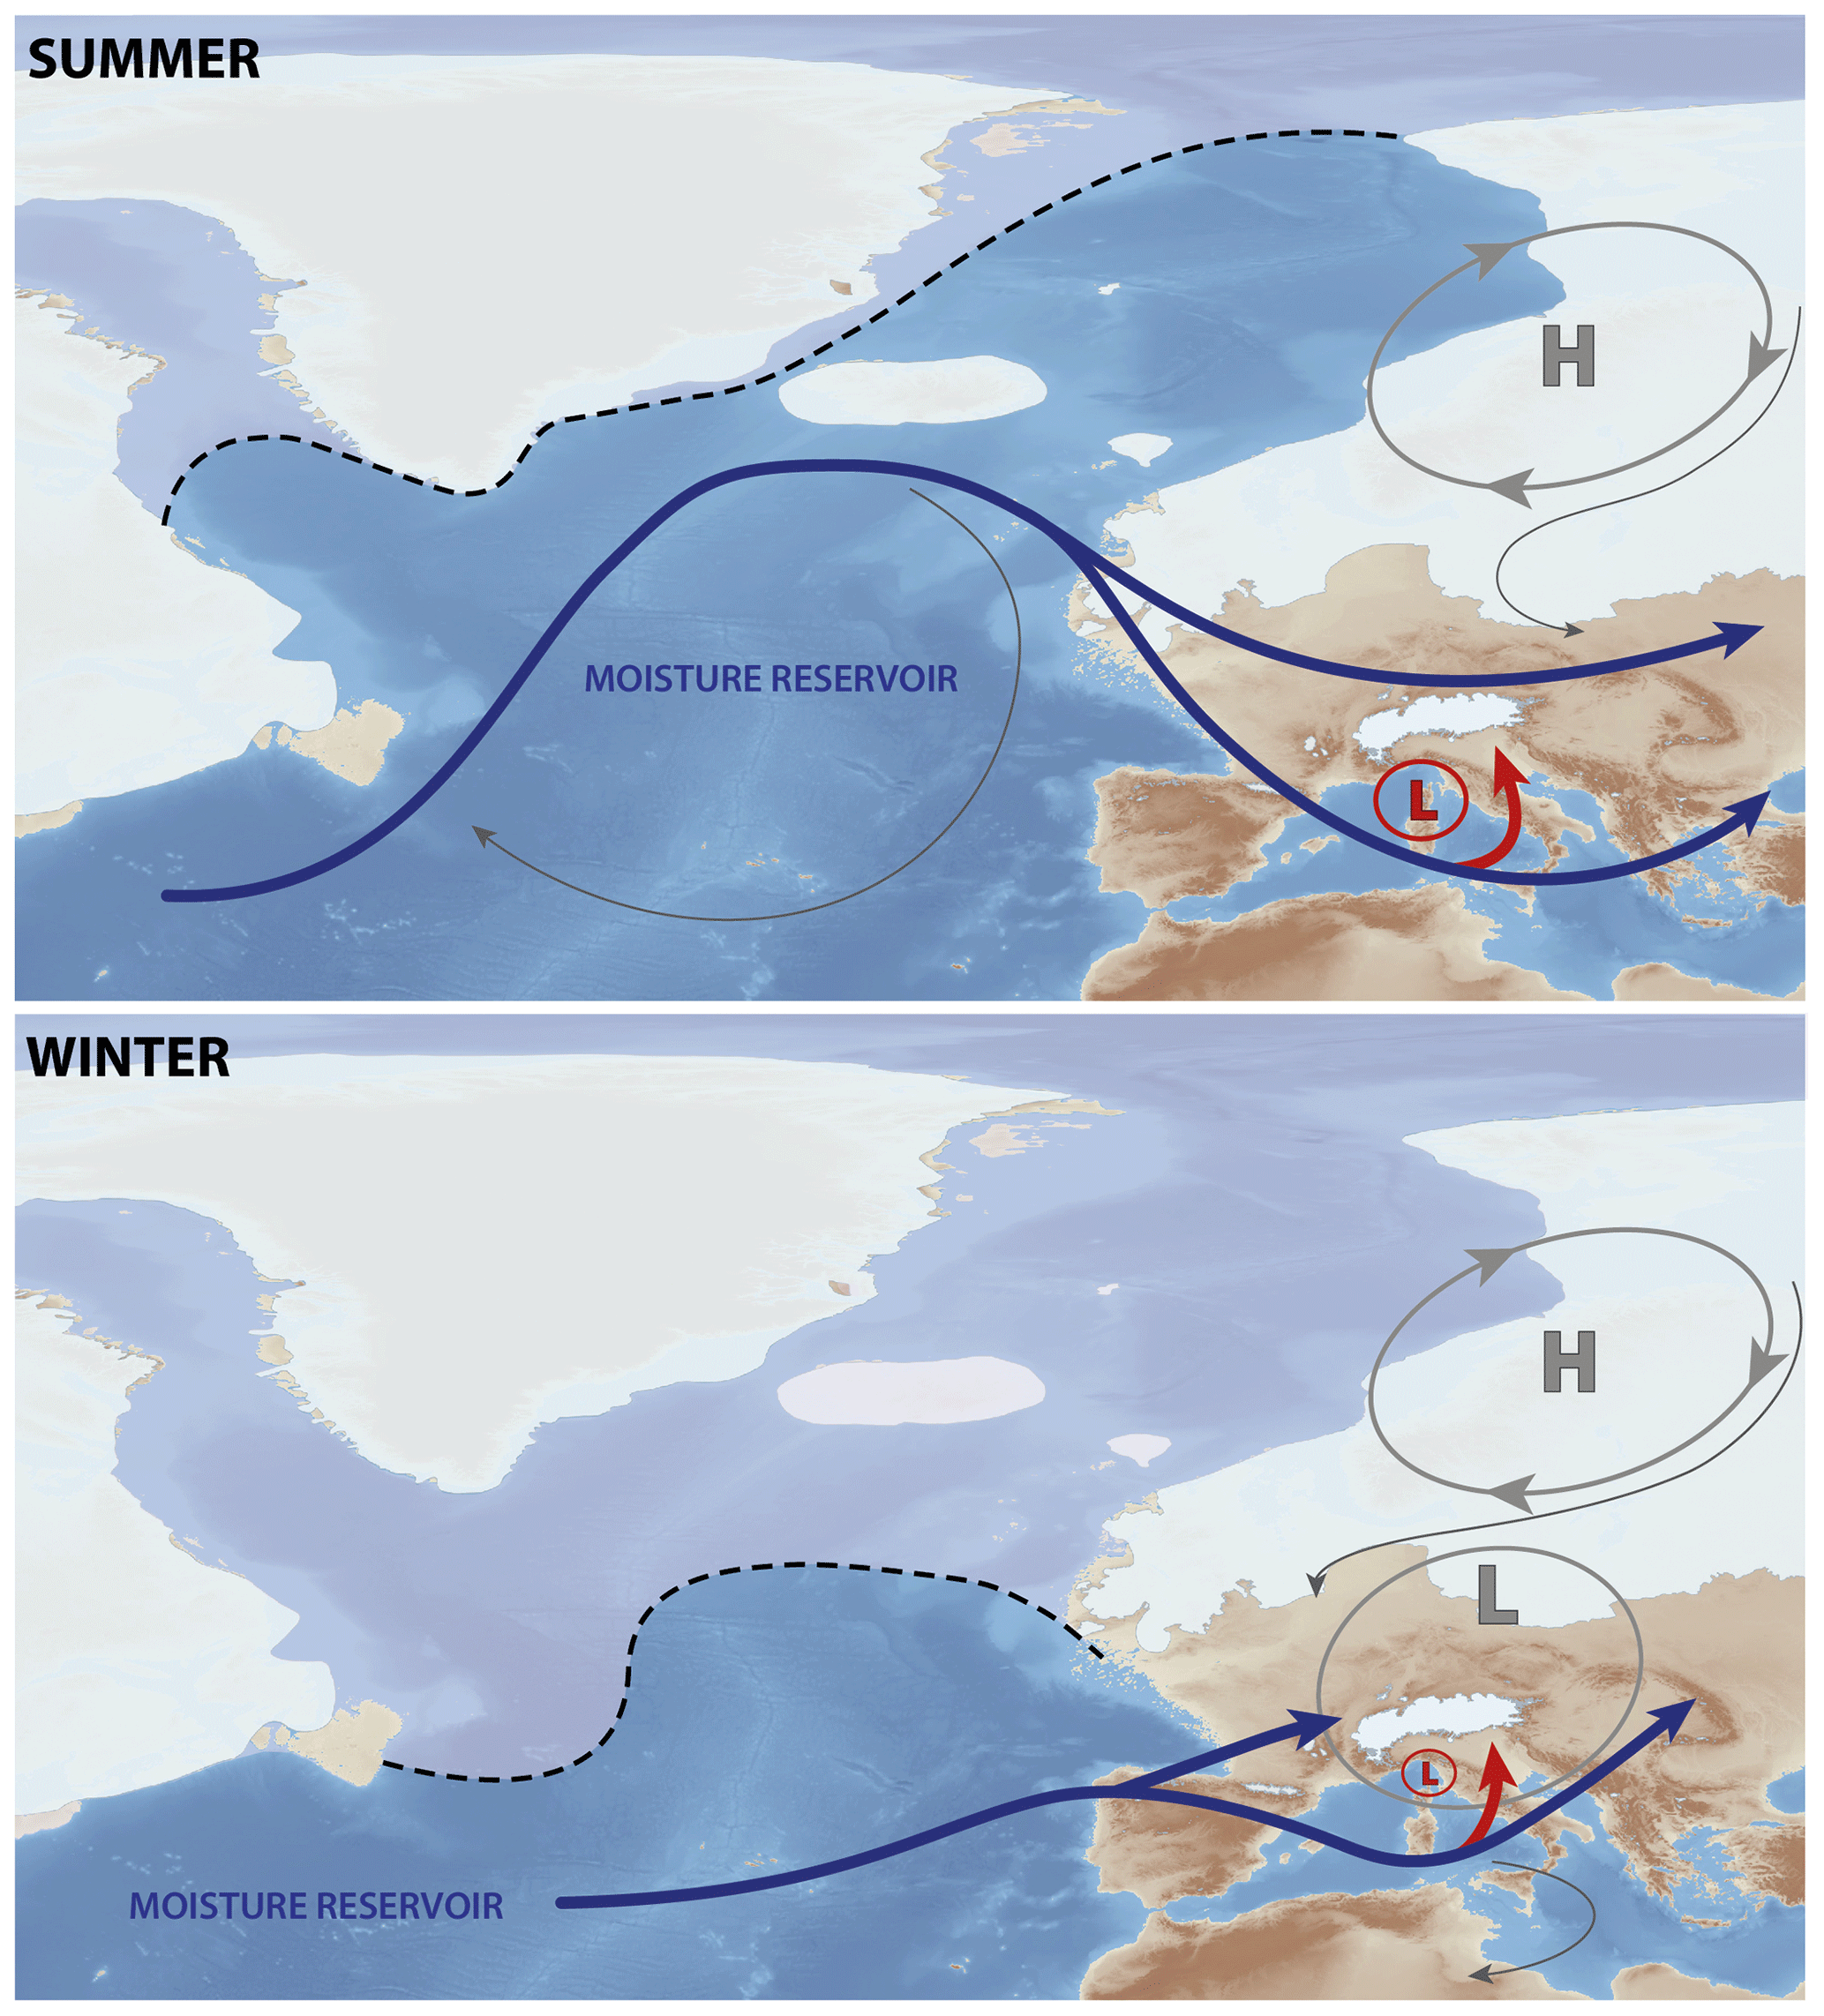
Figure 7Conceptual model of the air masses yielding precipitation in the Alps at 21 ka. Glaciers and ice sheets are shown in white. The black line marks the sea ice extension (Paul et al., 2020). The letters H and L stand for high-pressure and low-pressure systems. Blue and red arrows represent the air masses leading precipitation on the Alps. Grey lines represent other air masses not leading precipitation on the Alps. Blue and grey arrows are extrapolated from the mean winter and summer MPI-ESM-P 850 hPa winds, while the red symbols show the elements that emerged from the RegCM4 simulations.
Wind direction and associated precipitation (Fig. 5) suggest that a change in the position of the moisture reservoirs between summer and winter at 21 ka (Fig. 7) likely drove the precipitation patterns in the northern and southern Alpine regions and consequently controlled the glacier dynamics (Fig. 6). In the southern Alps, the humidity was provided mainly by the Mediterranean Sea which, being relatively warm and also ice-free in winter, acted as a moisture reservoir all year round. The path followed by moist air masses leading to precipitation in the northern Alps was largely dependent on the sea ice extension in the North Atlantic Ocean. During summer, the North Atlantic was almost ice-free (dashed black lines in Fig. 7; Paul et al., 2020), representing the source of moisture for central Europe. Conversely, during winter, the North Atlantic sea ice extended southwards (Fig. 7; Paul et al., 2020), reducing the area of the moisture reservoir and causing the moist air masses to reach Europe from a southern position. In this framework, the southern Alpine glaciers were fed throughout the year by Mediterranean moisture forced northward by the low-pressure system centred over the Gulf of Genoa (Fig. 7).
In summary, the Genoa low and the relatively warm Mediterranean temperatures were responsible for frequent and intense precipitation events over the southern Alps, while the northern Alpine glaciers were subject to weaker and more sparse precipitation (Raible et al., 2021) with a predominance of perturbations from the northwest in summer and the west in winter (as driven by the sea ice extent). These circulation patterns can explain the large piedmont glaciers extending in the southern Alpine foreland and the reconstructed envELA gradient across the Alps (Fig. 5).
In this work, we disentangled the contributions of the atmospheric circulation components and thermodynamic conditions leading to the Alpine glacier advance during the last phase of the LGM using a modelling approach. We highlight that the resolution of our model simulations is among the highest found in palaeoclimate studies, and this allows us to obtain much higher spatial detail compared to previous work dealing with this issue.
The high-resolution RegCM4 output data were then used to calculate the environmental equilibrium line altitude (envELA) over the Alpine region, providing new detailed and physically based information on the Alpine glaciers at 21 ka and at PI conditions. Our reconstruction allows us to better understand the different behaviours of the Alpine glaciers in light of the morphology of their accumulation basins and some of the shortcomings between previous LGM glacier reconstructions based on ice flow dynamics and geomorphological evidence. Our method is based only on simulated temperature and precipitation and is independent of local characteristics of the glacier site (dust and avalanches).
In agreement with the available literature and pollen-based proxies, our results show much drier and colder 21 ka conditions than during PI times over the Alpine region. Differences in the precipitation regimes across the Alps were caused by the southward displacement of the North Atlantic storm track, temperature differences controlling convective phenomena, and the frequent and persistent occurrence of cyclones and anticyclones. In particular, in the northern Alps, precipitation was sparse and weak, as the Atlantic storm track was located south of the Alps and was subject only to a small seasonal variability caused by the Atlantic sea ice extension. Conversely, the southern Alpine region received frequent and abundant precipitation due to the interplay of the Genoa low with the relatively warm Mediterranean Sea and convective phenomena. These, in particular, led to summer snowfall at low elevations, preserving the glaciers and lowering the ELA. We suggest that the seasonal variation in sea ice extent was an important mechanism modulating the LGM southward shift in the westerlies.
Our work represents also the first application of the RegCM4 model to palaeoclimate studies over the Alps. Thus, we provide a new dataset composed of climate and envELA information, which can be employed in future studies of the LGM and PI–LIA. These results further demonstrate the great potential for the use of RCM-simulated high-resolution palaeoclimate data in the study of the past cryosphere.
The data are available at https://doi.org/10.5281/zenodo.7278461 (Del Gobbo et al., 2023).
The supplement related to this article is available online at: https://doi.org/10.5194/cp-19-1805-2023-supplement.
Conceptualization: RRC and FG. Methodology: CDG, RRC, and FG. Investigation: CDG. Visualization: CDG. Supervision: RRC and FG. Writing the original draft: CDG, RRC, and FG. Review and editing: CDG, RRC, GM, MŽ, and FG.
The contact author has declared that none of the authors has any competing interests.
Publisher's note: Copernicus Publications remains neutral with regard to jurisdictional claims in published maps and institutional affiliations.
We would like to thank Johann Jungclaus (Max Planck Institute for Meteorology) for providing the MPI-ESM-P simulations; Graziano Giuliani (International Centre for Theoretical Physics) for adapting the RegCM4 model to palaeoclimate applications; and Riccardo Scotti for the comments and corrections. We are thankful to Julien Seguinot, two anonymous reviewers, and the editor, Irina Rogozhina, for the constructive comments that helped us to improve our paper.
Costanza Del Gobbo has received a doctoral grant from the University of Trieste (Earth Science, Fluid Dynamics, and Mathematics – Interactions and Methods, Department of Mathematics and Geosciences) and a research fellow grant from the International Centre for Theoretical Physics. Manja Žebre has received funding from the Slovenian Research Agency (ARRS) under the programme Dynamic Earth (grant no. P1-0419) and the project Past climate change and glaciation at the Alps–Dinarides junction (grant no. J1-2479).
This paper was edited by Irina Rogozhina and reviewed by Julien Seguinot and two anonymous referees.
Ahlmann, H. W. S.: Le niveau de glaciation comme fonction de l'accumulation d'humidité sous forme solide: Méthode pour le calcul de l'humidité condensée dans la haute montagne et pour l'étude de la fréquence des glaciers, Geogr. Ann., 6, 223–272, https://doi.org/10.1080/20014422.1924.11881098, 1924.
Amante, C. and Eakins, B.: ETOPO1 1 Arc-Minute Global Relief Model: Procedures, data sources and analysis, NOAA technical memorandum NESDIS NGDC-24, National Geophysical Data Center, NOAA, https://doi.org/10.7289/V5C8276M, 2009.
Anderson, R. S., Anderson, L. S., Armstrong, W. H., Rossi, M. W., and Crump, S. E.: Glaciation of alpine valleys: The glacier-debris-covered glacier-rock glacier continuum, Geomorphology, 311, 127–142, https://doi.org/10.1016/j.geomorph.2018.03.015, 2018.
Annan, J. D. and Hargreaves, J. C.: A new global reconstruction of temperature changes at the Last Glacial Maximum, Clim. Past, 9, 367–376, https://doi.org/10.5194/cp-9-367-2013, 2013.
Annan, J. D., Hargreaves, J. C., and Mauritsen, T.: A new global surface temperature reconstruction for the Last Glacial Maximum, Clim. Past, 18, 1883–1896, https://doi.org/10.5194/cp-18-1883-2022, 2022.
Auer, I., Böhm, R., Jurkovic, A., Lipa, W., Orlik, A., Potzmann, R., Schöner, W., Ungersböck, M., Matulla, C., Briffa, K., Jones, P., Efthymiadis, D., Brunetti, M., Nanni, T., Maugeri, M., Mercalli, L., Mestre, O., Moisselin, J.-M., Begert, M., Müller-Westermeier, G., Kveton, V., Bochnicek, O., Stastny, P., Lapin, M., Szalai, S., Szentimrey, T., Cegnar, T., Dolinar, M., Gajic-Capka, M., Zaninovic, K., Majstorovic, Z., and Nieplova, E.: HISTALP-historical instrumental climatological surface time series of the Greater Alpine Region, Int. J. Climatol., 27, 17–46, https://doi.org/10.1002/joc.1135, 2007.
Ban, N., Schmidli, J., and Schär, C.: Evaluation of the convection-resolving regional climate modeling approach in decade-long simulations, J. Geophys. Res.-Atmos., 119, 7889–7907, https://doi.org/10.1002/2014JD021478, 2014.
Bartlein, P. J., Harrison, S. P., Brewer, S., Connor, S., Davis, B. A. S., Gajewski, K., Guiot, J., Harrison-Prentice, T. I., Henderson, A., Peyron, O., Prentice, I. C., Scholze, M., Seppä, H., Shuman, B., Sugita, S., Thompson, R. S., Viau, A. E., Williams, J., and Wu, H.: Pollen-based continental climate reconstructions at 6 and 21 ka: A global synthesis, Clim. Dynam., 37, 775–802, https://doi.org/10.1007/s00382-010-0904-1, 2010.
Becker, P., Seguinot, J., Jouvet, G., and Funk, M.: Last Glacial Maximum precipitation pattern in the Alps inferred from glacier modelling, Geogr. Helv., 71, 173–187, https://doi.org/10.5194/gh-71-173-2016, 2016.
Berger, A.: Long-term variations of caloric insolation resulting from the Earth's orbital elements, Quaternary Res., 9, 139–167, https://doi.org/10.1016/0033-5894(78)90064-9, 1978.
Braconnot, P., Harrison, S. P., Kageyama, M., Bartlein, P. J., Masson-Delmotte, V., Abe-Ouchi, A., Otto-Bliesner, B., and Zhao, Y.: Evaluation of climate models using palaeoclimatic data, Nat. Clim. Change, 2, 417–424, https://doi.org/10.1038/NCLIMATE1456, 2012.
Casanueva, A., Kotlarski, S., Herrera, S., Fernández, J., Gutiérrez, J. M., Boberg, F., Colette, A., Christensen, O. B., Goergen, K., Jacob, D., Keuler, K., Nikulin, G., Teichmann, C., and Vautard, R.: Daily precipitation statistics in a EURO-CORDEX RCM ensemble: Added value of raw and bias-corrected high-resolution simulations, Clim. Dynam., 47, 719–737, https://doi.org/10.1007/s00382-015-2865-x, 2016.
Clark, P. U., Dyke, A. S., Shakun, J. D., Carlson, A. E., Clark, J., Wohlfarth, B., Mitrovica, J. X., Hostetler, S. W., and McCabe, A. M.: The Last Glacial Maximum, Science, 325, 710–714, https://doi.org/10.1126/science.1172873, 2009.
Cogley, J. G., Hock, R., Rasmussen, L. A., Arendt, A. A., Bauder, A., Braithwaite, R. J., Jansson, P., Kaser, G., Möller, M., Nicholson, L., and Zemp, M.: Glossary of Glacier Mass Balance and Related Terms, IHP-VII Technical Documents in Hydrology No. 86, IACS Contribution No. 2, UNESCO-IHP, Paris, 2011.
Colucci, R. R.: Geomorphic influence on small glacier response to post-Little Ice Age climate warming: Julian Alps, Europe, Earth Surf. Processes, 41, 1227–1240, https://doi.org/10.1002/esp.3908, 2016.
Cossart, E., Fort, M., Bourlès, D., Braucher, R., Perrier, R., and Siame, L.: Deglaciation pattern during the Lateglacial/Holocene transition in the southern French Alps. Chronological data and geographical reconstruction from the Clarée Valley (upper Durance catchment, southeastern France), Palaeogeogr. Palaeocl., 315, 109–123, https://doi.org/10.1016/j.palaeo.2011.11.017, 2012.
Danielson, J. J. and Gesch, D. B.: Global multi-resolution terrain elevation data 2010 (GMTED2010), Tech. rep., US Geological Survey, https://doi.org/10.3133/ofr20111073, 2011.
Dee, D. P., Uppala, S. M., Simmons, A. J., Berrisford, P., Poli, P., Kobayashi, S., Andrae, U., Balmaseda, M. A., Balsamo, G., Bauer, D. P., Bechtold, Beljaars, A. C. M., van de Berg, L., Bidlot, J., Bormann, N., Delsol, C., Dragani, R., Fuentes, M., Geer, A. J., Haimberger, L., Healy, S. B., Hersbach, H., Hólm, E. V., Isaksen, L., Kållberg, P., Köhler, M., Matricardi, M., McNally, A. P., Monge-Sanz, B. M., Morcrette, J.-J., Park, B.-K., Peubey, C., de Rosnay, P., Tavolato, C., Thépaut, J.-N., and Vitart, F.: The ERA-Interim reanalysis: Configuration and performance of the data assimilation system, Q. J. Roy. Meteor. Soc., 137, 553–597, https://doi.org/10.1002/qj.828, 2011.
Del Gobbo, C.: Use of the Regional Climate Model RegCM4 to assess circulation, precipitation and temperature patterns sustaining the Tagliamento glacier (southeastern Alps) at 21 ka, PhD, University of Trieste, Trieste, https://hdl.handle.net/11368/2988360 (last access: 14 September 2023), 2021.
Del Gobbo, C., Colucci, R. R., Monegato, G., Žebre, M., and Giorgi, F.: Atmosphere–cryosphere interactions during the last phase of the LGM (21 ka BP) in the European Alps (Version 02), Zenodo [data set], https://doi.org/10.5281/zenodo.7278461, 2023.
Duprat-Oualid, F., Rius, D., Bégeot, C., Magny, M., Millet, L., Wulf, S., and Appelt, O.: Vegetation response to abrupt climate changes in Western Europe from 45 to 14.7 k cal a BP: The Bergsee lacustrine record (Black Forest, Germany), J. Quaternary Sci., 32, 1008–1021, https://doi.org/10.1002/jqs.2972, 2017.
Ehlers, J., Gibbard, P. L., and Hughes, P. D. (Eds.): Quaternary Glaciations – Extent and Chronology. A Closer Look, Elsevier Science, London, ISBN 9780444534477, 2011.
Elguindi, N., Bi, X., Giorgi, F., Nagarajan, B., Pal, J., Solmon, F., Rauscher, S., Zakey, A., O'Brien, T., Nogherotto, R., and Giuliani, G.: Regional Climate Model RegCM, Reference Manual Version 4.5, Tech. Rep., Abdus Salam ICTP, Zenodo [code], https://doi.org/10.5281/zenodo.4603616, 2014.
Federici, P. R., Ribolini, A., and Spagnolo, M.: Glacial history of the Maritime Alps from the Last Glacial Maximum to the Little Ice Age, Geol. Soc. Spec. Publ., 433, 137–159, https://doi.org/10.1144/SP433.9, 2017.
Florineth, D. and Schlüchter, C.: Alpine Evidence for Atmospheric Circulation Patterns in Europe during the Last Glacial Maximum, Quaternary Res., 54, 295–308, https://doi.org/10.1006/qres.2000.2169, 2000.
Fontana, A., Mozzi, P., and Marchetti, M.: Alluvial fans and megafans along the southern side of the Alps, Sediment. Geol., 301, 150–171. https://doi.org/10.1016/j.sedgeo.2013.09.003, 2014.
Forno, M. G., Gianotti, F., and Gianluca, R.: Significato paleoclimatico dei rapporti tra il glacialismo principale e quello tributario nella bassa Valle della Dora Baltea, Il Quaternario – Italian Journal of Quaternary Sciences, 23, 105–124, 2010.
Frei, C. and Schär, C.: A precipitation climatology of the Alps from high-resolution rain-gauge observations, Int. J. Climatol., 18, 873–900, 1998.
García-Valdecasas Ojeda, M., Di Sante, F., Coppola, E., Fantini, A., Nogherotto, R., Raffaele, F., and Giorgi, F.: Climate change impact on flood hazard over Italy, J. Hydrol., 615, 128628, https://doi.org/10.1016/j.jhydrol.2022.128628, 2022.
Giorgi, F.: Thirty years of regional climate modeling: Where are we and where are we going next?, J. Geophys. Res.-Atmos., 124, 5696–5723, https://doi.org/10.1029/2018JD030094, 2019.
Giorgi, F., Coppola, E., Solmon, F., Mariotti, L., Sylla, M., Bi, X., Elguindi, N., Diro, G., Nair, V., Giuliani, G., Turuncoglu, U., Cozzini, S., Güttler, I., O'Brien, T., Tawfik, A., Shalaby, A., Zakey, A., Steiner, A., Stordal, F., Sloan, L. C., and Brankovic, C.: RegCM4: model description and preliminary tests over multiple CORDEX domains, Clim. Res., 52, 7–29, https://doi.org/10.3354/cr01018, 2012.
Gómez-Navarro, J. J., Raible, C. C., Bozhinova, D., Martius, O., García Valero, J. A., and Montávez, J. P.: A new region-aware bias-correction method for simulated precipitation in areas of complex orography, Geosci. Model Dev., 11, 2231–2247, https://doi.org/10.5194/gmd-11-2231-2018, 2018.
Haeberli, W., Hoelzle, M., Paul, F., and Zemp, M.: Integrated monitoring of mountain glaciers as key indicators of global climate change: The European Alps, Ann. Glaciol., 46, 150–160, https://doi.org/10.3189/172756407782871512, 2007.
Harris, I., Jones, P., Osborn, T., and Lister, D.: Updated high-resolution grids of monthly climatic observations – the CRU TS3.10 Dataset, Int. J. Climatol., 34, 623–642, https://doi.org/10.1002/joc.3711, 2014.
Hughes, P. D., Gibbard, P. L., and Ehlers, J.: Timing of glaciation during the last glacial cycle: Evaluating the concept of a global 'Last Glacial Maximum' (LGM), Earth-Sci. Rev., 125, 171–198, https://doi.org/10.1016/j.earscirev.2013.07.003, 2013.
Huss, M. and Hock, R.: A new model for global glacier change and sea-level rise, Front. Earth Sci., 3, 54, https://doi.org/10.3389/feart.2015.00054, 2015.
Imhof, M. A.: Combined climate-ice flow modelling of the Alpine ice field during the Last Glacial Maximum, PhD, VAW-ETH, https://doi.org/10.3929/ethz-b-000483937, 2021.
Isotta, F. A., Frei, C., Weilguni, V., Perčec Tadić, M., Lassègues, P., Rudolf, B., Pavan, V., Cacciamani, C., Antolini, G., Ratto, S. M., Munari, M., Micheletti, S., Bonati, V., Lussana, C., Ronchi, C., Panettieri, E., Marigo, G., and Vertačnik, G.: The climate of daily precipitation in the Alps: Development and analysis of a high-resolution grid dataset from pan-Alpine rain-gauge data, Int. J. Climatol. 34, 1657–1675, https://doi.org/10.1002/joc.3794, 2014.
Ivy-Ochs, S., Schäfer, J., Kubik, P. W., Synal, H. A., and Schlüchter, C.: Timing of deglaciation on the northern Alpine foreland (Switzerland), Eclogae Geol. Helv., 97, 47–55, https://doi.org/10.1007/s00015-004-1110-0, 2004.
Ivy-Ochs, S., Kerschner, H., Kubik, P. W., and Schlüchter, C.: Glacier response in the European Alps to Heinrich Event 1 cooling: The Gschnitz stadial, J. Quaternary Sci, 21, 115–130, https://doi.org/10.1002/jqs.955, 2006.
Ivy-Ochs, S., Monegato, G., and Reitner, J. M.: The Alps: Glacial landforms from the Last Glacial Maximum, in: European Glacial Landscapes: Maximum Extent of Glaciations, edited by: Palacios, D., Hughes, P. D., García Ruiz, J. M., de Andrés, N., Elsevier, Amsterdam, 449–460, https://doi.org/10.1016/B978-0-12-823498-3.00008-X, 2022.
Jost, A, Lunt, D, Kageyama, M, Abe-Ouchi, A, Peyron, O, Valdes, P., and Ramstein, G.: High-resolution simulations of the last glacial maximum climate over Europe: A solution to discrepancies with continental palaeoclimatic reconstructions?, Clim. Dynam., 24, 577–590, https://doi.org/10.1007/s00382-005-0009-4, 2005.
Jouvet, G., Seguinot, J., Ivy-Ochs, S., and Funk, M.: Modelling the diversion of erratic boulders by the Valais Glacier during the last glacial maximum, J. Glaciol., 63, 487–498, https://doi.org/10.1017/jog.2017.7, 2017.
Kageyama, M., Laîné, A., Abe-Ouchi, A., Braconnot, P., Cortijo, E., Crucifix, M., de Vernal, A., Guiot, J., Hewitt, C. D., and Kitoh, A.: Last Glacial Maximum temperatures over the North Atlantic, Europe and western Siberia: A comparison between PMIP models, MARGO sea–surface temperatures and pollen-based reconstructions, Quaternary Sci. Rev., 25, 2082–2102, https://doi.org/10.1016/j.quascirev.2006.02.010, 2006.
Kageyama, M., Harrison, S. P., Kapsch, M.-L., Lofverstrom, M., Lora, J. M., Mikolajewicz, U., Sherriff-Tadano, S., Vadsaria, T., Abe-Ouchi, A., Bouttes, N., Chandan, D., Gregoire, L. J., Ivanovic, R. F., Izumi, K., LeGrande, A. N., Lhardy, F., Lohmann, G., Morozova, P. A., Ohgaito, R., Paul, A., Peltier, W. R., Poulsen, C. J., Quiquet, A., Roche, D. M., Shi, X., Tierney, J. E., Valdes, P. J., Volodin, E., and Zhu, J.: The PMIP4 Last Glacial Maximum experiments: preliminary results and comparison with the PMIP3 simulations, Clim. Past, 17, 1065–1089, https://doi.org/10.5194/cp-17-1065-2021, 2021.
Kamleitner, S., Ivy-Ochs, S., Monegato, G., Gianotti, F., Akçar, N., Vockenhuber, C., Christl, M., and Synal, H.-A.: The Ticino–Toce glacier system (Swiss–Italian Alps) in the framework of the Alpine Last Glacial Maximum, Quaternary Sci. Rev., 279, 107400, https://doi.org/10.1016/j.quascirev.2022.107400, 2022.
Kelly, M. A., Buoncristiani, J. F., and Schlchter, C.: A reconstruction of the last glacial maximum (LGM) ice-surface geometry in the western Swiss Alps and contiguous Alpine regions in Italy and France, Eclogae Geol. Helv., 97, 57–75, https://doi.org/10.1007/s00015-004-1109-6, 2004.
Kirtman, B., Power, S. B., Adedoyin, A. J., Boer, G. J., Bojariu, R., Camilloni, I., Doblas-Reyes, F., Fiore, A. M., Kimoto, M., Meehl, G., Prather, M., Sarr, A., Schar, C., Sutton, R., van Oldenborgh, G. J., Vecchi, G., and Wang, H. J.: Near-term climate change: Projections and predictability, in: Climate Change 2013. The Physical Science Basis. Contribution of Working Group I to the Fifth Assessment Report of the Intergovernmental Panel on Climate Change, edited. by: Stocker, T., Qin, D., Plattner, G. K., Tignor, M., Allen, S., Boschung, J., Nauels, A., Xia, Y., Bex V., and Midgley, P., Cambridge University Press, Cambridge, United Kingdom and New York, NY, USA, https://doi.org/10.1017/CBO9781107415324.023, 2013.
Kuhlemann, J., Rohling, E. J., Krumrei, I., Kubik, P., Ivy-Ochs, S., and Kucera, M.: Regional synthesis of Mediterranean atmospheric circulation during the Last Glacial Maximum, Science, 321, 1338–1340, https://doi.org/10.1126/science.1157638, 2008.
Laîné, A., Kageyama, M., Salas-Mélia, D., Voldoire, A., Riviere, G., Ramstein, G., Planton, S., Tyteca, S., and Peterschmitt, J. Y.: Northern hemisphere storm tracks during the last glacial maximum in the PMIP2 ocean-atmosphere coupled models: energetic study, seasonal cycle, precipitation, Clim. Dynam., 32, 593–614, https://doi.org/10.1007/s00382-008-0391-9, 2009.
Lambeck, K., Rouby, H., Purcell, A., Sun, Y., and Sambridge, M.: Sea level and global ice volumes from the Last Glacial Maximum to the Holocene, P. Natl. Acad. Sci. USA, 111, 15296–15303, https://doi.org/10.1073/pnas.1411762111, 2014.
Lie, Ø., Dahl, S. O., and Nesje, A.: A theoretical approach to glacier equilibrium-line altitudes using meteorological data and glacier mass-balance records from southern Norway, Holocene, 13, 365–372, https://doi.org/10.1191/0959683603hl629rp, 2003.
Lisiecki, L. E. and Stern, J. V.: Regional and global benthic δ18O stacks for the last glacial cycle, Paleoceanography, 31, 1368–1394, https://doi.org/10.1002/2016pa003002, 2016.
Ludwig, P., Gavrilov, M. B., Markovic, S. B., Ujvari, G., and Lehmkuhl, F.: Simulated regional dust cycle in the Carpathian Basin and the Adriatic Sea region during the Last Glacial Maximum, Quatern. Int., 581, 114–127, https://doi.org/10.1016/j.quaint.2020.09.048, 2021.
Ludwig, P., Schaffernicht, E. J., Shao, Y., and Pinto, J. G.: Regional atmospheric circulation over Europe during the Last Glacial Maximum and its links to precipitation, J. Geophys. Res., 121, 2130–2145, https://doi.org/10.1002/2015JD024444, 2016.
Ludwig, P., Pinto, J. G., Raible, C. C., and Shao, Y.: Impacts of surface boundary conditions on regional climate model simulations of European climate during the Last Glacial Maximum, Geophys. Res. Lett., 44, 5086–5095, https://doi.org/10.1002/2017GL073622, 2017.
Ludwig, P., Gómez-Navarro, J. J., Pinto, J. G., Raible, C. C., Wagner, S., and Zorita, E.: Perspectives of regional paleoclimate modeling, Ann. N. Y. Acad. Sci., 1436, 54–69, https://doi.org/10.1111/nyas.13865, 2018.
Luetscher, M., Boch, R., Sodemann, H., Spötl, C., Cheng, H., Edwards, R. L., Frisia, S., Hof, F., and Müller, W.: North Atlantic storm track changes during the Last Glacial Maximum recorded by Alpine speleothems, Nat. Commun., 6, 6344, https://doi.org/10.1038/ncomms7344, 2015.
Mcgrath, D., Sass, L, O'Neel, S., Arendt, A., and Kienholz, C.: Hypsometric control on glacier mass balance sensitivity in Alaska and northwest Canada, Earths Future, 5, 324–336, https://doi.org/10.1002/2016EF000479, 2017.
Merz, N., Raible, C. C., and Woollings, T.: North Atlantic Eddy-Driven Jet in Interglacial and Glacial Winter Climates, J. Climate, 28, 3977–3997, https://doi.org/10.1175/jcli-d-14-00525.1, 2015.
Mix, A. C., Bard, E., and Schneider, R.: Environmental processes of the ice age: Land, oceans, glaciers (EPILOG), Quaternary Sci. Rev., 20, 627–657, https://doi.org/10.1016/S0277-3791(00)00145-1, 2001.
Monegato, G.: Local glaciers in the Julian Prealps (NE Italy) during the Last Glacial Maximum, Alpine and Mediterranean Quaternary, 25, 5–14, 2012.
Monegato, G., Ravazzi, C., Donegana, M., Pini, R., Calderoni, G., and Wick, L.: Evidence of a two-fold glacial advance during the last glacial maximum in the Tagliamento end moraine system (eastern Alps), Quaternary Res., 68, 284–302, https://doi.org/10.1016/j.yqres.2007.07.002, 2007.
Monegato, G., Ravazzi, C., Culiberg, M., Pini, R., Bavec, M., Calderoni, G., Jež, J., and Perego, R.: Sedimentary evolution and persistence of open forests between the south-eastern Alpine fringe and the Northern Dinarides during the Last Glacial Maximum, Palaeogeogr. Palaeocl., 436, 23–40, https://doi.org/10.1016/j.palaeo.2015.06.025, 2015.
Monegato, G., Scardia, G., Hajdas, I., Rizzini, F., and Piccin, A.: The Alpine LGM in the boreal ice-sheets game, Sci. Rep.-UK, 7, 2078, https://doi.org/10.1038/s41598-017-02148-7, 2017.
Monegato, G., Kamleitner, S., Gianotti, F., Martin, S., Scapozza, C., and Ivy-Ochs, S.: The Ticino–Toce ice conveyor belts during the Last Glacial Maximum, Alpine and Mediterranean Quaternary, 35, 119–134, https://doi.org/10.26382/AMQ.2022.07, 2022.
Ohmura, A. and Boettcher, M.: Climate on the equilibrium line altitudes of glaciers: Theoretical background behind Ahlmann's diagram, J. Glaciol., 64, 489–505, https://doi.org/10.1017/jog.2018.41, 2018.
Paul, A., Mulitza, S., Stein, R., and Werner, M.: Glacial Ocean Map (GLOMAP), PANGAEA [data set], https://doi.org/10.1594/PANGAEA.923262, 2020.
Peltier, W. R. and Fairbanks, R. G.: Global glacial ice volume and Last Glacial Maximum duration from an extended Barbados sea level record, Quaternary Sci. Rev., 25, 3322–3337, https://doi.org/10.1016/j.quascirev.2006.04.010, 2006.
Peresani, M., Monegato, G., Ravazzi, C., Bertola, S., Margaritora, D., Breda, M., Fontana, A., Fontana, F., Janković, I., Karavanić, I., Komšo, D., Mozzi, P., Pini, R., Furlanetto, G., De Amicis, M. G. M., Perhoč, Z., Posth, C., Ronchi, L., Rossato, S., Vukosavljević, N., and Zerboni, A.: Hunter-gatherers across the great Adriatic-Po region during the Last Glacial Maximum: Environmental and cultural dynamics, Quatern. Int., 581, 367–376, https://doi.org/10.1016/j.quaint.2020.10.007, 2021.
Pini, R., Furlanetto, G., Vallé, F., Badino, F., Wick, L., Anselmetti, F. S., Bertuletti, P., Fusi, N., Morlock, M. A., Delmonte, B., and Harrison, S. P.: Linking North Atlantic and Alpine Last Glacial Maximum climates via a high-resolution pollen-based subarctic forest steppe record, Quaternary Sci. Rev., 15, 107759, https://doi.org/10.1016/j.quascirev.2022.107759, 2022.
Pinto, J. G. and Ludwig, P.: Extratropical cyclones over the North Atlantic and western Europe during the Last Glacial Maximum and implications for proxy interpretation, Clim. Past, 16, 611–626, https://doi.org/10.5194/cp-16-611-2020, 2020.
Preusser, F., Graf, H. R., Keller, O., Krayss, E., and Schlüchter, C.: Quaternary glaciation history of northern Switzerland, E&G Quaternary Science Journal, 60, 282–305, https://doi.org/10.3285/eg.60.2-3.06, 2011.
Racoviteanu, A. E., Rittger, K., and Armstrong, R.: An automated approach for estimating snowline altitudes in the karakoram and eastern himalaya from remote sensing, Front. Earth Sci., 7, 220, https://doi.org/10.3389/feart.2019.00220, 2019.
Raible, C. C., Pinto, J. G., Ludwig, P., and Messmer, M.: A review of past changes in extratropical cyclones in the northern hemisphere and what can be learned for the future, WIREs Clim. Change, 12, e680, https://doi.org/10.1002/wcc.680, 2021.
Rajczak, J. and Schär, C.: Projections of future precipitation extremes over Europe: A multimodel assessment of climate simulations, J. Geophys. Res.-Atmos., 122, 10773–10800, https://doi.org/10.1002/2017JD027176, 2017.
Ramstein, G., Kageyama, M., Guiot, J., Wu, H., Hély, C., Krinner, G., and Brewer, S.: How cold was Europe at the Last Glacial Maximum? A synthesis of the progress achieved since the first PMIP model-data comparison, Clim. Past, 3, 331–339, https://doi.org/10.5194/cp-3-331-2007, 2007.
Rasmussen, S. O., Bigler, M., Blockley, S. P., Blunier, T., Buchardt, S. L., Clausen, H. B., Cvijanovic, I., Dahl-Jensen, D., Johnsen, S. J.; Fischer, H., Gkinis, V., Guillevic, M., Hoek, W. Z., Lowe, J. J., Pedro, J. B., Popp, T., Seierstad, I. K. Steffensen, J. P., Svensson, A. M., Vallelonga, P., Vinther, B. M., Walker, M. J. C., Wheatley, J. J., and Winstrup, M.: A stratigraphic framework for abrupt climatic changes during the Last Glacial period based on three synchronized Greenland ice-core records: refining and extending the INTIMATE event stratigraphy, Quaternary Sci. Rev., 106, 14–28, https://doi.org/10.1016/j.quascirev.2014.09.007, 2014.
Ravazzi, C., Pini, R., Badino, F., De Amicis, M., Londeix, L., and Reimer, P. J.: The latest LGM culmination of the Garda Glacier (Italian Alps) and the onset of glacial termination. Age of glacial collapse and vegetation chronosequence, Quaternary Sci. Rev., 105, 26–47, https://doi.org/10.1016/j.quascirev.2014.09.014, 2014.
Rettig, L., Monegato, G., Mozzi, P., Žebre, M., Casetta, L., Fernetti, M., and Colucci, R. R.: The Pleistocene evolution and reconstruction of LGM and late glacial paleoglaciers of the Silisia Valley and Mount Raut (Carnic Prealps, NE Italy), Alpine and Mediterranean Quaternary, 34, 277–290, 2021.
Rettig, L., Monegato, G., Spagnolo, M., Hajdas, I., and Mozzi, P.: The Equilibrium Line Altitude of isolated glaciers during the Last Glacial Maximum – New insights from the geomorphological record of the Monte Cavallo Group (south-eastern European Alps), CATENA, 229, 107187, https://doi.org/10.1016/j.catena.2023.107187, 2023.
Rolland, C.: Spatial and seasonal variations of air temperature lapse Rates in Alpine Regions, J. Climyte, 16, 1032–1046, https://doi.org/10.1175/1520-0442(2003)016%3c1032:SASVOA%3e2.0.CO;2, 2003.
Rubel, F., Brugger, K., Haslinger, K., and Auer, I.: The climate of the European Alps: Shift of very high resolution Köppen–Geiger climate zones 1800–2100, Meteorol Z., 26, 115–125, https://doi.org/10.1127/metz/2016/0816, 2017.
Salcher, B. C., Hinsch, R., and Wagreich, M.: High-resolution mapping of glacial landforms in the North Alpine Foreland, Austria, Geomorphology, 122, 283–293, https://doi.org/10.1016/j.geomorph.2009.09.037, 2010.
Scapozza, C., Castelletti, C., Soma, L., Dall'Agnolo, S., and Ambrosi, C.: Timing of LGM and deglaciation in the Southern Swiss Alps, Géomorphologie, 20, 307–322, https://doi.org/10.4000/geomorphologie.10753, 2014.
Schaffernicht, E. J., Ludwig, P., and Shao, Y.: Linkage between dust cycle and loess of the Last Glacial Maximum in Europe, Atmos. Chem. Phys., 20, 4969–4986, https://doi.org/10.5194/acp-20-4969-2020, 2020.
Schmittner, A., Urban, N. M., Shakun, J. D., Mahowald, N. M., Clark, P. U., Bartlein, P. J., Mix, A. C., and Rosell-Melé, A.: Climate sensitivity estimated from temperature reconstructions of the Last Glacial Maximum, Science, 334, 1385–1388, https://doi.org/10.1126/science.1203513, 2011.
Scotti, R., Brardinoni, F., Crosta, G. B., Cola, G., and Mair, V.: Time constraints for post-LGM landscape response to deglaciation in Val Viola, Central Italian Alps, Quaternary Sci. Rev., 177, 10–33, https://doi.org/10.1016/j.quascirev.2017.10.011, 2017.
Seguinot, J., Ivy-Ochs, S., Jouvet, G., Huss, M., Funk, M., and Preusser, F.: Modelling last glacial cycle ice dynamics in the Alps, The Cryosphere, 12, 3265–3285, https://doi.org/10.5194/tc-12-3265-2018, 2018.
Sirocko, F., Knapp, H., Dreher, F., Förster, M., Albert, J., Brunck, H., Veres, D., Dietrich, S., Zech, M., Hambach, U., Röhner, M., Rudert, S., Schwibus, K., Adams, C., and Sigl, P.: The ELSA-Vegetation-Stack: Reconstruction of Landscape Evolution Zones (LEZ) from laminated Eifel maar sediments of the last 60,000 years, Global Planet. Change, 142, 108–135, https://doi.org/10.1016/j.gloplacha.2016.03.005, 2016.
Snyder, C.: Evolution of global temperature over the past two million years, Nature, 538, 226–228, https://doi.org/10.1038/nature19798, 2016.
Spötl, C., Koltai, G., Jarosch, A. H., and Cheng, H.: Increased autumn and winter precipitation during the Last Glacial Maximum in the European Alps, Nat. Commun., 12, 1–9, https://doi.org/10.1038/s41467-021-22090-7, 2021.
Stadelmaier, K. H., Ludwig, P., Bertran, P., Antoine, P., Shi, X., Lohmann, G., and Pinto, J. G.: A new perspective on permafrost boundaries in France during the Last Glacial Maximum, Clim. Past, 17, 2559–2576, https://doi.org/10.5194/cp-17-2559-2021, 2021.
Stevens, B., Giorgetta, M., Esch, M., Mauritsen, T., Crueger, T., Rast, S., Salzmann, M., Schmidt, H., Bader, J., Block, K., Brokopf, R., Fast, I., Kinne, S., Kornblueh, L., Lohmann, U., Pincus, R., Reichler, and T., and Roeckner, E.: Atmospheric component of the MPI-M Earth system model: ECHAM6, J. Adv. Model. Earth Sy., 5, 146–172, https://doi.org/10.1002/jame.20015, 2013.
Strandberg, G., Brandefelt, J., Kjellstro, E., and Smith, M. B.: High-resolutionregional simulation of last glacial maximum climate in Europe, Tellus A, 63, 107–125, https://doi.org/10.1111/j.1600-0870.2010.00485.x, 2011.
Tierney, J. E., Zhu, J., King, J., King, J., Malevich, S. B., Hakim, G. J., and Poulsen, C. J.: Glacial cooling and climate sensitivity revisited, Nature 584, 569–573, https://doi.org/10.1038/s41586-020-2617-x, 2020.
Velasquez, P., Messmer, M., and Raible, C. C.: A new bias-correction method for precipitation over complex terrain suitable for different climate states: a case study using WRF (version 3.8.1), Geosci. Model Dev., 13, 5007–5027, https://doi.org/10.5194/gmd-13-5007-2020, 2020.
Velasquez, P., Kaplan, J. O., Messmer, M., Ludwig, P., and Raible, C. C.: The role of land cover in the climate of glacial Europe, Clim. Past, 17, 1161–1180, https://doi.org/10.5194/cp-17-1161-2021, 2021.
Velasquez, P., Messmer, M., and Raible, C. C.: The role of ice-sheet topography in the Alpine hydro-climate at glacial times, Clim. Past, 18, 1579–1600, https://doi.org/10.5194/cp-18-1579-2022, 2022.
Višnjević, V., Herman, F., and Prasicek, G.: Climatic patterns over the European Alps during the LGM derived from inversion of the paleo-ice extent, Earth Planet. Sc. Lett., 538, 116185, https://doi.org/10.1016/j.epsl.2020.116185, 2020.
Watts, W., Allen, J., and Huntley, B.: Vegetation history and palaeoclimate of the last glacial period at Lago Grande di Monticchio, southern Italy, Quaternary Sci. Rev. 15, 133–153, https://doi.org/10.1016/0277-3791(95)00093-3, 1996.
Wirsig, C., Zasadni, J., Christl, M., Akçar, N., and Ivy-Ochs, S.: Dating the onset of LGM ice surface lowering in the High Alps, Quaternary Sci. Rev., 143, 37–50, https://doi.org/10.1016/j.quascirev.2016.05.001, 2016.
Wu, H., Guiot, J., Brewer, S., and Guo, Z.: Climatic changes in Eurasia and Africa at the last glacial maximum and mid-Holocene: reconstruction from pollendata using inverse vegetation modelling, Clim. Dynam., 29, 211–229, https://doi.org/10.1007/s00382-007-0231-3, 2007.
Yokoyama, Y., Lambeck, K., De Deckker, P., Johnston, P., and Fifield, L. K.: Timing of the Last Glacial Maximum from observed sea-level minima, Nature, 406, 713–716, https://doi.org/10.1038/35021035, 2000.
Žebre, M., Colucci, R. R., Giorgi, F., Glasser, N. F., Racoviteanu, A. E., and Del Gobbo, C.: 200 years of equilibrium-line altitude variability across the European Alps (1901–2100), Clim. Dynam., 56, 1183–1201, https://doi.org/10.1007/s00382-020-05525-7, 2021.
Zekollari, H., Huss, M., and Farinotti, D.: On the Imbalance and Response Time of Glaciers in the European Alps, Geophys. Res. Lett., 47, e2019GL085578, https://doi.org/10.1029/2019GL085578, 2020.
Zemp, M., Paul, F., Hoelzle, M., and Haeberli, W.: Glacier fluctuations in the European Alps, 1850–2000: an overview and spatio-temporal analysis of available data, in: Darkening Peaks: Glacier Retreat, Science, and Society, edited by: Orlove, B., Wiegandt, E., and Luckman, B. H., University of California Press, Berkeley, Los Angeles, 152–167, ISBN 978-0-520-25305-6, 2008.