the Creative Commons Attribution 4.0 License.
the Creative Commons Attribution 4.0 License.
 | 25 Aug 2023
Late Aptian paleoclimate reconstruction of the Brazilian equatorial margin: inferences from palynology
Michelle Cardoso da Silva Giannerini
Marcelo de Araujo Carvalho
Cecília Cunha Lana
Gustavo Santiago
Natália de Paula Sá
Gabriel da Cunha Correia
This study conducted high-resolution paleoclimatic analyses based on the identification of palynological groups of late Aptian age (biozone Sergipea veriverrucata) in the Bragança and Codó formations within the Bragança–Viseu, São Luís, and Parnaíba basins. The analysis comprised 40 palynological samples, with 200 palynomorphs per slide counted when possible. Bioclimatic analysis was mainly supported by the identification of botanical affinities, and ecological and climatic parameters such as the wetarid trend (), Shannon–Wiener diversity, and indicator species analysis (IndVal) were used. Statistical analyses such as principal component and cluster analyses were employed to support the paleoclimatic interpretations. The study recognized 69 genera distributed among the main groups of living plants, including bryophytes, ferns, lycophytes, gymnosperms, and angiosperms. It was possible to attribute botanical affinity in 94.2 % of the taxa, and nine genera occurred in all sections studied: Afropollis, Araucariacites, Callialasporites, Cicatricosisporites, Classopollis, Cyathidites, Deltoidospora, Equisetosporites, and Verrucosisporites, with Classopollis being the most abundant. The stratigraphic distribution of the bioclimatic groups (hydrophytes, hygrophytes, lowland tropical flora, upland flora, and xerophytes) allowed for the identification of climatic phases: pre-evaporitic, evaporitic, and post-evaporitic. In the pre-evaporitic phase, the most significant abundances were between the hygrophytes and upland flora, indicating a certain level of humidity. Xerophytes were the most abundant in all phases, with a conspicuous increase in the evaporitic phase, reflecting an increase in aridity. In the post-evaporitic phase, there was a significant increase in the upland flora with the return of wetter conditions. This study confirmed an increasing humidity trend in the analyzed sections, probably owing to the influence of the Intertropical Convergence Zone that was already operating during the late Aptian.
- Article
(19510 KB) - Full-text XML
- BibTeX
- EndNote


The palynoflora preserved in the upper Aptian rocks of South America and Africa is typical of hot conditions and is commonly associated with arid climates (Chumakov et al., 1995, Hay and Floegel, 2012). However, because biodiversity tends to be higher in wetter climates, the high diversity observed during the Aptian raises the possibility that this arid phase fluctuated during that age. The palynoflora related to hot and humid climates exhibits a growing trend toward these conditions, even during the Aptian. This trend may be linked to the shifting and strengthening of a humid belt associated with the Intertropical Convergence Zone (ITCZ) (Hay and Floegel, 2012; Scotese, 2016; Carvalho et al., 2022; Santos et al., 2022), as well as to the establishment of the South Atlantic, which affected the marine current system.
Palynology plays an important role in paleoclimate studies, because when analyzing the assemblages of palynomorphs (e.g., spores, pollen grains), it is possible determine from the botanical affinities the types of plants that existed in the past and infer their climatic preferences. For instance, certain pollen types are indicative of wetter climates, while others are associated with drier conditions. Palynological analysis can also provide evidence of seasonal changes, temperature variations, moisture levels, and extreme climatic events. Upper Aptian rocks from Brazilian sedimentary basins, including the Bragança and Codó formations, contain a significant representation of conifers from the family Cheirolepidiaceae and their pollen grains, such as Classopollis (Regali et al., 1974; Carvalho et al., 2017, 2019, 2022). Classopollis is typically associated with arid conditions, often found in lagoons and coastal areas, and frequently associated with evaporites (Batten, 1975; Vakhrameev, 1970, 1981; Doyle et al., 1982; Hashimoto, 1995; Heimhofer et al., 2008, Carvalho et al., 2019). However, studies of the Sergipe Basin (northwestern Brazil) suggest strong fluctuations in the abundance of Classopollis and other xerophytic flora, with a decreasing trend toward the late Aptian accompanied by an increase in fern spores that require water for germination (Carvalho et al., 2017, 2019). The geographic extent of these trends remains controversial, and further investigation is required to identify possible climatic oscillations in other sedimentary basins in Brazil. Analysis of the Codó and Bragança formations, located in the Cretaceous section of the São Luís, Bragança–Viseu, and Parnaíba basins near the paleo-Equator, where the Intertropical Convergence Zone (ITCZ) occurs, has great potential to provide insights into this topic.
The objective of this study is to infer the paleoclimate of the late Aptian in the Bragança–Viseu, São Luís, and Parnaíba basins, all located in equatorial areas (Fig. 1), by examining the relationships among groups of palynomorphs that are sensitive climatic taxa. Furthermore, this study aimed to investigate how variations in the composition of paleoflora and indicator species are linked to climatic changes such as shifts in humidity and temperature, as well as other paleoenvironmental forcings.
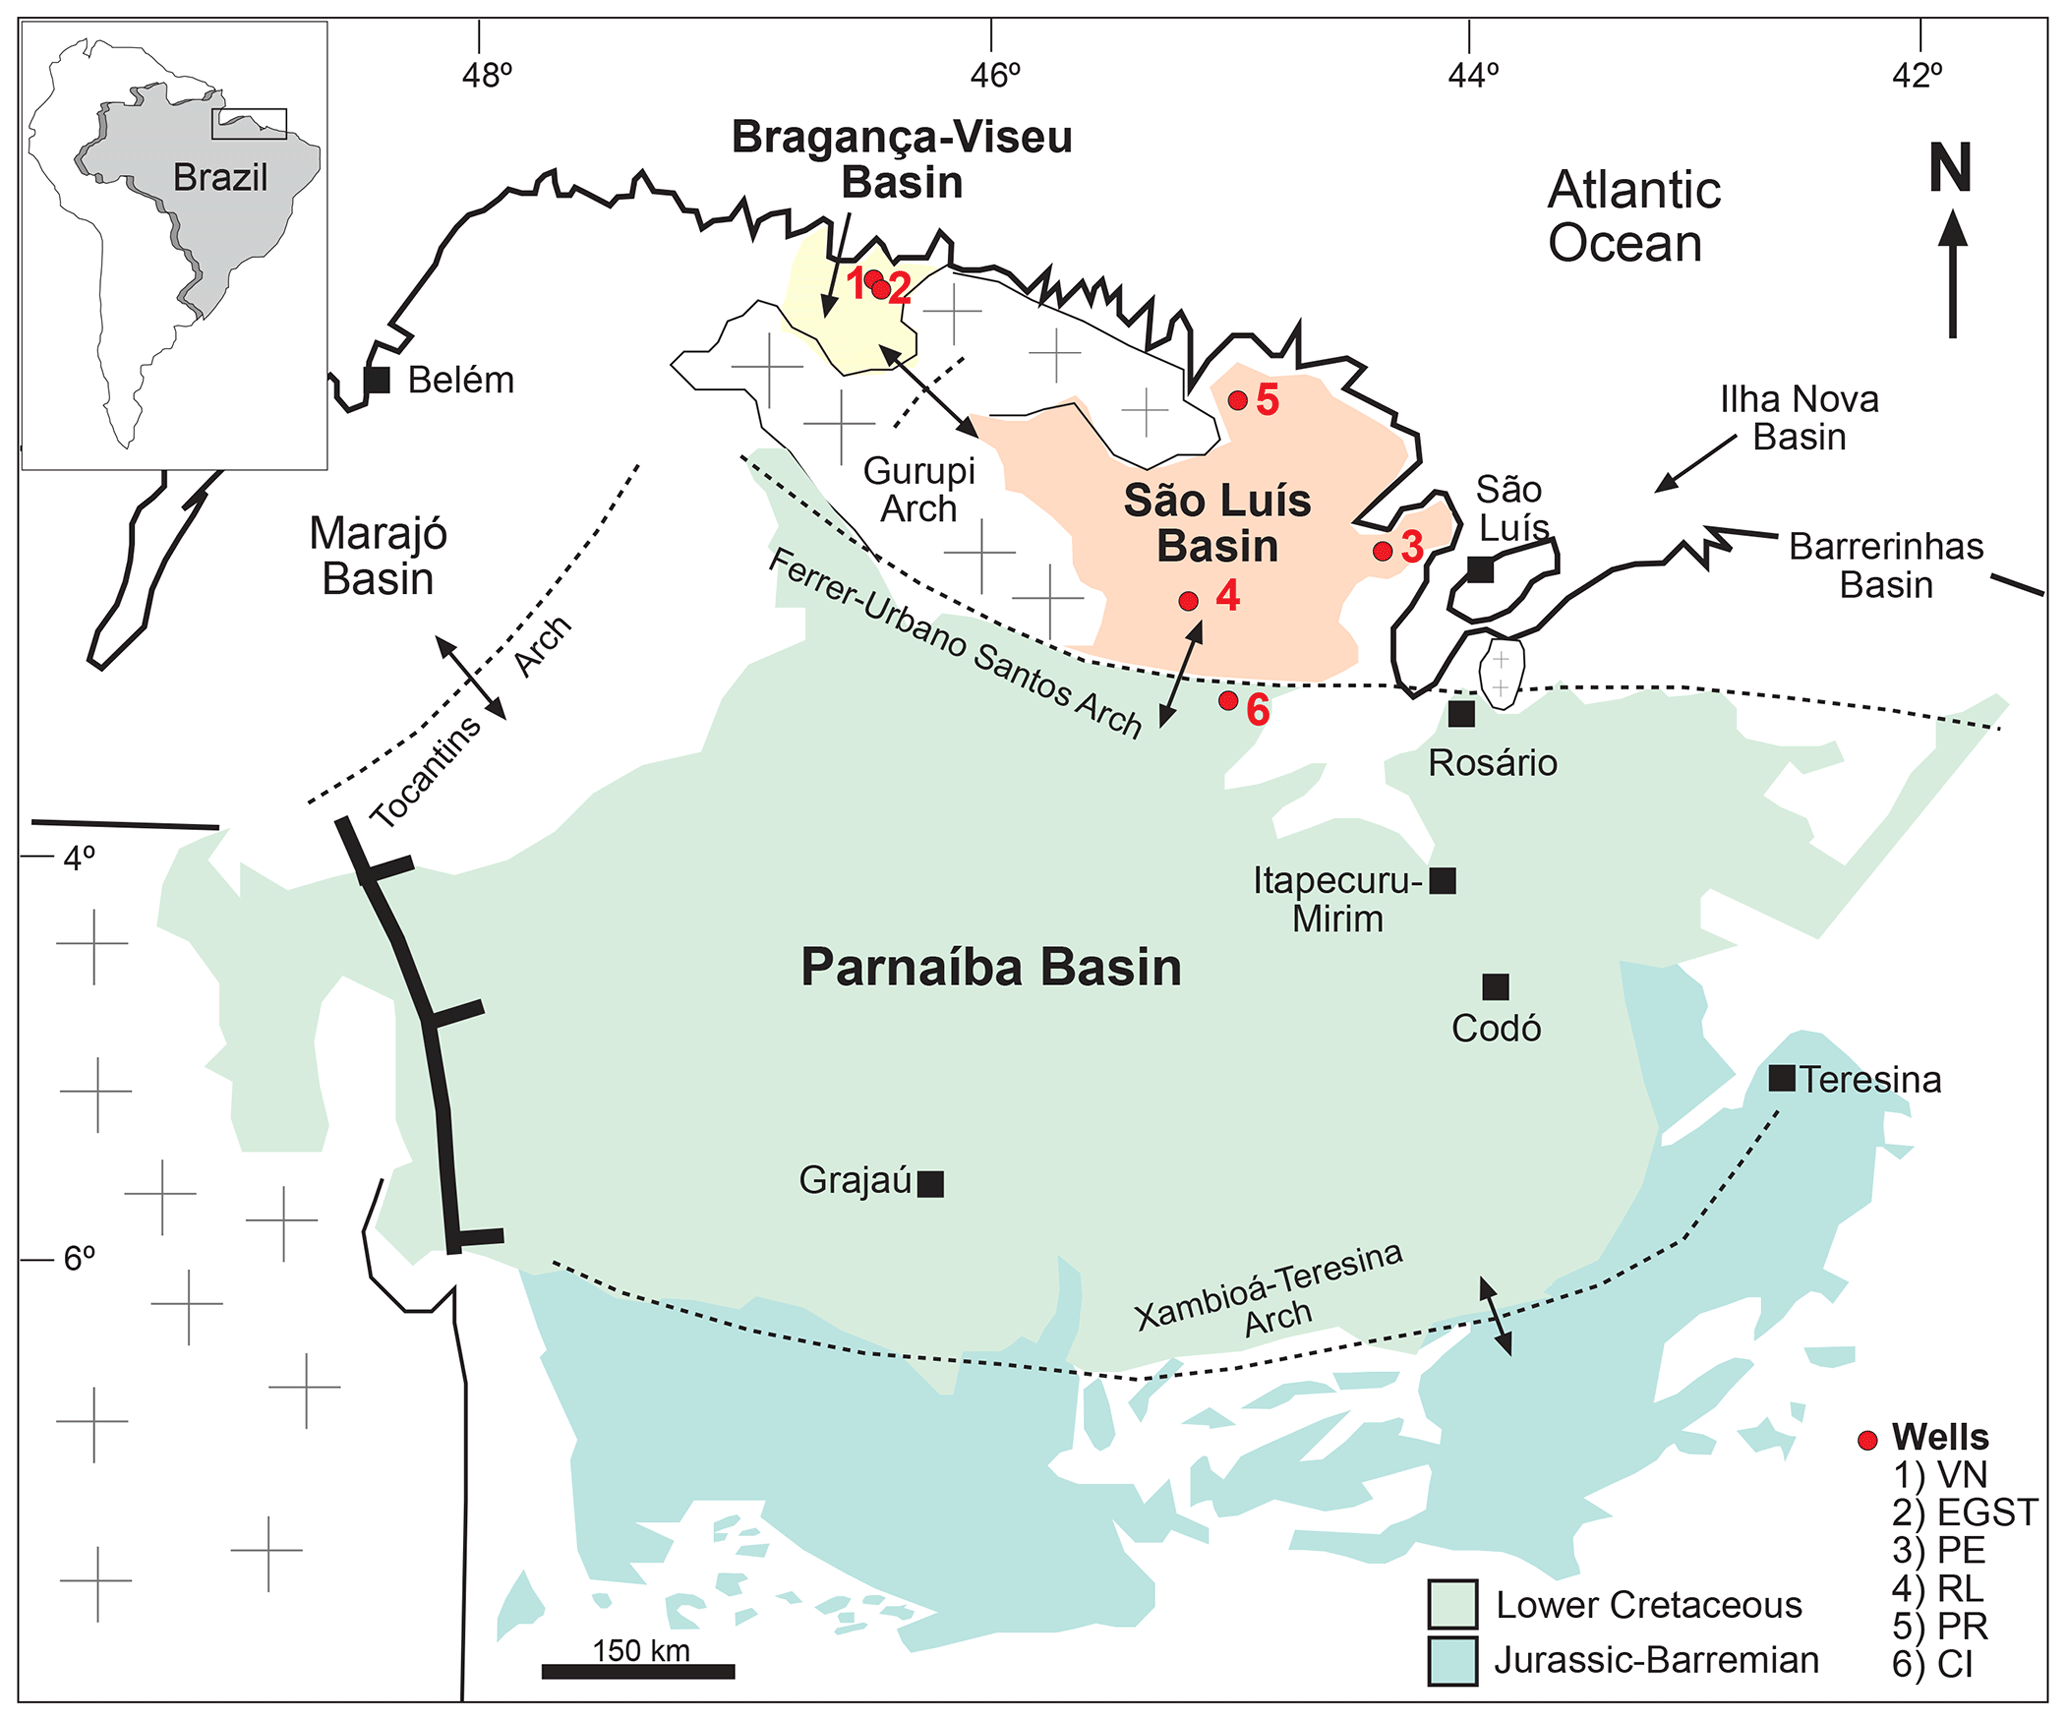
Figure 1Location of sedimentary basins showing the sites of stratigraphic sections.
According to Milani et al. (2007), the three sedimentary basins considered in this study are grouped into large assemblies based mainly on the tectonic context in which they developed: Mesozoic aborted rift basins (Bragança–Viseu and São Luís basins) and Paleozoic syneclises (Parnaíba Basin).
The Bragança–Viseu, São Luís, and Parnaíba basins show a similar stratigraphic evolution. The Bragança–Viseu and São Luís basins are located on the equatorial margin and the Parnaíba Basin in north-central Brazil (Fig. 1). The basins constitute a rift system (graben and semi-graben) located between the terrains of the folding belt. Together, these cover an area of approximately 645 000 km2. The sedimentary succession of the basins consists of Paleozoic, Mesozoic, and Cenozoic rocks. The Cretaceous strata are represented by the Bragança (Bragança–Viseu and São Luís basins), Grajaú, Codó, and Itapecuru formations.
The Bragança Formation consists of gray medium- to coarse-grained sandstones and conglomerates, with subordinate medium-grained sandstones and greenish siltstones. This formation is interpreted as an alluvial fan deposit.
The Codó Formation is composed of dark shales, anhydrite, and calcilutites, with sandstone intercalations. These deposits were assigned to a lagoonal environment. Marine incursions are indicated by fossil contents and the occurrence of evaporitic deposits.
The pre-evaporitic, evaporitic, and post-evaporitic phases are recognized for the late Aptian (Petri et al., 1983; Milani et al., 2007). These phases occur within the K40–K50 supersequences and show an average maximum thickness of approximately 650 m in the studied basins. The pre-evaporitic phase is represented by carbonate and siliciclastic deposits formed in fluvial and lacustrine deltaic environments within a large proto-oceanic gulf (Petri et al., 1983; Milani et al., 2007). The peak of the evaporitic deposition is recorded in the K50 supersequence, with widespread occurrences in the Brazilian equatorial margin. The origin of these deposits is heat intensification associated with the widening of the Atlantic Ocean. These conditions caused strong evaporation, leading to a wide distribution of evaporites (mainly halite and anhydrite gypsum) in the South Atlantic basins. The post-evaporitic phase is characterized by fully marine conditions, evidenced by the rich assemblages of marine fossils. During this phase, carbonates were deposited, followed by muddy and sandy sediments, in shallow marine to slope environments (Petri et al., 1983; Milani et al., 2007).
The Bragança and Codó formations are inserted within the K40–K50 supersequence. However, in the Bragança Formation, only the pre-evaporitic phase is recognized. On the other hand, the Codó Formation has recorded the three climatic phases (pre-evaporitic, evaporitic, and post-evaporitic) (Milani et al., 2007).
4.1 Studied sections
This study was based on core samples from three basins: Bragança–Viseu and São Luís located in the equatorial margin and the Parnaíba Basin in north-central Brazil. All of the core samples were obtained from Petrobras (the Brazilian oil company) drilling. (Fig. 1).
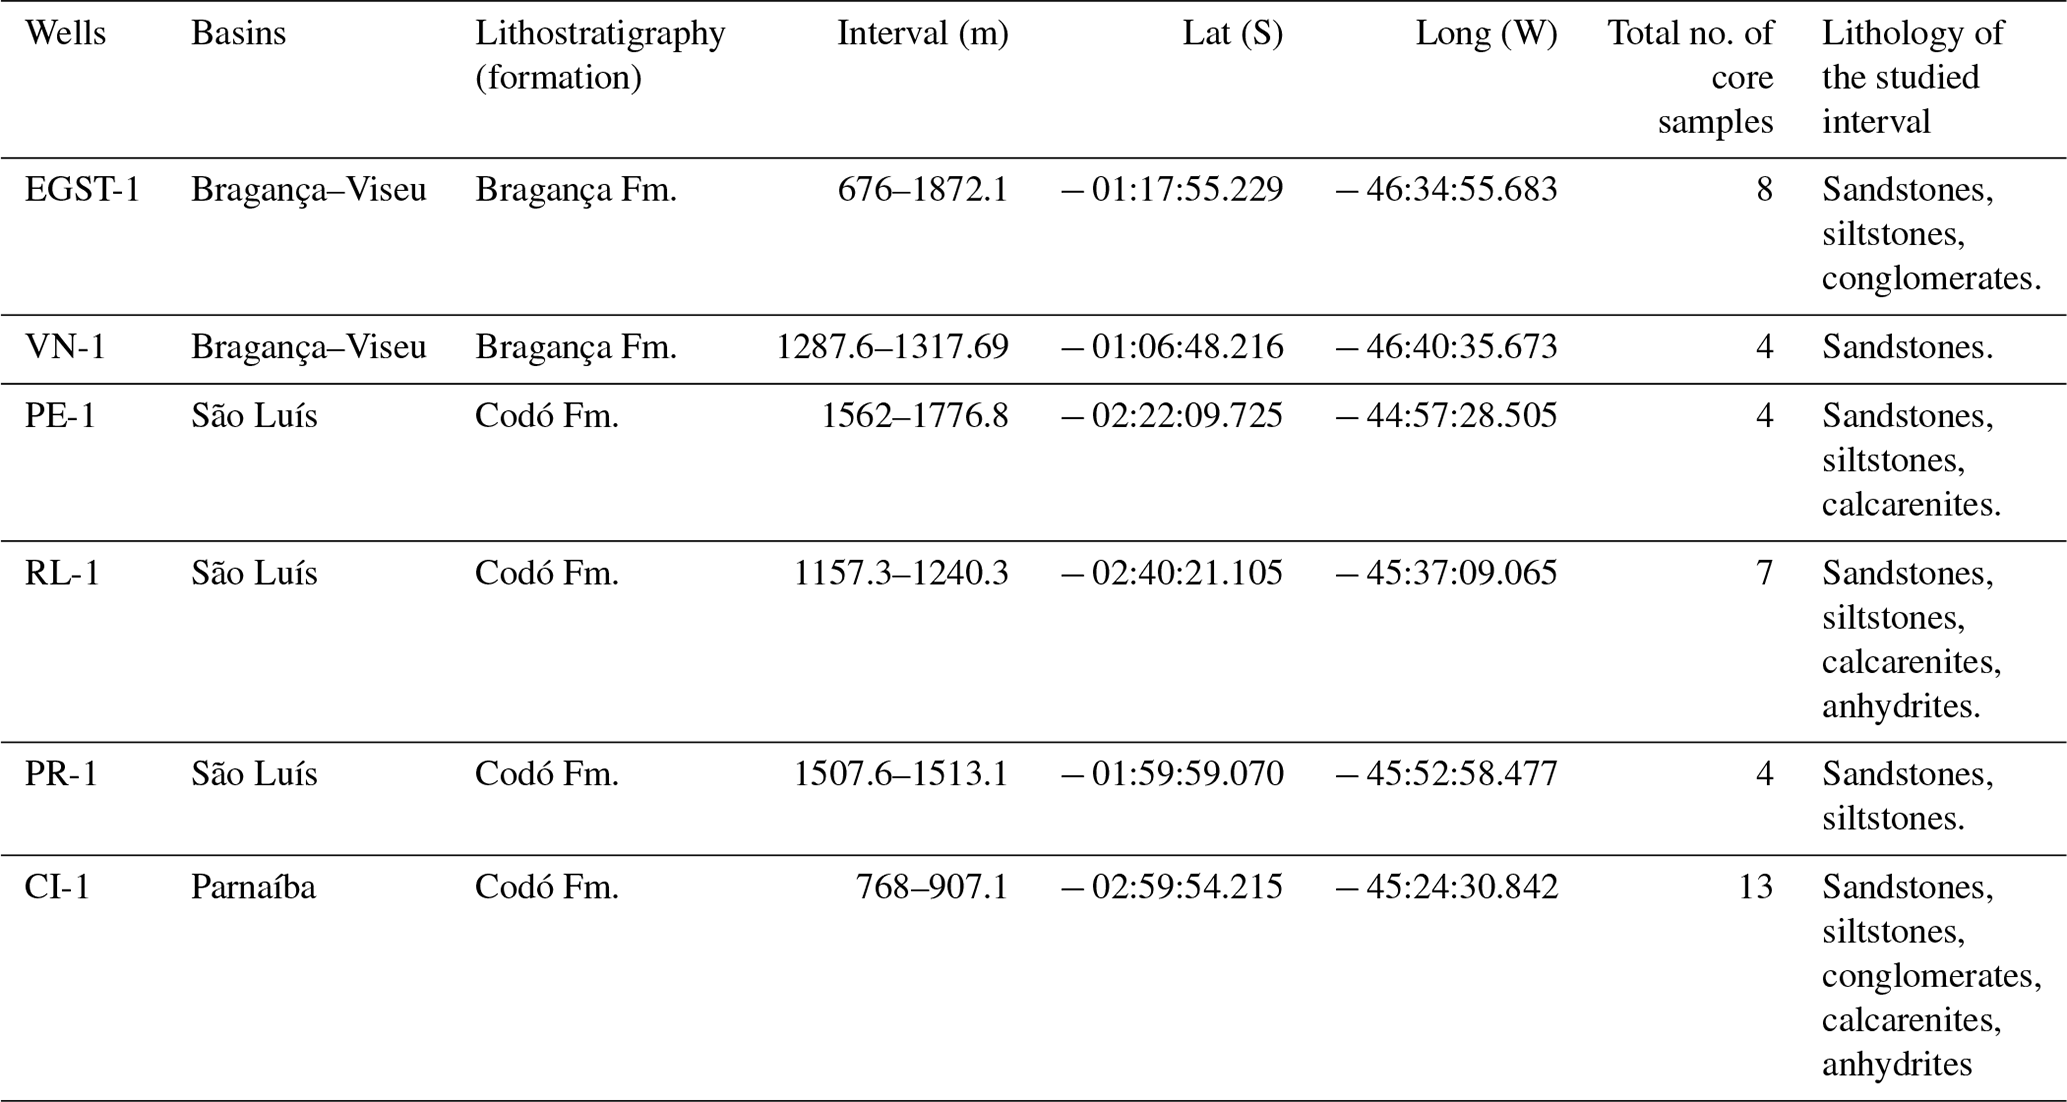
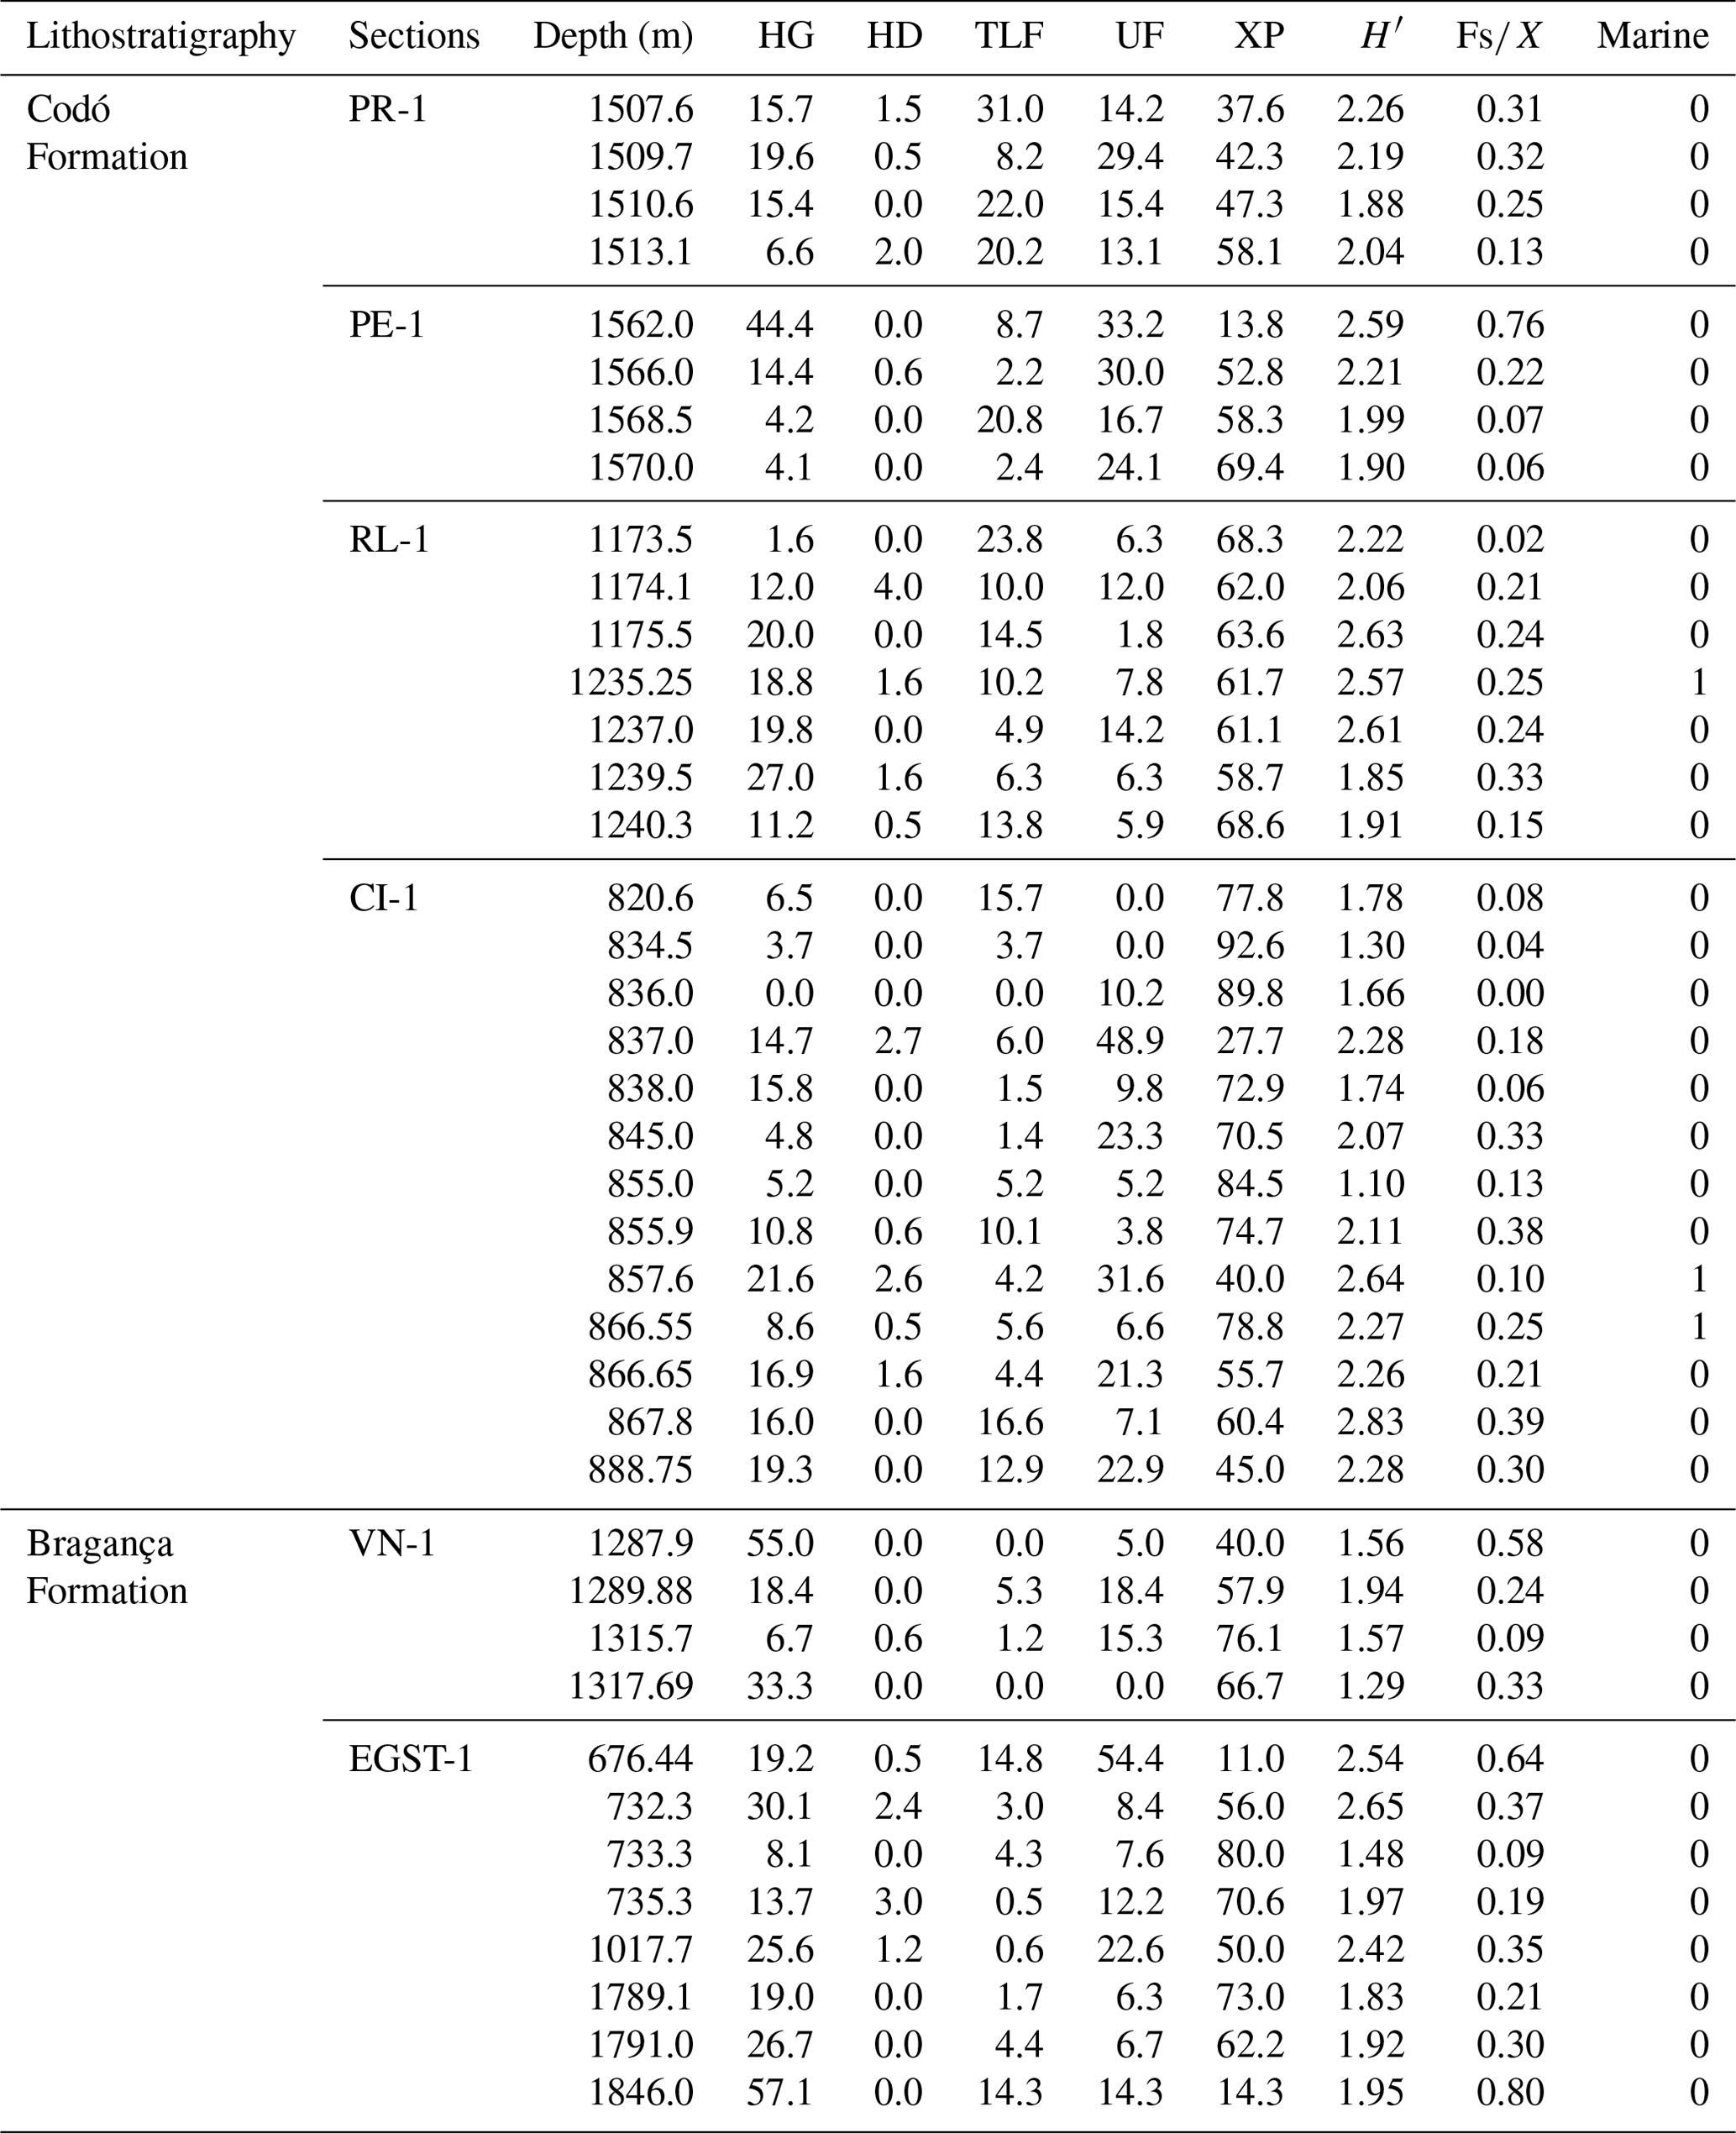
The stratigraphic succession studied comprises parts of the Bragança and Codó formations. The Bragança Formation (Bragança–Viseu Basin) includes wells EGST-1 (676–1872.1 m), consisting of sandstones, siltstones, and conglomerates, and VN-1 (1287.6–1317.69 m), consisting only of sandstones (Fig. 2) (Table 1). The Codó Formation includes three sections from the São Luís Basin: PR-1 (1507.6–1513.1 m), composed of sandstones and siltstones, and PE-1 (1562–1776.8 m), which has a lithology similar to that of the previous one, with the addition of calcarenites. RL-1 (1157.3–1240.3 m) is composed of sandstones, siltstones, calcarenites, and anhydrites. The fourth section, CI-1 (768–907.1 m), is from the Parnaíba Basin. CI-1 has a lithology similar to that of RL-1, but the former has a more pronounced package of anhydrites than the latter (Fig. 2) (Table 1).
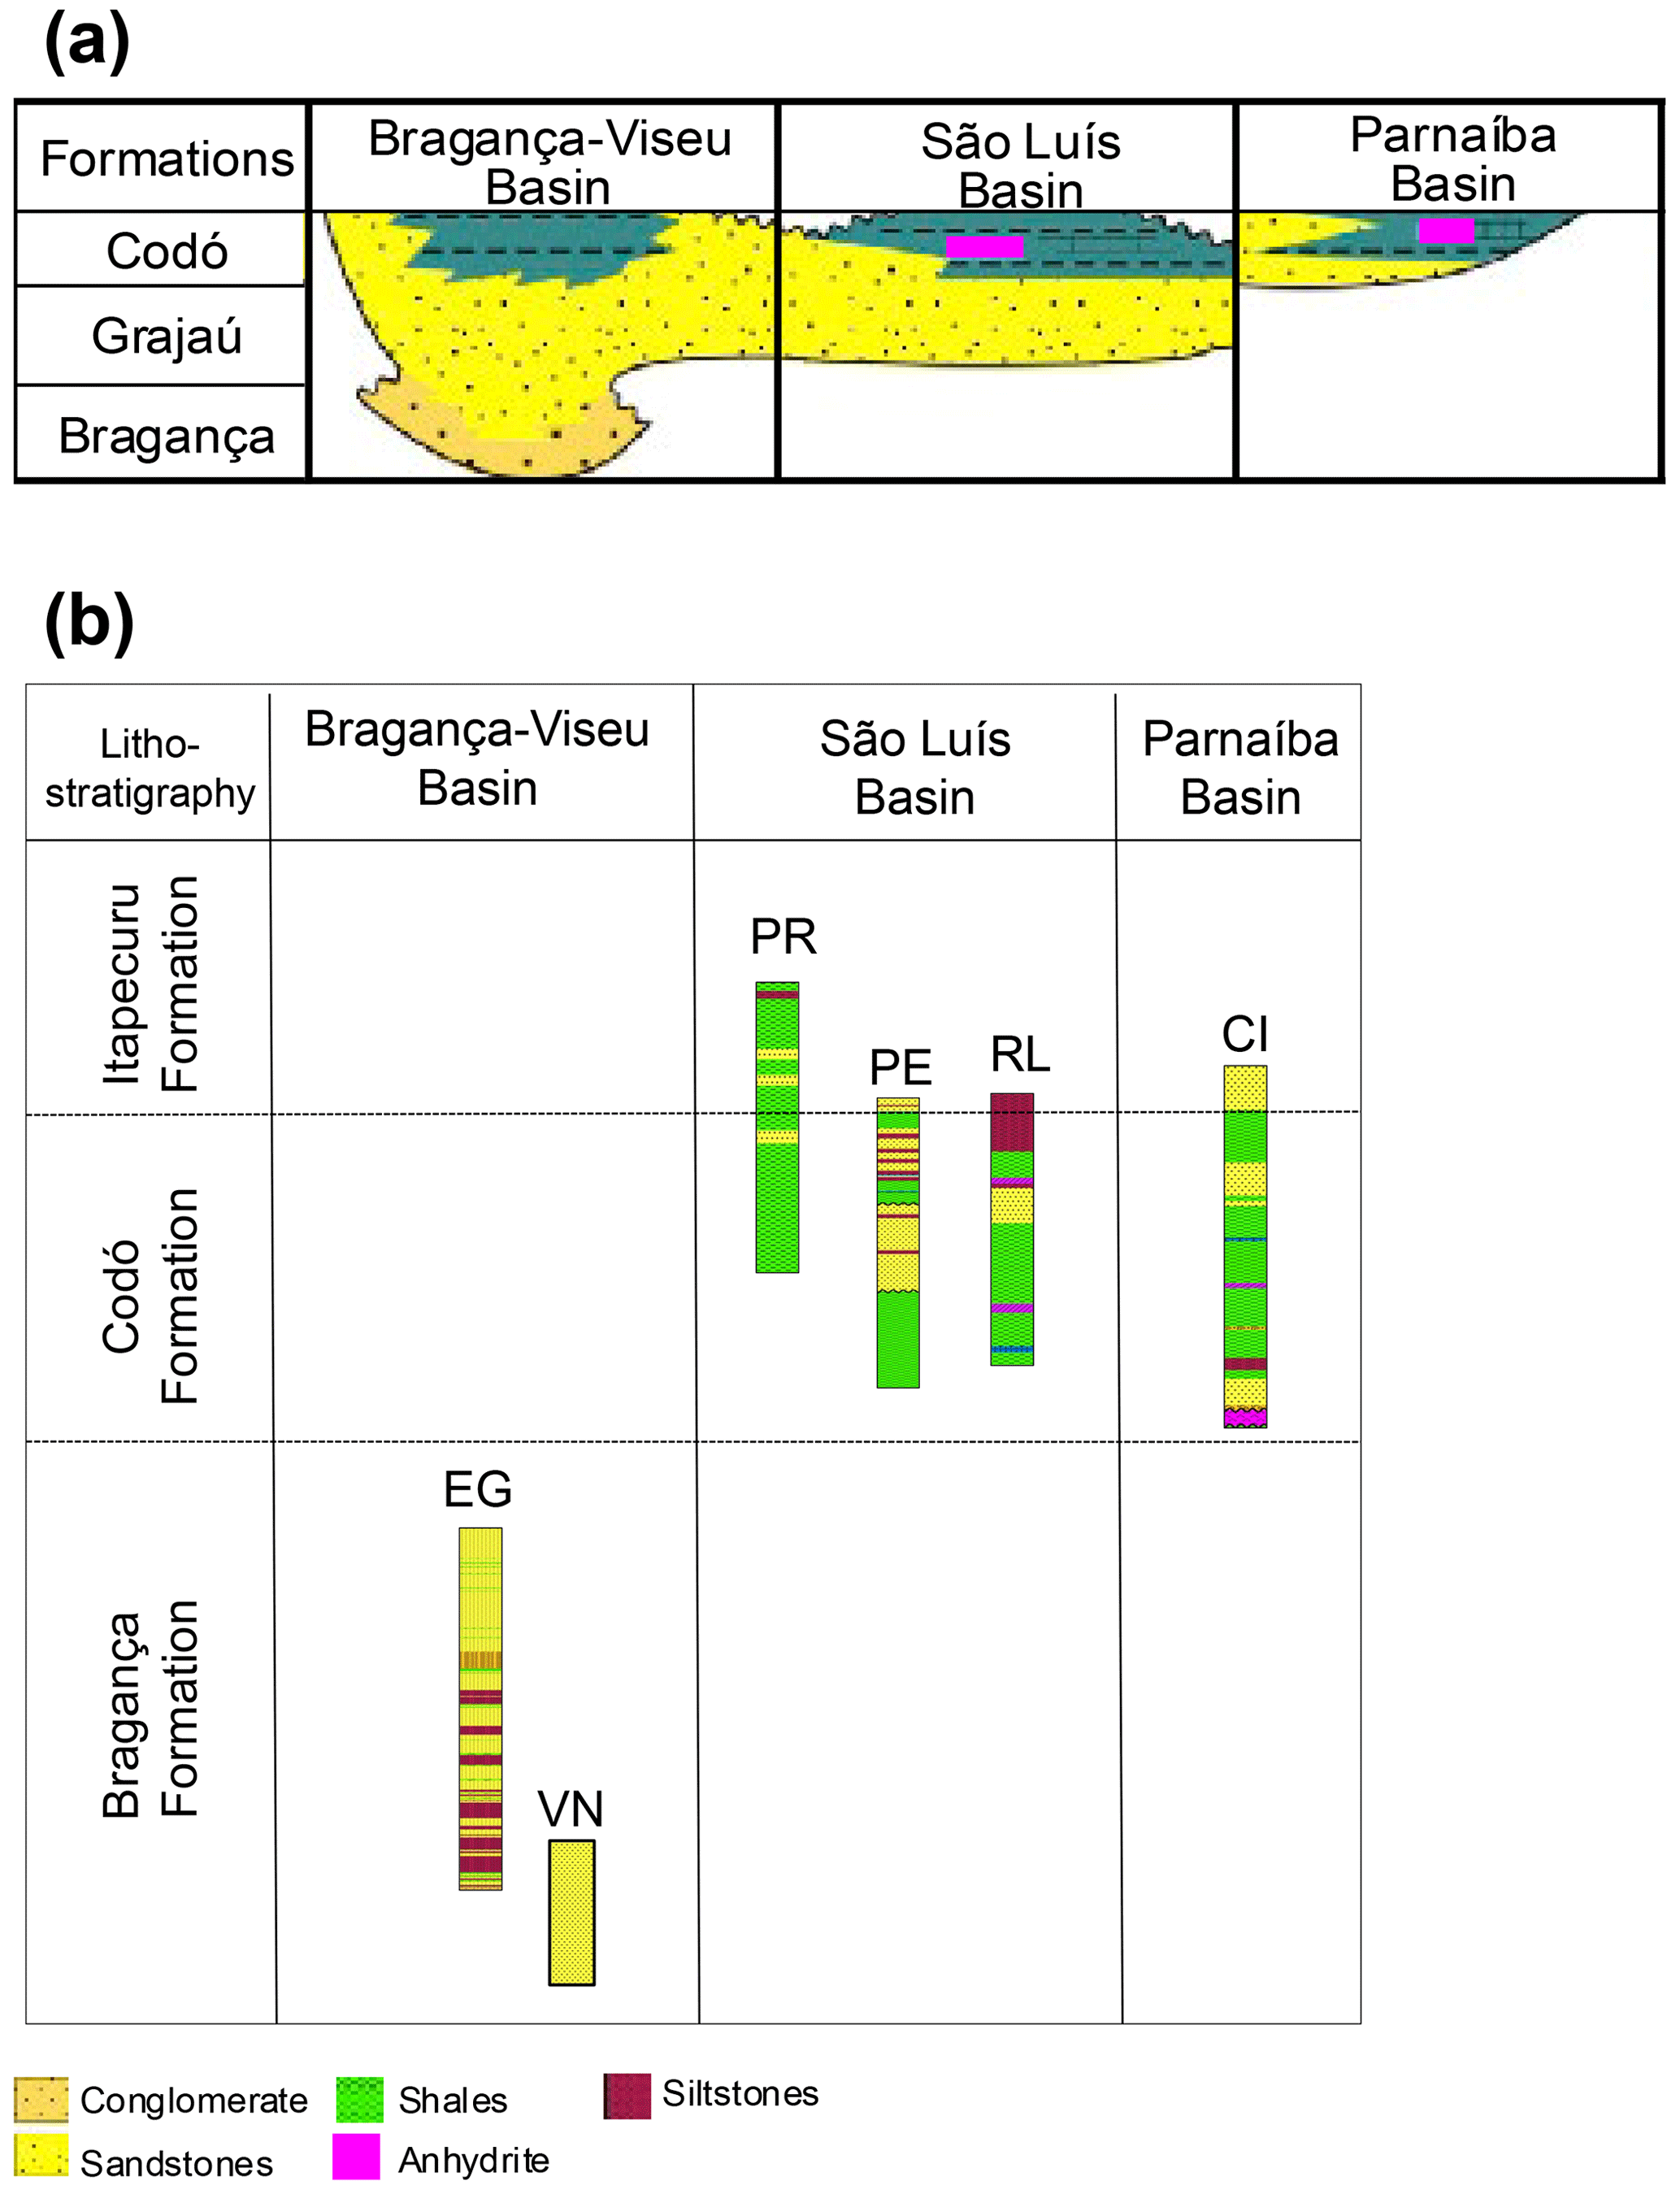
Figure 2(a) Correlation of lithostratigraphic data of the studied basins and (b) the studied wells.
Table 1Localities, lithostratigraphy of the studied sections, and lithologies of studied interval.
The late Aptian age of the samples is based on the Sergipea variverrucata biozone recognized in two studied drill cores (PR-1 and CI-1), which is correlated with part of the upper Aptian Globigerinelloides algerianus zone (Carvalho et al., 2016). In the other four sections (EGST-1, VN-1, PE-1, and RL-1), Sergipea variverrucata was not recognized. However, the identified floristic associations (e.g., Afropollis jardinus, Araucariacites australis, Bennettittaepollenites regaliae, Equisetosporites maculosus, Klukisporites foveolatus, Sergipea simplex) are attributed to the late Aptian of Brazil (Regali and Santos, 1999; Carvalho et al., 2017, 2019).
4.2 Sample preparation
The samples were prepared at the Research and Development Center of Petrobras (CENPES) in Rio de Janeiro, applying the standard Petrobras method of palynological, compiled by Uesugui (1979) based on Erdtman (1943, 1969) and Faegri et al. (1966). Thus, in this study, most mineral constituents were dissolved by hydrochloric and hydrofluoric acids before heavy-liquid separation, and the remaining organic matter was sieved through a 10 µm mesh before mounting on slides. The cores are stored at CENPES (Rio de Janeiro, RJ).
4.3 Palynological analyses
The samples were analyzed using a transmitted-light microscope. Analysis was based on the first 200 palynomorphs counted on each slide. The marine elements (dinoflagellate cysts and microforaminiferal linings) were counted separately. Taxonomic identification was based on the methods of Regali et al. (1974), Lima (1978), Dino (1992, 1994), and Carvalho et al. (2019, 2022).
4.4 Bioclimatic analysis
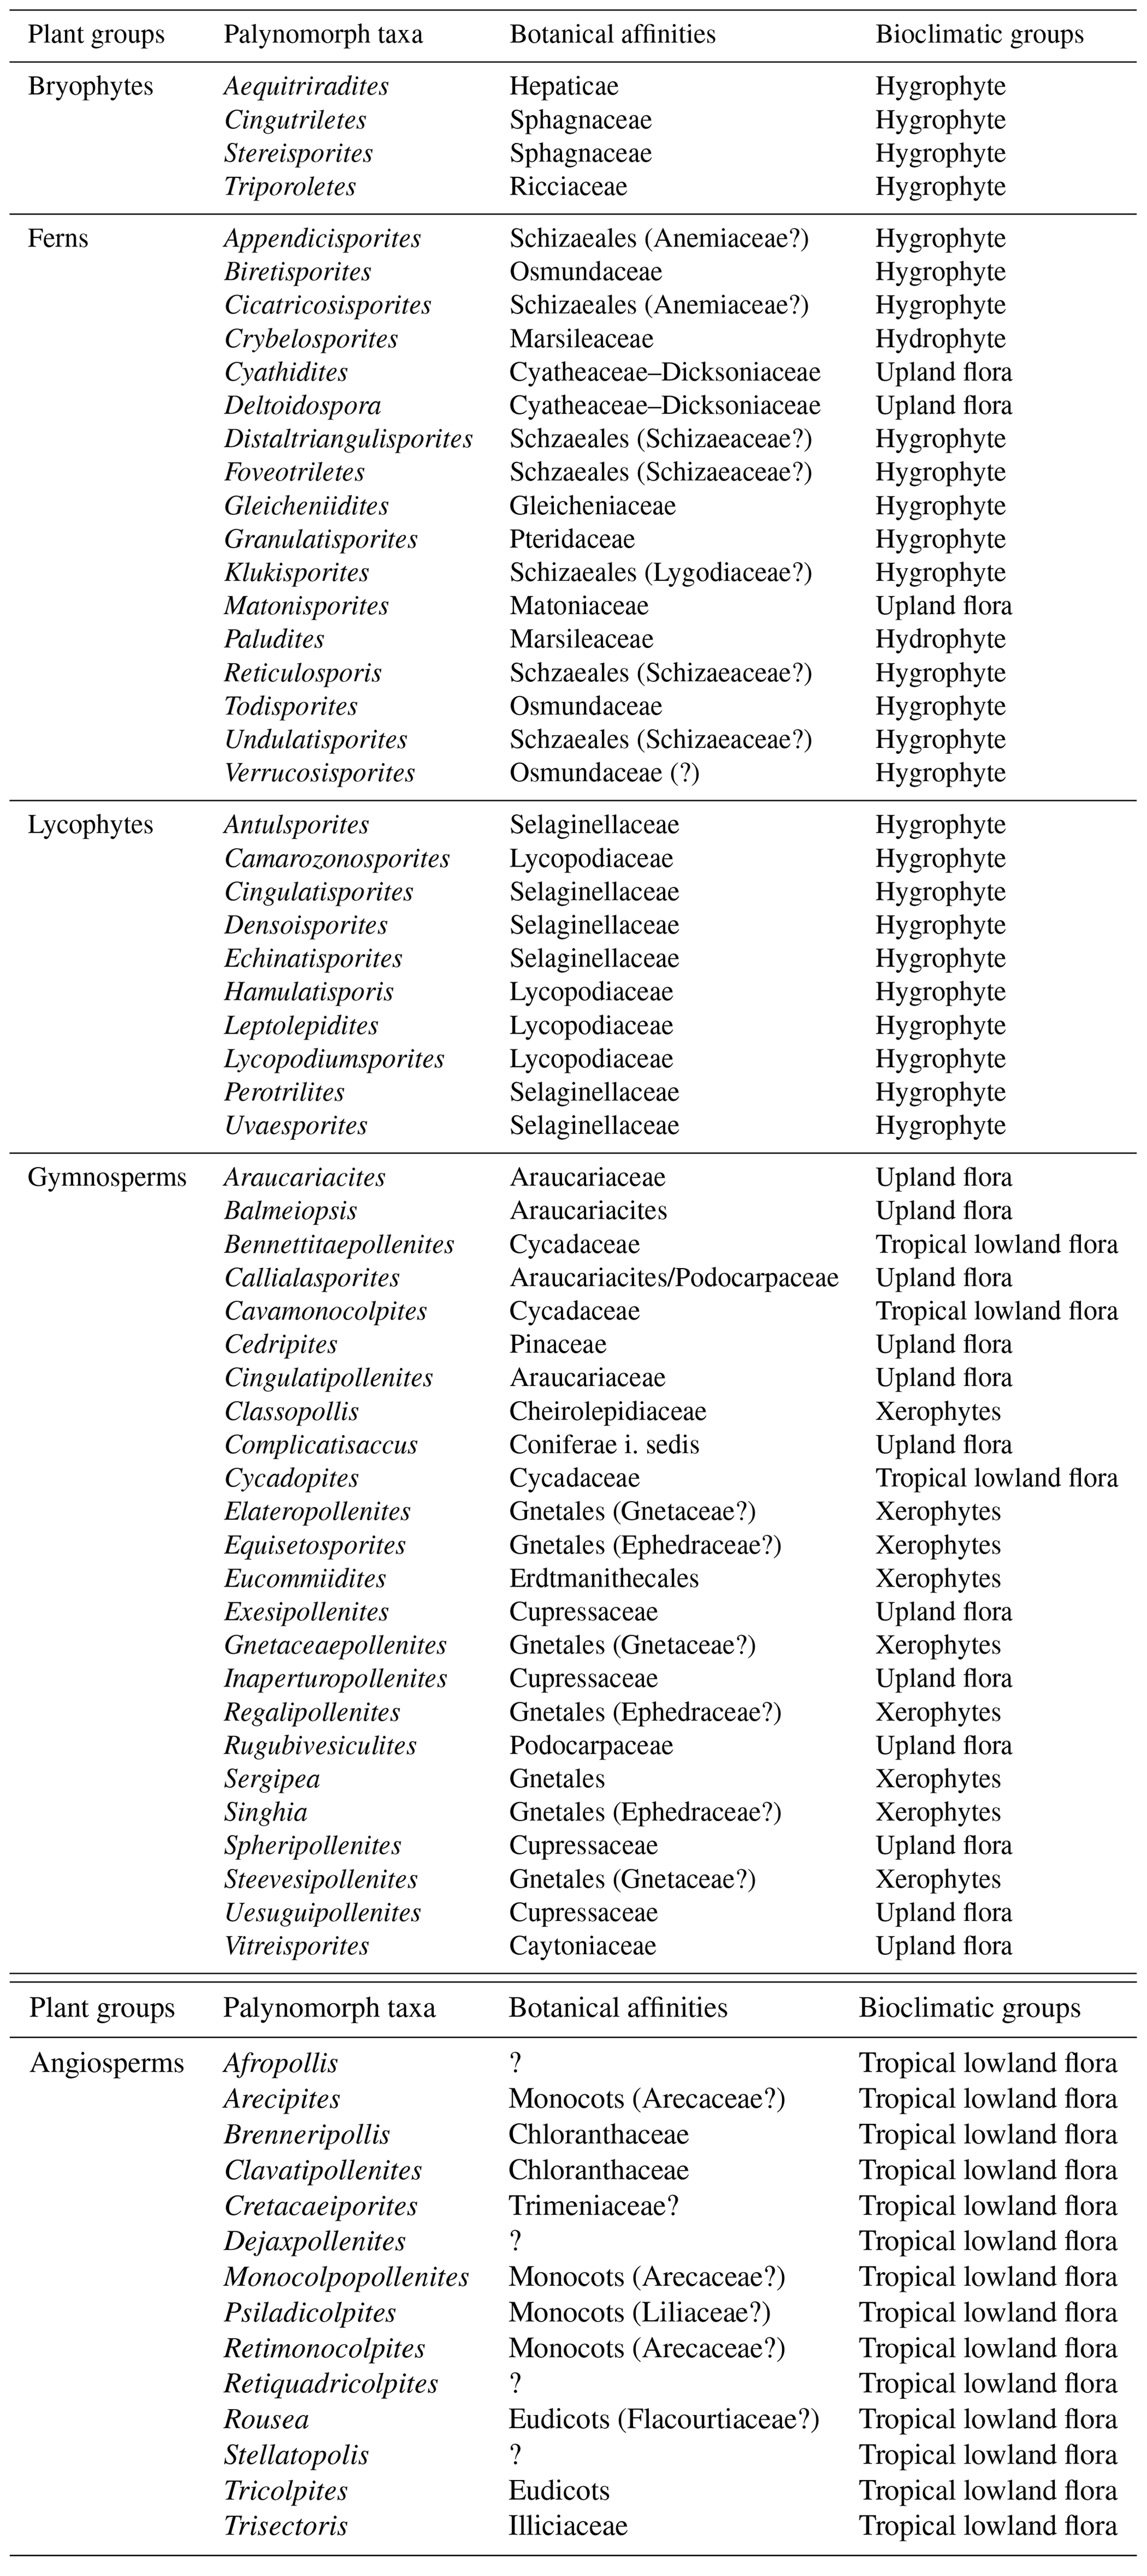
Palynomorphs are useful climatic indicators (bioclimatic groups) because of their botanical affinities that allow the application of the ecological preferences of taxa. However, identifying the spores and pollen grains of the parent plant classified at the family level is often challenging. This study referred to the literature (e.g., Dino, 1994; Carvalho, 2004; Souza-Lima and Silva, 2018; Jansonius et al., 1976–1996) to identify the botanical affinities of the indicator species.
On the basis of botanical affinities and inferred paleoenvironmental conditions (e.g., Dino, 1992; Balme, 1995; Antoniolli, 2001; Carvalho et al., 2017, 2019, 2022), this study proposes five bioclimatic groups: hydrophytes, hygrophytes, tropical lowland flora, upland flora, and xerophytes. These groups provide valuable insights into the climate and vegetation of the study area.
4.5 Wet–dry trend
To support the bioclimatic group distribution, we used the (fern spores versus xerophytes) ratio. This ratio is based on the co-occurrence of fern spores and xerophytic palynomorphs (Classopollis and polyplicate gnetalean pollen); therefore, it can be used as an indicator of dry–wet trends (Carvalho et al., 2019). The ratio of fern spores to xerophytic palynomorphs () was calculated as , where n is the number of specimens counted, Fs is the number of fern spores (non-reworked), and X is the number of xerophytic pollen grains. In summary, approaching 1 implies high humidity, and that approaching −1 indicates low humidity.
4.6 Diversity
Shannon–Wiener diversity indices H(S) were calculated for all samples by using PAST software (Hammer et al., 2001) to provide information for interpreting paleoclimatic trends. Diversity H(S) considers the abundance of each species and is used to characterize the diversity of the assemblages.
4.7 Indicator species
To characterize the climate changes during the late Aptian based on paleoflora, we employed the indicator species analysis (IndVal) method. IndVal is a widely used measure in ecological studies to evaluate the association between a particular species and a specific habitat or environmental condition. The IndVal index quantifies the level of association between a species and a habitat by considering two components: specificity and fidelity. Specificity refers to the extent to which a species is associated with a particular habitat or condition, while fidelity represents the probability of finding a species in a habitat given its occurrence in the overall study area. The IndVal index has demonstrated successful applications in palynological studies (Caron and Jackson, 2007; Roucoux et al., 2013; Carvalho et al., 2017; Trindade and Carvalho, 2018; Leandro et al., 2020). In our study, the IndVal index was employed to assess the degree of association between taxa and specific sample groups corresponding to different paleoclimatic phases. It was calculated using the formula proposed by Dufrêne and Legendre (1997): IndVal group k, species , j, where Ak,j represents specificity, and Bk,j represents fidelity. We used PAST software (Hammer et al., 2001) to calculate these values.
To ensure that our IndVal analysis fulfilled the criteria of ordination and climate-focused approach, we grouped the samples according to three climatic phases: pre-evaporitic, evaporitic, and post-evaporitic. This allowed us to identify the specific indicator species associated with each climatic phase and gain insights into the vegetation that existed during the late Aptian.
A total of 69 genera were identified in the 40 samples and were distributed into five plant groups: bryophytes (four genera), ferns (17 genera), lycophytes (10 genera), gymnosperms (24 genera), and angiosperms (14 genera) (Appendix A) (Table 2). A total of 20 indeterminate morphotypes were found in ferns and 10 in angiosperms. Of the 69 genera identified, 9 occurred in all the wells studied: Afropollis, Araucariacites, Callialasporites, Cicatricosisporites, Classopollis, Cyathidites, Deltoidospora, Equisetosporites, Verrucosisporites. The suggested botanical affinity of the 69 genera was 94.2 %. The 5.8 % without botanical affinity refers to the group of angiosperms.
Table 2Plant groups, palynomorph taxa, botanical affinities, and bioclimatic groups of the material studied.
All bioclimatic groups were present in the studied sections (Table 3, Appendix B). In general, the palynological assemblage is predominantly composed of the xerophytic bioclimatic group, characterized by a high abundance of Classopollis. The average abundance of xerophytes was 55.7 %, ranging from 46.3 % to 63.6 % in the sections studied (Table 4). In sequence, the upland flora had an overall average abundance of 18.9 % (ranging from 7.8 % to 26 %), with Araucariacites being the dominant taxon. The hygrophyte bioclimatic group is characterized by the presence of Cicatricosisporites, which had an average abundance of 18.6 % (ranging from 11.4 % to 28.4 %). By contrast, the hydrophyte bioclimatic group is the least abundant, with an overall average of 0.7 %, and is dominated by the genus Crybelosporites. Regarding diversity, the Shannon–Wiener indices (H′) obtained for the 40 samples showed an overall average of , which ranged from in the VN-1 section to in section PE-1 (Table 4). The values of the wet–dry trend ( ratio) ranged from 0.19 (dry) in section CI-1 to 0.39 (wet) in EGST-1 (wet) (Table 4).
Table 3Description of the bioclimatic groups and their main representatives.
5.1 Stratigraphic distribution of bioclimatic groups in the EGST-1 well
Although xerophytes are dominant overall, the EGST-1 well exhibits a higher abundance of hygrophytes (24.9 %) due to moderate to high occurrences of Cicatricosisporites, especially at the base of the well (Fig. 3). Additionally, the abundance of hygrophytes, tropical lowland flora, and upland flora increases toward the upper sections, whereas the abundance of xerophytes decreases (Fig. 4). The Shannon–Wiener indices (H′) showed an overall average of , slightly above the general average (). The ratio had the highest value for all sections (0.38), above the overall average (0.28), indicating more humid conditions (Table 4).
Table 4Average abundance of bioclimatic groups, diversity (H′), and ratio of the studied wells.
Figure 3Stratigraphic distribution of bioclimatic groups of well EGST-1 (Bragança–Viseu Basin).
Figure 4Stratigraphic distribution of bioclimatic groups of well VN-1 (Bragança–Viseu Basin).
5.2 Stratigraphic distribution of bioclimatic groups in the VN-1 well
Similar to the EGST-1 well, the VN-1 well is composed of four samples from the Bragança Formation, in which xerophytes dominate. However, unlike the former well, hygrophytes exhibit the highest average abundance (28.4 %) among all studied wells, primarily because of the abundance of trilete psilate. Despite few samples, an increasing trend of hygrophytes, tropical lowland flora, and upland flora was observed, with a significant peak in hygrophytes (Fig. 4). The average diversity of is the lowest for the studied basins, below the overall average (). The ratio was 0.31, above the overall average (0.28).
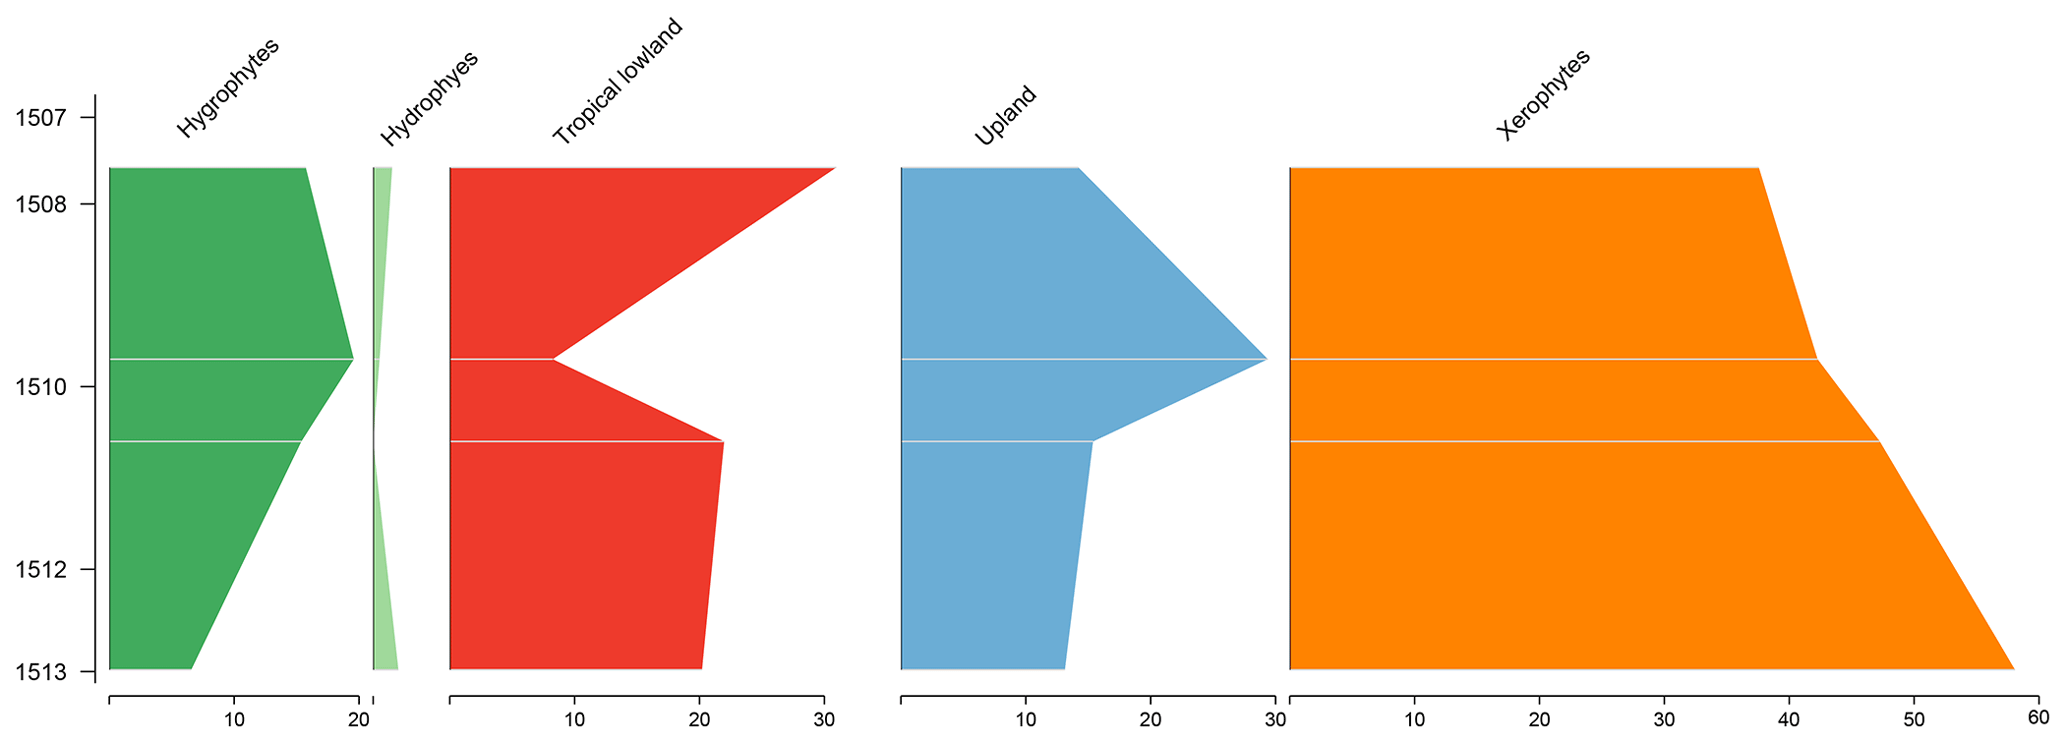
5.3 Stratigraphic distribution of bioclimatic groups in the PR-1 well
The section comprises four samples from the Codó Formation. Notably, the PR-1 well exhibits the lowest average abundance of xerophytes (46.3 %) (Table 4). However, it shows the highest average abundance in the tropical lowland flora group (20.4 %) of all the wells studied, driven by the presence of the genus Afropollis. In general, an increasing trend toward hygrophytes, upland flora, and mainly tropical lowland flora was observed (Fig. 5). The average diversity was in this well. This value is one of the highest values among all the wells studied. This high diversity is mainly attributed to the significant number of species belonging to the tropical lowland flora group. The ratio was 0.25, slightly below the overall average (0.28) (Table 4).
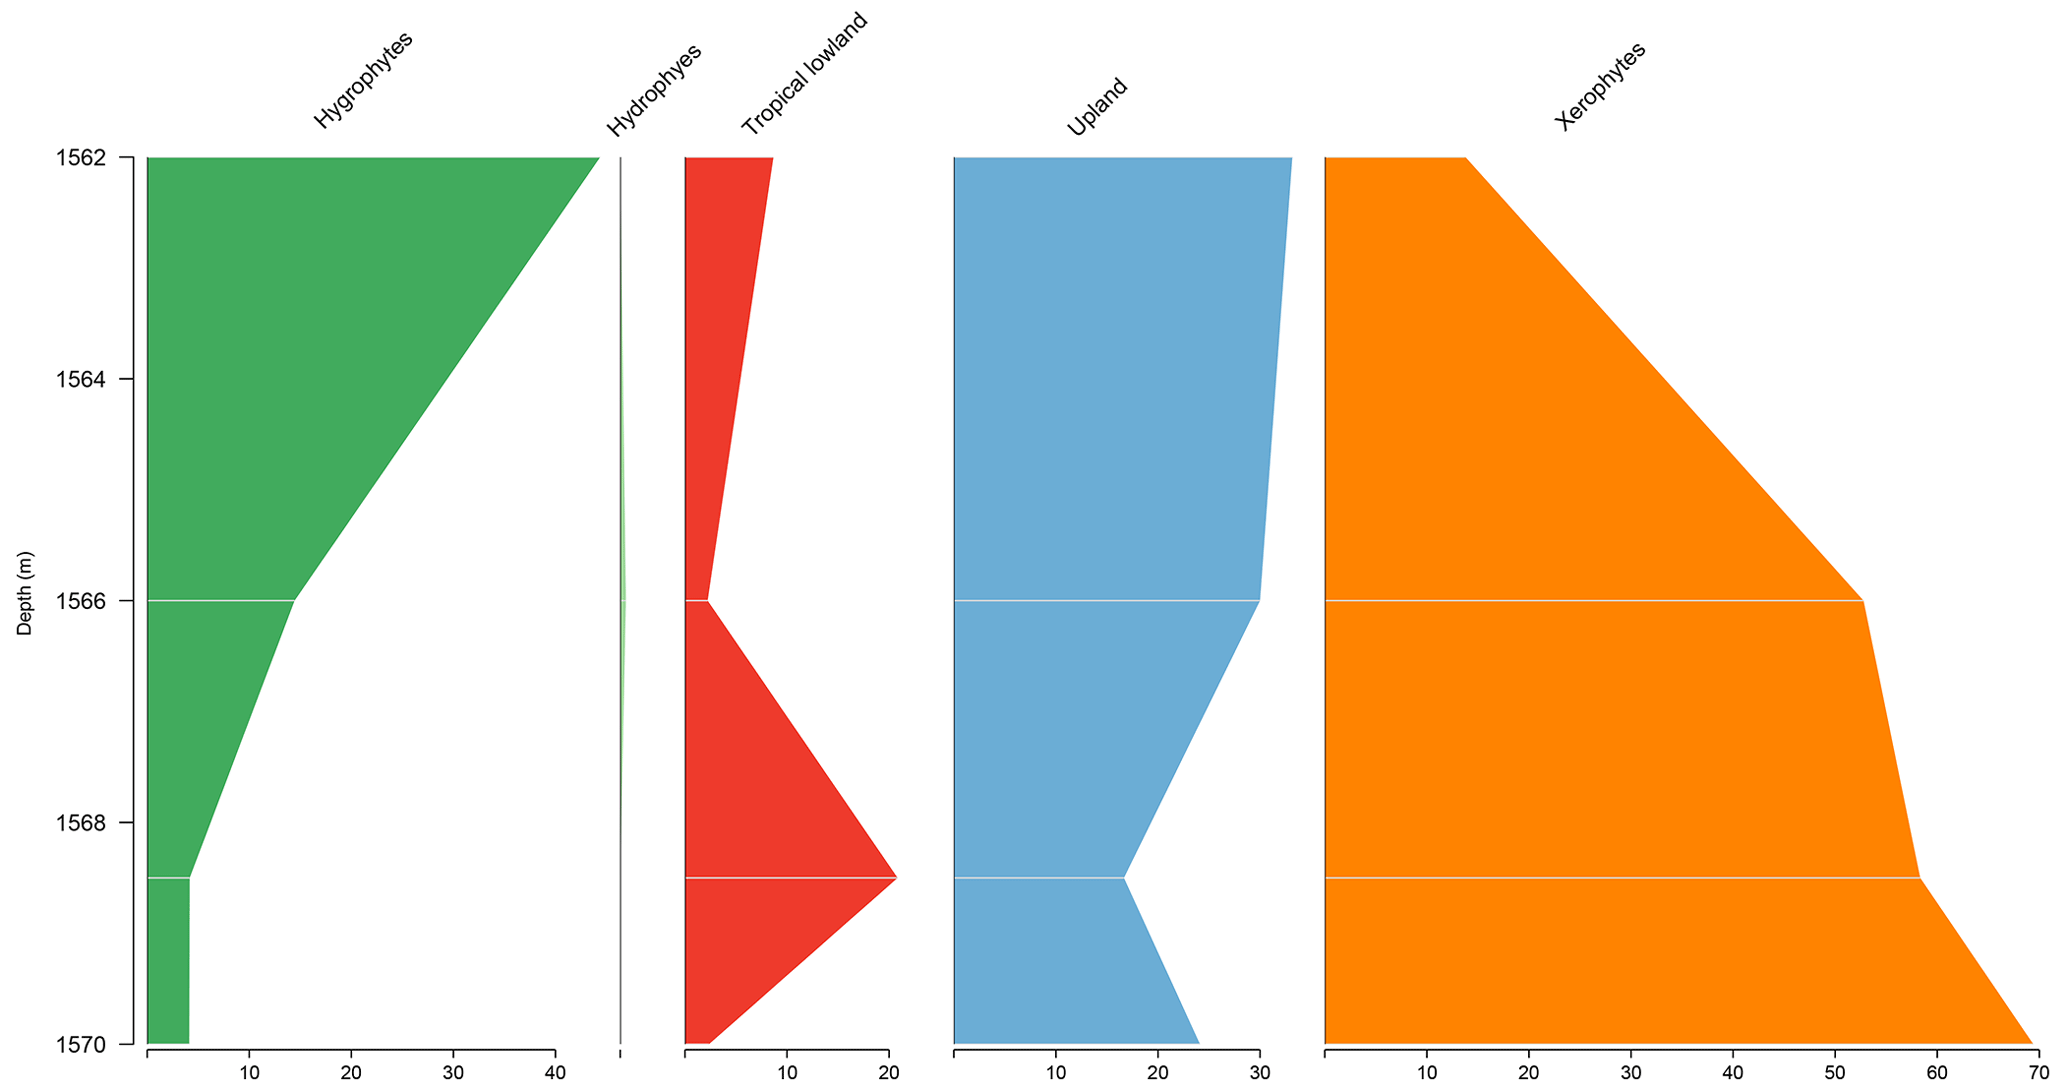
5.4 Stratigraphic distribution of bioclimatic groups in the PE-1 well
The PE-1 well shows a clear decreasing trend upward of the xerophytes, which did not exceed 20 % (Fig. 6). By contrast, hygrophytes and upland flora show a conspicuous increase. The upland flora group shows an average of 26 % driven by the genus Araucariacites. The average diversity of is the highest for the basins. This average diversity is due to the many species of upland flora and hygrophytes. The ratio was 0.28, the same as the overall average (0.28) (Table 4).
5.5 Stratigraphic distribution of bioclimatic groups in the RL-1 well
The section consists of seven samples from the Codó Formation. The xerophytic bioclimatic group dominated the entire section, with no abrupt changes in the abundance curve observed, except at the base of the section, where the hygrophytes, tropical plain flora, and upland flora groups together reached almost 40 % (Fig. 7). The average diversity of is the second lowest for the studied basins. The ratio was 0.24, slightly below the overall average (0.28) (Table 4).
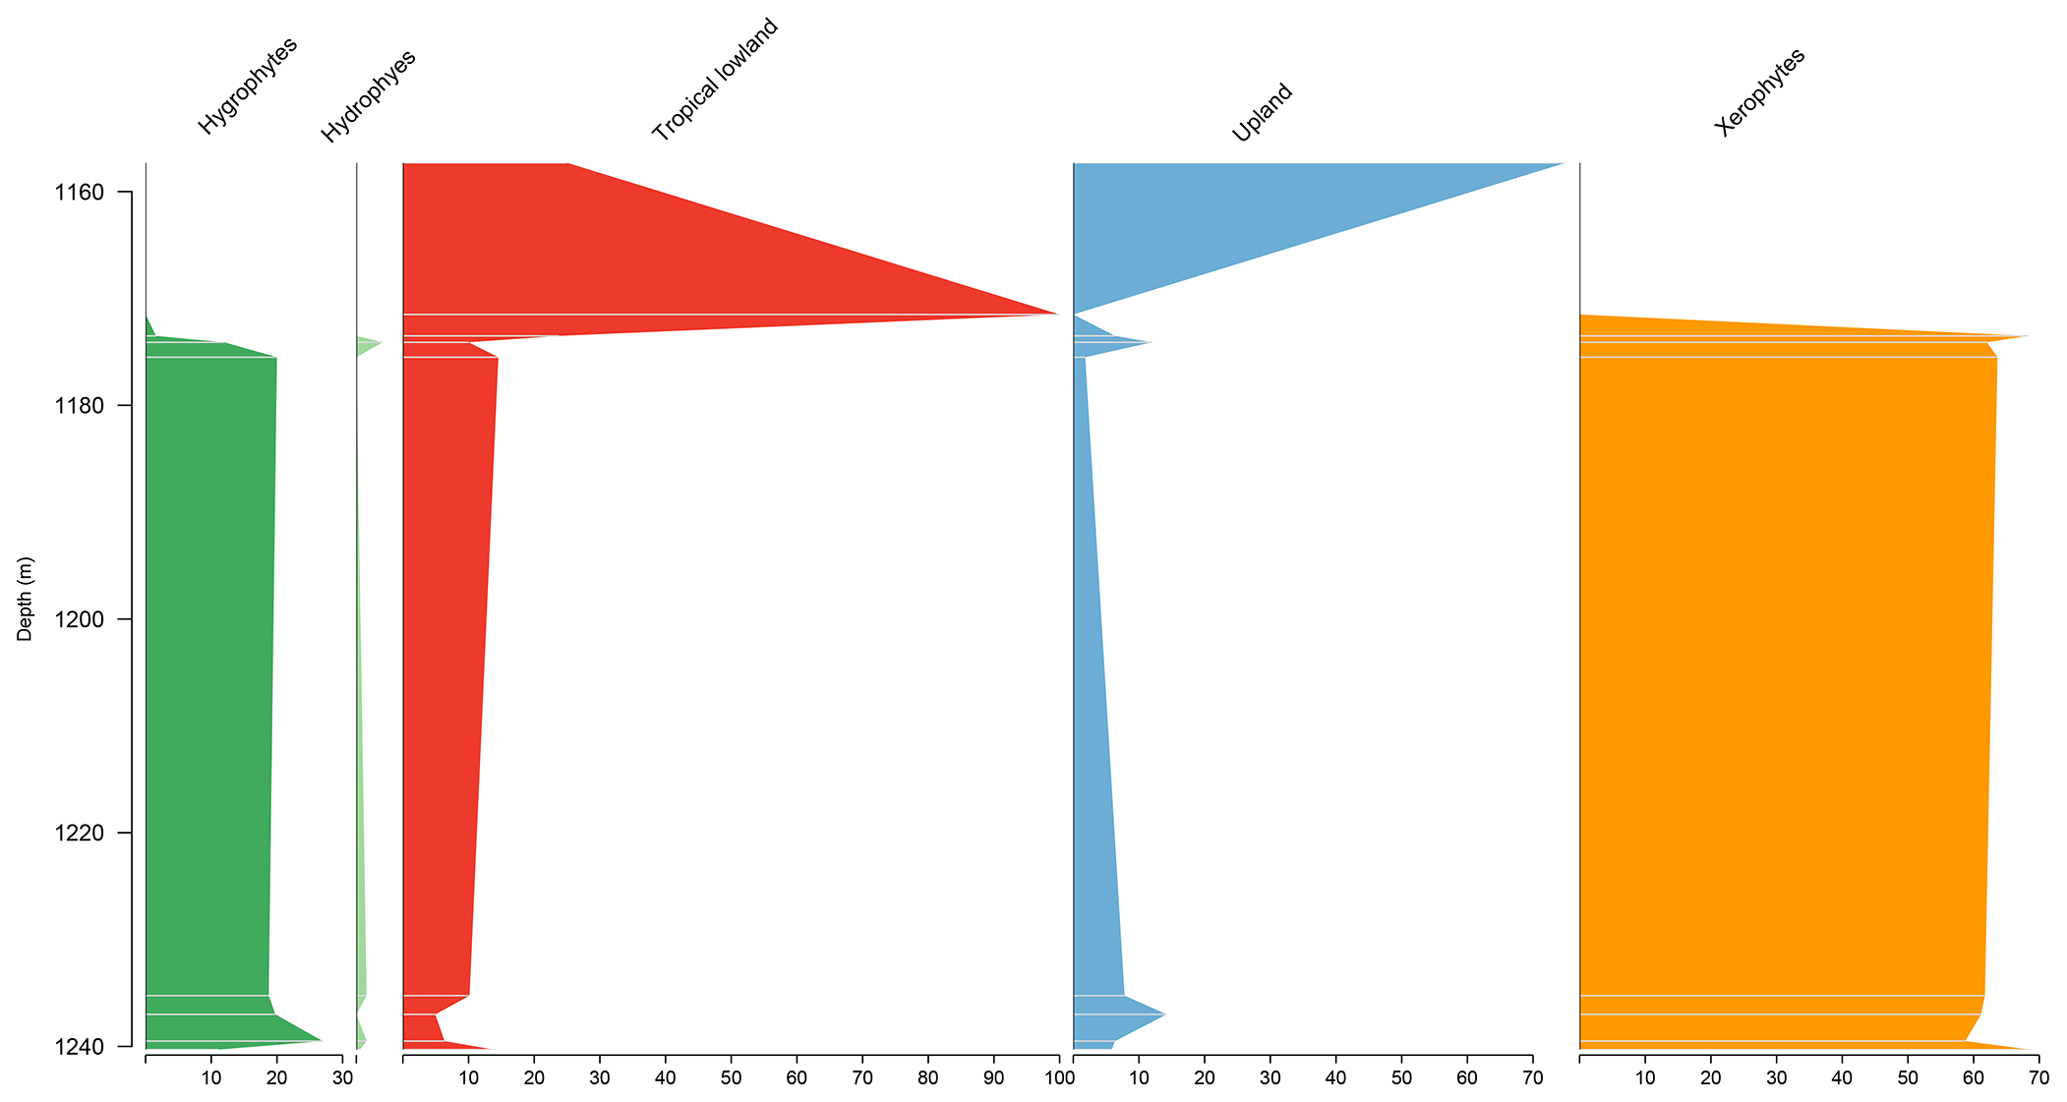
5.6 Stratigraphic distribution of bioclimatic groups in the CI-1 well
The Parnaíba Basin is represented by one well, which comprises 13 samples from the Codó Formation. The palynological assemblage of this section was dominated by the xerophytic bioclimatic group, with a high average of 63.6 %, largely because of the abundance of Classopollis and Equisetosporites. The abundance curves of bioclimatic groups show that in the base a balance occurs between the xerophytes and the other groups, especially the upland flora, and in the top there is a clear dominance of the xerophyte group (15.9 %) (Table 4). The ratio recorded the lowest value in all sections (0.19), which was below the overall average (0.28), indicating drier conditions (Table 4). However, despite this, the average diversity of was one of the highest, with the same value as the overall average of 2.0.
5.7 Climatic phases
All six sections were individually analyzed for palynology. However, a composite section was constructed (Table 5) based on the stratigraphically evident chronological distribution of the climatic phases in each studied section. The composite section of the Bragança–Viseu, São Luís, and Parnaíba basins consists of 40 samples, with 24 samples from the pre-evaporitic phase, 8 from the evaporitic phase, and 8 from the post-evaporitic phase (Table 5). In general, the composite section highlights the bioclimatic groups of hygrophytes (18.8 %) and tropical lowland flora. The diversity and ratio curves showed strong synchrony, indicating a relation between diversity and humidity (Fig. 9). No marine elements were recorded in these sections.
Table 5Average abundance of bioclimatic groups, diversity, , and marine elements of the paleoclimatic phases for the Bragança–Viseu, São Luís, and Parnaíba basins. No marine elements.
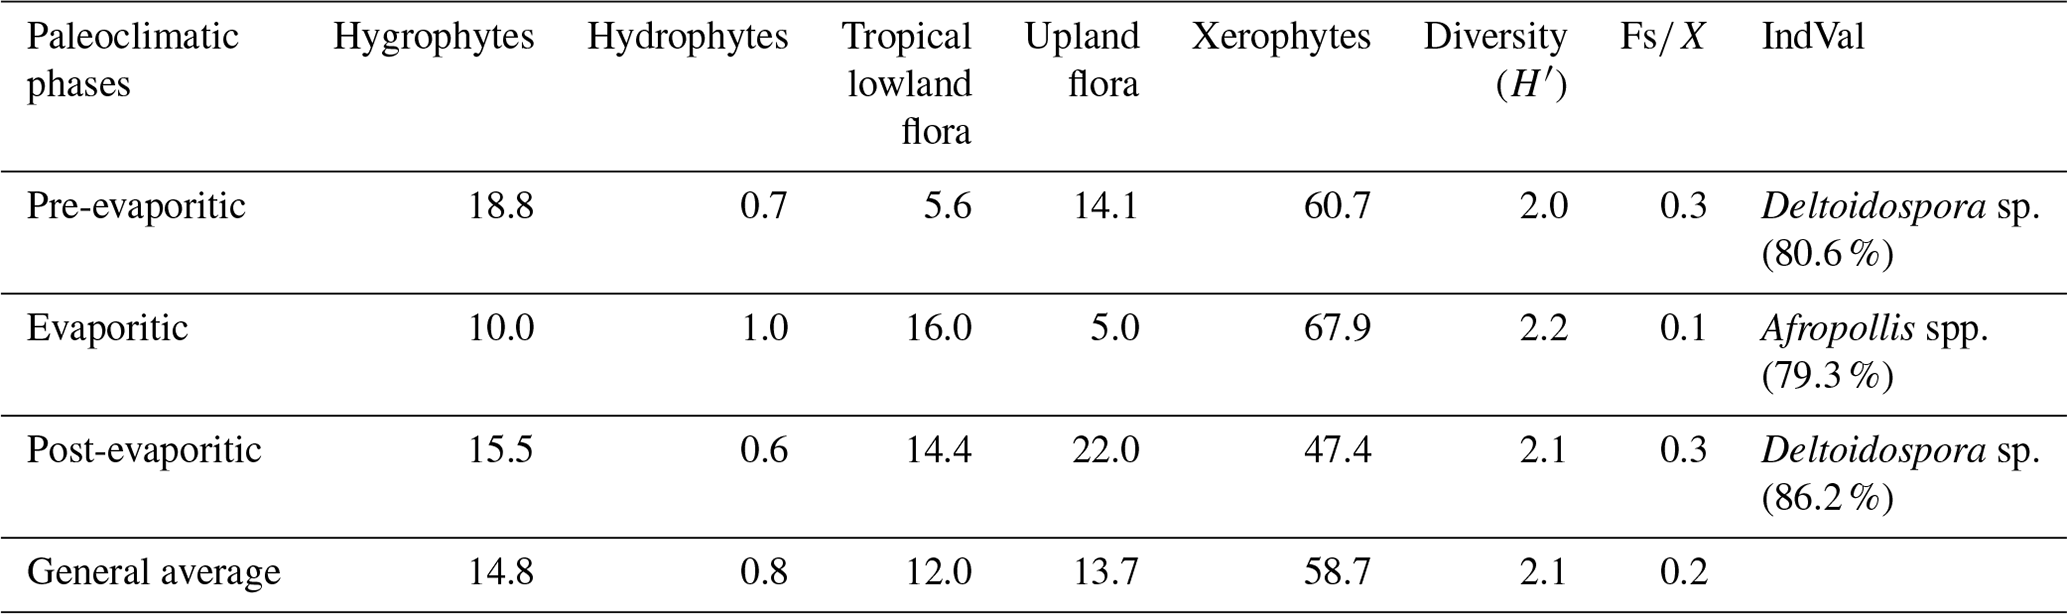
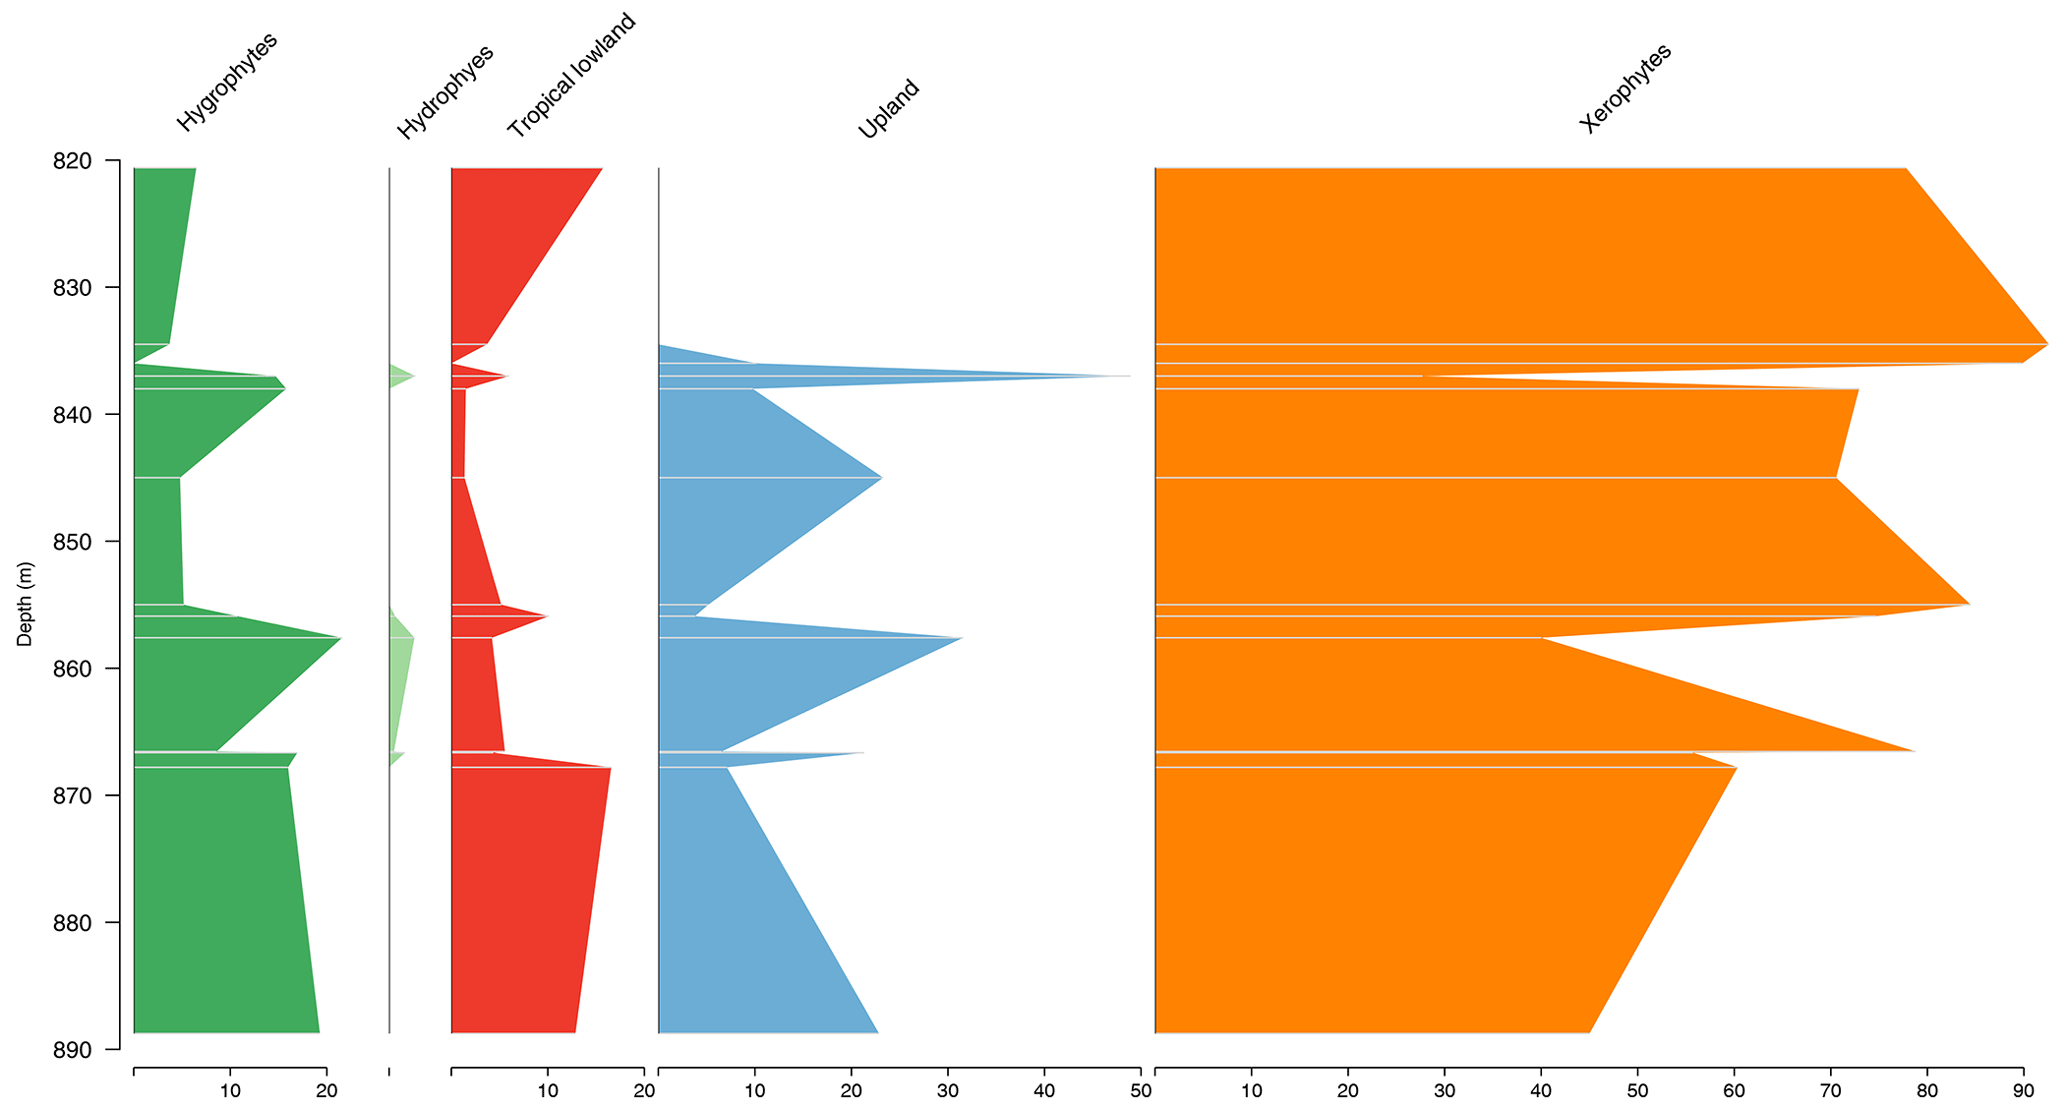
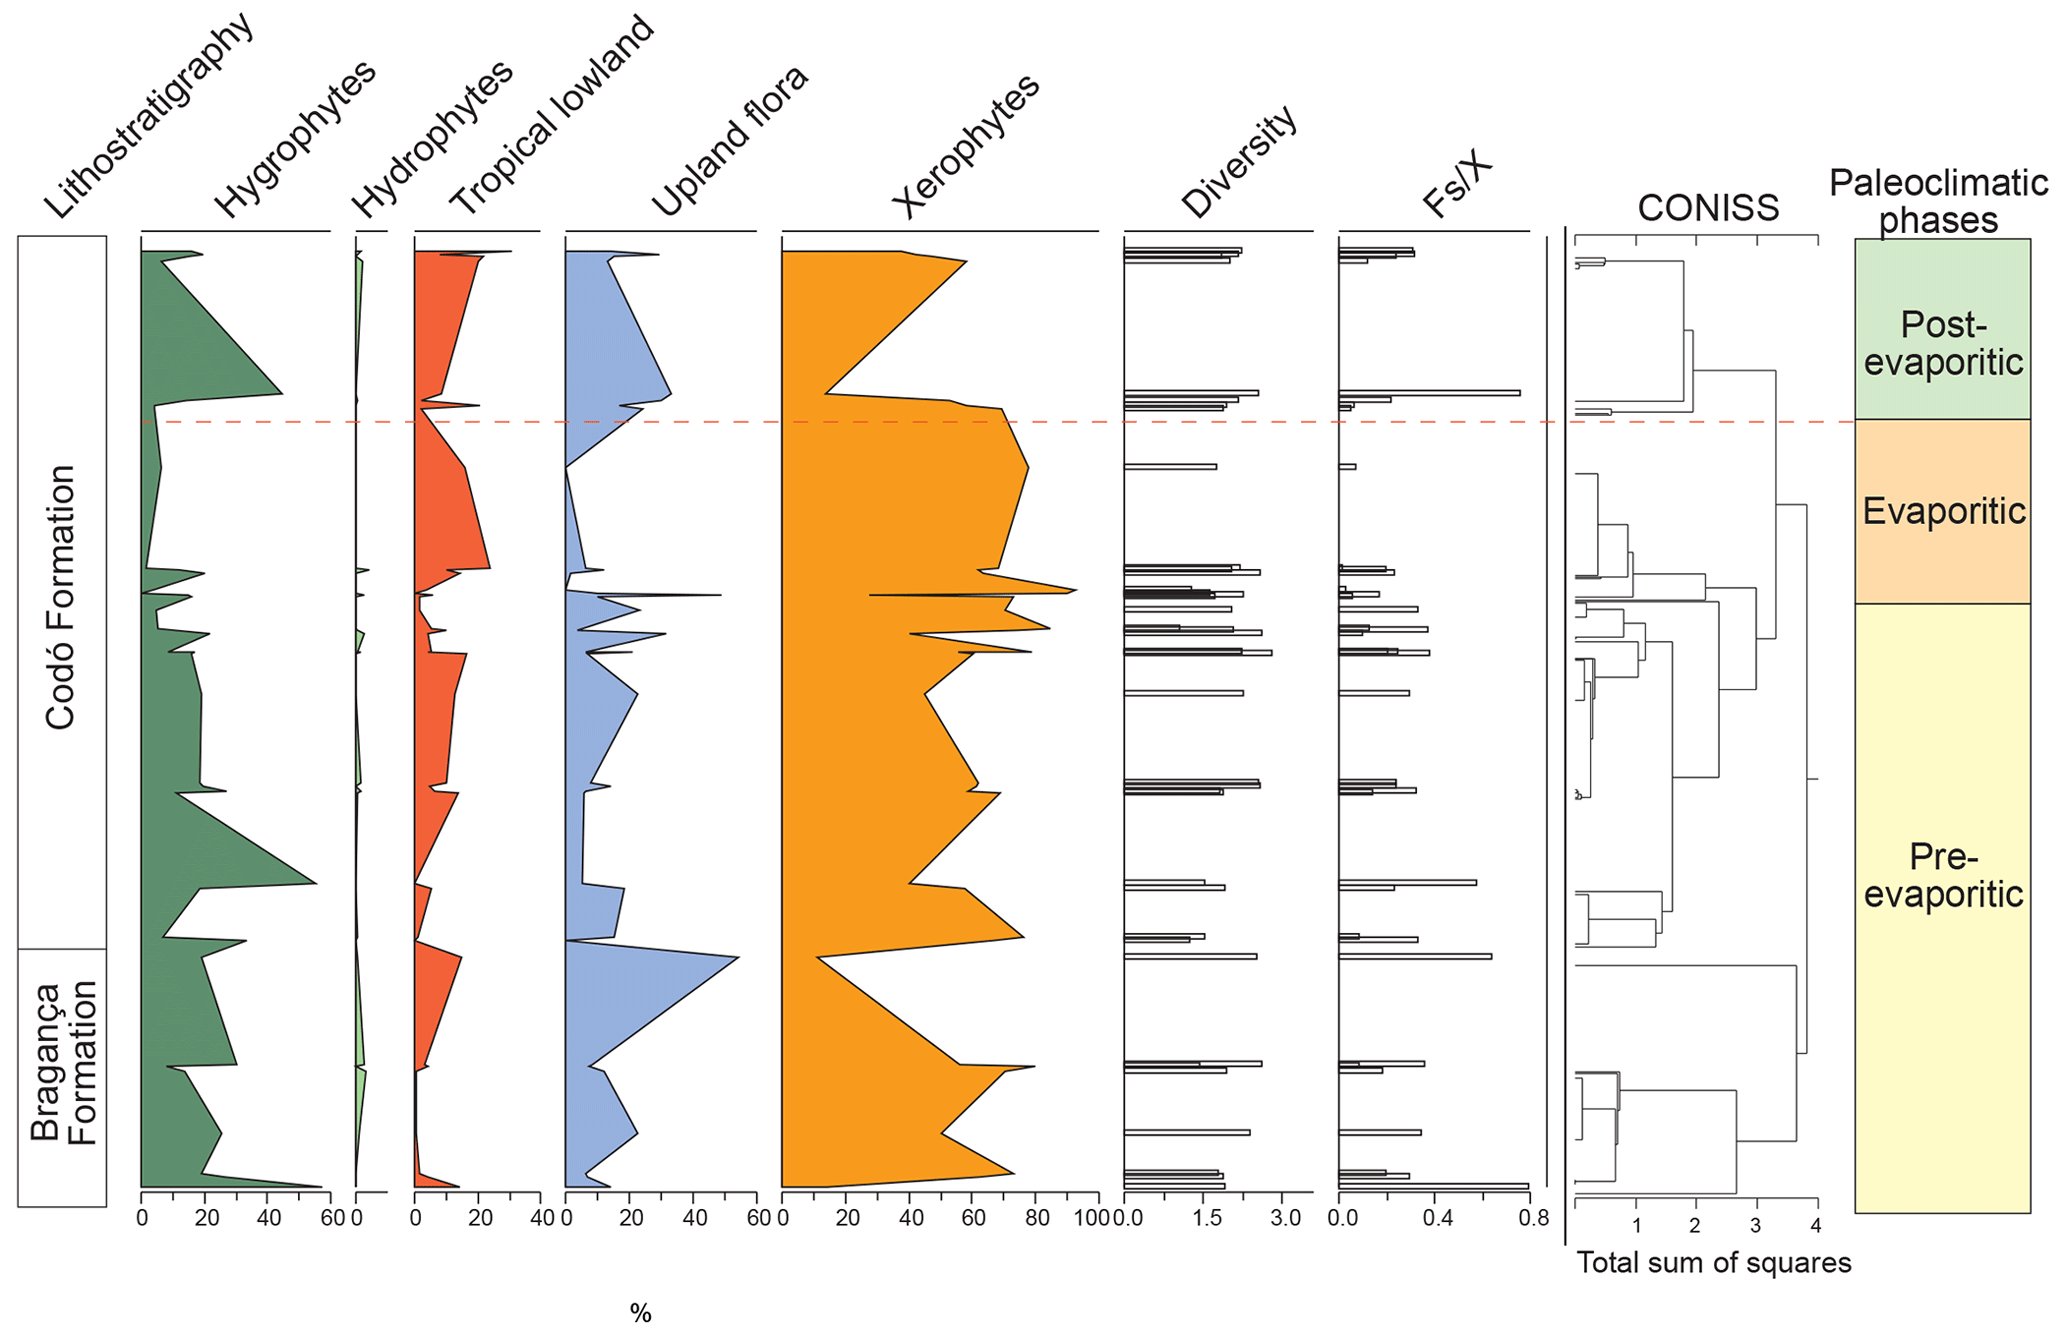
Figure 9Composite profile showing the stratigraphic distribution of bioclimatic groups, diversity, and against the paleoclimatic phases. Agglomerative hierarchical clustering and stratigraphically constrained dendrogram (CONISS) showing the main break (red dashed line).
During the pre-evaporitic phase, there is a higher abundance of xerophytes, hygrophytes, and upland flora, but with strong oscillations observed in their respective curves. The dendrogram in Fig. 9 identifies two intervals within this phase: with significant values of xerophytes at the base but with a decreasing trend toward the top. In the interval above, the xerophyte curve exhibits an upward trend. The diversity and ratio curves show synchrony but with a decreasing trend toward the top. The indicator species (IndVal) identified for the pre-evaporitic phase, Deltoidospora spp. (Cyatheaceae–Dicksoniaceae), is related to the montane rainforest, suggesting more humid conditions (Table 5).
The evaporitic phase, which corresponds to the gypsum layers of the Codó Formation, is characterized by the highest average of the xerophytic bioclimatic group in the composite section (Table 5). Additionally, the average abundance of the tropical lowland flora group is also high, driven by the genus Afropollis. Surprisingly, the mean diversity is high during this phase, but the mean ratio is the lowest. The high diversity in arid conditions is due to the great diversity of species in the xerophytic group, such as Classopollis classoides, Equisetosporites maculosus, and Gnetaceaepollenites jansonius. The IndVal for the evaporitic phase is Afropollis spp. related to tropical lowland flora (Table 5).
The post-evaporitic phase, which includes part of a section of the Codó Formation, is characterized by a significant decrease in the dominance of the xerophytic bioclimatic group; lower average abundance (47 %) in PR-1; and the clear dominance of hygrophyte groups, including tropical lowland flora and upland flora. The dendrogram reveals a break between this phase and the evaporitic phase (Fig. 9). In general, this reflects an inversion in abundance between groups related to humidity (hygrophytes, hydrophytes, tropical flora, and upland flora) and groups related to drier conditions (xerophytes) (Fig. 9). In this phase, the indicator species is Deltoidospora spp., suggesting more humid conditions for pre- and post-evaporitic phases.
The data obtained from these sections provide clear evidence of the dominance of the xerophytic bioclimatic group during the late Aptian in Brazilian sedimentary basins. This information supports the literature that suggests an essentially arid climate during this era (e.g., Lima, 1983; Suguio and Barcelos, 1983; Petri, 1983; Rossetti et al., 2003; Hay and Floegel, 2012; Carvalho et al., 2017, 2019, 2022). This aridity has been attributed to the predominance of conifers from the Cheirolepidiaceae family and their Classopollis pollen grains. However, climatic oscillations were identified during this era, indicated by bioclimatic groups related to humid conditions: hydrophytes, hygrophytes, tropical lowland flora, and upland flora. A relationship between these groups has been suggested (e.g., Carvalho et al., 2017, 2019, 2022). In this study, principal component analysis (PCA) was conducted between bioclimatic groups that exhibited patterns similar to those observed in the literature (e.g., Carvalho et al., 2017, 2019, 2022). The PCA revealed a positive correlation among hygrophytes, hydrophytes, tropical lowland flora, and upland flora, whereas xerophytes show a negative relationship on the first axis (component 1) (Fig. 10), explaining more than 70 % of the variation. Component 1 characterizes the wet–dry trend.
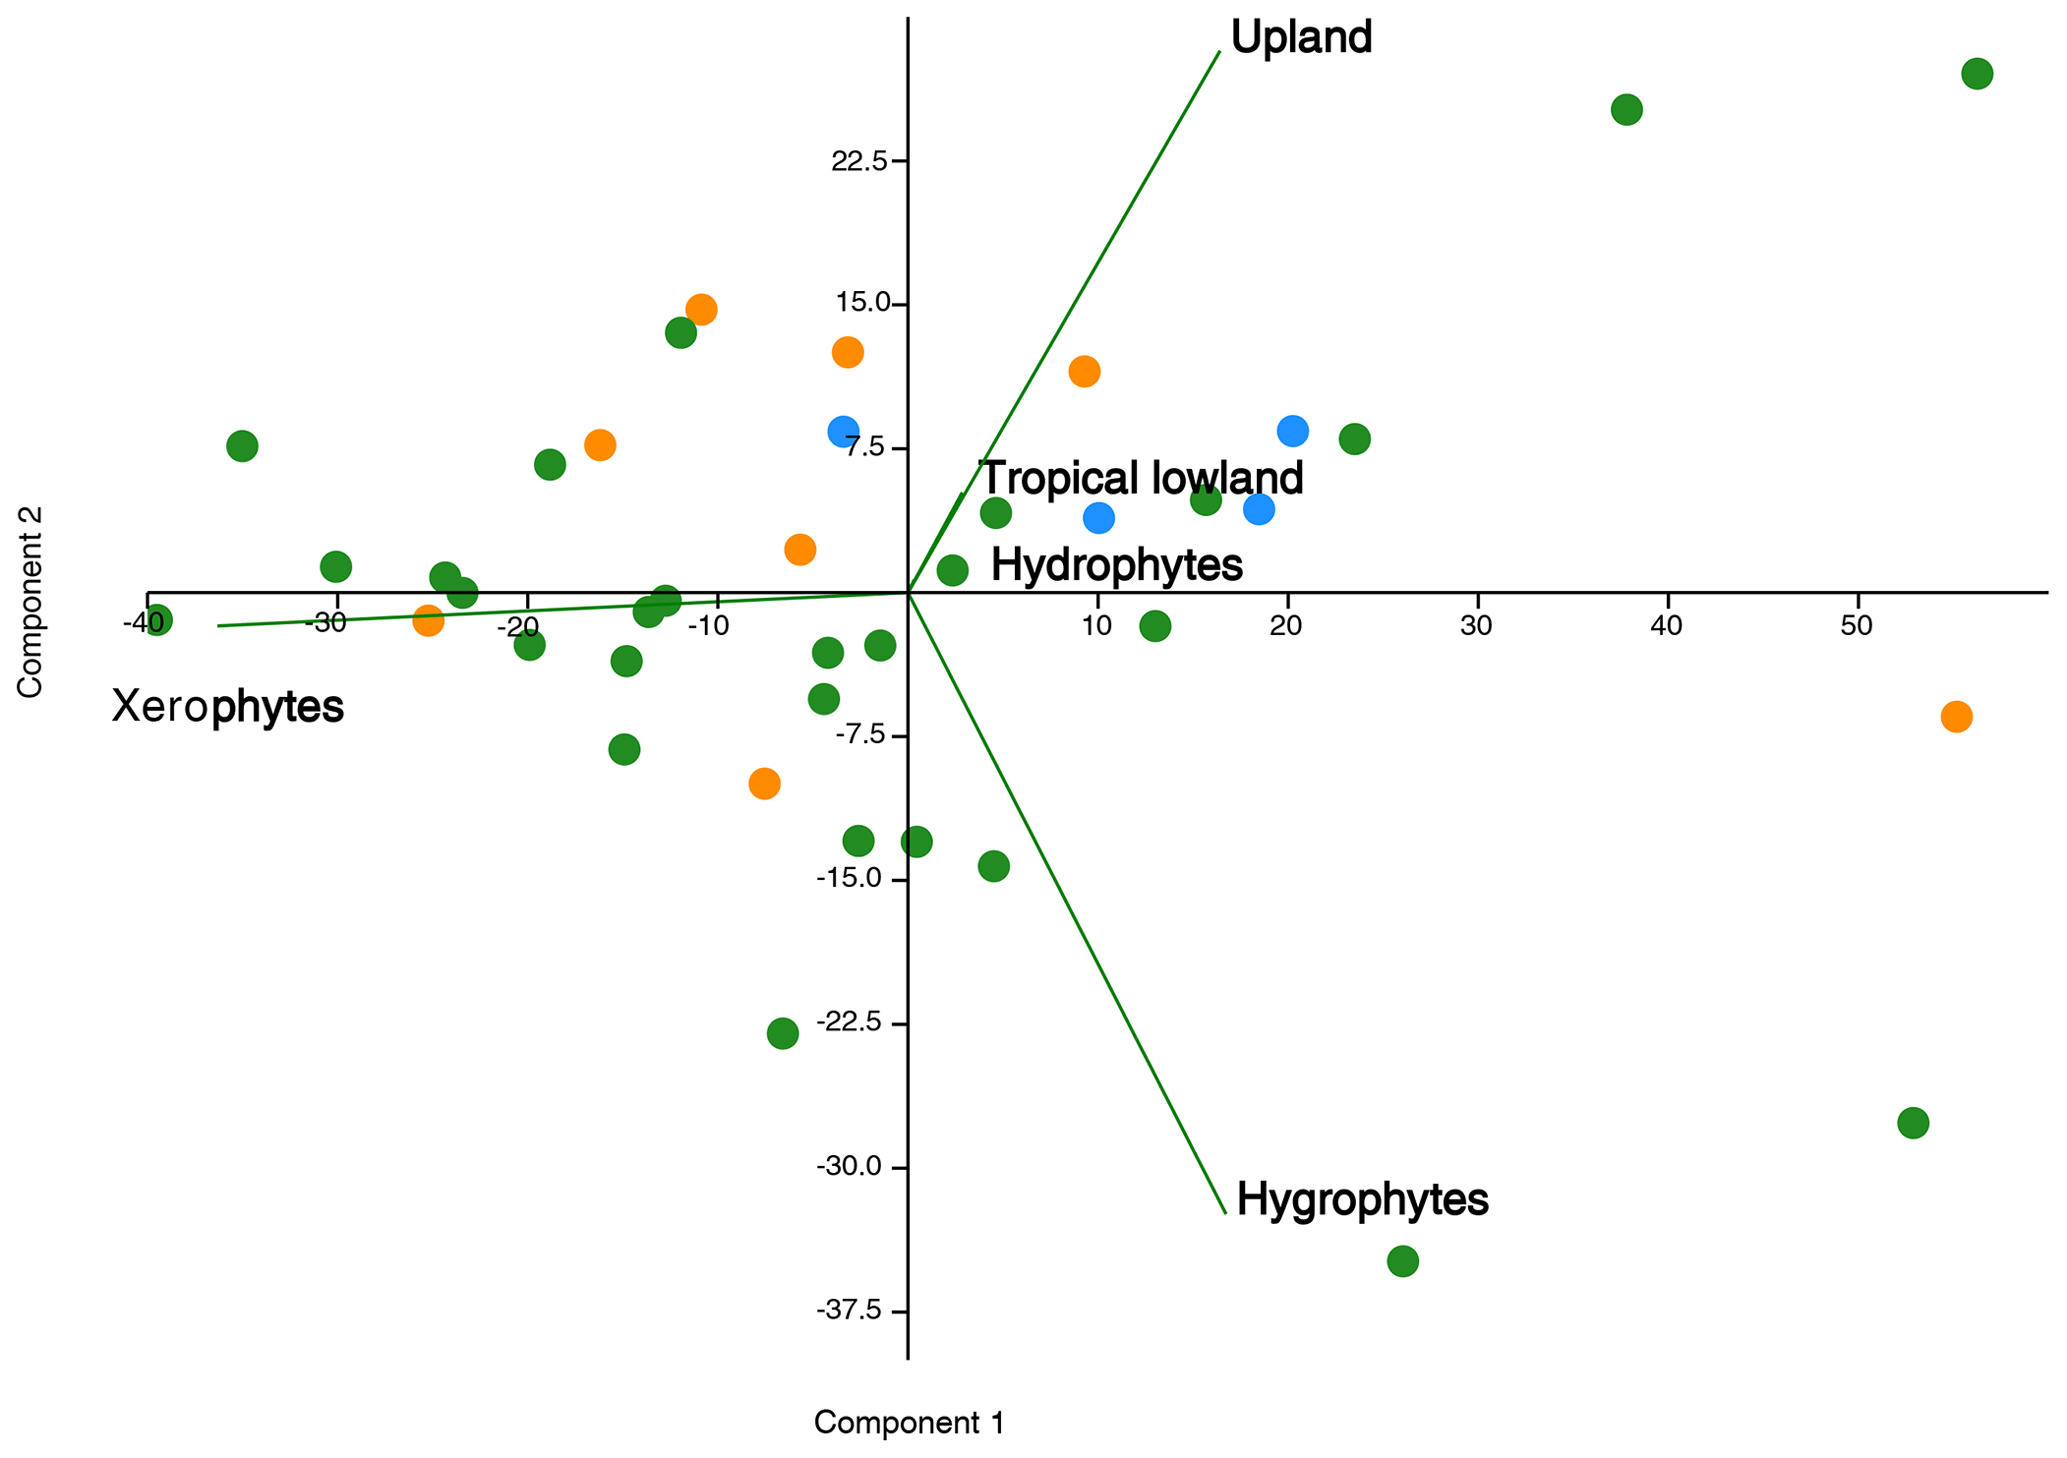
Figure 10Principal component plot of bioclimatic groups for the pre-evaporitic phase (green dots, N=28), evaporitic phase (orange dots, N=8), and post-evaporitic phase (blue dots, N=4).
The sections of the São Luís Basin (PE-1, RL-1, and PR-1) showed the lowest abundance of xerophytic flora, followed by the sections of the Bragança–Viseu Basin (VN-1 and EGST-1) and the CI-1 section (Parnaíba Basin) farther south (Fig. 11a). More humid conditions were also suggested by Santos et al. (2022) for the São Luís Basin. This study utilized palynological data and PCA to propose the existence of a wet phase during the late Aptian in the São Luis Basin. Through the analysis of the abundance of Araucariacites and fern spores, as well as the presence of the genus Classopollis associated with carbonate sedimentation in two semi-arid intervals, an intermediate humid interval was identified. According to Santos et al. (2022), the data were sufficient to identify a pre-Albian humid belt, which challenges the view of exclusively arid Gondwana during the Aptian and supports the presence of a wet phase.
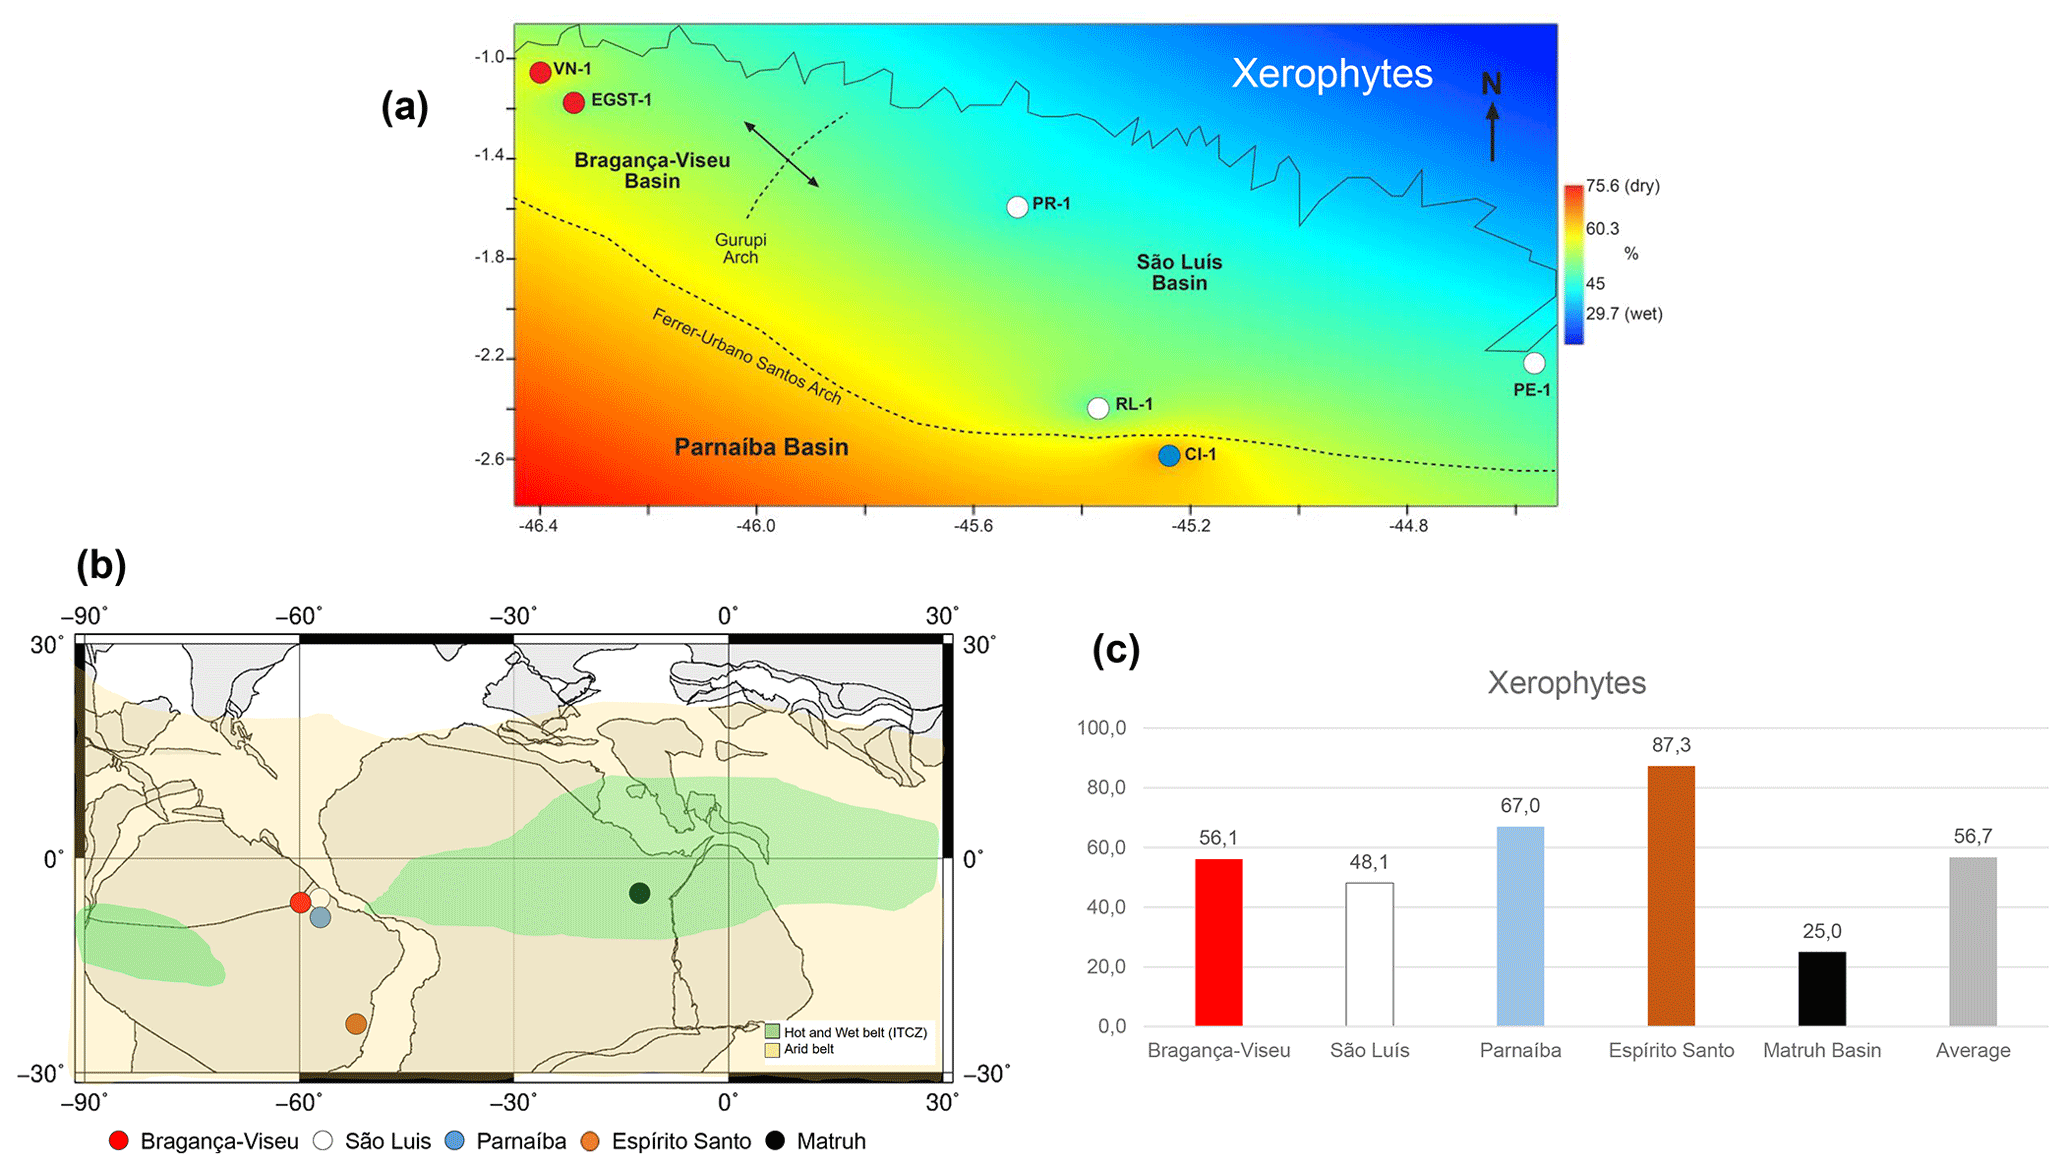
Figure 11(a) Late Aptian latitudinal distribution of the xerophyte bioclimatic group. (b) Paleoclimatic belts of the late Aptian in South America (climatic belts modified from Scotese, 2016). Reconstruction map at 116 Ma modified from the ODSN Plate Tectonic Reconstruction Service. (c) Comparison of the bioclimatic group xerophytes by basin. Data for the Mathru Basin (Dahab Formation) are from Deaf et al. (2020).
As also suggested by Carvalho et al. (2022), we compared the studied sections with sections in the Espírito Santo Basin, located much farther south (at 20∘ S). We found that the studied basins had a lower abundance of xerophytic flora than the Espírito Santo Basin (Fig. 11b, c). The decreasing trend in aridity observed from the southeast (Espírito Santo Basin) to the northeast (Fig. 11b, c) coincides with the location of the hot and humid belt attributed to the ITCZ (Ohba et al., 2010; Chaboureau et al., 2012, 2014; Scotese, 2016). Notably, the approach to the ITCZ belt, where xeric restrictions are milder, was reflected even in the phase with the most aridity, the evaporitic phase, whose indicator species was the Afropollis spp. of the lowland tropical flora. This indicates that the ITCZ must have had diminished aridity. The genus Afropollis has been associated with hot, humid climates. According to Carvalho et al. (2022), this genus exhibits the weakest negative correlation with xerophytic flora (e.g., Classopollis).
The ITCZ belt proposed by Scotese (2016) for the Aptian covers the entire African continental paleo-Equator. However, although very close, it did not reach South America (Fig. 11b). Palynological analyses conducted by Deaf et al. (2020) on the late Aptian material of the Dahab Formation (Matruh Basin, Egypt) indicated a predominance of fern spores from the hygrophyte bioclimatic group (e.g., Triplanosporites, Cicatricosisporites) and uplands (e.g., Deltoidospora, Araucariacites), accounting for approximately 60 % on average. This finding suggests that the Dahab Formation is characterized by humid conditions.
The xerophytic flora (Classopollis and Equisetosporites) in the Dahab Formation averaged approximately 25 %. Considering the climatic belts proposed by Scotese (2016, 2021), this formation occurred “inside” the ITCZ, which is reflected in the prevalence of bioclimatic groups associated with more humid conditions. The abundance of xerophytic flora in the Dahab Formation was lower than that in the sections studied. This difference was particularly significant when compared with the Espírito Santo Basin, where the abundance of xerophytic flora was 87.3 %, as opposed to 25 % in the Dahab Formation (Fig. 11c). Notably, a significant contributor to the humidity in the Dahab Formation was likely a marine influence, which was not present in the sections studied.
The Aptian sections studied have well-preserved palynological diversity dominated by the genera Classopollis (Cheirolepidiaceae) and Araucariacites (Araucariaceae). Some genera of ferns are also abundant such as Cicatricosisporites (Anemiaceae), Verrucosisporites (Osmundaceae), and Deltoidospora (Cyatheaceae).
Five bioclimatic groups were identified and proposed for interpretation: hydrophytes, hygrophytes, tropical lowland flora, upland flora, and xerophytes. The bioclimatic groups provide evidence that the climate during the late Aptian was arid. However, when considering the distribution curves of bioclimatic groups, as well as the indicator species (IndVal) and diversity, a clear upward trend toward increased humidity was observed.
The late Aptian age characterized by three distinct climatic phases: pre-evaporitic, evaporitic, and post-evaporitic. During the pre-evaporitic phase, despite the dominance of xerophytic flora, there were episodes of humidity, evidenced by indicator species such as Deltoidospora spp. The evaporitic phase was dominated by xeric elements, although the moderate to high abundance of lowland tropical flora, confirmed by Afropollis spp. as an indicator species, indicated some periods of humidity. The post-evaporitic phase was marked by a lower abundance of xerophytic elements and a clear dominance of groups associated with wet conditions, mainly the upland flora, suggesting a wetter climate during this phase.
The climatic variation during the late Aptian is reflected in the palynological assemblages, with the arid phase being dominated by the genus Classopollis and other xerophytic bioclimatic group indicators. The wet phase is marked by a significant decrease in xerophytes and a high abundance and diversity of Araucariacites, fern spores, and other genera related to highland, hydrophytic, and hygrophytic bioclimatic groups. The “mirror effect” observed in the frequency curves highlights the ecological differences between the arid and humid trend groups.
According to our findings, vegetation dynamics were affected by a combination of the Intertropical Convergence Zone (ITCZ) and the opening of the South Atlantic Ocean during the late Aptian. The influence of the ITCZ is currently stronger in the north-central region of South America. Notably, climate evolution during the late Aptian in the South Atlantic led to increased humidity, which was closely linked to plant diversity and marine influences.
Plate 1
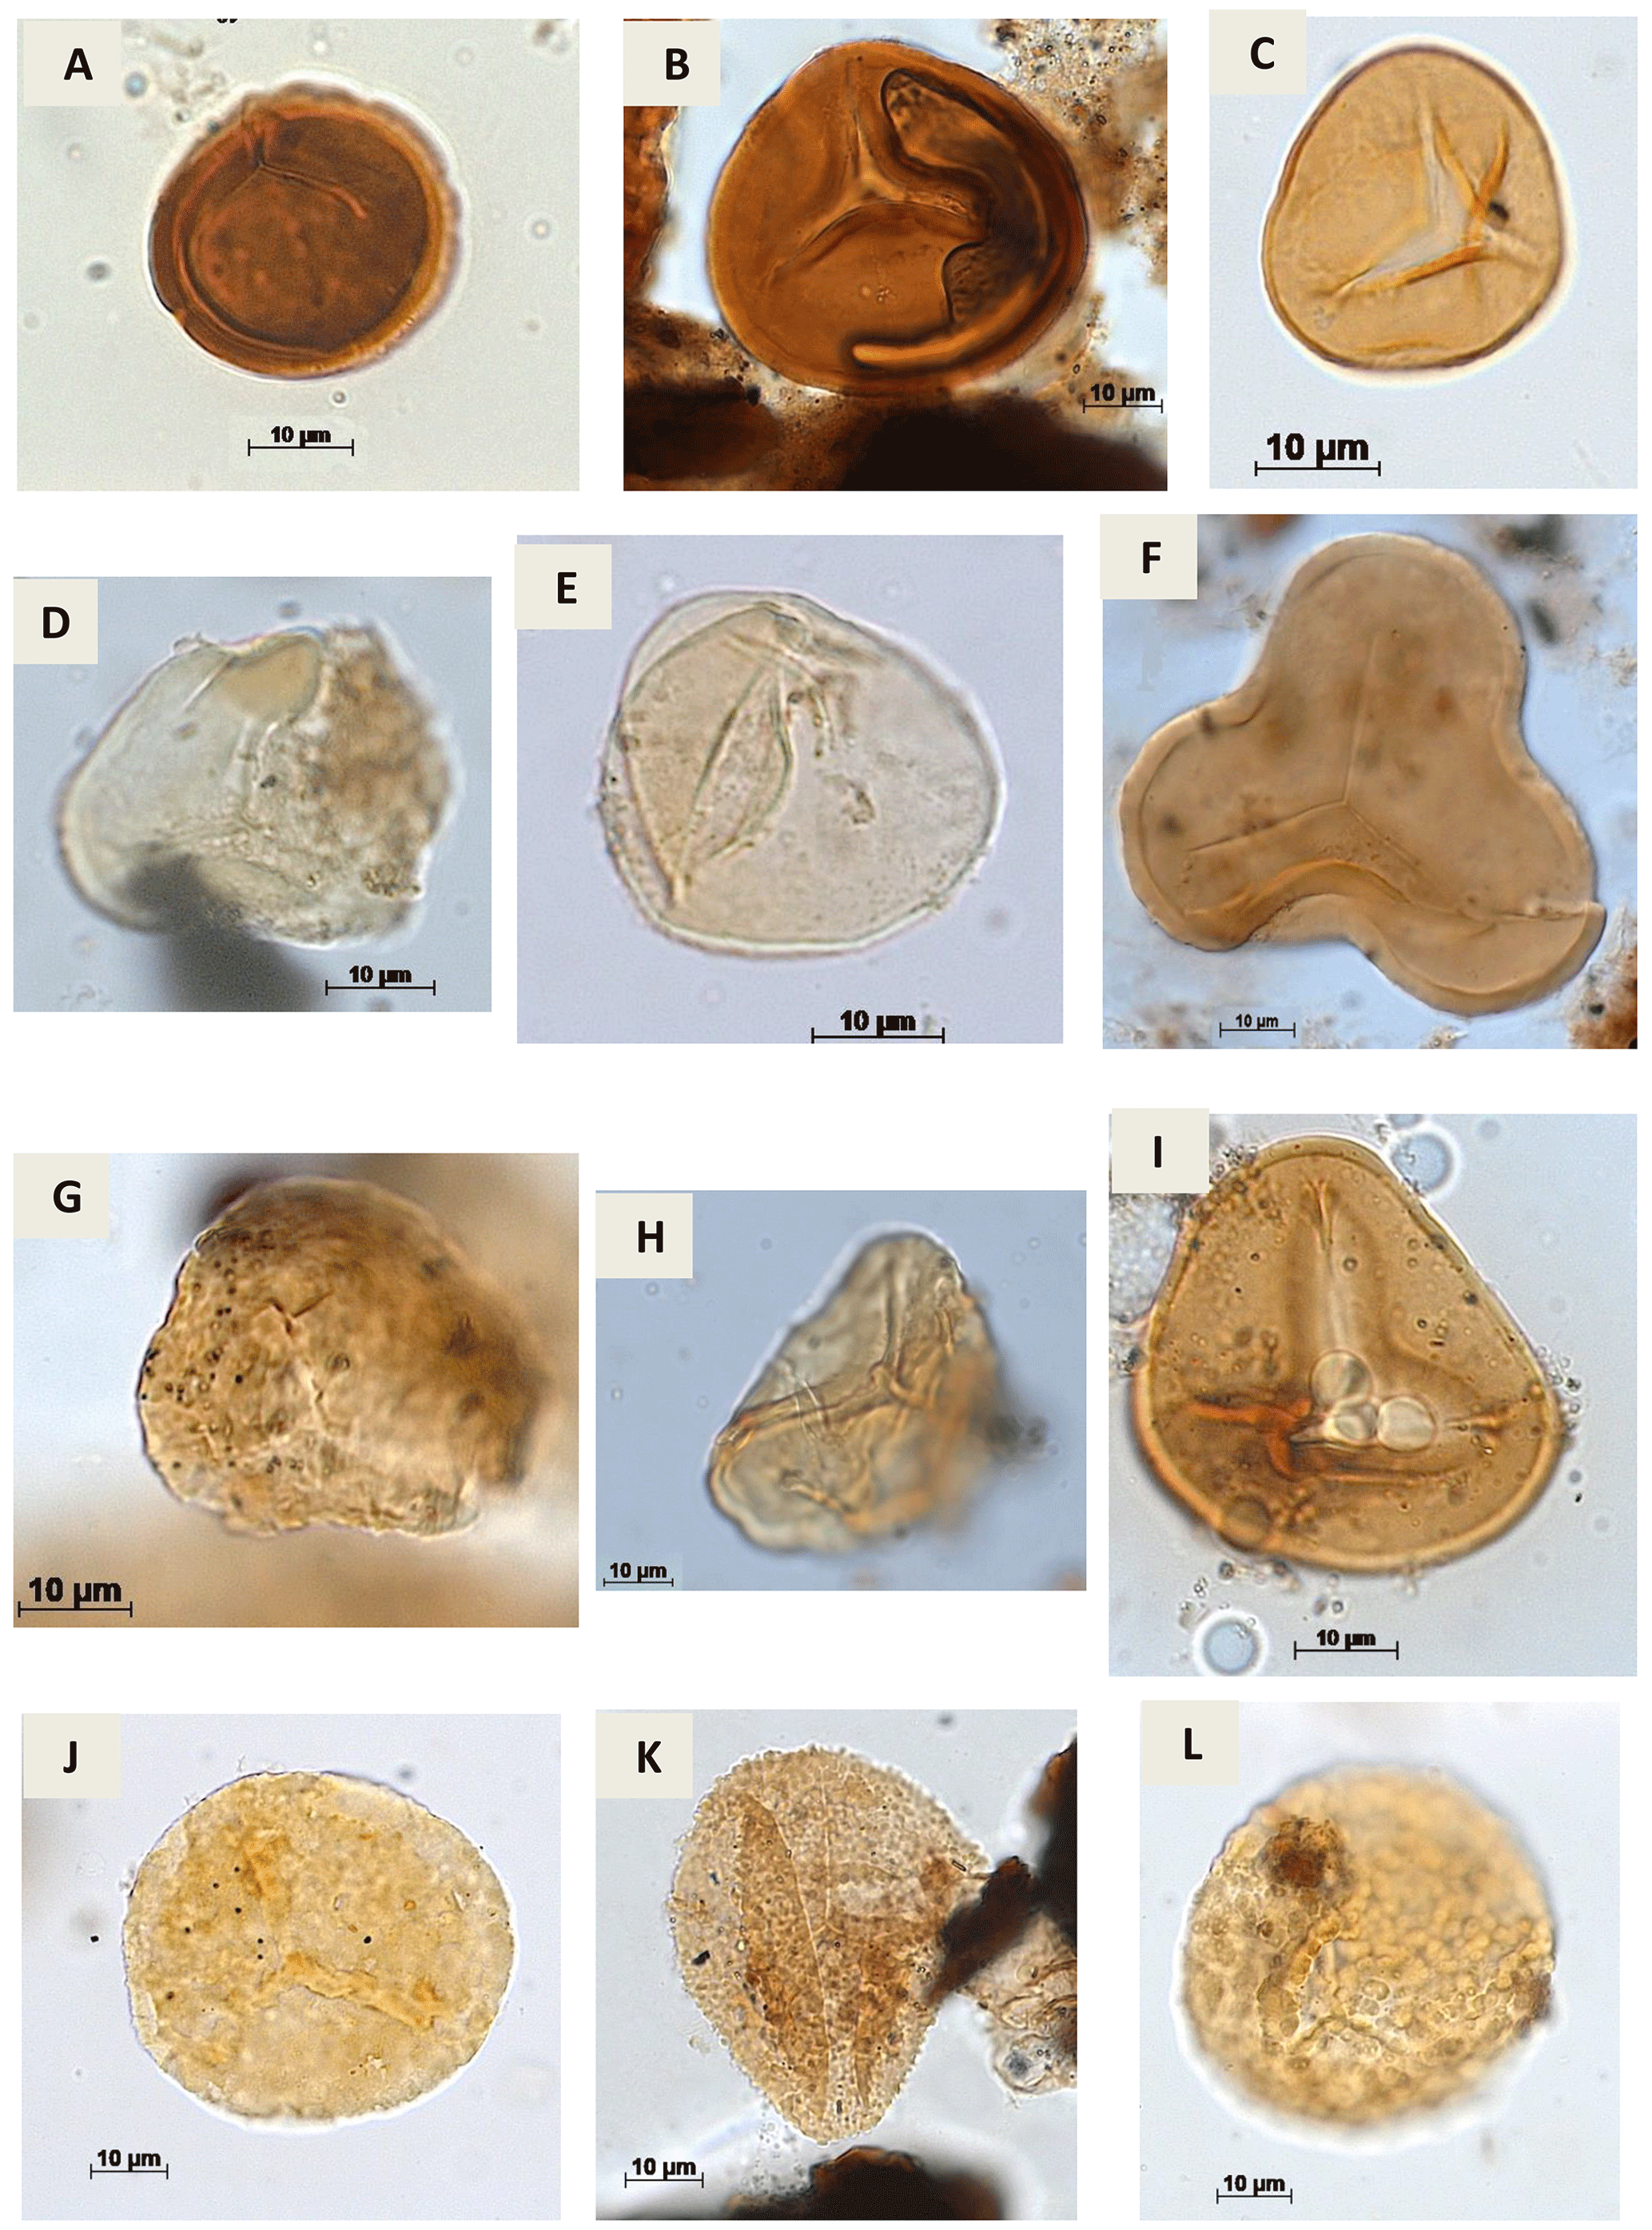
Plate A1(a) Stereisporites sp. Pflug, 1953 (RL-1). (b) Todisporites sp. Couper, 1958 (RL-1). (c) Deltoidospora diaphana Wilson & Webster, 1946 (EGST-1). (d, e). Deltoidospora minor (Couper 1953) Pocock 1970a (CI-1). (f) Cyathidites sp. Couper, 1953 (CI-1). (g) Cyathidites minor Couper, 1953 (CI-1). (h) Biretisporites sp. Delcourt & Sprumont, 1955 emend. Delcourt, Dettmann & Hughes, 1963 (CI-1). (i) Biretisporites pontoniaei Delcourt & Sprumont, 1955 (RL-1). (j) Undulatisporites sp.? Thomson & Pflug, 1953 (CI-1). (k) Granulatosporites sp. Ibrahim, 1933 (CI-1). (l) Verrucosisporites sp. Ibrahim, 1933 emend. Potonié & Kremp, 1955 (CI-1).
Plate 2
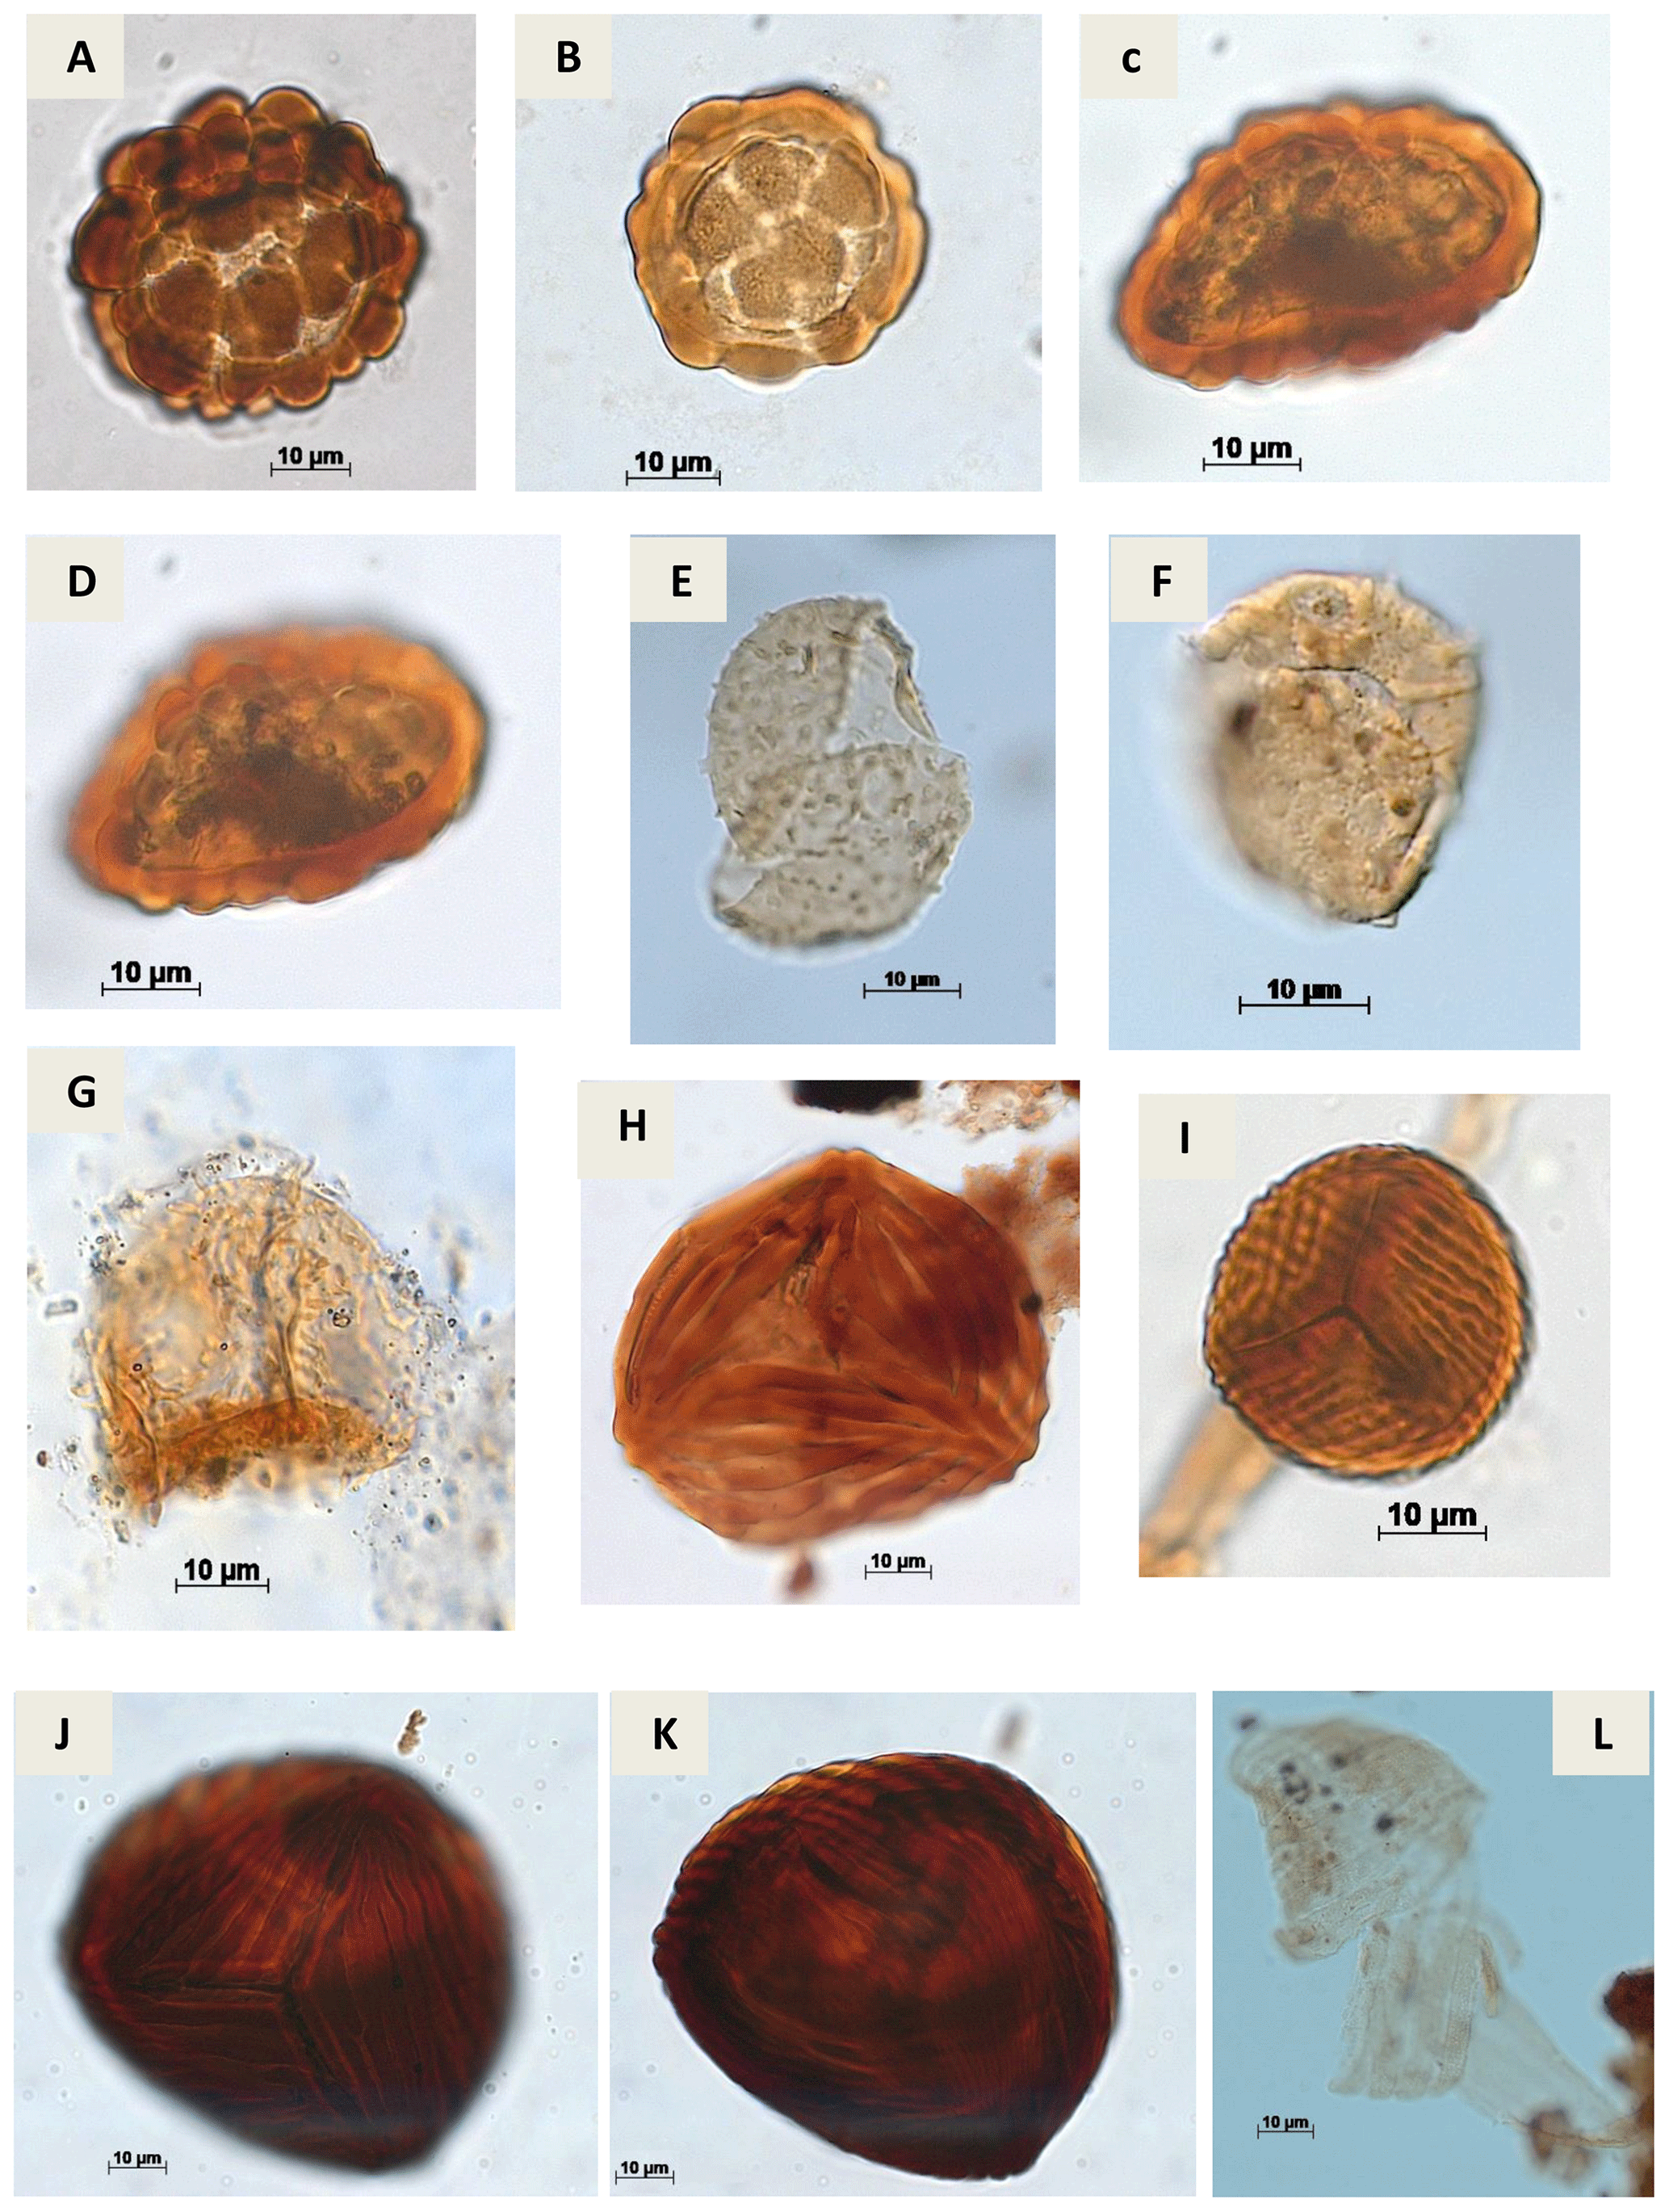
Plate A2(a) Leptolepidites psarosus Norris, 1966 (CI-1). (b) Leptolepidites verrucatus Couper, 1953 (CI-1). (c, d) Uvaesporites sp. Doring, 1965 (CI-1). (e) Apiculatisporis sp. Potonié & Kremp, 1954 (CI-1). (f) Echinatisporis sp. Krtuzsch, 1959 (CI-1). (g) Hamulatisporis sp. Krtuzsch, 1959 (RL-1). (h) Cicatricosisporites sp. Potonié & Gelletch, 1933 (EGST-1). (i) Cicatricosisporites avnimelechi Horowitz, 1970 (CI-1). (j, k) Cicatricosisporites brevilaesuratus Couper, 1958 (EGST-1). (l) Cicatricosisporites cf. Cicatricosisporites? sp. 5 Duarte, 2011 (EGST-1).
Plate 3
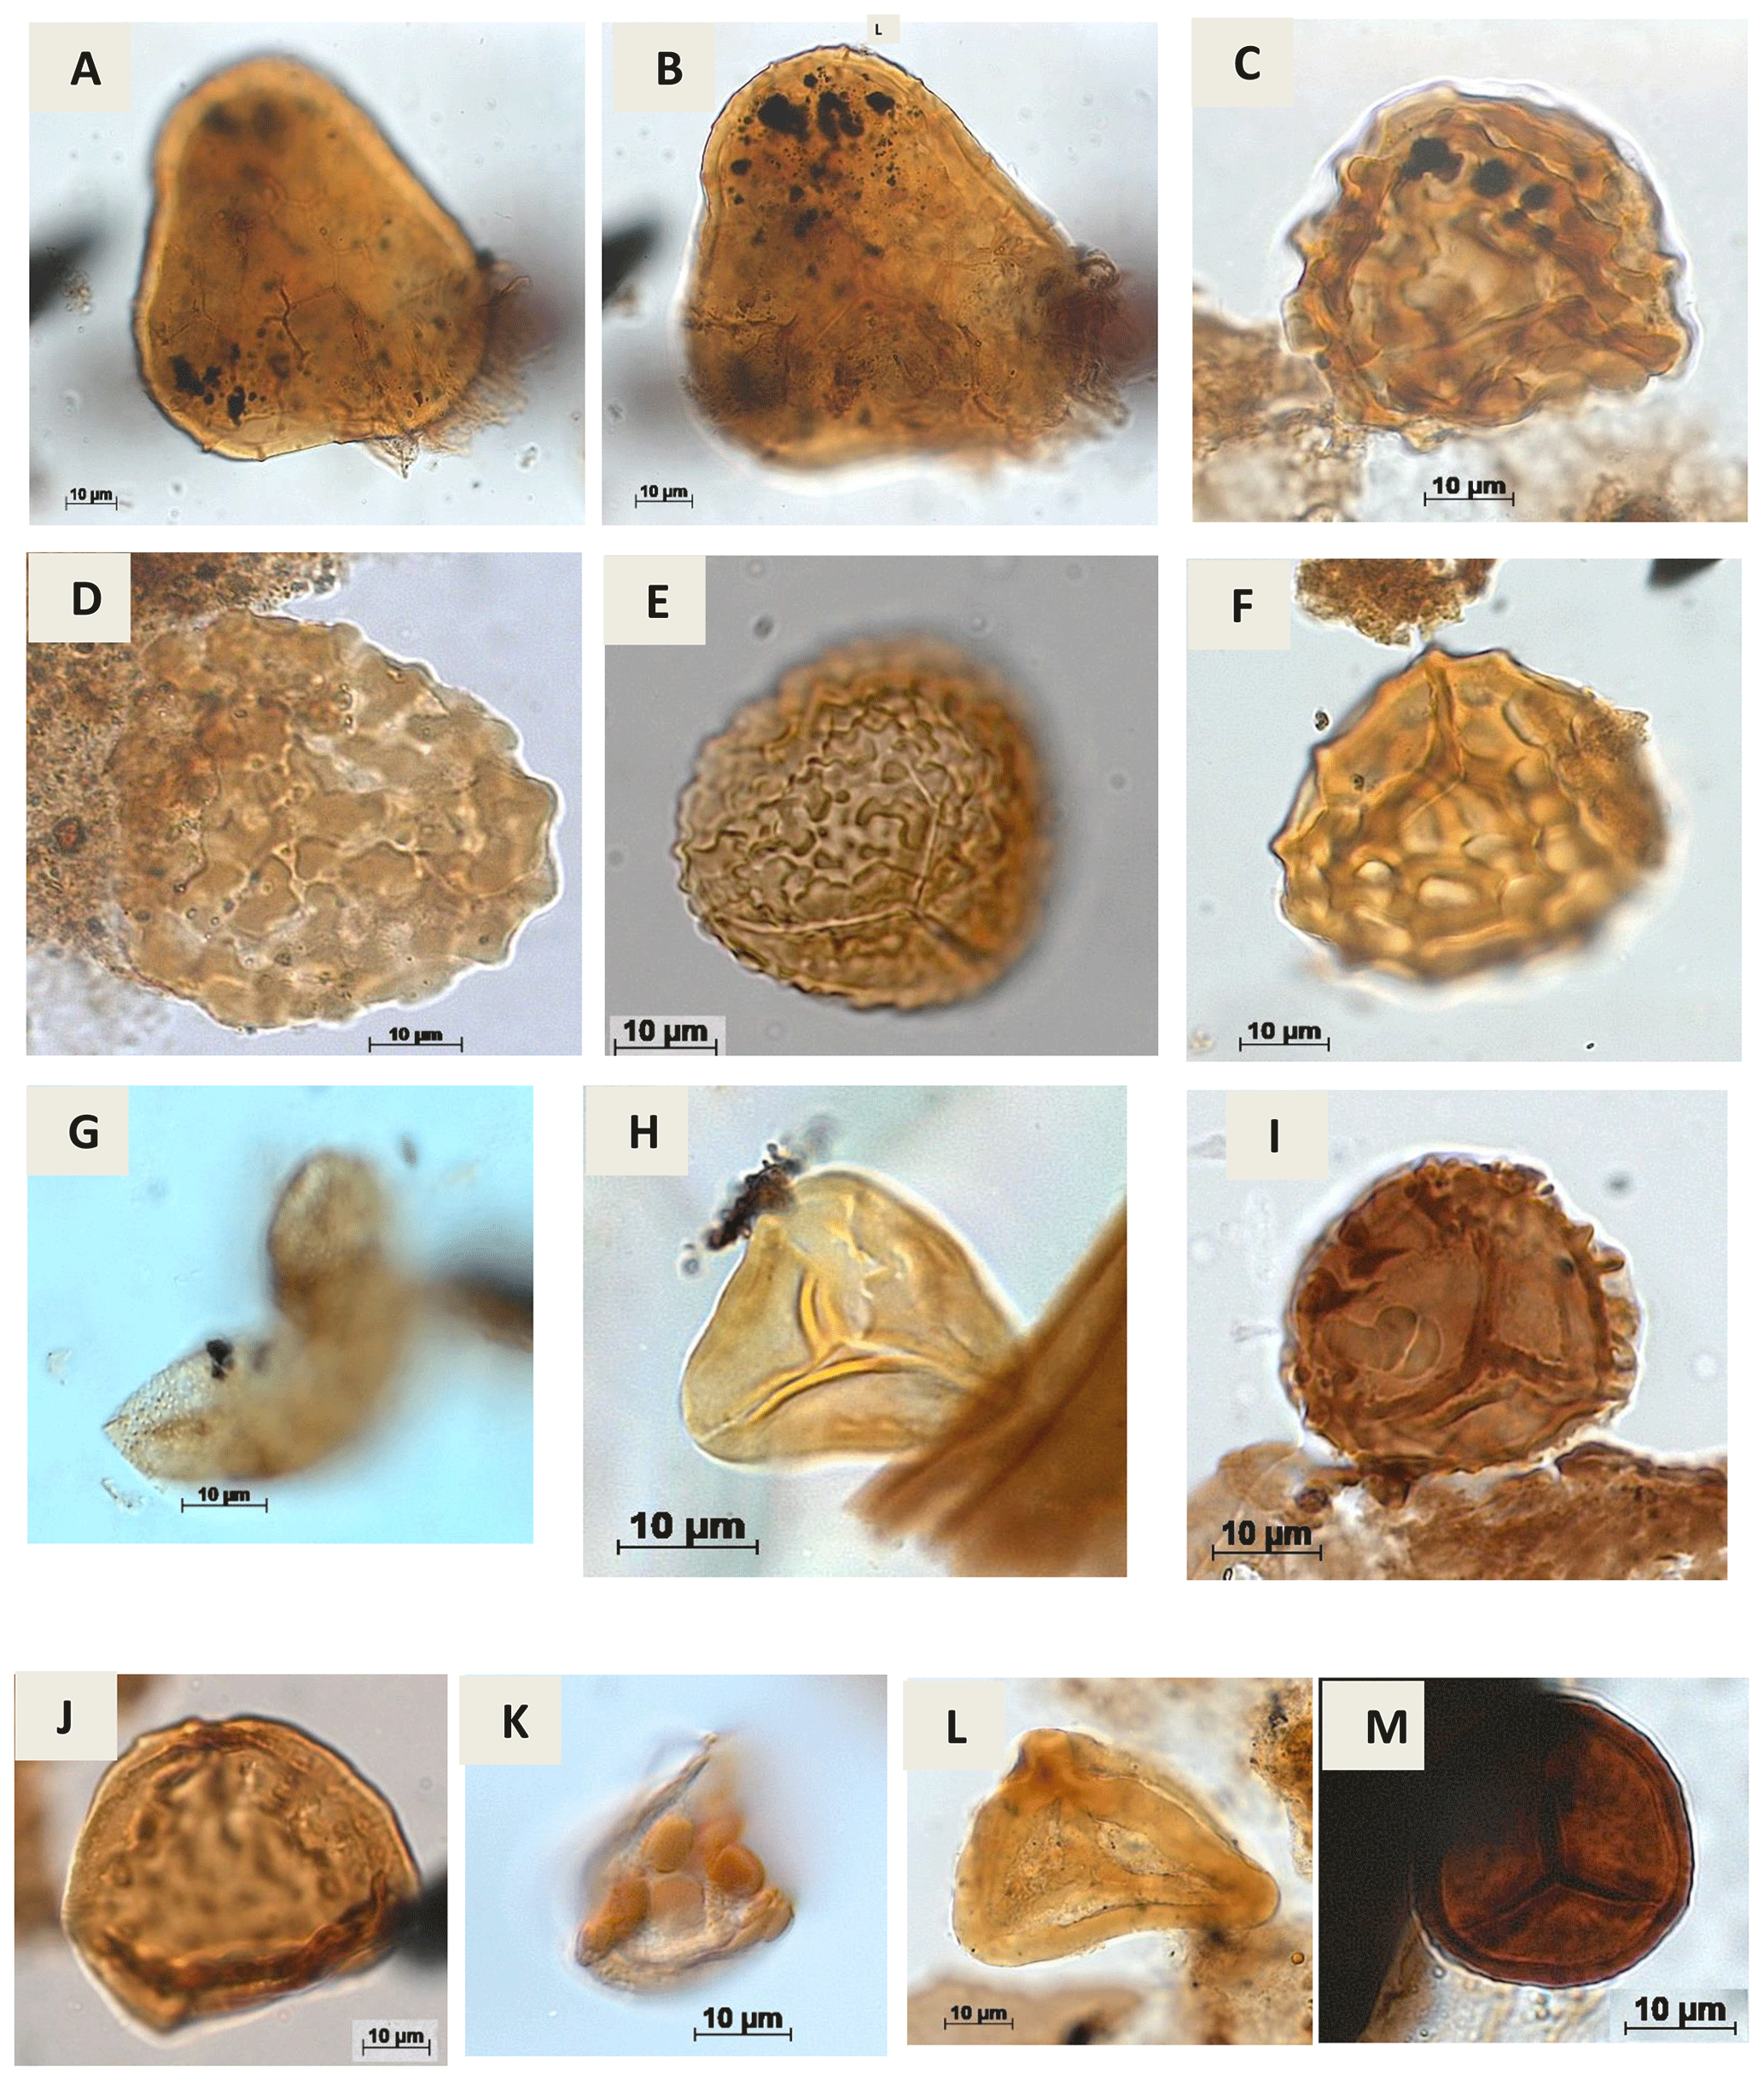
Plate A3(a, b) Lycopodiumsporites sp. Thiegart, 1938 (RL-1). (c) Klukisporites variegatus Couper, 1958 (CI-1). (d) Klukisporites sp. Couper, 1958 (RL-1). (e) Klukisporites foveolatus Pocock, 1964 (EGST-1). (f) Klukisporites pseudoreticulatus Couper, 1958 (CI-1). (g) Foveotriletessp. Hammen, 1956 (CI-1). (h) Gleicheniidites senonicus Ross, 1949 (PR-1). (i) Camarozonaesporites sp. Pant, 1954 ex. Potonié, 1956 emend. Klaus, 1960 (VN-1). (j) Antulsporites sp. Archangelsky & Gamerro, 1966 (CI-1). (k) Cingulatisporites verrucatus Regali, Uesugui & Santos, 1974 (PE-1) (l) Distaltriangulisporites sp. Singh, 1971 (RL-1). (m) Cingutriletes sp. Pierce, 196 (PR-1).
Plate 4
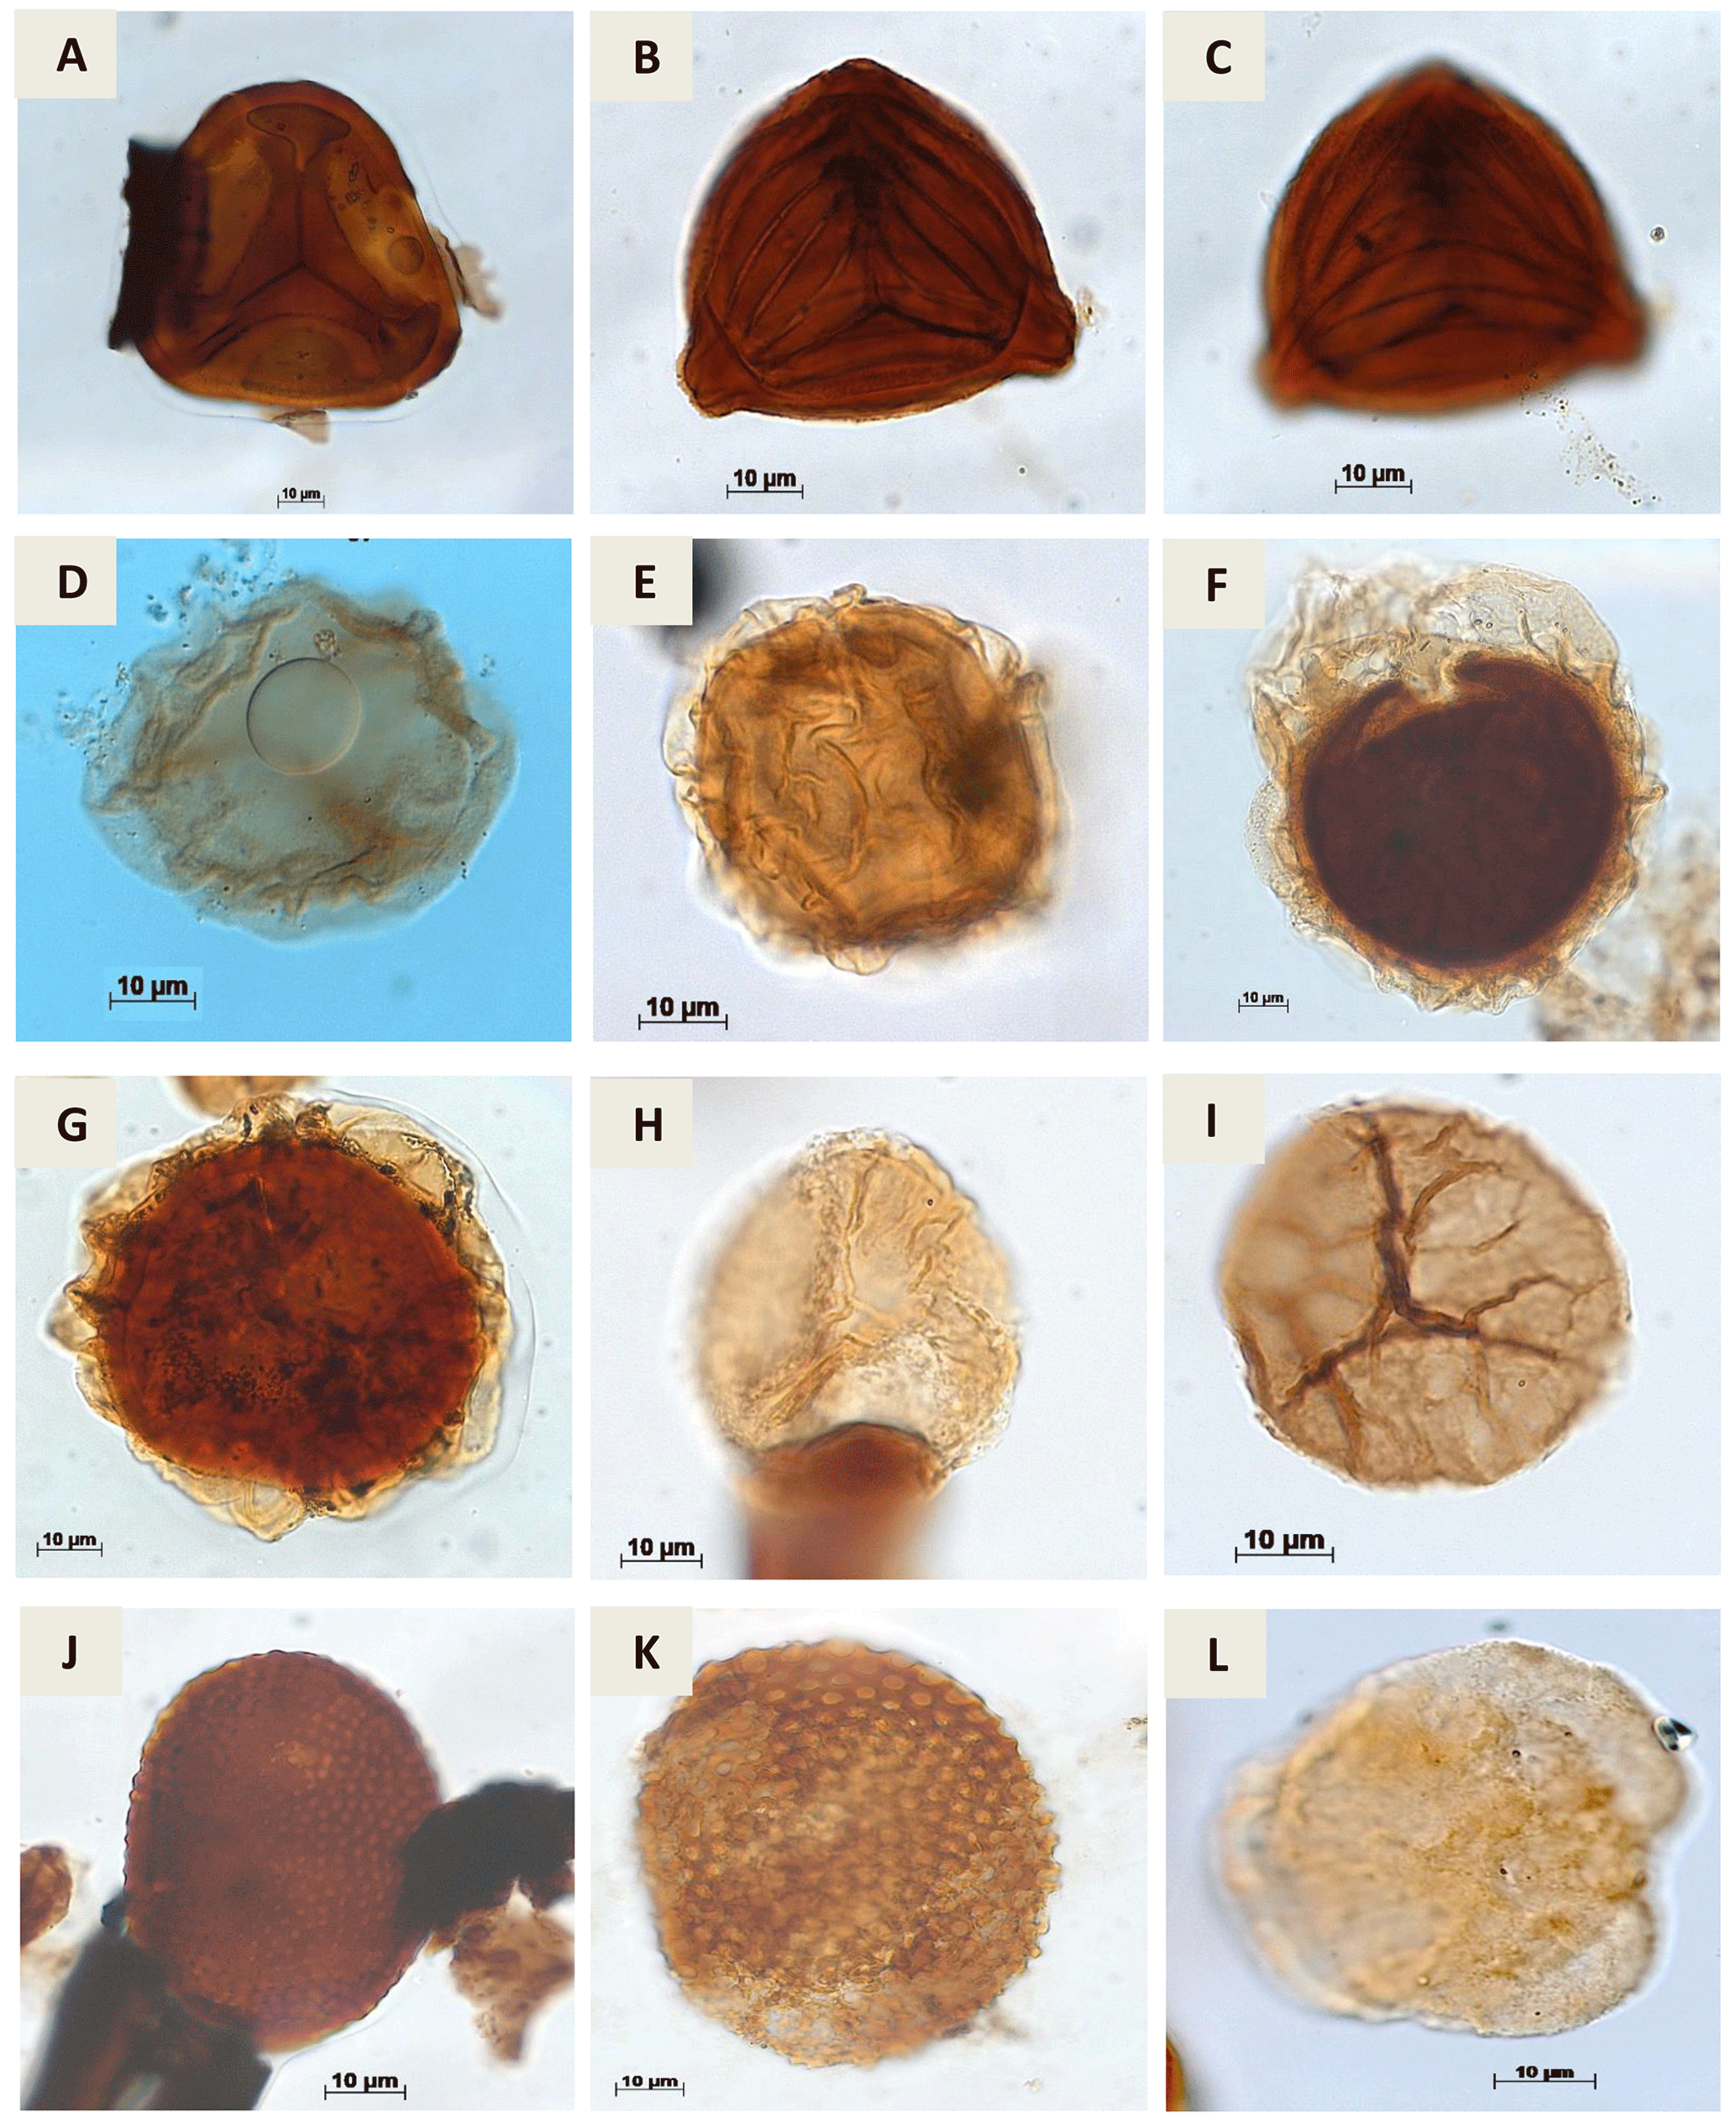
Plate A4(a) Matonisporites silvai Lima, 1978 (PR-1). (b, c) Appendicisporites sp. Weiland & Krieger, 1953; (PR-1). (d) Aequitriradites sp.Delcourt & Sprumont, 1955 emend. Dettmann, 1963 (RL-1). (e) Perotrilites sp. Erdtman, 1947 ex. Couper, 1953 (RL-1). (f) Crybelosporites pannuceus Brenner,1963 emend. Srivastava, 1975 (RL-1) (g) Paludites mameolatus Lima, 1978 (PR-1). (h) Densoisporites sp. Weyland & Krieger, 1953 (EGST-1). (i) Triporoletes sp. Mtchedlishvili, 1960 (RL-1). (j) Reticulosporis sp. Krutzsch, 1959 (PR-1). (k) Reticulosporis foveolatus Krutzsch, 1959 (EGST-1). (l) Callialasporites trilobatus Dev, 1961 (CI-1).
Plate 5
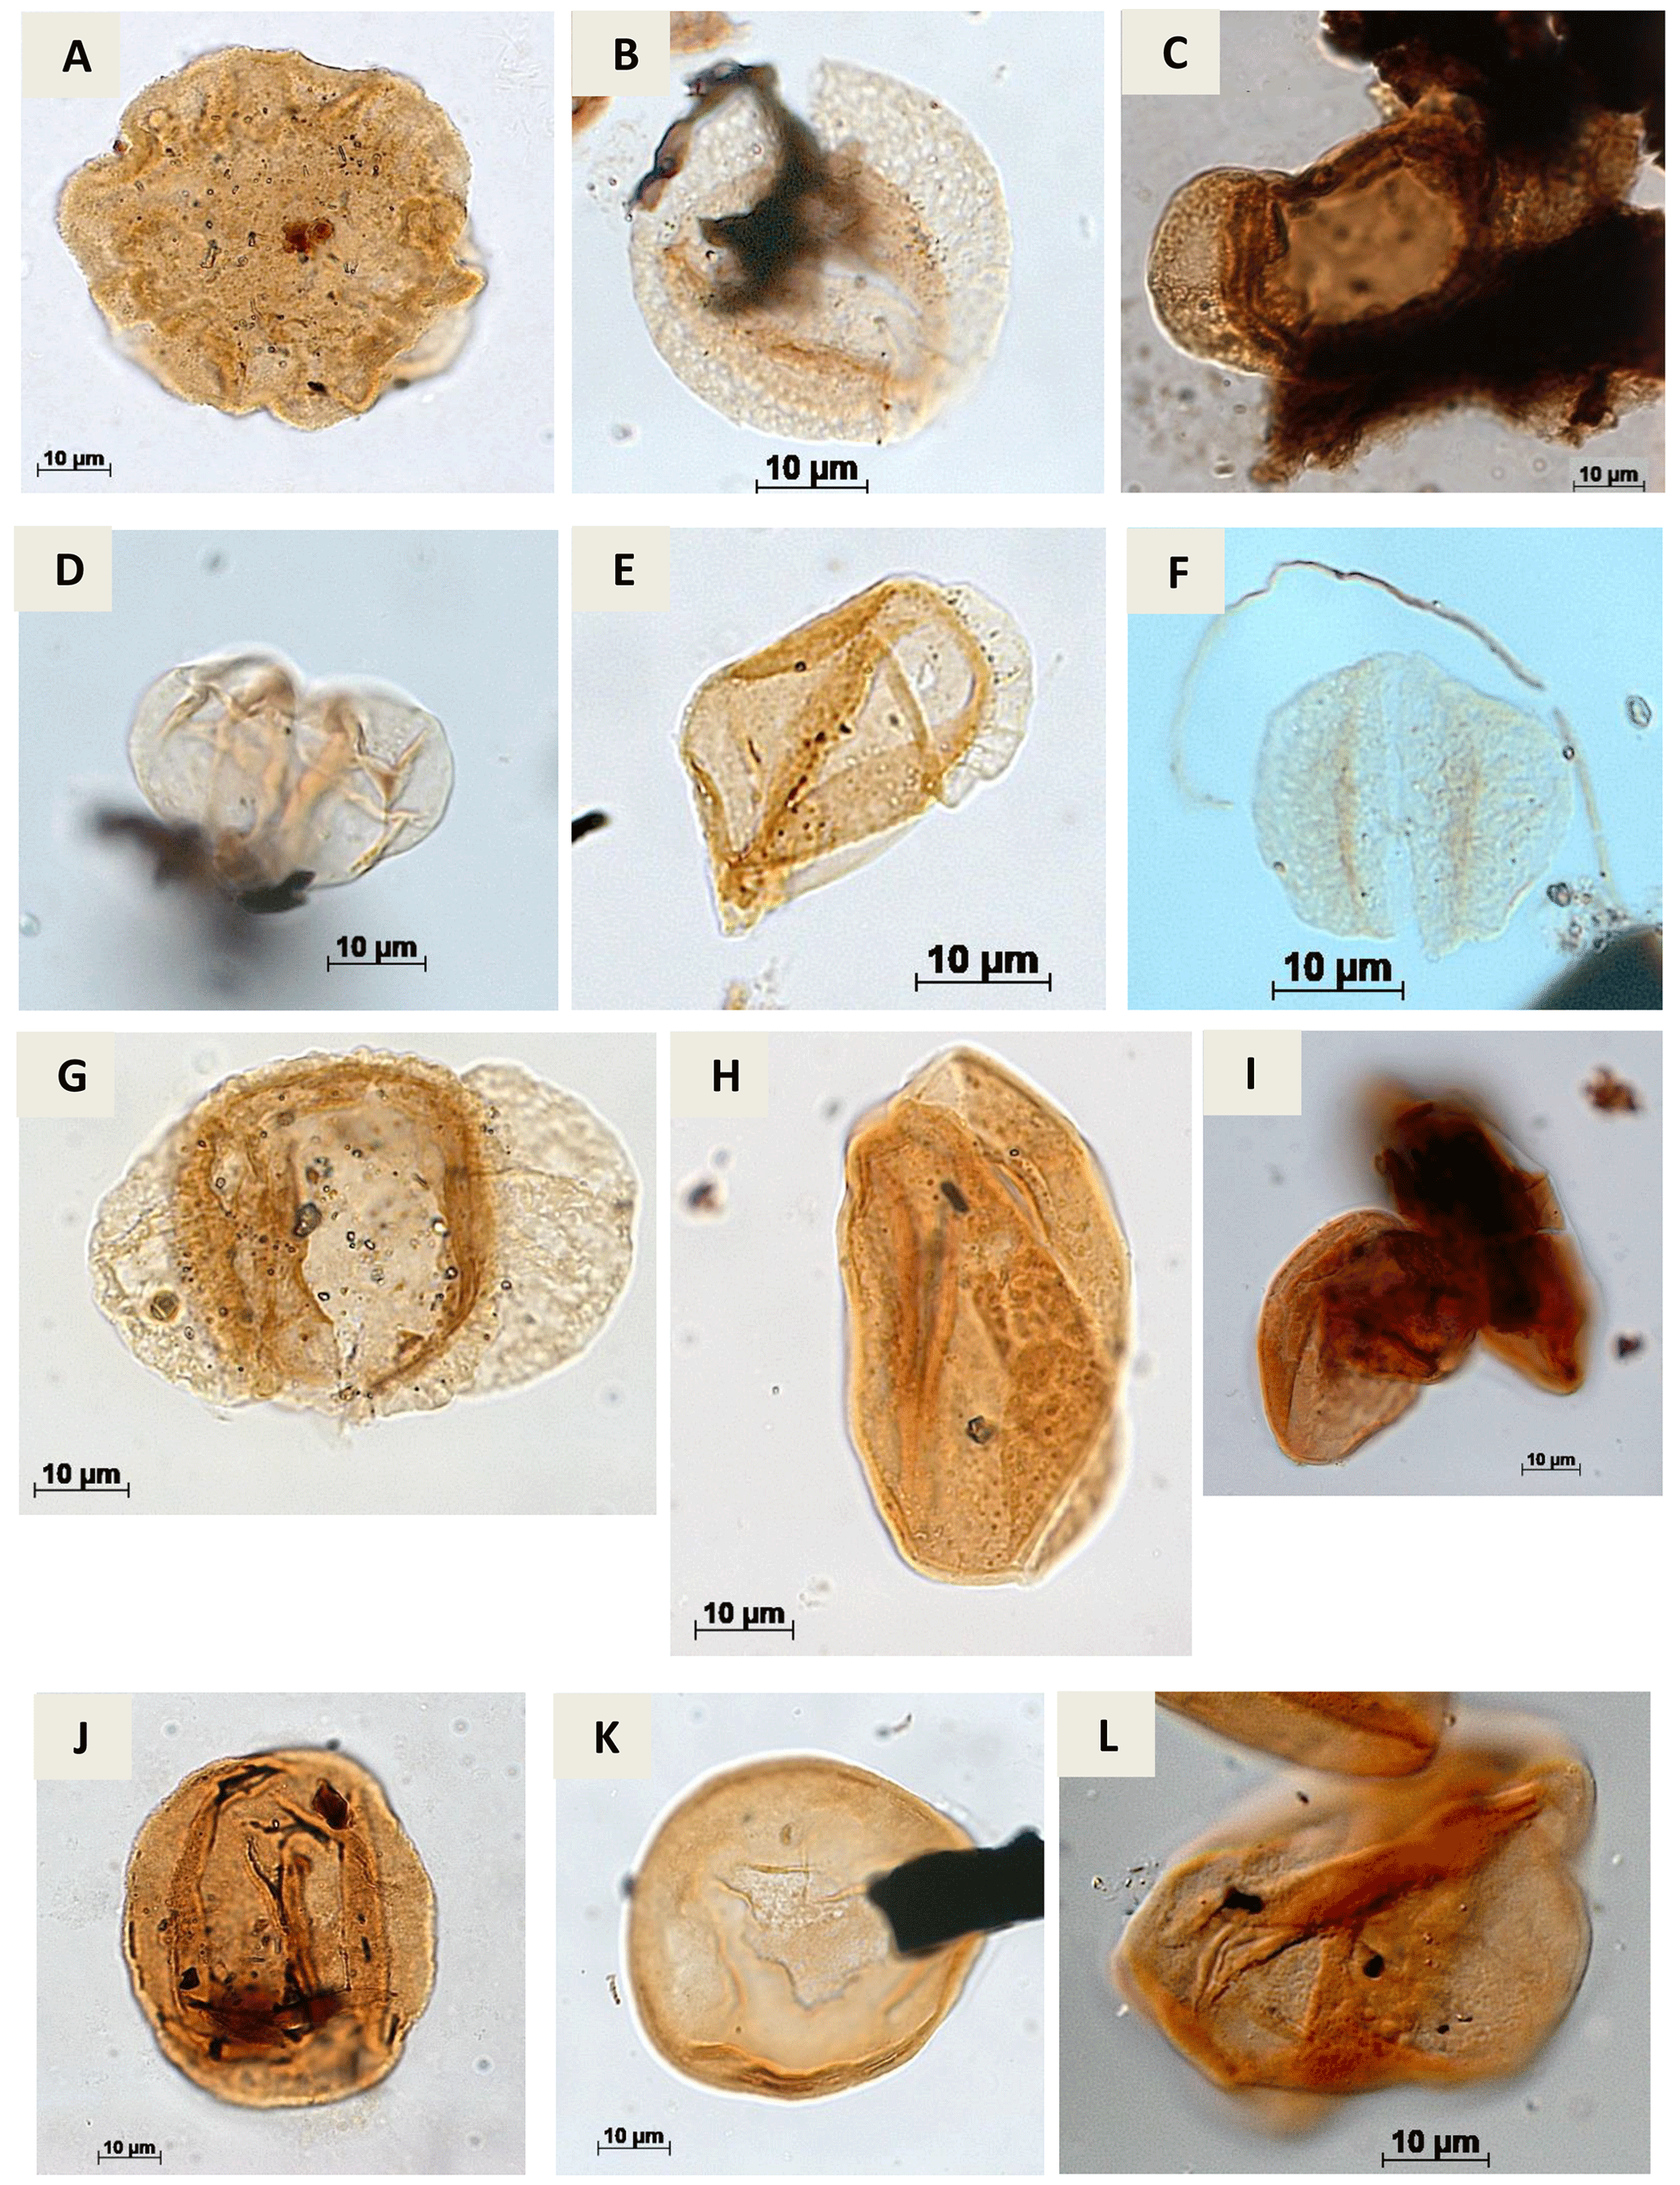
Plate A5(a) Callialasporites dampieri Dev, 1961 (CI-1). (b) Complicatisaccus cearensis Regali, 1989c (PR-1). (c) Cedripites sp. Wodehouse, 1933 (CI-1). (d) Vitreisporites pustulosus Regali, 1987 (PR-001-MA); (PE-1). (e) Vitreisporites microsaccus Jersey, 1964 (PR-1). (f) Vitreisporites pallidus Nilsson, 1958 (PR-1). (g) Rugubivesiculites bahiasulensis Pierce, 1961 (RL-1). (h) Inaperturopollenites sp. (Pflug, 1952 ex. Thomson e Pflug, 1953, Potonié, 1958) Potonié, 1966 (RL-1). (i) Araucariacites sp. Cookson, 1947 ex Couper, 1953 (CI-1). (j) Araucariacites australis Cookson, 1947 (CI-1). (k) Araucariacites limbatus (Balme) Habib, 1957 (EGST-1). (l) Araucariacites pergranulatus Volkheimer, 1968 (EGST-1).
Plate 6
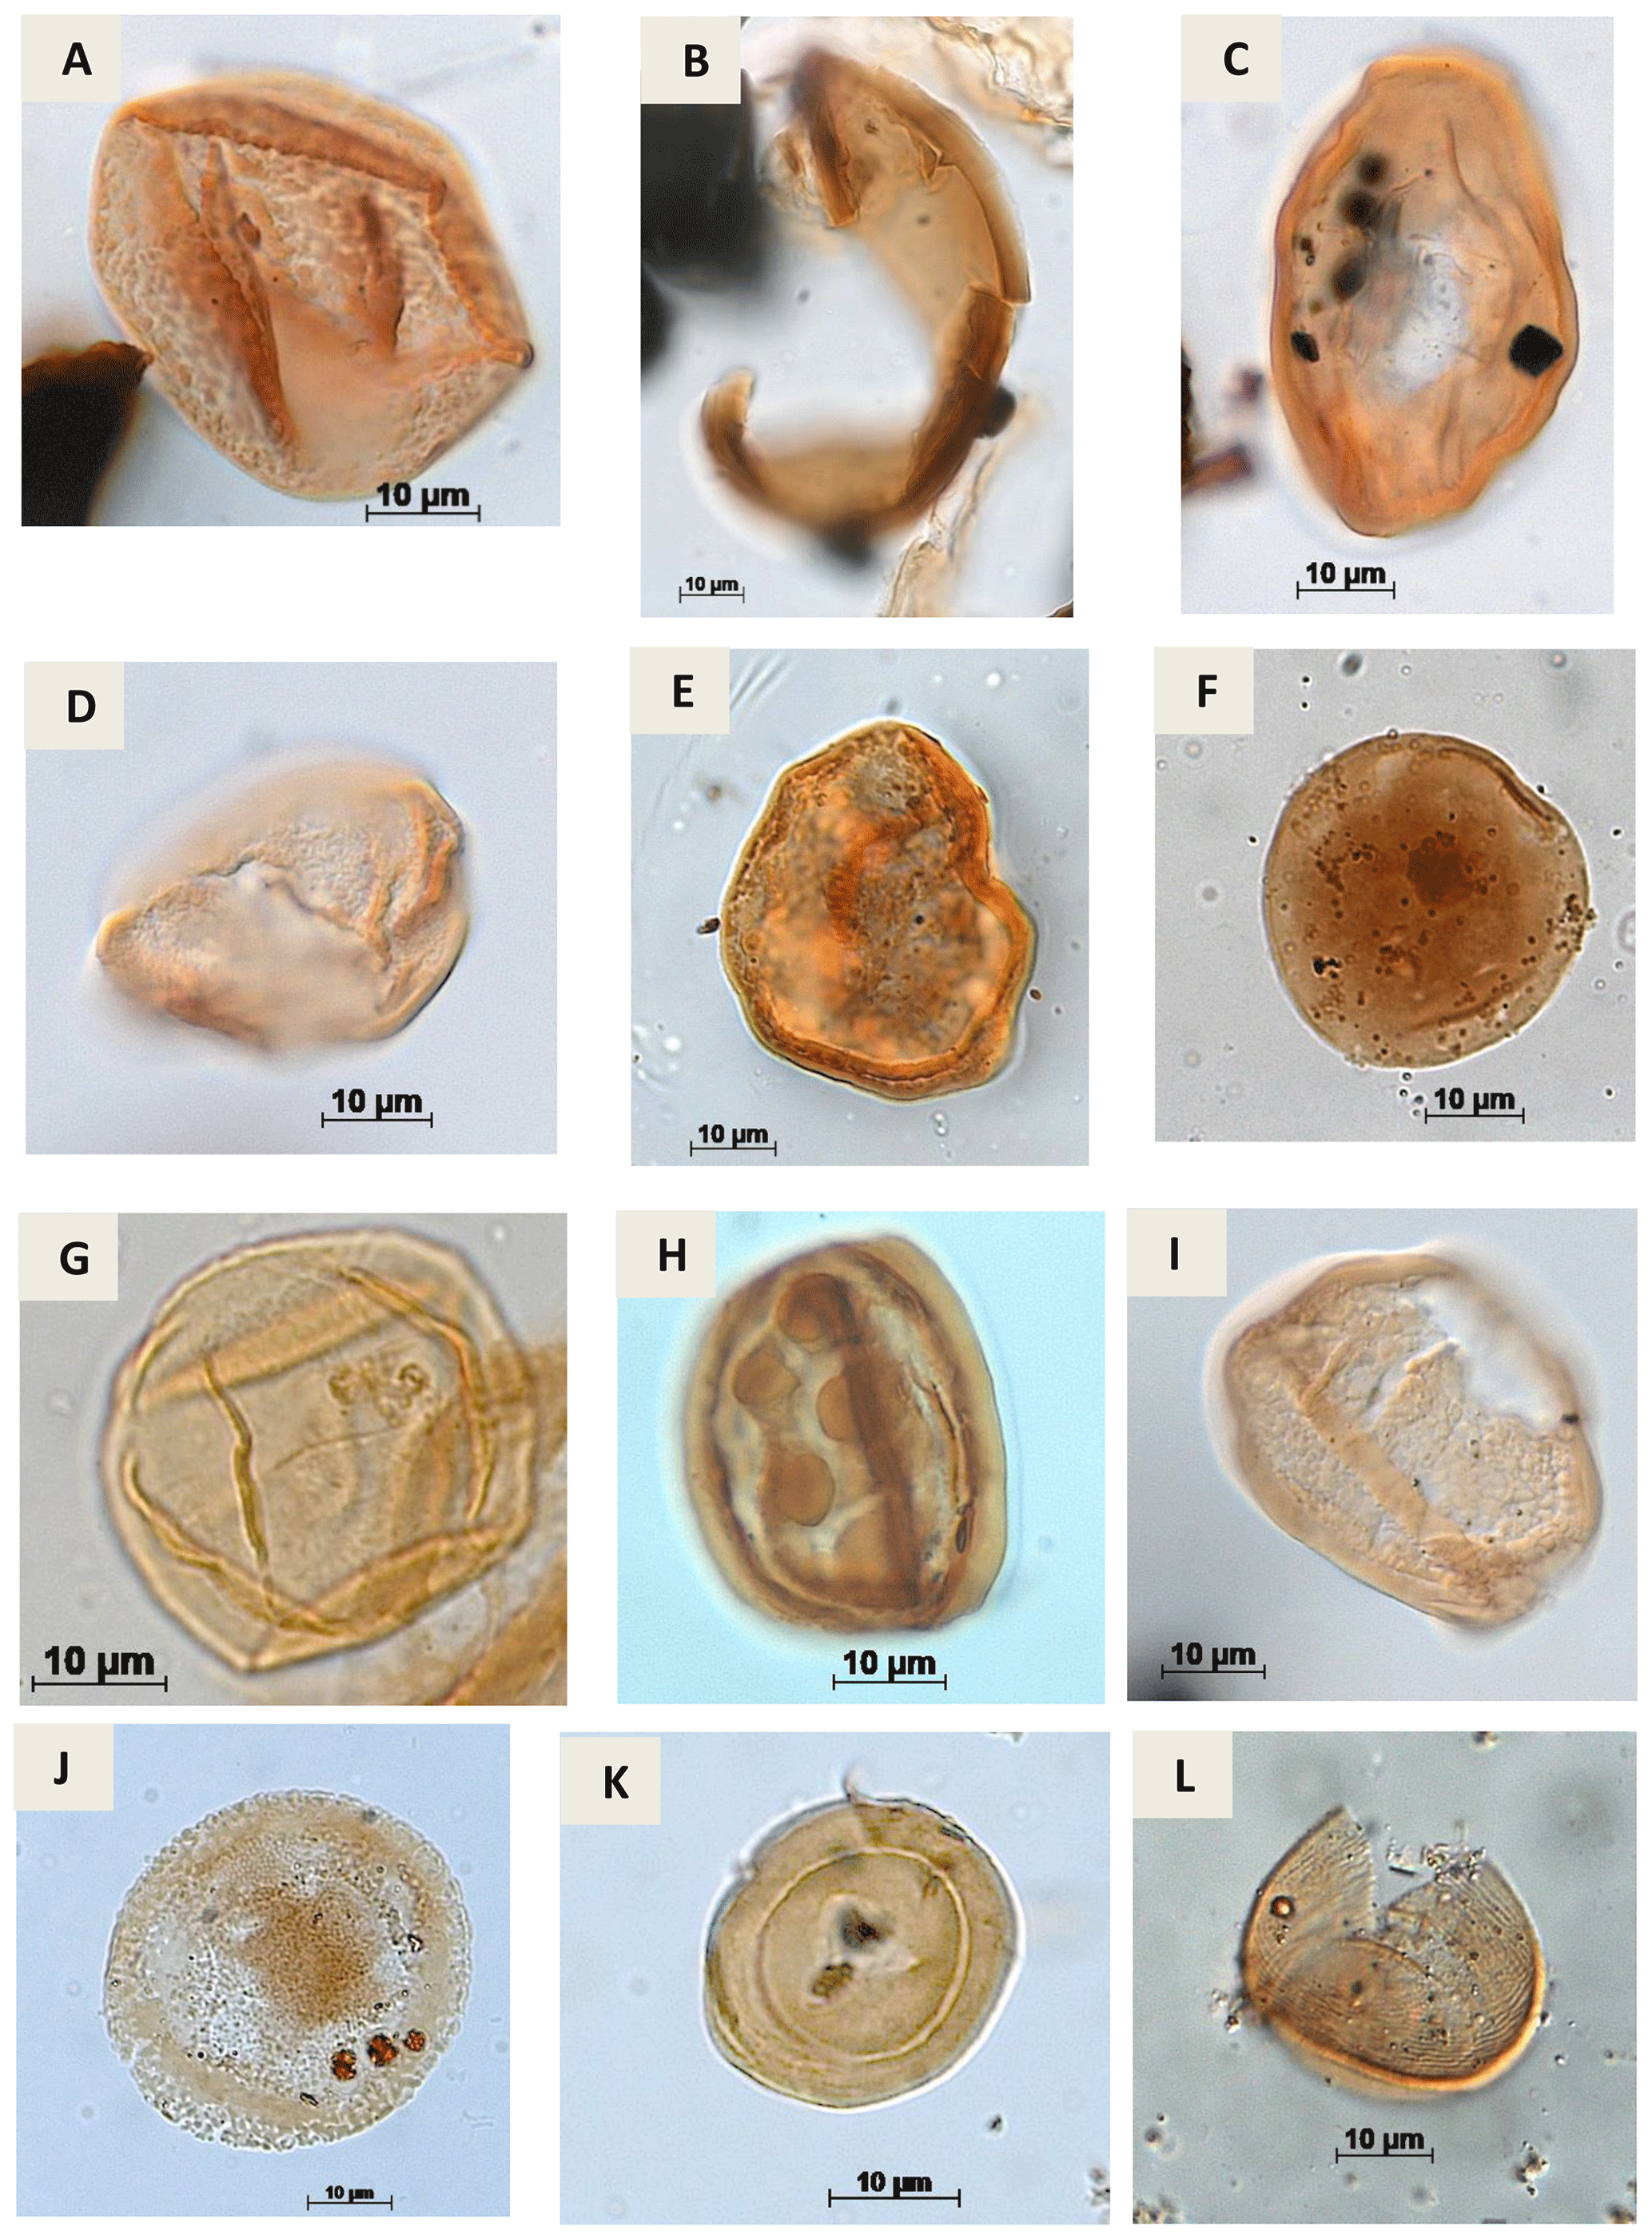
Plate A6(a) Araucariacites sp. S. CI. 265 A Jardiné & Magloire, 1965 (EGST-1). (b) Balmeiopsis sp.? Archangelsky, 1977 (PE-1). (c) Balmeiopsis limbatus Archangelsky, 1977 (EGST-1). (d) Cingulatipollenites sp.? Saad & Ghazaly, 1976 (PE-1). (e) Cingulatipollenites aegyptiaca Saad & Ghazaly, 1976 (EGST-1) (f) Spheripollenites sp. Couper, 1958 (RL-1). (g) Spheripollenites scabratus Couper, 1958 (EGST-1). (h) Sergipea variverrucata Regali, Uesugui & Santos, 1974 emend. Regali, 1987 (PR-1). (i) Sergipea simplex Regali, 1987 (PE-1). (j) Uesuguipollenites callosus Dino, 1992 (RL-1). (k) Classopollis classoides Pflug, 1953 (CI-1). (l) Classopollis brasiliensis Herngreen, 1973 (PE-1).
Plate 7
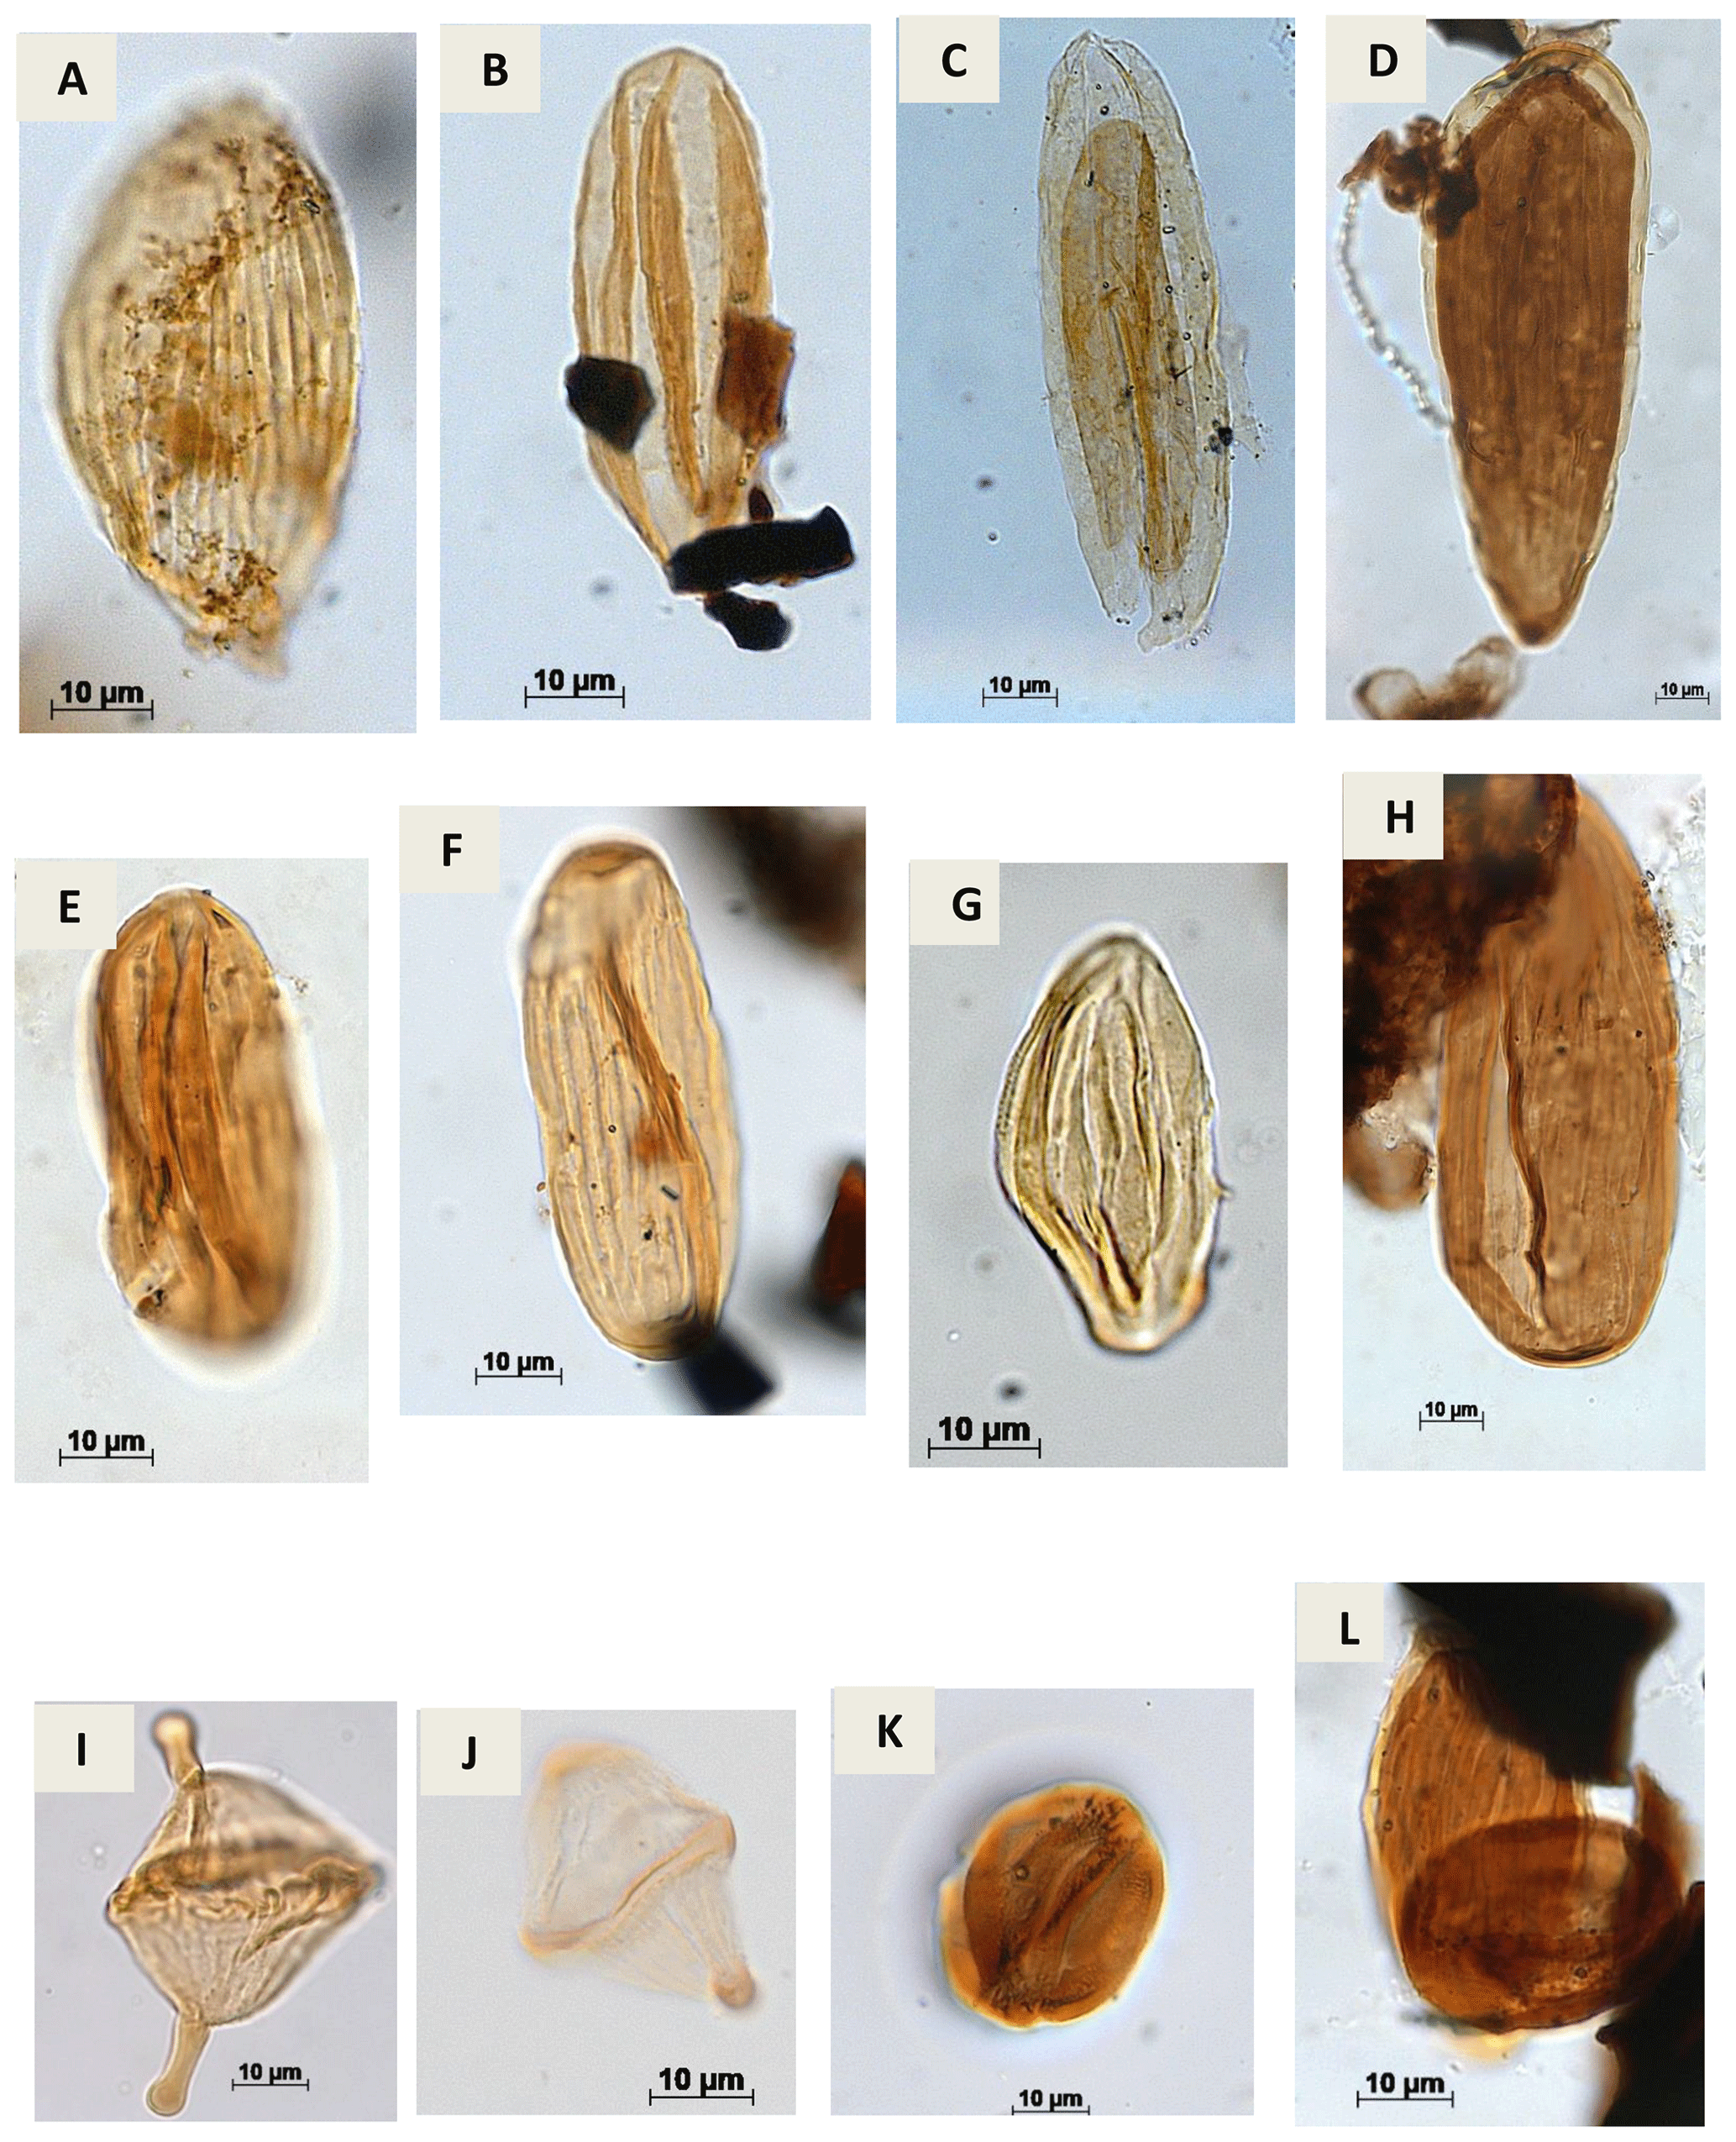
Plate A7(a) Equisetosporites aff. elegans Lima, 1978 (CI-1). (b) Equisetosporites dudarensis (Deák, 1964) Lima, 1980 (CI-1). (c) Equisetosporites ambuguus Hedlund, 1966 (RL-1). (d) Equisetosporites consinnus Singh, 1964 (PR-1). (e) Equisetosporites leptomatus Lima, 1978 (CI-1). (f) Equisetosporites luridus Lima, 1978 (CI-1). (g) Equisetosporites lanceolatus Lima, 1978 (CI-1). (h) Equisetosporites aff. leptomatus Lima, 1978 (CI-1). (i) Elateropollenites bicornis Regali, 1989e (EGST-1). (j) Elateropollenites dissimilis Regali, 1989e (EGST-1). (k) Classopollis intrareticulatus Volkheimer, 1972 (PR-1). (l) Equisetosporites aff. luridus Lima, 1978 (RL-1).
Plate 8
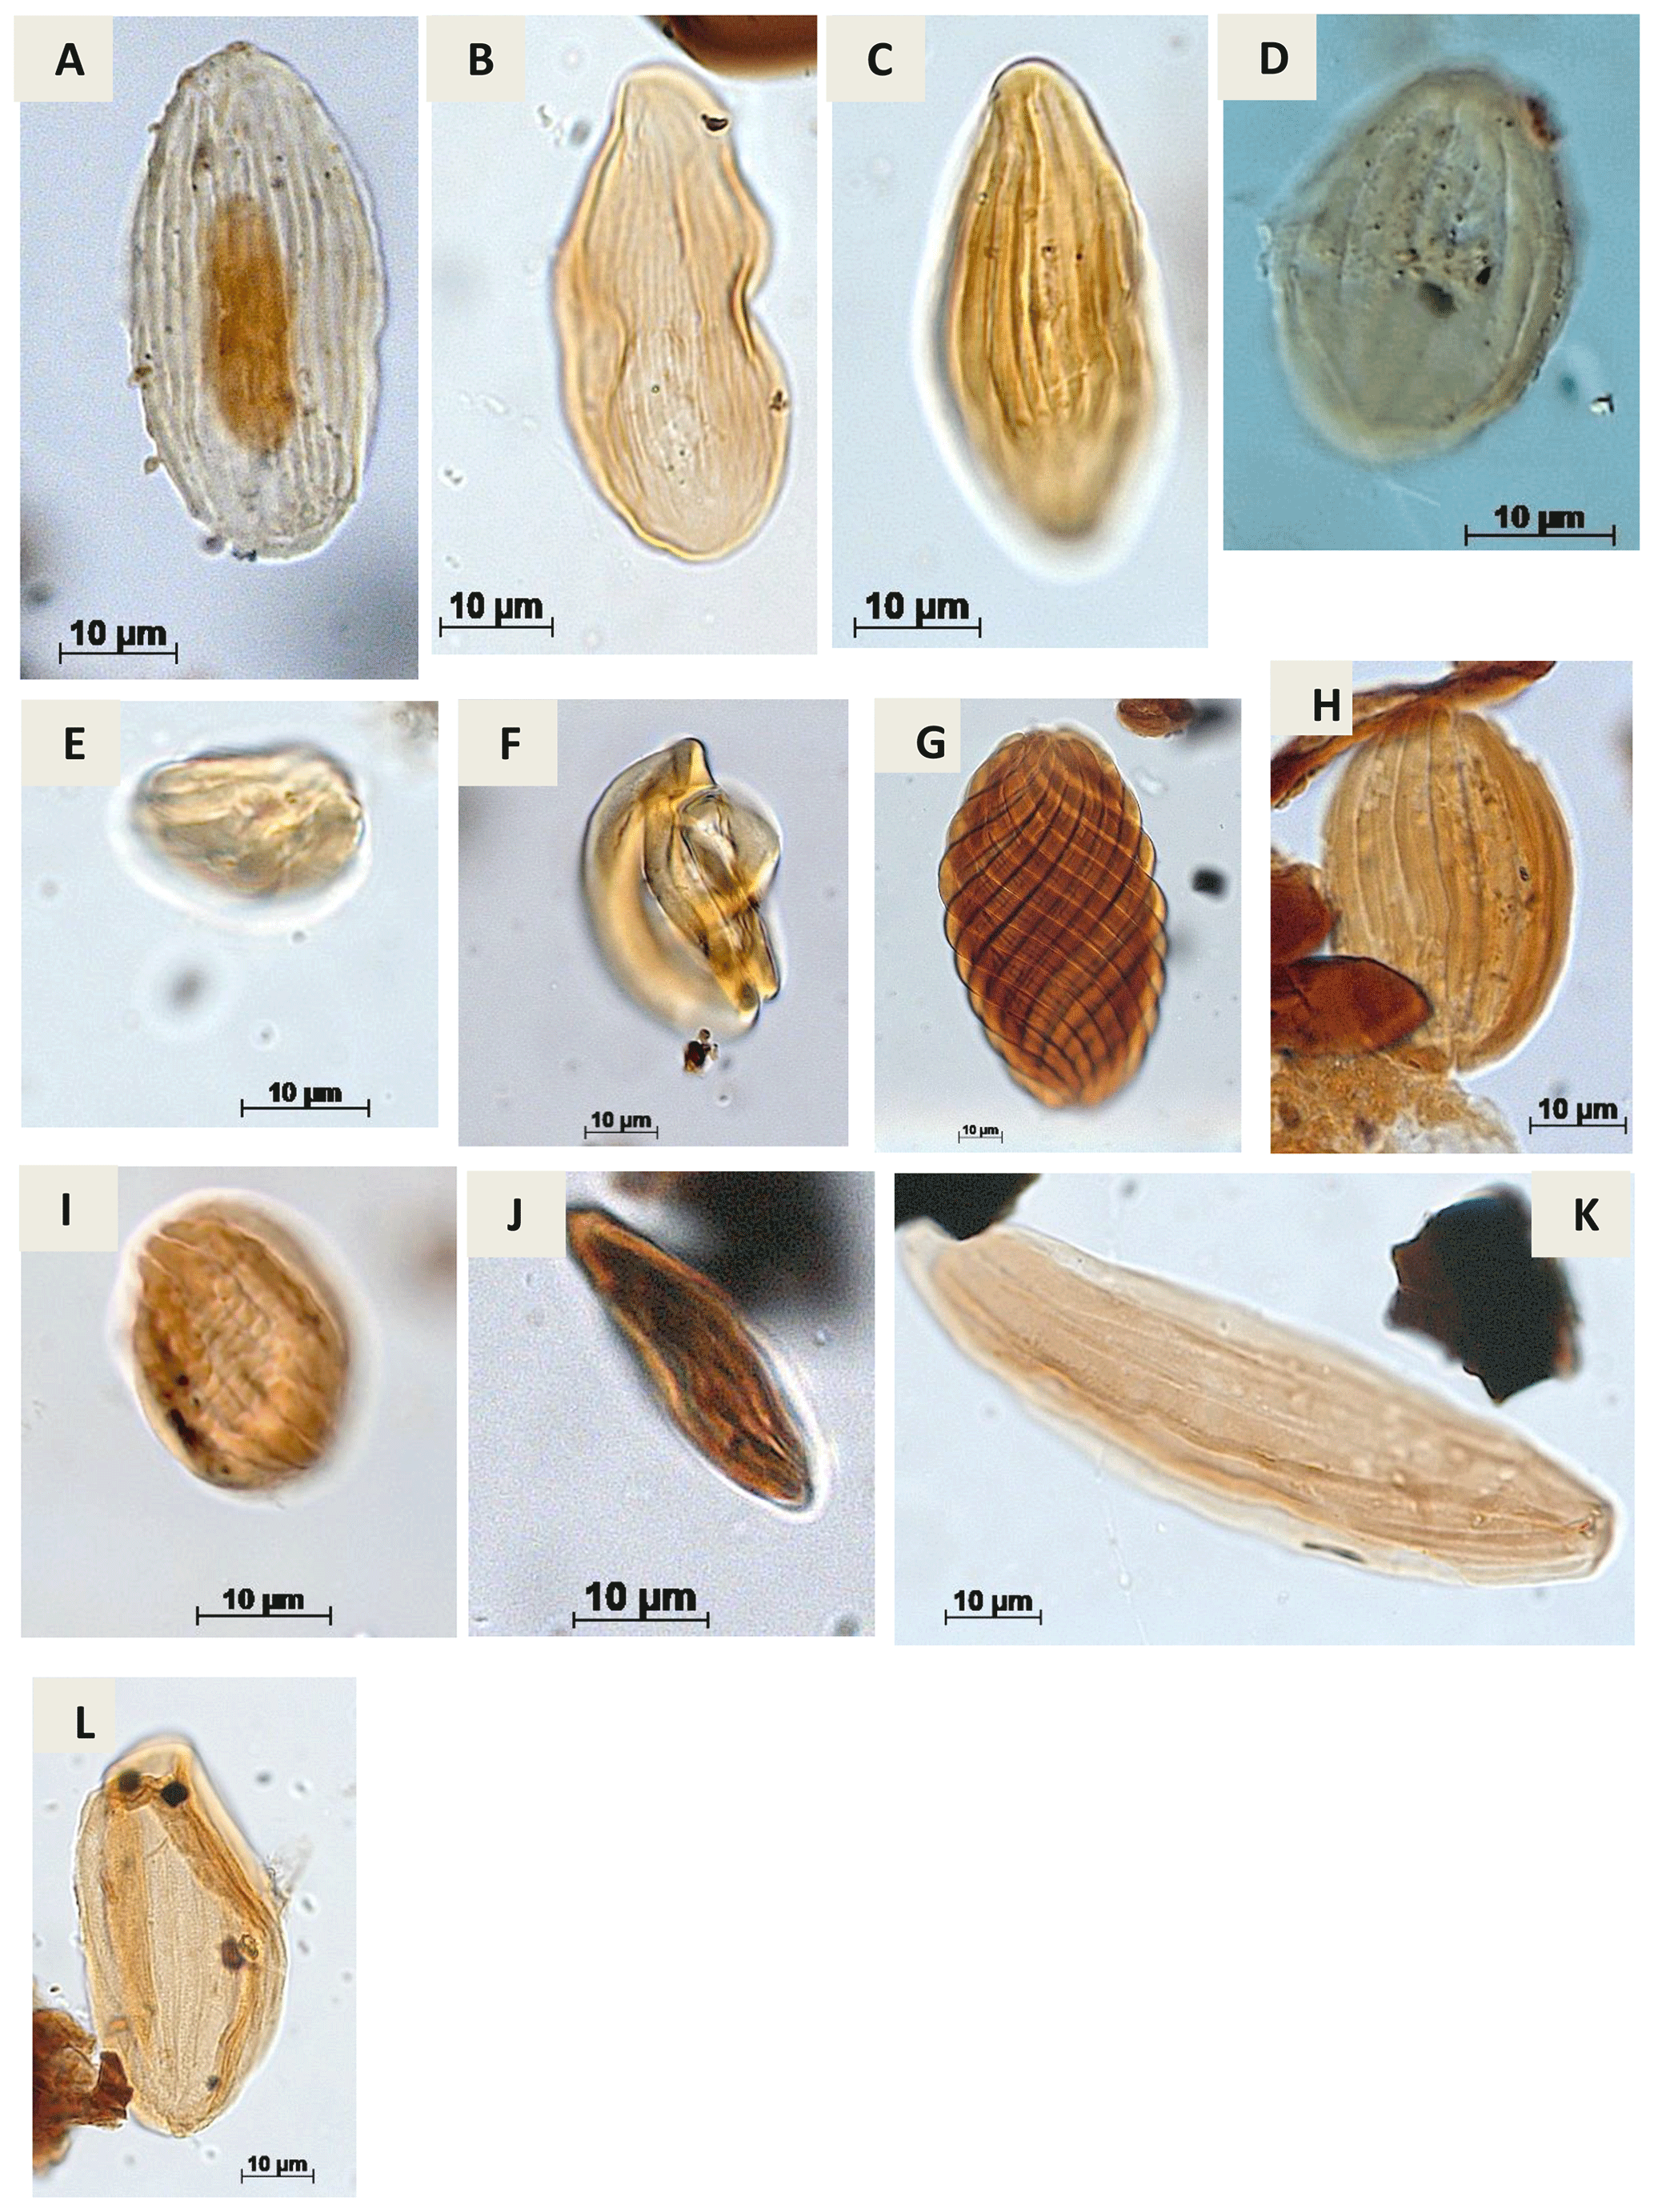
Plate A8(a) Equisetosporites maculosus Dino, 1992 (CI-1). (b) Equisetosporites minuticostatus Lima, 1978 (PR-1). (c) Equisetosporites aff. minuticostatus Lima, 1978 (CI-1). (d) Equisetosporites ovatus (Pierce) Singh, 1961 (CI-1). (e) Gnetaceaepollenites sp. Thiegart, 1938 (CI-1). (f) Gnetaceaepollenites consisus Regali, 1989c (CI-1). (g) Gnetaceaepollenites jansonii Pocock, 1964 (CI-1). (h) Gnetaceaepollenites uesuguii Lima, 1978 (CI-1). (i) Gnetaceaepollenites undulatus Regali, Uesugui & Santos, 1974 (RL-1). (j) Steevesipollenites sp. Stover, 1964 (CI-1).. (k) Singhia sp. Srivastava, 1968 (PR-1). (l) Singhia punctata Lima, 1978 (EGST-1).
Plate 9
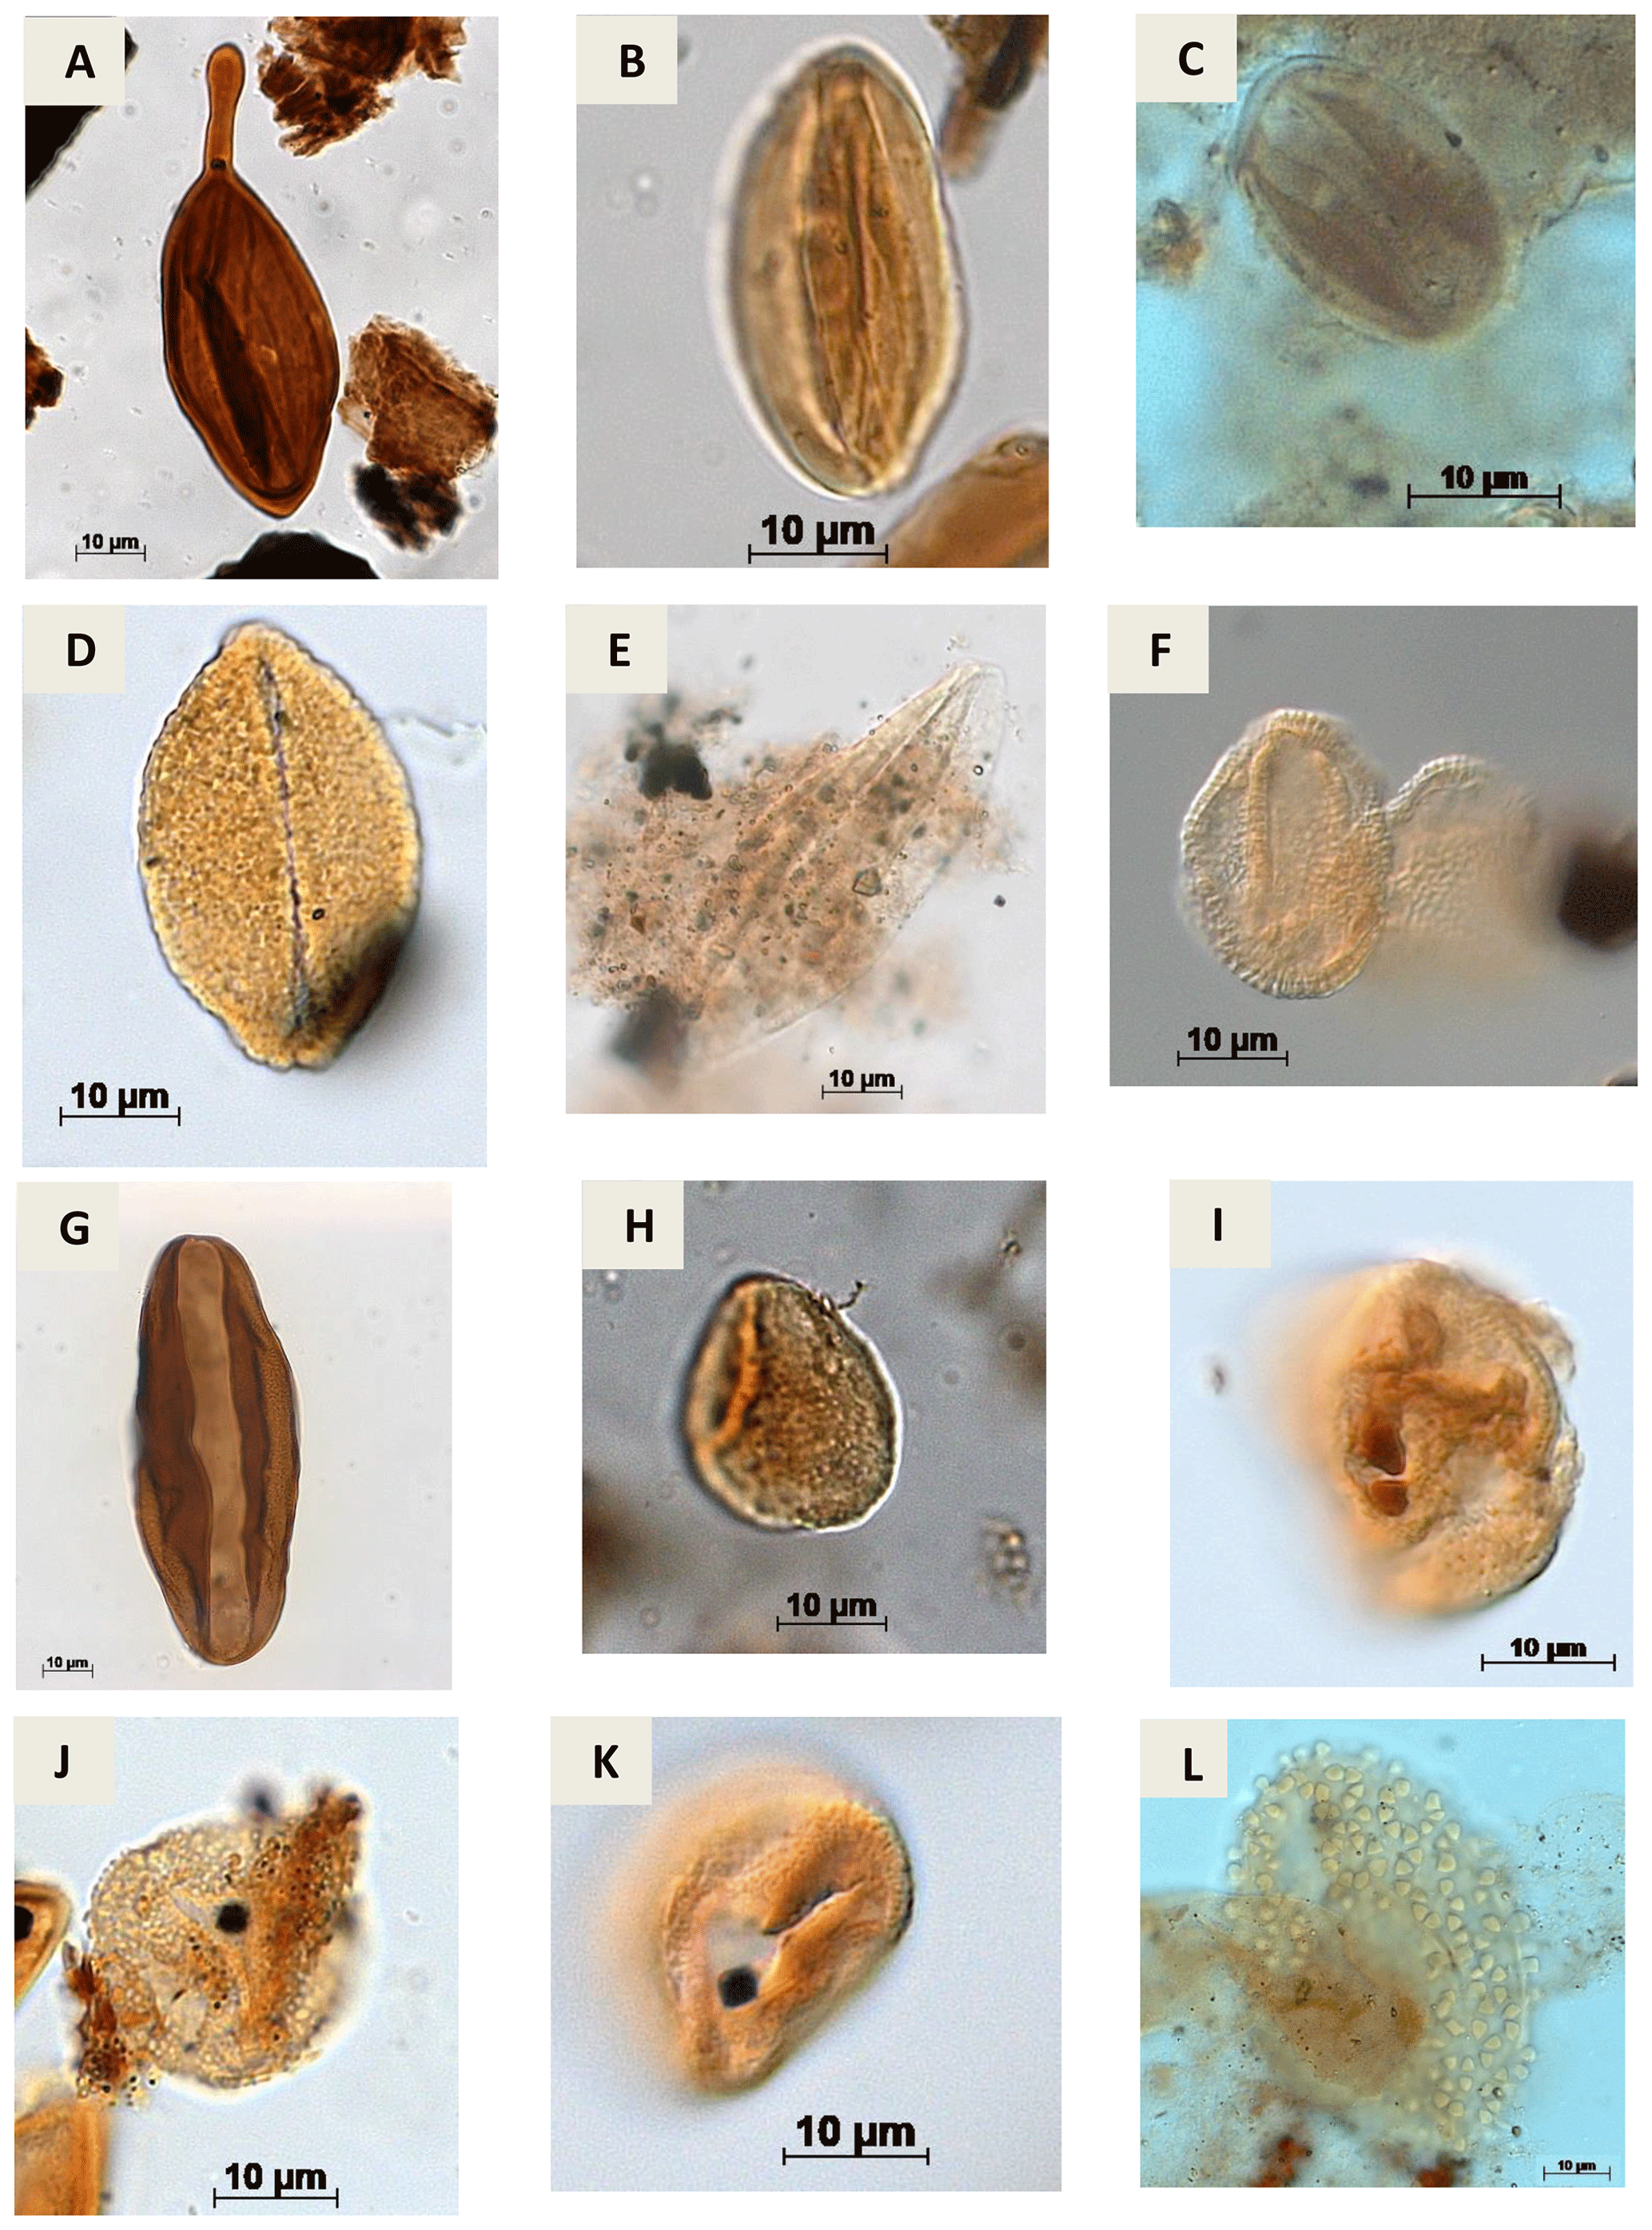
Plate A9(a) Regalipollenites sp. Lima, 1978 (PR-1). (b) Eucommiidites sp. (Erdtman, 1948) Hugues, 1961 (CI-1). (c) Eucommiidites troedssonii (Erdtman, 1948) Hugues, 1961 (RL-1). (d) Arecipites microfoveolatus Ibrahim, 2002 (CI-1) (e) Cycadopites sp. Wilson e Webster, 1946 (PE-1). (f) Dejaxpollenites foveoreticulatus Dino, 1992 (EGST-1) (g) Bennettitaepollenites sp. Thiegart, 1949 (CI-1) (h) Cavamonocolpites sp. Lima, 1978 (RL-1). (i) Cavamonocolpites sp. 1 Dino, 1992 (CI-1). (j) Clavatipollenites sp. Couper, 1958 (EGST-1). (k) Clavatipollenites huguesi Couper, 1958 (PE-1). (l) Stellatopollis sp. Doyle, Van Campo e Lugardon, 1975 (VN-1).
Plate 10
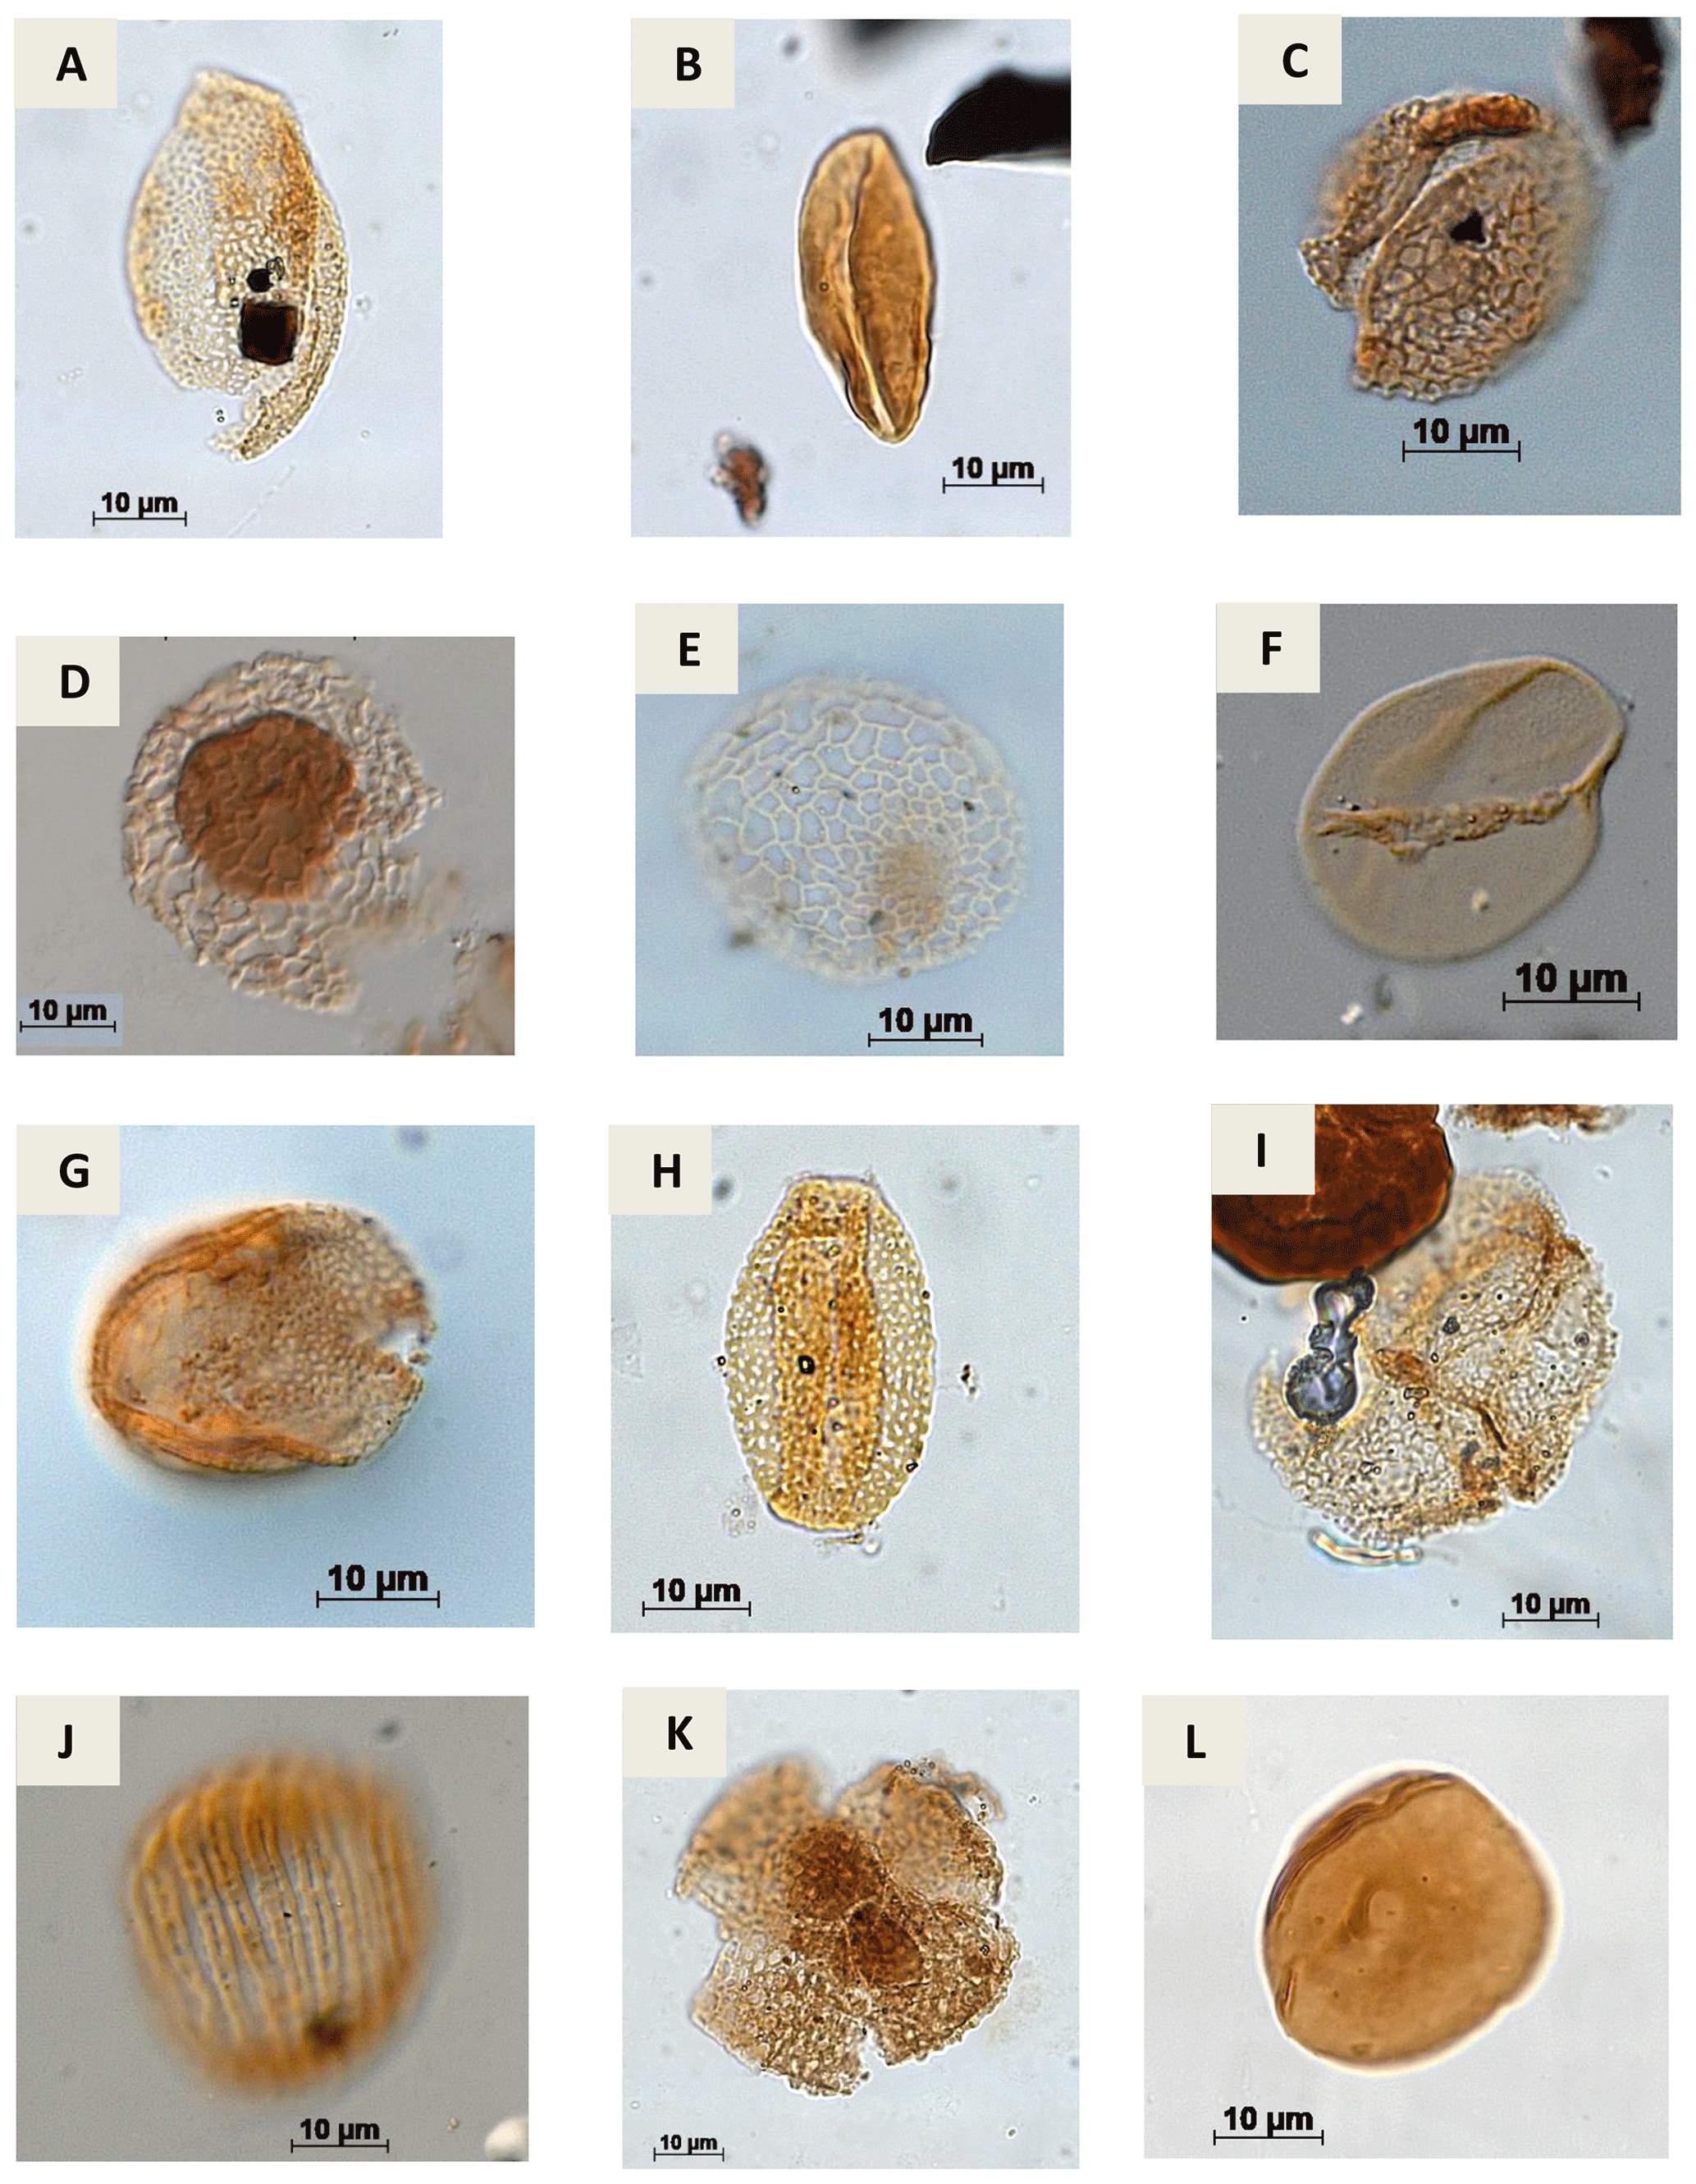
Plate A10(a) Retimonocolpites sp. Pierce, 1961 (PR-1). (b) Monocolpopollenites sp. Thomsom & Pflug, 1953 emend. Nichols, Ames & Traverse, 1973 (CI-1). (c) Brenneripollis reticulatus Júhasz & Góczan, 1985 (PE-1). (d) Afropollis jardinus Doyle, Jardiné & Doeren Kamp, 1982 (CI-1). (e) Afropollis aff. jardinus Doyle, Jardiné & Doeren Kamp, 1982 (PR-1). (f) Psiladicolpites papillatus? Regali, 1989c (EGST-1). (g) Tricolpites sp. Cookson, 1947 ex Couper, 1953 (EGST-1). (h) Rousea sp. Srivastava, 1969 (PR-1). (i) Rousea georgensis (Brenner, 1963) Dettmann, 1973 (PR-1). (j) Trisectoris reticulatus (Regali, Uesugui & Santos, 1974b) Heimhofer & Hochuli, 2010 (EGST-1). (k) Retiquadricolpites sp. Regali, 1989 (CI-1). (l) Exesipollenites tumulus Balme, 1957 (PR-1).
Plate 11
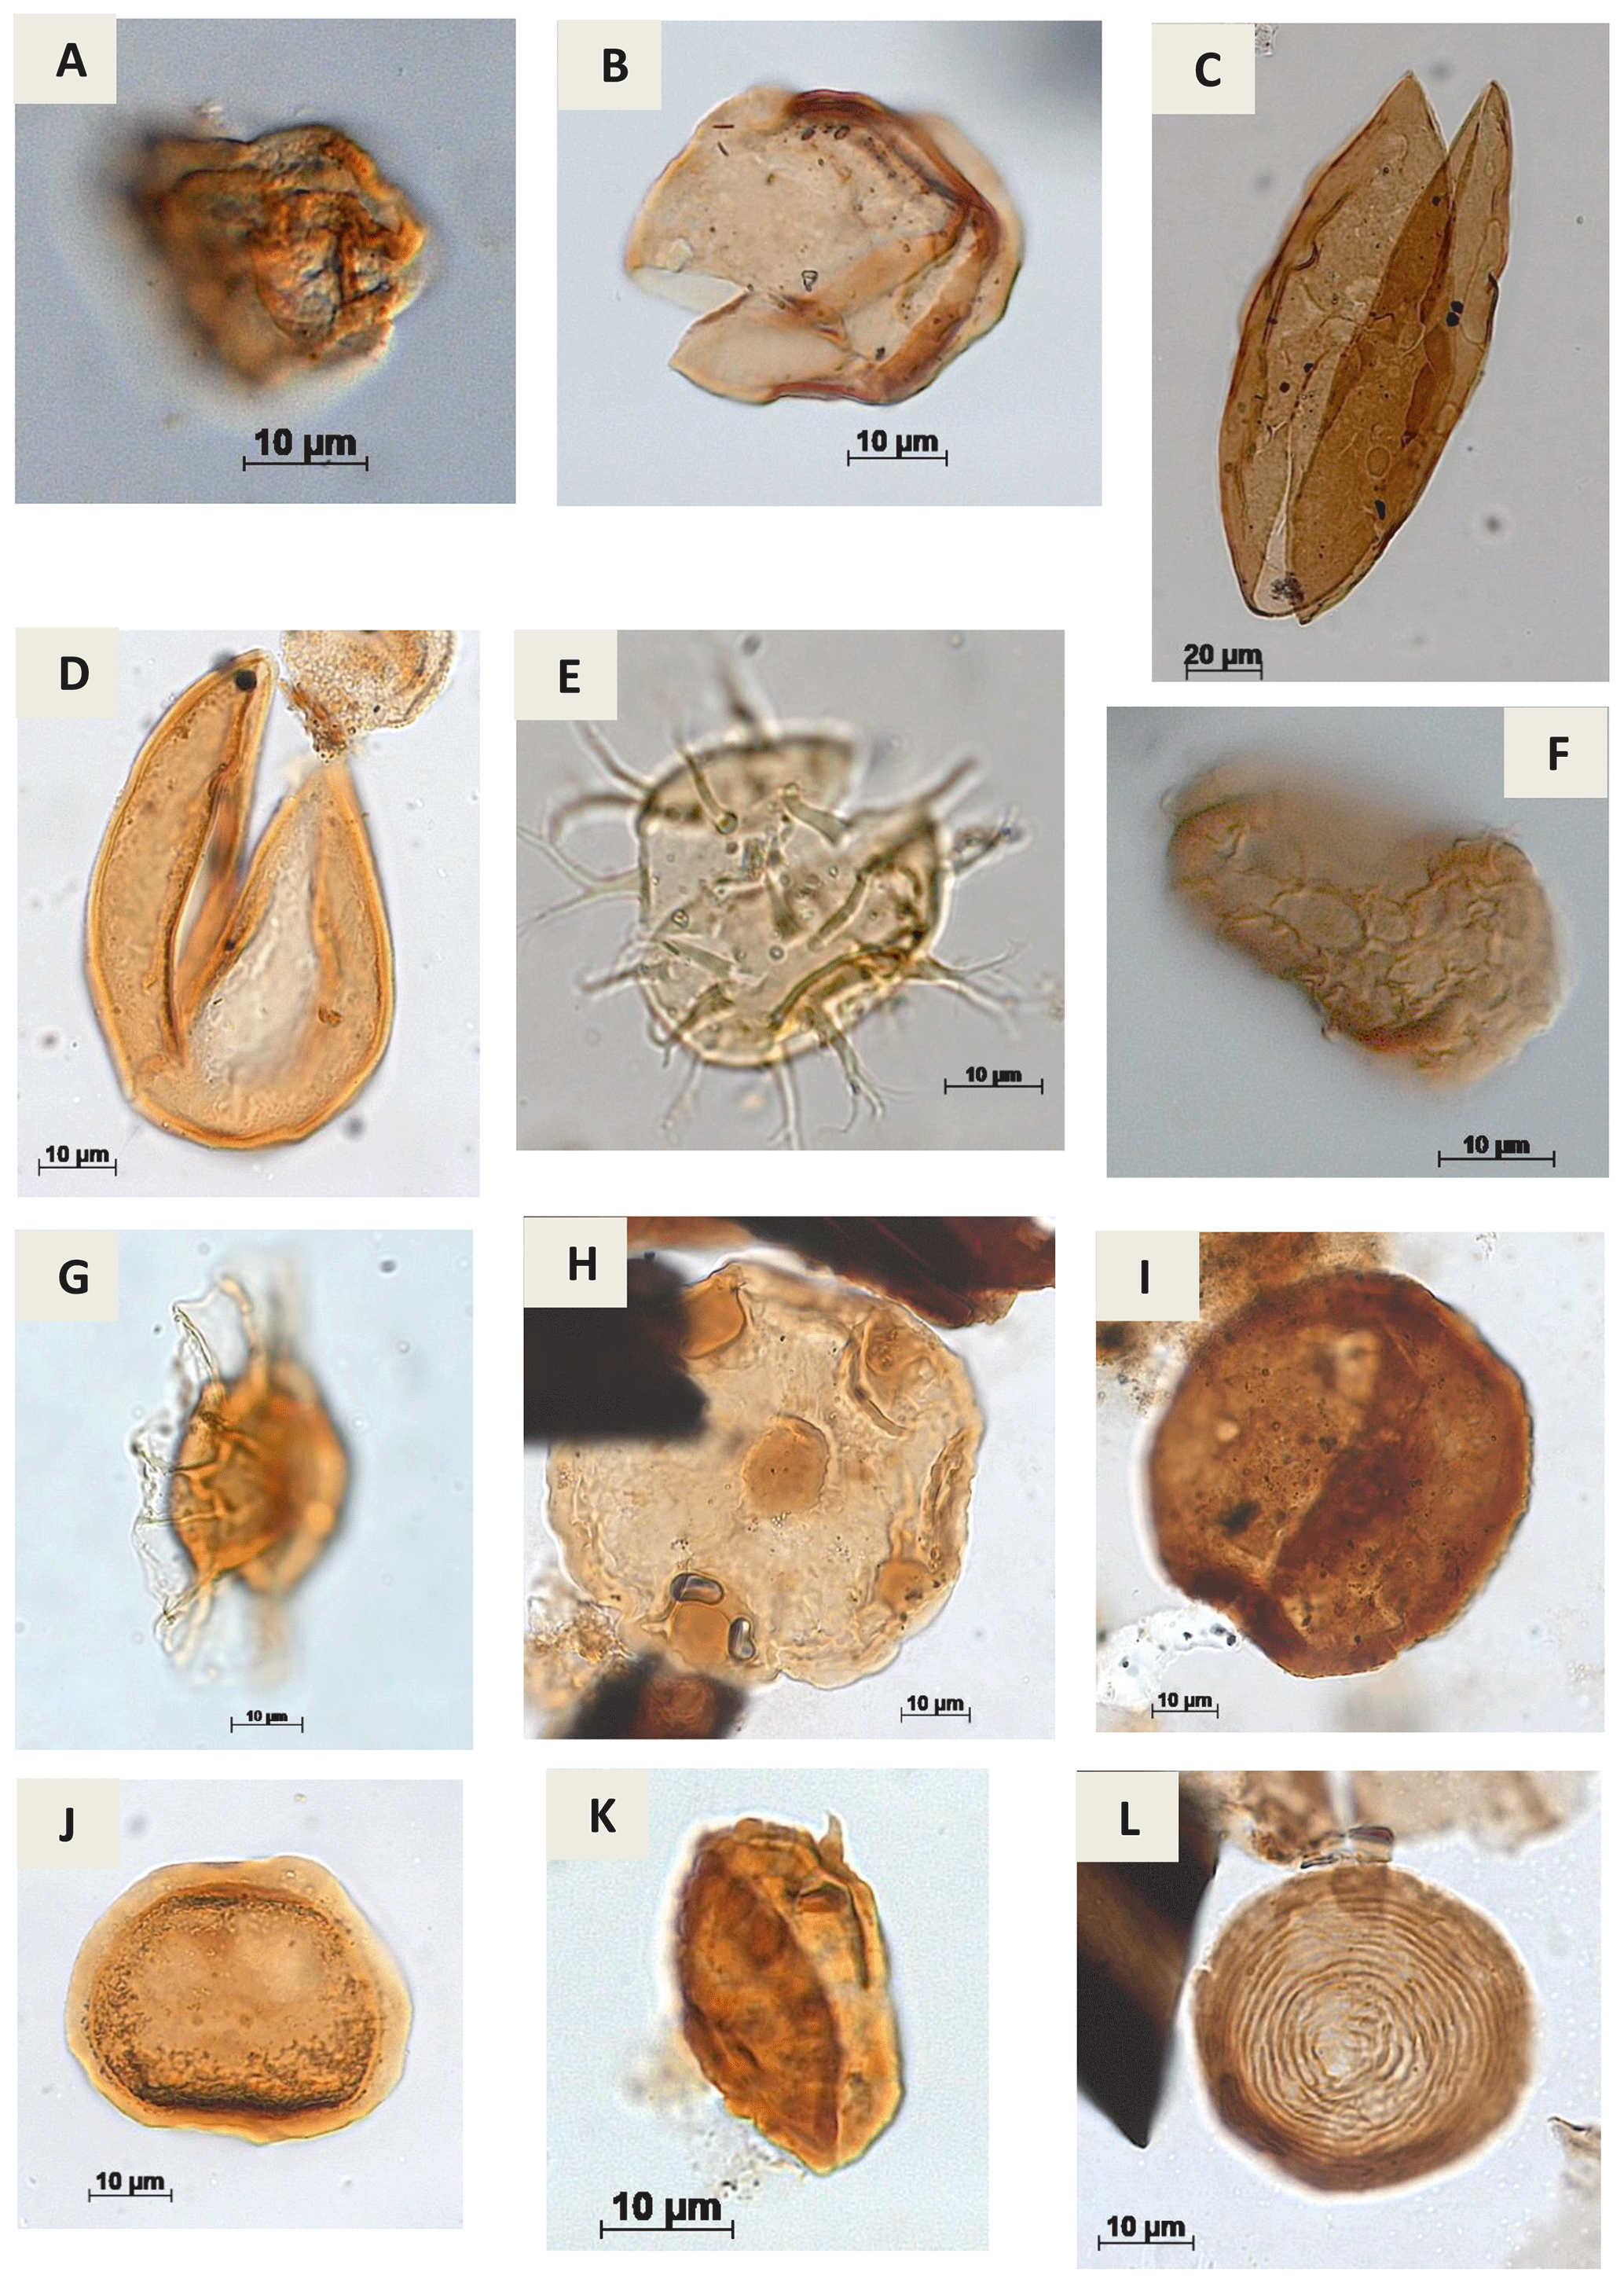
Plate A11(a) Cretacaeiporites sp.?Herngreen, 1973 (RL-1). (b) Schizosporis sp. Cookson & Dettmann, 1959 (PE-1). (c) Schizosporis parvus Cookson & Dettmann, 1959 (RL-1). (d) Schizosporis spriggi Cookson & Dettmann, 1959 (EGST-1). (e) Acritarch Evitt 1963 (CI-1). (f) Cymatiosphera? Wetzel, 1933 (CI-1). (g) Duvernaysphaera sp. (Staplin, 1961) Deunff, 1964 (CI-1). (h) Maranhites sp. Brito, 1965 emend. González, 2009 (CI-1). (i) Tasmanites sp. Newton, 1875 emend. Schopf, Wilson & Bentall, 1944 (CI-1). (j) Scylaspora sp. Burgess & Richardson, 1995 (EGST-1). (k) Raistrickia sp.? Schopf et al.1944 emend. Potonié & Kremp, 1954 (VN-1). (l) Chomotriletes sp. Naumova, 1937 (VN-1).
Table B1Bioclimatic groups (percentages) of the studied wells. HG: hygrophytes; HD: hydrophytes; TLF: tropical lowland flora; UF: upland flora; XP: xerophytes; H′: diversity; : fern spores, xerophytes.
The data and code used in this paper are available at https://www.gov.br/anp/pt-br/assuntos/exploracao-e-producao-de-oleo-e-gas/dados-tecnicos/acervo-de-dados (Agência Nacional do Petróleo, Gás Natural e Biocombustíveis, 2020). Additional information on samples (wellsVN-1,EGST-1,RL-1,PE-1,CI-1,and PR-1) can be accessed in Carvalho et al. (2022).
MCdSG and MdAC led the writing with contributions of all coauthors; MCdSG, CCL, GS, NdPS, and GdCC collected the palynological data, and MCdSG and MdAC carried out the pollen data analysis.
The contact author has declared that none of the authors has any competing interests.
Publisher's note: Copernicus Publications remains neutral with regard to jurisdictional claims in published maps and institutional affiliations.
The research was funded by CENPES/Petrobras under grant no. 2017/00192-8 (to Marcelo de Araujo Carvalho), registered by the National Petroleum Agency (ANP) as SAP 4600558879. We thank CENPES/Petrobras for the opportunity to study the data from wells, José Ricardo Maizatto (CENPES/Petrobras) for selecting wells and assistance with samples, and Caio Medeiros and Nelson Reis (Geological Survey of Brazil – CPRM) for supporting us with infrastructure in accordance with the technical and scientific agreement (48035.000153/2020-38). We thank Alessandra Santos (iitOceaneon/UNISINOS) and Renato Ramos (Museu Nacional/UFRJ) for their helpful comments.
This research has been supported by Petrobras (grant no. 2017/00192-8).
This paper was edited by Gerilyn (Lynn) Soreghan and reviewed by Mercedes di Pasquo and one anonymous referee.
Agência Nacional do Petróleo, Gás Natural e Biocombustíveis: Acervo de dados, Ministério de Minas e Energia [data set], https://www.gov.br/anp/pt-br/assuntos/exploracao-e-producao-de-oleo-e-gas/dados-tecnicos/acervo-de-dados, 2020.
Antonioli, L.: Estudo palinocronoestratigráfico da Formação Codó – Cretáceo Inferior do Nordeste brasileiro, PhD thesis, Universidade Federal do Rio de Janeiro, Rio deJaneiro, Brazil, 265 pp., 2001.
Balme, B. E.: Spores and pollen grains from the Mesozoic of Western Australia. C.S.I.R.O, Australia, Commonwealth Scientific and Industrial Research Organization, Coal Research Section. Reference, Melbourne, T.C., 25, 1–48, 1957.
Balme, B. E.: Fossil in situ spores and pollen grains: an annotated catalogue, Rev. Palaeobot. Palynol., 87, 81–323, 1995.
Batten, D. J.: Wealden palaeocology from the distribution of plant fossils, Proc. Geol. Ass., 85, 433–458, 1975.
Caron, J.-B. and Jackson, D. A.: Paleoecology of the Greater Phyllopod Bed community, Burgess Shale, Palaeogeogr. Palaeoclimatol. Palaeoecol., 258, 222–256, 2007.
Carvalho, M. A.: Palynological assemblage from Aptian/Albian of the Sergipe Basin: paleoenvironmental reconstruction, Rev. Bras. Paleontol., 7, 159–168, 2004.
Carvalho, M. A., Bengtson, P., and Lana, C. C.: Late Aptian (Cretaceous) paleoceanography of the South Atlantic Ocean inferred from dinocyst communities of the Sergipe Basin, Brazil, Paleoceanography, 31, 2–26, 2016.
Carvalho, M. A., Bengtson, P., Lana, C. C., Sá, N. P., Santiago, G., and Giannerini, M. C. S.: Late Aptian (Early Cretaceous) dry-wet cycles and their effects on vegetation in the South Atlantic: Palynological evidence, Cretaceous Res., 100, 172–183, 2019.
Carvalho, M. A., Lana, C. C., Sá, N. P, Santiago, G., Giannerini, M. C. S., and Bengtson, P.: Influence of the intertropical convergence zone on early Cretaceous plant distribution in the South Atlantic, Sci. Rep., 12, 12600, https://doi.org/10.1038/s41598-022-16580-x, 2022.
Carvalho, M. C., Lana, C. C., Bengtson, P., and Sá, N. P.: Late Aptian (Cretaceous) climate changes in northeastern Brazil: A reconstruction based on indicator species analysis (IndVal), Palaeogeogr. Palaeoclimatol. Palaeoecol., 485, 553–560, 2017.
Chaboureau, A.-C., Donnadieu, Y., Sepulchre, P., Robin, C., Guillocheau, F., and Rohais, S.: The Aptian evaporites of the South Atlantic: a climatic paradox?, Clim. Past, 8, 1047–1058, https://doi.org/10.5194/cp-8-1047-2012, 2012.
Chaboureau, A.-C., Sepulchre, P., Donnadieu, Y., and Franc, A.: Tectonic-driven climate change and the diversification of angiosperms, P. Natl. Acad. Sci. USA, 111, 14066–14070, 2014.
Chumakov, N. M., Zharkov, M. A., Herman, A. B., Doludenko, M. P., Kalandadze, N. N., Lebedev, E. A., Ponomarenko, A. G., and Rautian, A. S.: Climate belts of themid- Cretaceous time, Stratigr. Geol. Correl., 3, 241–260, 1995.
Deaf, A. M., Harding, I. C., and Marshall, J. E. A.: Cretaceous (Hauterivian–Cenomanian) palaeoceanographic conditions in southeastern Tethys (Matruh Basin, Egypt): Implications for the Cretaceous climate of northeastern Gondwana, Cret. Res., 106, 104229, https://doi.org/10.1016/j.cretres.2019.104229, 2020.
Dino, R.: Palinologia, bioestratigrafia e paleoecologia da Formação Alagamar- Cretáceo da Bacia Potiguar, Nordeste do Brasil, PhD. thesis, Universidade de São Paulo, Brazil, 299 pp., 1992.
Dino, R.: Algumas espécies novas de grãos de pólen do Cretáceo Inferior do nordeste do Brasil, Bol. Geociênc. Petrobras, 8, 257–273, 1994.
Doyle, J. A., Jardiné, S., and Dorenkamp, A.: Afropollis, a new genus of early angiosperm pollen, with notes on the Cretaceous palynostratigraphy and paleoenvironments of northern Gondwana, Bull. Centres Rech. Explor. Prod. Elf-Aquitaine, 6, 39–117, 1982.
Dufrêne, M. and Legendre, P.: Species assemblages and indicator species: the need for a flexible asymmetrical approach, Ecol. Monogr., 67, 345–366, 1997.
Erdtman, G.: An introduction to pollen analysis. Waltham, Chronica Botanica Company, v. XII, 239 pp., 1943.
Erdtman, G.: Handbook of Palynology: An Introduction to the Study of Pollen Grains and Spores, Copenhagen, Ejnar Munksgaard, 486 pp., 1969.
Faegri, K. and Iversen, J.: Textbook of Pollen Analysis. Munksgaard (Scandinavian University Books), Copenhagen, 236 pp., ISBN 0632000074, 1966.
Fossilworks: http://fossilworks.org, last access: 27 August 2022.
Hammer, O., Harper, D. A. T., and Ryan, P. D.: PAST: paleontological statistics software package for education and data analysis, Palaeontol. Electron., 4, 1–9, 2001.
Hashimoto, A. T.: Contribuição ao estudo do relacionamento da palinologia e a estratigrafia de sequências. Análise da seção do Cretáceo Médio/Superior da Bacia de Santos, MSc. thesis, Universidade Federal do Rio Grande do Sul, Rio Grande do Sul, Brazil, 130 pp., 1995.
Hay, W. W. and Floegel, S.: New thoughts about the Cretaceous climate and oceans, Earth-Sci. Rev., 115, 262–272, 2012.
Heimhofer, U., Adatte, T., Hochuli, P. A., Burla, S., and Weissert, H.: Coastal sediments from the Algarve: low-latitude climate archive for the Aptian–Albian, Int. J. Earth Sci., 97, 785–797, 2008.
Jansonius, J., Hills, L. V., and Hartkopf-Fröder, C.: Genera File of Fossil Spores and Pollen, Spec. Pub., Department of Geology, University of Calgary, Alberta, https://digitalcollections.ucalgary.ca/archive/Genera-file-of-fossil-spores-and-pollen-2R340807EMIQ.html (last access: 22 November 2022), 1976–1996.
Leandro, L. M, Santos, A., Carvalho, M. A., and Fauth, G.: Middle to late Miocene Caribbean dinoflagellate assemblages and palynofacies (DSDP Leg 15 Site 153), Mar. Micropaleontol., 160, 101898, https://doi.org/10.1016/j.marmicro.2020.101898, 2020.
Lima, M. R.: Palinologia da Formação Santana (Cretáceo do nordeste do Brasil). II. Descrição sistemática dos esporos da Subturma Azonotriletes, Ameghiniana, XV, 333–365, https://www.ameghiniana.org.ar/index.php/ameghiniana/article/view/1565 (last access: 18 March 2023), 1978.
Lima, M. R.: Paleoclimatic reconstrution the Brazilian Cretaceous based on palynological date, Rev. Bras. Geoc., 4, 223–228, 1983.
Milani, E. J., Rangel, H. D., Bueno, G. V., Stica, J. M., Winter, W. R., Caixeta, J. M., and Neto, O. P.: Bacias sedimentares brasileiras: cartas estratigráficas, Bol. Geoc. PETROBRAS, 15, 183–205, 2007.
Ohba, M. and Ueda, H.: AGCM study on effects of continental drift on tropical climate at the early and late Cretaceous, J. Meteorol. Soc. Jpn., 88, 869–881, 2010.
Petri, S.: Brazilian Cretaceous paleoclimates: evidence from clay-minerals, sedimentar structures and palynomorphs, Rev. Bras. Geoc., 13, 215–222, 1983.
Regali, M. S. P. and Santos, P. R. S.: Palinoestratigrafia e geocronologia dos sedimentos albo-aptianos das bacias de Sergipe e Alagoas – Brasil, in: Simpósio sobre o Cretáceo do Brasil, 5, Rio Claro, Brazil, 411–419, 1999.
Regali, M. S. P., Uesugui, N., and Santos, A. S.: Palinologia dos sedimentos Meso-cenozoicos do Brasil (I), Bol. Téc. Petrobras, 17, 177–191, 1974.
Rossetti, D. F. and Góes, A. M.: Caracterização paleoambiental de depósitos albianos na borda Sul da Bacia de São Luís-Grajaú: modelo de delta fluvial influenciado por tempestade, Braz. J. Geol., 33, 299–312, 2003.
Roucoux, K. H., Lawson, I. T., Jones, T. D., Baker, T. R., Honorio Coronado, E. N., and Gosling, W. D.: Vegetation development in an Amazonian peatland, Palaeogeogr. Palaeoclimatol. Palaeoecol., 374, 242–255, 2013.
Santos, A., De Lira Mota, M., Kern, H. P., Fauth, G., Paim, P. S. G., Netto, R. G., Sedorko, D., Lavina, E. L. C., Krahl, G., Fallgatter, C., Silveira, D. M., Aquino, C. D., Santos, M. O., Baecker-Fauth, S., and Vieira, C. E. L.: Earlier onset of the early Cretaceous equatorial humidity belt, Glob. Planet. Change, 208, 103724, https://doi.org/10.1016/j.gloplacha.2021.103724, 2022.
Scotese, C.: A new global temperature curve for the Phanerozoic. Paper Presented at the Geological Society of America, Annual Meeting in Denver, Colorado, 6 January 2016, 287167, 2016.
Scotese, C. R., Song, H., Mills, J. W., and van der Meer, D. G.: Phanerozoic paleotemperatures: The earth's changing climate during the last 540 million years, Earth Sci. Rev., 215, 10350otese, https://doi.org/10.1016/j.earscirev.2021.103503, 2021.
Souza-Lima, W. and Silva, R. O.: Aptian-Albian paleophytogeography and paleoclimatology from Northeastern Brazil sedimentary basins, Rev. Palaeobot. Palyno., 258, 163–189, 2018.
Suguio, K. and Barcelos, J. H.: Paleoclimatic evidence from the Bauru Group, Cretaceous of the Paraná Basin, Brazil, Rev. Bras. Geoc., 13, 232–236, 1983.
Trindade, V. S. F. and Carvalho, M. A.: Paleoenvironment reconstruction of Parnaíba Basin (north, Brazil) using indicator species analysis (IndVal) of Devonian microphytoplankton, Mar. Micropaleontol., 140, 69–80, 2018.
Uesugui, N.: Palinologia: técnica de tratamento de amostras, Bol. Téc. Petrobras, 22, 229–240, 1979.
Vakhrameev, V. A.: Range and paleoecology of Mesozoic conifers. The Cheirolepidiaceae, Paleontol. J., 41, 11–25, 1970.
Vakhrameev, V. A.: Pollen Classopollis: indicator of Jurassic and Cretaceous climates, Paleobotanist, 28, 301–307, 1981.
- Abstract
- Introduction
- Geological settings
- Late Aptian climatic evolution
- Material and methods
- Results
- Discussion
- Conclusions
- Appendix A: The 11 plates with the most relevant palynomorphs recorded in the studied wells
- Appendix B
- Code and data availability
- Author contributions
- Competing interests
- Disclaimer
- Acknowledgements
- Financial support
- Review statement
- References