the Creative Commons Attribution 4.0 License.
the Creative Commons Attribution 4.0 License.
 | 17 Aug 2023
An age scale for new climate records from Sherman Island, West Antarctica
Carlos Martin
Robert Mulvaney
Helena Pryer
Dieter Tetzner
Emily Doyle
Hara Madhav Talasila
Eric Wolff
Few ice cores from the Amundsen Sea and Bellingshausen Sea sectors of the West Antarctic Ice Sheet (WAIS) extend back in time further than a few hundred years. The WAIS is believed to be susceptible to collapse as a result of anthropogenic climate change and may have at least partially collapsed during the Last Interglacial (LIG) period. Understanding the stability of the WAIS during warm periods such as the LIG and Holocene is important. As part of the WACSWAIN (WArm Climate Stability of the West Antarctic ice sheet in the last INterglacial) project, the British Antarctic Survey's (BAS) Rapid Access Isotope Drill (RAID) was deployed in 2020 on Sherman Island in the Abbot Ice Shelf, West Antarctica. We drilled a 323 m deep borehole, with discrete samples of ice chippings collected that cover the entire depth range of the drilled ice. The samples were analysed for stable water isotope composition and major ion content at BAS from 2020–2022. Using annual layer counting of chemical records, volcanic horizon identification and ice modelling, an age scale for the record of 1724 discrete samples is presented. The Sherman Island ice record extends back to greater than 1240 years, providing the oldest, continuous ice-derived palaeoclimate records in the coastal Amundsen and Bellingshausen Sea sectors to date. We demonstrate the potential for recovery of a complete Holocene climate record from Sherman Island in the future and confidence in the ability of RAID samples to contain sufficiently resolved records for meaningful climatic interpretation.
- Article
(5203 KB) - Full-text XML
-
Supplement
(778 KB) - BibTeX
- EndNote


The West Antarctic Ice Sheet (WAIS) is believed to be vulnerable to collapse due to anthropogenic warming, with the potential to contribute several metres to global sea level (Mercer, 1978; Oppenheimer, 1998; Edwards et al., 2019; Bamber et al., 2019; Lowry et al., 2021). Much of the WAIS is grounded in marine basins lying up to 2000 m below sea level, making it highly susceptible to mass loss as a result of marine ice sheet instability induced by ocean warming (Joughin et al., 2014; Shepherd et al., 2004). The recent thinning of the WAIS and southern Antarctic Peninsula ice shelves has resulted in accelerated flow of their respective glaciers into the Bellingshausen Sea and Amundsen Sea embayments, and their grounding lines have subsequently retreated over the last few decades (Konrad et al., 2018; Paolo et al., 2015; Wouters et al., 2015). Current loss of ice volume from the WAIS is dominated by loss from the Pine Island and Thwaites glaciers (Pattyn and Morlighem, 2020). Significant retreat of WAIS glaciers is underway and is identified as one of the major “tipping points” in the climate system, which could bring about irreversible WAIS collapse (Lenton et al., 2008). WAIS loss has implications for other parts of the climate system, such as Antarctic sea ice coverage, albedo and freshening of the Southern Ocean, highlighting the importance of research in this area (Bronselaer et al., 2018; Wunderling et al., 2020).
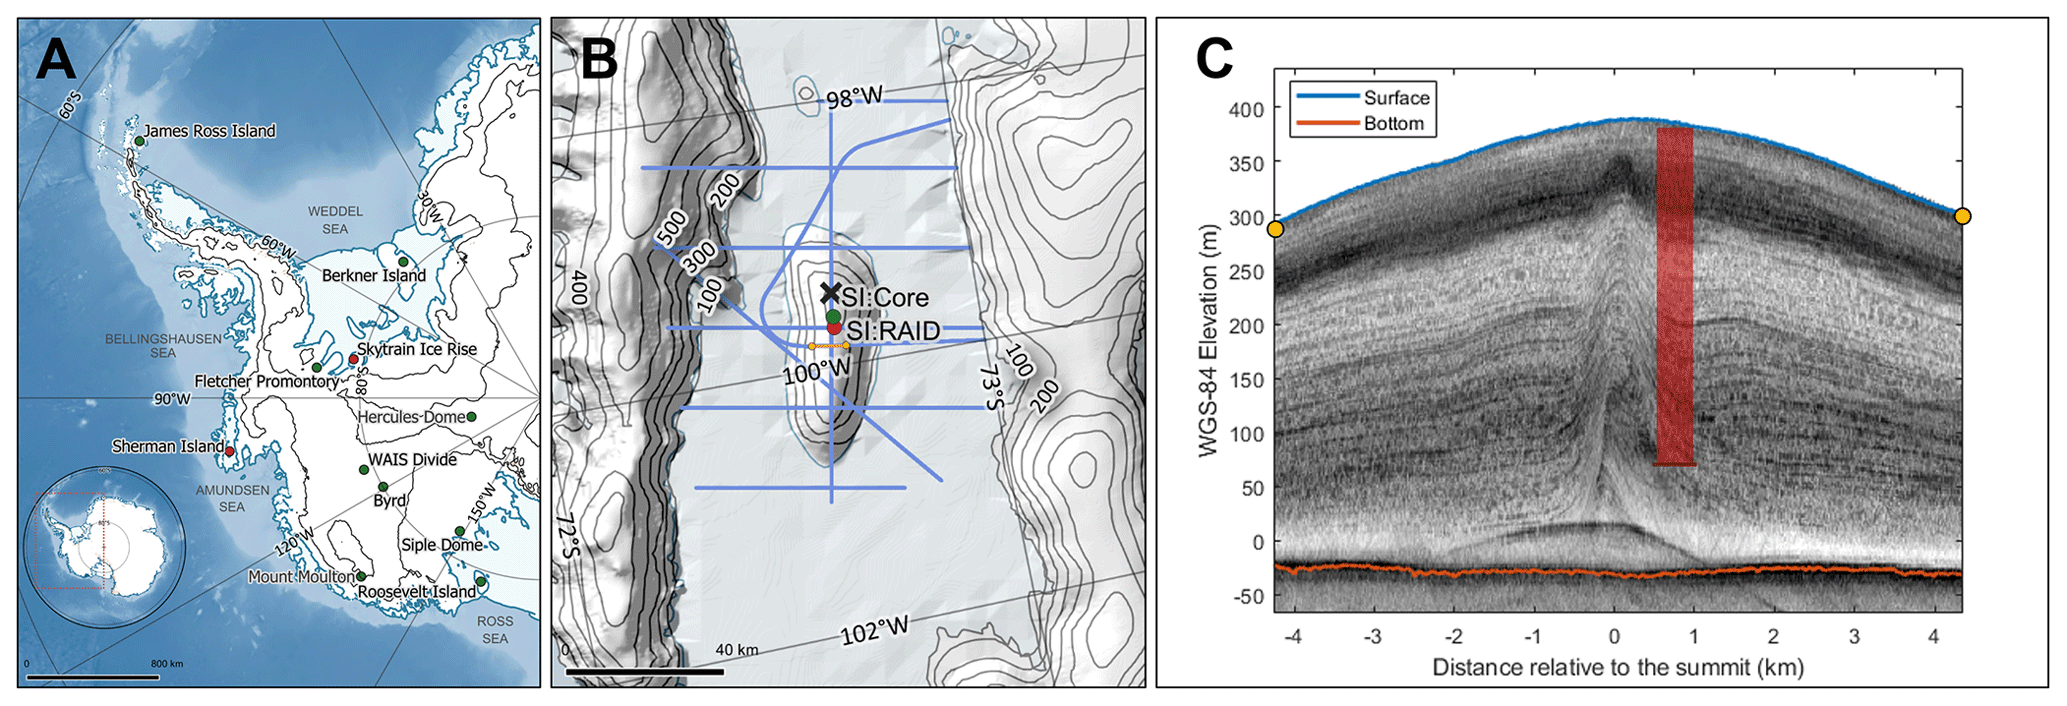
Figure 1(a) Map of West Antarctica indicating the location of the WACSWAIN drilling sites in red and other WAIS deep-ice-core sites in green. (b) Close up map of Sherman Island, showing IceBridge flyover lines in blue, the line from which the echogram (c) is taken in yellow, the SI:RAID site in red, the SI:Core site in green and the black cross (×) indicating the deepest location on the island (discussed in the text). Maps are generated using QGIS with the Quantarctica mapping environment (Matsuoka et al., 2021). Contour lines show the elevation at 1000 m (a) and 100 m (b) intervals from CryoSat-2. (c) Radar echogram from the IceBridge line in yellow in panel (b), with the red column showing the approximate relative location of the SI:RAID drilling site to the ice divide.
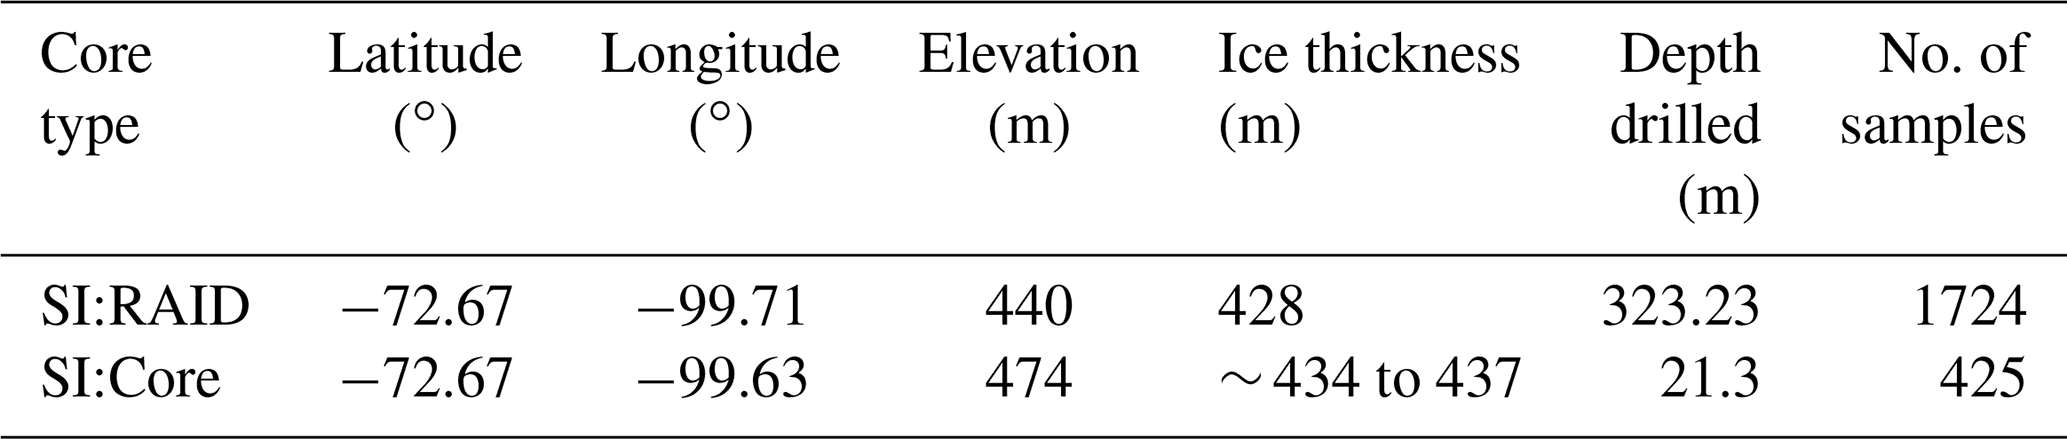
Table 1Information about the Sherman Island RAID and ice core sites and drilling campaign. SI:Core data are from (D. Tetzner et al., 2022) and IceBridge data.
The WAIS is believed to have at least partially collapsed during past warm periods, including the Last Interglacial (LIG) period (Dutton et al., 2015). Investigating the behaviour of presently sensitive WAIS regions during these times provides insights into ice sheet stability, which can be used to understand and predict current and future change. The WACSWAIN project (WArm Climate Stability of the West Antarctic ice sheet in the last INterglacial) aims to use ice core records to investigate the WAIS during the LIG in order to supplement existing modelling studies (e.g. DeConto and Pollard, 2016). An ice core from the Skytrain Ice Rise (Fig. 1) was successfully drilled to the bed at 651 m in 2018–2019 (Mulvaney et al., 2021), the results of which are now being published (Mulvaney et al., 2023; Hoffmann et al., 2022).
The second candidate site, Sherman Island, is located in the Abbot Ice Shelf between continental Antarctica and Thurston Island, close to the Thwaites and Pine Island glaciers (Fig. 1 and Table 1). If present, LIG ice from Sherman Island would provide a second constraint of LIG WAIS stability through an examination of stable water isotope records, which could indicate the temperature and elevation history of the site and the palaeoclimatic variability in the Amundsen Sea and Bellingshausen Sea sectors of the WAIS. Furthermore, a LIG record from this site, in addition to those from Skytrain Ice Rise and the upcoming Hercules Dome ice core further south (Fudge et al., 2022; Dütsch et al., 2023), and LIG data (Steig et al., 2015) from the more westerly Mount Moulton (Korotkikh et al., 2011; Steig et al., 2015), would result in a more complete picture of the WAIS from this time. Sherman Island lies in what was predicted to be a region effectively rain-shadowed by the mountains on Thurston Island to the north, lowering the estimated accumulation rate at the site in comparison to nearby coastal WAIS ice rises. Ice sheet thickness data from two Operation IceBridge flyovers (IRMCR2, 2009) indicated ice of approximately 420 m depth on the island, and estimates of the accumulation rate and geothermal heat flux indicated the possibility of ice from the LIG towards the bed (Mulvaney et al., 2021). Due to the low-lying position of Sherman Island, it is possible that the dome could have been overridden during the Last Glacial Maximum, thus removing older ice.
The British Antarctic Survey's Rapid Access Isotope Drill (RAID) was used, instead of carrying out a full-scale ice core drilling campaign, to mitigate the risks of a higher-risk site such as Sherman Island (Mulvaney et al., 2021). The RAID is a novel drilling technique which uses a single barrel to drill a dry borehole and obtain stratigraphically ordered samples of ice chippings rather than a solid ice core. The samples can be discretely sampled and analysed to obtain a comparatively lower-resolution record of measurements, including stable water isotope composition (Rix et al., 2019). Drilling with the RAID progresses approximately 3 times more quickly than traditional drilling techniques and places a significantly lower logistics demand on projects, with the possibility of going from the field set-up, drilling and de-camping to completion within a few weeks. It has previously been demonstrated that the drilling and sampling techniques necessary for RAID ice do not result in significant mixing or attenuation of stable water isotopic or chemical signals in the ice (Nguyen et al., 2021; Rowell et al., 2022). Measurements of chemical concentration, for which the RAID was not initially designed, are climatologically meaningful, and an identified chemical contamination problem does not impact climatic interpretation, particularly on longer timescales (Rowell et al., 2022).
Drilling on Sherman Island in early 2020 reached a depth of 323 m, out of a total ice sheet depth of approximately 428 m, at which point the drill became stuck in the ice and the drilling campaign ended (Mulvaney et al., 2021). Not reaching the bedrock is expected to significantly reduce the total possible length of the climate records obtained, due to the exponential increase in age with depth. For this reason and to maximise the potential use of the Sherman Island ice samples, the project aims turned to investigating the natural climate variability in the last few centuries of this vulnerable region of the WAIS in order to set current and future warming and ice sheet behaviour into a recent context. Crucial to this task is assigning a reliable age scale to the ice, and this paper addresses that for the new RAID core from Sherman Island. Using the ice we do have, we also assess the oldest ice which may be available from this site from a deeper core towards the bed.
2.1 Drilling and measurements
The BAS RAID (Rix et al., 2019) drilled on Sherman Island to a depth of 323 m in 5 drilling days, thus collecting 1724 discrete samples of ice chippings at a resolution of 6 to 29 cm (average 19 cm), as described in Rowell et al. (2022) and Mulvaney et al. (2021). Stable water isotope composition (δ18O and δ2H) and chemical ion concentrations (Ca2+, K+, Mg2+, Na+, Cl−, , MSA− and ) were measured on the samples at BAS from 2020 to 2021. The Ca2+ and K+ concentrations in the top-most sample of each drop of the drill into the ice was found to be artificially high. After discarding the contaminated data, the remaining data set appears robust and suitable for the investigation of the annual layers and trends in the concentrations of chemical ions and stable water isotope composition (Rowell et al., 2022).
2.2 Age-scale development
The Sherman Island RAID (SI:RAID) age scale was produced using three methods. Annual layer counting of stable water isotopic and chemical species was carried out on the basis that the stable water isotopic composition and concentration of certain ions vary seasonally, thereby enabling the visualisation and counting of peaks and troughs corresponding to one annual cycle, or layer, in the ice (e.g. Sigg and Neftel, 1988; Sigl et al., 2016; Winstrup et al., 2019). The layers can simply be counted from 1 year to the next, thereby giving fixed depths for the summer and/or winter of the shallower and more recent years in the ice sheet. The identification of large, well-dated volcanic events in the sulfate () record, supplemented with sulfur (S) isotope analysis to differentiate between background and volcanic samples, was conducted to date ice beyond the depth at which annual layer counting was possible (Patris et al., 2000). Two ice thinning models were used to give an initial estimate of the age scale, assess confidence in the first two dating methods and provide an age estimation for the deepest ice. The three steps are described in further detail below.
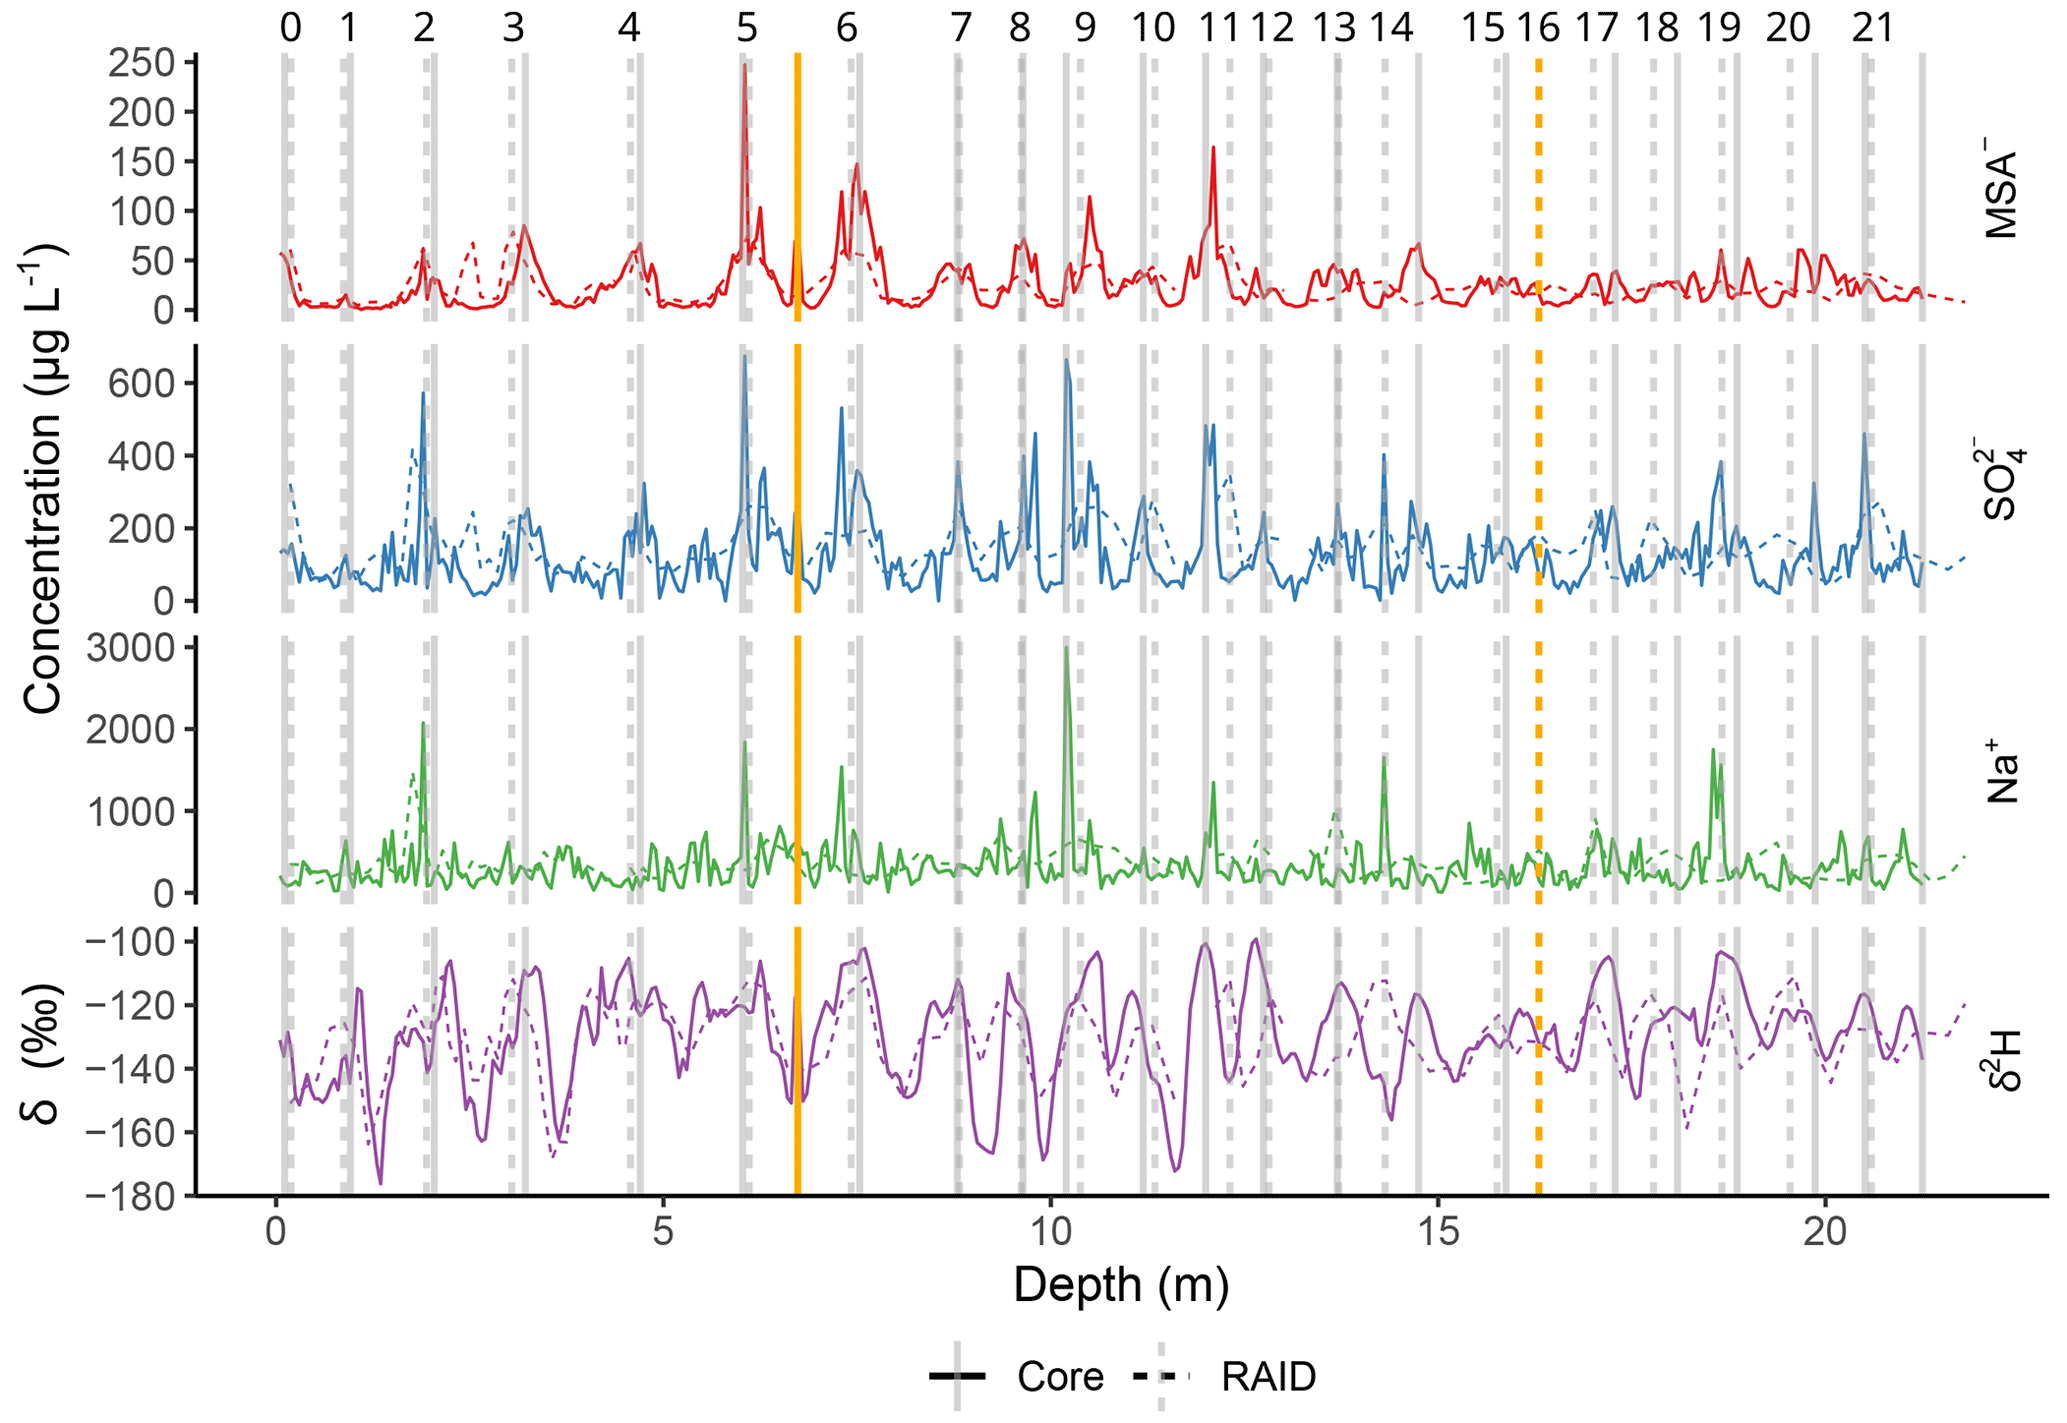
Figure 2Annual layer counting of the top 20 m of the Sherman Island MSA−, , Na+ (in µg L−1) and δ2H (in ‰) data. Counts are performed using both SI:RAID (dashed lines) and SI:Core (solid lines) data. Vertical grey age markers are placed on the assigned summer peak. Yellow lines represent the “uncertain” years in both core and RAID and are used for assessing the age-scale uncertainty, which is described in the text. The numbers along the top x axis represent the number of years counted from the surface.
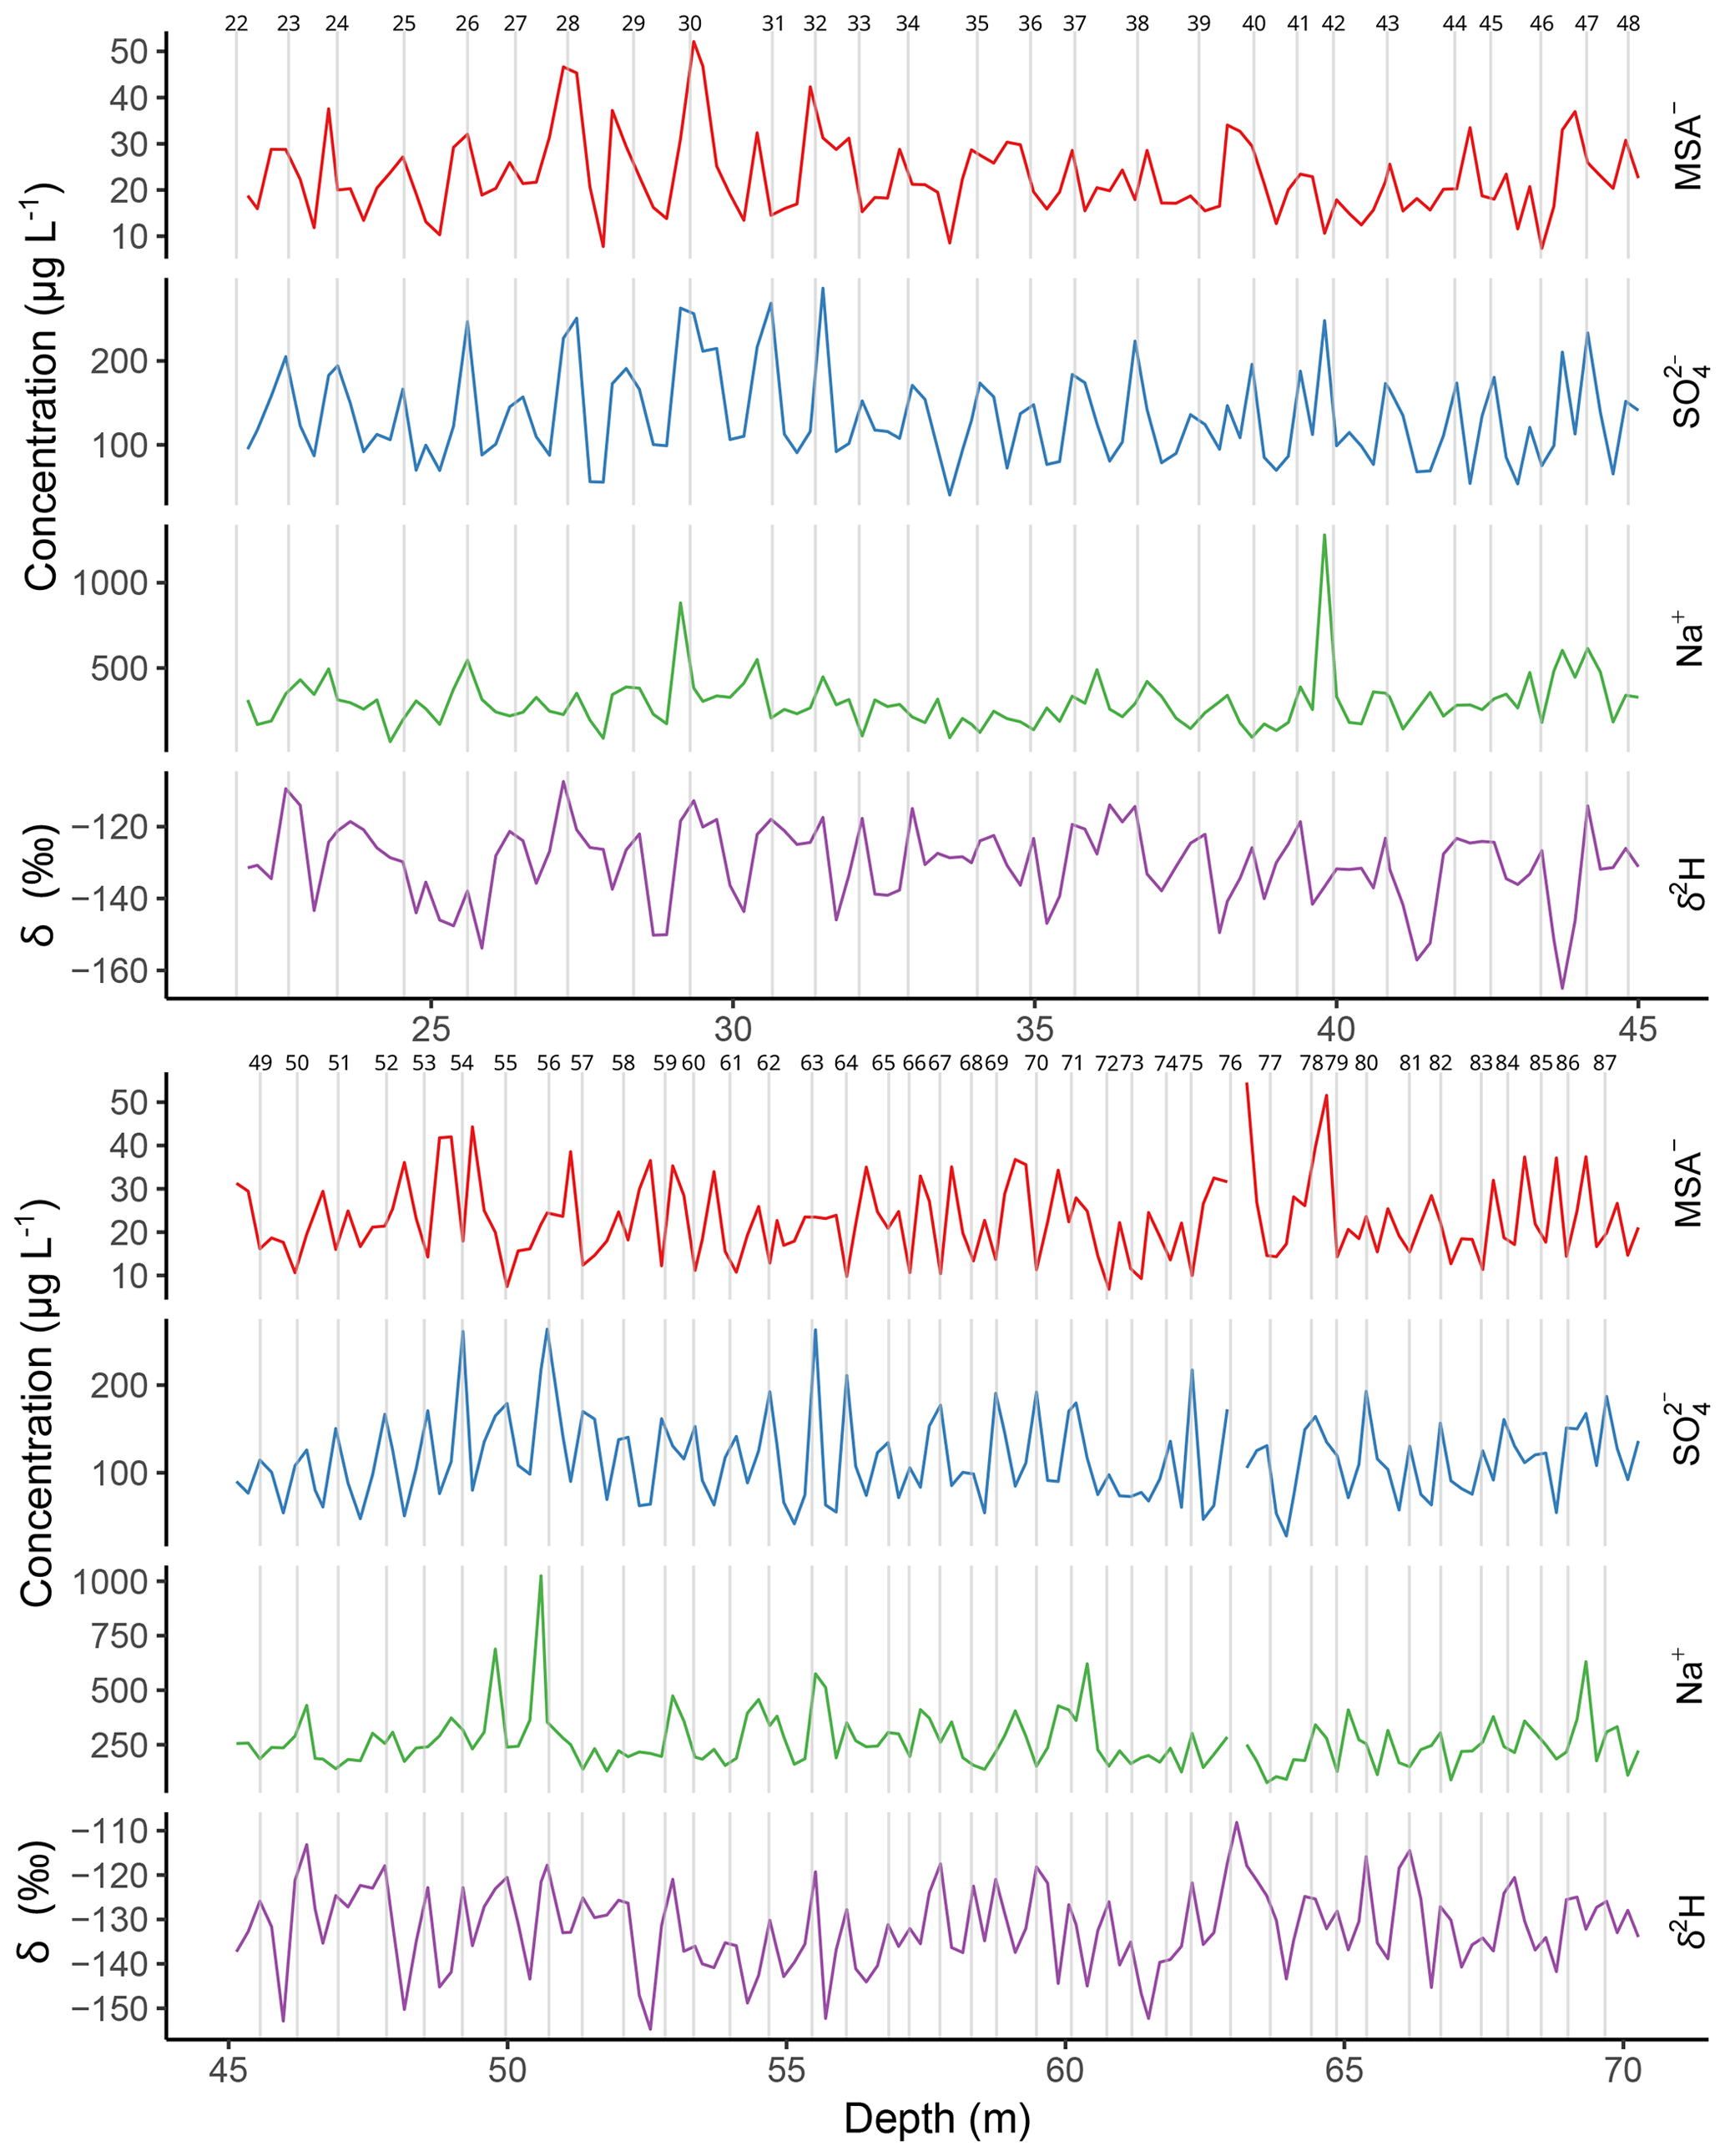
Figure 3Annual layer counting from 20 to 70 m of the SI:RAID MSA−, , Na+ (in µg L−1) and δ2H (in ‰) data. Grey age markers are placed on the assigned summer peak. The y axis ranges of panels are adjusted for the range of concentrations. The numbers along the top x axes represent the number of years counted from the surface.
2.2.1 Annual layer counting
Annual layer counting (Figs. 2 and 3) was performed on stable water isotope ratio and chemical data plotted on a depth scale. The MATLAB programme Matchmaker was used for plotting multiple records together from the SI:RAID data and a nearby 20 m long Sherman Island ice core (hereinafter referred to as SI:Core). Matchmaker was used to identify corresponding peaks and troughs, place markers and adjust the age scale accordingly (Rasmussen et al., 2013; D. R. Tetzner et al., 2022; Tetzner et al., 2021). The species used consistently throughout annual layer counting were deuterium (δ2H), methanesulfonate (MSA−), sulfate () and sodium (Na+). These species typically have highest values during the austral summer (December to February) because δ2H responds primarily to temperature and and MSA− are related to marine bio-productivity, both of which peak in the summer (Turner et al., 1995). The relative contribution of Na+ seasonally to the ice appears to be inconsistent at Sherman Island, with some years seeing summer peaks corresponding to clear summer signals in the δ2H record and other years showing winter peaks. This variability could reflect the local geography of Sherman Island, which is close to open-water sea salt contributions in the summer and is then closely surrounded by salt-producing sea ice in the winter, with potential contributions from the nearby Pine Island and Amundsen Sea polynyas (Tetzner et al., 2019). The contribution of Na+ to the ice core site could therefore be dependent on wind direction and circulation patterns rather than seasonality. Counting was therefore supplemented with the ratio in places where the seasonality of Na+ was unclear.
Annual age markers from the SI:Core were used to add summer-to-summer reference points in the top 20 m of the RAID data to aid with the layer counting. The SI:RAID data show similar absolute concentrations to the SI:Core and closely match the annual variability throughout much of the 20 m but with less well-defined peaks because of the lower depth resolution (Fig. 2). Using the spacing of the annual layers in the top 20 m, with the SI:Core as a guide, the counting was continued to 70 m, using the same technique as for the top 20 m but without the assistance of the SI:Core data. It is possible that annual layer counting could have been continued below 70 m. However, the regular variations, which arguably are still of seasonal origin, are difficult to distinguish from variability caused by other factors. In particular, seasonal variability in δ2H becomes limited below this depth. The regular peaks and troughs that are indicative of seasonal variations are typically formed from fewer than four data points below 70 m, meaning that annual layer counting below this point cannot be considered robust. Annual layer counting data (summer peaks) are available in the Supplement (Sect. S1).
2.2.2 Modelling ice thinning and a priori estimate of depth–age
Using the age scale for the top 70 m from annual layer counting, it was possible to estimate the age of deeper samples. This estimate was done in combination with an ice thinning model. Details about the model can be found in Martín et al. (2015), but here we summarise the main equations for convenience. The model neglects horizontal advection and calculates age A at a given depth d and time t as a function of the vertical velocity w, as shown in Eq. (1):
where H is the ice thickness, A0 is the initial depth–age, and t0 is the time before the present t=0.
We further assume that in the vertical velocity we can separate the time- and depth-dependency and that there is no basal melt or variation in ice thickness with time. The assumption of no basal melt is based on the estimated basal temperature at Sherman Island of −6 ∘C from borehole temperature measurements (Mulvaney et al., 2021). The vertical velocity can be then written as shown in Eq. (2):
where ρ is the density that is assumed uniform in time, ρi is the density of ice, a is the time-dependent annual accumulation, and η(d) is a function of depth, often referred as the shape function that varies between 0 at the bed and 1 at the surface. For the shape function, we use two extreme approximations. For one extreme, we use Lliboutry (1979), as seen in Eq. (3):
where p is a parameter. The Lliboutry approximation reproduces the ice flow dominated by shear well (Martín and Gudmundsson, 2012), and we use it to simulate ice thinning at the “flanks” of the ice flow divide. The term flank describes the flow located more than a few thicknesses away from the ice flow “divide”, which is often located near the ridge perpendicular to the ice flow (Fig. 1c). For the other extreme, to represent ice flow divide conditions, we use the numerical output at the divide from the full field model of Martín and Gudmundsson (2012).
For our a priori depth–age model, we assume that the accumulation rate is proportional to that of WAIS Divide (Sigl et al., 2016), using the present values of annual accumulation rate at Sherman Island estimated from annual layer counting. Our hypothesis is that the flow conditions can be bounded between a divide flow and flank flow with p = 3. The results for the depth–age estimation from both extremes are shown in Fig. 5. The annual layer counting (yellow markers in Fig. 5a) aligns more closely with the depth–age model for flank–flow conditions than divide–flow conditions with the bottom of the annual layer counts. We therefore use the flank–flow depth–age model to guide us in dating the deeper samples, as described below.
2.2.3 Volcanic horizon identification
The records of chemical species were closely inspected for signatures of volcanic events, as explained below. Based on the a priori depth–age model, an average annual layer thickness of 87 cm is found in the top 70 m, and with a 19 cm average sample resolution, samples should continue to be on an annual, or greater, resolution until at least 250 m depth. Assuming that the imprint of volcanic events is recorded in the concentration at Sherman Island, the age resolution of the samples is therefore sufficient for resolving individual volcanic events.
Large volcanic eruptions emit sulfurous gases such as sulfur dioxide (SO2) and hydrogen sulfide (H2S) into the atmosphere, which are oxidised and precipitated onto the ice sheets in the form of , leaving a peak in the concentration of the ice layer (Delmas et al., 1985). Matching volcanic peaks in the record of ice cores with known volcanic events provides an age constraint at certain depth intervals (e.g. Udisti et al., 2004; Parrenin et al., 2012; Severi et al., 2012). The Sherman Island drill site is only 440 m above sea level and located very close to the open ocean. The record is therefore dominated by marine biogenic and sea salt sources, making volcanic peaks more difficult to identify. The total concentration was split into its sea salt (ss) and non-sea-salt (nss) components to aid the identification of volcanic peaks, according to Eqs. (4) to (8).
with
and
where Rm and Rt are the sea salt and continental ion mass ratios, respectively, and Rs is the sea salt ion mass ratio for . Values of 1.78, 0.038 and 0.25 were used for Rt, Rm and Rs, respectively (Röthlisberger et al., 2002; Bigler et al., 2006). As described in Rowell et al. (2022), to make the best use of the Ca2+ data while avoiding contaminated or missing data, the Ca2+ data points for the first sample in each drop of the drill (which is generally contaminated) were replaced with the mean of the rest of the drop. This correction enables the use of the Ca2+ record to obtain ssNa+ and, subsequently, apportionments.
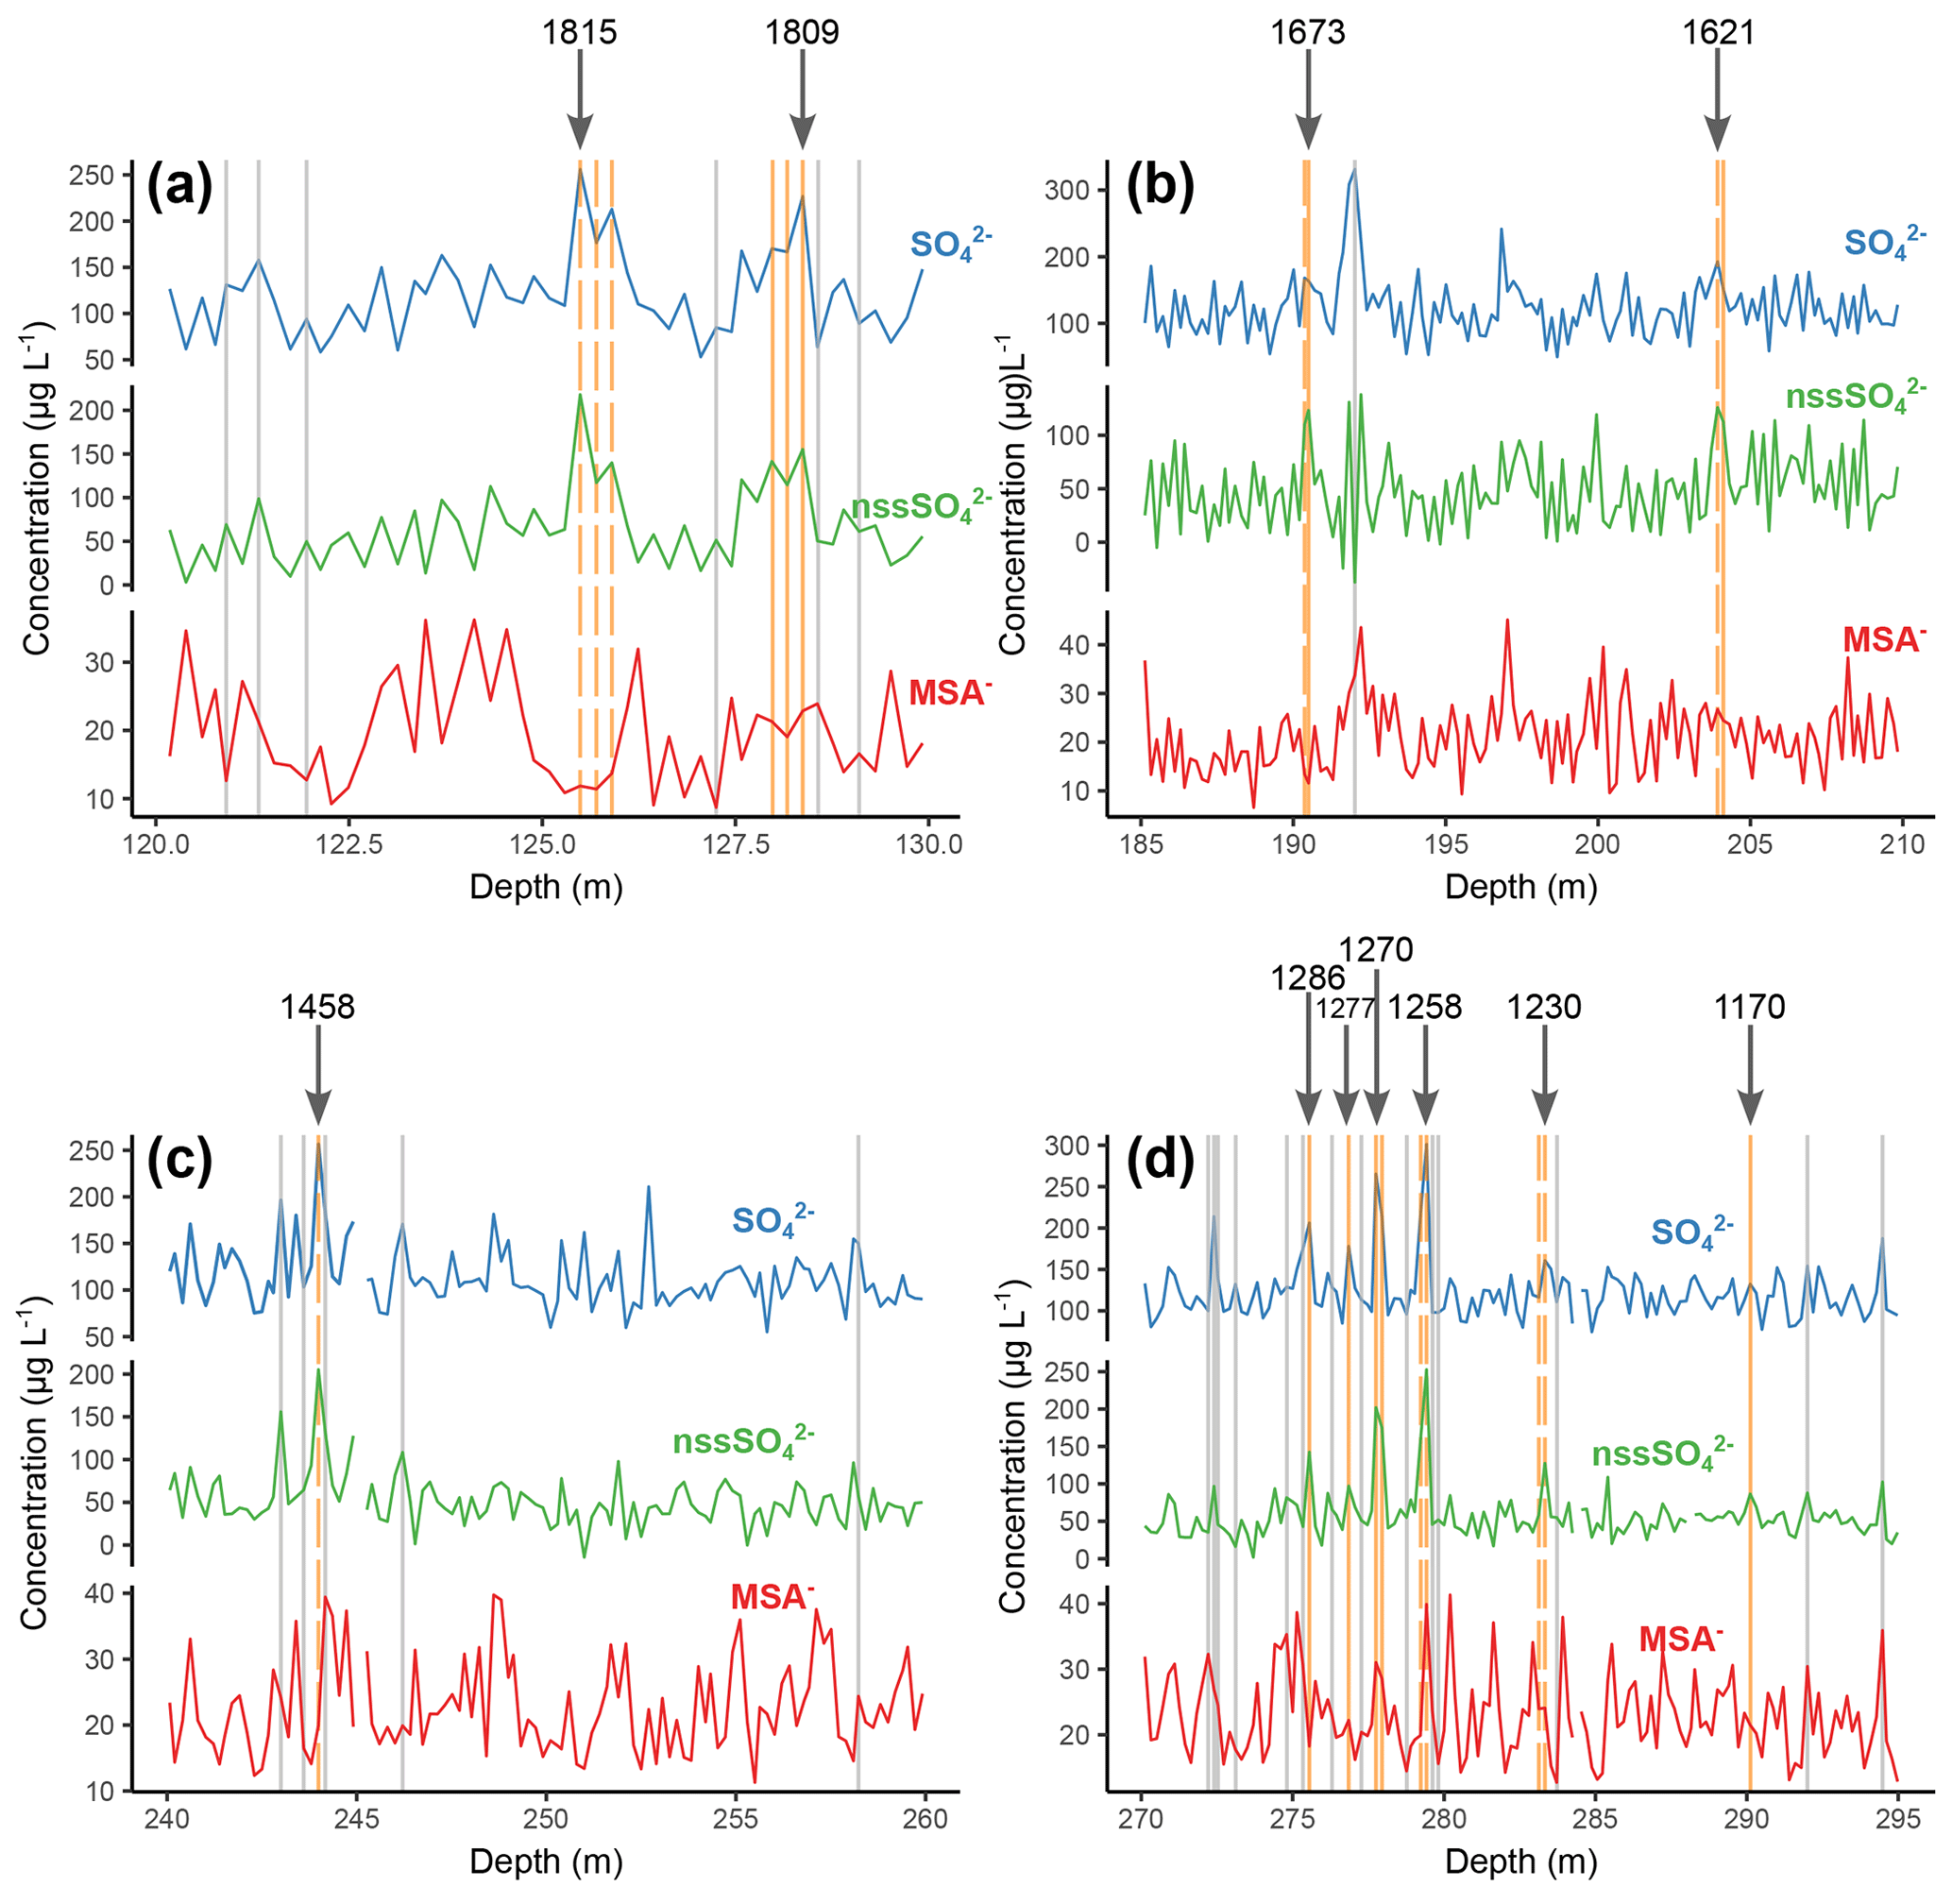
Figure 4Identification of potential volcanic markers. The vertical lines show candidate peaks in the record that were analysed for S isotope compositions. Grey lines show the depths of samples that had background, non-volcanic S isotope compositions; yellow lines show the depth of samples that had low δ34S values, indicative of volcanically derived ; and dashed lines show volcanic peaks of stratospheric origin, as defined by non-zero Δ33S values. Panels (a–d) show the discrete depth ranges in which the identified volcanic markers appear. Arrows and numbers show the year of the identified event (CE).
The concentrations of MSA−, and were plotted together (Fig. 4) to identify potential volcanic peaks in the record. MSA− is used to corroborate the record by providing a reference record of purely marine biogenic origin so as to assist in the identification of peaks that are not related to fluctuations in marine inputs (Saigne and Legrand, 1987). Several eruptions known to have left a signal in the records of multiple ice cores from across Antarctica were targeted. Multiple viable peaks in the record, including some not related to these targeted events, were identified in approximately the expected depth range for these events, as estimated from the initial age–depth model. Due to the relatively high background concentration of in the SI:RAID samples, S isotope analysis was used to identify peaks that have a volcanic source, which increases our confidence in identifying specific volcanic events in the data.
Sulfur (S) has four stable isotopes, namely 32S, 33S, 34S and 36S, which have natural relative abundances of 95.02 %, 0.75 %, 4.21 % and 0.02 %, respectively. Volcanic emissions have isotopically light S compositions (i.e. relatively depleted in the 34S isotope) compared to other dominant inputs of from marine biogenic emissions or sea salt (Rees et al., 1978; Nielsen et al., 1991; Patris et al., 2000; Crick et al., 2021). As such, the Δ34S values (Eq. 9) recorded in ice can be used to determine peaks in that have a volcanic source. The relative difference between the δ34S and δ33S values and the ratio expected from equilibrium fractionation is expressed using Δ33S notation (Eq. 10; in ‰). Values of Δ33S that are outside the analytical error of zero show mass-independent fractionation (Farquhar et al., 2001). Mass-independent fractionation of S isotopes occurs when sulfur dioxide gases are photo-oxidised to by short-wave UV radiation (Savarino et al., 2003). This process only occurs above the ozone layer, meaning that non-zero Δ33S values indicate volcanic eruptions where the eruptive plume reached the stratosphere (Gautier et al., 2019; Burke et al., 2019).
where x is either 34S or 33S, and the values are reported relative to the Vienna–Canyon Diablo Troilite standard.
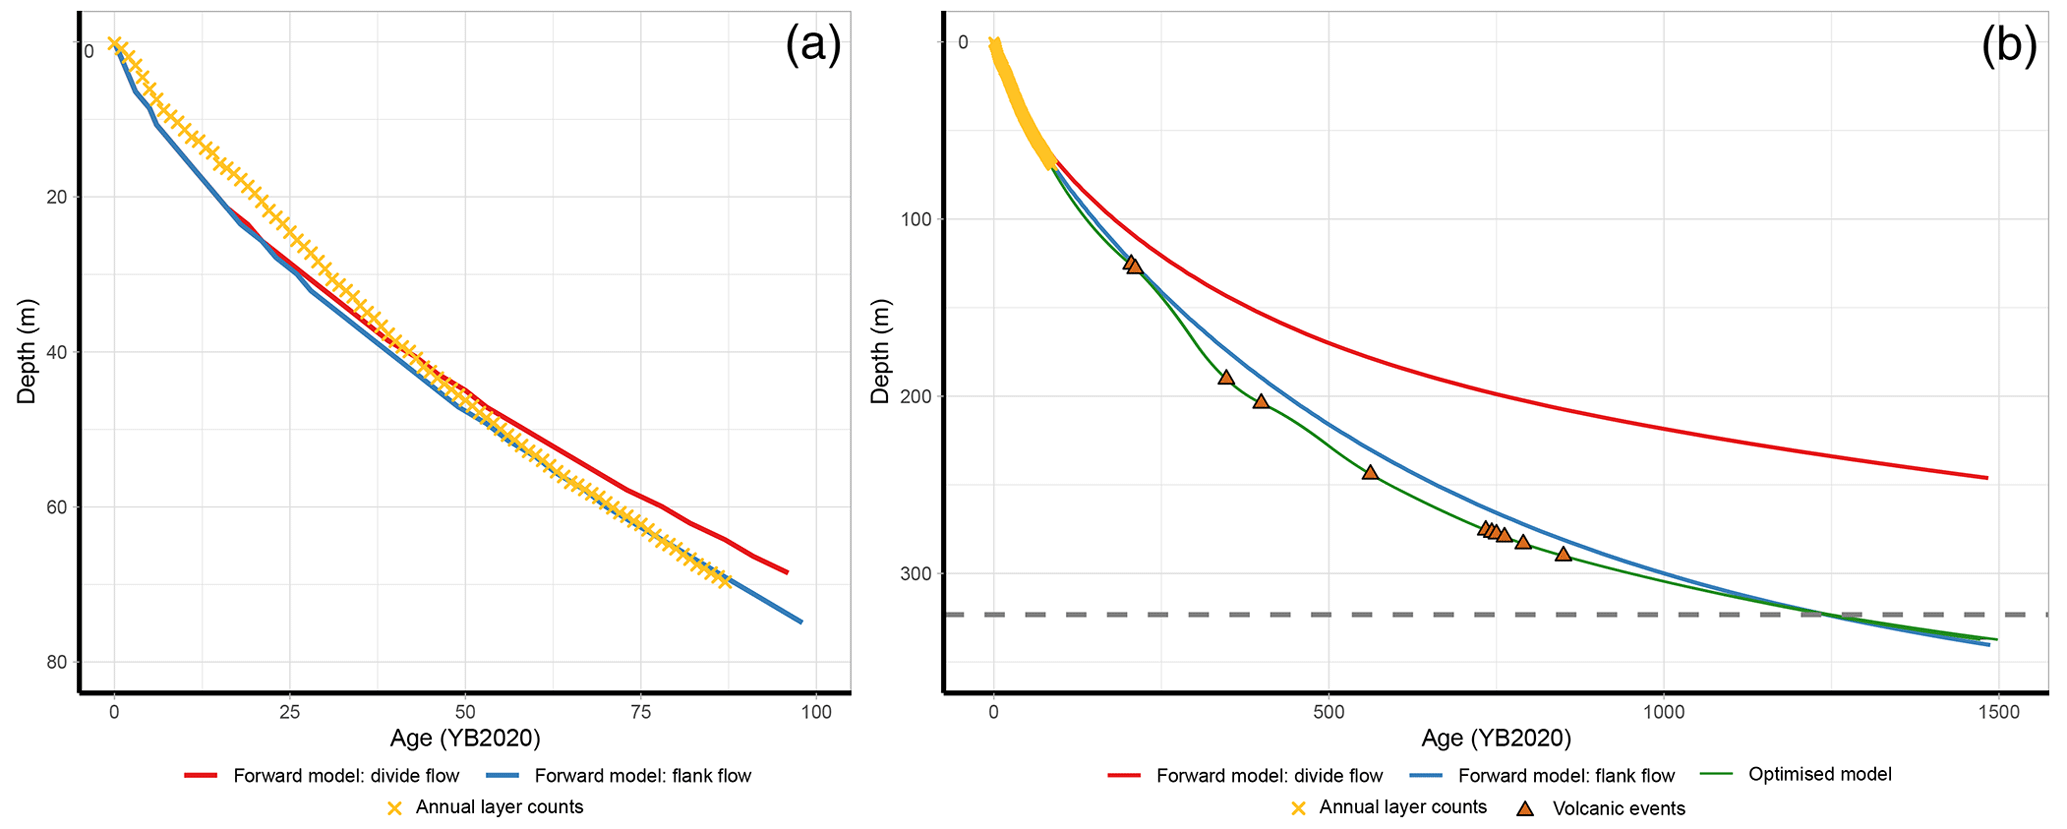
Figure 5(a) Depth–age from the forward model of ice thinning, showing the divide flow (red) and flank flow (blue), with annual layer counts (yellow crosses). (b) Original model flank flows and divide flows (red and blue lines; same as in panel a) and optimised model simulations (p = 1 to 4; green line) showing the tie points of annual layer counts (yellow crosses) and volcanic tie markers (brown triangles). The dotted grey line shows the bottom of the borehole and drilled ice.
A total of 75 samples from Sherman Island were analysed for their S isotope composition, using the method described in (Hoffmann et al., 2022), and 11 individual volcanic eruptions were identified (Fig. 4). Peaks in the record defined as being volcanic had δ34S values ranging from 0.2 to 16.18 ‰ (mean = 11.18; σ = 4.37; n = 20), whereas background samples had δ34S values ranging from 16.05 to 20.33 ‰ (mean = 18.23; σ = 0.95; n = 55). Δ33S values were considered to indicate stratospheric eruptions if they were greater than 0.15 or less than −0.15 ‰. All S isotope data are provided in the Supplement (Sect. S2). Through a combination of comparisons with the modelled age (Fig. 5b), assessing the relative depth–age difference between eruptions and cross-checking against previously identified volcanic eruptions in Antarctic ice cores, the eruptions were dated. The peaks are believed to correspond to the eruption of Tambora in 1815, an eruption of unknown origin in 1809, an eruption in 1458 (possibly Kuwae), five eruptions in the 13th century (including Samalas; sequentially in 1286, 1277, 1270, 1258 and 1230), eruptions in 1621 and 1673 and an eruption of unknown origin in 1170 (Sigl et al., 2014). Several eruptions were defined by multiple samples and show the evolution of δ34S and Δ33S values during an eruptive event. Samples that had non-volcanic S isotope values were also measured between every volcanic event to allow for precise depth assignment and ensure that multiple eruptions were defined by separate peaks. A total of 11 eruptions were used for the final the age–depth interpolation, as described below.
2.2.4 Model optimisation and final depth–age interpolation
The deepest fixed-age marker attributable to a known volcanic event is at 290 m depth (year 1170 CE). To date the remaining 33 m of ice samples and remaining ice below the drilled depth, we use a depth–age model that assimilates age markers and optimises the past accumulation rate and ice flow parameters. The depth–age model is the result of an optimisation. We use a model that is identical to the one described in Sect. 2.2.2, but we find the values of accumulation rate variation a(t) that provide a best fit between the model and the age markers. We assume that the accumulation rate history, a(t), is a piecewise linear function and use multiple values for p, ranging from 1 to 4, to simulate the so-called flank flow. Under these assumptions, we optimise the model using the simplex method from Lagarias et al. (1998), as coded in the fminsearch function of MATLAB. The results of the depth–age optimisation are shown, alongside the original model, in Fig. 5b.
The model optimisations using accurately captured the age of the volcanic tie points to within the uncertainty resulting from the discrete sample depth range. The selection of points for accumulation rate to change within the age–depth optimisation model introduces a source of error; this is because although the tie point locations necessitate a shift in the accumulation rate, the exact timing of this change is unknown. This is the reason for assigning a relatively high uncertainty to the age–depth model (10 %; described below) and for using the mean of the flank age–depth relationships as the final interpolation beyond annual layer counting. The annual layer counts were used for interpolation of the age scale for the top 70 m. Below this depth, the mean of these optimisation simulations was used as the final age scale, with the range of values used for defining the age-scale uncertainty (described below). Due to the high resolution of the annual layer counts and model simulations, a simple linear interpolation between all points was assigned to each sample, with a top and bottom age associated with the top and bottom sample depths.
2.3 Radar data processing
The radar echogram (Fig. 1c) was obtained using a Multichannel Coherent Radar Depth Sounder (MCoRDS; Rodriguez-Morales et al., 2014) from the DC-8 IceBridge flight over Sherman Island on 16 November 2018 (ID IRMCR2). A larger aperture angle (115∘) was used in SAR (synthetic-aperture radar) processing by the CReSIS toolbox to recover and enhance the echoes from the ice layers at the ice divide (Paden et al., 2021). The echoes from these layers were missing or weak due to the slope effects (∼ ± 10∘) in the echogram from the routine processing, which used an 18∘ full aperture angle. The data were decimated along-track after SAR processing by a factor of 26, using the average of the 51 range lines centred around the output range line, and thus resulting in 6.5 m between two neighbouring range lines. The radar echogram was detrended using multiple polynomials to display the ice layers more clearly. The length of the echogram is ∼ 8.6 km and is displayed relative to the summit (starting point 72.6132∘ S and 99.8208∘ W; endpoint 72.6895∘ S and 99.8576∘ W), with an average aircraft altitude of 380 m above the ice surface. The ice thickness at the summit is ∼ 419 m, assuming that the ice dielectric constant is 3.15. The traced ice surface and bed interface are delineated by blue and red lines, respectively. The strong interface close to the ice bed under the summit that follows the surface topography is the multiple reflections on the surface.
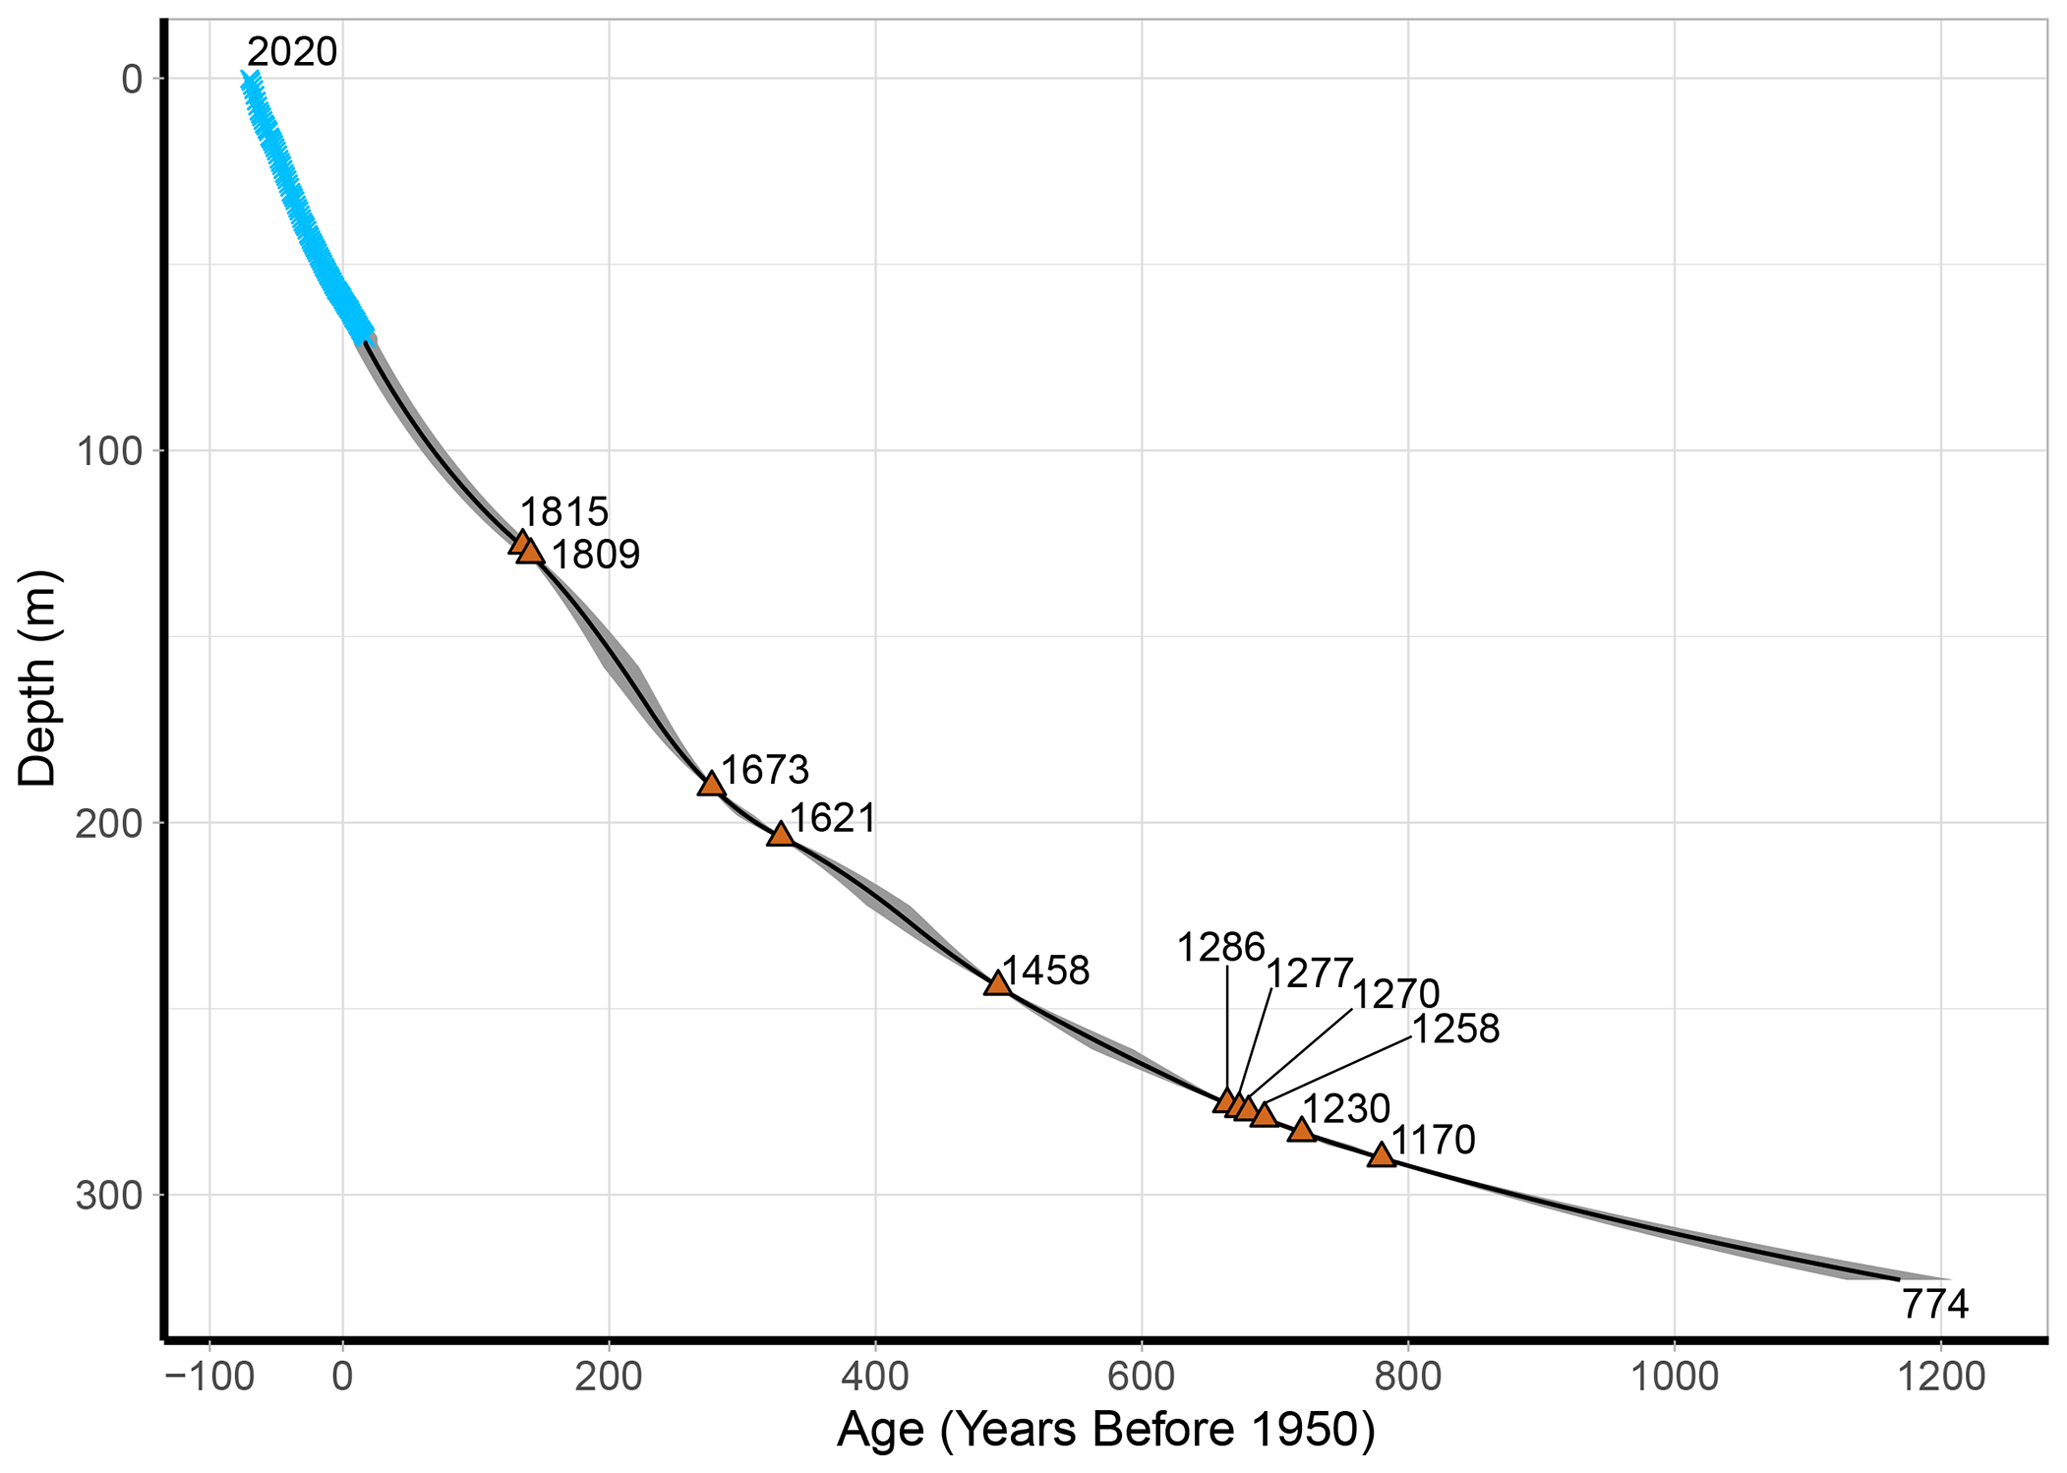
Figure 6The SI:RAID age scale (black line) shown with the respective age markers (blue crosses are annual layer counts; filled orange triangles are volcanic events) used in its development. Grey shading indicates the uncertainty.
3.1 Age scale and uncertainty
The depth–age profile, with uncertainty limits, of the SI:RAID data is shown in Fig. 6. The depths and ages presented represent the bottom of each sample, unless specified otherwise; the full age-scale data set with top and bottom depths and ages can be found in the Supplement (Sect. S2). The 323 m record of ice samples reaches an age of 1176 years before 1950 or the year 774 CE (± 41 years). The age profile follows the idealised glacial flow closely, with small adjustments in the accumulation rate necessary to satisfactorily intercept every known age marker, as discussed below. The maximum absolute uncertainty in the whole record is 41 years at 323 m, with a percentage uncertainty of 3.3 % of the total age at that point. An uncertainty estimate was calculated for the annual counts, each volcanic tie point, the mid-points between each tie point and, finally, for the model interpolation point, as described below.
The uncertainty associated with the annual layer counting was estimated using the SI:RAID and SI:Core annual counts together to assess the presence or absence of uncertain annual layers. Peaks present in some species in the SI:RAID data which were not identified in the SI:Core data (or vice versa; shown by yellow bars in Fig. 2) indicate uncertain years. There were 2 uncertain years out of 21 counted years for the top 21.8 m (when the SI:Core data end), leading to an uncertainty of 9.5 %. A 10 % uncertainty was therefore applied throughout the section that was annually counted in the SI:RAID data (to 70 m).
For the volcanic tie points, we are confident about the identified volcanoes and the timing of their eruptions. Uncertainty at the tie point comes only from the depth interval of each eruption and its corresponding range of ages. Some of the identified volcanic events are recorded in the record over multiple samples. When this was the case, the sample with the highest concentration was chosen as the year of the event. Based on interpolation of the age scale to the point of each volcanic event, the age interval of that sample (and surrounding samples) was calculated. This gives an uncertainty for each volcanic tie point.
Table 2Estimates of age uncertainty for every tie point used in the SI:RAID age-scale interpolation and the mid-points between them (to the nearest sample). Ages are given in the year (CE) rounded to nearest year.
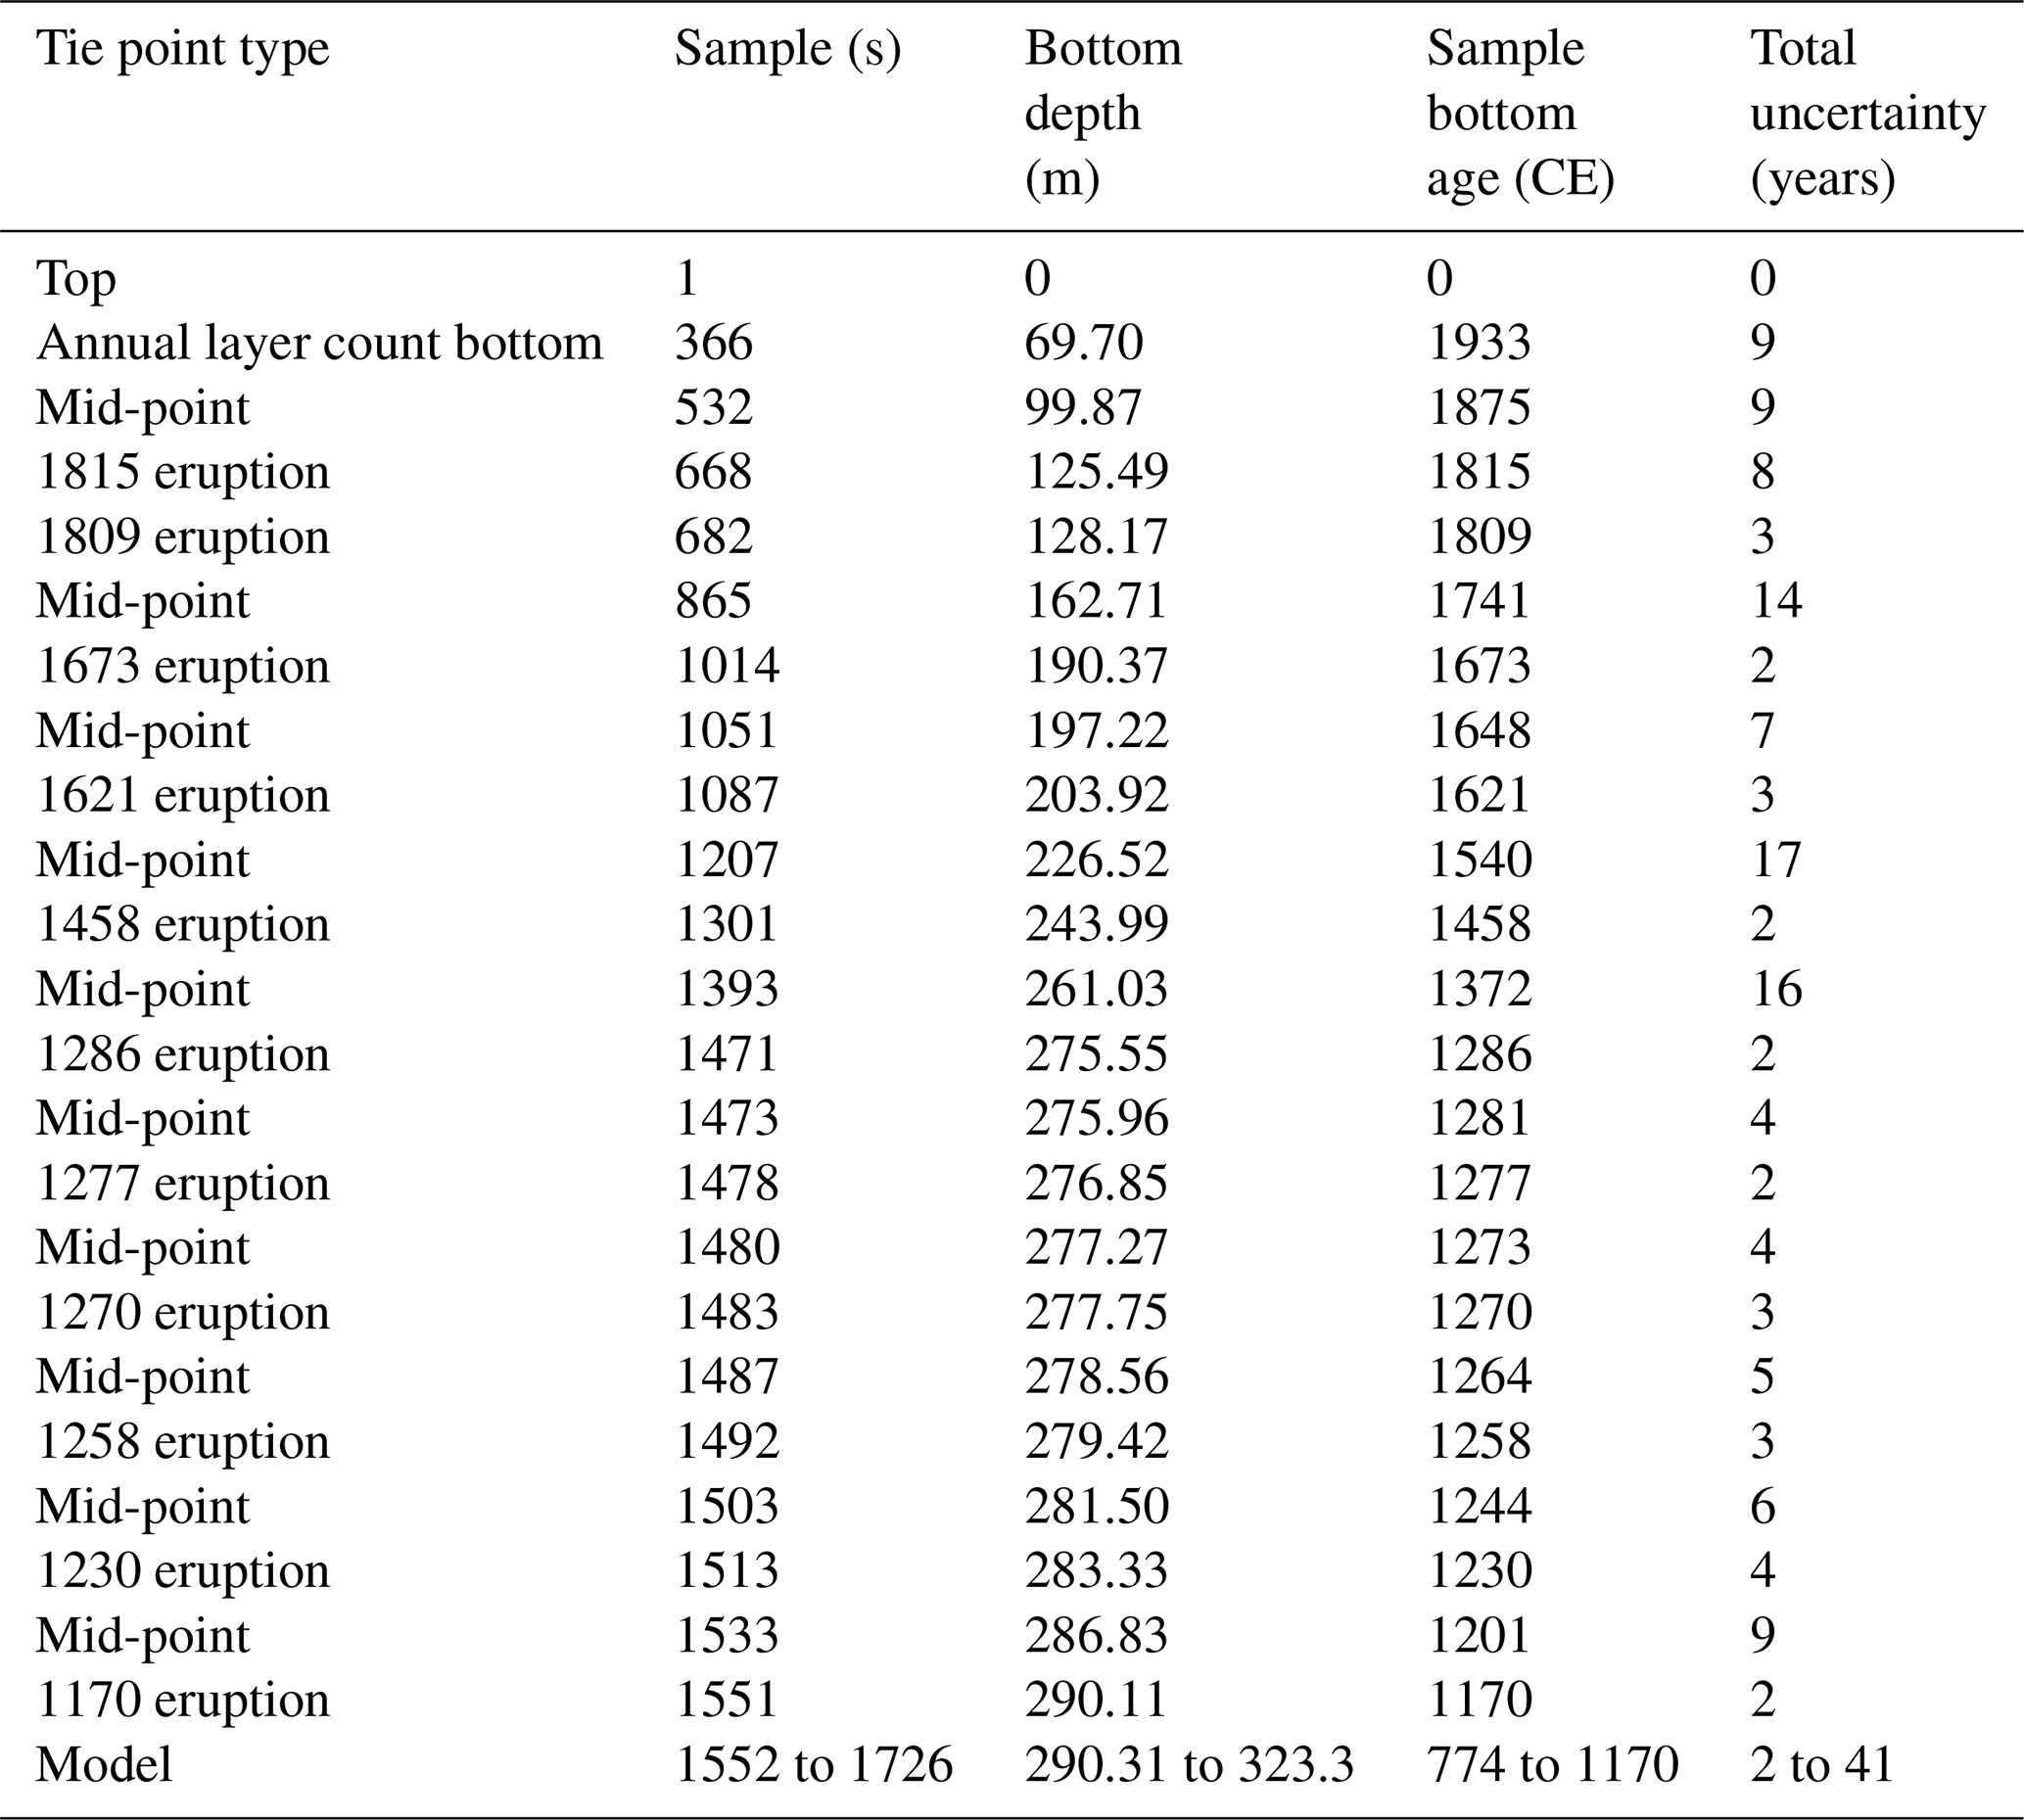
The optimised model age–depth fits through the volcanic tie points, as it was designed to do, within the uncertainties described above. An estimate of the uncertainty for the remaining age scale is derived from the relative difference in age between the models run with different p parameters at 90 % depth, which is approximately 10 %. A 10 % uncertainty from the previous tie point is therefore applied to the mid-points between the tie points and added to the average uncertainty at the two adjacent ties (Table 2).
The age-scale uncertainty was interpolated to every sample, using a linear interpolation of the error between the points shown in Table 2, up to the last tie point (volcanic at 1170 CE). For all samples below this depth, the model uncertainty (10 %) was applied as a percentage relative to the age difference from the final tie point (1172 CE) and added to the uncertainty at that tie point. All uncertainty values are shown in Table 2. The age scale (limited to the sample bottom depths and ages) is provided in the Supplement (Sect. S3).
3.2 Prediction of age near the bedrock
Predicting the age of the 105 m of ice below the bottom sample depth, where the drill was lost, is more uncertain. The optimisation model was used to estimate the age of the ice towards the bed at the SI:RAID drilling site; however, in the deepest ∼ 5 %, model outputs are highly dependent on input parameters and thus unrealistic. This is because in our depth–age model we assume no basal melting, and the solution to Eq. (1) is that the age of ice at the bottom tends to infinity. Numerically, this translates into a solution at the bottom that depends on the numerical details used, which are mainly the unknown initial conditions. Instead, we use, as a conservative estimate, the age at 90 % depth (∼ 385 m). For the existing SI:RAID site, assuming that the accumulation rate varies approximately within modern values and relative to WAIS Divide prior to 774 CE, it is likely the age at 90 % depth is between ∼ 3.1 and 3.4 ka, extending to approximately 6 to 7.1 ka at 95 % depth (∼ 406 m). Our expectation is that the depth of older features, such as the early Holocene or Last Glacial Maximum (LGM), if present, are likely of the order of a maximum of a few metres above the bed.
A final attempt to locate older ice on the island used the accumulation rate histories as calculated for age–depth simulations of the SI:RAID site. The piecewise values of a(t) (Eq. 2) are used as input for the age–depth optimisation, with age–depth tie points removed and p = −1 (in practice −0.99) to assume divide flow conditions, as described in Sect. 2.2.2. To test the impact of the maximum age given to the model, two values (150 and 25 kyr) were used. The results are shown in Fig. 7.
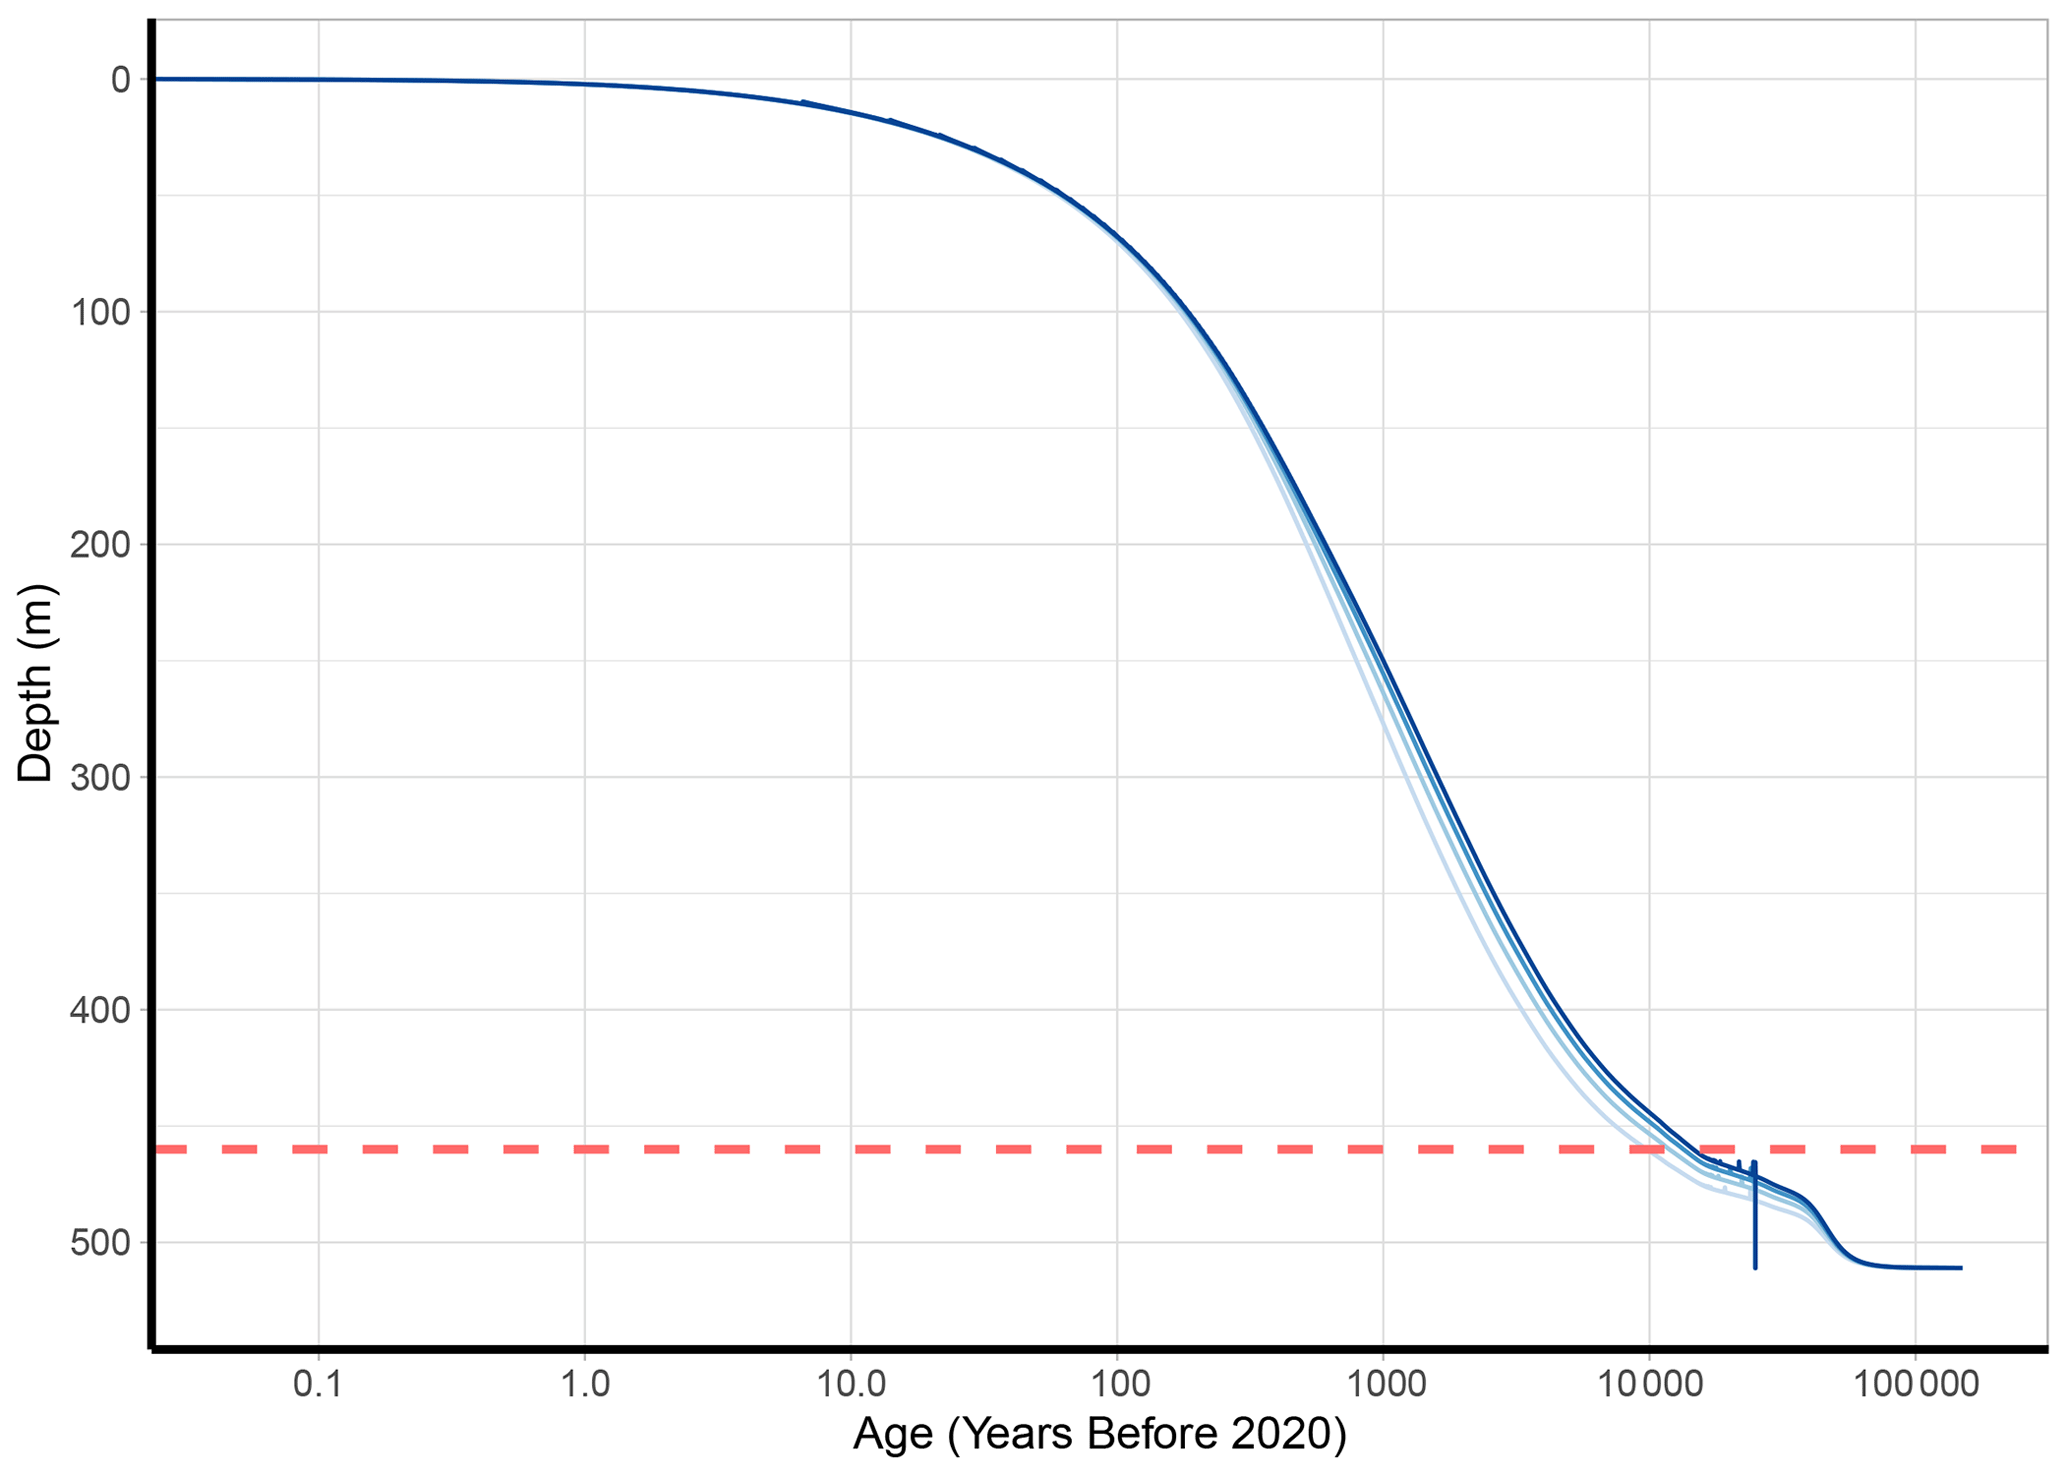
Figure 7Ice thinning model predictions of ice age at the deepest point (“summit”) of Sherman Island (80 m deeper than the SI:RAID site) for a divide flow regime (p = −1). The different lines are the simulations resulting from smoothed estimates of the accumulation rate from age–depth modelling at the SI:RAID drill site. The simulations assume an identical accumulation history, based on four flank flow regimes from the SI:RAID site (p = 1 to 4; light to dark blue; Eq. 3). Two maximum input age parameters were compared, namely 25 kyr (dashed lines) and 150 kyr (solid lines); they are identical until ∼ 20 ka. The dashed red line shows the 90 % depth (460 m) discussed in Sect. 4.2, which was used as the cut-off point due to unrealistic age–depth below this point, as discussed in Sect. 3.2.
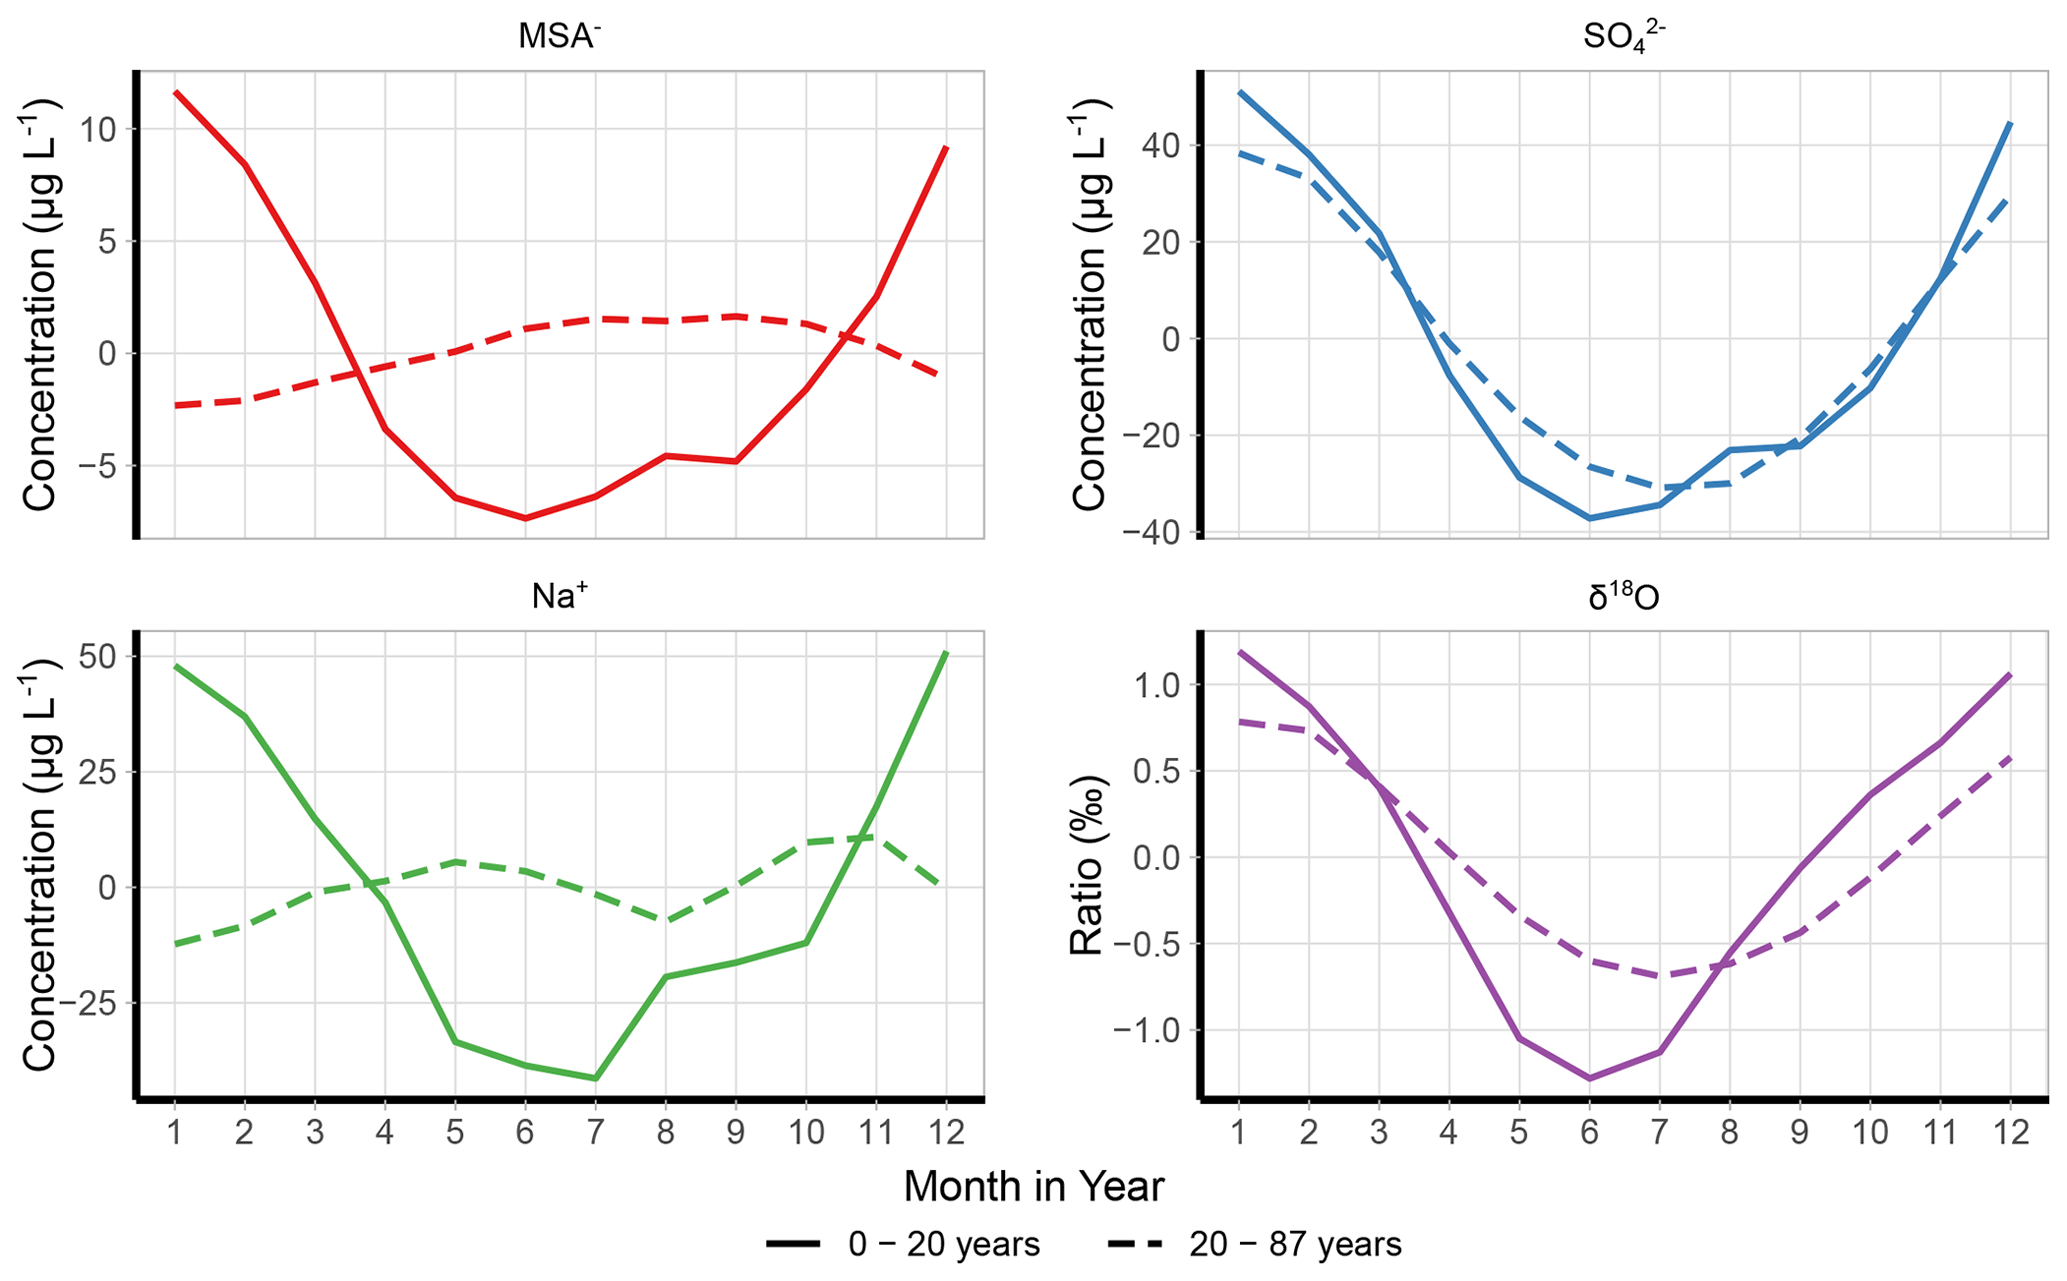
Figure 8Seasonality of certain chemical species and stable water isotope composition. The x axes show the month of the year (1 is January; 12 is December), and the y axes show the anomaly concentrations or composition of the species relative to the annual mean. Line types are for the shallow dated section (0 to 20 m) and annual layer counted section (20 to 70 m).
3.3 Seasonality of chemical species
The species used for annual layer counting were interpolated to monthly resolution for their entire records. Monthly mean anomaly concentrations, relative to annual means, were then calculated to investigate the seasonality of species with depth, using methods similar to Hoffmann et al. (2022) (Fig. 8). All species show strong seasonality in the top 20 years, which were annually counted alongside SI:Core. and δ18O demonstrate this continued seasonality consistently to 70 m (annually counted). MSA− also demonstrates a seasonal pattern throughout this period but with a changed seasonality from a summer peak to a slight winter peak, in line with Na+. This migration of the MSA− peak has been well documented in ice cores, and in the SI:RAID samples begins at approximately 30 m, with inconsistent seasonality in peaks for 15 m followed by consistent winter peaks (corresponding with troughs in δ2H) by 46 m depth (Osman et al., 2017; Pasteur and Mulvaney, 2000; Curran et al., 2002).
4.1 Dating methods
The Sherman Island RAID samples present a relatively low-resolution ice core record due to the sampling restraints to keep cargo minimal. The samples average 19 cm depth resolution, with age increments ranging from 0.04 to 2.38 years and an average of 0.7 years. This presents a challenge for ice dating compared to other ice cores; traditional ice cores can be sampled and measured at any chosen resolution, typically of the order of a few centimetres or fewer for continuous flow analyses of shallow- to intermediate-depth ice cores. Considering this limitation, the ice from Sherman Island has been dated relatively robustly from a combination of approaches that are widely used in ice core analysis, with the necessary accommodations made for the lower-resolution samples compared to traditional ice cores. For example, annual layer counting was only possible to a relatively shallow depth (70 m; 85 years), at which point it was deliberately cut off to prevent the dubious counting of non-annual variations. In comparison, the WAIS Divide and Skytrain ice cores are annually dated to 31.2 ka (2850 m) and 1942 years (184.14 m), respectively (Sigl et al., 2016; Hoffmann et al., 2022). Furthermore, annual layer counting was aided by comparison with a short but very proximal firn core with higher-resolution measurements; the SI:Core was sampled at 5 cm resolution, as compared with the average of 18 cm for the corresponding depth range of SI:RAID (21 m). The existence of such a close ice core for comparison and for assisting with the dating strategy is not a common occurrence in deep-ice-core drilling. This proximity is valuable because two such closely located ice cores should not have age scales which significantly deviate from each other, due to experiencing similar accumulation histories. Furthermore, despite the distance of ∼ 3 km between them, in the top 20 m, thinning and horizontal ice flow are insignificant, as evidenced by the agreement of their records in Fig. 2.
Volcanic synchronisation of ice core records and dating of individual ice cores using volcanic event identification using the data of cores is a standard ice core dating technique (e.g. Fujita et al., 2015; Narcisi et al., 2006; Palmer et al., 2001; Severi et al., 2017, and others). In this case, peak identification was supplemented with S isotope analysis, giving more confidence that, first, some of the peaks identified were of volcanic origin and, second, that their isotopic characteristics matched those of the expected volcanic eruption being used to assign an age horizon for its respective depth. Being confident in the eruptions identified meant that the uncertainty in those age horizons was effectively zero, making it equivalent only to the estimated age increment covered by the sample depth due to the necessarily low sampling resolution.
Finally, the use of an ice thinning model that allows the accumulation to vary in order to fit through empirical tie points resulted in a more realistic estimate of the age–depth relationship. This optimisation also enabled the interpolation of an age estimate for the bottom-most sample, which would have been difficult to date in any other way, thereby allowing an age scale for the full range of SI:RAID samples to be developed. The model also helped to calculate the age-scale uncertainty. Further use of the model is discussed below.
4.2 Deepest ice: is it possible to find a continuous record beyond the Holocene in Sherman Island?
Is it possible to find a continuous record beyond the Holocene in Sherman Island? To answer that question, here we discuss the influence of local ice flow on depth–age. The ice flow near a ridge can be characterised by the proximity to the divide of flow, which is the vertical plane where ice starts flowing towards the opposite flanks of the ridge that is often located near the ridge (Fig. 1). This is a result of the ice having non-linear rheology (Raymond, 1983/e). Some distance from the divide, which is only a few ice thicknesses, flow is dominated by shear, and it is well represented by the Lliboutry approximation, with the parameter p larger than 1. At the divide, however, the lower strain rates near the bed and the non-linearity of ice translate into nearly stagnant ice. These local flow conditions have a strong influence on depth–age, as shown in Figs. 5 and 7. Intriguingly, it is clear that the depth–age ratio at SI:RAID better fits the flanking flow model, and under no reasonable assumptions of past accumulation is the forward-divide flow model able to fit the observed age markers. Furthermore, the optimised age model fits the tie points well for , demonstrating that the SI:RAID site is located at the flanks of the ice divide. However, if we were to find a site in Sherman Island at a divide of the flow, we hypothesise that, based on the estimated bottom age of the ice at the SI:RAID site, the age of the ice toward the bedrock would likely reach the early Holocene (Fig. 7).
The echogram from IceBridge data over the ridge near the drilling location (Fig. 1b and c) shows that such flow conditions could exist on the opposite side of the ridge in relation to our drilling site. This is because the low-strain rates near the base at the divide flow manifest conspicuously as arches in the ice structure (Vaughan et al., 1999).
Another potential drilling site on the island is near the summit, where the ice is thicker. Near the summit, the ice is approximately 80 m deeper than the SI:RAID site. Our model estimates that, assuming identical accumulation histories (taken from the modelled accumulation for from the SI:RAID site age–depth optimisation), under divide flow conditions (p ≈ −1), the age at 90 % depth (459 m) is ∼ 9.7 to 16.5 ka (Fig. 7). These values are dependent on the accumulation rate values given to the model, which are in turn a consequence of the assigned p parameter (flow regime) in the optimisation. This is evident in Fig. 7; the higher the p value (in this case, the accumulation rate taken from the corresponding optimisation model with p assigned between 1 and 4), the lower the accumulation rate and therefore the older the ice at the same depth. Figure 7 also demonstrates the susceptibility of the model to the maximum age input as a parameter; the outputs set to 25 and 150 kyr follow identical age–depth relationships until approximately between 90 % and 95 % depth, when rapid and unrealistic ageing occurs, which is necessary for the model to reach its assigned maximum age. The agreement of both simulations (in terms of the maximum age supplied) until this point does, however, give more confidence to the conclusion of a Holocene ice core (or longer) being obtainable from Sherman Island.
4.3 Insights from the SI:RAID age scale
Bringing together our findings, we finally consider the significance of the SI:RAID age scale in a broader context. From the annually dated samples, we estimate an average modern (last 80 years) annual accumulation rate at Sherman Island of 60 cm water equivalent (standard deviation, SD, is 12 cm), compared with the Regional Atmospheric Climate Model (RACMO) estimate, used for site selection, of 47 cm weq (SD 6 cm; Mulvaney et al., 2021). From the model optimisation, allowing the accumulation rate to vary at set points to enable the fitting of the known tie markers, the range of annual accumulation rates was between ∼ 46 and 110 cm weq. Measured accumulation rates at Sherman Island are thus both higher and more variable than those calculated by RACMO. This is a significant finding, given that the efforts to reconstruct regional and continental accumulation rate histories are often heavily dependent on data assimilation techniques, including the use of reanalysis products such as RACMO and ERA reanalyses (Wang et al., 2017; Thomas et al., 2017; Stenni et al., 2017). Furthermore, in the above studies, the Sherman Island region and coastal WAIS are poorly represented due to a lack of ice cores in this data-sparse region. The records from Sherman Island are therefore an important contribution to wider reconstructive efforts (e.g. Neff, 2020). The age scale presented here is robust enough to permit palaeoclimatic reconstruction using the SI:RAID data, despite its lower-than-average ice core resolution, which is the primary limitation of RAID records. The lack of annually resolvable cycles extending significantly beyond the reanalysis period (∼ 40 years for this region), and the relatively low ice sheet thickness limit the length of an empirically derivable record of the accumulation rate. The modelling performed for the Sherman Island summit location indicates that an ice core might not only extend back substantially further in time (thousands of years) but would also be more highly resolvable. Further investigation of the simulations indicates the potential for seasonally resolvable variations to 0.7 to 1 ka, with an annual resolution to at least 2 ka by assuming an analytical resolution of 5 cm or greater. By 90 % depth, the annual layers are approximately 3 mm thick.
An age scale for the SI:RAID samples, which extends back to more than 1.17 kyr BP and is currently the longest ice core from the coastal West Antarctic and western Antarctic Peninsula regions, has been presented. The use of chemistry data and S isotope measurements on SI:RAID-drilled ice to establish an age scale is presented here for the first time, in addition to stable water isotopic measurements. The SI:RAID data will make a valuable contribution to regional, continental and global compilation projects, such as PAGES 2k (PAGES 2k Coordinators, 2017). There is a lack of a recent Antarctic Holocene ice core composite, and the 1000 years of climate data from Sherman Island could make a significant contribution to work such as this (Masson et al., 2000). If in the future a full-scale drilling campaign on Sherman Island were to be carried out, then a longer, full Holocene record for this region in West Antarctica could probably be obtained by drilling to bedrock at the deepest point of Sherman Island. Such a record would be critical for gaining insights into West Antarctic interglacial variability. The records contained in the existing Sherman Island data have the potential to constrain climate history over the last millennium in this important and vulnerable region of West Antarctica and represent a valuable addition to the ice core community.
The full SI:RAID data set is available at https://doi.pangaea.de/10.1594/PANGAEA.960067 (Rowell et al., 2023).
The supplement related to this article is available online at: https://doi.org/10.5194/cp-19-1699-2023-supplement.
The paper was written by IR, with contributions from CM, HP, EW, DT and JL. The RAID ice was drilled and sampled by RM, IR and DT. The Sherman Island firn core was drilled by DT. The RAID chemistry samples were analysed by IR and the isotopes by IR and RM. The Sherman Island firn core was processed and analysed and data made available for use by DT. The sulfur isotope analysis was done by HP and ED. The annual layer counting was done by IR, with ice core contributions from DT. The volcanic horizon identification was done by IR, HP and EW. The ice models were developed by CM and used by IR, with assistance from CM. The age-scale uncertainty estimation was done by IR, with assistance from EW and CM. The seasonality analysis was done by IR. Age predictions were done by IR, CM and EW. The radargram data were processed by HM and JL.
At least one of the (co-)authors is a member of the editorial board of Climate of the Past. The peer-review process was guided by an independent editor, and the authors also have no other competing interests to declare.
This material reflects only the authors' views, and the European Commission is not liable for any use that may be made of the information contained therein.
Publisher's note: Copernicus Publications remains neutral with regard to jurisdictional claims in published maps and institutional affiliations.
This article is part of the special issue “Ice core science at the three poles (CP/TC inter-journal SI)”. It is not associated with a conference.
The authors would like to thank Pete Akers, Eric Steig and a third, anonymous reviewer, whose thoughtful consideration of this paper contributed to its improvement. We also thank Shaun Miller and Jack Humby for their assistance with the lab analyses necessary for this project.
This research has received funding from the European Research Council under the Horizon 2020 research and innovation programme (grant no. 74224; WACSWAIN). Eric Wolff has also been funded through a Royal Society Professorship. The drilling of the Sherman Island shallow ice core was supported by the Collaborative Antarctic Science Scheme (CASS-168). Data obtained from the Sherman Island shallow ice core were funded by a CONICYT-Becas Chile and Cambridge Trust fellowship awarded to Dieter Tetzner (grant no. 72180432).
This paper was edited by Tas van Ommen and reviewed by Eric Steig, Pete D. Akers, and one anonymous referee.
Bamber, J. L., Oppenheimer, M., Kopp, R. E., Aspinall, W. P., and Cooke, R. M.: Ice Sheet Contributions to Future Sea-Level Rise from Structured Expert Judgment, P. Natl. Acad. Sci. USA, 116, 11195–11200, https://doi.org/10.1073/pnas.1817205116, 2019. a
Bigler, M., Röthlisberger, R., Lambert, F., Stocker, T. F., and Wagenbach, D.: Aerosol Deposited in East Antarctica over the Last Glacial Cycle: Detailed Apportionment of Continental and Sea-Salt Contributions, J. Geophys. Res.-Atmos., 111, D08205, https://doi.org/10.1029/2005JD006469, 2006. a
Bronselaer, B., Winton, M., Griffies, S. M., Hurlin, W. J., Rodgers, K. B., Sergienko, O. V., Stouffer, R. J., and Russell, J. L.: Change in Future Climate Due to Antarctic Meltwater, Nature, 564, 53–58, https://doi.org/10.1038/s41586-018-0712-z, 2018. a
Burke, A., Moore, K. A., Sigl, M., Nita, D. C., McConnell, J. R., and Adkins, J. F.: Stratospheric Eruptions from Tropical and Extra-Tropical Volcanoes Constrained Using High-Resolution Sulfur Isotopes in Ice Cores, Earth Planet. Sc. Lett., 521, 113–119, https://doi.org/10.1016/j.epsl.2019.06.006, 2019. a
Crick, L., Burke, A., Hutchison, W., Kohno, M., Moore, K. A., Savarino, J., Doyle, E. A., Mahony, S., Kipfstuhl, S., Rae, J. W. B., Steele, R. C. J., Sparks, R. S. J., and Wolff, E. W.: New insights into the ∼ 74 ka Toba eruption from sulfur isotopes of polar ice cores, Clim. Past, 17, 2119–2137, https://doi.org/10.5194/cp-17-2119-2021, 2021. a
Curran, M. A. J., Palmer, A. S., van Ommen, T. D., Morgan, V. I., Phillips, K. L., McMorrow, A. J., and Mayewski, P. A.: Post-Depositional Movement of Methanesulphonic Acid at Law Dome, Antarctica, and the Influence of Accumulation Rate, Ann. Glaciol., 35, 333–339, https://doi.org/10.3189/172756402781816528, 2002. a
DeConto, R. M. and Pollard, D.: Contribution of Antarctica to Past and Future Sea-Level Rise, Nature, 531, 591–597, https://doi.org/10.1038/nature17145, 2016. a
Delmas, R. J., Legrand, M., Aristarain, A. J., and Zanolini, F.: Volcanic Deposits in Antarctic Snow and Ice, J. Geophys. Res.-Atmos., 90, 12901–12920, https://doi.org/10.1029/JD090iD07p12901, 1985. a
Dütsch, M., Steig, E. J., Blossey, P. N., and Pauling, A. G.: Response of Water Isotopes in Precipitation to a Collapse of the West Antarctic Ice Sheet in High-Resolution Simulations with the Weather Research and Forecasting Model, J. Climate, 1, 5417–5430, https://doi.org/10.1175/JCLI-D-22-0647.1, 2023. a
Dutton, A., Carlson, A. E., Long, A. J., Milne, G. A., Clark, P. U., DeConto, R., Horton, B. P., Rahmstorf, S., and Raymo, M. E.: Sea-Level Rise Due to Polar Ice-Sheet Mass Loss during Past Warm Periods, Science (New York, N. Y.), 349, aaa4019–aaa4019, https://doi.org/10.1126/science.aaa4019, 2015. a
Edwards, T. L., Brandon, M. A., Durand, G., Edwards, N. R., Golledge, N. R., Holden, P. B., Nias, I. J., Payne, A. J., Ritz, C., and Wernecke, A.: Revisiting Antarctic Ice Loss Due to Marine Ice-Cliff Instability, Nature, 566, 58–64, https://doi.org/10.1038/s41586-019-0901-4, 2019. a
Farquhar, J., Savarino, J., Airieau, S., and Thiemens, M. H.: Observation of Wavelength-Sensitive Mass-Independent Sulfur Isotope Effects during SO2 Photolysis: Implications for the Early Atmosphere, J. Geophys. Res.-Planet., 106, 32829–32839, https://doi.org/10.1029/2000JE001437, 2001. a
Fudge, T. J., Hills, B. H., Horlings, A. N., Holschuh, N., Christian, J. E., Davidge, L., Hoffman, A., O'Connor, G. K., Christianson, K., and Steig, E. J.: A Site for Deep Ice Coring at West Hercules Dome: Results from Ground-Based Geophysics and Modeling, J. Glaciol., 69, 538–550, https://doi.org/10.1017/jog.2022.80, 2022. a
Fujita, S., Parrenin, F., Severi, M., Motoyama, H., and Wolff, E. W.: Volcanic synchronization of Dome Fuji and Dome C Antarctic deep ice cores over the past 216 kyr, Clim. Past, 11, 1395–1416, https://doi.org/10.5194/cp-11-1395-2015, 2015. a
Gautier, E., Savarino, J., Hoek, J., Erbland, J., Caillon, N., Hattori, S., Yoshida, N., Albalat, E., Albarede, F., and Farquhar, J.: 2600-Years of Stratospheric Volcanism through Sulfate Isotopes, Nat. Commun., 10, 466, https://doi.org/10.1038/s41467-019-08357-0, 2019. a
Hoffmann, H. M., Grieman, M. M., King, A. C. F., Epifanio, J. A., Martin, K., Vladimirova, D., Pryer, H. V., Doyle, E., Schmidt, A., Humby, J. D., Rowell, I. F., Nehrbass-Ahles, C., Thomas, E. R., Mulvaney, R., and Wolff, E. W.: The ST22 chronology for the Skytrain Ice Rise ice core – Part 1: A stratigraphic chronology of the last 2000 years, Clim. Past, 18, 1831–1847, https://doi.org/10.5194/cp-18-1831-2022, 2022. a, b, c, d
Joughin, I., Smith, B. E., and Medley, B.: Marine Ice Sheet Collapse Potentially Under Way for the Thwaites Glacier Basin, West Antarctica, Science, 344, 735–738, https://doi.org/10.1126/science.1249055, 2014. a
Konrad, H., Shepherd, A., Gilbert, L., Hogg, A. E., McMillan, M., Muir, A., and Slater, T.: Net Retreat of Antarctic Glacier Grounding Lines, Nat. Geosci., 11, 258–262, https://doi.org/10.1038/s41561-018-0082-z, 2018. a
Korotkikh, E. V., Mayewski, P. A., Handley, M. J., Sneed, S. B., Introne, D. S., Kurbatov, A. V., Dunbar, N. W., and McIntosh, W. C.: The Last Interglacial as Represented in the Glaciochemical Record from Mount Moulton Blue Ice Area, West Antarctica, Quaternary Sci. Rev., 30, 1940–1947, https://doi.org/10.1016/j.quascirev.2011.04.020, 2011. a
Lagarias, J. C., Reeds, J. A., Wright, M. H., and Wright, P. E.: Convergence Properties of the Nelder–Mead Simplex Method in Low Dimensions, SIAM J. Optimiz., 9, 112–147, https://doi.org/10.1137/S1052623496303470, 1998. a
Lenton, T. M., Held, H., Kriegler, E., Hall, J. W., Lucht, W., Rahmstorf, S., and Schellnhuber, H. J.: Tipping Elements in the Earth's Climate System, P. Natl. Acad. Sci. USA, 105, 1786–1793, https://doi.org/10.1073/pnas.0705414105, 2008. a
Lliboutry, L.: A Critical Review of Analytical Approximate Solutions for Steady State Velocities and Temperature in Cold Ice-sheets, Z. Gletscherkd. Glazialgeol., 15, 135–148, 1979. a
Lowry, D. P., Krapp, M., Golledge, N. R., and Alevropoulos-Borrill, A.: The Influence of Emissions Scenarios on Future Antarctic Ice Loss Is Unlikely to Emerge This Century, Communications Earth & Environment, 2, 1–14, https://doi.org/10.1038/s43247-021-00289-2, 2021. a
Martín, C. and Gudmundsson, G. H.: Effects of Nonlinear Rheology, Temperature and Anisotropy on the Relationship between Age and Depth at Ice Divides, The Cryosphere, 6, 1221–1229, https://doi.org/10.5194/tc-6-1221-2012, 2012. a, b
Martín, C., Mulvaney, R., Gudmundsson, G. H., and Corr, H.: Inferring Palaeo-Accumulation Records from Ice-Core Data by an Adjoint-Based Method: Application to James Ross Island's Ice Core, Clim. Past, 11, 547–557, https://doi.org/10.5194/cp-11-547-2015, 2015. a
Masson, V., Vimeux, F., Jouzel, J., Morgan, V., Delmotte, M., Ciais, P., Hammer, C., Johnsen, S., Lipenkov, V. Y., Mosley-Thompson, E., Petit, J.-R., Steig, E. J., Stievenard, M., and Vaikmae, R.: Holocene Climate Variability in Antarctica Based on 11 Ice-Core Isotopic Records, Quaternary Res., 54, 348–358, https://doi.org/10.1006/qres.2000.2172, 2000. a
Matsuoka, K., Skoglund, A., Roth, G., de Pomereu, J., Griffiths, H., Headland, R., Herried, B., Katsumata, K., Le Brocq, A., Licht, K., Morgan, F., Neff, P. D., Ritz, C., Scheinert, M., Tamura, T., Van de Putte, A., van den Broeke, M., von Deschwanden, A., Deschamps-Berger, C., Van Liefferinge, B., Tronstad, S., and Melvær, Y.: Quantarctica, an Integrated Mapping Environment for Antarctica, the Southern Ocean, and Sub-Antarctic Islands, Environ. Model. Softw., 140, 105015, https://doi.org/10.1016/j.envsoft.2021.105015, 2021. a
Mercer, J.: West Antarctic Ice Sheet and Co2 Greenhouse Effect – Threat of Disaster, Nature, 271, 321–325, https://doi.org/10.1038/271321a0, 1978. a
Mulvaney, R., Rix, J., Polfrey, S., Grieman, M., Martìn, C., Nehrbass-Ahles, C., Rowell, I., Tuckwell, R., and Wolff, E.: Ice Drilling on Skytrain Ice Rise and Sherman Island, Antarctica, Ann. Glaciol., 62, 311–323, https://doi.org/10.1017/aog.2021.7, 2021. a, b, c, d, e, f, g
Mulvaney, R., Wolff, E. W., Grieman, M. M., Hoffmann, H. H., Humby, J. D., Nehrbass-Ahles, C., Rhodes, R. H., Rowell, I. F., Parrenin, F., Schmidely, L., Fischer, H., Stocker, T. F., Christl, M., Muscheler, R., Landais, A., and Prié, F.: The ST22 chronology for the Skytrain Ice Rise ice core – Part 2: An age model to the last interglacial and disturbed deep stratigraphy, Clim. Past, 19, 851–864, https://doi.org/10.5194/cp-19-851-2023, 2023. a
Narcisi, B., Robert Petit, J., and Tiepolo, M.: A Volcanic Marker (92 ka) for Dating Deep East Antarctic Ice Cores, Quaternary Sci. Rev., 25, 2682–2687, https://doi.org/10.1016/j.quascirev.2006.07.009, 2006. a
Neff, P.: Amundsen Sea Coastal Ice Rises: Future Sites for Marine-Focused Ice Core Records, Oceanography, 33, https://doi.org/10.5670/oceanog.2020.215, 2020. a
Nguyen, L., Paleari, C. I., Müller, S., Christl, M., Mekhaldi, F., Gautschi, P., Mulvaney, R., Rix, J., and Muscheler, R.: The Potential for a Continuous 10Be Record Measured on Ice Chips from a Borehole, Results in Geochemistry, 5, 100012, https://doi.org/10.1016/j.ringeo.2021.100012, 2021. a
Nielsen, H., Pilot, J., Grinenko, L., Grinenko, V., Lein, A. Yu., Smith, J., and Pankina, R.: Lithospheric Sources of Sulphur, John Wiley and Sons, United Kingdom, ISBN 0-471-92646-9, 1991. a
Oppenheimer, M.: Global Warming and the Stability of the West Antarctic Ice Sheet, Nature, 393, 325–332, https://doi.org/10.1038/30661, 1998. a
Osman, M., Das, S. B., Marchal, O., and Evans, M. J.: Methanesulfonic acid (MSA) migration in polar ice: data synthesis and theory, The Cryosphere, 11, 2439–2462, https://doi.org/10.5194/tc-11-2439-2017, 2017. a
Paden, J., Mathews, R., jiluli, mohanadalibadi, theresa-moore, da Silva, V. B., jsprick, Talasila, H. M., Gordon, Holschuh, N., gamer10bm, Barnett, C., Aegidius7, Hsien), S. C. K., Ibikunle, Jutila, A., Choudhari, R., and Christoffersen, M.: CReSIS/Cresis-Toolbox: CReSIS Toolbox Version 3.01, Zenodo, https://doi.org/10.5281/zenodo.5683959, 2021. a
PAGES 2k Coordinators: The Third Phase of the PAGES 2k Network, Past Global Changes Magazine, 25, 71–74, https://doi.org/10.22498/pages.25.1.71, 2017. a
Palmer, A. S., van Ommen, T. D., Curran, M. A. J., Morgan, V., Souney, J. M., and Mayewski, P. A.: High-Precision Dating of Volcanic Events (A. D. 1301–1995) Using Ice Cores from Law Dome, Antarctica, J. Geophys. Res.-Atmos., 106, 28089–28095, https://doi.org/10.1029/2001JD000330, 2001. a
Paolo, F. S., Fricker, H. A., and Padman, L.: Volume Loss from Antarctic Ice Shelves Is Accelerating, Science, 348, 327–331, https://doi.org/10.1126/science.aaa0940, 2015. a
Parrenin, F., Petit, J.-R., Masson-Delmotte, V., Wolff, E., Basile-Doelsch, I., Jouzel, J., Lipenkov, V., Rasmussen, S. O., Schwander, J., Severi, M., Udisti, R., Veres, D., and Vinther, B. M.: Volcanic synchronisation between the EPICA Dome C and Vostok ice cores (Antarctica) 0–145 kyr BP, Clim. Past, 8, 1031–1045, https://doi.org/10.5194/cp-8-1031-2012, 2012. a
Pasteur, E. C. and Mulvaney, R.: Migration of Methane Sulphonate in Antarctic Firn and Ice, J. Geophys. Res.-Atmos., 105, 11525–11534, https://doi.org/10.1029/2000JD900006, 2000. a
Patris, N., Delmas, R. J., and Jouzel, J.: Isotopic Signatures of Sulfur in Shallow Antarctic Ice Cores, J. Geophys. Res.-Atmos., 105, 7071–7078, https://doi.org/10.1029/1999JD900974, 2000. a, b
Pattyn, F. and Morlighem, M.: The Uncertain Future of the Antarctic Ice Sheet, Science, 367, 1331–1335, https://doi.org/10.1126/science.aaz5487, 2020. a
Rasmussen, S. O., Abbott, P. M., Blunier, T., Bourne, A. J., Brook, E., Buchardt, S. L., Buizert, C., Chappellaz, J., Clausen, H. B., Cook, E., Dahl-Jensen, D., Davies, S. M., Guillevic, M., Kipfstuhl, S., Laepple, T., Seierstad, I. K., Severinghaus, J. P., Steffensen, J. P., Stowasser, C., Svensson, A., Vallelonga, P., Vinther, B. M., Wilhelms, F., and Winstrup, M.: A first chronology for the North Greenland Eemian Ice Drilling (NEEM) ice core, Clim. Past, 9, 2713–2730, https://doi.org/10.5194/cp-9-2713-2013, 2013. a
Raymond, C. F.: Deformation in the Vicinity of Ice Divides, J. Glaciol., 29, 357–373, https://doi.org/10.3189/S0022143000030288, 1983/ed. a
Rees, C. E., Jenkins, W. J., and Monster, J.: The Sulphur Isotopic Composition of Ocean Water Sulphate, Geochim. Cosmochim. Ac., 42, 377–381, https://doi.org/10.1016/0016-7037(78)90268-5, 1978. a
Rix, J., Mulvaney, R., Hong, J., and Ashurst, D.: Development of the British Antarctic Survey Rapid Access Isotope Drill, J. Glaciol., 65, 288–298, https://doi.org/10.1017/jog.2019.9, 2019. a, b
Rodriguez-Morales, F., Gogineni, S., Leuschen, C. J., Paden, J. D., Li, J., Lewis, C. C., Panzer, B., Gomez-Garcia Alvestegui, D., Patel, A., Byers, K., Crowe, R., Player, K., Hale, R. D., Arnold, E. J., Smith, L., Gifford, C. M., Braaten, D., and Panton, C.: Advanced Multifrequency Radar Instrumentation for Polar Research, IEEE T. Geosci. Remote, 52, 2824–2842, https://doi.org/10.1109/TGRS.2013.2266415, 2014. a
Röthlisberger, R., Mulvaney, R., Wolff, E. W., Hutterli, M. A., Bigler, M.,Sommer, S., and Jouzel, J.: Dust and Sea Salt Variability in Central East Antarctica (Dome C) over the Last 45 Kyrs and Its Implications for Southern High-Latitude Climate, Geophys. Res. Lett., 29, 1963, https://doi.org/10.1029/2002GL015186, 2002. a
Rowell, I. F., Mulvaney, R., Rix, J., Tetzner, D. R., and Wolff, E. W.: Viability of Chemical and Water Isotope Ratio Measurements of RAID Ice Chippings from Antarctica, J. Glaciol., 69, 623–638, https://doi.org/10.1017/jog.2022.94, 2022. a, b, c, d, e
Rowell, I., Mulvaney, R., Wolff, E. W., Martìn, C., Tetzner, D., Pryer, H., and Rix, J.: Sherman Island Rapid Access Isotope Drill sample data on depth and age scale: stable water isotopes and major ion concentrations, PANGAEA [data set], https://doi.pangaea.de/10.1594/PANGAEA.960067, 2023. a
Saigne, C. and Legrand, M.: Measurements of Methanesulphonic Acid in Antarctic Ice, Nature, 330, 240–242, https://doi.org/10.1038/330240a0, 1987. a
Savarino, J., Romero, A., Cole-Dai, J., Bekki, S., Thiemens, M. H.: UV Induced Mass-Independent Sulfur Isotope Fractionation in Stratospheric Volcanic Sulfate, Geophys. Res. Lett., 30, 2131, https://doi.org/10.1029/2003GL018134, 2003. a
Severi, M., Udisti, R., Becagli, S., Stenni, B., and Traversi, R.: Volcanic synchronisation of the EPICA-DC and TALDICE ice cores for the last 42 kyr BP, Clim. Past, 8, 509–517, https://doi.org/10.5194/cp-8-509-2012, 2012. a
Severi, M., Becagli, S., Caiazzo, L., Ciardini, V., Colizza, E., Giardi, F., Mezgec, K., Scarchilli, C., Stenni, B., Thomas, E. R., Traversi, R., and Udisti, R.: Sea Salt Sodium Record from Talos Dome (East Antarctica) as a Potential Proxy of the Antarctic Past Sea Ice Extent, Chemosphere, 177, 266–274, https://doi.org/10.1016/j.chemosphere.2017.03.025, 2017. a
Shepherd, A., Wingham, D., and Rignot, E.: Warm Ocean Is Eroding West Antarctic Ice Sheet, Geophys. Res. Lett., 31, L23402, https://doi.org/10.1029/2004GL021106, 2004. a
Sigg, A. and Neftel, A.: Seasonal Variations in Hydrogen Peroxide in Polar Ice Cores, Ann. Glaciol., 10, 157–162, https://doi.org/10.3189/S0260305500004353, 1988. a
Sigl, M., McConnell, J. R., Toohey, M., Curran, M., Das, S. B., Edwards, R., Isaksson, E., Kawamura, K., Kipfstuhl, S., Krüger, K., Layman, L., Maselli, O. J., Motizuki, Y., Motoyama, H., Pasteris, D. R., and Severi, M.: Insights from Antarctica on Volcanic Forcing during the Common Era, Nat. Clim. Change, 4, 693–697, https://doi.org/10.1038/nclimate2293, 2014. a
Sigl, M., Fudge, T. J., Winstrup, M., Cole-Dai, J., Ferris, D., McConnell, J. R., Taylor, K. C., Welten, K. C., Woodruff, T. E., Adolphi, F., Bisiaux, M., Brook, E. J., Buizert, C., Caffee, M. W., Dunbar, N. W., Edwards, R., Geng, L., Iverson, N., Koffman, B., Layman, L., Maselli, O. J., McGwire, K., Muscheler, R., Nishiizumi, K., Pasteris, D. R., Rhodes, R. H., and Sowers, T. A.: The WAIS Divide deep ice core WD2014 chronology – Part 2: Annual-layer counting (0–31 ka BP), Clim. Past, 12, 769–786, https://doi.org/10.5194/cp-12-769-2016, 2016. a, b, c
Steig, E. J., Huybers, K., Singh, H. A., Steiger, N. J., Ding, Q., Frierson, D. M. W., Popp, T., and White, J. W. C.: Influence of West Antarctic Ice Sheet Collapse on Antarctic Surface Climate: CLIMATE RESPONSE TO WAIS COLLAPSE, Geophys. Res. Lett., 42, 4862–4868, https://doi.org/10.1002/2015GL063861, 2015. a
Steig, E., White, J., and Popp, T.: Mount Moulton Isotope Data and Other Ice Core Data, USAP-DC – US Antarctic Program Data Center [data set], https://doi.org/10.7265/N5FT8J0N, 2015. a
Stenni, B., Curran, M. A. J., Abram, N. J., Orsi, A., Goursaud, S., Masson-Delmotte, V., Neukom, R., Goosse, H., Divine, D., van Ommen, T., Steig, E. J., Dixon, D. A., Thomas, E. R., Bertler, N. A. N., Isaksson, E., Ekaykin, A., Werner, M., and Frezzotti, M.: Antarctic climate variability on regional and continental scales over the last 2000 years, Clim. Past, 13, 1609–1634, https://doi.org/10.5194/cp-13-1609-2017, 2017. a
Tetzner, D., Thomas, E., and Allen, C.: A Validation of ERA5 Reanalysis Data in the Southern Antarctic Peninsula—Ellsworth Land Region, and Its Implications for Ice Core Studies, Geosciences, 9, 289, https://doi.org/10.3390/geosciences9070289, 2019. a
Tetzner, D., Allen, C., and Thomas, E.: Annual and Sub-Annual Diatom Abundance and Distribution in the Jurassic, Rothschild Island, Sherman Island and Sky-Blu Ice Cores (1992–2019 CE), NERC EDS UK Polar Data Centre [data set], https://doi.org/10.5285/E7166724-E7FA-4267-A2A7-6207EDE57F70, 2022. a
Tetzner, D. R., Thomas, E. R., Allen, C. S., and Piermattei, A.: Evidence of Recent Active Volcanism in the Balleny Islands (Antarctica) From Ice Core Records, J. Geophys. Res.-Atmos., 126, e2021JD035095, https://doi.org/10.1029/2021JD035095, 2021. a
Tetzner, D. R., Thomas, E. R., Allen, C. S., and Grieman, M. M.: Regional validation of the use of diatoms in ice cores from the Antarctic Peninsula as a Southern Hemisphere westerly wind proxy, Clim. Past, 18, 1709–1727, https://doi.org/10.5194/cp-18-1709-2022, 2022. a
Thomas, E. R., van Wessem, J. M., Roberts, J., Isaksson, E., Schlosser, E., Fudge, T. J., Vallelonga, P., Medley, B., Lenaerts, J., Bertler, N., van den Broeke, M. R., Dixon, D. A., Frezzotti, M., Stenni, B., Curran, M., and Ekaykin, A. A.: Regional Antarctic snow accumulation over the past 1000 years, Clim. Past, 13, 1491–1513, https://doi.org/10.5194/cp-13-1491-2017, 2017. a
Turner, S. M., Nightingale, P. D., Broadgate, W., and Liss, P. S.: The Distribution of Dimethyl Sulphide and Dimethylsulphoniopropionate in Antarctic Waters and Sea Ice, Deep-Sea Res. Pt. II, 42, 1059–1080, https://doi.org/10.1016/0967-0645(95)00066-Y, 1995. a
Udisti, R., Becagli, S., Castellano, E., Delmonte, B., Jouzel, J., Petit, J. R., Schwander, J., Stenni, B., and Wolff, E. W.: Stratigraphic Correlations between the European Project for Ice Coring in Antarctica (EPICA) Dome C and Vostok Ice Cores Showing the Relative Variations of Snow Accumulation over the Past 45 Kyr, J. Geophys. Res.-Atmos., 109, D08101, https://doi.org/10.1029/2003JD004180, 2004. a
Vaughan, D. G., Corr, H. F. J., Doake, C. S. M., and Waddington, E. D.: Distortion of Isochronous Layers in Ice Revealed by Ground-Penetrating Radar, Nature, 398, 323–326, https://doi.org/10.1038/18653, 1999. a
Wang, Y., Thomas, E. R., Hou, S., Huai, B., Wu, S., Sun, W., Qi, S., Ding, M., and Zhang, Y.: Snow Accumulation Variability Over the West Antarctic Ice Sheet Since 1900: A Comparison of Ice Core Records With ERA-20C Reanalysis, Geophys. Res. Lett., 44, 11,482–11,490, https://doi.org/10.1002/2017GL075135, 2017. a
Winstrup, M., Vallelonga, P., Kjær, H. A., Fudge, T. J., Lee, J. E., Riis, M. H., Edwards, R., Bertler, N. A. N., Blunier, T., Brook, E. J., Buizert, C., Ciobanu, G., Conway, H., Dahl-Jensen, D., Ellis, A., Emanuelsson, B. D., Hindmarsh, R. C. A., Keller, E. D., Kurbatov, A. V., Mayewski, P. A., Neff, P. D., Pyne, R. L., Simonsen, M. F., Svensson, A., Tuohy, A., Waddington, E. D., and Wheatley, S.: A 2700-year annual timescale and accumulation history for an ice core from Roosevelt Island, West Antarctica, Clim. Past, 15, 751–779, https://doi.org/10.5194/cp-15-751-2019, 2019. a
Wouters, B., Martin-Espa nol, A., Helm, V., Flament, T., van Wessem, J. M., Ligtenberg, S. R. M., van den Broeke, M. R., and Bamber, J. L.: Dynamic Thinning of Glaciers on the Southern Antarctic Peninsula, Science, 348, 899–903, https://doi.org/10.1126/science.aaa5727, 2015. a
Wunderling, N., Willeit, M., Donges, J. F., and Winkelmann, R.: Global Warming Due to Loss of Large Ice Masses and Arctic Summer Sea Ice, Nat. Commun., 11, 5177, https://doi.org/10.1038/s41467-020-18934-3, 2020. a