the Creative Commons Attribution 4.0 License.
the Creative Commons Attribution 4.0 License.
 | 05 Jul 2023
Changing sources and burial of organic carbon in the Chukchi Sea sediments with retreating sea ice over recent centuries
Liang Su
Marie-Alexandrine Sicre
Youcheng Bai
Ruoshi Zhao
Xibing Han
Zhongqiao Li
Haiyan Jin
Anatolii S. Astakhov
Xuefa Shi
Jianfang Chen
Decreasing sea ice extent caused by climate change is affecting the carbon cycle of the Arctic Ocean. In this study, surface sediments across the western Arctic Ocean are investigated to characterize sources of sedimentary organic carbon (OC). Bulk organic parameters (total organic carbon, total nitrogen, δ13Corg, and δ15N) and molecular organic biomarkers (e.g., sterols and highly branched isoprenoids – HBIs) are combined to distinguish between sympagic, pelagic, and terrestrial OC sources. Their downcore profiles generated at the Chukchi Sea R1 core site (74∘ N) are then used to evaluate changes in the relative contribution of these components of sedimentary OC over the last 200 years with decreasing sea ice. Our data evidence that, from the 1820s to the 1930s, prevailing high sea ice cover inhibited in situ primary production, resulting in prominent land-derived material in sediments. Then, from the 1930s to the 1980s, primary production started increasing with the gradual decline of summer sea ice. The ratio of sympagic and pelagic OC began to rise to account for the larger portion of sedimentary OC. Since the 1980s, accelerated sea ice loss led to enhanced primary production, stabilizing over the last decades due to freshwater-induced surface ocean stratification in summer.
- Article
(6361 KB) - Full-text XML
-
Supplement
(1745 KB) - BibTeX
- EndNote


Knowledge on the processes and feedback mechanisms controlling the carbon cycle is essential for a better understanding of Arctic marine ecosystem dynamics and its role in climate change (Parmentier et al., 2017; Wheeler et al., 1996). The Arctic Ocean is the major world carbon sink region where huge amounts of marine and terrestrial organic carbon (OC) have accumulated (Stein et al., 2004). Today, the Arctic Ocean experiences unprecedented changes caused by global warming and Arctic amplification (Cavalieri et al., 1997; Rantanen et al., 2022; Serreze and Francis, 2006; Shindell and Faluvegi, 2009), which have resulted in major sea ice loss with consequences for the marine ecosystems and Arctic carbon budget. Increased river discharge and melting permafrost are responsible for enhanced delivery of terrigenous inorganic and organic carbon to the Arctic marginal seas (Grotheer et al., 2020; Holmes et al., 2011; Rawlins et al., 2021; Vonk et al., 2012). Terrigenous OC reaching the Arctic Ocean is either partly mineralized or transported to the sea floor where it is ultimately buried (Fritz et al., 2017; Tanski et al., 2019). Increased nutrient-rich waters brought by enhanced Pacific water inflow (PWI), a major source of nutrients to the Arctic, also contribute to stimulating phytoplankton productivity in the western Arctic Ocean (Arrigo and van Dijken, 2015; Tian et al., 2021; Woodgate and Peralta-Ferriz, 2021; Woodgate, 2018). Lastly and most importantly, the rapid sea ice loss in summer has resulted in large areas of the Arctic Ocean that shifted from multi-year-long sea ice coverage to seasonal sea ice coverage (Cavalieri and Parkinson, 2012; Parkinson et al., 1999; Stroeve et al., 2007), allowing for higher light penetration in surface waters and thereby enhancing primary production and export of OC to the bottom floor. Enhanced summer sea ice melting further contributes to sea ice algal production, export, and burial of marine OC in sediments (Ardyna and Arrigo, 2020). The Chukchi Sea (CS) is one of the most productive regions of the Arctic marginal seas (Cai et al., 2010; Ouyang et al., 2022; Zhuang et al., 2022). With the rapid sea ice retreat, the CS has become a key area to study climate-induced OC changes since the beginning of the Industrial Era.
A large variety of indicators, including bulk geochemical ratios and lipid biomarkers (Volkman, 1986) have been developed to characterize the composition of OC in Arctic Ocean sediments (Fernandes and Sicre, 2000; Sparkes et al., 2015). Among them, lignins and δ13Corg have been successfully used to provide reliable estimates of terrestrial OC (Tesi et al., 2014; K. Wang et al., 2019; Wild et al., 2022). However, pelagic- and sympagic-sourced OC remains difficult to discriminate in the Arctic Ocean, particularly in regions of high sympagic productivity. To address this issue, the H-Print index based on highly branched isoprenoids (HBIs), defined as the ratio of pelagic HBI-III over the sum of HBIs (IP25 + HBI-II + HBI-III), was developed (Brown et al., 2014b; Koch et al., 2020). Values close to 100 % are thus indicative of prominent pelagic sources, while those close to 0 % reflect prevailing sympagic sources. By combining H-Print and δ13Corg, we here intend to more accurately quantify marine pelagic, marine sympagic, and terrestrial fractions of OC in Arctic sediments.
Documenting changes in sea ice changes and induced transformations of Arctic ecosystems is key to better predict how the carbon cycle will respond to future changes with continued warming (Arrigo et al., 2008; Bates and Mathis, 2009). Extensive surveys of Arctic sea ice have been possible only since the 1970s with the development of remote sensing observations (Cavalieri et al., 1996). Prior to this, very few in situ observations on sea ice exist due to the inaccessibility of the Arctic Ocean. Paleoclimate proxies such as fossil assemblages and geochemical indicators have thus been used as alternative approaches to document past changes of sea ice and to place them in the context of ongoing changes (e.g., Belt, 2018; de Vernal et al., 2013, and references therein). The monounsaturated HBI biomarker IP25(ice proxy with 25 carbon atoms) produced by sea ice diatoms was initially proposed to assess seasonal sea ice cover (Belt et al., 2007; Massé et al., 2008). The PIP25 (phytoplankton–IP25) index that combines IP25 with pelagic phytoplankton biomarkers was then proposed to provide semi-quantitative estimates of seasonal sea ice (Belt, 2019; Müller et al., 2011). Most IP25-related studies in the Arctic Ocean have focused on surface sediments to derive the spatial seasonal sea ice distribution (Kolling et al., 2020; Stoynova et al., 2013; Su et al., 2022; Xiao et al., 2013, 2015a). Others have investigated its past variability at the millennial scale and beyond (Cronin et al., 2013; Polyak et al., 2016; Stein et al., 2017; Xiao et al., 2015b), but only a limited number has explored sea ice variability over the past centuries (Bai et al., 2022; Hu et al., 2020; Kim et al., 2019). None have attempted to link seasonal sea ice changes to sedimentary OC composition since the beginning of the Industrial Era.
In this study, we investigate the potential of H-Print combined with δ13Corg in surface sediments of the northern CS to discriminate and quantify the relative contribution of OC originating from pelagic, sympagic, and terrestrial sources and their evolution over 2 last two centuries under changing sea ice conditions to improve our understanding of the ongoing alteration of the OC cycle.
The CS is one of the largest marginal seas in the world, located on the northern Asian and American continents (Jakobsson, 2002). The surface ocean circulation in the CS is controlled by winds and sea ice cover (Ovall et al., 2021). This basin is connected to the Pacific Ocean through the Bering Strait. The PWI entering the Arctic Ocean strongly influences the physico-chemical water properties of the Arctic Ocean and contributes to enhanced primary production (Coachman and Aagaard, 1966) (Fig. 1). In the CS, the PWI divides into the following three branches: the highly saline and high-nutrient-content Anadyr Water (AW) on the western side, the fresher and oligotrophic Alaska Coastal Water (ACW) on the eastern side, and the moderately saline Bering Shelf Water (BSW) in between (Grebmeier et al., 2006; Hunt et al., 2013; Woodgate et al., 2005). The eastern side of the CS is adjacent to the Beaufort Sea. The dynamics of the Beaufort Gyre (BG) also impact on the characteristics of the CS water mass (Timmermans and Toole, 2023). In particular, enhanced anticyclonic BG circulation has resulted in increased freshwater convergence into the Canadian Basin in recent years (Giles et al., 2012), with implications for the local biological production and for the transport of terrestrial organic matter (He et al., 2012; Coupel et al., 2015; Ren et al., 2020). Fresh and cold waters from the seasonal Siberian coastal current (SCC) are another feature of the surface ocean circulation that lowers salinity of the central CS water (Weingartner et al., 1999). The dramatic loss of sea ice in summer caused by global warming is particularly tangible in the Arctic Ocean marginal seas (Cavalieri et al., 1997; Parkinson et al., 1999; Polyakov et al., 2003; Zhang et al., 2021) and is most pronounced in the CS in terms of both sea ice extent and thickness (Serreze and Stroeve 2015; Y. Wang et al., 2019). Remote sensing data (1979 to 2020) reveal considerable seasonal variations of sea ice extent in the CS. The CS is heavily covered by sea ice from November to June. Sea ice gradually decreases in July and reaches its minimum extent in September (https://nsidc.org, last access: 15 January 2023; Cavalieri et al., 1996).
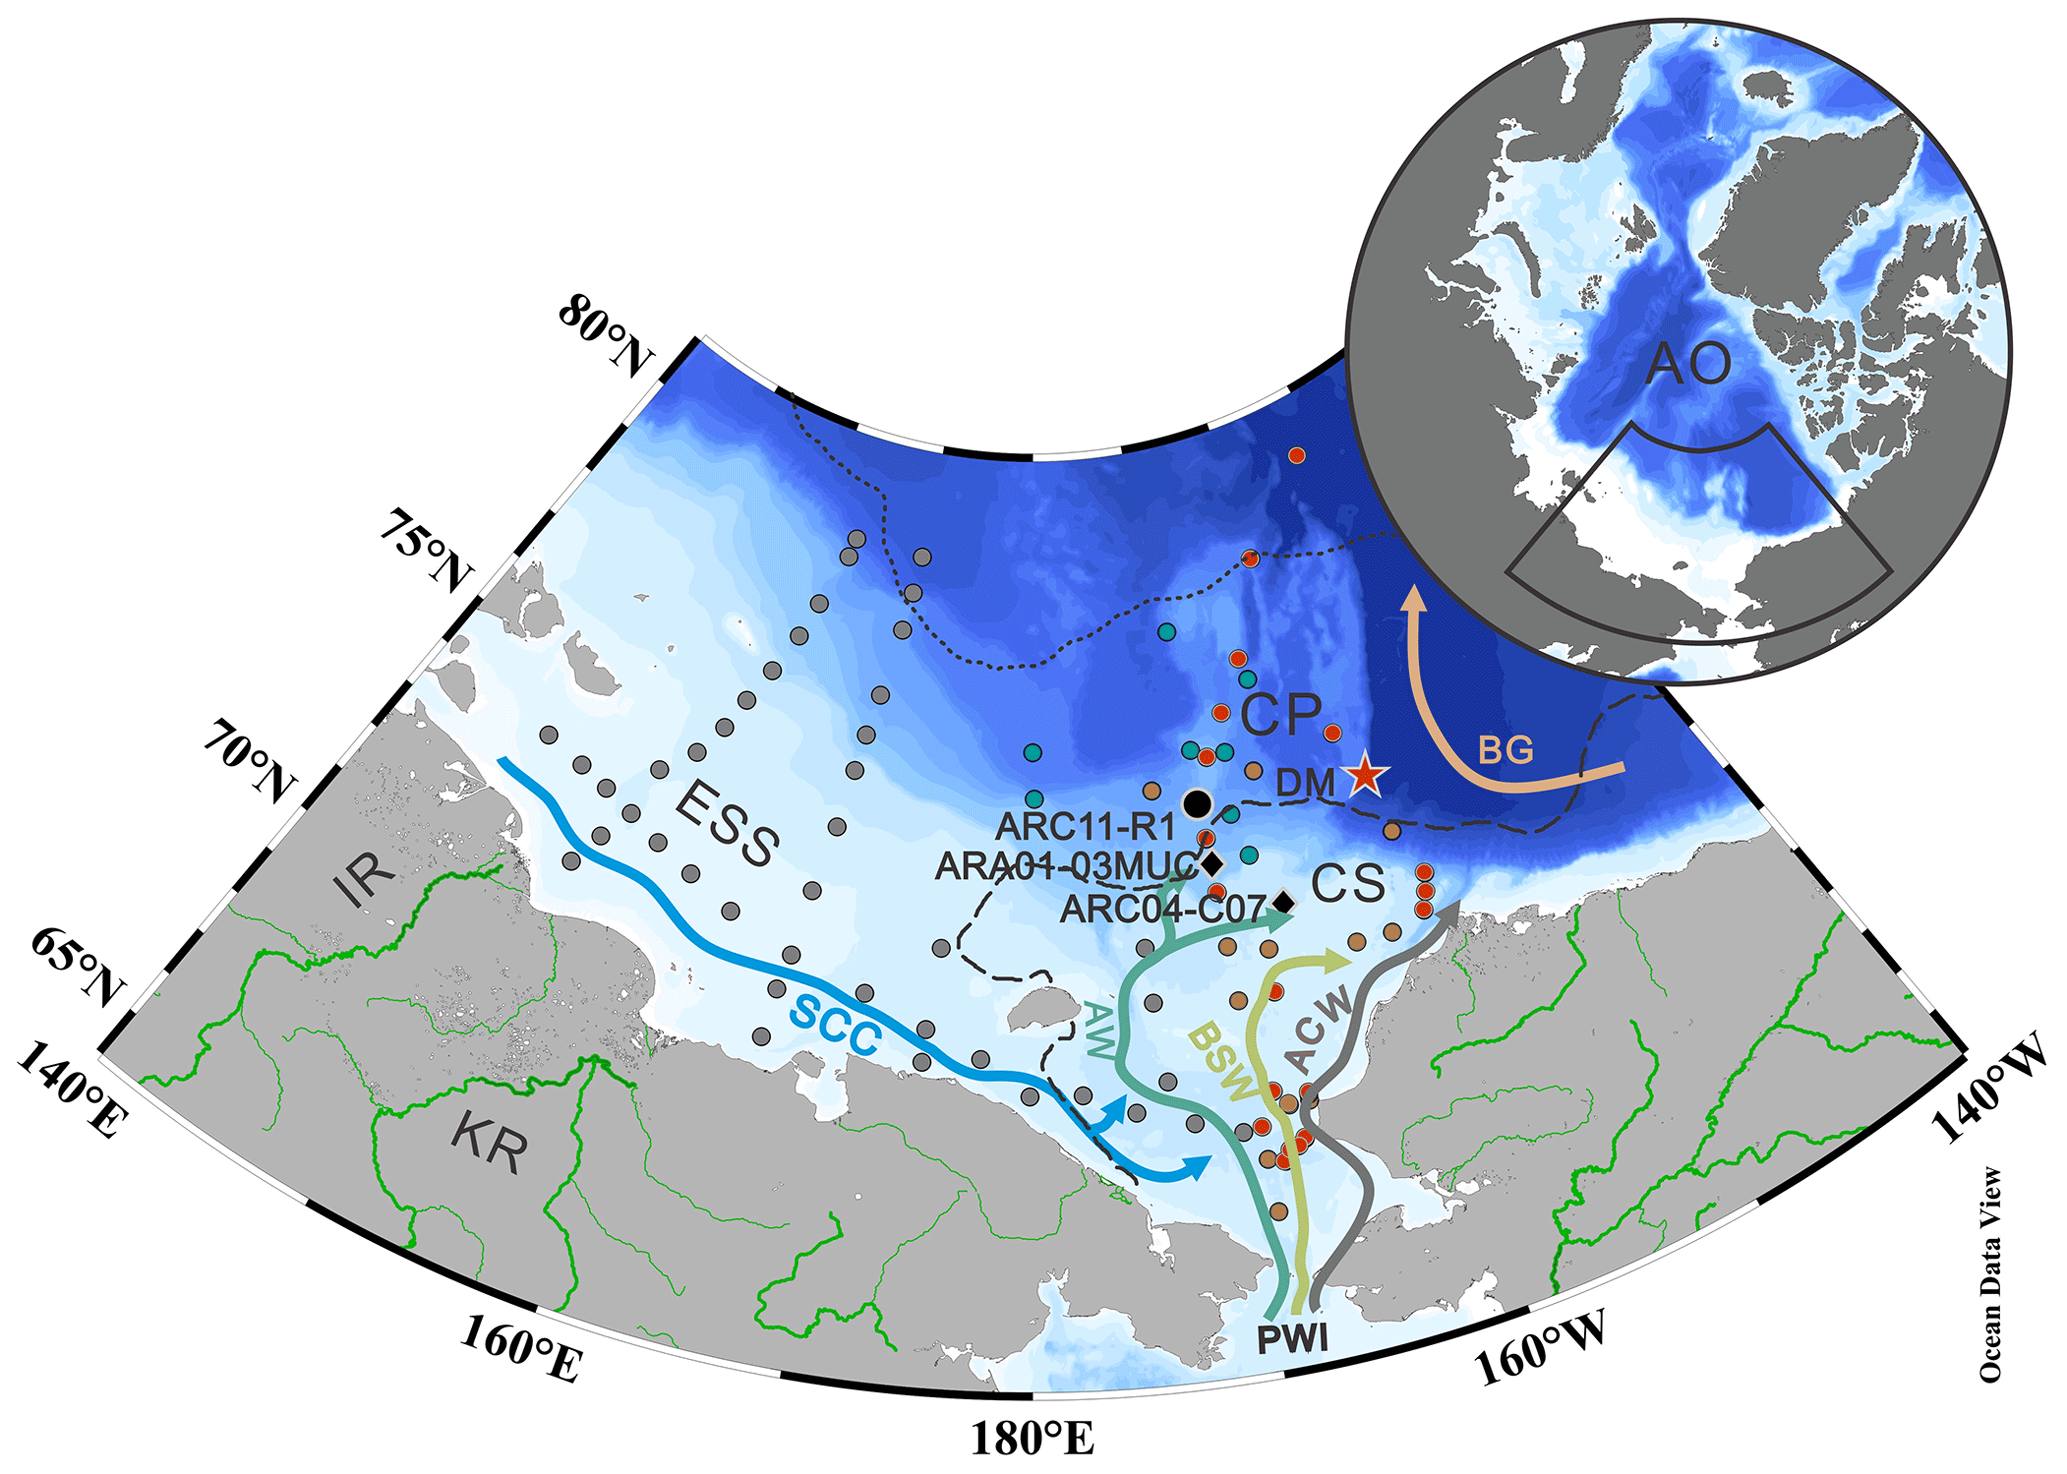
Figure 1Map of the western Arctic Ocean (AO) showing surface ocean circulation and sampling locations (black, gray, and green dots). The stations in gray and green represent the surface samples collected on the LV77 and 11th CHINARE cruises, respectively. The black dot indicates the sediment core ARC11-R1 location. The black diamonds show two other sediment cores discussed in the text (ARC04-C07, Bai et al., 2022; ARA01-03MUC, Kim et al., 2019). Surface sediments reported by Bai et al. (2019) and Wang et al. (2017) are shown by red and orange dots, respectively. The red start shows the location of the sediment trap station DM (Bai et al., 2019). The dotted and dashed lines in black represent the 20 % isolines of September sea ice concentration for 2019 and 1979, respectively (https://nsidc.org, last access: 15 January 2023; Cavalieri et al., 1996). Main study regions: ESS – East Siberian Sea; CS – Chukchi Sea; CP – Chukchi Plateau. Main surface currents: SCC – Siberian coastal current; PWI – Pacific water inflow; ACW – Alaskan Coastal Water; AW – Anadyr Water; BSW – Bering Shelf Water. Rivers are shown as green lines: IR – Indigirka River; KR – Kolyma River.
3.1 Material
A total of 42 surface sediments (0–2 cm) from the East Siberian Sea (ESS) and CS were collected during the Cruise LV77 on board the R/V Akademik M. A. Lavrentiev. An additional 11 surface sediments (0–2 cm) and a 15 cm long sediment core, ARC11-R1 (R1 hereafter; 74.64∘ N, 169.13∘ W; 200 m water depth), were also collected using a box corer and a multi-corer, respectively, in the CS and Chukchi Plateau (CP) during the 11th Chinese National Arctic Research Expedition (CHINARE) in summer 2020 on board the R/V Xuelong 2 (Fig. 1). Subsampling was performed on board at a sampling interval of 1 cm. Subsampled core sediments and surface sediments were frozen immediately after recovery at −20 ∘C until further analysis in the laboratory.
3.2 Sediment core chronology
The chronology of the R1 core is based on excess 210Pb (210Pbex) determinations performed at the State Key Laboratory of Estuarine and Coastal Research, East China Normal University, Shanghai, China, using an HPGe gamma spectrometry (GSW275L, Canberra). The 210Pbex activity was calculated by subtracting the supporting fraction (226Ra) from the total 210Pb (210Pbtotal) activity in the sediment. The error in 210Pbex is computed by propagating the error in the corresponding measured pair (210Pb and 226Ra). A mean linear sedimentation rate (cm yr−1) was calculated from the 210Pbex profile using a constant flux–constant sedimentation rate (CF–CS) model, assuming continuous homogeneous deposition of non-equilibrium 210Pb in the sediment (Nittrouer et al., 1984). As 137Cs was also measured during the same gamma-counting session, this radionuclide was also used to test the chronology.
3.3 Bulk analyses
Total organic carbon (TOC), total nitrogen (TN), δ13Corg, and δ15N of the 42 surface sediments from the ESS and western CS during the LV77 cruise, as well as the 11 surface sediments and the R1 core retrieved from the CS during the CHINARE cruise, were analyzed at the Key Laboratory of Marine Ecosystem Dynamics, Second Institute of Oceanography, Ministry of Natural Resources (MED, SIO, MNR, Hangzhou, China). These were first freeze dried, then ground and homogenized before the analyses. About 0.5 g of sediment was acidified using 1 mol L−1 HCl and heated overnight in a water bath at 50 ∘C. The excess acid was washed away using ultrapure water (Williford et al., 2007). These samples were weighed for TOC and δ13Corg determinations. For TN and nitrogen stable isotope (δ15N) analyses, we used samples that were not acidified. TOC, TN, δ13Corg, and δ15N measurements were carried out on an elemental analyzer, the Elementar CHNOS, coupled to an isotope ratio mass spectrometer (IRMS – Thermo, Delta V advantage). The standard deviations for TOC, TN, δ13Corg, and δ15N based on replicate analyses were 0.02 %, 0.005 %, 0.2 ‰, and 0.2 ‰, respectively.
3.4 Biomarker analyses
Biomarker analyses were completed at MED, SIO, MNR (Hangzhou, China). Before extraction, internal standards 7-hexylnonadecane and cholest-5-en-3β-ol-D6 were added to about 5 g of freeze-dried and homogenized sediment for quantification of HBIs and sterols, respectively. Extraction was performed three times in an ultrasonic bath for 15 min using dichloromethane/methanol (2:1 ). The three extracts were combined and dried under a gentle nitrogen stream. Further separation was carried out by adsorption chromatography on an open column filled with SiO2 using 2.5 mL n-hexane and 4 mL n-hexane/ethyl acetate (70:30 ) to separate the hydrocarbons and sterols, respectively, from the total lipid extract. About 50 µL BSTFA (bis-trimethylsilyl-trifluoroacetamide) were added to the sterol fraction and heated at 70 ∘C for 1 h for silylation.
Then, hydrocarbons and sterols were analyzed by gas chromatography (GC – Agilent Technologies 7890; 30 m HP-1MS column, 0.25 mm in diameter, and 0.25 µm film thickness) coupled to mass spectrometry (MS – Agilent 262 Technologies 5975C inert XL). A heating rate of 10 ∘C min−1 for the oven temperature was programmed from 40 to 300 ∘C and maintained at final temperature for 10 min. The ion source temperature was set at 250 ∘C, and the ionization energy was set at 70 eV for MS analyses (Belt et al., 2007; Müller et al., 2009). Individual compounds were identified based on their retention time and mass spectra. Selective ion monitoring was used to detect the C25-HBIs ( 350 for IP25, 348 for HBI-II, and 346 for HBI-III) and the sterols ( 470 for brassicasterol (24-methylcholesta-5,22E-dien-3β-ol), 500 for dinosterol (4α,23,24R-trimethyl-5α-cholest-22E-en-3β-ol), 396 for β-sitosterol (24-ethylcholest-5-en-3β-ol), and 382 for campesterol (24-methylcholest-5-en-3β-ol)). Concentrations of HBIs were determined based on the area of individual compounds and that of the 7-hexylnonadecane ( 266) obtained by GC–MS. Similarly, sterol concentrations were calculated from the area of individual sterols and cholesterol-D6 (cholest-5-en-3β-ol-D6, 464) (Belt et al., 2012; Müller et al., 2011). Concentrations of all biomarkers were normalized to TOC.
3.5 PIP25 index and H-Print
PIP25 indexes were calculated to estimate seasonal sea ice concentrations (Müller et al., 2011) using the following expression:
where
Brassicasterol (B), dinosterol (D), and HBI-III (III) were used as a reference for pelagic phytoplankton to calculate the PBIP25, PDIP25, and PIIIIP25 values, respectively.
The H-Print values were also calculated to infer the relative contribution of pelagic and sympagic OC (Brown et al., 2014b; Koch et al., 2020).
Low H-Print values are indicative of higher sympagic production, while high H-Print values point to prevalent pelagic algae.
3.6 Environmental dataset of surface sediment
The assessment of seasonal sea ice spatial distribution is based on the compilation of previously published surface sediment data from the ESS (HBIs, Su et al., 2022) and the CS (HBIs, Bai et al., 2019; δ13Corg, Wang et al., 2017) and new data from the CS and CP produced in this study. δ13Corg data from the ESS are also new, together with all data from the R1 core.
4.1 Chronology of core R1
The activity of 210Pbtotal ranges from 22 to 214 Bq kg−1, with an average value of 64.30 Bq kg−1 (Fig. 2). 210Pbex decreases exponentially with increasing depth to reach negligible values around 9 cm. The calculated average sedimentation rate of R1 using the CF–CS model is estimated to be 0.07 cm yr−1 (r2=0.94, p<0.05), which gives a time span of about 200 years for the whole core. The 137Cs profile (not shown) further supports the 210Pb dating. This value falls within the range reported by Cooper and Grebmeier (2018) in a Chukchi Shelf core (0.03–0.37 cm yr−1) and is slightly lower than that found at the ARC4-C07 core (0.09 cm yr−1, Bai et al., 2022) and the ARA01B-03MUC core (0.09 cm yr−1, Kim et al., 2019), both located to the south (Fig. 1).
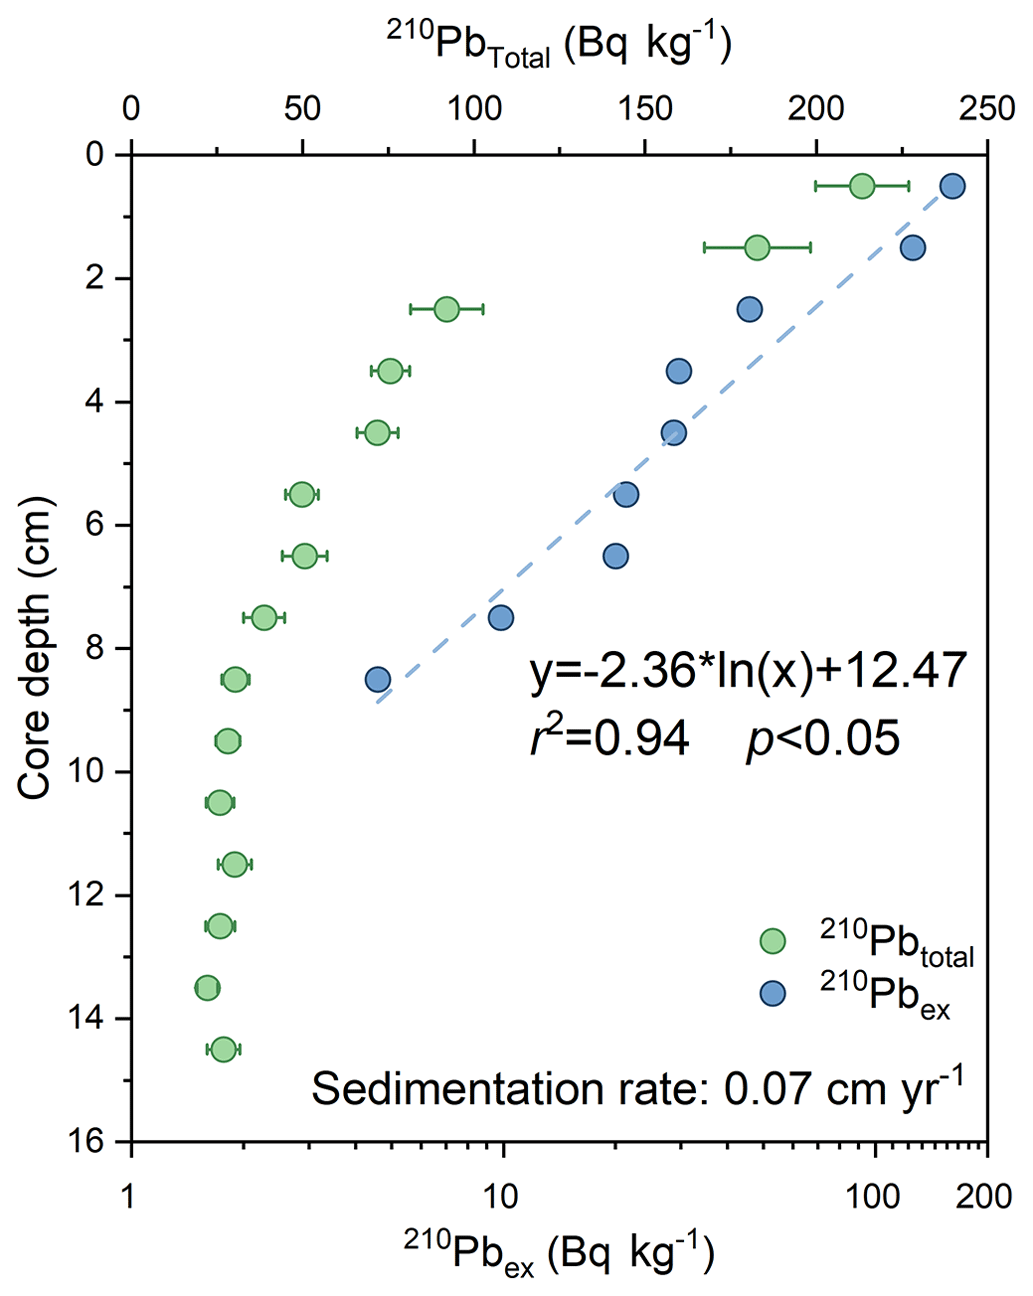
Figure 2Downcore profile of 210Pbtotal (green circles) with the error range and 210Pbex (blue circles) for ARC11-R1.
4.2 Proxy data
4.2.1 Surface sediments
The TOC and TN of surface sediments range from 0.57 % to 1.42 % and from 0.12 % to 0.28 %, respectively (Table 1, Fig. S1 in the Supplement). δ13Corg varies from −23.7 ‰ to −22.0 ‰, and δ15N varies from 8.01 ‰ to 9.91 ‰. Both HBIs and pelagic phytosterol concentrations showed a gradual decrease from the shelf to the northern CP. The concentrations of HBI-II and HBI-III reached their detection limit at around 76∘ N, whereas for IP25, this limit is achieved north of 78∘ N. By contrast, brassicasterol and dinosterol were detected in all samples, with the highest values recorded at the shelf edge. Terrestrial sterols (β-sitosterol and campesterol) showed high values over the shelf and minimum ones at the northern end of the CP.
Table 1Summary of bulk parameters and biomarker data from surface sediment in the Chukchi Sea and Chukchi Plateau.
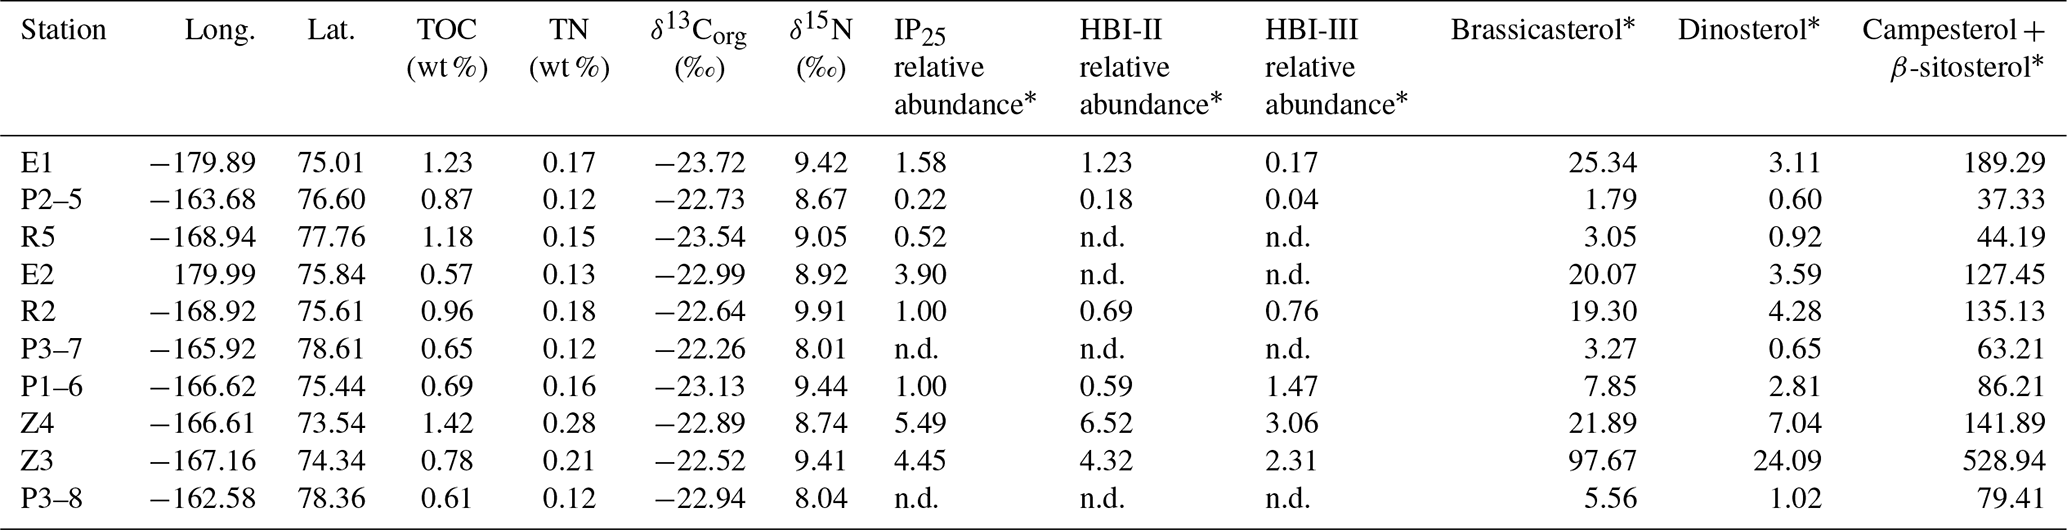
n.d.: not detected; * in µg g−1 TOC.
4.2.2 ARC11-R1 core
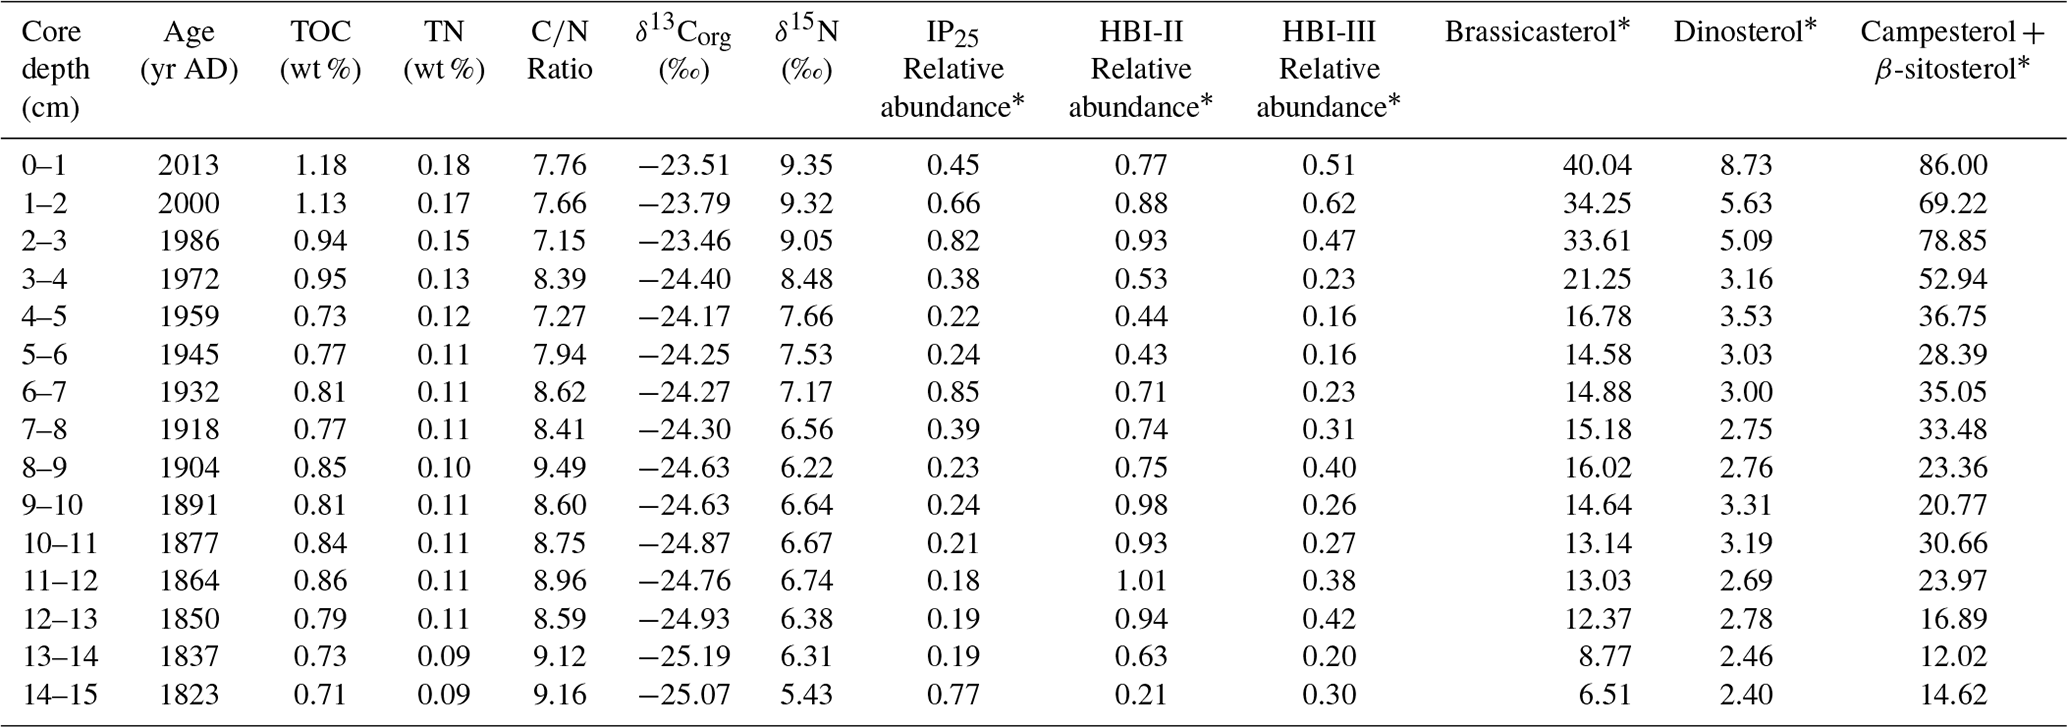
The TOC and TN downcore profiles over the last 200 years both show increasing trends towards present (r2=0.88, p<0.01), with values varying from 0.71 % to 1.18 % and from 0.09 % to 0.18 %, respectively (Table 2, Fig. 3a and c). TOC exhibits a minimum at the end of the 1950s and rapidly increases thereafter. Downcore values of ratios show a gradual decrease from 9.2 to 7.6, while δ13Corg consistently increases from −25.07 ‰ to −23.46 ‰ in the 1980s (Table 2, Fig. 3b and d). δ15N exhibits constant values until the early 1900s, after which it gradually increases and reaches a maximum at the top of the core (9.35 ‰; Table 2, Fig. 3d).
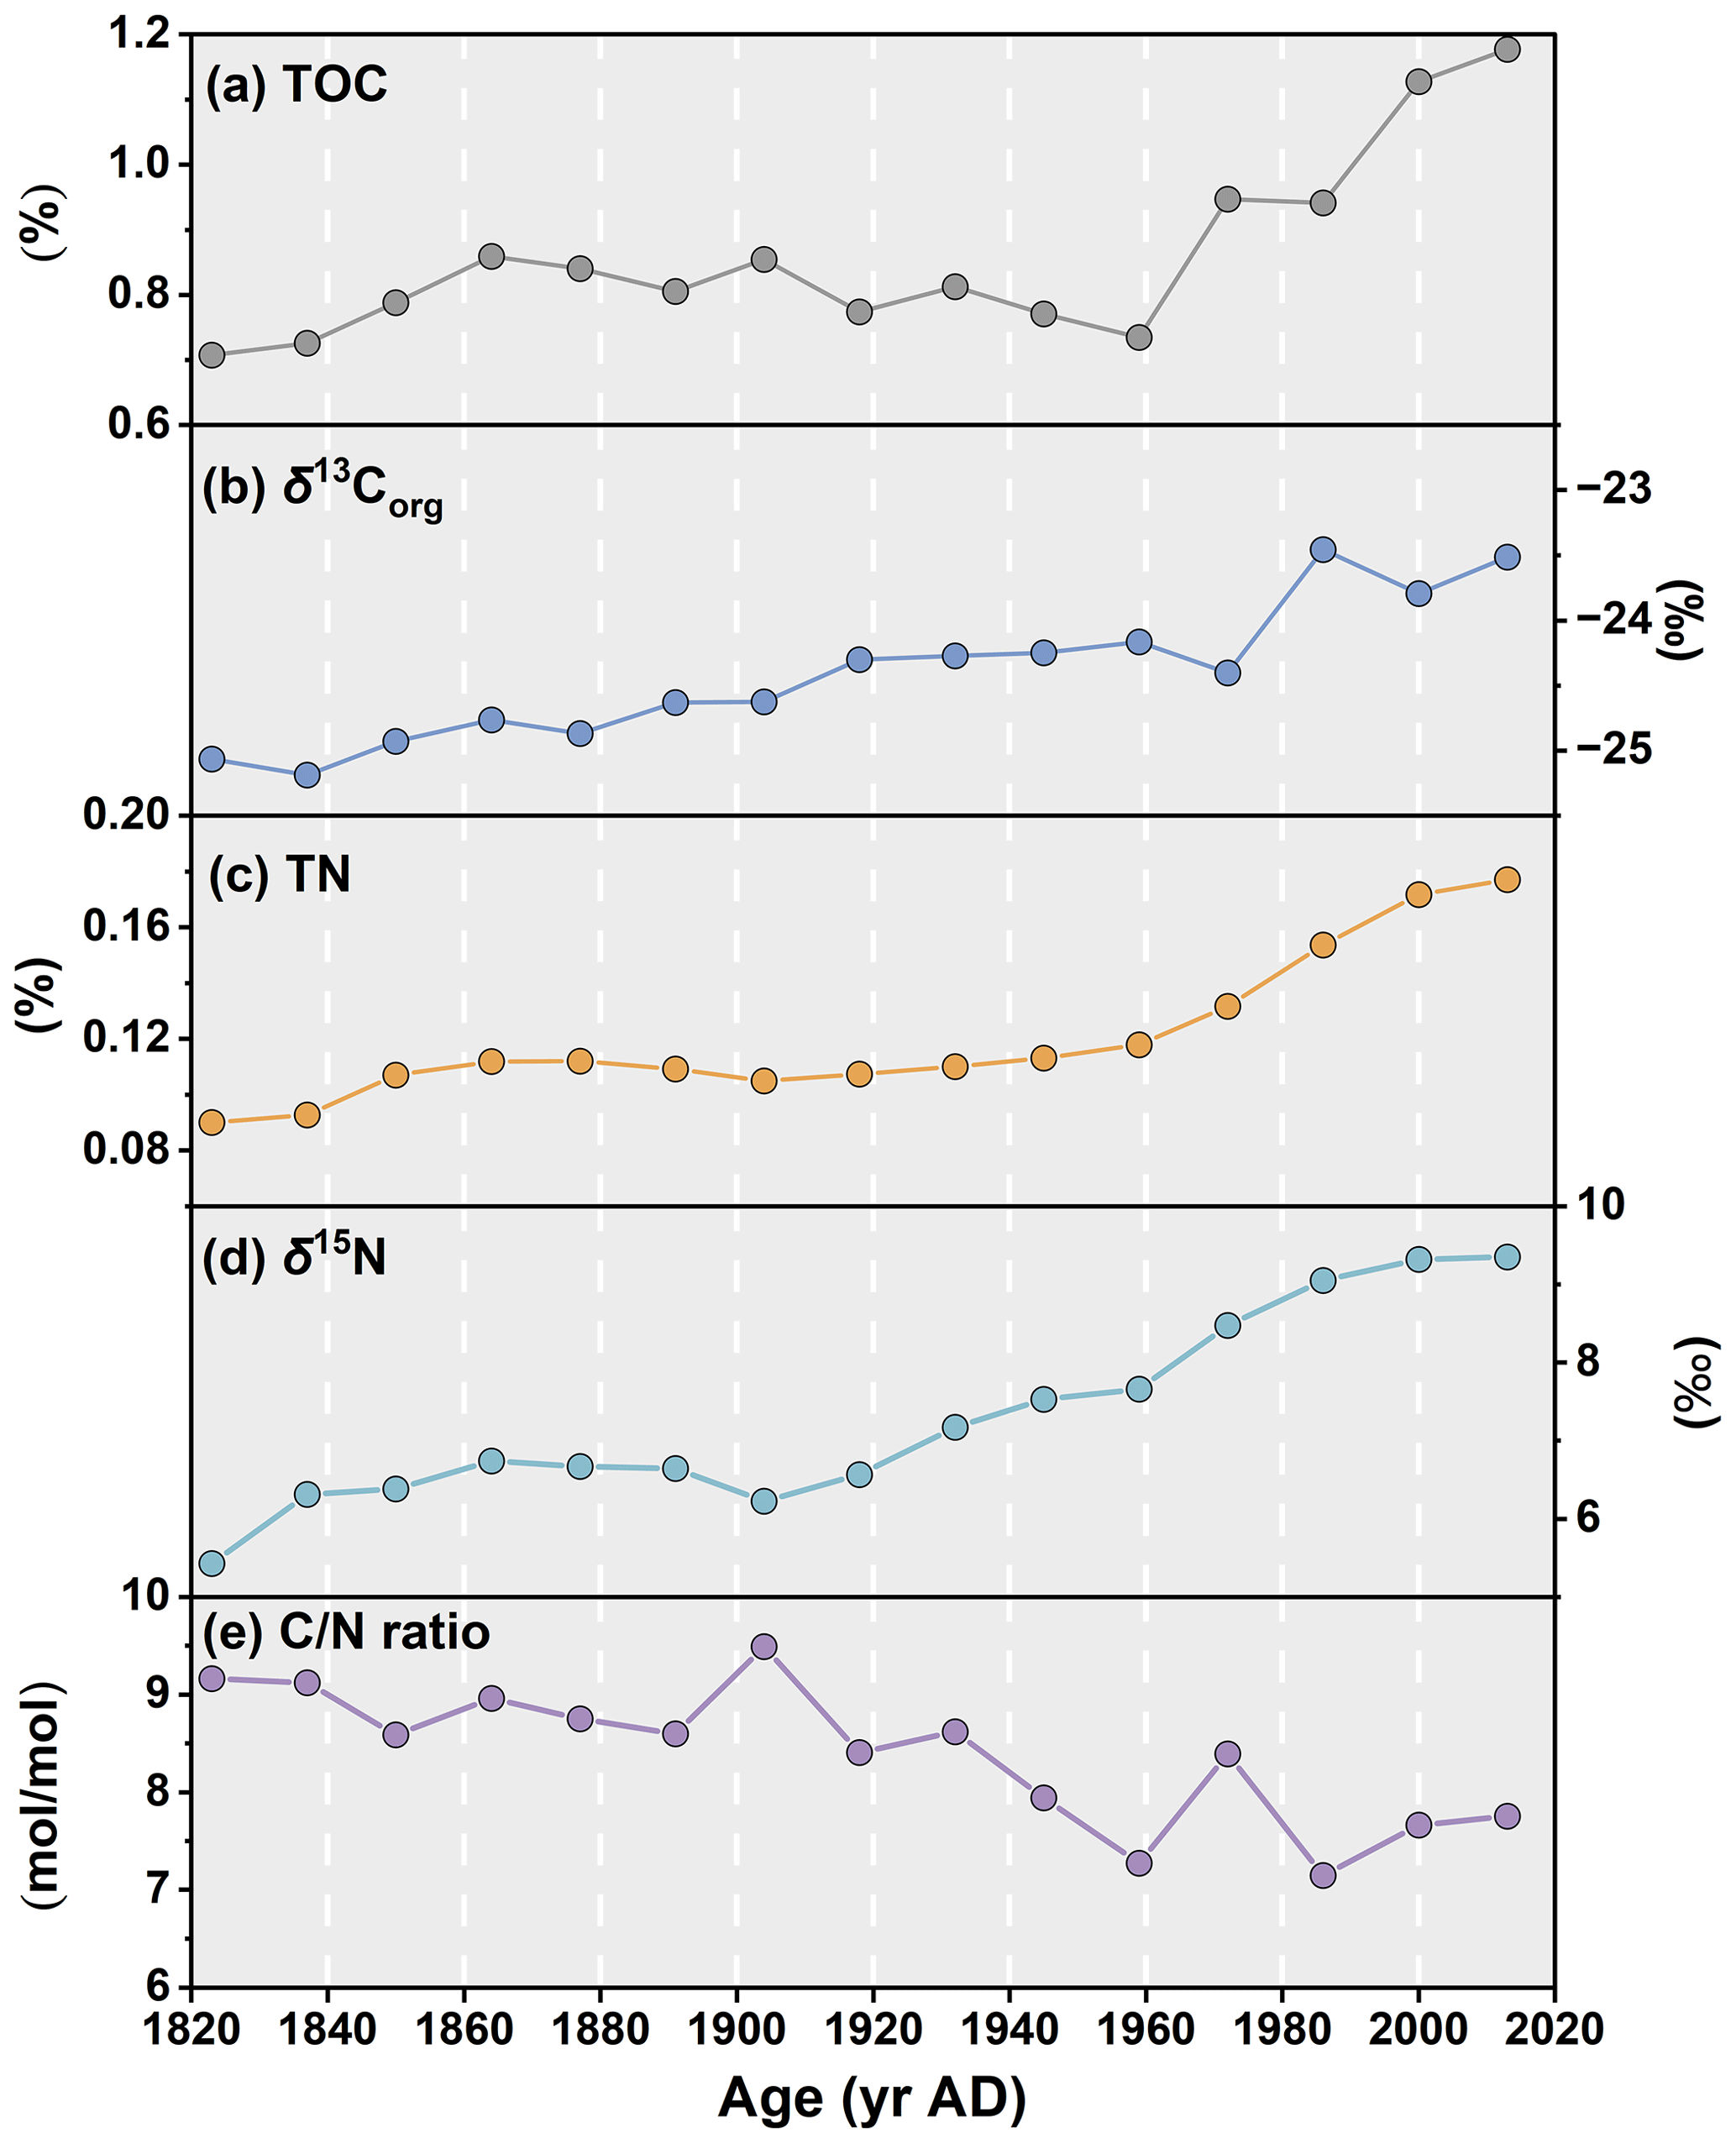
Figure 3Downcore profiles of (a) total organic carbon, TOC, in %; (b) organic carbon isotopic composition (δ13Corg) of the TOC in ‰; (c) total nitrogen, TN, in %; (d) nitrogen isotopic composition (δ15N) in ‰; and (e) ratio in the ARC11-R1 core.
Table 2Summary of bulk parameters and biomarker data from core ARC11-R1.
* In µg g−1 TOC.
The IP25 concentrations span from 0.18 to 0.85 µg g−1 TOC with highest values found in the 1930s and after the 1980s (Fig. 4a). Brassicasterol and dinosterol both exhibit increasing abundances over time (Fig. 4d, r2=0.85, p<0.01), with brassicasterol being notably more abundant (6.51 µg g−1 TOC to 40.04 µg g−1 TOC) than dinosterol (2.40 µg g−1 TOC to 8.73 µg g−1 TOC; Fig. 4d). Finally, terrestrial sterols slowly increase from the 1820s to present in the R1 core (campesterol: 10.47 µg g−1 TOC to 68.98 µg g−1 TOC; β-sitosterol: 4.15 µg g−1 TOC to 17.02 µg g−1 TOC; Fig. 4e).
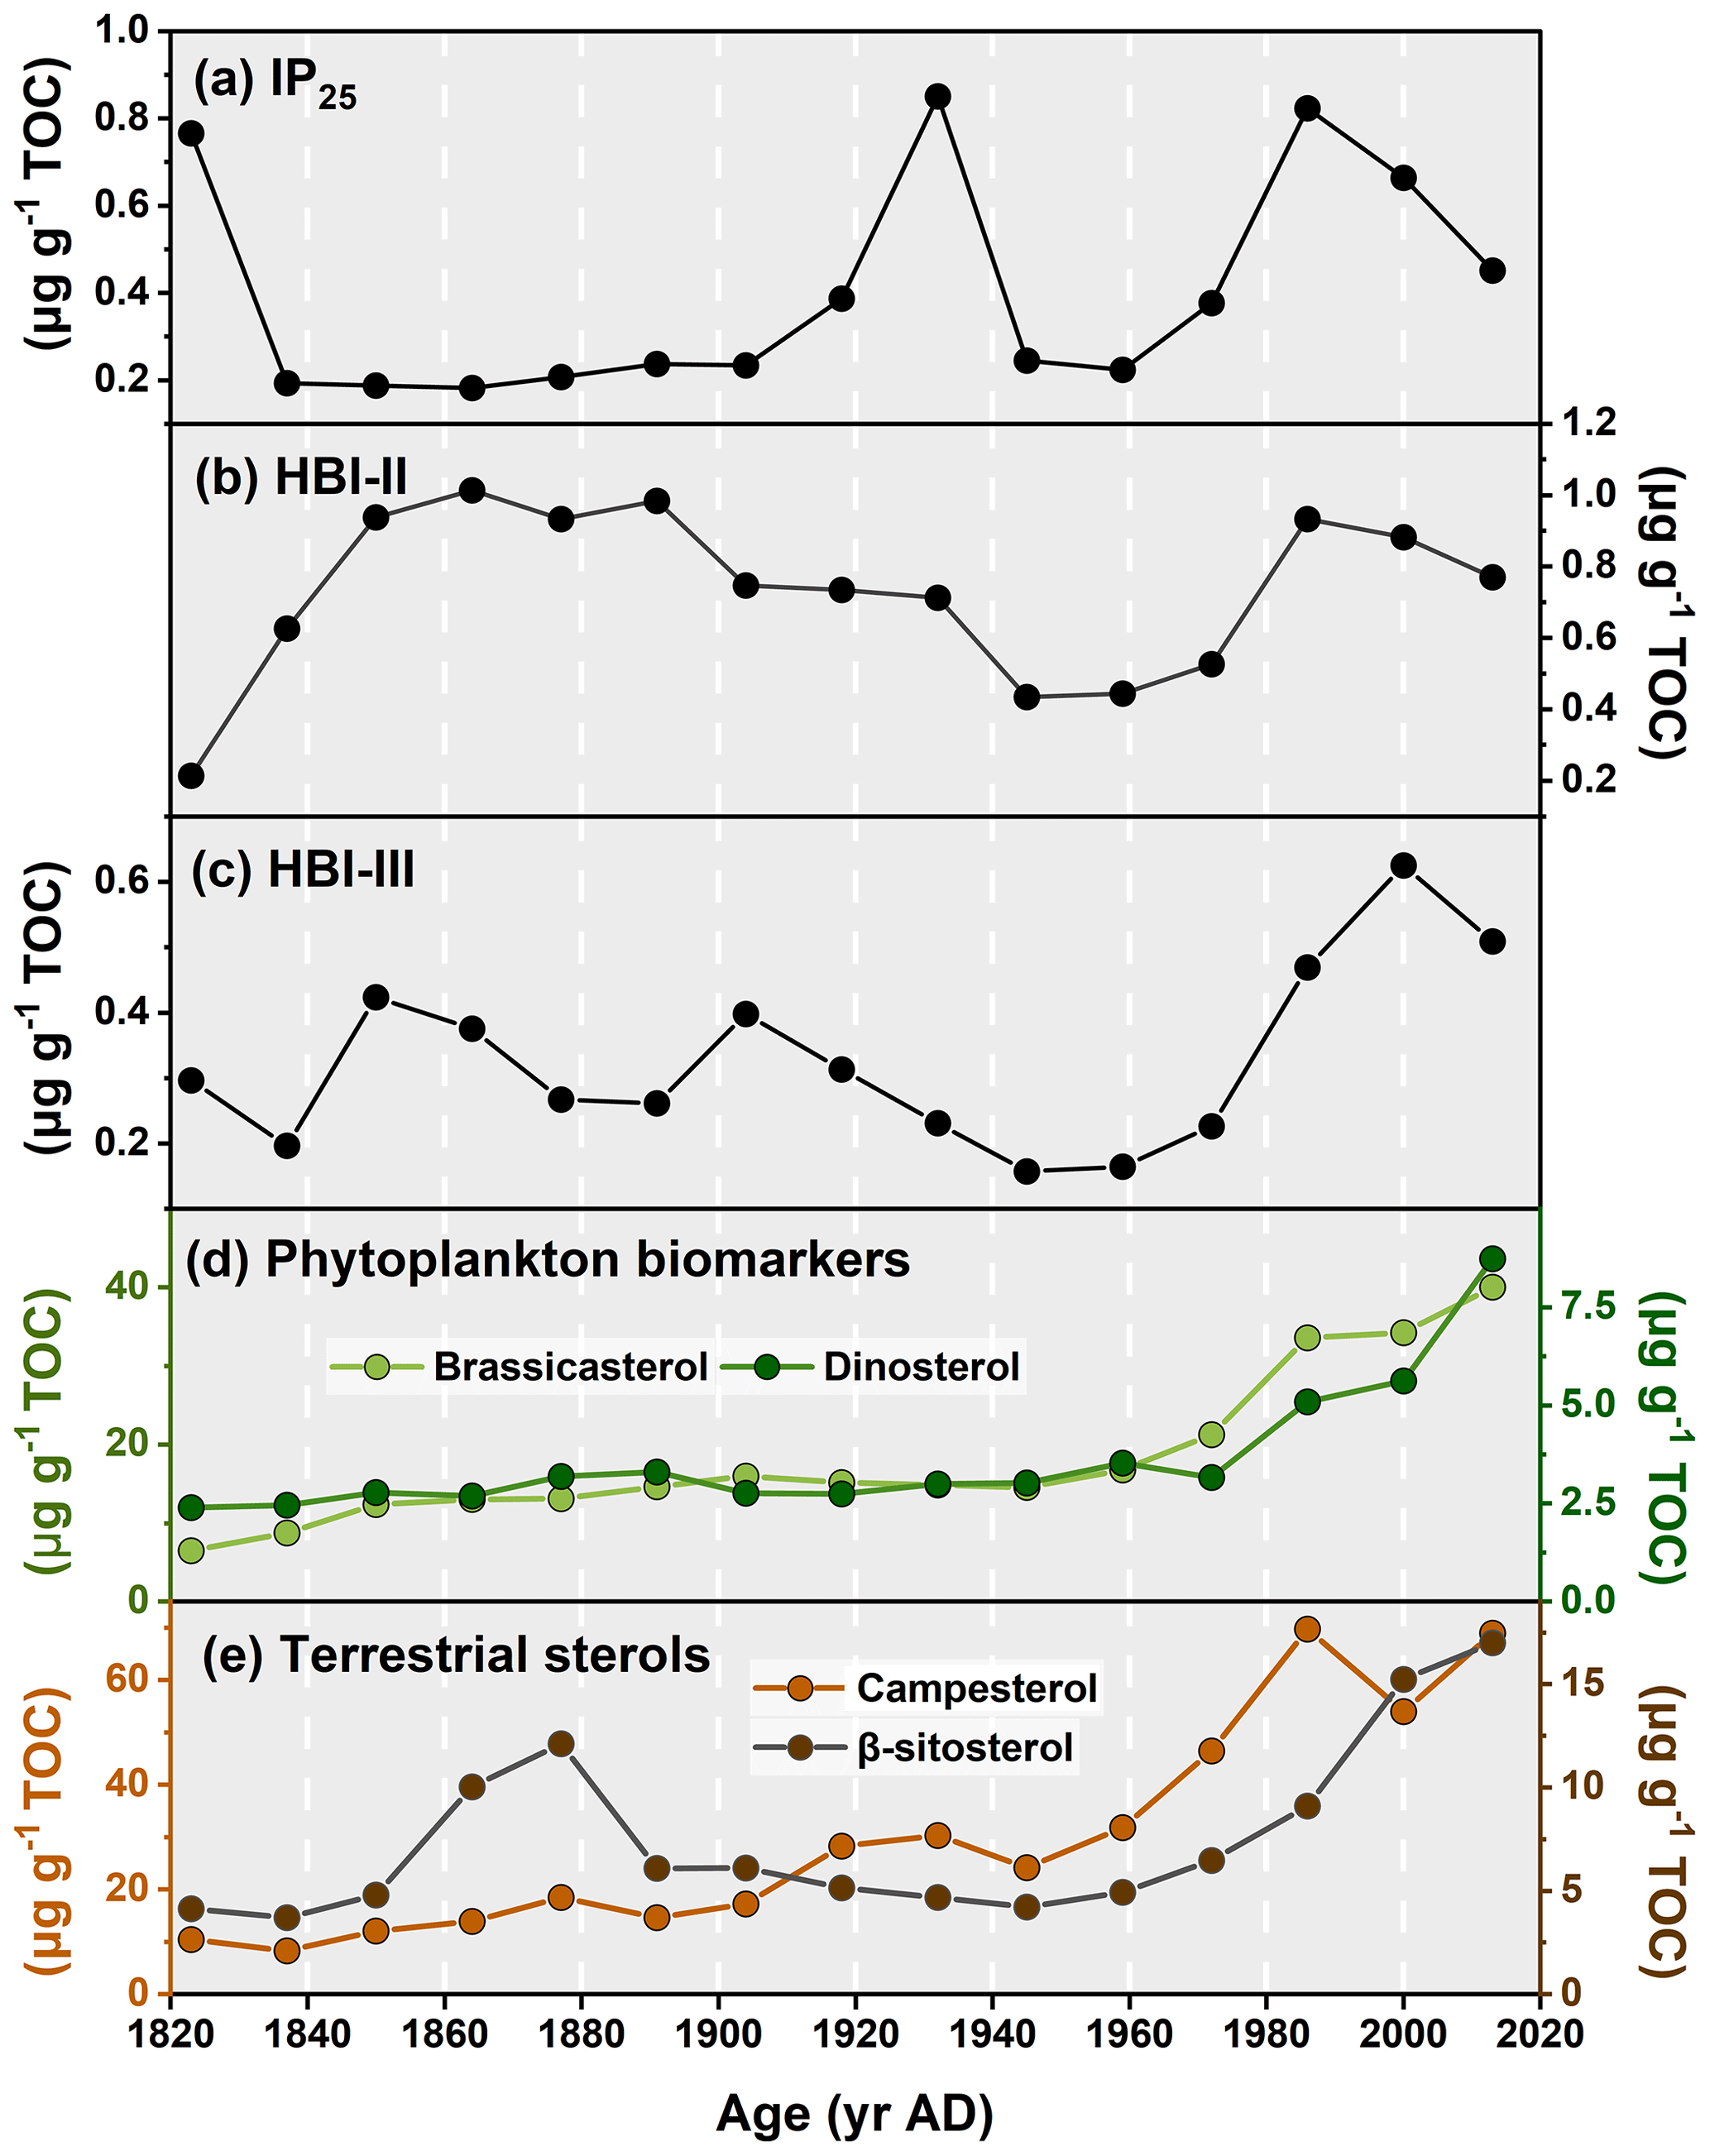
Figure 4Downcore profiles of (a) IP25, (b) HBI-II, (c) HBI-III, (d) brassicasterol and dinosterol, and (e) campesterol and β-sitosterol in core ARC11-R1.
Figure 5PIP25 index using brassicasterol (in green; PBIP25, c=0.02 as calculated by Xiao et al., 2015a), dinosterol (in purple; PDIP25, c=0.11 as calculated by Xiao et al., 2015a), and HBI-III (in orange; PIIIIP25, c=0.63 as calculated by Smik et al., 2016) and September sea ice extent record for the Chukchi Sea (red line, Walsh et al., 2017).
5.1 Reconstruction of sea ice conditions
Sympagic biomarker IP25 concentrations (0.40±0.25 µg g−1 TOC, mean ± SD) were lower throughout the R1 core than those found over the same period in the ARA01B-03MUC (0.96±0.72 µg g−1 TOC; Kim et al., 2019) and ARC04-C07 cores (1.29±1.19 µg g−1 TOC; Bai et al., 2022), both located south of the R1 core (Fig. S2 in the Supplement). Decreasing sympagic biomarker concentrations with increasing latitude likely reflect lower export of sympagic OC to the sea floor due to higher sea ice cover in the North. However, this interpretation does not rule out a possible contribution of analytical methods and/or regional depositional conditions (Belt, 2018). The box plot in Fig. S2 in the Supplement also points to higher variability at the two further-south sites, possibly reflecting sea ice edge variations. The presence of IP25 throughout R1 indicates seasonal sea ice cover and/or sea ice edge conditions since the 1820s at this location. While Bai et al. (2022) reported parallel trends of IP25 and HBI-II throughout core ARC4-C07, this feature is only observed after the 1930s in core R1 (Fig. 4a and b). Indeed, before 1930s, these two HBIs show opposite behavior. The reasons for this discrepancy are not entirely clear, and few data exist to explore in depth possible explanations. It is worthy to note that both HBIs in the sediment trap at the DM station (74∘ N) shown similar production and export behavior (Bai et al., 2019). HBI-II is commonly found in Southern Ocean sediments, unlike IP25, where its production has been attributed to the sea ice diatom Berkeleya adeliensis (Belt et al., 2016; Brown et al., 2014a). It was also noted that B. adeliensis tends to preferentially flourish in platelet ice, particularly in coastal settings, leading to the linking of its occurrence to landfast sea ice associated with freshwater discharge in Southern Ocean sediments (Belt, 2018, 2019). The divergent behavior of the HBI-II and IP25 prior the 1930s could thus indicate variable sea ice conditions, with a possible contribution of drifting ice from coastal areas of the ESS.
Combined IP25 and pelagic phytoplankton biomarkers were investigated to quantify downcore seasonal sea ice cover. To test the sensitivity of PIP25 to the c factor, PIP25 values were calculated using the different c factors of Xiao et al. (2015a) and Smik et al. (2016) and the c factor calculated from surface sediments collected from the CS and R1 for this study. The estimated PIP25 values were found to be consistent with each other with comparable fluctuations (Fig. S3 in the Supplement). Additionally, a previous study in the same region suggested that the PIP25-derived sea ice reconstructions were more reliable when using c factors from the Pan-Arctic database (Kim et al., 2019). Thus, in this study, PBIP25, PDIP25, and PIIIIP25 were calculated using surface sediment balance factors c of 0.02, 0.11 (Xiao et al., 2015a), and 0.63 (Smik et al., 2016), respectively. All indexes show similar trends (Fig. S3 in the Supplement), reflecting the strong correlation between brassicasterol, dinosterol, and HBI-III (Figs. 5 and S4 in the Supplement; all: r>0.63, p<0.01). Only in the 1820s and 1930s are PIP25 values above the threshold of 0.75 indicative of permanent sea ice according to Müller et al. (2011) (Fig. 5).
Between the 1820s and 1850s, all PIP25 values steeply drop, suggesting rapid sea ice retreat. Then, PBIP25 and PDIP25 show rather stable values till the beginning of the 20th century, whereas PIIIIP25 values slowly increase (Fig. 5). All three PIP25 indexes point to seasonal sea ice or marginal ice zone conditions. Higher amounts of HBI-III and PIIIIP25 values may indicate sea ice edge conditions. Sediment trap data from the Northwind Ridge and slope of the East Siberian Sea show high levels of brassicasterol till late summer or early autumn when ice-free conditions are reached, whereas HBI-III is close to the detection limit in mid-summer when sea ice has melted (Bai et al., 2019; Gal et al., 2022). This result further confirms that HBI-III producers proliferate at the sea ice edge rather than in ice-free waters. From the 1850s to 1910s, both PBIP25 and PDIP25 were below 0.5, pointing to less and variable sea ice cover than at the end of early 19th century, contrarily to observations indicating high sea ice cover (Walsh et al., 2017). PIIIIP25 falls in a higher sea ice cover range. Increasing PDIP25 and PBIP25 values between the 1910s and 1930s occur, while observations indicate a significant reduction of sea ice from permanent to marginal sea ice (Walsh et al., 2017). The bias with regard to higher sea ice cover estimates using PIIIIP25 is explained by HBI-III production taking place at the ice edge rather than under ice-free conditions. Low concentrations of IP25 and phytoplankton biomarkers during this period may also result in uncertainties in the calculation of the PIP25 index (Fig. 6), as suggested by previous studies (Müller et al., 2011; Xiao et al., 2015b). Observation data of September sea ice extent since 1850 in the Chukchi Sea (Walsh et al., 2017) also support high sea ice conditions between the 1820s and 1930s (Fig. 5).
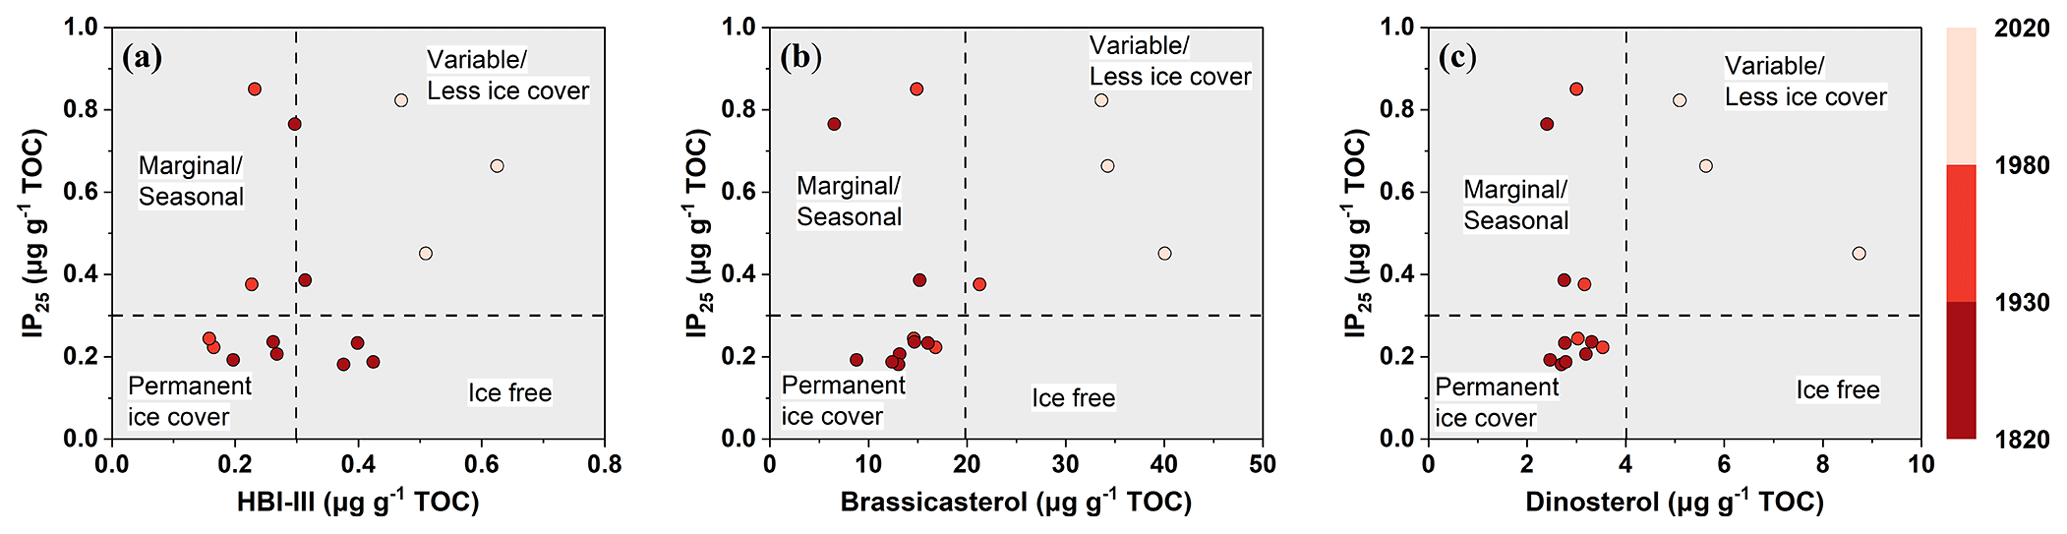
Figure 6Cross plot between concentrations of IP25 and phytoplankton biomarkers – (a) HBI-III, (b) brassicasterol, and (c) dinosterol, respectively – in the ARC11-R1 core, distinguishing between different spring and summer sea ice condition zones. The gradient from dark- to light-red represents the periods of 1820–1930, 1930–1980, and 1980–2020, respectively.
After the 1930s, PIIIIP25 gradually decreased to ca. 0.7, while PBIP25 and PDIP25 dropped to lower values around 0.4 till the 1960s and then slightly increased until the 1980s–1990s when PBIP25 and PDIP25 exceeded the seasonal sea ice threshold value (0.5) and PIIIIP25 was that of nearly permanent sea ice at approximately 0.75. In this time interval (1930s–1980s), low IP25 and increasing brassicasterol in cores ARC4-C07 and ARA01B-03MUC suggest enhanced sea ice melting and the northward retreat of the summer ice edge (Fig. S5 in the Supplement). From the 1980s to present, PBIP25 and PDIP25 continued to decrease but at a faster rate (Figs. 5 and 7a–c), emphasizing the unprecedented decline of seasonal sea ice over the last 30 years, as also found by Astakhov et al. (2019) and shown by remote sensing data (Walsh et al., 2017; Y. Wang et al., 2019).
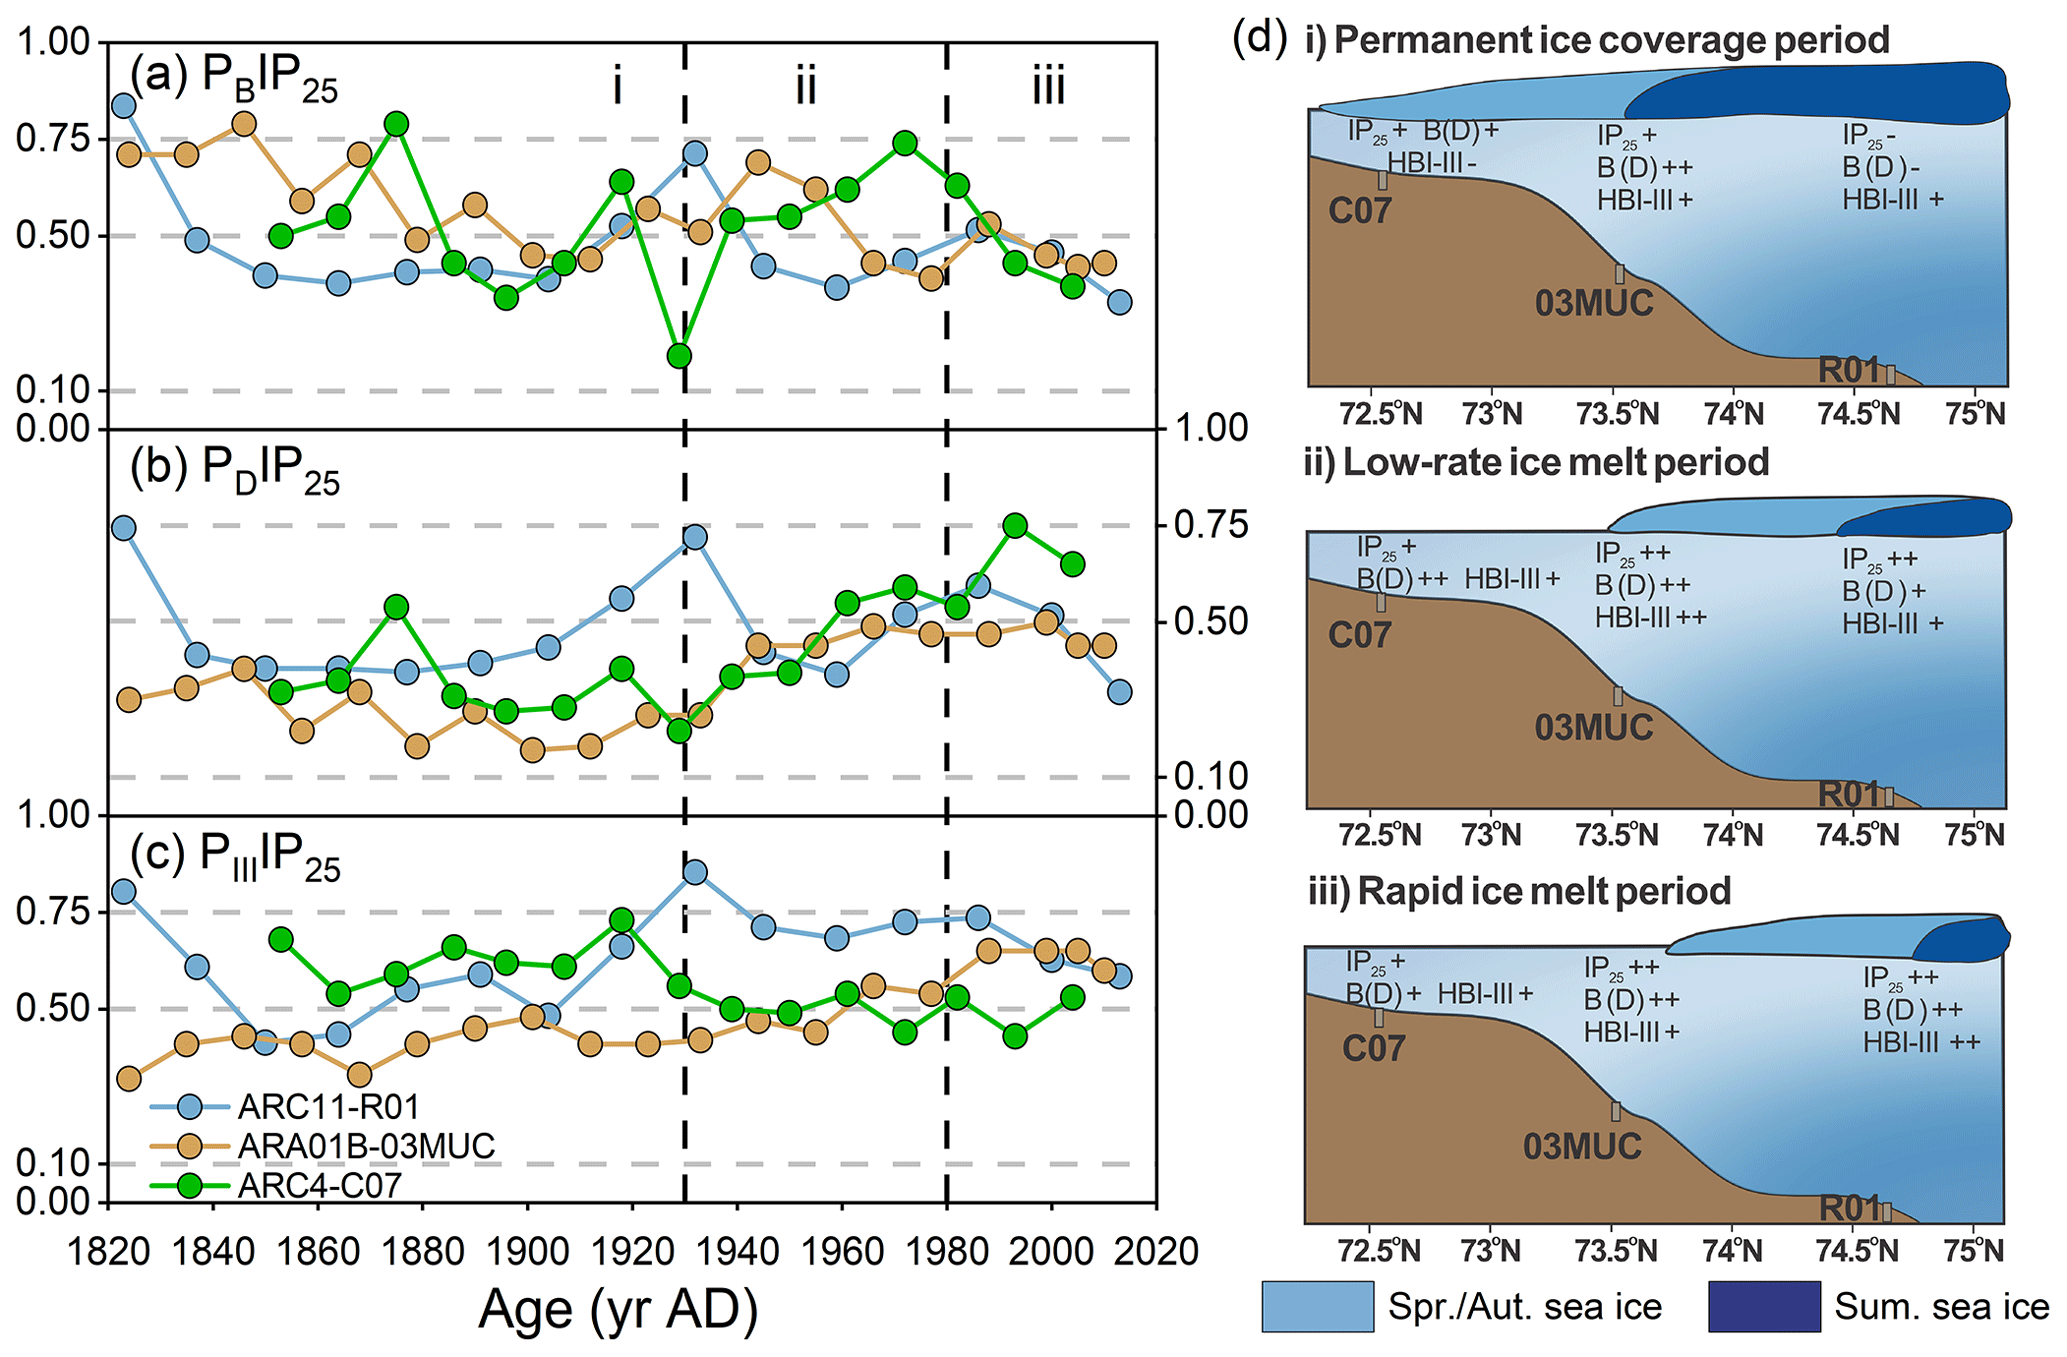
Figure 7Downcore profiles of (a) PIP25 index using brassicasterol (PBIP25), (b) dinosterol (PDIP25), and (c) HBI-III (PIIIIP25) in the cores ARC04-C07 (green; Bai et al., 2022), ARA01B-03MUC (yellow; Kim et al., 2019), and ARC11-R1 (blue); i, ii, and iii in (a)–(c) represent different sea ice cover scenarios, which are schematically illustrated in (d). The color of sea ice in (d) represents the different sea ice cover: light blue for spring and autumn sea ice and dark blue for summer sea ice.
In summary, the downcore profiles of seasonal sea ice proxies over the last 200 years evidence the following (Fig. 7d): (i) reconstructed lower sea ice cover contrasting with nearly permanent sea ice observation record between the 1820s and 1930s, implying the limitation of the PIP25 index under heavy sea ice condition; (ii) from the 1930s to 1980s, the seasonal sea ice slowly retreated to the north, and the summer sea ice edge gradually reached the location of the R1 core; (iii) a strong reduction in sea ice cover with summer sea ice edge conditions being reached since the 1980s at our core site. Finally, our findings highlight the need to further investigate the potential value of HBI-II in the Arctic Ocean to track drifting and landfast ice from coastal regions under the influence of freshwater discharge.
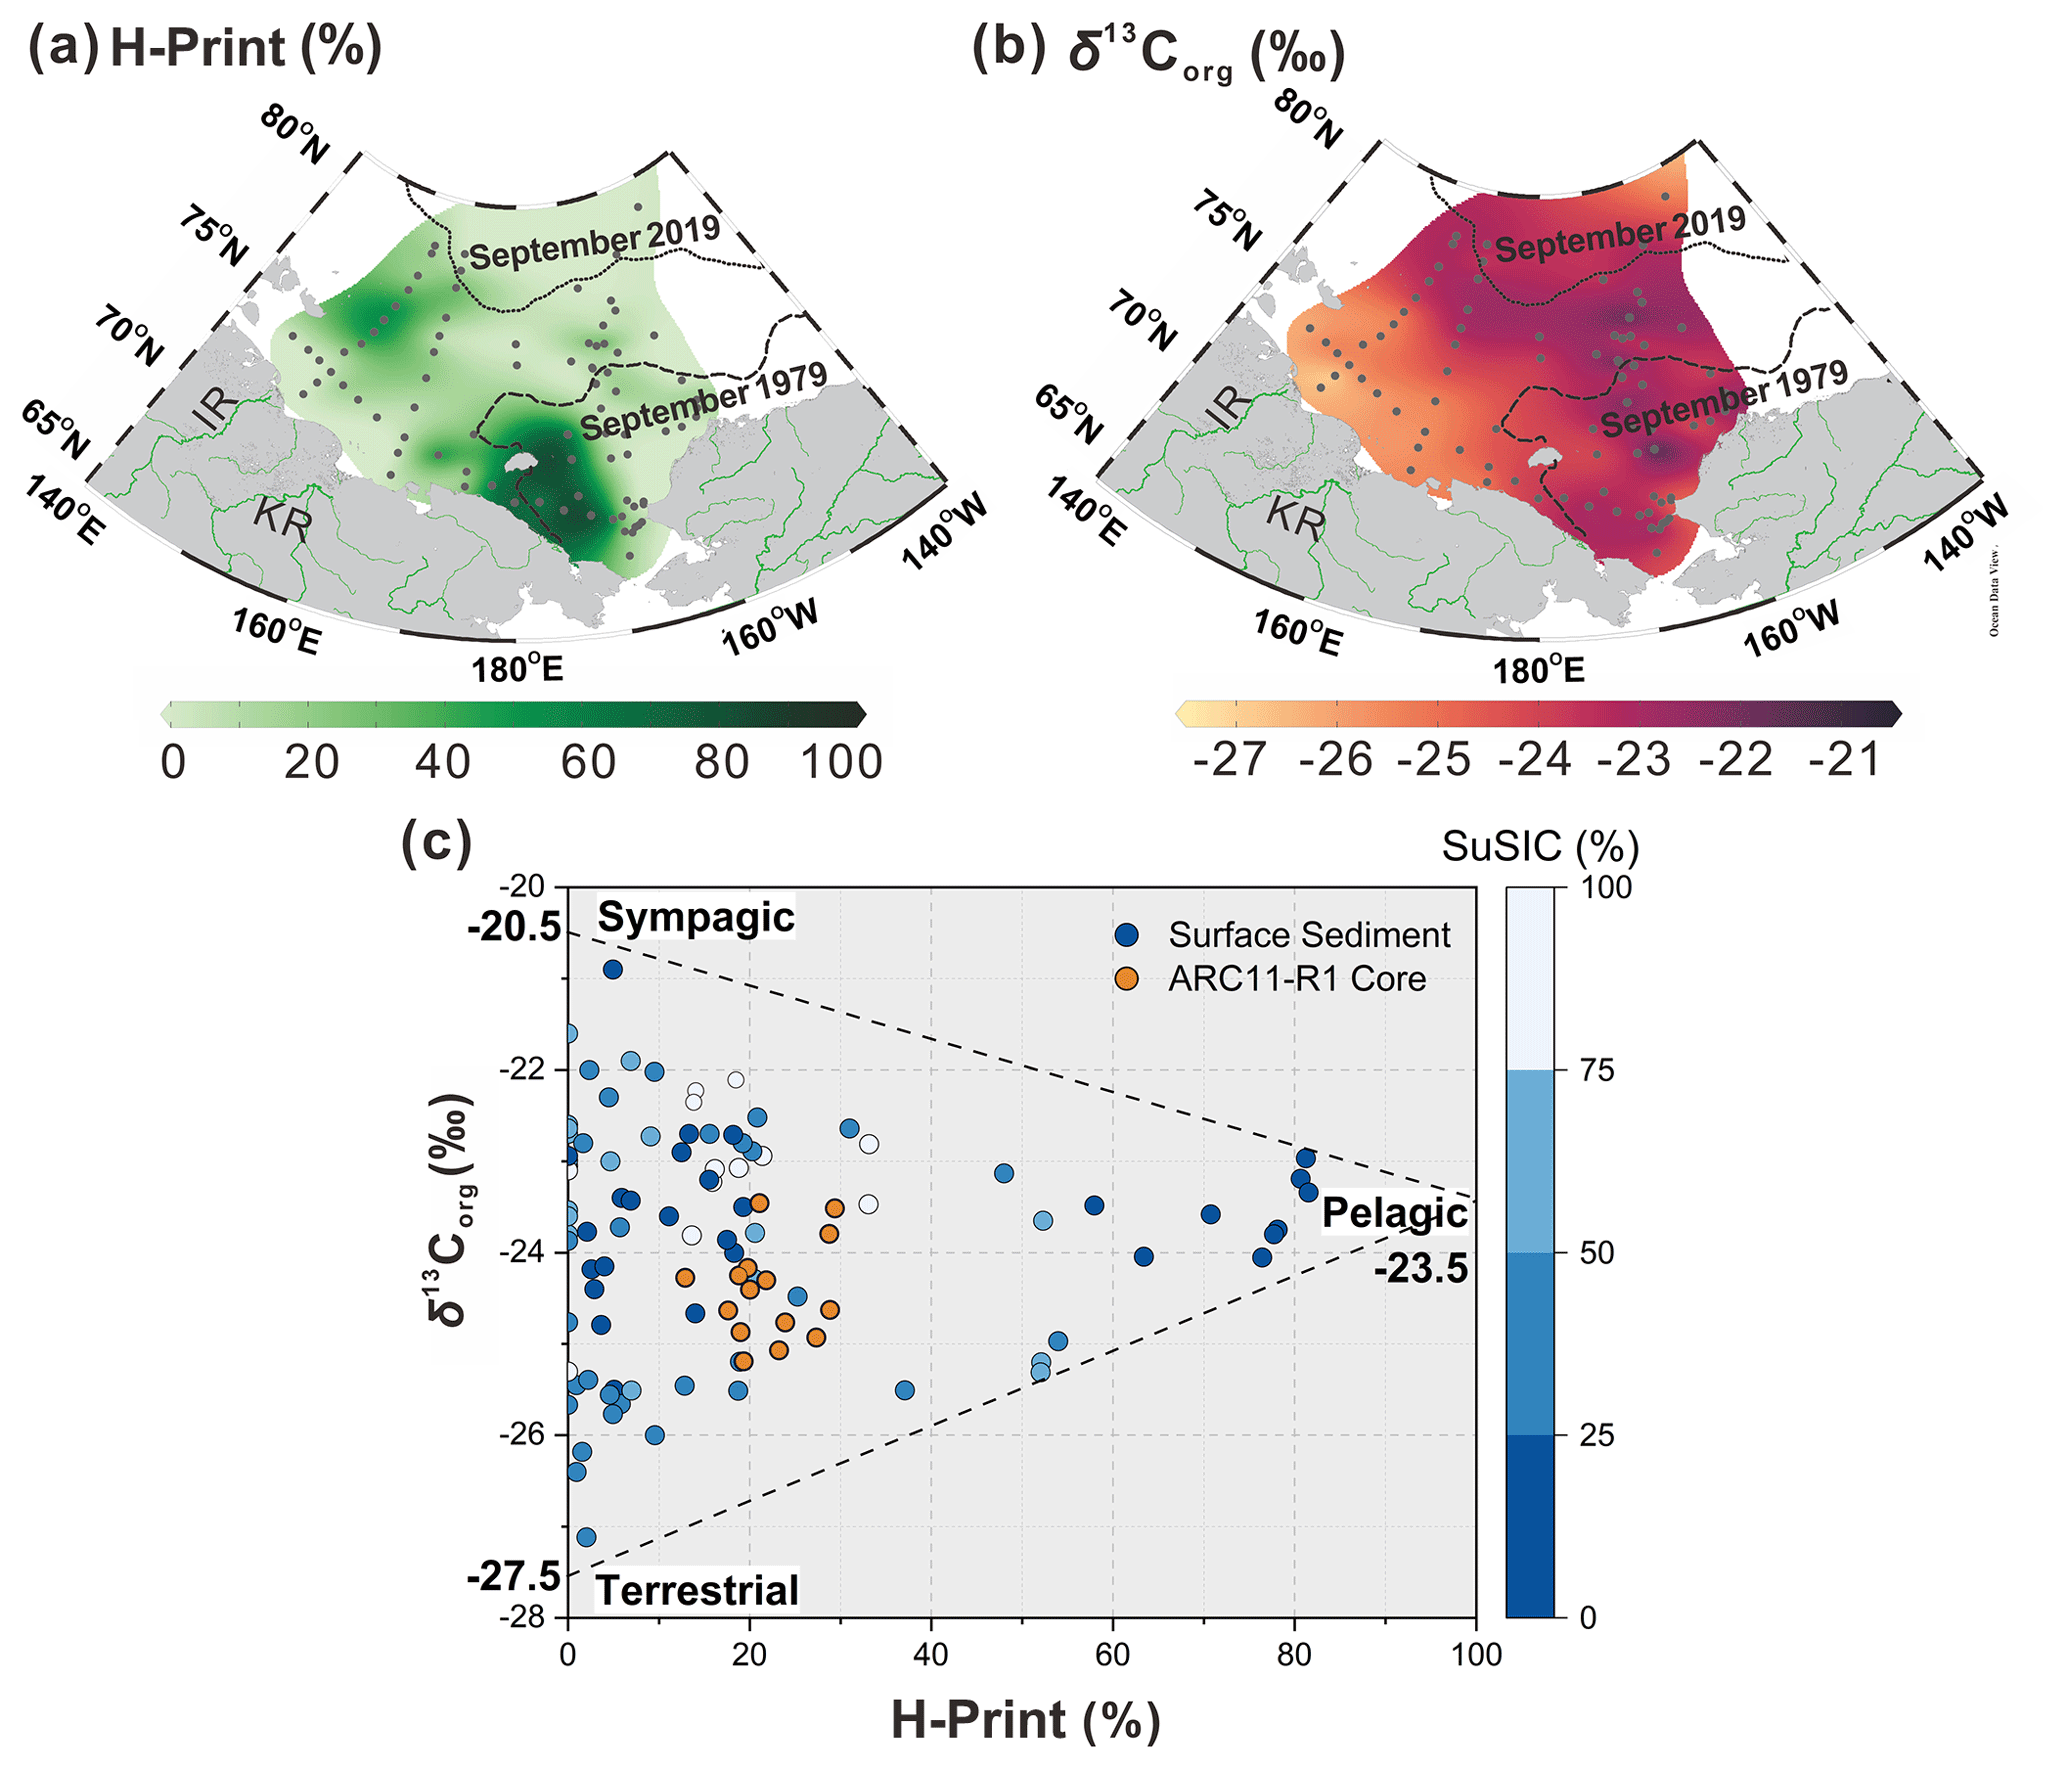
Figure 8Distribution of (a) H-Print and (b) δ13Corg in the surface sediments of the ESS and CS. (c) Cross plot of values of δ13Corg and H-Print for surface sediments. The gradient from dark blue to white represents SuSIC (summer sea ice concentration, NSIDC) from 0 %–25 %, 25 %–50 %, 50 %–75 %, and 75 %–100 %, respectively, and the ARC11-R1 core (in orange). The δ13Corg endmembers for the sympagic end-member at 0 % for the H-Print is −20.5 ‰. The pelagic δ13Corg end-member at 100 % for the H-Print is −23.5 ‰. The terrestrial δ13Corg end-member is −27.5 ‰. The dotted and dashed lines in black represent the 20 % isolines of September sea ice concentration for 2019 and 1979, respectively.
5.2 Organic carbon variability in response to sea ice change
5.2.1 Modern sources of organic carbon
The loss of sea ice is the most remarkable manifestation of global warming in the Arctic that has profound impacts on the carbon cycle. The most obvious one is the shift of the primary production pattern as a result of light and nutrient supply changes. Enhanced riverine inputs of terrestrial organic matter also affect the nature and amount of organic carbon reaching the Arctic Ocean. In this section, we investigate OC compositional changes over the past 200 years in relation to sea ice conditions by distinguishing three major carbon pools, e.g., sympagic, pelagic, and terrestrial. We use the H-Print ratio as a complementary indicator of PIP25 to discriminate between pelagic and sympagic marine sources (Brown et al., 2014b; Brown and Belt, 2017; Koch et al., 2020). As shown in Fig. 8a, high values of H-Print (>80 %) occur in the western CS where marine phytosterols are high (dinosterol concentrations > 5 µg g−1 TOC and brassicasterol concentrations > 100 µg g−1 TOC; Su et al., 2022). Intermediate values (30 %–60 %) roughly lie between the 1979 and 2019 isolines of the September minimum ice edge, denoting mixed pelagic and sympagic productions (Fig 8a). Minimum H-Print values are found in coastal sediments along the western ESS and suggest that freshwater discharge, by lowering water salinity, can suppress HBI-III production (Su et al., 2022) (Fig. 8a). At higher latitudes, low H-Print values are likely to reflect light limitation due to nearly permanent sea ice cover (Fig. 8a).
Earlier studies of Arctic Eurasia estuary sediments have reported δ13Corg values ranging from −27.8 ‰ to −24.7 ‰ (Bröder et al., 2019; Tesi et al., 2014). The lowest values (−27.5 ‰ to −26 ‰, Fig. 8b) are found in the western ESS shelf sediments that receive land-derived material from the Indigirka and Lena rivers, in agreement with previous data (−27.5 ‰ to −25.5 ‰; Bröder et al., 2019). Apart from permafrost thawing, sea ice retreat likely accelerated coastal erosion, contributing to the transfer of allochthonous material towards the Arctic Ocean (Overeem et al., 2011). The δ13Corg values of organic matter produced by phytoplankton in the Arctic Ocean vary around ‰ (Stein et al., 2004; Vonk et al., 2012), which are similar values to those found in the saline waters of the western CS, characterized by high pelagic production (Fig. 8b). Enriched δ13Corg values (−22 ‰ to −20.5 ‰) are also observed in the marginal ice zone or seasonal sea ice zone of the CS (Fig. 8b), where sea ice plankton production is significant, which is in accordance with values reported in sea ice (−23.6 ‰ to −18.3 ‰) (Schubert and Calvert, 2001).
δ13Corg and H-Print were combined to discriminate among autochthonous and allochthonous sources of OC in our surface sediments. As illustrated by the scatter plot in Fig. 8c, a three-end-member distribution emerged from the relationship between these two parameters and the summer sea ice concentration (SuSIC), demonstrating their potential to differentiate sympagic, pelagic, and terrestrial OC in our dataset. The site symbolizing the sympagic end-member is located at the sea ice edge, where sea ice phytoplankton production is high. Coincidentally, its δ13Corg value (−20.5 ‰) falls within the range of values reported in the lowermost 10 cm of sea ice cores (−23.6 ‰ to −18.3 ‰; Schubert and Calvert, 2001) and is close to the mean δ13Corg value of sedimentary IP25 (−19.3 ‰ ± 2.3 ‰; Belt et al., 2008). The terrigenous end-member is consistently represented by sites located in estuarine zones or where land-derived supply dominates. Pelagic end-member values (−23.5 ‰) are encountered in the western CS, where phytoplankton productivity is the highest and where the influence of terrigenous and sea ice carbon is less pronounced. This more depleted value as compared to IP25 is consistent with the latter being produced in sea ice. Indeed, the δ13Corg of the two marine components also depends on pCO2. Higher pCO2 in surface waters may result in lower δ13Corg in pelagic marine algae OC, while sea ice diatoms are relatively enriched in δ13Corg due to potentially limited CO2 in sea ice (Tortell et al., 2013). It should be pointed out that our surface sediment dataset covers the nearshore, shelf, and basin regions, with different deposition rates; therefore, the OC source apportionment reflect several tens to hundreds of years, depending on the location (Bröder et al., 2016; Baskaran and Naidu, 1995; Vonk et al., 2012; Li et al., 2020). Nevertheless, H-Print, δ13Corg, and SuSIC successfully discriminate between OC sources.
Based on these results, a ternary mixing model was used to calculate the relative contribution of sympagic, pelagic, and terrestrial sources in our surface sediments (Figs. 8c and S6; Table S1 in the Supplement) using the following equations:
where fsym, fpela, and fterr are the sympagic, pelagic, and terrestrial fractions of OC, respectively. The δ13Corg endmembers used for the sympagic end-member at 0 % for H-Print is −20.5 ‰. The pelagic δ13Corg end-member at 100 % for H-Print is −23.5 ‰. The terrestrial δ13Corg end-member is −27.5 ‰.
5.2.2 Source and burial of organic carbon change over the last 2 centuries
In this section, we examine the temporal evolution of sympagic, pelagic, and terrestrial fractions of OC calculated with our ternary mixing model and end-member values, with changing sea ice conditions over the last 2 centuries. Figure 9a shows that TOC values slowly increase between 1820 and 1860 and remain relatively stable around 0.8 % until 1960, where they increase rapidly to reach their highest levels (1.17 %) at the core top, falling within the range reported in the surface sediments of the CS shelf and the CP (1.25 % to 2.56 %, Goñi et al., 2013; 0.31 % to 1.73 %, Ji et al., 2019). This trend is paralleled by increasing δ13Corg values (Fig. 9a), suggesting that higher TOC may be related to enhanced marine production (primary and secondary). Indeed, sea ice retreat and increased ice-free conditions are expected to result in higher rates of primary production due to higher light penetration and more nutrient supply both from rivers and via wind-driven mixing. In addition, a longer season of production will also subsequently enhance production and export to the sea floor (Ouyang et al., 2022; Zhuang et al., 2022).
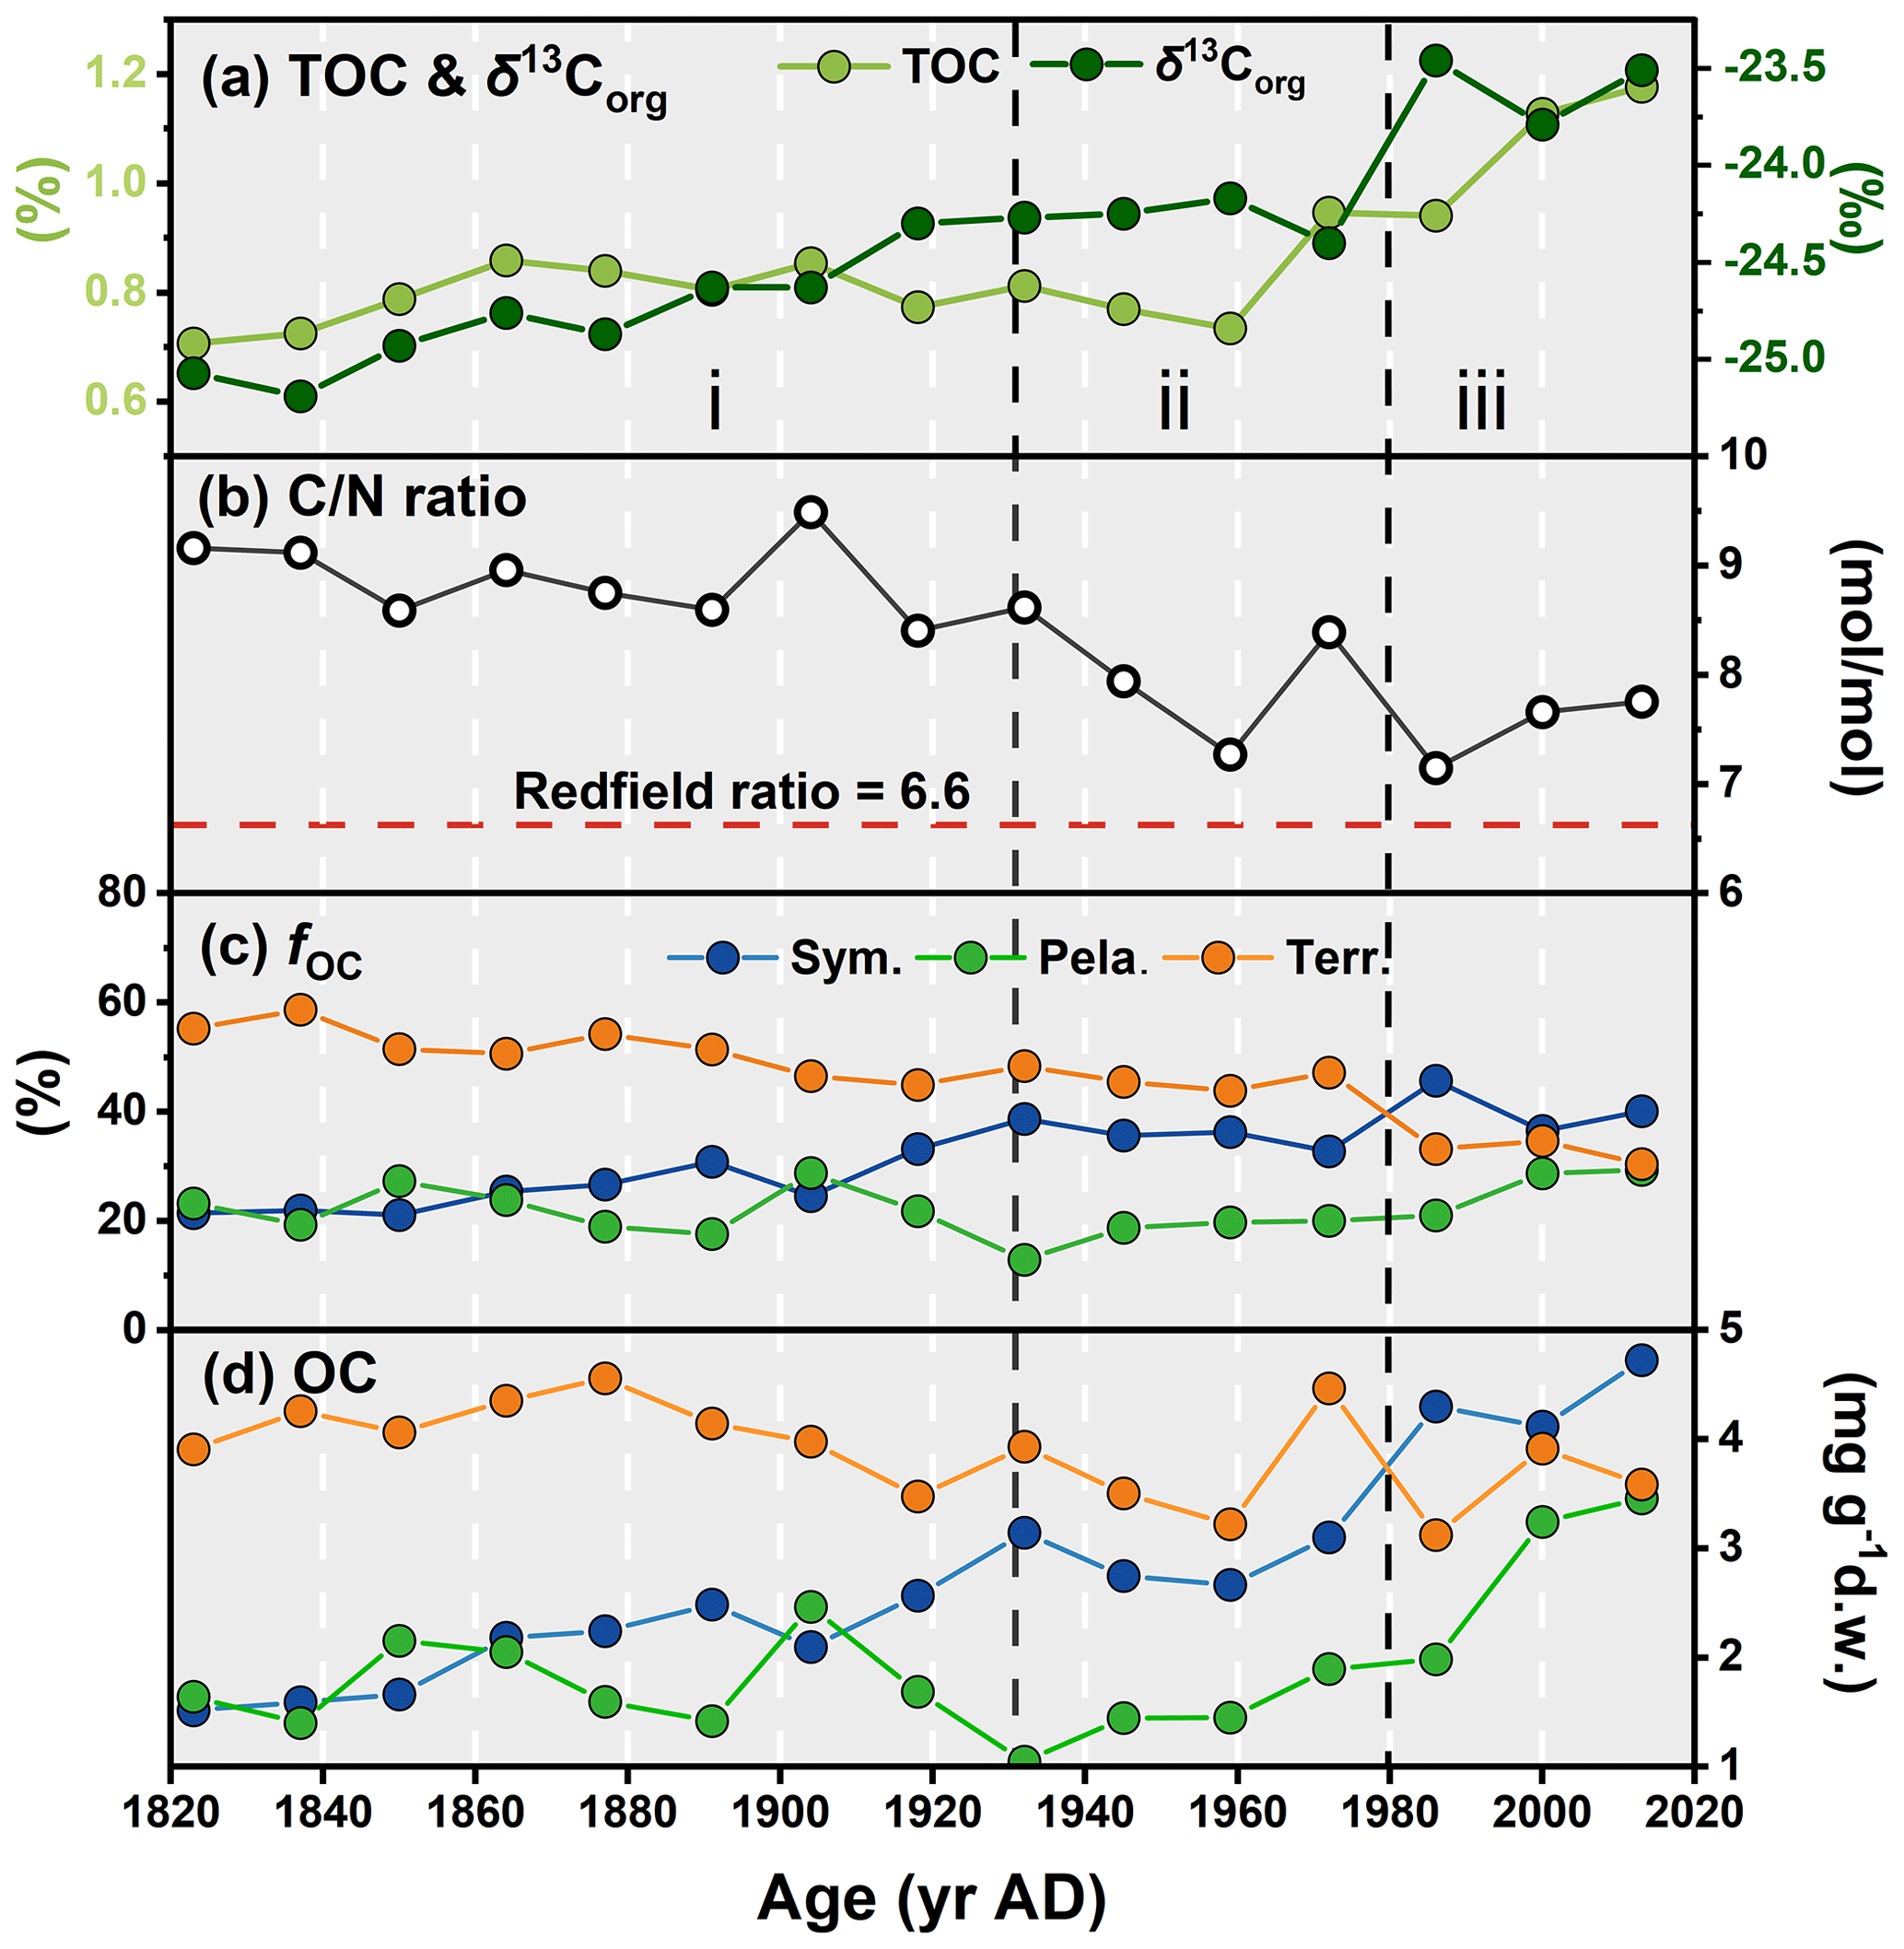
Figure 9Downcore profiles of (a) TOC and δ13Corg, (b) ratio, (c) proportion of the overall OC from each source (fOC, calculated based on δ13Corg and H-Print), and (d) OC (mg g−1 d.w., dry weight) in the ARC11-R1 core. In (c) and (d), blue, green, and orange dots represent the sympagic, pelagic, and terrestrial carbon input, respectively.
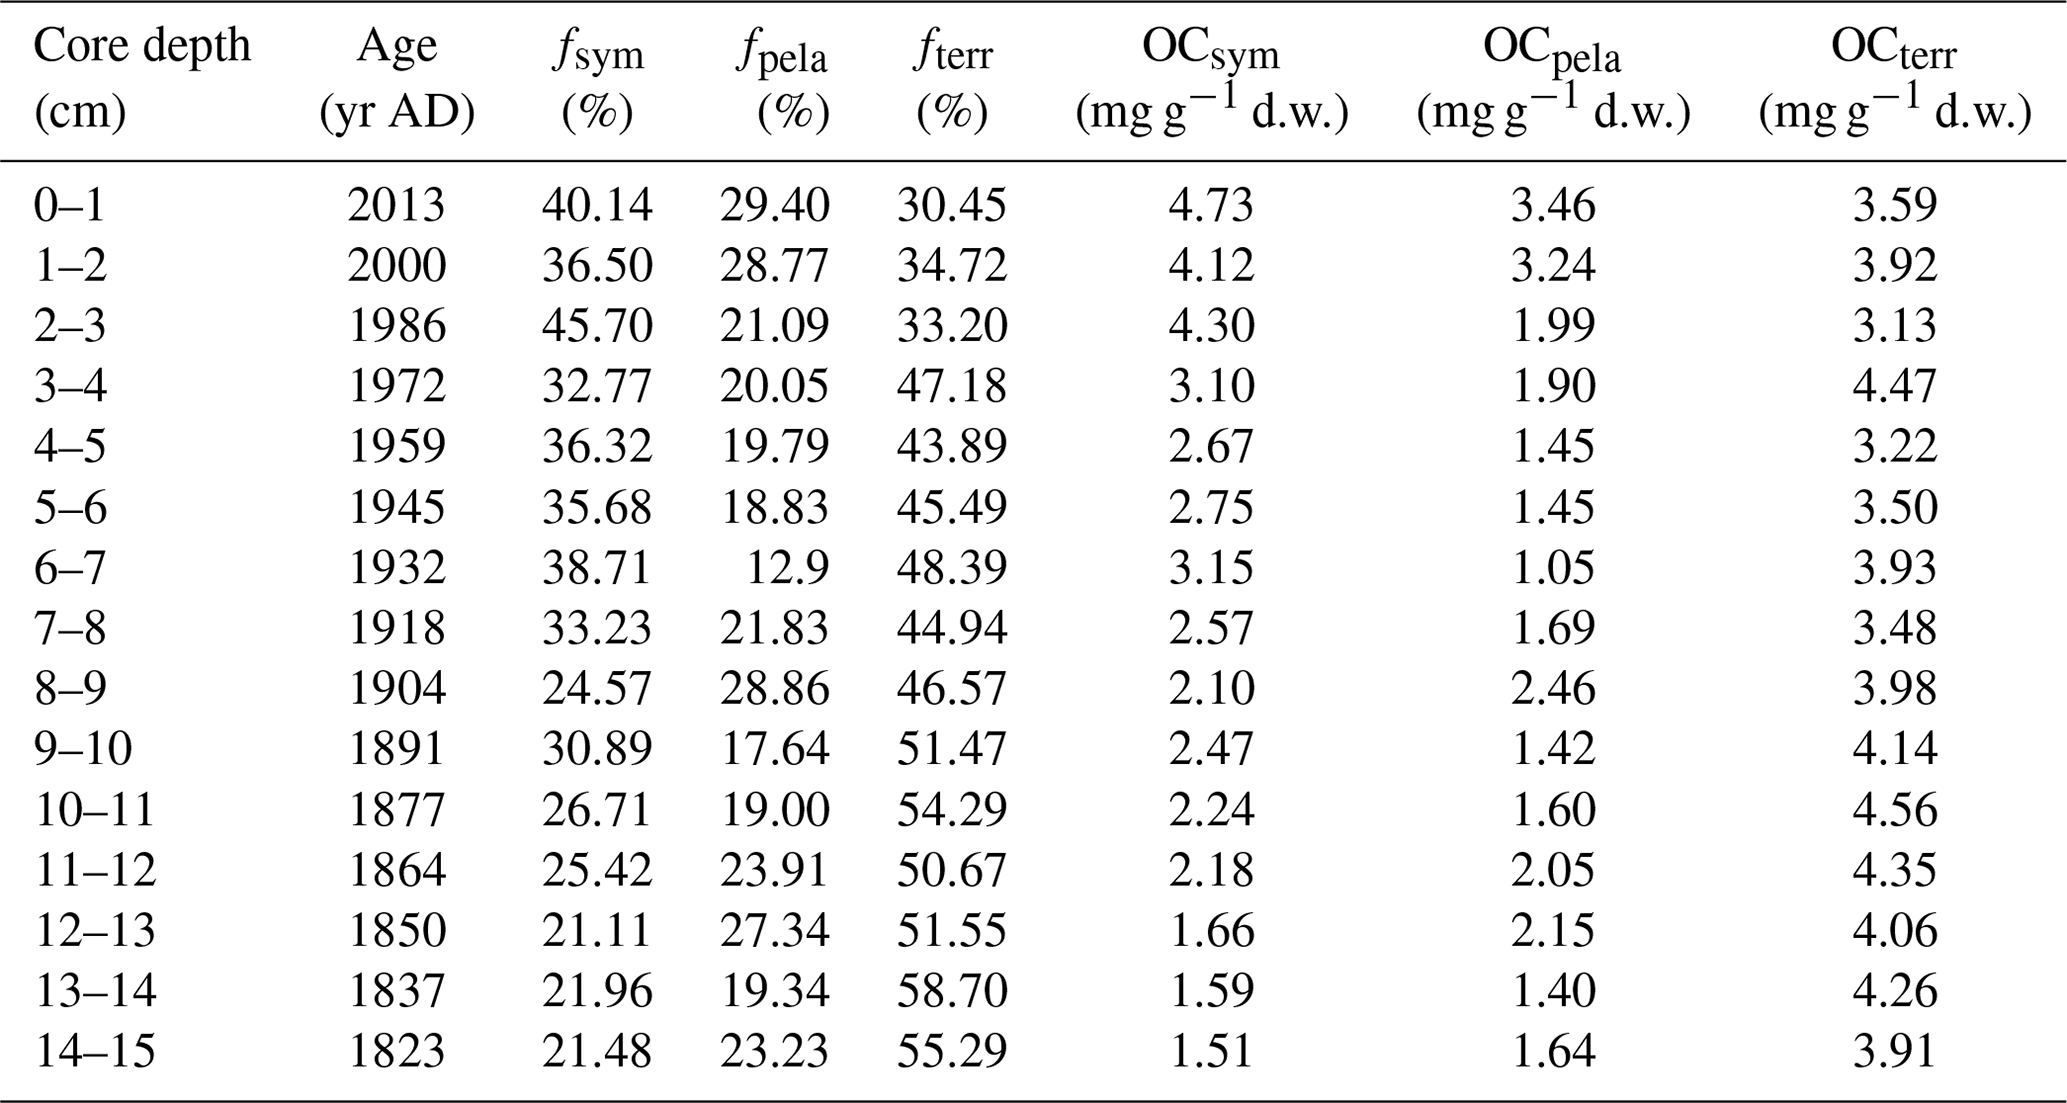
Table 3Overall organic carbon composition of core ARC11-R1 (relative portion (foc – %) and absolute content (OC – mg g−1 d.w.)).
The ratios are higher than the Redfield ratio over the entire core and show a decreasing trend (Fig. 9b), in agreement with the diminishing contribution of terrestrial OC with respect to marine OC sources. The mean fterr is relatively high throughout the R1 core (46.45 % ± 8.20 %, Fig. 9c and Table 3) but decreases from 58.70 % to 30.45 %. Although R1 is located rather far from the continent, these estimates suggest efficient transport pathways of land-derived organic matter towards the open sea, such as drifting sea ice (Jia et al., 2020) or wave action remobilizing and transporting shelf sediments to the ocean interior (Vonk et al., 2012). Time series sediment traps evidenced high and long-standing terrigenous material advection by lateral transport controlled by the Chukchi Slope Current and mesoscale eddies in winter in this region (Onodera et al., 2021; Watanabe et al., 2014, 2022). Figure 9c also shows that, since the 1960s, there has been a significant decline in the share of terrigenous OC with the enhanced loss of sea ice over the last 60 years and a subsequent rise of productivity in terms of marine and sea ice diatoms. By contrast, ARC4-C07, the core located to the southeast of R1 (Fig. 1), exhibits a trend of enhanced land-sourced input in recent years (Bai et al., 2022). The different trend of the terrigenous OC components of these two cores might be related to the weakening of sediment-laden sea ice transport to higher northern latitudes due to its earlier melting.
From the 1820s to the 1930s, pelagic and sympagic OC is found in comparable amounts in the sediments (2.17±0.53 mg g−1 d.w. sediment and 1.72±0.46 mg g−1 d.w. sediment, respectively; Fig. 9d and Table 3), but from the 1930s to the 1980s, the content of sympagic OC increases by nearly 50 % to 3.10 mg g−1 d.w. sediment (Fig. 9d). However, pelagic phytoplankton growth also shows rising values but remains lower than sympagic OC, possibly because of surface freshening limiting nutrient supply (Arrigo et al., 2008). After the 1980s, when the minimum ice edge reached R1 and the ice-free period was prolonged in the northern CS (Astakhov et al., 2019), the sympagic and pelagic productions depict a final increase and a superseding terrestrial OC (Fig. 9c and d). The high δ15N data during this period suggest enhanced stratification, most likely due to surface freshening (Fig. 3d) which gradually shifted the limiting factor of marine pelagic production from light to nutrient availability (Ardyna and Arrigo, 2020; Lannuzel et al., 2020).
H-Print and δ13Corg values from 83 surface sediments were used to diagnose OC sources across the western Arctic Ocean and to distinguish how they are influenced by sea ice extent. δ13Corg values were consistently generally lower in the southern coastal and shelf sediments where riverine terrigenous inputs are stronger, while heavier δ13Corg values were found at offshore sites of the northern CS and ESS where pelagic and/or sympagic productions are significant. Combining δ13Corg and H-Print enabled us to draw an inventory of terrestrial, sympagic, and marine pelagic OC in northern CS sediments using a ternary mixing model which was then applied to the ARC11-R1 core to reconstruct the temporal evolution of the OC content since 1820 as the sea ice retreat.
Our results demonstrate that, over the last 200 years, the northern CS experienced nearly permanent sea ice conditions between the 1820s and 1930s followed by a period of gradual melting to reach marginal sea ice conditions (1930s–1980s). The most recent decades were marked by the accelerated decline of sea ice (1980s–present) leading to shifts in primary production that, in turn, impacted the composition and burial of OC in Arctic sediments from coastal to open-sea areas. Our data show that, with the loss of sea ice, the fraction of terrigenous OC decreased, while marine pelagic and sympagic OC export and sequestration in the deep ocean increased. Since the beginning of the 21st century, the three OC pools at the core site have been comparable in size, while 200 years ago, OC was predominantly of terrestrial origin. In the future, with rising temperature and reduced sea ice, primary production in the northern CS may, however, become nutrient limited as a result of freshening and ocean stratification, and phytoplankton populations will likely undergo further alteration with subsequent changes in CO2 drawdown.
All data that support the findings of this study are available in the article and Supplement (Tables 1–3 and S1).
The supplement related to this article is available online at: https://doi.org/10.5194/cp-19-1305-2023-supplement.
LS, JR, and JC designed the study and wrote the paper with contributions from MAS, YB, ZL, RZ, HJ, AAS, and XS. LS and RZ contributed the biomarker analyses and the determination of bulk parameters. JR retrieved the environmental data from different databases, while XH carried out the age model estimate of R1. All the authors contributed to the final version of the paper.
The contact author has declared that none of the authors has any competing interests.
Publisher's note: Copernicus Publications remains neutral with regard to jurisdictional claims in published maps and institutional affiliations.
We are grateful to the captain, crew members, and scientific party of the R/V Xuelong 2 and R/V Akademik M. A. Lavrentiev for their professional sampling work. We are indebted to Zhi Yang and Qianna Chen of the Second Institute of Oceanography for their kind help in the bulk data measurement. Vincent Klein of Sorbonne University is also thanked for the technical assistance. We are also grateful to Sabine Schmidt of the University of Bordeaux for her suggestions on the age model. Two anonymous reviewers are acknowledged for their constructive suggestions.
This study was financially supported by the National Natural Science Foundation of China (grant nos. 41941013, 42076241, 41976229, 41606052, and 42076242), the National Key Research and Development Program of China (grant nos. 2019YFE0120900 and 2019YFC1509101), and the Marine S&T Fund of Shandong Province for Pilot National Laboratory for Marine Science and Technology (Qingdao; grant no. 2018SDKJ0104-3). The expedition work was partly supported by the Ministry of Sciences and Education of the Russian Federation (project no. 121021700342-9). Publisher’s note: the article processing charges for this publication were not paid by a Russian or Belarusian institution.
This paper was edited by Nathalie Combourieu Nebout and reviewed by two anonymous referees.
Ardyna, M. and Arrigo, K. R.: Phytoplankton dynamics in a changing Arctic Ocean, Nat. Clim. Change, 10, 892–903, https://doi.org/10.1038/s41558-020-0905-y, 2020.
Arrigo, K. R. and van Dijken, G. L.: Continued increases in Arctic Ocean primary production, Prog. Oceanogr., 136, 60–70, https://doi.org/10.1016/j.pocean.2015.05.002, 2015.
Arrigo, K. R., van Dijken, G., and Pabi, S.: Impact of a shrinking Arctic ice cover on marine primary production, Geophys. Res. Lett., 35, L19603, https://doi.org/10.1029/2008gl035028, 2008.
Astakhov, A. S., Bosin, A. A., Liu, Y. G., Darin, A. V., Kalugin, I. A., Artemova, A. V., Babich, V. V., Melgunov, M. S., Vasilenko, Y. P., and Vologina, E. G.: Reconstruction of ice conditions in the northern Chukchi Sea during recent centuries: Geochemical proxy compared with observed data, Quatern. Int., 522, 23–37, https://doi.org/10.1016/j.quaint.2019.05.009, 2019.
Bai, Y., Sicre, M.-A., Chen, J., Klein, V., Jin, H., Ren, J., Li, H., Xue, B., Ji, Z., Zhuang, Y., and Zhao, M.: Seasonal and spatial variability of sea ice and phytoplankton biomarker flux in the Chukchi sea (western Arctic Ocean), Prog. Oceanogr., 171, 22–37, https://doi.org/10.1016/j.pocean.2018.12.002, 2019.
Bai, Y., Sicre, M.-A., Ren, J., Jalali, B., Klein, V., Li, H., Lin, L., Ji, Z., Su, L., Zhu, Q., Jin, H., and Chen, J.: Centennial-scale variability of sea-ice cover in the Chukchi Sea since AD 1850 based on biomarker reconstruction, Environ. Res. Lett., 17, 044058, https://doi.org/10.1088/1748-9326/ac5f92, 2022.
Baskaran, M. and Naidu, A. S.: 210Pb-derived chronology and the fluxes of 210Pb and 137Cs isotopes into continental shelf sediments, East Chukchi Sea, Alaskan Arctic, Geochim. Cosmochim. Ac., 59, 4435–4448, https://doi.org/10.1016/0016-7037(95)00248-x, 1995.
Bates, N. R. and Mathis, J. T.: The Arctic Ocean marine carbon cycle: evaluation of air-sea CO2 exchanges, ocean acidification impacts and potential feedbacks, Biogeosciences, 6, 2433–2459, https://doi.org/10.5194/bg-6-2433-2009, 2009.
Belt, S. T.: Source-specific biomarkers as proxies for Arctic and Antarctic sea ice, Org. Geochem., 125, 277–298, https://doi.org/10.1016/j.orggeochem.2018.10.002, 2018.
Belt, S. T.: What do IP25 and related biomarkers really reveal about sea ice change?, Quat.ernarySci. Rev., 204, 216–219, https://doi.org/10.1016/j.quascirev.2018.11.025, 2019.
Belt, S. T., Massé, G., Rowland, S. J., Poulin, M., Michel, C., and LeBlanc, B.: A novel chemical fossil of palaeo sea ice: IP25, Org. Geochem., 38, 16–27, https://doi.org/10.1016/j.orggeochem.2006.09.013, 2007.
Belt, S. T., Massé, G., Vare, L. L., Rowland, S. J., Poulin, M., Sicre, M.-A., Sampei, M., and Fortier, L.: Distinctive 13C isotopic signature distinguishes a novel sea ice biomarker in Arctic sediments and sediment traps, Mar. Chem., 112, 158–167, https://doi.org/10.1016/j.marchem.2008.09.002, 2008.
Belt, S. T., Brown, T. A., Rodriguez, A. N., Sanz, P. C., Tonkin, A., and Ingle, R.: A reproducible method for the extraction, identification and quantification of the Arctic sea ice proxy IP25 from marine sediments, Anal. Meth., 4, 705–713, https://doi.org/10.1039/c2ay05728j, 2012.
Belt, S. T., Smik, L., Brown, T. A., Kim, J. H., Rowland, S. J., Allen, C. S., Gal, J. K., Shin, K. H., Lee, J. I., and Taylor, K. W.: Source identification and distribution reveals the potential of the geochemical Antarctic sea ice proxy IPSO25, Nat. Commun., 7, 12655, https://doi.org/10.1038/ncomms12655, 2016.
Bröder, L., Tesi, T., Andersson, A., Eglinton, T. I., Semiletov, I. P., Dudarev, O. V., Roos, P., and Gustafsson, Ö.: Historical records of organic matter supply and degradation status in the East Siberian Sea, Org. Geochem., 91, 16–30, https://doi.org/10.1016/j.orggeochem.2015.10.008, 2016.
Bröder, L., Andersson, A., Tesi, T., Semiletov, I., and Gustafsson, Ö.: Quantifying Degradative Loss of Terrigenous Organic Carbon in Surface Sediments Across the Laptev and East Siberian Sea, Global Biogeochem. Cy., 33, 85–99, https://doi.org/10.1029/2018GB005967, 2019.
Brown, T. A. and Belt, S. T.: Biomarker-based H-Print quantifies the composition of mixed sympagic and pelagic algae consumed by Artemia sp, J. Exp. Mar. Biol. Ecol., 488, 32–37, https://doi.org/10.1016/j.jembe.2016.12.007, 2017.
Brown, T. A., Belt, S. T., Tatarek, A., and Mundy, C. J.: Source identification of the Arctic sea ice proxy IP25. Nat. Commun., 5, 4197, https://doi.org/10.1038/ncomms5197, 2014a.
Brown, T. A., Yurkowski, D. J., Ferguson, S. H., Alexander, C., and Belt, S. T.: H-Print: a new chemical fingerprinting approach for distinguishing primary production sources in Arctic ecosystems. Environ. Chem. Lett., 12, 387–392, https://doi.org/10.1007/s10311-014-0459-1, 2014b.
Cai, W.-J., Chen, L., Chen, B., Gao, Z., Lee, S. H., Chen, J., Pierrot, D., Sullivan, K., Wang, Y., and Hu, X.: Decrease in the CO2 uptake capacity in an ice-free Arctic Ocean basin, Science, 329, 556–559, https://doi.org/10.1126/science.1189338, 2010.
Cavalieri, D. J. and Parkinson, C. L.: Arctic sea ice variability and trends, 1979–2010, The Cryosphere, 6, 881–889, https://doi.org/10.5194/tc-6-881-2012, 2012.
Cavalieri, D. J., Parkinson, C. L., Gloersen, P., and Zwally, H. J.: Sea Ice Concentrations from Nimbus-7 SMMR and DMSP 20 SSM/ISSMIS Passive Microwave Data, Version 1 (Digital media, updated yearly), NASA National Snow and Ice Data Center Distributed Active Archive Center Boulder, Colorado, USA [data set], https://doi.org/10.5067/8GQ8LZQVL0VL, 1996.
Cavalieri, D. J., Gloersen, P., Parkinson, C. L., Comiso, J. C., and Zwally, H. J.: Observed hemispheric asymmetry in global sea ice changes, Science, 278, 1104–1106, https://doi.org/10.1126/science.278.5340.1104, 1997.
Coachman, L. K. and Aagaard, K.: On the water exchange through Bering Strait, Limnol. Oceanogr., 11, 44–59, https://doi.org/10.4319/lo.1966.11.1.0044, 1966.
Cooper, L. W. and Grebmeier, J. M.: Deposition patterns on the Chukchi shelf using radionuclide inventories in relation to surface sediment characteristics, Deep-Sea Res. Pt. II, 152, 48–66, https://doi.org/10.1016/j.dsr2.2018.01.009, 2018.
Coupel, P., Ruiz-Pino, D., Sicre, M. A., Chen, J. F., Lee, S. H., Schiffrine, N., Li, H. L., and Gascard, J. C.: The impact of freshening on phytoplankton production in the Pacific Arctic Ocean, Prog. Oceanogr., 131, 113–125, https://doi.org/10.1016/j.pocean.2014.12.003, 2015.
Cronin, T. M., Polyak, L., Reed, D., Kandiano, E. S., Marzen, R., and Council, E.: A 600-ka Arctic sea-ice record from Mendeleev Ridge based on ostracodes, Quaternary Sci. Rev., 79, 157–167, https://doi.org/10.1016/j.quascirev.2012.12.010, 2013.
de Vernal, A., Gersonde, R., Goosse, H., Seidenkrantz, M.-S., and Wolff, E. W.: Sea ice in the paleoclimate system: the challenge of reconstructing sea ice from proxies – an introduction, Quaternary Sci. Rev., 79, 1–8, https://doi.org/10.1016/j.quascirev.2013.08.009, 2013.
Fernandes, M.-B. and Sicre, M.-A.: The importance of terrestrial organic carbon inputs on Kara Sea shelves as revealed by n-alkanes, OC and δ13C values, Org. Geochem., 31, 363–374, https://doi.org/10.1016/S0146-6380(00)00006-1, 2000.
Fritz, M., Vonk, J. E., and Lantuit, H.: Collapsing Arctic coastlines, Nat. Clim. Change, 7, 6–7, https://doi.org/10.1038/nclimate3188, 2017.
Gal, J. K., Ha, S. Y., Park, J., Shin, K. H., Kim, D., Kim, N. Y., Kang, S. H., and Yang, E. J.: Seasonal flux of ice-related organic matter during under-ice blooms in the western Arctic Ocean revealed by algal lipid biomarkers, J. Geophys. Res.-Oceans, 127, e2021JC017914, https://doi.org/10.1029/2021jc017914, 2022.
Giles, K. A., Laxon, S. W., Ridout, A. L., Wingham, D. J., and Bacon, S.: Western Arctic Ocean freshwater storage increased by wind-driven spin-up of the Beaufort Gyre, Nat. Geosci., 5, 194–197, https://doi.org/10.1038/ngeo1379, 2012.
Goñi, M. A., O'Connor, A. E., Kuzyk, Z. Z., Yunker, M. B., Gobeil, C., and Macdonald, R. W.: Distribution and sources of organic matter in surface marine sediments across the North American Arctic margin, J. Geophys. Res.-Oceans, 118, 4017–4035, https://doi.org/10.1002/jgrc.20286, 2013.
Grebmeier, J. M., Cooper, L. W., Feder, H. M., and Sirenko, B. I.: Ecosystem dynamics of the Pacific-influenced Northern Bering and Chukchi Seas in the Amerasian Arctic, Prog. Oceanogr., 71, 331–361, https://doi.org/10.1016/j.pocean.2006.10.001, 2006.
Grotheer, H., Meyer, V., Riedel, T., Pfalz, G., Mathieu, L., Hefter, J., Gentz, T., Lantuit, H., Mollenhauer, G., and Fritz, M.: Burial and Origin of Permafrost-Derived Carbon in the Nearshore Zone of the Southern Canadian Beaufort Sea, Geophys. Res. Lett., 47, e2019GL085897, https://doi.org/10.1029/2019gl085897, 2020.
He, J., Zhang, F., Lin, L., Ma, Y., and Chen, J.: Bacterioplankton and picophytoplankton abundance, biomass, and distribution in the Western Canada Basin during summer 2008, Deep-Sea Res. Pt. II, 81–84, 36–45, https://doi.org/10.1016/j.dsr2.2012.08.018, 2012.
Holmes, R. M., McClelland, J. W., Peterson, B. J., Tank, S. E., Bulygina, E., Eglinton, T. I., Gordeev, V. V., Gurtovaya, T. Y., Raymond, P. A., Repeta, D. J., Staples, R., Striegl, R. G., Zhulidov, A. V., and Zimov, S. A.: Seasonal and Annual Fluxes of Nutrients and Organic Matter from Large Rivers to the Arctic Ocean and Surrounding Seas, Estuar. Coasts, 35, 369–382, https://doi.org/10.1007/s12237-011-9386-6, 2011.
Hu, L., Liu, Y., Xiao, X., Gong, X., Zou, J., Bai, Y., Gorbarenko, S., Fahl, K., Stein, R., and Shi, X.: Sedimentary records of bulk organic matter and lipid biomarkers in the Bering Sea: A centennial perspective of sea-ice variability and phytoplankton community, Mar. Geol., 429, 106308, https://doi.org/10.1016/j.margeo.2020.106308, 2020.
Hunt, G. L., Blanchard, A. L., Boveng, P., Dalpadado, P., Drinkwater, K. F., Eisner, L., Hopcroft, R. R., Kovacs, K. M., Norcross, B. L., Renaud, P., Reigstad, M., Renner, M., Skjoldal, H. R., Whitehouse, A., and Woodgate, R. A.: The Barents and Chukchi Seas: Comparison of two Arctic shelf ecosystems, J. Mar. Syst., 109–110, 43–68, https://doi.org/10.1016/j.jmarsys.2012.08.003, 2013.
Jakobsson, M.: Hypsometry and volume of the Arctic Ocean and its constituent seas, Geochem. Geophy. Geosy., 3, 1–18, https://doi.org/10.1029/2001GC000302, 2002.
Ji, Z., Jin, H., Stein, R., Li, Z., Bai, Y., Li, H., Zhang, Y., and Chen, J.: Distribution and Sources of Organic Matter in Surface Sediments of the Northern Bering and Chukchi Seas by Using Bulk and Tetraether Proxies, J. Ocean Univ. China, 18, 563–572, https://doi.org/10.1007/s11802-019-3869-7, 2019.
Jia, R., Mu, X., Chen, M., Zhu, J., Wang, B., Li, X., Astakhov, A. S., Zheng, M., and Qiu, Y.: Sources of particulate organic matter in the Chukchi and Siberian shelves: clues from carbon and nitrogen isotopes, Acta Oceanol. Sin., 39, 96–108, https://doi.org/10.1007/s13131-020-1650-9, 2020.
Kim, J.-H., Gal, J.-K., Jun, S.-Y., Smik, L., Kim, D., Belt, S. T., Park, K., Shin, K.-H., and Nam, S.-I.: Reconstructing spring sea ice concentration in the Chukchi Sea over recent centuries: insights into the application of the PIP25 index, Environ. Res. Lett., 14, 125004, https://doi.org/10.1088/1748-9326/ab4b6e, 2019.
Koch, C. W., Cooper, L. W., Grebmeier, J. M., Lalande, C., and Brown, T. A.: Seasonal and latitudinal variations in sea ice algae deposition in the Northern Bering and Chukchi Seas determined by algal biomarkers, PLoS One, 15, e0231178, https://doi.org/10.1371/journal.pone.0231178, 2020.
Kolling, H. M., Stein, R., Fahl, K., Sadatzki, H., Vernal, A., and Xiao, X.: Biomarker Distributions in (Sub)-Arctic Surface Sediments and Their Potential for Sea Ice Reconstructions, Geochem. Geophy. Geosy., 21, 2019GC008629, https://doi.org/10.1029/2019gc008629, 2020.
Lannuzel, D., Tedesco, L., van Leeuwe, M., Campbell, K., Flores, H., Delille, B., Miller, L., Stefels, J., Assmy, P., Bowman, J., Brown, K., Castellani, G., Chierici, M., Crabeck, O., Damm, E., Else, B., Fransson, A., Fripiat, F., Geilfus, N.-X., Jacques, C., Jones, E., Kaartokallio, H., Kotovitch, M., Meiners, K., Moreau, S., Nomura, D., Peeken, I., Rintala, J.-M., Steiner, N., Tison, J.-L., Vancoppenolle, M., Van der Linden, F., Vichi, M., and Wongpan, P.: The future of Arctic sea-ice biogeochemistry and ice-associated ecosystems, Nat. Clim. Change, 10, 983–992, https://doi.org/10.1038/s41558-020-00940-4, 2020.
Li, L., Liu, Y., Wang, X., Hu, L., Yang, G., Wang, H., Bosin, A. A., Astakhov, A. S., and Shi, X.: Early diagenesis and accumulation of redox-sensitive elements in East Siberian Arctic Shelves, Mar. Geol., 429, 106309, https://doi.org/10.1016/j.margeo.2020.106309, 2020.
Massé, G., Rowland, S. J., Sicre, M. -A., Jacob, J., Jansen, E., and Belt, S. T.: Abrupt climate changes for Iceland during the last millennium: evidence from high resolution sea ice reconstructions, Earth Planet. Sc. Lett., 269, 565–569, https://doi.org/10.1016/j.epsl.2008.03.017, 2008.
Müller, J., Massé, G., Stein, R., and Belt, S. T.: Variability of sea-ice conditions in the Fram Strait over the past 30,000 years, Nat. Geosci., 2, 772–776, https://doi.org/10.1038/ngeo665, 2009.
Müller, J., Wagner, A., Fahl, K., Stein, R., Prange, M., and Lohmann, G.: Towards quantitative sea ice reconstructions in the northern North Atlantic: A combined biomarker and numerical modelling approach, Earth Planet. Sc. Lett., 306, 137–148, https://doi.org/10.1016/j.epsl.2011.04.011, 2011.
Nittrouer, C. A., DeMaster, D. J., McKee, B. A., Cutshall, N. H., and Larsen, I. L.: The effect of sediment mixing on Pb-210 accumulation rates for the Washington continental shelf, Mar. Geol., 54, 201–221, https://doi.org/10.1016/0025-3227(84)90038-0, 1984.
Onodera, J., Watanabe, E., Itoh, M., Harada, N., Honda, M. C., Tengberg, A., Tanaka, Y., and Kikuchi, T.: Interannual Variation of Settling Particles Reflects Upper-Ocean Circulation in the Southern Chukchi Borderland, 2010–2014, J. Geophys. Res.-Oceans, 126, e2021JC017431, https://doi.org/10.1029/2021jc017431, 2021.
Ouyang, Z., Li, Y., Qi, D., Zhong, W., Murata, A., Nishino, S., Wu, Y., Jin, M., Kirchman, D., Chen, L., and Cai, W. J.: The Changing CO2 Sink in the Western Arctic Ocean From 1994 to 2019, Global Biogeochem. Cy., 36, e2021GB007032, https://doi.org/10.1029/2021gb007032, 2022.
Ovall, B., Pickart, R. S., Lin, P., Stabeno, P., Weingartner, T., Itoh, M., Kikuchi, T., Dobbins, E., and Bell, S.: Ice, wind, and water: Synoptic-scale controls of circulation in the Chukchi Sea, Prog. Oceanogr., 199, 102707, https://doi.org/10.1016/j.pocean.2021.102707, 2021.
Overeem, I., Anderson, R. S., Wobus, C. W., Clow, G. D., Urban, F. E., and Matell, N.: Sea ice loss enhances wave action at the Arctic coast, Geophys. Res. Lett., 38, L17503, https://doi.org/10.1029/2011GL048681, 2011.
Parkinson, C. L., Cavalieri, D. J., Gloersen, P., Zwally, H. J., and Comiso, J. C.: Arctic sea ice extents, areas, and trends, 1978–1996, J. Geophys. Res., 104, 20837–20856, https://doi.org/10.1029/1999JC900082, 1999.
Parmentier, F. W., Christensen, T. R., Rysgaard, S., Bendtsen, J., Glud, R. N., Else, B., van Huissteden, J., Sachs, T., Vonk, J. E., and Sejr, M. K.: A synthesis of the arctic terrestrial and marine carbon cycles under pressure from a dwindling cryosphere, Ambio, 46, 53–69, https://doi.org/10.1007/s13280-016-0872-8, 2017.
Polyak, L., Belt, S. T., Cabedo-Sanz, P., Yamamoto, M., and Park, Y. -H.: Holocene sea-ice conditions and circulation at the Chukchi-Alaskan margin, Arctic Ocean, inferred from biomarker proxies, Holocene, 26, 1810–1821, https://doi.org/10.1177/0959683616645939, 2016.
Polyakov, I. V., Alekseev, G. V., Bekryaev, R. V., Bhatt, U. S., Colony, R., Johnson, M. A., Karklin, V. P., Walsh, D., and Yulin, A. V.: Long-term ice variability in Arctic marginal seas, J. Climate, 16, 2078–2085, https://doi.org/10.1175/1520-0442(2003)016<2078:LIVIAM>2.0.CO;2, 2003.
Rantanen, M., Karpechko, A. Y., Lipponen, A., Nordling, K., Hyvärinen, O., Ruosteenoja, K., Vihma, T., and Laaksonen, A.: The Arctic has warmed nearly four times faster than the globe since 1979, Commun. Earth. Environ., 3, 168, https://doi.org/10.1038/s43247-022-00498-3, 2022.
Rawlins, M. A., Connolly, C. T., and McClelland, J. W.: Modeling Terrestrial Dissolved Organic Carbon Loading to Western Arctic Rivers, J. Geophys. Res.-Biogeo., 126, e2021JG006420, https://doi.org/10.1029/2021jg006420, 2021.
Ren, J., Chen, J., Bai, Y., Sicre, M.-A., Yao, Z., Lin, L., Zhang, J., Li, H., Wu, B., Jin, H., Ji, Z., Zhuang, Y., and Li, Y.: Diatom composition and fluxes over the Northwind Ridge, western Arctic Ocean: Impacts of marine surface circulation and sea ice distribution, Prog. Oceanogr., 186, 102377, https://doi.org/10.1016/j.pocean.2020.102377, 2020.
Schubert, C. J. and Calvert, S. E.: Nitrogen and carbon isotopic composition of marine and terrestrial organic matter in Arctic Ocean sediments: implications for nutrient utilization and organic matter composition, Deep-Sea Res. Pt. I, 48, 789–810, https://doi.org/10.1016/s0967-0637(00)00069-8, 2001.
Serreze, M. C. and Francis, J. A.: The Arctic Amplification Debate, Climatic Change, 76, 241–264, https://doi.org/10.1007/s10584-005-9017-y, 2006.
Serreze, M. C. and Stroeve, J.: Arctic sea ice trends, variability and implications for seasonal ice forecasting, Philos. T. Roy. Soc. A, 373, 20140159, https://doi.org/10.1098/rsta.2014.0159, 2015.
Shindell, D. and Faluvegi, G.: Climate response to regional radiative forcing during the twentieth century, Nat. Geosci., 2, 294–300, https://doi.org/10.1038/ngeo473, 2009.
Smik, L., Cabedo-Sanz, P., and Belt, S. T.: Semi-quantitative estimates of paleo Arctic sea ice concentration based on source-specific highly branched isoprenoid alkenes: a further development of the PIP25 index, Org. Geochem., 92, 63–69, https://doi.org/10.1016/j.orggeochem.2015.12.007, 2016.
Sparkes, R. B., Doğrul Selver, A., Bischoff, J., Talbot, H. M., Gustafsson, Ö., Semiletov, I. P., Dudarev, O. V., and van Dongen, B. E.: GDGT distributions on the East Siberian Arctic Shelf: implications for organic carbon export, burial and degradation, Biogeosciences, 12, 3753–3768, https://doi.org/10.5194/bg-12-3753-2015, 2015.
Stein, R., Macdonald, R. W., Naidu, A. S., Yunker, M. B., Gobeil, C., Cooper, L. W., Grebmeier, J. M., Whitledge, T. E., Hameedi, M. J., Petrova, V. I., Batova, G. I., Zinchenko, A. G., Kursheva, A. V., Narkevskiy, E. V., Fahl, K., Vetrov, A., Romankevich, E. A., Birgel, D., Schubert, C., Harvey, H. R., and Weiel, D.: The Organic Carbon Cycle in the Arctic Ocean, edited by: Stein, R. and MacDonald, R. W., Springer, Berlin, Heidelberg, 169–314, ISBN 978-3-642-62351-6, 2004.
Stein, R., Fahl, K., Schade, I., Manerung, A., Wassmuth, S., Niessen, F., and Nam, S.-I.: Holocene variability in sea ice cover, primary production, and Pacific-Water inflow and climate change in the Chukchi and East Siberian Seas (Arctic Ocean), J. Quaternary Sci., 32, 362–379, https://doi.org/10.1002/jqs.2929, 2017.
Stoynova, V., Shanahan, T. M., Hughen, K. A., and de Vernal, A.: Insights into circum-Arctic sea ice variability from molecular geochemistry, Quaternary Sci. Rev., 79, 63–73, https://doi.org/10.1016/j.quascirev.2012.10.006, 2013.
Stroeve, J., Holland, M. M., Meier, W., Scambos, T., and Serreze, M.: Arctic sea ice decline: faster than forecast, Geophys. Res. Lett., 34, L09501, https://doi.org/10.1029/2007gl029703, 2007.
Su, L., Ren, J., Sicre, M. A., Bai, Y., Jalali, B., Li, Z., Jin, H., Astakhov, A. S., Shi, X., and Chen, J.: HBIs and Sterols in Surface Sediments Across the East Siberian Sea: Implications for Palaeo Sea-Ice Reconstructions, Geochem. Geophy. Geosy., 23, e2021GC009940, https://doi.org/10.1029/2021gc009940, 2022.
Tanski, G., Wagner, D., Knoblauch, C., Fritz, M., Sachs, T., and Lantuit, H.: Rapid CO2 release from eroding permafrost in seawater, Geophys. Res. Lett., 46, 11244–11252, https://doi.org/10.1029/2019gl084303, 2019.
Tesi, T., Semiletov, I., Hugelius, G., Dudarev, O., Kuhry, P., and Gustafsson, Ö.: Composition and fate of terrigenous organic matter along the Arctic land-ocean continuum in East Siberia: Insights from biomarkers and carbon isotopes, Geochim. Cosmochim. Ac., 133, 235–256, https://doi.org/10.1016/j.gca.2014.02.045, 2014.
Tian, F., Pickart, R. S., Lin, P., Pacini, A., Moore, G. W. K., Stabeno, P., Weingartner, T., Itoh, M., Kikuchi, T., Dobbins, E., Bell, S., Woodgate, R. A., Danielson, S. L., and Wang, Z.: Mean and seasonal circulation of the eastern Chukchi Sea from moored timeseries in 2013–2014, J. Geophys. Res.-Oceans, 126, e2020JC016863, https://doi.org/10.1029/2020jc016863, 2021.
Timmermans, M. L. and Toole, J. M.: The Arctic Ocean's Beaufort Gyre, Annu. Rev. Mar. Sci., 15, 223–248, https://doi.org/10.1146/annurev-marine-032122-012034, 2023.
Tortell, P. D., Mills, M. M., Payne, C. D., Maldonado, M. T., Chierici, M., Fransson, A., Alderkamp, A. C., and Arrigo, K. R.: Inorganic C utilization and C isotope fractionation by pelagic and sea ice algal assemblages along the Antarctic continental shelf, Mar. Ecol.: Prog. Ser., 483, 47–66, https://doi.org/10.3354/meps10279, 2013.
Volkman, J. K.: A review of sterol markers for marine and terrigenous organic matter, Org. Geochem., 9, 83–99, https://doi.org/10.1016/0146-6380(86)90089-6, 1986.
Vonk, J. E., Sánchez-García, L., Van Dongen, B., Alling, V., Kosmach, D., Charkin, A., Semiletov, I. P., Dudarev, O. V., Shakhova, N., and Roos, P.: Activation of old carbon by erosion of coastal and subsea permafrost in Arctic Siberia, Nature, 489, 137–140, https://doi.org/10.1038/nature11392, 2012.
Walsh, J. E., Fetterer, F., Scott stewart, J., and Chapman, W. L.: A database for depicting Arctic sea ice variations back to 1850, Geogr. Rev., 107, 89–107, https://doi.org/10.1111/j.1931-0846.2016.12195.x, 2017.
Wang, K., Zhang, H., Han, X., and Qiu, W.: Sources and burial fluxes of sedimentary organic carbon in the northern Bering Sea and the northern Chukchi Sea in response to global warming, Sci. Total Environ., 679, 97–105, https://doi.org/10.1016/j.scitotenv.2019.04.374, 2019.
Wang, X., Li, Z., Jin, H., Zheng, H., and Chen, J.: Sources and degradation of organic carbon in the surface sediments across the Chukchi Sea, insights from lignin phenols, Haiyang xuebao, 39, 19-31, https://doi.org/10.3969/j.issn.0253-4193.2017.10.002, 2017.
Wang, Y., Bi, H., Huang, H., Liu, Y., Liu, Y., Liang, X., Fu, M., and Zhang, Z.: Satellite-observed trends in the Arctic sea ice concentration for the period 1979–2016, J. Oceanol. Limnol., 37, 18–37, 2019.
Watanabe, E., Onodera, J., Harada, N., Honda, M. C., Kimoto, K., Kikuchi, T., Nishino, S., Matsuno, K., Yamaguchi, A., Ishida, A., and Kishi, M. J.: Enhanced role of eddies in the Arctic marine biological pump, Nat. Commun., 5, 3950, https://doi.org/10.1038/ncomms4950, 2014.
Watanabe, E., Onodera, J., Itoh, M., and Mizobata, K.: Transport Processes of Seafloor Sediment From the Chukchi Shelf to the Western Arctic Basin, J. Geophys. Res.-Oceans, 127, e2021JC017958, https://doi.org/10.1029/2021jc017958, 2022.
Weingartner, T. J., Danielson, S., Sasaki, Y., Pavlov, V., and Kulakov, M.: The Siberian Coastal Current: A wind- and buoyancy-forced Arctic coastal current, J. Geophys. Res.-Oceans, 104, 29697–29713, https://doi.org/10.1029/1999jc900161, 1999.
Wheeler, P. A., Gosselin, M., Sherr, E., Thibault, D., Kirchman, D. L., Benner, R., and Whitledge, T. E.: Active cycling of organic carbon in the central Arctic Ocean, Nature, 380, 697–699, https://doi.org/10.1038/380697a0, 1996.
Wild, B., Shakhova, N., Dudarev, O., Ruban, A., Kosmach, D., Tumskoy, V., Tesi, T., Grimm, H., Nybom, I., Matsubara, F., Alexanderson, H., Jakobsson, M., Mazurov, A., Semiletov, I., and Gustafsson, O.: Organic matter composition and greenhouse gas production of thawing subsea permafrost in the Laptev Sea, Nat. Commun., 13, 5057, https://doi.org/10.1038/s41467-022-32696-0, 2022.
Williford, K. H., Ward, P. D., Garrison, G. H., and Buick, R.: An extended organic carbon-isotope record across the Triassic–Jurassic boundary in the Queen Charlotte Islands, British Columbia, Canada, Palaeogeogr. Palaeoclimatol. Palaeoecol., 244, 290–296, https://doi.org/10.1016/j.palaeo.2006.06.032, 2007.
Woodgate, R., and Peralta-Ferriz, C.: Warming and freshening of the Pacific inflow to the Arctic from 1990–2019 implying dramatic shoaling in Pacific Winter Water ventilation of the Arctic water column, Geophys. Res. Lett., 48, e2021GL092528, https://doi.org/10.1029/2021gl092528, 2021.
Woodgate, R. A.: Increases in the Pacific inflow to the Arctic from 1990 to 2015, and insights into seasonal trends and driving mechanisms from year-round Bering Strait mooring data, Prog. Oceanogr., 160, 124–154, https://doi.org/10.1016/j.pocean.2017.12.007, 2018.
Woodgate, R. A., Aagaard, K., and Weingartner, T. J.: Monthly temperature, salinity, and transport variability of the Bering Strait through flow, Geophys. Res. Lett.,32, L04601, https://doi.org/10.1029/2004gl021880, 2005.
Xiao, X., Fahl, K., and Stein, R.: Biomarker distributions in surface sediments from the Kara and Laptev seas (Arctic Ocean): indicators for organic-carbon sources and sea-ice coverage, Quaternary Sci. Rev., 79, 40–52, https://doi.org/10.1016/j.quascirev.2012.11.028, 2013.
Xiao, X., Fahl, K., Müller, J., and Stein, R.: Sea-ice distribution in the modern Arctic Ocean: Biomarker records from trans-Arctic Ocean surface sediments, Geochim. Cosmochim. Ac., 155, 16–29, https://doi.org/10.1016/j.gca.2015.01.029, 2015a.
Xiao, X., Stein, R., and Fahl, K.: MIS 3 to MIS 1 temporal and LGM spatial variability in Arctic Ocean sea ice cover: reconstruction from biomarkers, Paleoceanography, 30, 969–983, https://doi.org/10.1002/2015PA002814, 2015b.
Zhang, R., Wang, H., Fu, Q., Rasch, P. J., Wu, M., and Maslowski, W.: Understanding the cold season Arctic surface warming trend in recent decades, Geophys. Res. Lett., 48, e2021GL094878, https://doi.org/10.1029/2021gl094878, 2021.
Zhuang, Y., Jin, H., Cai, W. J., Li, H., Qi, D., and Chen, J.: Extreme nitrate deficits in the western Arctic Ocean: Origin, decadal changes, and implications for denitrification on a polar marginal shelf, Global Biogeochem. Cy., 36, e2022GB007304, https://doi.org/10.1029/2022gb007304, 2022.