the Creative Commons Attribution 4.0 License.
the Creative Commons Attribution 4.0 License.
 | 03 Jan 2023
Reassessing long-standing meteorological records: an example using the national hottest day in Ireland
Katherine Dooley
Ciaran Kelly
Natascha Seifert
Therese Myslinski
Sophie O'Kelly
Rushna Siraj
Ciara Crosby
Jack Kevin Dunne
Kate McCauley
James Donoghue
Eoin Gaddren
Daniel Conway
Jordan Cooney
Niamh McCarthy
Eoin Cullen
Simon Noone
Conor Murphy
Peter Thorne
This analysis highlights the potential value in reanalysing early national meteorological records from around the world. These were oftentimes measured via techniques that preceded standardisation of instrumentation and methods of observation and thus could be subject to considerable biases and uncertainties. This analysis uses the techniques pioneered by WMO record assessment teams. The highest currently recognised air temperature (33.3 ∘C) ever recorded in the Republic of Ireland was logged at Kilkenny Castle in 1887. The original observational record however no longer exists. Given that Ireland is now the only country in Europe to have a national heat record that was set in the 19th century, a reassessment of the verity of this record is both timely and valuable. The present analysis undertakes a fundamental reassessment of the plausibility of the 1887 temperature record using methods similar to those used to assess various weather extremes under WMO auspices over recent years. Specifically, we undertake an inter-station reassessment using sparse available records and make recourse to the new and improved 20CRv3 sparse-input reanalysis product. Neither surrounding available stations nor the reanalysis offer substantive support for the Kilkenny record of 33.3 ∘C being correct. Moreover, recent data rescue efforts have uncovered several earlier extreme values, one of which exceeds the Kilkenny value (33.5 ∘C on 16 July 1876 recorded at the Phoenix Park). However, the sparsity of early observational networks, a distinct lack of synoptic support from 20CRv3 for many of the extreme heat values, and the fact that these measurements were obtained using non-standard exposures lead us to conclude that there is grossly insufficient evidence to support any of these 19th century extremes as robust national heat record candidates. Data from the early 20th century onwards benefit from a denser network of stations undertaking measurements in a more standardised manner, many under the direct auspices of Met Éireann and its predecessors, adhering to WMO guidance and protocols. This enables more robust cross-checking of records. We argue that the Met Éireann-recognised 20th century heat record from Boora in 1976 is verified as the most plausible robust national temperature record based upon the synoptic situation and comparisons with nearby neighbouring stations. This measurement of 32.5 ∘C thus likely constitutes the highest reliably recorded temperature measurement in the Republic of Ireland. Ultimately, the formal decision on any reassessment and reassignment of the national record rests with the national meteorological service, Met Éireann.
- Article
(5121 KB) - Full-text XML
- BibTeX
- EndNote


National meteorological records of heat, cold, precipitation, and other meteorological parameters play a key role in the communication of weather events and climate change at both national and international scales. Over the past decade or so the WMO has instigated teams of experts to assess or reassess global and regional records for a range of phenomena. These have either recognised (Queterlard et al., 2009; Courtney et al., 2012; Purevjav et al., 2015; Lang et al., 2017; Cerveny et al., 2017; Láska et al., 2018; Merlone et al., 2019; Peterson et al., 2020; Weidner et al., 2021) or occasionally removed and replaced (El Fadli et al., 2013) various global or regional records for meteorological phenomena including heat and cold records. The latter revocation by El Fadli et al. (2013) was of particular note as it removed a long-standing global all-time heat record which had appeared in the Guinness Book of World Records, encyclopedias, and other similar reference materials. In comparison, national records have, at least in most cases, received scant attention. Yet the tools and approaches employed by the WMO are eminently scalable to a national context. Here, by use of Ireland's reported all-time heat record as an example, we make the case for assessing anew national records using the tools and techniques pioneered by these WMO expert teams. Such investigations are particularly valuable for early records that occurred prior to standardisation of instrumentation and methods of observation when the biases in the original records may be substantial (Böhm et al., 2010; Brunet et al., 2011; Murphy et al., 2020).
The highest recognised shaded air temperature recorded in Ireland was observed at Kilkenny Castle on 26 June 1887 (Rohan, 1986). Kilkenny Castle is located at 52.6505∘ N, 7.2493∘ W, 60 m above sea level (a.s.l.). In 1841, the population of Kilkenny City was approximately 19 071, decreasing to 15 257 in 1851 (McDill, 2021). According to the 2016 census, Kilkenny City now has a population of 25 512 (City Population, 2021). The reported temperature was observed from a “standard site”, reading 33.3 ∘C (Rohan, 1986, p. 133). Unfortunately, the original records from Kilkenny Castle for the period are missing and unavailable for scrutiny (Mary Curley, personal communication, 2019). Curiosity surrounds this temperature record as Ireland remains the only country in Europe to have an existing heat record from the 19th century, with almost all other European countries having had their heat records set much more recently (Table 1). Given this, and the relative paucity of metadata supporting the Irish record, it is appropriate to re-examine this record using modern investigative techniques.
Table 1Highest daily maximum temperature records of several NW European countries surrounding Ireland including constituent countries of the United Kingdom sourced from various national meteorological service websites at the time of writing.

The national temperature record was logged at Kilkenny Castle using a Negretti and Zambia thermometer, a standard thermometer in use at the time. This thermometer was tested by the Meteorological Council in 1890, which showed the instrument required no corrections, thus reporting the true value (Meteorological Council, 1890). During the 1880s the Stevenson screen (Stevenson, 1864) became the preferred standard screen to shield thermometers from sunlight and radiation. Dolores Gaffney, the collections officer at Kilkenny Castle, believes the temperature in question was recorded within a Stevenson screen (Dolores Gaffney, personal communication, 2019). The original Kilkenny Castle site was surveyed in 1890 but not considered a “second-order” (maintained by trained staff; UCAR, 2021) station (RMS, 1890) and eventually closed in 1933 (Niall Dollard, personal communication, 2021). The exact location of the weather station in Kilkenny Castle at the time of the record is unknown. Station siting is known to have substantial potential impacts upon the representativity of resulting measurements and modern guidance from WMO specifies criteria for siting (WMO, 2018). Kilkenny Castle is in the centre of Kilkenny Town beside the River Nore (Fig. 1). Given ample grounds, it is possible that the instrument was well sited, but, equally, there are many potential sitings which would today be considered to yield the possibility of biased records. Met Éireann explained that a station inspection report from approximately 1911 stated that Kilkenny Castle only kept the records for 4 years before destroying them (Mary Curley, personal communication, 2019). This both means that the original record from which the national temperature record arises is lost for perpetuity and that necessary metadata to understand the measurement context are also unavailable. Unfortunately, the time series of daily recordings around the record heat event were not saved and so the single “observation” of record heat must be analysed in isolation.
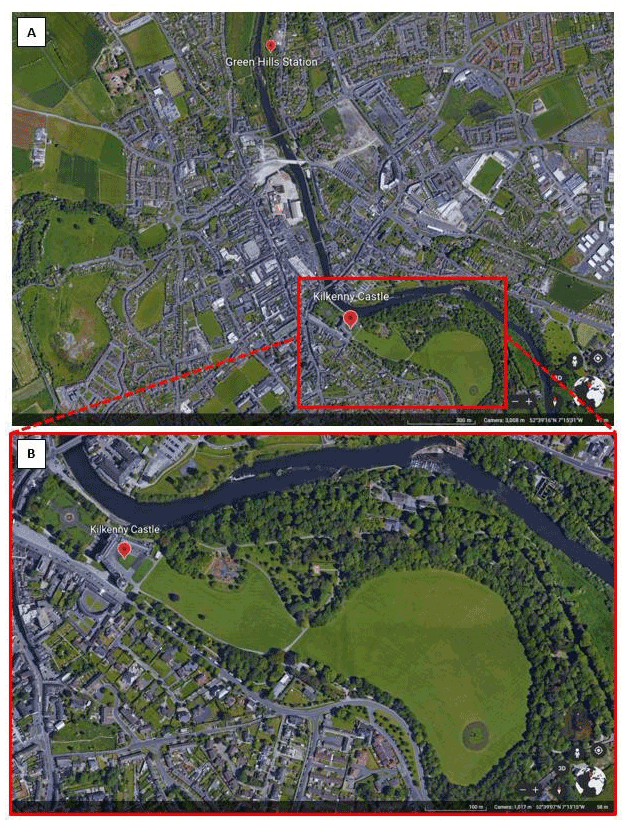
Figure 1Aerial image of Kilkenny Castle and its' surrounding area (a) and the grounds of the castle (b) (© Google Earth, 2021).
This added challenge of missing data is not an isolated occurrence. The crossover of manual to digitised recordings, early inconsistencies in logs before standardisation, and the destroying of records viewed as “no longer useful” have been reported on at both European and global scales (Brunet and Jones, 2011). Data rescue efforts are being recognised as imperative tools in the understanding of early climate variability and change (Allan et al., 2011; Brönnimann et al., 2019) but are of limited utility for stations that had a policy of actively disposing of their records as is the case at Kilkenny Castle.
Met Éireann also recognises a 20th century highest air temperature of 32.5 ∘C recorded on 29 June 1976 in Boora, County Offaly. This reading came during the long heatwave and summer drought which affected the British and Irish isles along with much of NW Europe (Stubbs, 1977; Noone et al., 2017). This station recorded data from 1950 to 2016 and was maintained by Met Éireann. Based upon available digital data, other notable heat events in the national instrumental record are summarised in Table 2. These include a suite of new potential heat records arising from recent highly valuable data rescue efforts as part of a collaboration between Met Éireann and the National University of Ireland, Galway, as part of a PhD project (Mateus et al., 2020). Notable heat extremes have occurred exclusively in meteorological high summer – late June through early August.
Table 2Notable heat extremes in available records from the Republic of Ireland over the instrumental record sourced from Met Éireann's website and available digital records, including the recently rescued early holdings from Mateus et al. (2020). The table includes all records that exceed 32 ∘C, at least one of which must plausibly constitute the robust national record.
Given the uncertainty associated with the Irish national high temperature record, together with its novelty in being the earliest national temperature record in Europe, the 2019–20 class of the MSc Climate Change at Maynooth University were set a group assignment to re-evaluate the record. This paper represents the outcomes of that reassessment. Having introduced in the present section the national context and aspects of the recognised all-time and 20th century national heat records, as well as selected additional heat extremes in available records, the rest of the paper is structured as follows. Section 2 introduces key methodological approaches and results from past WMO extremes verification efforts, which this exercise was designed to mimic. Section 3 goes on to apply these approaches to propose that the long-standing Kilkenny Castle national heat record should be rejected. Section 4 then considers additional candidates arising from Table 2, until alighting upon a recommendation for the most plausible highest reliable heat record in the available observations. Section 5 concludes.
The WMO has instigated a formal process to verify and certify a broad range of extremes. A rapporteur, when advised of a candidate record extreme that is desired to be assessed, convenes a team of domain area and regional experts to investigate the event and recommend either acceptance or rejection as a bona fide observation. If the event is rejected the team is asked to recommend an alternative record if they can do so. Teams have been instigated for temperature (El Fadli et al., 2013; Láska et al., 2018; Merlone et al., 2019; Weidner et al., 2021), precipitation (Quetelard et al., 2009), winds (Courtney et al., 2012), and pressure (Purevjav et al., 2015) amongst other records. The WMO teams consider global or WMO region records and have not, to date, assessed national records.
Teams assess all aspects of the potential record including available metadata, data, the synoptic situation, and, if possible, the instrumentation to come to a conclusion. The extent of the investigation depends upon the nature and timing of the event being analysed. More recent events can benefit from more thorough analyses which may include instrument characterisation and site visits (Merlone et al., 2019), whereas revisiting old records, as is the case herein, has to rely more on event characterisation and reference to nearby instrumental records (e.g. El Fadli et al., 2013). Increasingly, recourse is made to meteorological reanalysis products, including sparse-input centennial-scale reanalyses (Slivinski et al., 2019) that can provide information on the evolving synoptic meteorological situation surrounding the record event.
Several analyses of various meteorological records worldwide have been undertaken over recent years, leading to their removal (WMO, 2021). Perhaps most famously, what was cited to be the world's highest recorded temperature for over 90 years was invalidated following a careful WMO-team reappraisal. A temperature of 58 ∘C was recorded at El Azizia (modern-day Libya) but was disproved due to various issues brought to light after an in-depth investigation of the record. The issues surrounding the reading included problematic instrumentation, siting, observer interpretation, and, notably in the context of the present study, the fact that the record did not correspond to other nearby locations (El Fadli et al., 2013). The South African Weather Service (SAWS, 2019) reported a temperature of 50.1 ∘C from the Vioolsdrif weather station on 28 November 2019 (austral summer). This reading exceeded all previous heat records for South Africa. However, the temperature sensor in the Vioolsdrif weather station was replaced 2 d prior to the record temperature, and upon tracking the behaviour of the station over the following days, it was decided that the behaviour of the temperature sensor was questionable. This resulted in the 50.1 ∘C record being deemed invalid. A temperature of 42.9 ∘C was recorded at the Deelen weather station, in the Netherlands, on 25 July 2019 (Schildkamp, 2019). The sensors at the Deelen station were inspected, and any technical faults were ruled out. However, another instrument on the same site, a few hundred metres away, did not record the same high values, which resulted in the record being dismissed. Lastly, a high temperature of 53 ∘C recorded in Cloncurry, Queensland, Australia, in 1889 was disregarded due to faults in the measurement and was therefore not included in Australia's Bureau of Meteorology's list of recognised extremes (Smith, 2012).
Of those assessments of possible records, the most analogous to the present analysis is that of El Fadli et al. (2013) in that the original instrumentation has long since disappeared and the metadata are imperfect. Like El Fadli et al. (2013), we therefore must make recourse to nearby stations and sparse-input centennial-timescale reanalyses to reassess the Kilkenny record.
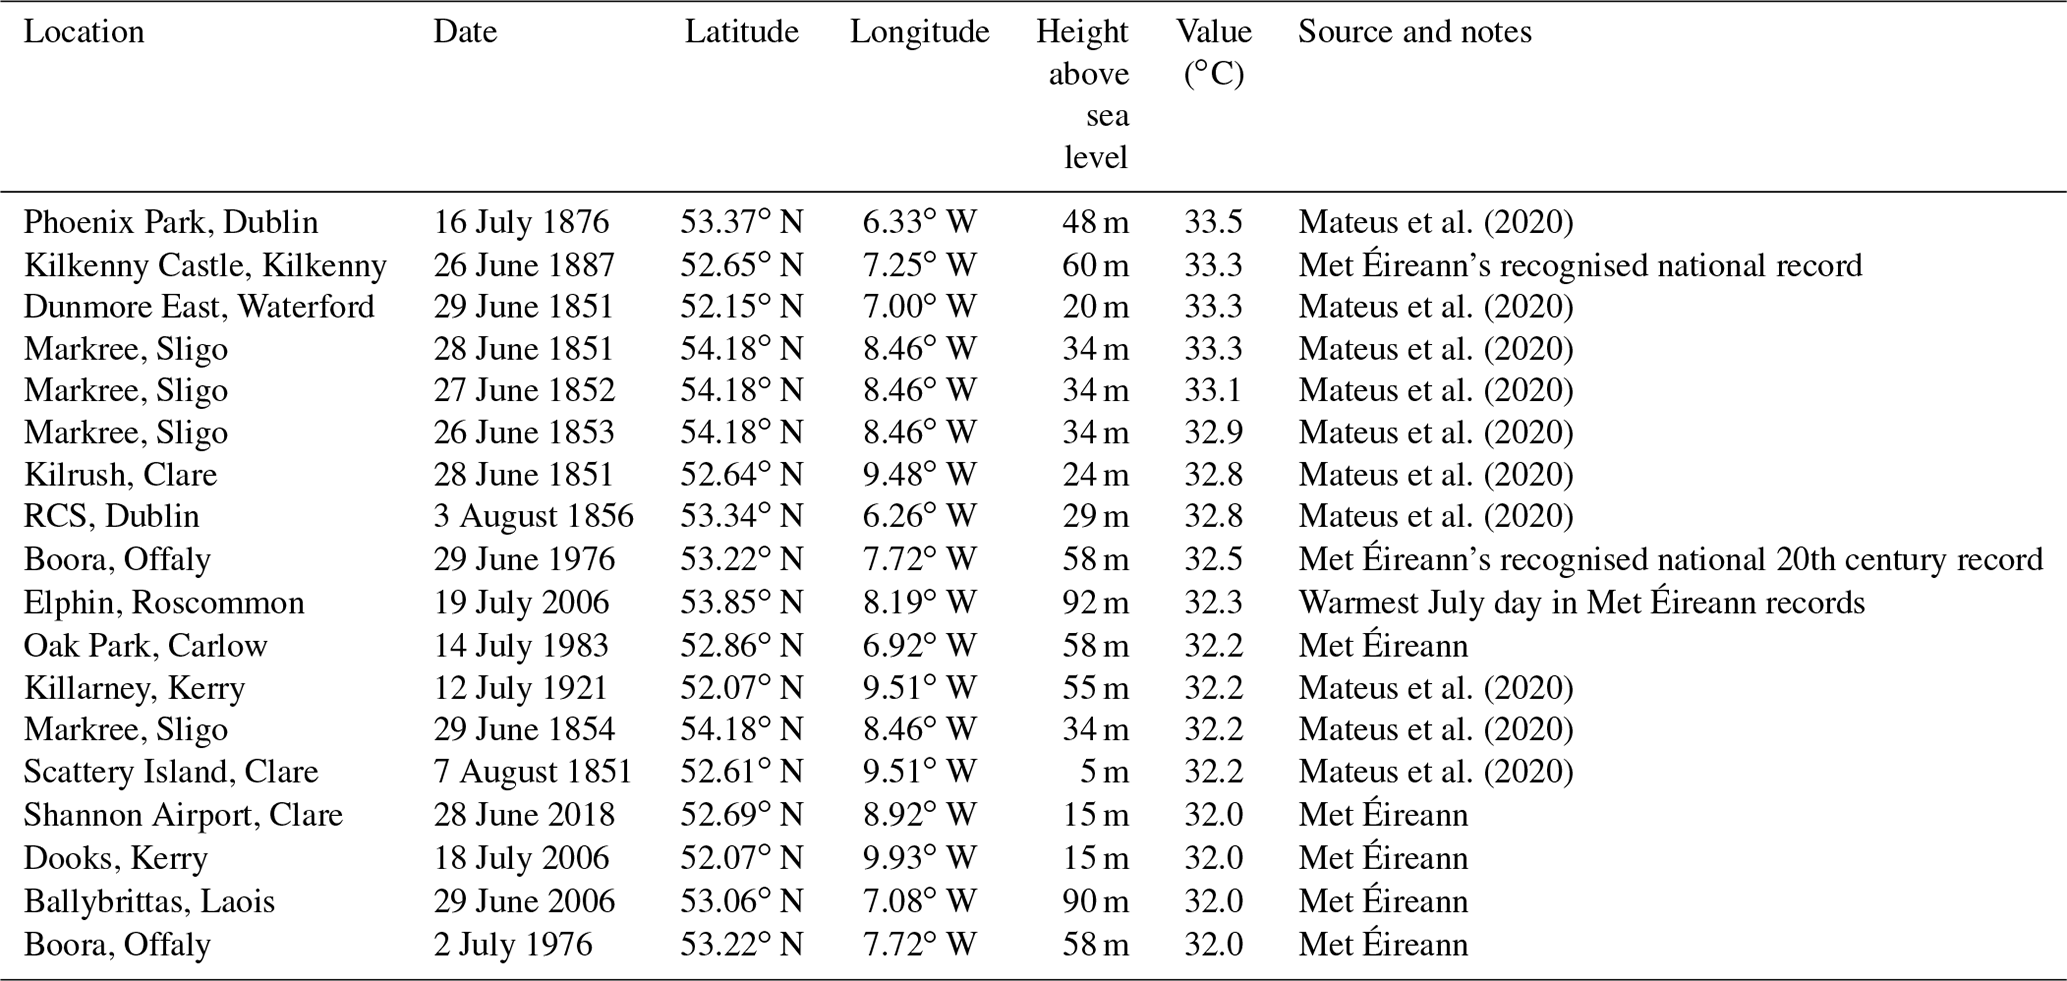
Figure 2 displays the location of the Kilkenny station as well as the six closest stations with continuously available daily records over the period of the national heat record. There are very few stations with continuous daily records over this period, with only five other stations on the island of Ireland for which records had been digitised and made available at the time of the present analysis. Data were sourced from holdings under preparation for the Copernicus Climate Change Service that arises from Met Éireann and the UK Met Office. Additional records may exist in the Met Éireann archives that are yet to be digitised or those of the UK Met Office, and the analysis largely preceded the availability of the very recently rescued holdings from Mateus et al. (2020) (Table 2). The stations on the island of Ireland all consist of long-running sites that have been well maintained by either Met Éireann and its predecessors or the Armagh Observatory. To augment the records on the island of Ireland, recourse is also made to records from Sheffield in the UK. There are other British stations for the same time, but they are even further from the Kilkenny site (e.g. Oxford, Kew Gardens). With the notable exception of a station situated southeast of Kilkenny, the stations provide a reasonable geographical spread sufficient to infer spatial temperature gradient behaviour on the day of the record.
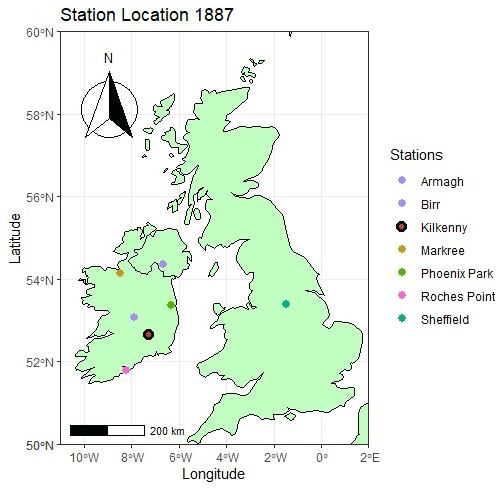
Figure 2Location of the seven stations in Ireland and England used in this study to assess the reliability of the reported Kilkenny record. The green marker shows the location of the Kilkenny station. Station selection is based upon availability over the period of the Kilkenny record high-temperature event.
Figure 3 illustrates observed surface temperatures for the month of June 1887 for the six comparator weather stations and the reported record temperature from Kilkenny. All station series show similar temporal evolution in their maximum daily temperatures through June of 1887 (although there is some ambiguity as to the timing of daily observations at several sites). A period of sustained heat builds during the second half of June, peaking on or around the day of the record, before breaking the next day. The break in heat appears to progress from north to south. Geographically, the nearest recording to the Kilkenny record on 26 June was Birr, which reported 29.3 ∘C, followed by Roches Point, which reached 22.2 ∘C. These high temperatures are backed up by contemporary records of the summer of 1887 being hot and dry. Noone et al. (2017) note that 1887 is one of the most intense drought years in Ireland in precipitation records spanning the past 250 years. Barrington (1888) assessed the impacts of the previous year's drought on agriculture, describing the drought of 1887 as being most extreme in the south and southeast, particularly in Counties Kilkenny, Wexford, and Cork where April to June precipitation was as little as 30 % of normal. Barrington also notes widespread crop failure across Ireland in 1887, while newspaper articles from the time indicate reduced harvests and crop failure throughout the country. Industrial activity, particularly the linen industry in Northern Ireland, was also adversely affected (Noone et al., 2017). Although the main focus of Barrington (1888) is on precipitation deficits, he does also note the temperature: “On Sunday, June 5th, the temperature rose, and for the remainder of the month we had a combination of heat and drought, which lasted until July 10th. No record exists of such a hot and dry June in the south and southeast of Ireland”. Barrington (1888) goes on to mention that “in June and July 1887, the S. of Ireland suffered more from excess of heat than any part of England or Scotland”, further cementing the plausibility that the island of Ireland was experiencing extreme hot and dry conditions at the time of the Kilkenny record high.
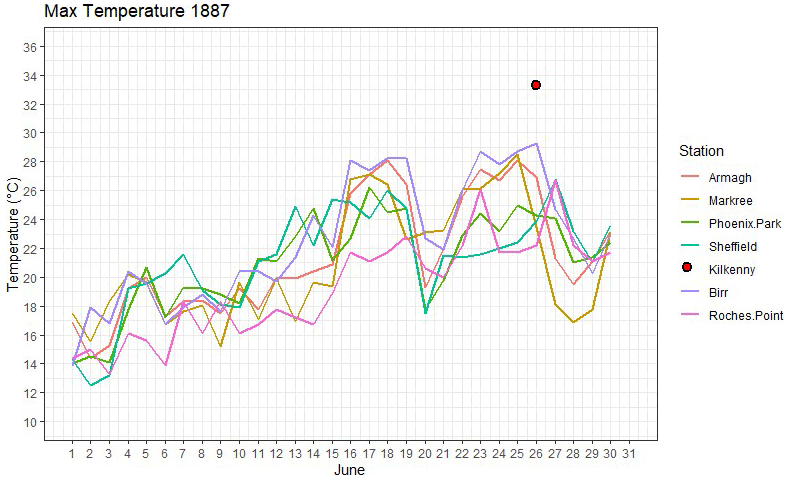
Figure 3The maximum air surface temperatures of the six selected weather stations for the month of June 1887. The red point marker displays the maximum surface temperature recorded at Kilkenny on 26 June 1887.
The 20CRv3 reanalysis product (Slivinski et al., 2019) extends back to the early 19th century using surface pressure and prescribed sea surface temperature boundary conditions to create physically consistent reconstructions of climate. This research paper gathered analyses at 15:00 GMT (14:30 LST) – the closest 3-hourly analysis window to the expected timing of daily maxima in Ireland – using the ensemble mean product. Examination of 20CRv3 fields over the period around 26 June 1887 highlights that there was a high-pressure system in place throughout the examined period (Fig. 4). Prior to 26 June the high pressure is centred to the north of Ireland, advecting air from the near continent. On 26 June the high pressure collapses and is subsequently replaced by a building high pressure from the near Atlantic, initially advecting cooler air from the north, which becomes centred over Ireland by the end of the month. The evolving pressure situation is highly consistent with the timing and relative phasing of changes reported from each site in Fig. 3.
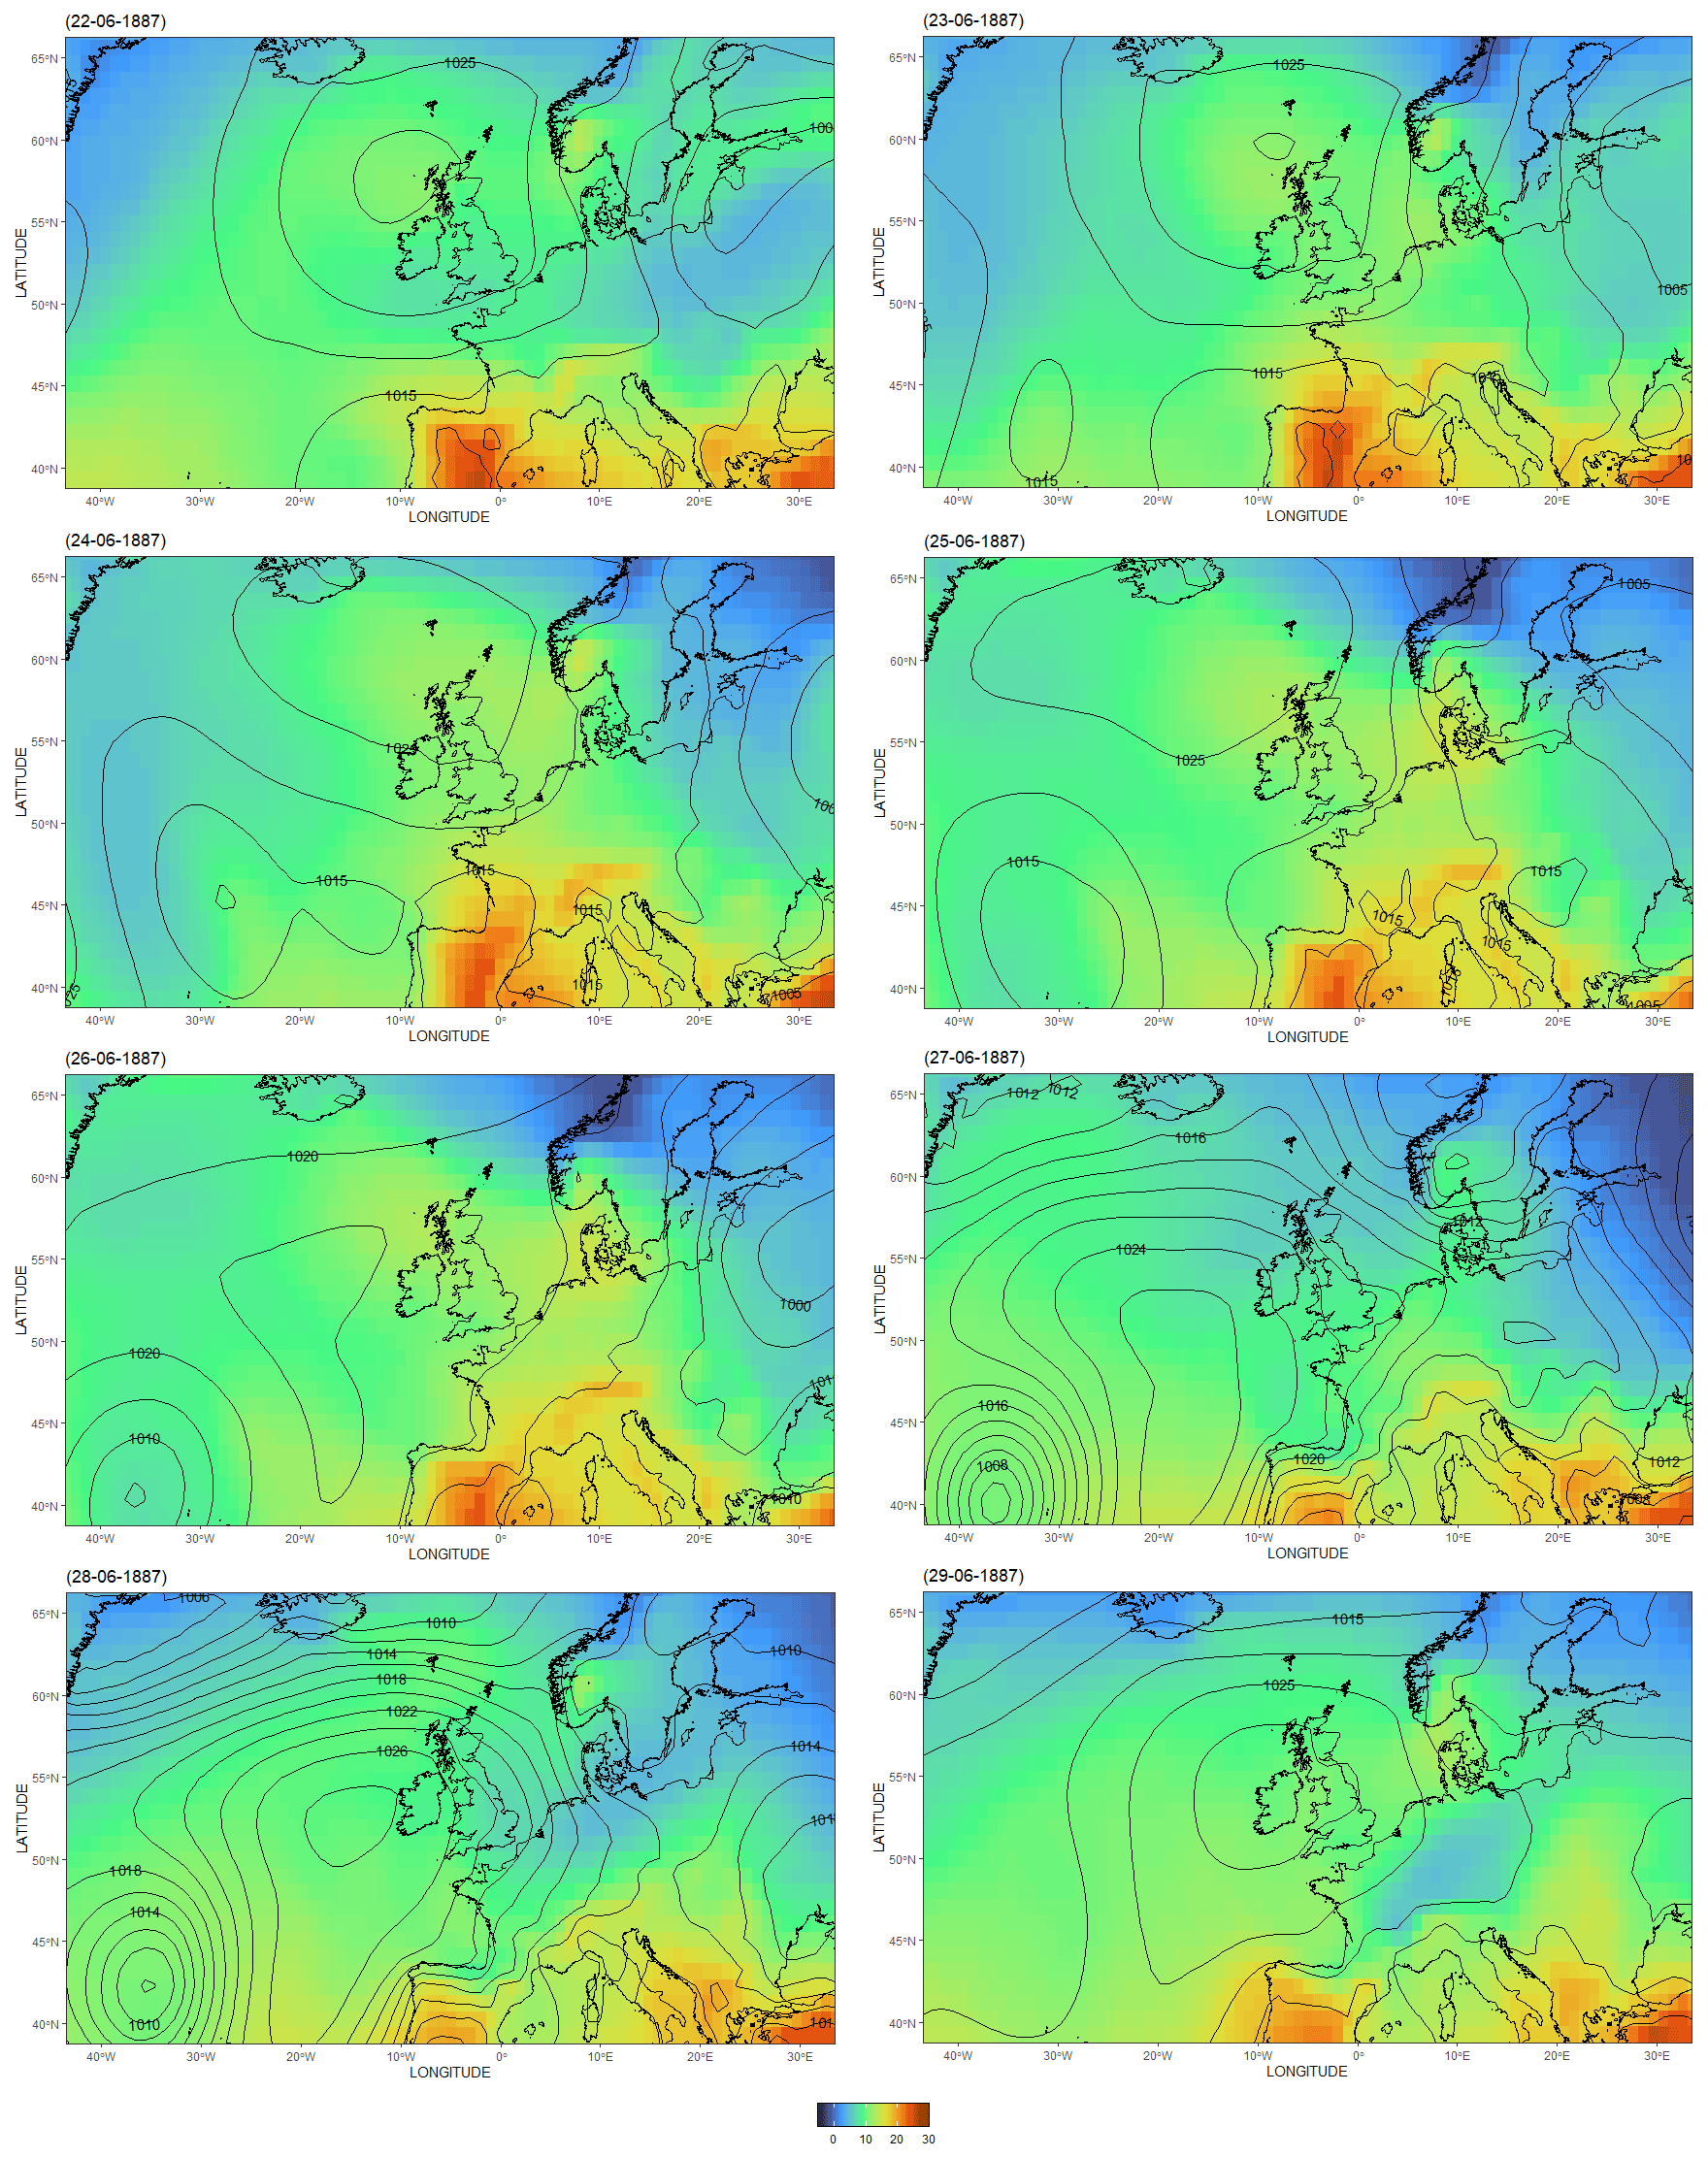
Figure 4NOAA 20CRv3 MSLP and 850 hPa temperatures over an 8 d period centred upon 26 June 1887. The 20th Century Reanalysis V3 data provided by the NOAA/OAR/ESRL PSL, Boulder, Colorado, USA, from their web site at https://psl.noaa.gov/data/gridded/data.20thC_ReanV3.html (last access: 21 January 2022; NOAA PSL, 2020). The domain of latitude 35–70∘ N and longitude 45∘ W–30∘ E was chosen to provide a synoptic view, with Ireland centred to provide an overview of the surrounding regions. The 850 hPa temperatures are given in colours while MSLP is given as contours. All maps correspond to 15:00 UTC, which is the approximate expected time of daily maxima in Ireland (corresponding to ca. 14:30 LST).
On the basis of the synoptic situation (Fig. 4) and the contiguous station series (Fig. 3), it is certain that the period was indeed a notable heatwave event that could, plausibly, be consistent with a record high temperature. From 22–26 June Ireland lay in a slack southeast-to-east airflow with an anticyclone of 1025 hPa centred to the north of the United Kingdom and Ireland and a weak cut-off cyclone of 1015 hPa centred to the west of Iberia. This situation would be typical for the advection of continental tropical air masses and the slack gradient consistent with low winds, enabling local diurnal solar heating of the near-surface air mass. Taken together, these conditions would be broadly consistent with exceptional warmth relative to seasonal expectations. However, such a synoptic situation is not uncommon in the summer season over Ireland. In isolation this evidence is thus insufficient to determine the validity of the record. On 27–28 June a new anticyclone of 1024 hPa replaced the previous anticyclone and was centred just to the west of Ireland. There was a deepening cyclone almost stationary to the west of the Canary Islands and a developing cyclone centred just to the west of Norway. This resulted in a northerly/northwesterly flow of advection of polar maritime air over 26–27 June, leading to the cooling trend seen in all contiguous station series (Fig. 3). By 29 June the anticyclone became centred over Ireland with slack winds. The evolving synoptic situation from 20CRv3 is entirely consistent with the temporal evolution of temperatures at the stations plotted in Fig. 3.
The 850 hPa temperature, which corresponds approximately the top of the boundary layer in Ireland in summer, is often used by meteorologists to indicate the potential surface temperatures and is used here and elsewhere to indicate the potential for significant surface warmth. However, under high pressure and stable air masses there is considerable potential for near-surface inversions that enable build-up of additional heat near the surface above and beyond what would be expected from simple adiabatic lapse rate assumptions. The relative coarse resolution of the 20CRv3 product () and potential for climatological biases in surface temperatures arising from this arguably make the 850 hPa temperatures more reliable for the present analysis than the 2 m air temperature estimates as an indicator of at least the potential for significant and widespread surface warmth. Focussing in more locally and considering the 850 hPa reanalysed temperature fields (Fig. 5) highlight an increase in temperatures at this pressure level, peaking around 25 June, followed by a rapid cooling and then a degree of recovery through the period. The 850 hPa temperatures are not, however, exceptional, reaching only the mid-teens to high teens at their peak. While this cannot preclude very high surface temperatures, it would require a very substantial near-surface inversion to support temperatures at the surface as high as that reported from Kilkenny Castle.
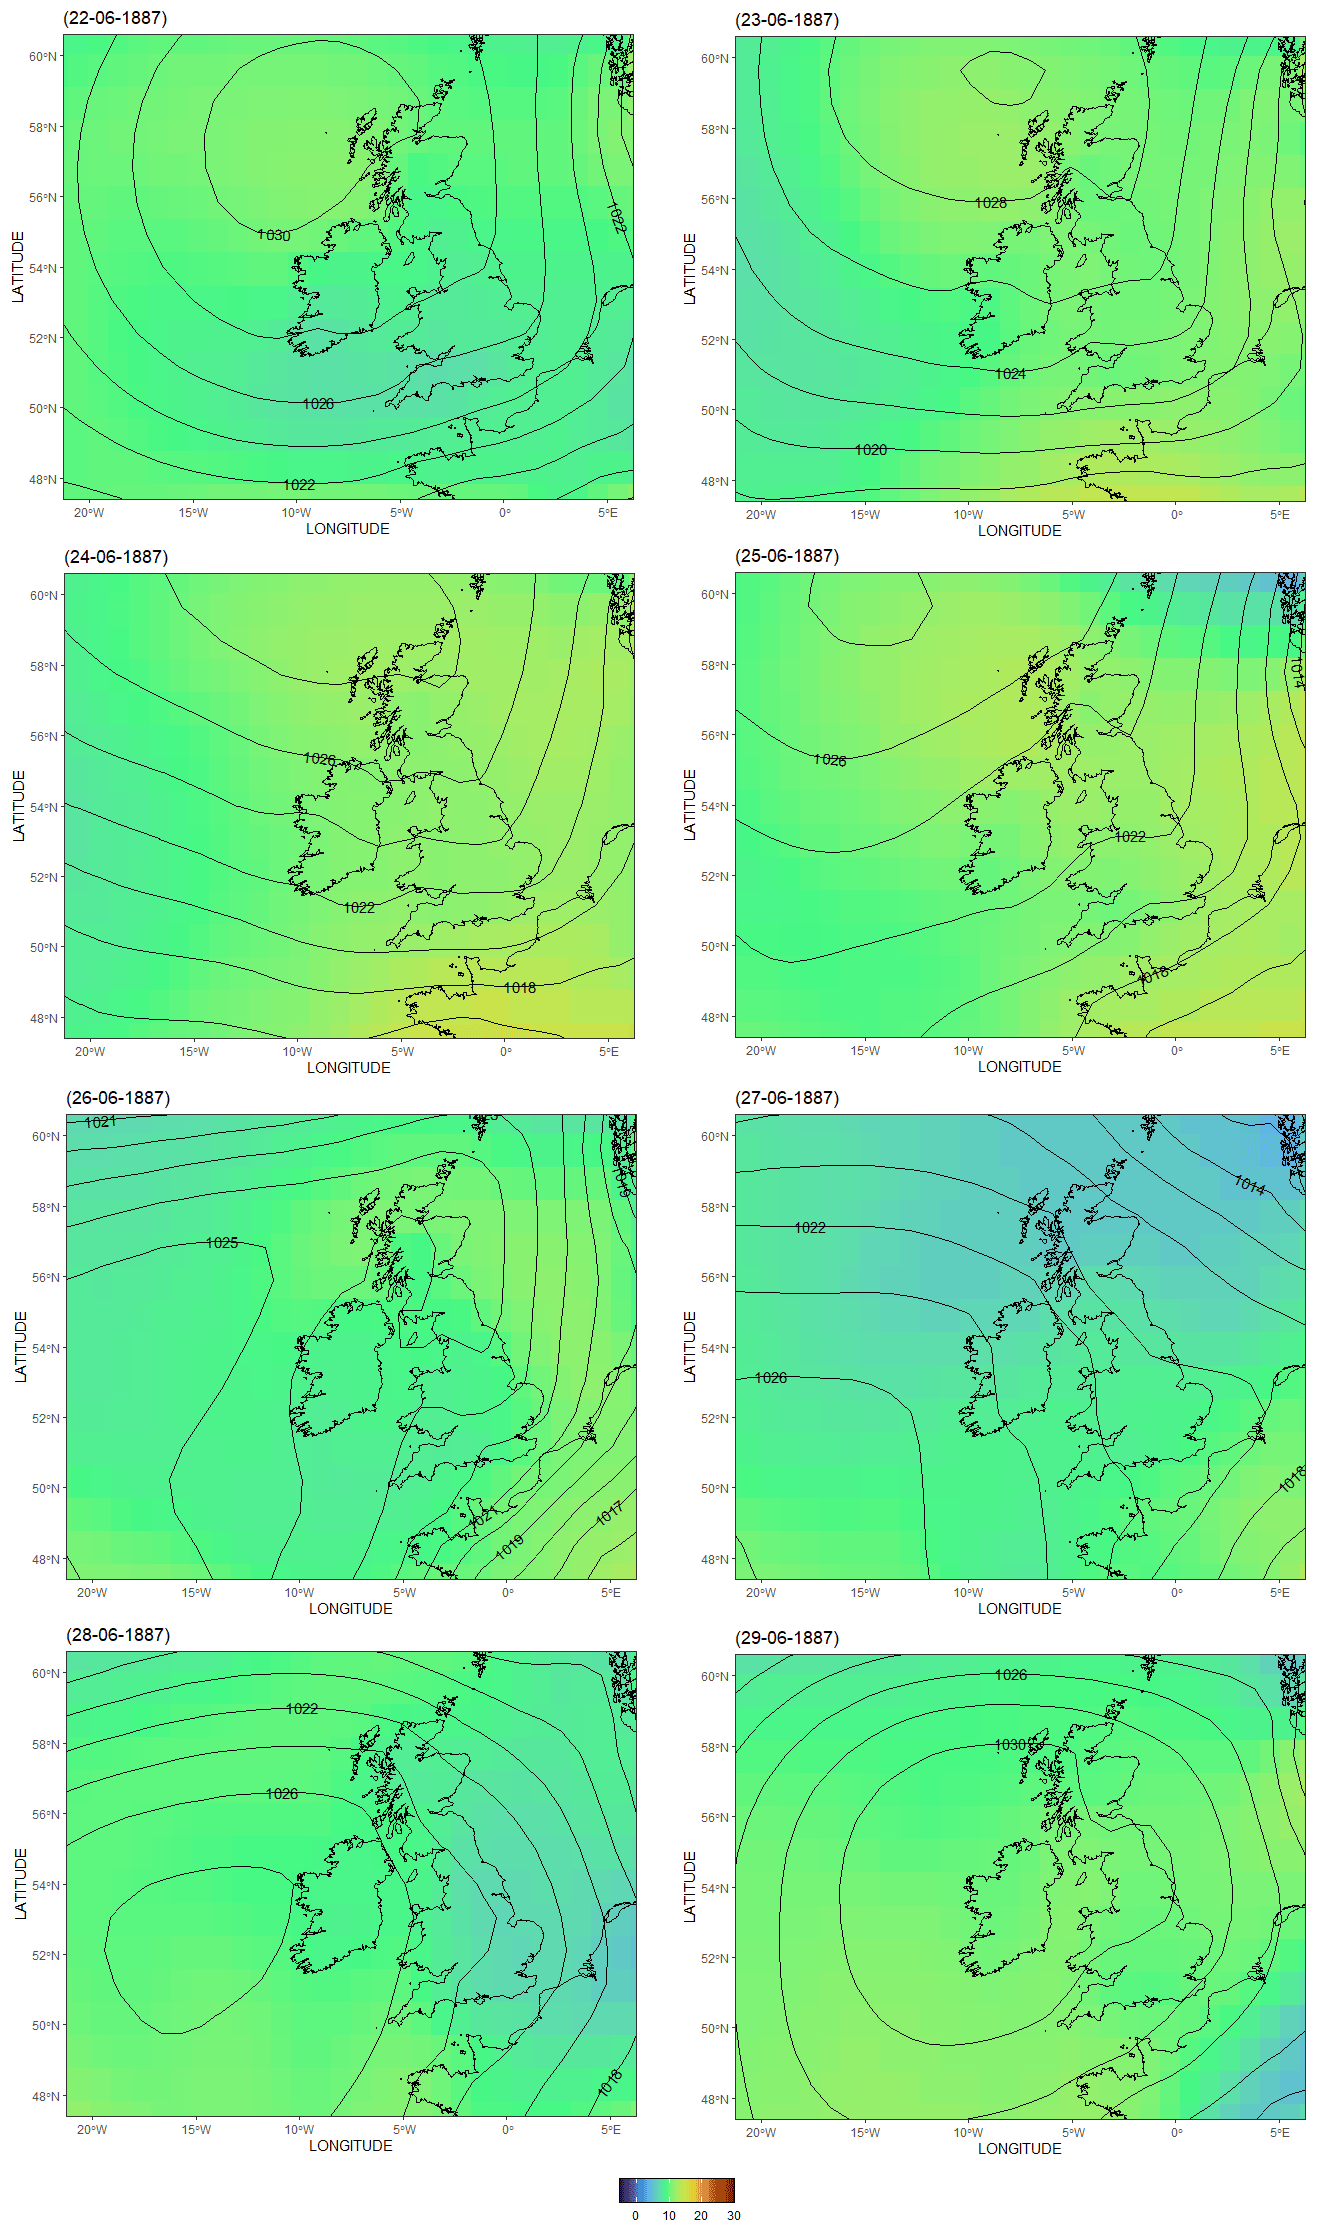
Figure 5As Fig. 4 but zoomed in to the British and Irish isles region. See the Fig. 4 caption for further details and note that 20CRv3 native resolution is .
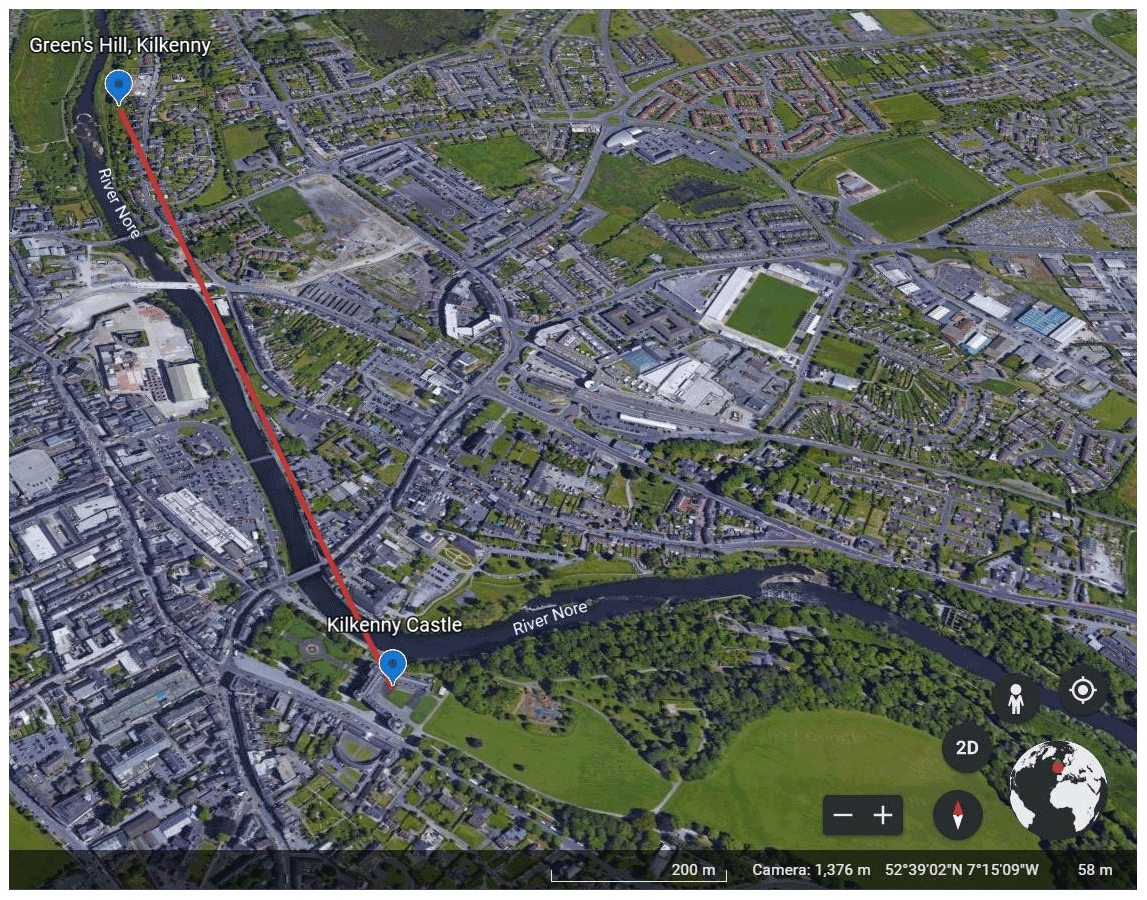
Figure 6Illustration of the relative positioning of Kilkenny Castle and Greenshill, Kilkenny (© Google Earth, 2022).
With the exception of the Kilkenny Castle site, all sites used in Fig. 3 have nearly complete records through to the present, many of which have been digitised. Since 2010, data from Kilkenny Greenshill (also referred to as Green's Hill or Green Hills), which is very close to the location of the original Kilkenny Castle site, are available via Met Éireann. The Greenshill site is at a distance of 1.6 km NNW from Kilkenny Castle (Fig. 6). The elevation differs by approximately 12 m, with Kilkenny Castle lying at 58 m a.s.l. while the Greenshill station lies 46 m a.s.l. Both sites are reasonably proximal to the River Nore, and both are surrounded by some urban infrastructure. Thus, the Kilkenny Castle and Greenshill stations are likely to have been broadly comparable. Although clearly the lack of a period of overlap leaves some irreducible uncertainty in this interpretation. The availability of several years of modern data using modern instrumental techniques both near the site of the original Kilkenny record and at the sites of the historical comparator sites permits statistically based comparisons. Summer season time series from each station were matched to account for missing data, and then modern differences between station pairs were analysed to provide context for the evident offsets between Kilkenny Castle and remaining sites in Fig. 3 on 26 June 1887. For Birr, the modern data were only available for the 2010 summer, which would have been insufficient to analyse the frequency distributions. As a result, Birr station was excluded from the modern-day frequency distribution analysis.
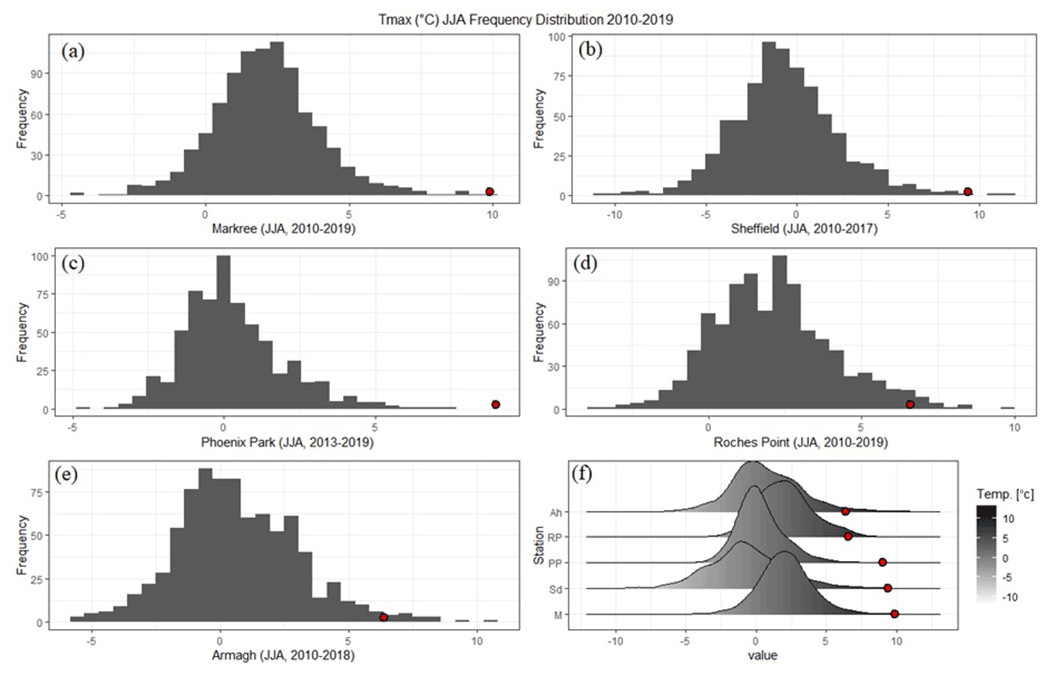
Figure 7(a–e) Modern-day distribution for the JJA season differences between the maximum temperature of Kilkenny Greenshill and the five stations where the data were most available and (f) amalgamation of all of the stations for comparison purposes. Shown in red is the difference reported on 26 June 1887 between each station and Kilkenny Castle.
In observing the modern-day differences between Kilkenny Greenshill and five of the closest stations with available data in 1887 (Fig. 7), several inferences can be made. For the modern-day differences between Markree and Kilkenny Greenshill, 90 % of the distribution lies between a 0–5 ∘C temperature difference (Kilkenny warmer than Markree on average, Fig. 6a). The difference recorded between Markree and Kilkenny Castle on 26 June 1887 was 9.9 ∘C, which is a substantial outlier. The bulk of the differences (95 %) between Kilkenny Greenshill and Sheffield (2010–2017) lie between −5 and 5 ∘C (broader because of the far greater distance between the sites). Despite this increased dispersion of modern-era differences, the difference between Sheffield and Kilkenny Castle on 26 June 1887 of 9.4 ∘C again indicates a substantial outlier relative to modern inter-site characteristics. Only a handful of higher differences have been reached within the recent era. For Kilkenny Greenshill and Phoenix Park (2013–2019), 95 % of the data lie between −2.5 and 2.5 ∘C, with Kilkenny Greenshill generally measuring slightly higher temperatures than Phoenix Park. The difference on 26 June 1887 between Kilkenny Castle and Phoenix Park at 9 ∘C lies entirely outside the distribution of modern inter-site behaviour. The highest recorded temperature difference in the modern era was 7.5 ∘C, indicating the currently recognised heat record to be an extreme anomaly. Most (95 %) differences between Kilkenny Greenshill and Roches Point (2010–2019) lie within a range between 0 and 5 ∘C, showing that here again Kilkenny Greenshill generally measures higher temperatures than Roches Point. The temperature record of 26 June 1887 was 6.6 ∘C warmer at Kilkenny Castle than Roches Point and lie within the upper 2 % of the differences. Similarly, the difference between Armagh and Kilkenny Greenshill (2010–2018) shows that 90 % of the data lies within −2.5 and 3 ∘C. Here, the temperature difference of 6.4 ∘C between Kilkenny Castle and Armagh also lies within the upper 2 %, showing that such a temperature difference is unlikely to occur but not impossible.
The 26 June 1887 difference between Kilkenny Castle and all surrounding sites is highly anomalous, being in the extreme upper tail at Markree, Sheffield, Roches Point, and Armagh and entirely outside the distribution for Phoenix Park. Differences overall are highly anomalous in a broad arc from the SSW through the N to due E. While there is a change in circulation via advection of a northerly air mass, this occurred on 27 June (Figs. 3 and 4), and there is no obvious active frontal system that may lead to a multi-degree thermal gradient between Kilkenny and its neighbours that would support such an extreme departure from all neighbouring sites. The slack pressure gradient also does not support such a strong temperature gradient between Kilkenny and neighbouring sites. While many of the Irish stations are coastal, Birr (for which unfortunately a modern data comparison was not possible) is not and would have been less impacted by any sea breezes that may have set up than Kilkenny. Overall, therefore, while June 1887 undoubtedly was an unusually hot month and there is strong support for a build-up of heat breaking on or around 26–27 June, the very anomalous differences compared to modern behaviour argue strongly against the validity of the reported Kilkenny Castle record value. The question therefore is what value may constitute the “true” Irish national heat record and when did it occur?
Table 2 noted a number of other candidate dates and locations in which the reported temperature exceeded 32 ∘C. Unlike the Kilkenny Castle value, many of these observations have been made as part of long-term series that are digitally available. These permit, in addition to the analyses performed for Kilkenny Castle, a consideration of the evolution of the station series around the event, including for some cases the hour-by-hour evolution of temperatures on the day. Also, at least for more recent events, there is a denser neighbour series network available to perform the neighbour-based comparison, and the difference series can be calculated directly rather than via a replacement site as is the case in Kilkenny. The relative recency of the events also means there are better metadata, and the records are generally made in a more standardised and uniform manner, consistent with WMO guidance on methods of observation (WMO, 2018). However, first it is necessary to consider the viability of the other records unearthed by Mateus et al. (2020), many of which pre-date the Kilkenny Castle record.
4.1 Early period candidate record high temperatures
Mateus et al. (2020) have digitised a range of early Irish meteorological stations and made these data available. In constructing Table 2 the majority of the remaining observations above 32 ∘C arise from this source, including an observation of 33.5 ∘C from Phoenix Park, Dublin, in July 1876, which is even warmer than the Kilkenny Castle observation, and a set of observations made in the 1850s.
4.1.1 1850s candidates
The suite of observations made in the 1850s, with the exception of the RCS observation in 1856, preceded the formation of the UK Met Office in 1854 (at the time the Republic of Ireland had not gained independence from the UK). Metadata on who exactly took these observations are incomplete but suggest they were undertaken by military engineers to whom it is assumed some degree of training had been given. This period precedes efforts to shield instruments using a Stevenson screen (Stevenson, 1864), and instruments may typically have been housed on north-facing walls or placed in ventilated rooms (Parker, 1994). There is substantial literature pointing to potential biases in these early records with a tendency for summertime maxima to be overestimated (Parker, 1994; Camuffo, 2002; Böhm et al., 2010; Trewin, 2010; Brunet et al., 2011). Specifically, modern-day comparisons of either original instruments and exposures (Böhm et al., 2010) or reconstructed instruments and exposures (Brunet et al., 2011) with standard Stevenson screens highlight important potential biases in summertime daily maximum temperatures. These are particularly marked for mid-latitude north wall exposures that would, especially if not oriented to true north, catch significant solar radiation in mid-summer (Parker, 1994; Böhm et al., 2010).
A further concern over the validity of several of these 1850s high-temperature records relates to their geographical situation. A reading of 32.2 ∘C on Scattery Island, Clare, an island off the west coast of less than 1 km × 1 km seems implausible when climatological sea surface temperatures are in the high teens. Markree in Sligo also appears multiple times. While it is possible in theory to have a high temperature at these stations given the presence of a long upstream land passage of air combined with an offshore wind, as a near-coastal location in the NW of Ireland it is difficult to envisage how temperatures as warm as 32 ∘C or higher could be attained on such a regular basis. They also are very much bunched around late June, which may indicate the presence of radiative effects around the solstice upon this measurement series or something as simple as annual leave measurements being taken incorrectly by a substitute observer. Kilrush in Clare is similarly coastal, and similar questions would pertain to how plausible such extreme heat was so close to the Atlantic Ocean. The same concerns pertain to Dunmore East, which is on the Irish Sea coast of SE Ireland. The Royal College of Surgeons in Dublin is relatively close to the quay, so, again, it is questionable whether such a warm temperature could be attained even allowing for urban heat island effects.
The 1850s candidates also are sometimes associated with implausible synoptic situations according to NOAA 20CRv3 (NOAA PSL, 2021) MSLP and 850 hPa temperature reanalysis reconstructions (Fig. 8). Even in the 1850s the available pressure constraint is sufficiently robust over NW Europe to provide a robust synoptic-scale reconstruction. The three synoptic charts in 1851 (Fig. 8) are associated with high pressure and a slack flow of air from the continent which would, generally, be associated with climatologically hot conditions. Of note is that over 28–29 June 1851, Kilrush, Markree, and Dunmore East all reported temperatures in excess of 32 ∘C. Combined with the synoptic chart reconstructed from 20CRv3, there is little doubt that 28–29 June 1851 was, indeed, a heatwave event across the island of Ireland. Newspapers at the time reflected these conditions reporting on the “hot” and “oppressive” weather that was occurring in Ireland (Freemans Journal, 1851; Leinster Express, 1851).
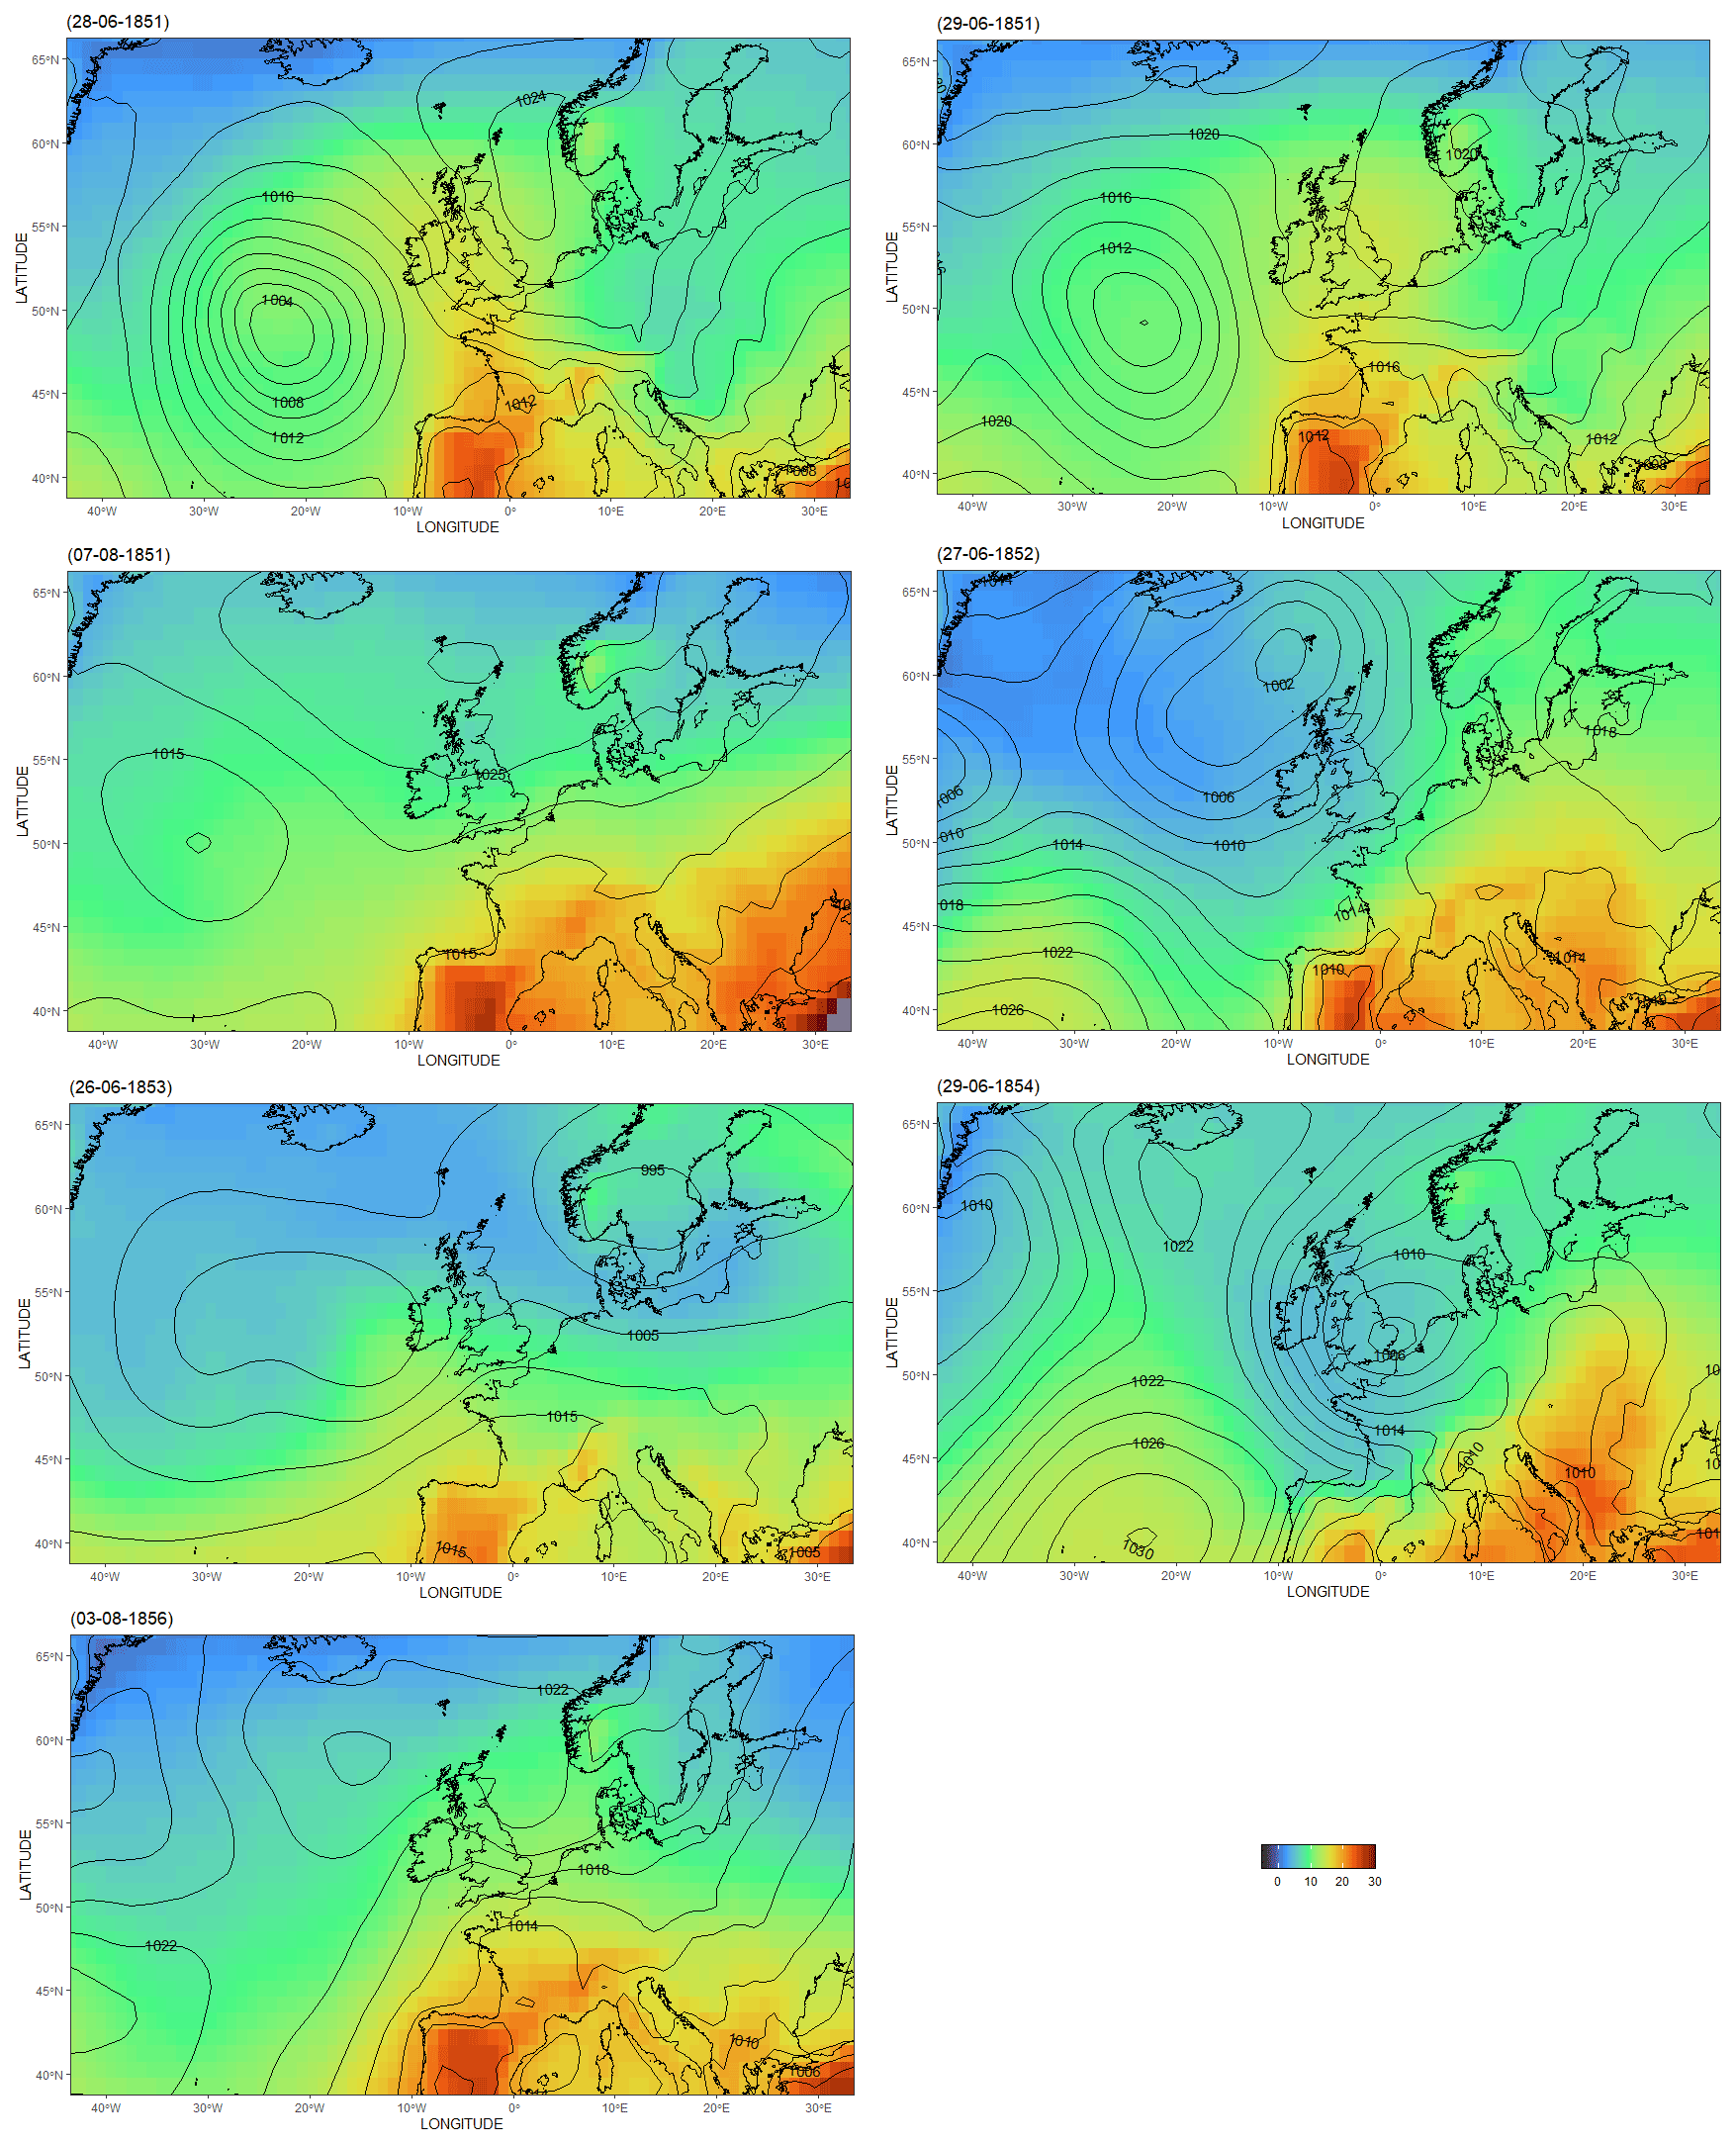
Figure 8NOAA 20CRv3 MSLP and 850 hPa temperatures on the dates of the possible heat records in the 1850s arising from the recent Mateus et al. (2020) data rescue and as documented in Table 2. The 20th Century Reanalysis V3 data provided by the NOAA/OAR/ESRL PSL, Boulder, Colorado, USA, from their web site at https://psl.noaa.gov/data/gridded/data.20thC_ReanV3.html (last access: 21 January 2022). The domain of latitude 35–70 ∘N and longitude 45 ∘W–30 ∘E was chosen to provide a synoptic view, with Ireland centred to provide an overview of the surrounding regions. All maps correspond to 15:00 UTC, which is the approximate expected time of daily maxima in Ireland (corresponding to ca. 14:30 LST).
The remaining dates in the 1850s are associated synoptically with conditions that would tend to be climatically normal or even below normal temperatures. The 27 June 1852 chart has a low pressure to the north of Ireland with a slack westerly flow, which would be an onshore wind at Markree, Sligo, and taken together with the depressed 850 hPa temperatures would be completely inconsistent with a temperature in excess of 32 ∘C. The 26 June 1853 event, again for a temperature at Markree, Sligo, is represented by a southwesterly flow, which is grossly inconsistent with temperatures as high as the low 30s in this location. The situation on 29 June 1854 is of a low pressure centred over England with a northerly flow, again inconsistent with temperatures in excess of 32 ∘C at Markree. The 850 hPa temperatures are also notably depressed on this date, casting considerable further doubt on the verity of this record. The slack pressure gradient on 3 August 1856 leads to potentially a slight easterly onshore wind inconsistent with a high temperature at the Royal College of Surgeons in Dublin.
Taken together, the uncertainty relating to early instrumental bias, climatological locations, and in many cases lack of substantive synoptic situation support mean that the 1850s values contained in Table 2 almost certainly should be precluded as robust candidates for record temperatures. That is not to say that, at least in some cases, the values may not be correct or at the very least indicative of, climatologically speaking, extreme heat. But Markree in particular, which occurs the most frequently, has values that are often not supported at all by the synoptic situation.
4.1.2 The Phoenix Park value of 33.5 ∘C
The Phoenix Park site is the longest running contiguous site in the Republic of Ireland. Originally run by the Ordnance Survey, then the military, it is now maintained by Met Éireann. It is a little unclear exactly how the potential record on 16 July 1876 was measured. Mateus et al. (2020) mention “Drawings when no station photographs are available for the early 19th century, for example Cameron (1856) of the thermometer screen at Phoenix Park Dublin, are furnished”. In 1879 there is the first mention of measurements by a Stevenson screen: “quality of the record improved and since 1879/1880, when the thermometers were housed in a Stevenson screen, the data may be considered to have a high level of accuracy and reliability [sic]” (Irish Meteorological Service, 1983, p. 4). It is hence probable, but not certain, that the measurement was made by a thermometer housed in something other than a Stevenson screen, although exactly what is hard to ascertain precisely. The site is about 5 km inland from Dublin Bay such that, in the absence of a sea breeze, climatologically speaking, a temperature in the 30s could potentially be attained. The synoptic situation as reconstructed by NOAA 20CRv3 is supportive of very warm conditions with a near-stationary high pressure of 1025 hPa centred over the British and Irish isles (Fig. 9). Preceding days had a gentle flow of air from the near continent/Iberian peninsula. The 850 hPa temperature evolution (Fig. 10) is also highly supportive of very warm temperatures – more so than for the Kilkenny Castle record (see Fig. 5). The 850 hPa temperatures are consistently in the high teens to low 20s and peak on 16 June, consistent with the date of the recorded maximum. The peak results from the advection of very warm air over several days from the continent. There is thus clear synoptic support for very high temperatures at this time.
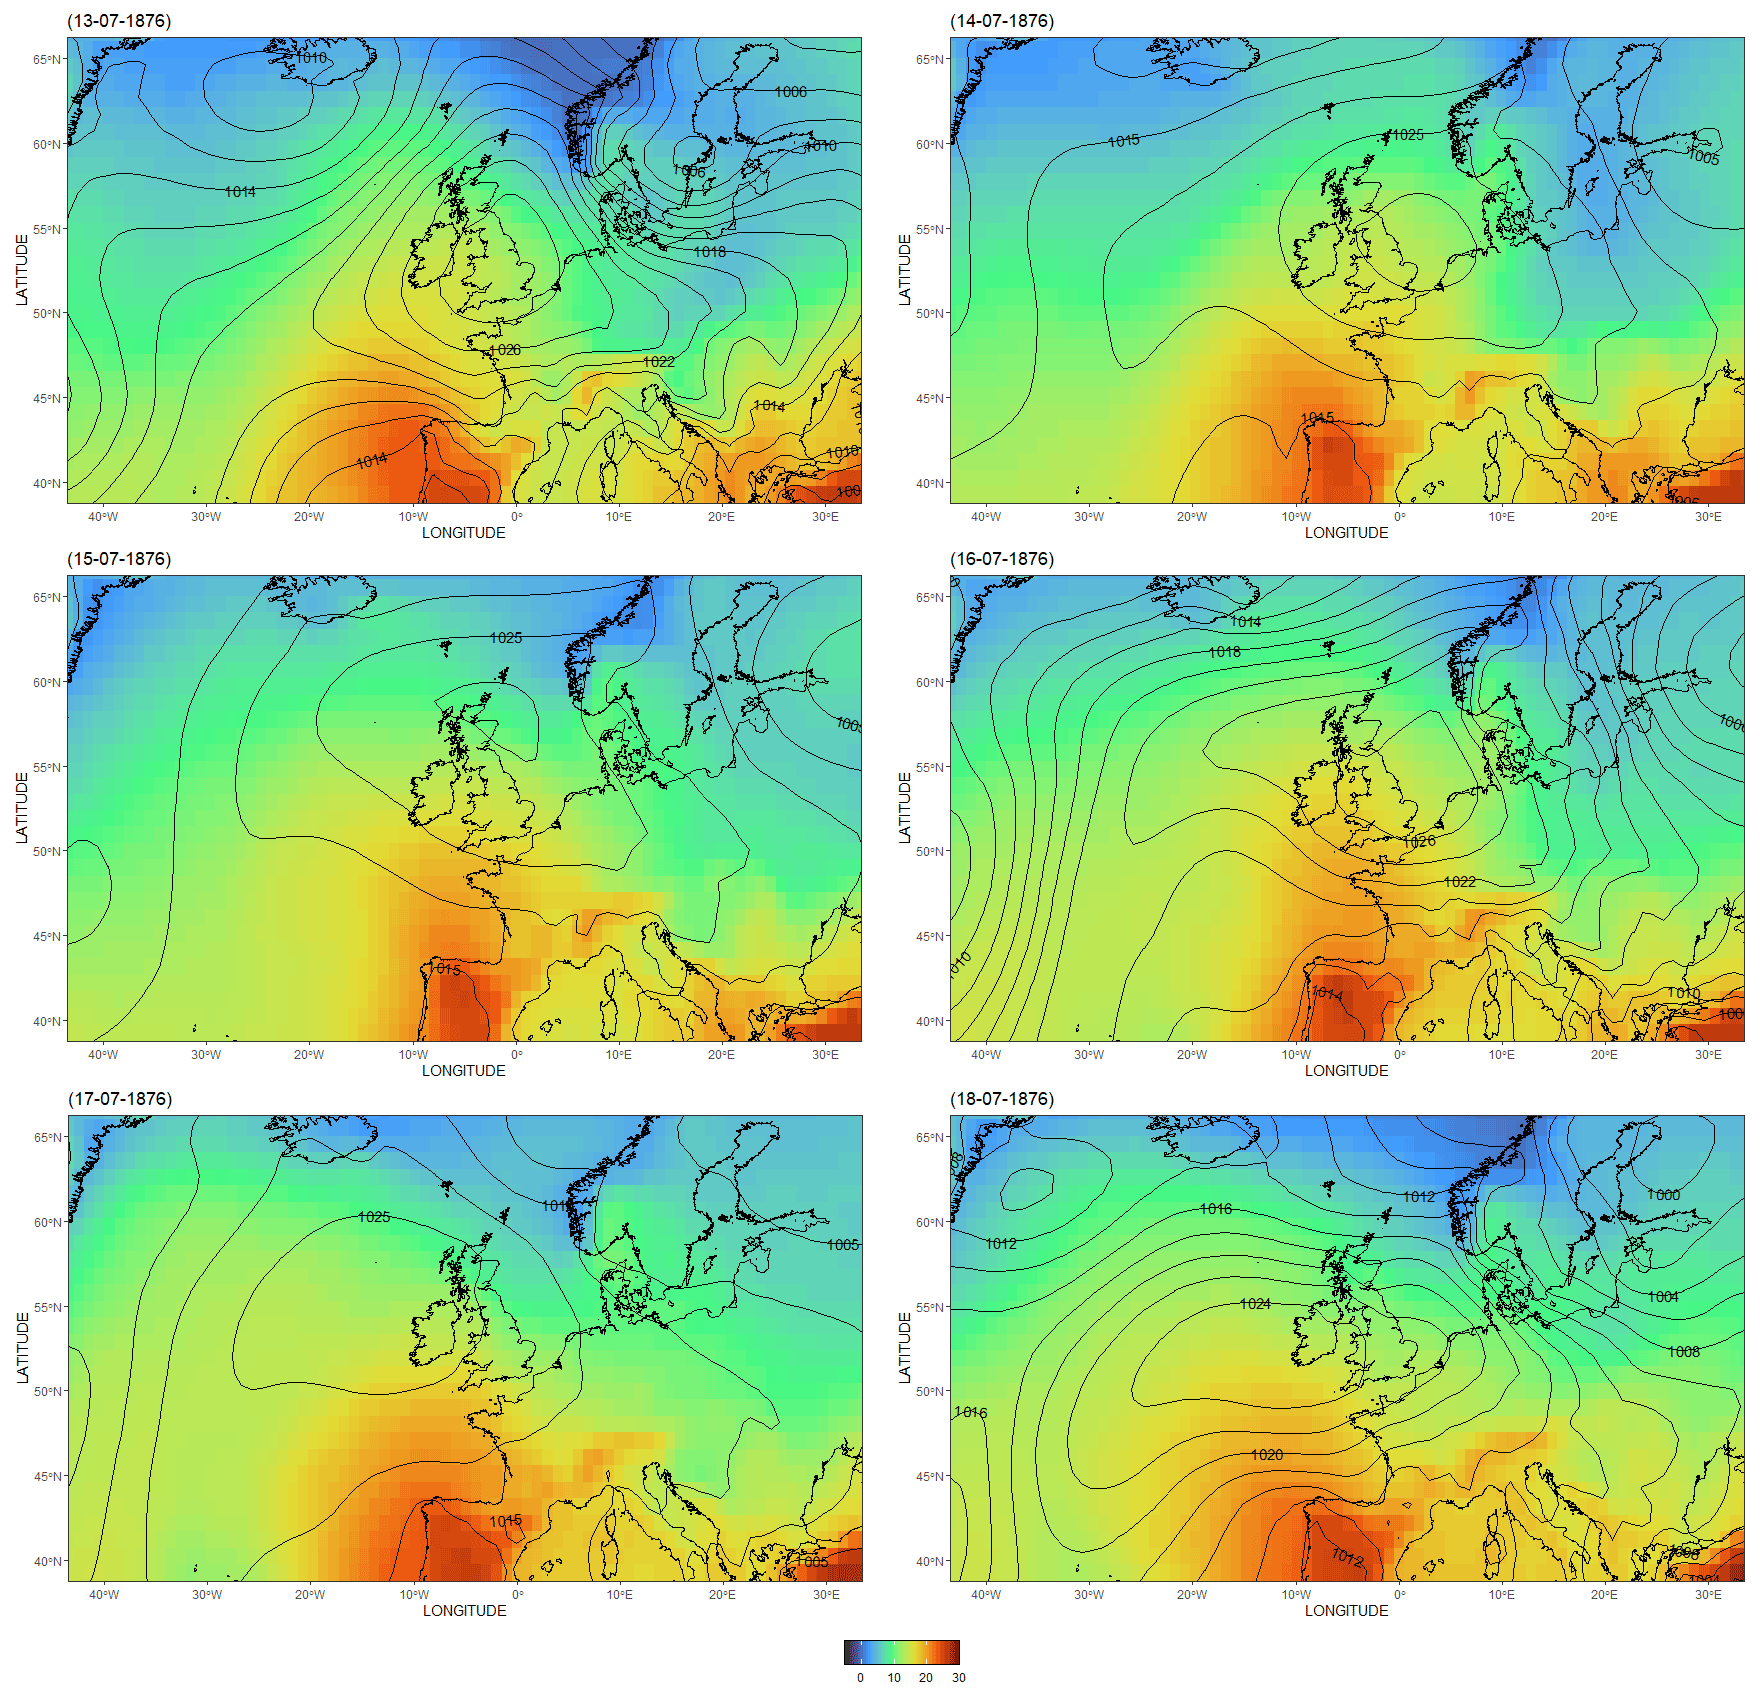
Figure 9NOAA 20CRv3 MSLP and 850 hPa temperatures evolution around the Phoenix Park observed value of 33.5 ∘C in 1876 on 16 July. The 20th Century Reanalysis V3 data provided by the NOAA/OAR/ESRL PSL, Boulder, Colorado, USA, from their web site at https://psl.noaa.gov/data/gridded/data.20thC_ReanV3.html (last access: 21 January 2022). The domain of latitude 35–70∘ N and longitude 45∘ W–30∘ E was chosen to provide a synoptic view, with Ireland centred to provide an overview of the surrounding regions. All maps correspond to 15:00 UTC, which is the approximate expected time of daily maxima in Ireland (corresponding to ca. 14:30 LST).
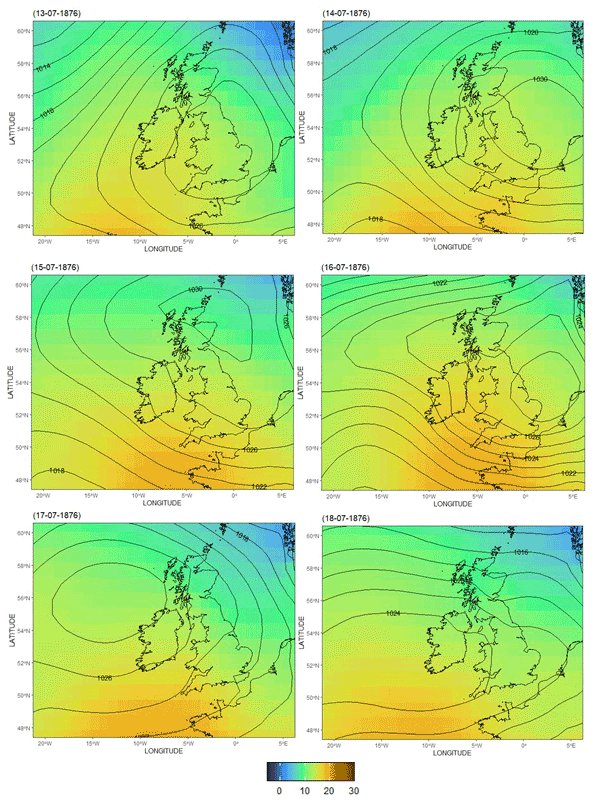
Figure 10As Fig. 9 but for zoomed-in data for the British and Irish isles.
Having discounted the long-standing Kilkenny Castle national record in Sect. 3 and, in Sect. 4.1, ruled out as sufficiently robust any values from the 1850s, this leaves the Phoenix Park temperature a full 1 ∘C warmer than any other remaining candidate value in Table 2. Most of these remaining candidate values are from far further inland where such high temperatures a priori would be more easily attainable. When analysed against other Dublin City temperature observations for the month of July 1876 (Fig. 11), it can be seen that, while a similar temperature evolution is mostly followed throughout the month, the Phoenix Park station is consistently hotter than the other Dublin stations (except for the 3rd and 26th days) by between 1 and 2∘. Dixon (1953) reported a sudden and rapid temperature high just a few years earlier, on 21 July 1868: “the temperature in Phoenix Park one day during July shot up to 88.4 degrees F. (31.3 ∘C), a record which has yet to beaten”. At this time, the National Botanic Gardens, Dublin, similarly recorded a very hot July; however the temperature recorded on 21 July is 81 ∘F (27.2 ∘C), several degrees below the Phoenix Park recording despite their close geographical proximity.
It is clear from the 20CRv3 reconstruction and the surface temperature recordings shown in Figs. 9 and 10 that the synoptic situation in July 1876 supports very warm conditions. However, the near-constant systematic elevation of the temperature readings in Phoenix Park relative to other stations casts doubt on whether it was reporting the actual surface temperature at the time. Phoenix Park is in an elevated position so on lapse rate basis alone would be expected to record slightly lower and not higher temperatures than nearby sites. While the value at Phoenix Park cannot be discounted, there is equally no obvious way to sufficiently robustly confirm the observation for it to be adequately verified as a national heat record.
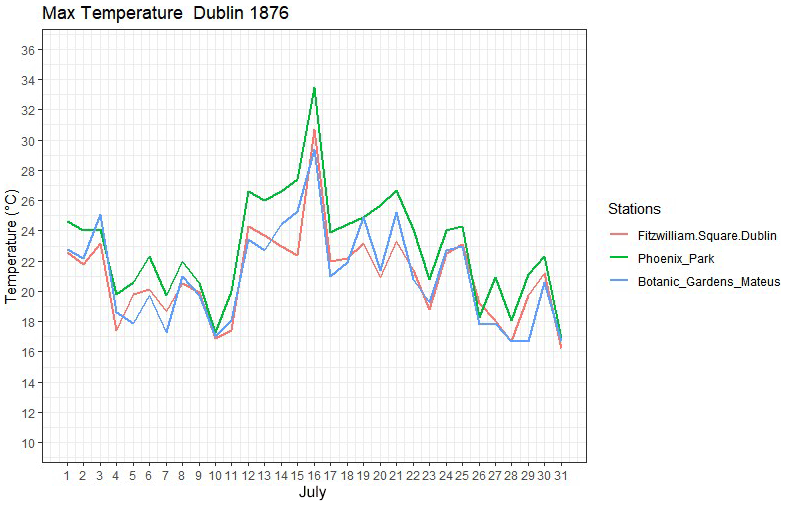
Figure 11The maximum surface temperatures of all available stations in Dublin City during June 1876.
4.2 Candidates since the beginning of the 20th century
The remaining candidate events in which the reported temperature attained or exceeded 32 ∘C are all associated with synoptically broadly similar conditions. High pressure in each case is situated over or to the north-northeast of the island of Ireland, often with weak advection of air from the near continent (Fig. 12). For all cases the 850 hPa temperatures are elevated relative to seasonal expectations, with 850 hPa temperatures in the high teens to low 20s. The synoptic situations thus do not call into immediate question any of the remaining candidate values' realism.
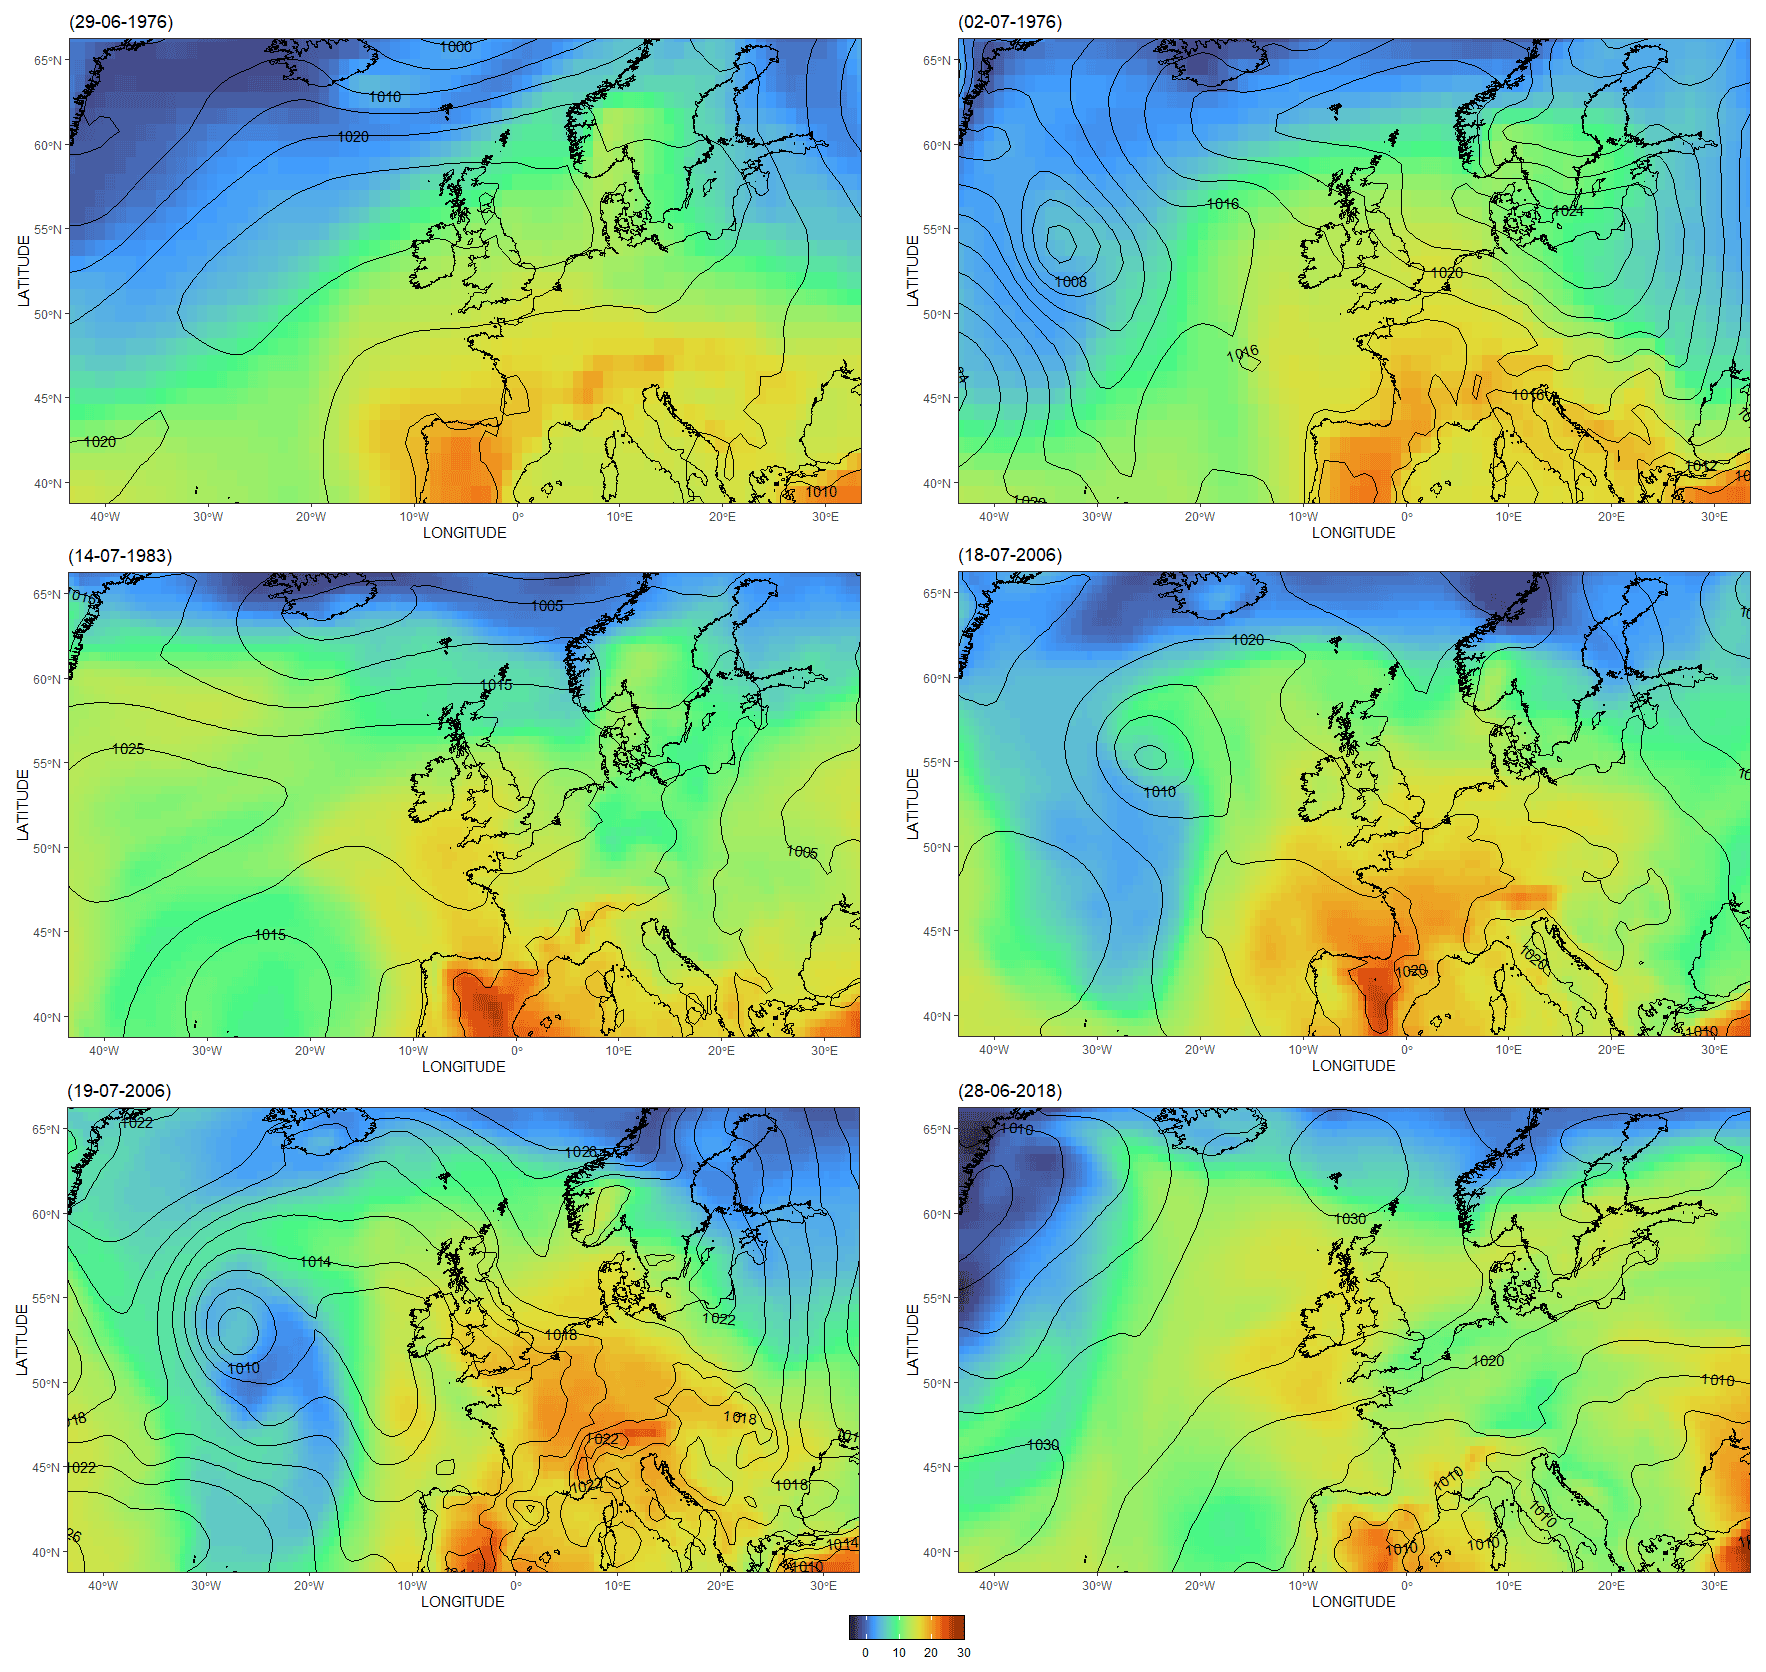
Figure 12As Fig. 4 but for the dates of post-1900 possible record heat events as detailed in Table 2. Data provided by the NOAA/OAR/ESRL PSL, Boulder, Colorado, USA, from their web site at https://psl.noaa.gov/data/gridded/data.20thC_ReanV3.html (last access: 21 January 2022) (for NOAA 20CRv3 MSLP and 850 hPa temperatures) and Hersbach et al. (2018) (for ERA5 during its period of record). The domain of latitude 35–70∘ N and longitude 45∘ W–30∘ E was chosen to provide a synoptic view, with Ireland centred to provide an overview of the surrounding regions. All maps correspond to 15:00 UTC, which is the approximate expected time of daily maxima in Ireland (corresponding to ca. 14:30 LST).
Boora is the hottest value of these remaining candidates at 32.5 ∘C, attained on 29 June 1976. Boora is situated in the centre of the island of Ireland, which means it is highly unlikely to suffer from marine influences, which may cap diurnal maxima closer to the coast. The summer of 1976 was famous across the British and Irish isles for its drought and hot summer following on from 18 dry months previously (Noone et al., 2017; O'Laoghog, 1979). Therefore, the partitioning of heat between sensible (temperature) and latent (evaporation) terms would have been climatologically skewed toward sensible heating. The value at Boora furthermore is situated within a string of very warm days, with many of the daily maximum observations exceeding 30 ∘C.
The hot and dry conditions were widely reported in newspapers at the time; The Irish Press reported on 24 June 1976 “The Irish have been greeted by a heatwave which saw the temperature hover around the 88 degree (31.1 ∘C) mark for a long time” (Redmond, 1976). On 28 June 1976, The Irish Press reported on the weather in Britain and Europe:
you cannot expect to share the 90 degree (32.2 ∘C) heatwave that has had Britain sweltering for days. But there is a chance you will soon be basking in a purely Irish hot spell, with temperatures reaching 85 degrees F (29.4 ∘C). Britain, because of its proximity to the Continent and its distance from the Atlantic, is enjoying the effects of an anti-cyclone which is almost stationary over Europe... According to the Dublin Met Office, this could mean an Irish heatwave within the next few days, with temperatures rising from the present 60–70 degrees F. (15.5–21.1 ∘C) to 86 degrees F (30 ∘C). (Cahill, 1976)
Table 3Comparison between Boora, Offaly, maximum temperature on 29 June 1976 and neighbouring stations within a 60 km radius. All data arise from Met Éireann.
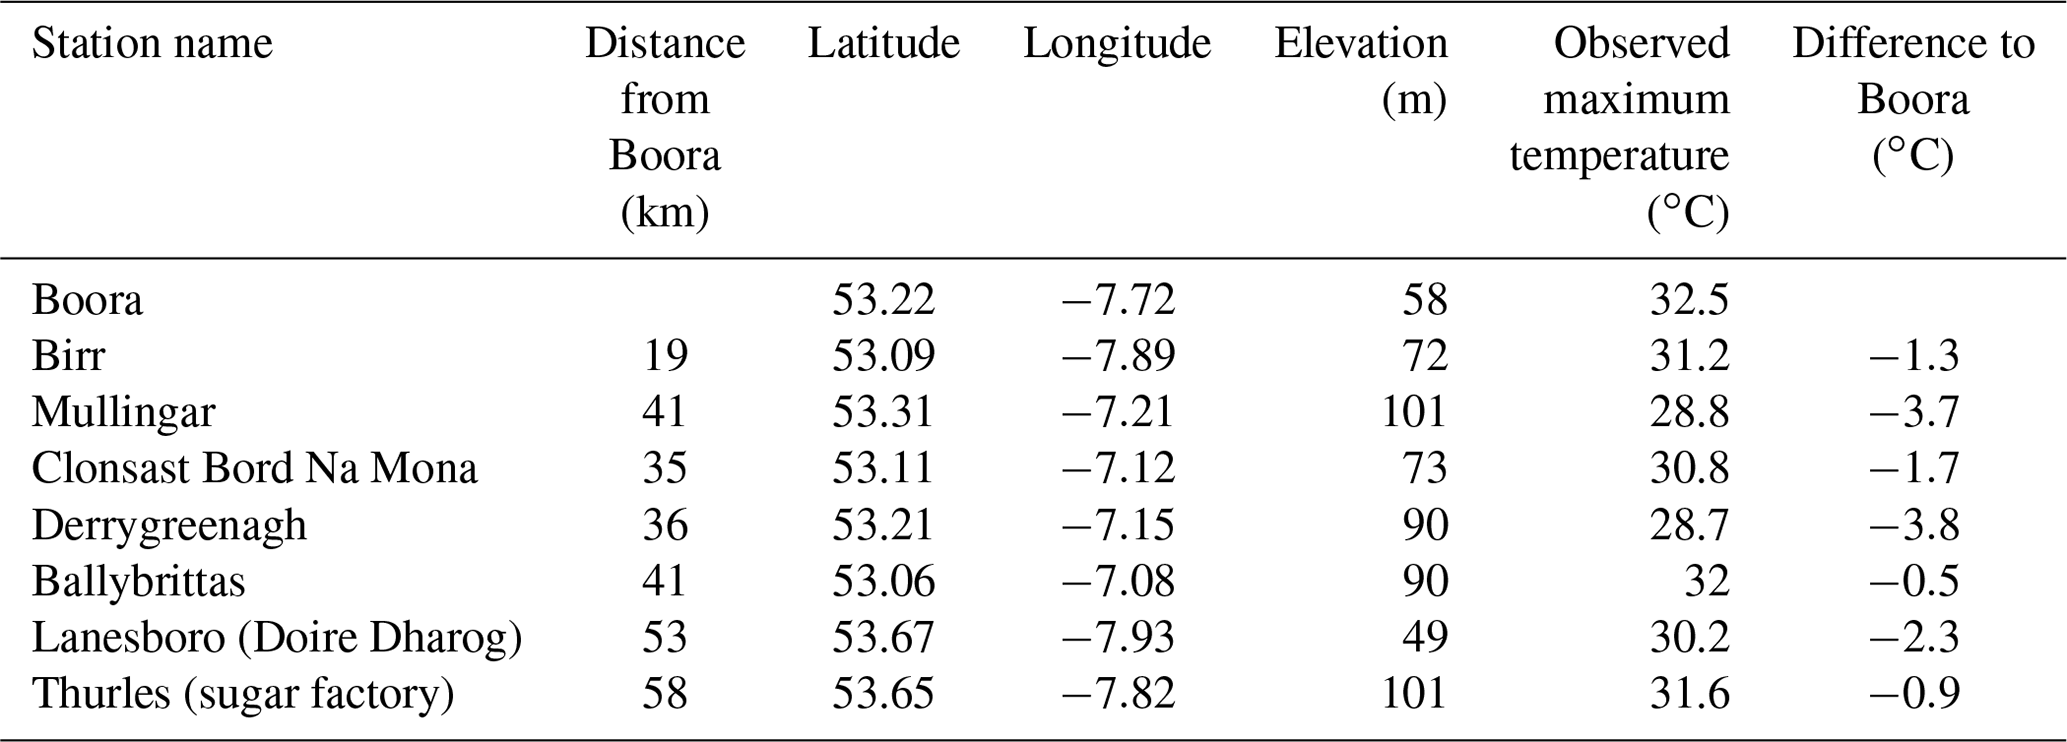
A comparison to neighbouring sites (Fig. 13) for this candidate event benefits from the standardisation of meteorological observations during the 20th century and the much denser network of Met Éireann sites since the mid-20th century. Comparisons can now be made to sites at tens of kilometres distance rather than some hundreds of kilometres. These elevated temperatures, experienced at Boora, were also experienced at the nearby stations which sit within tens of kilometres of the Boora site (Table 3).

Figure 13Map of stations closest to Boora considered in this analysis.
Repeating the methodology of the Kilkenny neighbour-based analysis but using Boora and nearby stations for a period of up to 20 years either side of the record, the observation in question sits well within the distributions of expected differences in daily maxima over summer (Fig. 14). In the modern-day differences between Boora and its seven neighbouring stations, most of the inter-site distribution lies between ±2 ∘C temperature difference, and almost all daily values lie within ±5 ∘C. For Boora and Derrygreenagh, most of the data lie between −1.5 and 2 ∘C, with Boora typically measuring slightly higher temperatures than Derrygreenagh. The difference on 29 June 1976 between the two sites at 3.8 ∘C lies within the upper 2 % of the expected differences but has still been exceeded on several occasions. The difference recorded between Boora and Mullingar was 3.7 ∘C, which falls within the upper 2 % of its distribution. The difference between Boora and Lanesboro at 2.3 ∘C sits well within the distribution of daily differences experienced between the sites. Differences between Boora and Clonsast are generally between −2 and 2.5 ∘C, and the heat record difference on 29 June 1976 was 1.7 ∘C, falling within the upper 10 %. Birr was 1.3 ∘C cooler than Boora, sitting well within the range of experienced daily differences. Similarly, the difference to Thurles at 0.9 ∘C almost matches the peak frequency of differences expected between the stations. Lastly, Boora and Ballybrittas have very strong similarities in the recorded temperature, with most of the differences between −2 and 2 ∘C. The 29 June 1976 difference between these stations was 0.5 ∘C, completely within the distribution of modern inter-site behaviour.
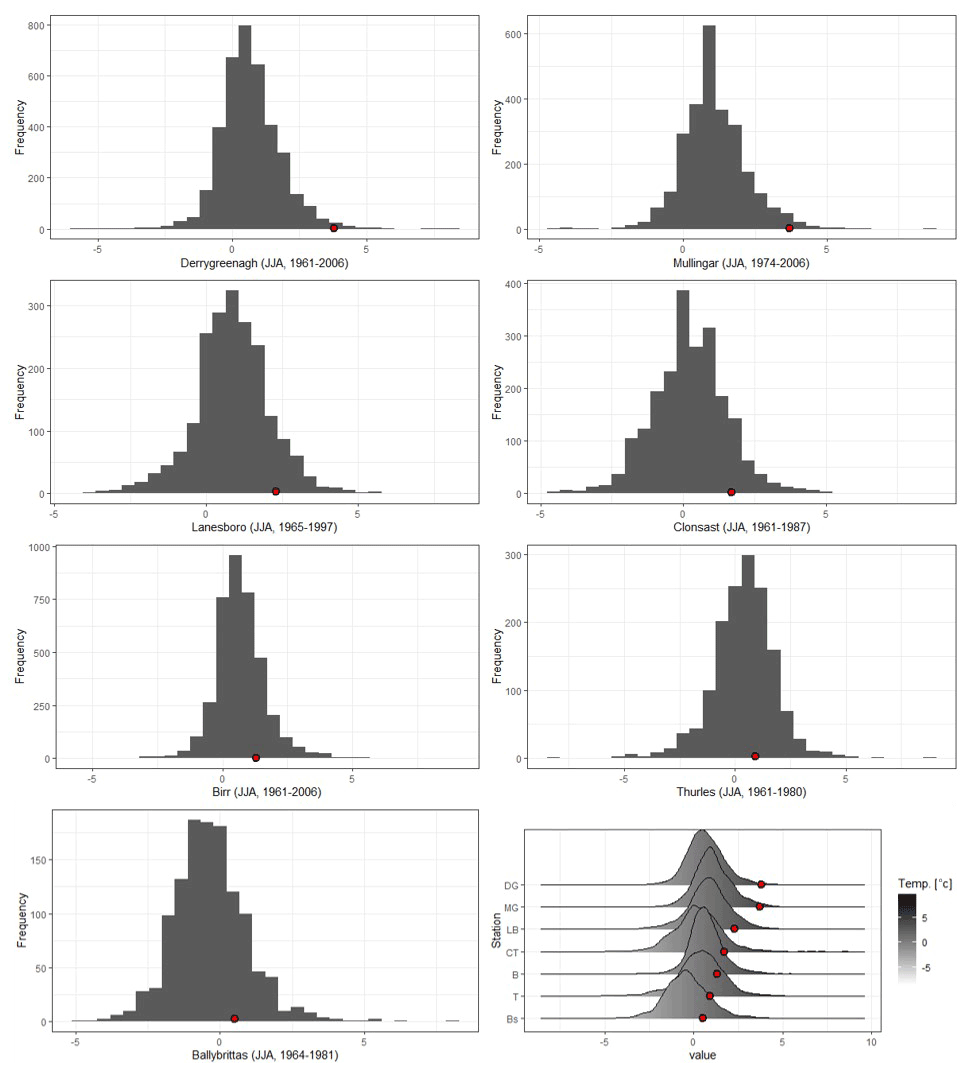
Figure 14Modern-day distribution for the JJA season differences between the maximum temperature of Boora, Offaly, and the seven stations where adequate data was available. Shown in red is the difference reported on 29 June 1976 between each station and Boora.
A combination of geographical location, the synoptic situation, antecedent conditions, neighbour comparisons, and use of standard modern-day meteorological observations leads us to conclude the Boora observation is likely to be a credible reading. We would thus conclude logically that this represents the highest reliably recorded temperature in the Republic of Ireland since observations began up until the time of the present analysis in 2021. If the observation were to be called into question, any of several candidates between 32 and 32.3 ∘C since 1900 based upon the synoptic situation on each date would be viable alternatives, but we do not consider these in greater depth herein.
Ireland is now highly anomalous in having its recognised national heat record set in the 19th century. The record is from a long-closed site in Kilkenny Castle, and the associated series is not available, presumed lost, as is the bulk of relevant metadata. The Kilkenny record of 33.3 ∘C in June 1887 exceeds that reached since the beginning of the 20th century by 0.8 ∘C. Results from our inter-station reassessment and reanalysis comparisons lead us to question if this truly represents the highest reliably measured national temperature for Ireland. Based upon the few contemporaneous station records available on the island of Ireland and at Sheffield and their modern differences to a site close to the original Kilkenny Castle site, our findings cast very considerable doubt upon the record. Differences on 26 June 1887 are implausibly large and not consistent with the synoptic situation as reanalysed by NOAA 20CRv3. A range of similar concerns including basic physical considerations preclude a number of other 19th century values in excess of 32 ∘C, including an observation of 33.5 ∘C at Phoenix Park in 1876.
A search of candidate records since 1887 yields that the highest likely defensible observation is 32.5 ∘C recorded at Boora on 29 June 1976. The synoptic situation is consistent with a significant heatwave, the series evolution is realistic, and comparison with nearby (within tens of kilometres) neighbouring stations does not suggest any substantial issues in the reported reading. We would thus recommend that the Boora observation be recognised as the national heat record for the Republic of Ireland. Ultimately, however, the official recognition of the national temperature record rests with Met Éireann as the national meteorological service.
It should be noted that following the completion of this present analysis on 18 July 2022 Met Éireann recorded a temperature of 33.0 ∘C at the Phoenix Park station in Dublin. This record is still waiting to be verified by Met Éireann, but if correct, would constitute the new national all-time heat record in place of Boora, County Offaly.
This analysis only considered the national all-time heat record. Met Éireann maintains all-time annual and monthly records, several of which date back to similarly early, pre-standardisation measurements (Met Éireann, 2020). Most notably the all-time cold record is −19.1 ∘C, recorded in Markree, Sligo, in January 1881, which is close to the Atlantic coast in NW Ireland. Reassessment of these records using a range of techniques such as those used here would likely be valuable.
It is probable that Ireland is far from alone in having national meteorological heat, cold, rainfall, and other records that may benefit from a reassessment using these new techniques pioneered by WMO record assessment teams. These national all-time meteorological records are important in media and the general public discourse around both weather and climate change. They are also important in the context of monitoring long-term changes in climate extremes and their attribution. It is therefore important that the verity of these records be assured. The techniques and approaches used herein are broadly transferable to any similar reconsideration of meteorological records in other jurisdictions.
A consolidated dataset of NOAA/CIRES/DOE Reanalysis (V3) and ERA5 mean sea level pressure and air temperature 850 hPa, combined with raw and processed CSV station datasets used in this paper, has been archived at the following URL https://github.com/CIARAN-KELLY-IRELAND/-Reassessing-long-standing-meteorological-records (last access: 14 October 2022; Ciaran-kelly-Ireland, 2022) and https://doi.org/10.5281/zenodo.7125213 (Kelly, 2022).
The datasets used to support the findings of this research were obtained from the following DOIs and/or URLs: NOAA/CIRES/DOE 20th Century Reanalysis (V3) (https://doi.org/10.7289/V5M32STR; Vose et al., 2014), ERA5 hourly data on single levels (https://doi.org/10.24381/cds.adbb2d47; Hersbach et al., 2018b), ERA5 hourly data on pressure levels (https://doi.org/10.24381/cds.bd0915c6; Hersbach et al., 2018a), Met Éireann long-term dataset for Ireland (1831–1968), and Geoscience Data Journal (https://doi.org/10.1002/gdj3.92; Mateus et al., 2020).
The Sheffield data were sourced from the UK Met Office (2022; https://www.metoffice.gov.uk/research/climate/maps-and-data/historic-station-data, last access: 24 November 2022).
SOK, CC, EC, and KM conducted a primary investigation and provided background information on the study. KD, CK, NS, and JKD conducted an inter-station series assessment to assess the plausibility of the reported record. CK created and analysed reanalysis weather maps for the top recorded hottest years 1887, 1995, 2006, and 2018 with assistance from DC, NM, JD, and TM. RS, EG, and JC explored the plausible national heat records if the Kilkenny 1887 record were to fail. SN and CM provided data and support along with contributions from Met Éireann. KD, CK, and PT prepared the paper with contributions from all the co-authors.
The contact author has declared that none of the authors has any competing interests.
Publisher’s note: Copernicus Publications remains neutral with regard to jurisdictional claims in published maps and institutional affiliations.
The authors would like to extend our gratitude to ICARUS and the Department of Geography at Maynooth University for their help on this assignment for the MSc in Climate Change. The authors would also like to thank the reviewers of this paper, Chris Folland and Guoyu Ren, for their time and expertise given in improving the paper.
The authors acknowledge that raw station datasets from Met Éireann are published under Creative Commons Attribution 4.0 International (CC BY 4.0). (https://creativecommons.org/licenses/by/4.0/, last access: 21 January 2022). Additionally, it is acknowledged that the processed CSV station data were conducted solely by the authors of this research.
Support for the Twentieth Century Reanalysis Project version 3 dataset is provided by the U.S. Department of Energy, Office of Science Biological and Environmental Research (BER), by the National Oceanic and Atmospheric Administration Climate Program Office, and by the NOAA Physical Sciences Laboratory.
The results contain modified Copernicus Climate Change Service information 2020. Neither the European Commission nor ECMWF is responsible for any use that may be made of the Copernicus information or data it contains.
This paper was edited by Hans Linderholm and reviewed by Chris Folland and Guoyu Ren.
Allan, R., Brohan, P., Compo, G. P., Stone, R., Luterbacher, J., and Brönnimann, S.: The international atmospheric circulation reconstructions over the earth (ACRE) initiative, B. Am. Meteorol. Soc., 92, 1421–1425, https://doi.org/10.1175/2011BAMS3218.1, 2011.
Barrington, R. M.: The drought of 1887, and some of its effects on Irish agriculture, Journal of the Statistical and Social Inquiry Society of Ireland, 9, p. 223, ISSN: 00814776, https://search.proquest.com/docview/911736931?pq-origsite=gscholar&fromopenview=true (last access: 12 September 2021), 1888.
Böhm, R., Jones, P. D., Hiebl, J., Frank, D., Brunetti, M., and Maugeri, M.: The early instrumental warm-bias: a solution for long central European temperature series 1760–2007, Climatic Change, 101, 41–67, https://doi.org/10.1007/s10584-009-9649-4, 2010.
Brönnimann, S., Allan, R., Ashcroft, L., Baer, S., Barriendos, M., Brázdil, R., Brugnara, Y., Brunet, M., Brunetti, M., Chimani, B., and Cornes, R.: Unlocking pre-1850 instrumental meteorological records: A global inventory, B. Am. Meteorol. Soc., 100, ES389–ES413, https://doi.org/10.1175/BAMS-D-19-0040.1, 2019.
Brunet, M. and Jones, P.: Data rescue initiatives: bringing historical climate data into the 21st century, Clim. Res., 47, 29–40, https://doi.org/10.3354/cr00960, 2011.
Brunet, M., Asin, J., Sigró, J., Bañón, M., García, F., Aguilar, E., Palenzuela, J. E., Peterson, T. C., and Jones, P.: The minimization of the screen bias from ancient Western Mediterranean air temperature records: an exploratory statistical analysis, Int. J. Climatol., 31, 1879–1895, https://doi.org/10.1002/joc.2192, 2011.
Cahill, A.: How the Irish keep their cool, Irish Press, https://archive-irishnewsarchive-com.jproxy.nuim.ie/Olive/APA/INA.Edu/SharedView.Article.aspx?href=IPR/1976/06/28&id=Ar00101&sk=74_D555A7 (last access: 22 March 2021), 28 June 1976.
Cameron, H. J. : Meteorological obersvations take during the year 1829 to 1852 at the Ordnanace Survey Office, Phoenix Park Dublin: to which is added a series of similar observations made at the principal trigonometrical stations, and at other places, in Ireland, Alexander Thom and Sons Dublin, Ireland, 1856.
Camuffo, D.: Errors in Early Temperature Series Arising from Changes in Style of Measuring Time, Sampling Schedule and Number of Observations, Climatic Change, 53, 331–352, https://doi.org/10.1023/A:1014962623762, 2002.
Cerveny, R. S., Bessemoulin, P., Burt, C. C., Cooper, M. A., Cunjie, Z., Dewan, A., Finch, J., Holle, R. L., Kalkstein, L., Kruger, A., and Lee, T. C.: WMO assessment of weather and climate mortality extremes: lightning, tropical cyclones, tornadoes, and hail, Weather Clim. Soc., 9, 487–497, https://doi.org/10.1175/WCAS-D-16-0120.1, 2017.
Ciaran-kelly-Ireland: Re-evaluating extreme heat temperature records using Ireland as a proxy, GitHub [dataset], https://github.com/CIARAN-KELLY-IRELAND/-Reassessing-long-standing-meteorological-records, last access: 14 October 2022.
City Population: KILKENNY (Ireland), City Population, available at: https://www.citypopulation.de/en/ireland/towns/KK_kilkenny/, last access: 8 December 2021.
Courtney, J., Buchan, S., Cerveny, R., Bessemoulin, P., Peterson, T. C., Rubiera Torres, J. M., Beven, J., King, J., Trewin, B., and Rancourt, K.: Documentation and verification of the world extreme wind gust record: 113.3 m s−1 on Barrow Island Australia, during passage of tropical cyclone Olivia, Aust. Meteorol. Ocean., 62, 1–9, https://doi.org/10.22499/2.6201.001, 2012.
Dixon, F. E.: Weather in old Dublin, Dublin Historical Record, Old Dublin Society, 13, 94–107, 1953.
El Fadli, K., Cerveny, R., Burt, C., Eden, P., Parker, D., Brunet, M., Peterson, T., Mordacchini, G., Pelino, V., Bessemoulin, P., Stella, J., Driouech, F., Wahab, M., and Pace, M.: World Meteorological Organization Assessment of the Purported World Record 58 ∘C Temperature Extreme at El Azizia, Libya (13 September 1922), B. Am. Meteorol. Soc., 94, 199–204, https://doi.org/10.1175/BAMS-D-12-00093.1, 2013.
Freemans Journal: Smithfield Market – London, Friday, Freemans Journal, https://archive-irishnewsarchive-com.jproxy.nuim.ie/Olive/APA/INA.Edu/SharedView.Article.aspx?href=FMJ/1851/06/30&id=Ar00312&sk=736004A9 (last access: 29 April 2021), 30 June 1851.
Hersbach, H., Bell, B., Berrisford, P., Biavati, G., Horányi, A., Muñoz Sabater, J., Nicolas, J., Peubey, C., Radu, R., Rozum, I., Schepers, D., Simmons, A., Soci, C., Dee, D., and Thépaut, J.-N.: ERA5 hourly data on pressure levels from 1979 to present, Copernicus Climate Change Service (C3S) Climate Data Store (CDS) [data set], https://doi.org/10.24381/cds.bd0915c6, 2018a.
Hersbach, H., Bell, B., Berrisford, P., Biavati, G., Horányi, A., Muñoz Sabater, J., Nicolas, J., Peubey, C., Radu, R., Rozum, I., Schepers, D., Simmons, A., Soci, C., Dee, D., and Thépaut, J.-N.: ERA5 hourly data on single levels from 1959 to present, Copernicus Climate Change Service (C3S) Climate Data Store (CDS) [data set], https://doi.org/10.24381/cds.adbb2d47, 2018b.
Irish Meteorological Service: The climate of Dublin, Irish Meteorological Service, Dublin, 1983.
Kelly, C.: CIARAN-KELLY-IRELAND/-Reassessing-long-standing-meteorological-records: Reassessing-long-standing-meteorological-records, Version v2.0.0, Zenodo [data set], https://doi.org/10.5281/zenodo.7125213, 2022.
Lang, T. J., Pédeboy, S., Rison, W., Cerveny, R. S., Montanyà, J., Chauzy, S., MacGorman, D. R., Holle, R. L., Ávila, E. E., Zhang, Y., Carbin, G., Mansell, E. R., Kuleshov, Y., Peterson, T. C., Brunet, M., Driouech, F., and Krahenbuhl, D. S.: WMO world record lightning extremes: Longest reported flash distance and longest reported flash duration, B. Am. Meteorol. Soc., 98, 1153–1168, https://doi.org/10.1175/BAMS-D-16-0061.1, 2017.
Láska, K., King, J., Bromwich, D., Jones, P., Solomon, S., Renwick, J., Lazzara, M., de los Milagros Skansi, M., Brunet, M., Peterson, T., and Burt, C.: Antarctic extreme temperature record evaluation, WMO MeteoWorld, 2018/2, ISSN 1818-7137, https://public.wmo.int/en/resources/meteoworld (last access: 19 October 2021), June 2018.
Leinster Express: London Markets. Corn Exchange – Monday, Leinster Express, https://archive-irishnewsarchive-com.jproxy.nuim.ie/Olive/APA/INA.Edu/SharedView.Article.aspx?href=LEE/1851/06/28&id=Ar00301&sk=C5_F36D51 (last access: 29 April 2021), 28 June 1851.
Mateus, C., Potito, A., and Curley, M.: Reconstruction of a long-term historical daily maximum and minimum air temperature network dataset for Ireland (1831–1968), Geosci. Data J., 7, 102–115, https://doi.org/10.1002/gdj3.92, 2020.
McDill, Z.: A City in Co. Kilkenny in Ireland, ArcGIS StoryMaps, https://storymaps.arcgis.com/stories/cb7c886c4e1a412db98f8d71906fe984, last access: 8 December 2021.
Merlone, A., Al-Dashti, H., Faisal, N., Cerveny, R. S., AlSarmi, S., Bessemoulin, P., Brunet, M., Driouech, F., Khalatyan, Y., Peterson, T. C., and Rahimzadeh, F.: Temperature extreme records: World Meteorological Organization metrological and meteorological evaluation of the 54.0 ∘C observations in Mitribah, Kuwait and Turbat, Pakistan in 2016/2017, Int. J. Climatol., 39, 5154–5169, https://doi.org/10.1002/joc.6132, 2019.
Met Éireann: Weather Extreme Records for Ireland, Met Éireann, https://www.met.ie/climate/weather-extreme-records (last access: 13 August 2021), 2020.
Meteorological Council: Report of the Meteorological Council to the Royal Society For the Year ending 31st of March 1890, Q. J. Roy. Meteor. Soc., p. 73, https://play.google.com/books/reader?id=YnEMAAAAYAAJ&pg=GBS.PA72&hl=en_GB (last access: 30 July 2021), 1890.
Murphy, C., Wilby, R. L., Matthews, T. K. R., Thorne, P., Broderick, C., Fealy, R., Hall, J., Harrigan, S., Jones, P., McCarthy, G., MacDonald, N., Noone, S., and Ryan, C.: Multi-century trends to wetter winters and drier summers in the England and Wales precipitation series explained by observational and sampling bias in early records, Int. J. Climatol., 40, 610–619, https://doi.org/10.1002/joc.6208, 2020.
NOAA PSL (NOAA Physical Science Laboratory): The Twentieth Century Reanalysis Project, NOAA PSL, https://www.psl.noaa.gov/data/20thC_Rean/, last access: 5 September 2020.
Noone, S., Broderick, C., Duffy, C., Matthews, T., Wilby, R. L., and Murphy, C.: A 250-year drought catalogue for the Island of Ireland (1765–2015), Int. J. Climatol., 37, 239–254, https://doi.org/10.1002/joc.4999, 2017.
O'Laoghog, S. S.: The Dry Period October 1974 to August 1976 [report], Met Éireann, Internal Memorandum, 88/79, 1979, 1979–01, 1979.
Parker, D. E. : Effects of changing exposure of thermometers at land stations, Int. J. Climatol., 14, 1–31, https://doi.org/10.1002/joc.3370140102, 1994.
Peterson, M. J., Lang, T. J., Bruning, E. C., Albrecht, R., Blakeslee, R. J., Lyons, W. A., Pédeboy, S., Rison, W., Zhang, Y., Brunet, M., and Cerveny, R. S.: New WMO certified megaflash lightning extremes for flash distance (709 km) and duration (16.73 seconds) recorded from space, Geophys. Res. Let., 47, e2020GL088888, https://doi.org/10.1029/2020GL088888, 2020.
Purevjav, G., Balling Jr., R. C., Cerveny, R. S., Allan, R., Compo, G. P., Jones, P., Peterson, T. C., Brunet, M., Driouech, F., Stella, J. L., and Svoma, B. M.: The Tosontsengel Mongolia world record sea-level pressure extreme: spatial analysis of elevation bias in adjustment-to-sea-level pressures, Int. J. Climatol., 35, 2968–2977, https://doi.org/10.1002/joc.4186, 2015.
Quetelard, H., Bessemoulin, P., Cerveny R. S., Peterson, T. C., Burton, A., and Boodhoo, Y.: World record rainfalls (72-hour and four-day accumulations) at Cratère Commerson, Réunion Island, during the passage of Tropical Cyclone Gamede, B. Am. Meteorol. Soc., 90, 603–608, 2009.
Redmond, J.: Sun Sets a Poser, Irish Press, https://archive-irishnewsarchive-com.jproxy.nuim.ie/Olive/APA/INA.Edu/SharedView.Article.aspx?href=IPR/1976/06/24&id=Ar01400&sk=E0_C59558 (last access: 22 March 2021), 24 June 1976.
RMS: Report of the council for the year 1889, Q. J. Roy. Meteor. Soc., 16, 86–119, https://doi.org/10.1002/qj.4970167403, 1890.
Rohan, P. K.: The Climate of Ireland, 2nd edn., Meteorological Service, Dublin, 1986.
Schildkamp, V.: So it was 42.9 degrees, where did the mysterious heat in Deelen come from?, Algemeen Dagblad, https://www.ad.nl/binnenland/het-was-dus-wel- 42-9-graden-waar-kwam-die-mysterieuze-hitte-in-deelen-vandaan-br~a07dfb22/?referrer=https://en.wikipedia.org/ (last access: 20 October 2020), 3 December 2019.
Slivinski, L. C., Compo, G. P., Whitaker, J. S., et al.: Towards a more reliable historical reanalysis: Improvements for version 3 of the Twentieth Century Reanalysis system, Q. J. Roy. Meteor. Soc., 145, 2876–2908, https://doi.org/10.1002/qj.3598, 2019.
Smith, B.: Hottest temperature on earth revised, The Sunday Morning Herald, https://www.smh.com.au/environment/hottest-temperature-on-earth-revised-20120914-25wji.html (last access: 16 October 2020), 14 September 2012.
South African Weather Station (SAWS): Vioolsdrif temperature on 28 November 2019, https://www.weathersa.co.za/Documents/Corporate/Medrel2Dec2019b%20Vioolsdrif%20temperature.pdf (last access: 20 October 2020), 2019.
Stevenson, T. C. E.: New Description of Box for Holding Thermometers, Journal of the Scottish Meteorological Society, 1, 122 pp., 1864.
Stubbs, M. W.: EXCEPTIONAL EUROPEAN WEATHER IN 1976, Weather, 32, 457–463, https://doi.org/10.1002/j.1477-8696.1977.tb04504.x, 1977.
Trewin, B.: Exposure, instrumentation, and observing practice effects on land temperature measurements, WIREs Clim. Change, 1, 490–506, https://doi.org/10.1002/wcc.46, 2010.
UCAR: 3. Conventional Meteorological Station Data, An Introduction to Atmospherice and Oceanic Datasets, NCAR Technical Note, NCAR/TN-404+IA, NCAR, Boulder, CO, https://www.cgd.ucar.edu/cas/tn404/text/tn404_6.html, last access: 1 July 2021.
UK Met Office: Historic station data, UK Met Office [data set], https://www.metoffice.gov.uk/research/climate/maps-and-data/historic-station-data, last access: 24 November 2022.
Vose, R. S., Applequist, S., Squires, M., Durre, I., Menne, M. J., Williams Jr., C. N., Fenimore, C., Gleason, K., and Arndt, D.: NOAA Monthly U.S. Climate Divisional Database (NClimDiv), 20th Century Reanalysis (V3), NOAA National Climatic Data Center [data set], https://doi.org/10.7289/V5M32STR, 2014.
Weidner, G., King, J., Box, J. E., Colwell, S., Jones, P., Lazzara, M., Cappelen, J., Brunet, M., and Cerveny, R. S.: WMO evaluation of northern hemispheric coldest temperature: −69.6 ∘C at Klinck, Greenland, 22 December 1991, Q. J. Roy. Meteor. Soc., 147, 21—29, https://doi.org/10.1002/qj.3901, 2021.
WMO: Guide to Instruments and Methods of Observation, Volume I – Measurement of meteorological variables, WMO-No. 8, https://library.wmo.int/doc_num.php?explnum_id=10616 (last access: 1 January 2021), 2018.
WMO: World Weather & Climate Extremes Archive, WMO, https://wmo.asu.edu/#global, last access: 9 April 2021.
- Abstract
- Introduction and context
- Assessments and certifications of climatic extremes
- A critical reassessment of the Kilkenny Castle national heat record
- Consideration of alternative candidate record events
- Conclusions
- Code and data availability
- Author contributions
- Competing interests
- Disclaimer
- Acknowledgements
- Review statement
- References