the Creative Commons Attribution 4.0 License.
the Creative Commons Attribution 4.0 License.
 | 01 Apr 2022
Northern Hemisphere atmospheric history of carbon monoxide since preindustrial times reconstructed from multiple Greenland ice cores
Xavier Faïn
Rachael H. Rhodes
Philip Place
Vasilii V. Petrenko
Kévin Fourteau
Nathan Chellman
Edward Crosier
Joseph R. McConnell
Edward J. Brook
Thomas Blunier
Michel Legrand
Jérôme Chappellaz
Carbon monoxide (CO) is a regulated pollutant and one of the key components determining the oxidizing capacity of the atmosphere. Obtaining a reliable record of atmospheric CO mixing ratios ([CO]) since preindustrial times is necessary to evaluate climate–chemistry models under conditions different from today and to constrain past CO sources. We present high-resolution measurements of CO mixing ratios from ice cores drilled at five different sites on the Greenland ice sheet that experience a range of snow accumulation rates, mean surface temperatures, and different chemical compositions. An optical-feedback cavity-enhanced absorption spectrometer (OF-CEAS) was coupled with continuous melter systems and operated during four analytical campaigns conducted between 2013 and 2019. Overall, continuous flow analysis (CFA) of CO was carried out on over 700 m of ice. The CFA-based CO measurements exhibit excellent external precision (ranging from 3.3 to 6.6 ppbv, 1σ) and achieve consistently low blanks (ranging from 4.1±1.2 to 12.6±4.4 ppbv), enabling paleoatmospheric interpretations. However, the five CO records all exhibit variability that is too large and rapid to reflect past atmospheric mixing ratio changes. Complementary tests conducted on discrete ice samples demonstrate that these variations are not artifacts of the analytical method (i.e., production of CO from organics in the ice during melting) but are very likely related to in situ CO production within the ice before analysis. Evaluation of the signal resolution and co-investigation of high-resolution records of CO and total organic carbon (TOC) suggest that past atmospheric CO variations can be extracted from the records' baselines with accumulation rates higher than 20 cm (water equivalent per year). Consistent baseline CO records from four Greenland sites are combined to produce a multisite average ice core reconstruction of past atmospheric CO for the Northern Hemisphere high latitudes, covering the period from 1700 to 1957 CE. Such a reconstruction should be taken as an upper bound of past atmospheric CO abundance. From 1700 to 1875 CE, the record reveals stable or slightly increasing values in the 100–115 ppbv range. From 1875 to 1957 CE, the record indicates a monotonic increase from 114±4 to 147±6 ppbv. The ice core multisite CO record exhibits an excellent overlap with the atmospheric CO record from Greenland firn air which spans the 1950–2010 CE time period. The combined ice core and firn air CO history, spanning 1700–2010 CE, provides useful constraints for future model studies of atmospheric changes since the preindustrial period.
- Article
(2454 KB) - Full-text XML
-
Supplement
(3625 KB) - BibTeX
- EndNote


Carbon monoxide (CO) is a reactive trace gas that plays a crucial role in the interactions between climate and atmospheric chemistry. CO strongly affects the global oxidative capacity of the atmosphere by acting on the budgets of both the hydroxyl radical (OH) and ozone (O3). CO is the principal sink for tropospheric OH, with up to 40 % of OH radicals reacting with CO in the modern troposphere (Lelieveld et al., 2016). Thus, CO indirectly impacts the lifetime of numerous atmospheric constituents such as methane (CH4), non-methane hydrocarbons (NMHCs), and hydrofluorocarbons (HCFCs). Oxidation of CO by OH ultimately leads to CO2 production and, in the presence of high levels of nitrogen oxides (NOx), can also result in significant production of tropospheric ozone (Crutzen, 1973). As CO impacts the atmospheric budgets of greenhouse gases such as CO2, CH4, and tropospheric ozone, its present-day emissions lead to an indirect radiative forcing of about 0.23±0.05 W m−2 (Myhre et al., 2013). Furthermore, CO has another indirect climatic impact through the formation of submicron secondary organic aerosol produced by the oxidation of volatile organic compounds (VOCs).
CO is emitted by various surface processes and produced by the atmospheric oxidation of different gaseous precursors. Atmospheric oxidation of CH4 and VOCs represents about half of the sources (Duncan et al., 2007). The surface sources include incomplete combustion of anthropogenic fossil fuels and biofuels (Hoesly et al., 2018), biomass burning (van der Werf et al., 2017), and minor contributions from plant leaves (Tarr et al., 1995; Bruhn et al., 2013) and the ocean (Conte et al., 2019). Oxidation by OH is the dominant sink of CO, which results in a mean global CO tropospheric lifetime of about 2 months (Khalil et al., 1999). However, the CO lifetime strongly varies with latitude and season, ranging from 20 to 40 d in the tropics and up to 3 months in polar areas (Duncan et al., 2007).
The understanding of the past CO trends is crucial for monitoring how anthropogenic activities have impacted CO emissions, atmospheric chemistry, and atmospheric composition. Over the last decades, analyses of past CO trends have been made possible by a growing number of direct and indirect observations. Monitoring of atmospheric CO, initiated by NOAA (National Oceanic and Atmospheric Administration) in 1988, has revealed a global decrease in tropospheric CO of ∼0.5 ppbv yr−1 between 1988 and 1996 (Novelli et al., 1998). The spaceborne MOPITT (Measurements of Pollution in The Troposphere) instrument has monitored the atmospheric CO burden since 2000 (Deeter et al., 2017) and has revealed a declining trend. This trend is more pronounced in the Northern Hemisphere (Zheng et al., 2019) which concentrates more sources related to the global economic activity, such as fossil fuel use and CO emission from combustion processes.
Ground-based and satellite-derived CO data are only available, however, for the last 3 decades. Thus, ancient air preserved in glacial ice and firn is a unique archive for reconstructing the past atmospheric CO record prior to the 1990s. The firn is the upper layer of an ice sheet where snow is slowly transformed into ice. A large amount of air can be sampled from the interconnected open pores. Mean ages of atmospheric gas increase with firn depth. CO has only been measured in firn air at a few Northern Hemisphere sites, including Summit, the North Greenland Ice Core Project (NGRIP), and the North Greenland Eemian Ice Drilling (NEEM) site (Petrenko et al., 2013). Measurements performed on the Devon Island (Canadian Arctic) firn air showed CO artifacts precluding atmospheric reconstruction (Clark et al., 2007). The three central Greenland firn records allowed for a 60-year reconstruction of atmospheric CO and revealed that atmospheric CO mixing ratios ([CO]) in the Arctic following industrialization increased from 145 ppbv in 1950 CE (Common Era) until around the late 1970s with a peak of 155 ppbv, and decreased to 140 ppbv in the late 1990s. This decreasing trend in the atmospheric CO mixing ratio reconstructed from firn archive is in agreement with direct (ground- and satellite-based) observations for the last decades. Isotopic measurements of the NEEM firn air suggested that this pattern was driven mainly by a change in CO emissions derived from fossil fuel combustion (Wang et al., 2012).
Analysis of air trapped in bubbles in solid ice below the firn layer is required to extend such reconstruction further back in time, beyond 1950 CE. The pioneering measurements conducted on the Eurocore ice archive (Haan et al., 1996; Haan and Raynaud, 1998) found that the Northern Hemisphere (NH) CO concentration increased gradually from ∼90 ppbv in 1850 CE to 110 ppbv in ∼1950 CE and that CO levels were stable at ∼90 ppbv from 1625 to 1850 CE. Air older than 1600 CE (below 167 m depth) exhibited higher variability and elevated CO levels (100–180 ppbv) with parallel anomalies in the CO2 record. This section of the Greenland Eurocore record is thought to reflect in situ CO production rather than an atmospheric signal. Haan et al. (1996) and Haan and Raynaud (1998) determined CO concentrations along the Eurocore archive using gas chromatography, including a mercuric oxide detector, combined with wet extractions of the trapped gases from discrete pieces of ice. This protocol was affected by a relatively large blank (typically 10 ppbv), was time consuming, and resulted in limited-resolution reconstructions.
Over the last decade, continuous flow analysis (CFA) of ice core CH4 concentrations utilizing laser spectroscopy (Stowasser et al., 2012) has become a widely used tool in paleoclimatology (e.g., Rhodes et al., 2015). The measurement of the NEEM-2011-S1 core (Faïn et al., 2014) was the first application of CFA to CO, as an attempt to reconstruct an atmospheric history for NH CO over the past 1800 years. The ultra-high resolution of CFA analysis means that it is a powerful tool to distinguish between depth sections impacted by in situ CO production and sections preserving the atmospheric record. Faïn et al. (2014) report stable measurements of CO mixing ratios with an external precision of 7.8 ppbv (1σ), but a poorly constrained procedural blank and poor accuracy because absolute calibration was not yet possible. The NEEM-2011-S1 CO mixing ratios reported are highly variable throughout the ice core with high-frequency (at the annual scale), high-amplitude spikes characterizing the record. These CO signals likely result from in situ production occurring within the ice itself, with patterns too abrupt and rapid to reflect atmospheric variability. In situ production coupled with the procedural blank and accuracy problems largely prevented interpretation of the record in terms of atmospheric CO variations.
In this study, we expand on this exploratory investigation by reporting continuous CO data measured on a set of five additional Greenland ice cores. By combining the analysis of these new ice core records and by separating the high-frequency CO signals driven by in situ production from baseline concentrations, we reveal (i) an upper-bound estimate of past atmospheric CO abundance and (ii) atmospheric [CO] trends in the Arctic and for the last three centuries. Climate–chemistry models and/or Earth system models can produce simulated atmospheric [CO] at ground level in central Greenland, from the preindustrial era to the present day. Such models are presently intercompared within the Aerosol Chemistry Model Intercomparison Project (AerChemMIP; Collins et al., 2017). The comparison of the past evolution of the Arctic atmospheric CO mixing ratio extracted from Greenland ice archives within the framework of this study with AerChemMIP model outputs is outside the scope of this paper. Such a comparison, which should also allow one to better constrain CO emission inventories of emissions factors, will be addressed in a future study.
2.1 Sample description
Five ice cores extracted from Greenland (Table 1) were investigated in this study (Fig. S1 in the Supplement). High-resolution CO mixing ratio data were measured continuously along with those of methane. The methane data for the NEEM-SC, D4, North Greenland Ice Core Project (NGRIP), and Tunu13 sites have been reported previously (Rhodes et al., 2016). The NEEM-SC section was chosen to extend the existing NEEM-2011-S1 record (Faïn et al., 2014; Rhodes et al., 2013) further back in time, and a composite NEEM signal, including the NEEM-2011-S1 and new NEEM-SC sections, is presented here. The calibration of the NEEM-2011-S1 CO data was revisited before building this composite (see Sect. S2.1 in the Supplement). The NEEM-SC and NEEM-2011-S1 archives are different ice cores but were drilled at the same location.
Table 1Locations, site characteristics, and other relevant information for ice cores featured in this study.
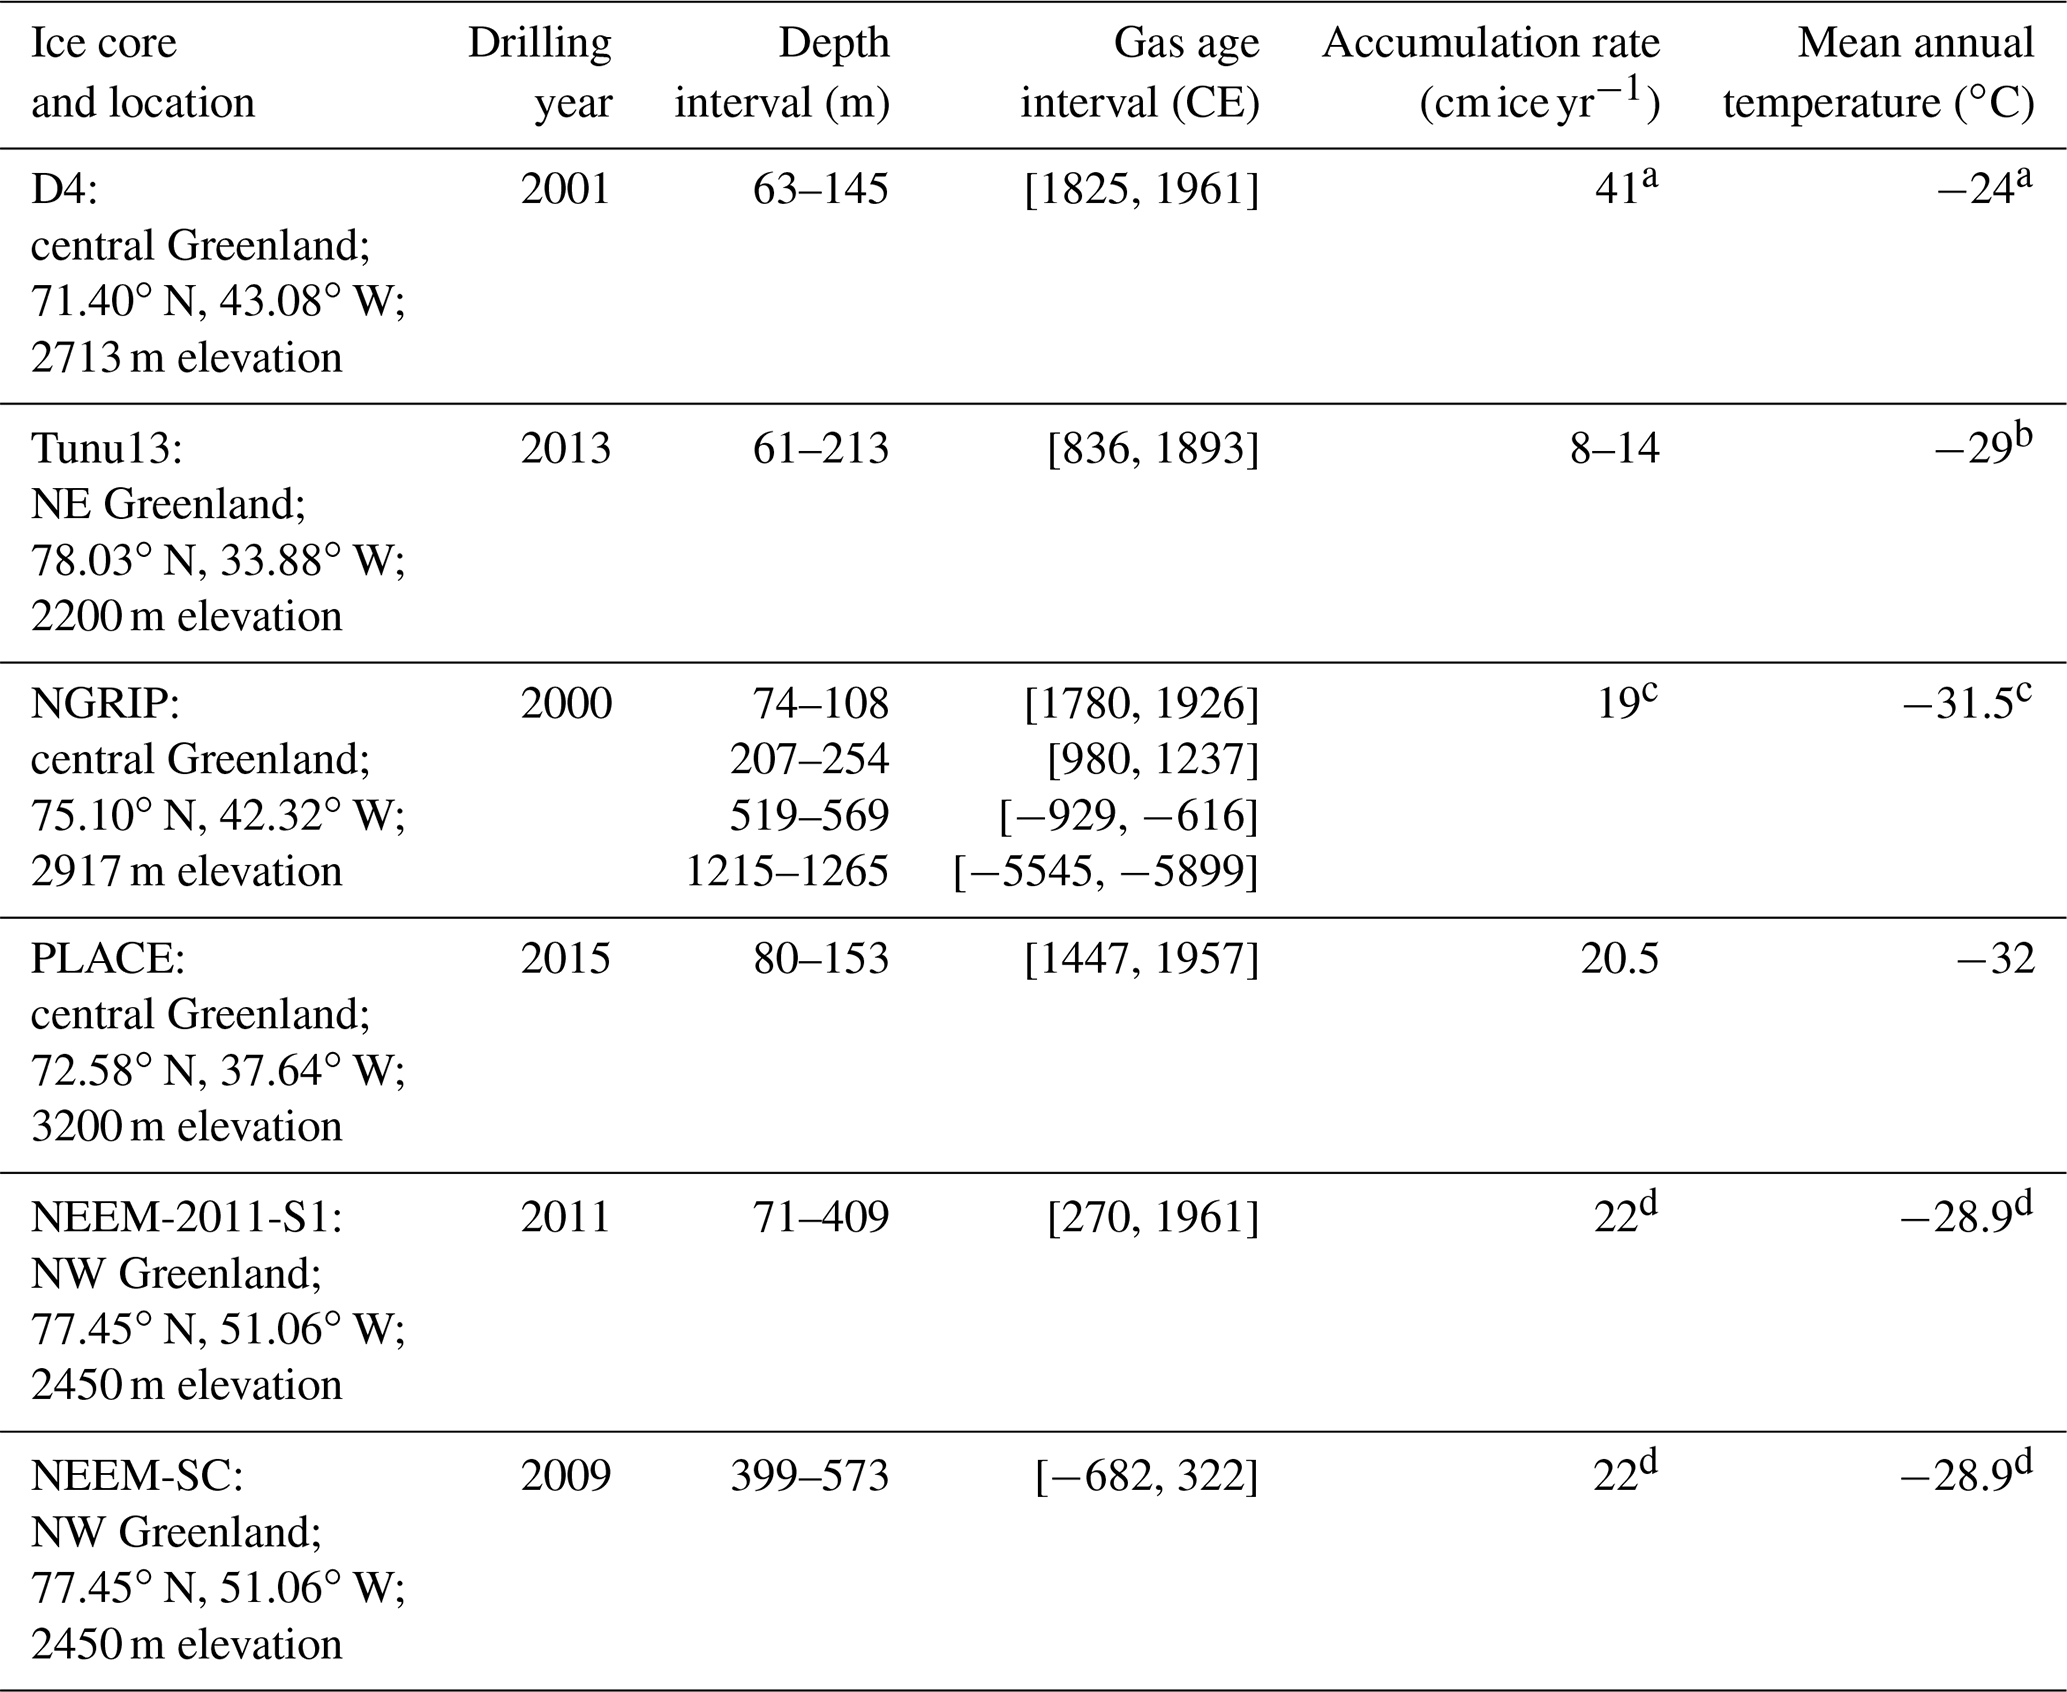
a Rhodes et al. (2016). b Butler et al. (1999). c NGRIP community members (2004). d NEEM community members (2012).
The fifth ice core in this study is a new core, retrieved from central Greenland during June 2015: the PLACE ice core. The PLACE core was drilled 1 km away from the location of Eurocore site (72.58∘ N, 37.64∘ W; drilled in 1989; Schwander and Rufli, 1994), which has been suggested to contain an intact atmospheric CO signal for air ages younger than 1650 CE (Haan et al., 1996; Haan and Raynaud, 1998). Care was taken when selecting the PLACE site to avoid drilling in areas that were disturbed during the Eurocore and later GRIP ice core drilling operations. The core sections were drilled with the Blue Ice Drill (BID) (Kuhl et al., 2014), immediately placed in the shade in a clean snow area after drilling, and then packed into ice core boxes. Following this, these boxes were stored in a snow cave (at −20 ∘C or colder). At the end of the season, the cores were removed from the snow cave at the field site and returned to Summit Station for transport to the National Ice Core Laboratory (NICL), Denver, CO, USA. Core temperature was verified to not have exceeded −15 ∘C during transport by including temperature loggers in some of the ice core boxes.
The five sites investigated experience accumulation rates ranging from 8 to 41 (water equivalent per year), mean annual surface temperatures between −24 and −32 ∘C, and different chemical compositions (Table 1, Sect. 3.3). A description of the ice and gas chronologies for the five ice cores is reported in Table S1 in the Supplement.
2.2 CO continuous flow analyses
Since the first continuous, high-resolution, CO measurements were performed along the NEEM-S1 ice core in 2011 (Faïn et al., 2014), CFA-based CO analyses have greatly improved, including lowering the CO blank and characterizing how CO is preferentially dissolved during the CFA process so as to establish an absolute calibration. The excellent precision of CO analyses has been confirmed, and the designs of CFA setups themselves have been optimized to limit instrumental smoothing and improve signal resolution. This section reviews the operation and recent improvements of CFA-based CO measurements. More details can also be found in the Supplement (Sect. S1).
2.2.1 System operation
The ice cores listed in Table 1 were analyzed using continuous ice core melter systems coupled with online gas measurements. The general principles of this analytical approach are provided by Stowasser et al. (2012). Briefly, ice core sticks are cut at a 34 mm×34 mm cross section and processed on a melter head located in a cold room. The melter head is composed of inner and outer collection areas with the inner area dedicated to sample collection. To prevent contamination, an overflow from the inner to the outer melter head areas of >10 % is created by lowering the sample pumping speed. The water and gas bubble mixture is continuously pumped via a debubbler into a temperature-controlled gas extraction unit maintained at 30 ∘C. The gas / water volume ratio of the sample is about 10 % before the debubbler and 50 % after the debubbler. Thus, a fully degassed fraction of the melted sample is also available at the debubbler for complementary chemical analyses in the liquid phase. The gas is recovered from the sample line after the debubbler by applying a pressure gradient across a gas-permeable membrane, either Transfer Line (IDEX, USA) or MicroModule 0.5×1 (Membrana GmbH, Germany) degassers. The gas is then dried by a custom-made Nafion (Perma Pure LLC, USA) dryer. Finally, the CO (and/or CH4) mixing ratios are continuously monitored along the gas sample flow by a laser spectrometer.
Our samples were all analyzed at the Desert Research Institute (DRI), Reno (NV, USA) during two analytical campaigns (Tunu13, D4, NEEM-SC, and NGRIP in 2013; PLACE in 2015). The NEEM-2011-S1 core was analyzed at DRI in 2011, as described by Faïn et al. (2014). The PLACE core was also analyzed at the Institute of Environmental Geosciences (IGE, Grenoble, France) in 2017. Specific descriptions of the DRI and IGE setups have already been provided by Rhodes et al. (2015) and Fourteau et al. (2017), respectively, and a comparison of the two setups is reported in Sect. S1.2.
A unique spectrometer, using optical-feedback cavity-enhanced absorption spectrometry (SARA, developed at Laboratoire Interdisciplinaire de Physique, University Grenoble Alpes, France; Morville et al., 2005) was used to analyze carbon monoxide (and simultaneously, methane) at both DRI and IGE and during the three analytical campaigns. A detailed description of this instrument, which was used for CO measurements along the NEEM-2011-S1 core in 2011 at DRI, is reported by Faïn et al. (2014). The optical-feedback cavity-enhanced absorption spectrometer (OF-CEAS) was always carefully calibrated against standard gases (Table S3) before melting the ice cores (see Sect. S1.4).
2.2.2 Calibration loop
The degassing membranes currently operated in gas-CFA systems extract bubbles from the sample flow but do not recover dissolved gases from the water phase efficiently. Carbon monoxide (or methane) have higher solubility than N2 or O2. Consequently, mixing ratios of CO in the gas phase of the sample flow exhibit lower values than those that initially exist in the ice bubbles. These offsets need to be corrected for, and an attempt to replicate the conditions experienced by the ice core water–gas mixture between the melter head and the laser spectrometer was originally reported by Stowasser et al. (2012). As melting ice contains 10 % air by volume, a 10:90 mixture of synthetic air and degassed deionized (DI) water can be introduced into the system via a four-port valve located directly after the melter head. The water is sourced from a 2 L reservoir that is degassed by constantly bubbling ultra-pure He through it. The air–water mixture follows the same path through the system as the ice core sample before being analyzed by the laser spectrometer. However, it is not completely identical because it includes more components, such as an additional peristaltic pump or extra lines. This pathway for synthetic standard analysis will be referred to as “calibration loop” here but has been referred to as “full loop” in previous studies (e.g., Rhodes et al., 2013; Faïn et al., 2014). Note that this calibration loop should not be confused with the “internal loop” (Rhodes et al., 2013), which is a system to isolate the gas extraction system from the remainder of the melting system while maintaining a continuous gas extraction (see Fig. 1 from Rhodes et al., 2013).
2.2.3 CO blank of CFA-based analyses
The CO procedural blank was evaluated for each analytical campaign. Two different evaluation approaches were applied, which are described in Sect. S1.5. A relatively high CO blank of 35±7 ppbv was observed at DRI in 2013 when using a Membrana MicroModule degasser to analyze the Tunu13 core, the D4 core, and a fraction of the NEEM-SC core. Lower blank values, ranging from 4.1±1.2 to 12.6±4.4 ppbv, were observed when using an IDEX Transfer Line degasser (to analyze PLACE, NGRIP, and a fraction of the NEEM-SC core).
2.2.4 Internal precision and stability
Internal precision and stability of gas-CFA measurements can be evaluated by Allan variance tests (Allan, 1966) applied to the calibration loop dataset. Laser spectrometers produce many measurements per minute, with a data acquisition rate of 6 Hz for our OF-CEAS instrument. The observed optimal integration time (i.e., time of lowest Allan deviation) was determined for each analytical campaign, and it is now larger than 500 s for DRI and 1000 s for IGE CFA setups (Supplement), which is much longer than the 5 s reported by Faïn et al. (2014) and a testament to increased stability. However, to maximize the depth resolution, CO data can be averaged over a shorter integration time (IT). There is a trade-off between internal precision and IT. Abrupt, non-climatic signals in gas records, such as in situ CO production (Faïn et al., 2014), cannot be fully resolved without reducing the IT. Internal precision, defined as twice the Allan deviation at chosen ITs, ranged from 1.2 to 1.6 ppbv depending on the analytical campaign (Sect. S1.6 and Table S2).
2.2.5 External precision
External precision of the continuous CO measurements (i.e., including all sources of errors or bias) was investigated by melting replicate ice sticks on different days during each analytical campaign. Specifically, we defined the external precision as the pooled standard deviation calculated on the differences of CO concentrations from main and replicate analyzed ice sticks, averaging continuous CO data over intervals of a few centimeters in length (Sect. S1.7). This approach estimates an external precision of 5.7 ppbv for the DRI gas-CFA setup in 2011 (NEEM-2011-S1 campaign, 18 m long replicated section, using 9 cm intervals). We reproduced this analysis for the 2015 DRI campaign, and established an external precision of 6.6 ppbv (19.6 m long replicated section, 10 cm long intervals; Fig. S3). With a similar methodology, but a shorter replicate section analyzed, we evaluated the external precision of PLACE continuous CO measurements conducted at IGE in 2017 to 3.3 ppbv (2.3 m long replicated section, 1 cm intervals; Fig. S3). No replicate ice core sections were available and measured during the 2013 DRI campaign. For the 2013 campaign, we consider the external precision to be 5.7 ppbv for the ice cores analyzed in 2013 with a MicroModule and 6.6 ppbv using the IDEX Transfer Line degasser, by extrapolating results from similar CFA setups.
2.2.6 Absolute calibration and accuracy
CFA-based gas records must be corrected for under-recovery of gases dissolved in the water stream to obtain absolute values on the WMO-CO X2014A calibration scale. The magnitude of gas dissolution is monitored using the calibration loop (Sect. 2.2.2). In this study, a 73 m long ice core (PLACE) was analyzed on two different CFA setups (at IGE and DRI), for CO as well as for CH4 mixing ratios. This gas-CFA laboratory intercomparison revealed that the fraction of CH4 not recovered at IGE was larger than at DRI (14 % and 10 %, respectively). Note that the gas extraction unit and the OF-CEAS detection instrument were identical, and only the melter and lines upstream of the IDEX Transfer Line degasser had different geometries (Sect. S1.2). This intercomparison demonstrates that solubility-based calibrations are required to transfer gas-CFA datasets into absolute concentration scales, and these calibrations are dependent on the geometry and operation of the CFA setup. This observation was further confirmed by measuring the CH4 mixing ratio at IGE when melting replicate ice sticks with varying CFA system geometries (e.g., length of lines) and operation of the CFA setup (e.g., melting speed, pumping rate). Thus, for each analytical campaign, the geometry and operational protocol of the CFA setup were kept unchanged during the measurements. However, these observations rule out universal modeling of the preferential CO dissolution by using Henry's law coefficient and also demonstrate that CFA setups are dynamic systems that are not at solubility equilibrium.
In this study, we used the calibration loop operated with standard gases (Table S3) for absolute calibration of the CO dataset. Such an approach has been successfully applied for CH4 (e.g., Rhodes et al., 2015). However, calibration loops need to be carefully set up and operated in order to closely reproduce the solubility losses occurring in the CFA sample pathway. In the case of CH4, discrete datasets often allow for an external validation of this CFA internal calibration, but such validation was not available for Greenland CO. We hypothesize that CO and CH4 dissolution follow the same physical laws; consequently, if a calibration loop is able to reproduce methane preferential dissolution, it should also reproduce CO losses related to dissolution. Thus, calibration loop experiments reproducing the expected methane preferential dissolution were conducted for each analytical campaign. From such calibration loop experiments, we extracted solubility calibration (SC) factors for CO. Overall, CO losses driven by preferential dissolution ranged from 4 % to 9 %. Replicate measurements show that the fraction of CO not recovered at the outlet of the CFA system was very stable during analytical campaigns, both at DRI and IGE. Based on repeated calibration loop measurements throughout the campaigns, we conservatively estimate the uncertainty of the SC factor to be ±1 % (2σ).
To further evaluate the robustness of the CFA procedure and this absolute calibration approach, five discrete samples of the PLACE core were analyzed with a discrete CO setup (Sect. 1.8.4, Fig. S7). The agreement between the discrete and CFA-based CO dataset (both IGE and DRI) was excellent, with differences in the CO mixing ratio ranging from 0.4 % to 2.8 %. The depth intervals of the discrete samples encompassed the entire span of the PLACE core, from 84 to 146 m depth. More details on the absolute CO calibration are reported in the Supplement (Sect. S1.8).
2.2.7 Signal smoothing
The mixing of gases and meltwater during the sample transfer from the melt head to the laser spectrometer induces a CFA experimental smoothing of the signal. The extent of the CFA-based damping was determined for each analytical campaign by performing step tests, i.e., switches between two synthetic mixtures of degassed DI water and synthetic air standards of different CH4 concentrations (Stowasser et al., 2012, see Sect. S1.9). A cutoff wavelength can be defined as the wavelength of a sine signal experiencing a 50 % attenuation in amplitude. Cutoff wavelengths ranged from 15.0 cm during the DRI 2013 campaign (when using a Membrana MicroModule degasser) to 1.6 cm during IGE 2017 campaign (Table S2). Lower cutoff wavelengths were obtained by limiting the system dead volume, most notably by reducing the debubbler internal volume and by using an optimized IDEX Transfer Line degasser instead of a Membrana MicroModule degasser (1 and 5 mL internal volume, respectively)
2.2.8 Data processing
CO and ice chemistry data collected at DRI were mapped onto depth scales using high-resolution (0.1–0.5 Hz acquisition rate) liquid conductivity data and time–depth relationships recorded by system operators. A constant melt rate for each meter length of core is assumed. The DRI depth scale uncertainties are estimated to be ±1 cm (1σ).
The occasional entry of ambient air into the analytical system as breaks in the core were encountered and caused contamination. The OF-CEAS spectrometer simultaneously measures CO and CH4 mixing ratios, and such contamination was characterized by a sharp increase in the CH4 concentration (ca. 1900 ppbv) followed by an exponential decrease. Data were manually screened for these ambient air contamination events.
Uncertainty in the CO mixing ratios is established as 1σ and is calculated for each calibrated CO dataset. It combined uncertainties evaluated specifically for each analytical setup on CO blanks, solubility calibration factors, and internal precision of CO CFA measurements (see Supplement and previous sections).
Finally, we used high-resolution water isotope datasets to match the DRI and IGE PLACE depth scales. Water isotopic ratios were measured simultaneously with gas concentrations in both laboratories using laser spectroscopy (Gkinis et al., 2011; Maselli et al., 2013).
2.3 Investigation of possible rapid CO production from trace organics in the ice during melting
To investigate if elevated or highly variable CO levels observed in the Greenland ice core could originate from the melting process (i.e., “in extractu” CO production from trace organics in the ice), CO concentrations were determined in tests with 20 discrete ice and firn samples (sized between 272 and 1089 g, with an average size of 690 g). The experimental protocol is reported in detail in the Supplement. Briefly, ice samples collected below close-off depth (fully closed porosity) are completely grated to fine powder to remove trapped air. Firn samples do not contain a significant amount of trapped air; however, some firn samples were still grated to powder to verify that the grating process did not increase the [CO] blank. The samples are then introduced in a glass vessel, evacuated, and flushed with ultrapure air overnight. A gas standard of known concentration is then introduced within the vessel. Consequently, for both firn and ice samples, the CO mixing ratio within the vessel prior to melting is equal to that of the gas standard introduced in the vessel. If CO in extractu production occurs during melting, it should cause an increase in the CO mixing ratio above this known value.
The CO concentration in the gas available in the vessel headspace is determined by gas chromatography combined with a mercuric oxide reduction detector (RGD; Peak Performer 1, Peak Laboratories, USA). This is carried out at three different stages: before melting, during melting, and after melting. CO concentrations are calibrated using four synthetic air gas standards with nominal CO concentrations ranging from 50 to 500 ppbv, and data are reported on the WMO-CO X2014A scale.
Three large-diameter (27 cm) cores collected with the Blue Ice Drill (BID) were used for these tests: the PLACE ice core (central Greenland; Table 1), the C14 firn core (central Greenland, drilled in June 2015; 72∘39.62′ N, 38∘34.85′ W), and a Taylor Glacier ice core (Antarctica, drilled in December 2015; 77∘45.69′ S, 161∘43.18′ E). BID cores allowed for up to four true depth replicates to be measured from the same depth interval. CO concentrations were determined (before, during, and after melting) for the following cases: (i) Greenland C14 firn (45 m depth), (ii) Greenland PLACE ice from depths ranging from 110 to 125 m and showing low and stable [CO] on the CFA record, (iii) Greenland PLACE ice from depths (111 m) showing elevated and highly variable [CO] on the CFA, (iv) Oldest Dryas (15 kyr BP) and Holocene (9.5 kyr) Antarctica ice, and (v) gas-free ice made from degassed Milli-Q 18.2 MΩ.
2.4 Chemistry data
During the two DRI analytical campaigns, melted ice core samples were analyzed continuously by inductively coupled plasma mass spectrometry (ICP-MS) and CFA for chemical species. These analytical methods have been reported previously (McConnell and Edwards, 2008; McConnell et al., 2007, 2002). High-resolution measurements of total organic carbon (TOC) were obtained at DRI by coupling a Sievers 900 TOC analyzer to the DRI ice core melter (Legrand et al., 2016).
The new CO records available from the PLACE, NGRIP, NEEM, D4, and Tunu13 ice cores are reported in Fig. 1 and plotted for the period spanning from 1650 to 1960 CE (gas age, see Table S1). Only the NEEM, NGRIP, and Tunu13 datasets significantly extend beyond the last 3 centuries, and the full records are reported in Fig. S17. Over the 1650–1960 CE period, all Greenland CO ice records exhibit highly variable CO values. A minimum mixing ratio of 92 ppbv is observed at NEEM and PLACE, and a maximum mixing ratio of 1191 ppbv is observed at Tunu13. Considering all records, some 46 events revealed mixing ratios higher than 250 ppbv. In Sect. 3.1, we discuss the baseline CO levels of the different ice core records as well as the characteristics of the abrupt CO spikes detected in all records. Tests and discussions presented in Sect. 3.2 demonstrate that in situ production drives these abrupt CO spikes. The key question of whether an atmospheric signal can be extracted from the low-frequency variability in the CO ice records' baselines is discussed in Sect. 3.3. Comparison of our new CO records with existing data is presented in Sect. 3.4. Finally, a multisite reconstruction of past atmospheric CO levels at northern latitudes is presented in Sect. 3.5.
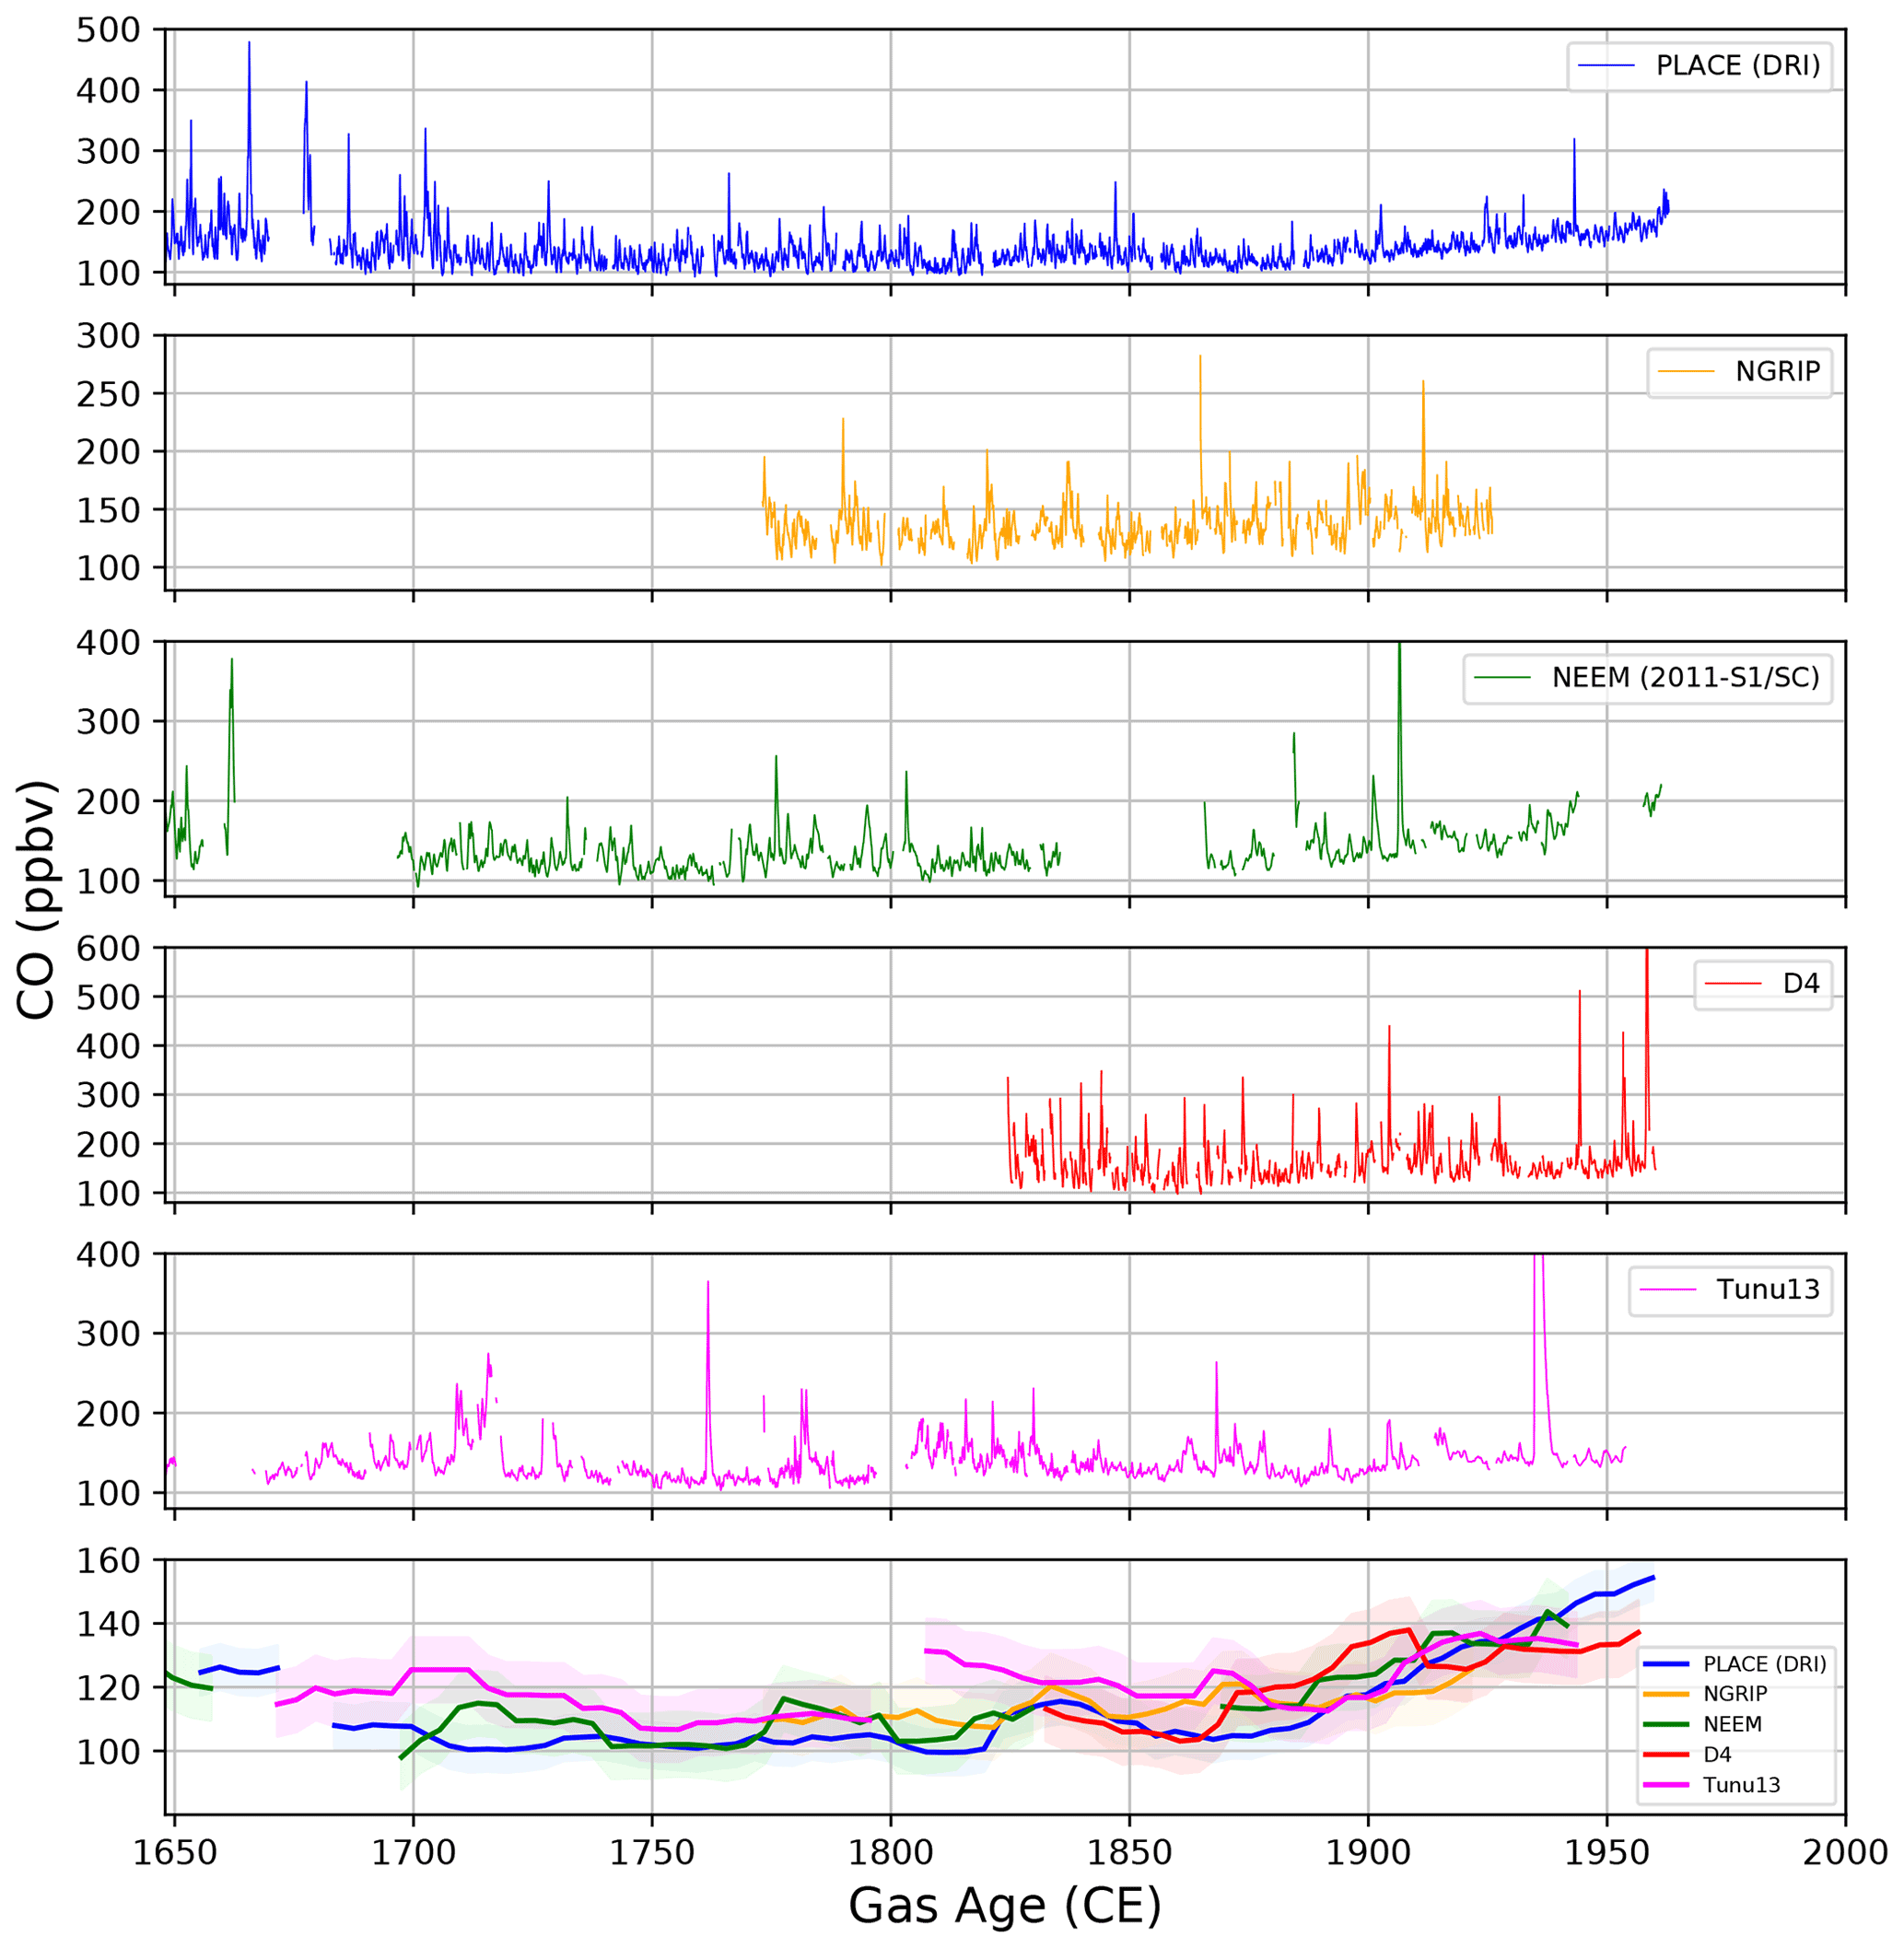
Figure 1The first five panels (from top to bottom) show the Greenland continuous CO records available from the PLACE (DRI), NGRIP, NEEM, D4, and Tunu13 ice cores, respectively, and are plotted for the period spanning from 1650 to 1960 CE. The bottom panel shows the CO baseline levels from each ice record, defined as the 5th percentile of data every 4 years over a 15-year moving window, with the shaded regions on each baseline representing the uncertainty.
3.1 Continuous CO records along Greenland ice cores
3.1.1 CO baseline levels
We identified the CO baseline levels from each ice record by calculating the 5th percentile of data every 4 years over a 15-year moving window. A 15-year moving window corresponds to a time interval shorter than the full width at half maximum of the CO age distribution at these sites (Table 1). We chose to use the 5th percentile CO baselines because they can be calculated identically for all datasets and are not based on the subjective operator decisions involved in identifying and removing peaks to derive a baseline level. The temporal trends in records calculated using the 10th percentiles are similar. The 5th percentiles were not computed when more than 50 % of the data were missing within the windows. Figure 1 (lower panel) reports the 5th percentile CO baselines extracted over the last 300 years from the D4, Tunu13, NGRIP, NEEM, and PLACE ice records (all DRI dataset). The shaded envelope reported on each baseline represents the uncertainty (1σ) calculated by propagating the CO external precision and uncertainties onto the CO blank and solubility calibration factor (see Sect. 2). The CO baseline records from the five ice cores are always within 20 ppbv of each other. From 1700 to 1875 CE, the ice records indicate rather unchanged or slightly enhanced levels with time, whereas from 1875 to 1950 CE, all the ice records reveal a steady increase.
3.1.2 High-frequency non-atmospheric CO signals
Figure 1 shows that the five Greenland sites investigated in this study all exhibit highly variable CO mixing ratios. Referring to previous data reported by Faïn et al. (2014), such a pattern was expected when measuring the NEEM-SC samples and extending the NEEM-2011-S1 record. However, new records from central Greenland (PLACE, NGRIP), northeastern Greenland (Tunu13), and southern Greenland (D4) also appear to be affected by variability in the CO mixing ratios that is too large and rapid to reflect past atmospheric mixing ratio changes (Figs. 1, S17).
The true extent of high CO variability may be masked, however, by CFA analytical smoothing. Figure 2 (upper panel) reports a 1.5 m long section of the PLACE ice core, analyzed with both the DRI and IGE CFA setups. The higher CFA setup resolution at IGE (Sect. 2.2.7) reveals more features but may still miss even higher-frequency variability and dampen extrema values. Similarly, a CO record from a core drilled at a relatively low-snow-accumulation site will appear more smoothed out by CFA analysis than one from a relatively high-snow-accumulation site.
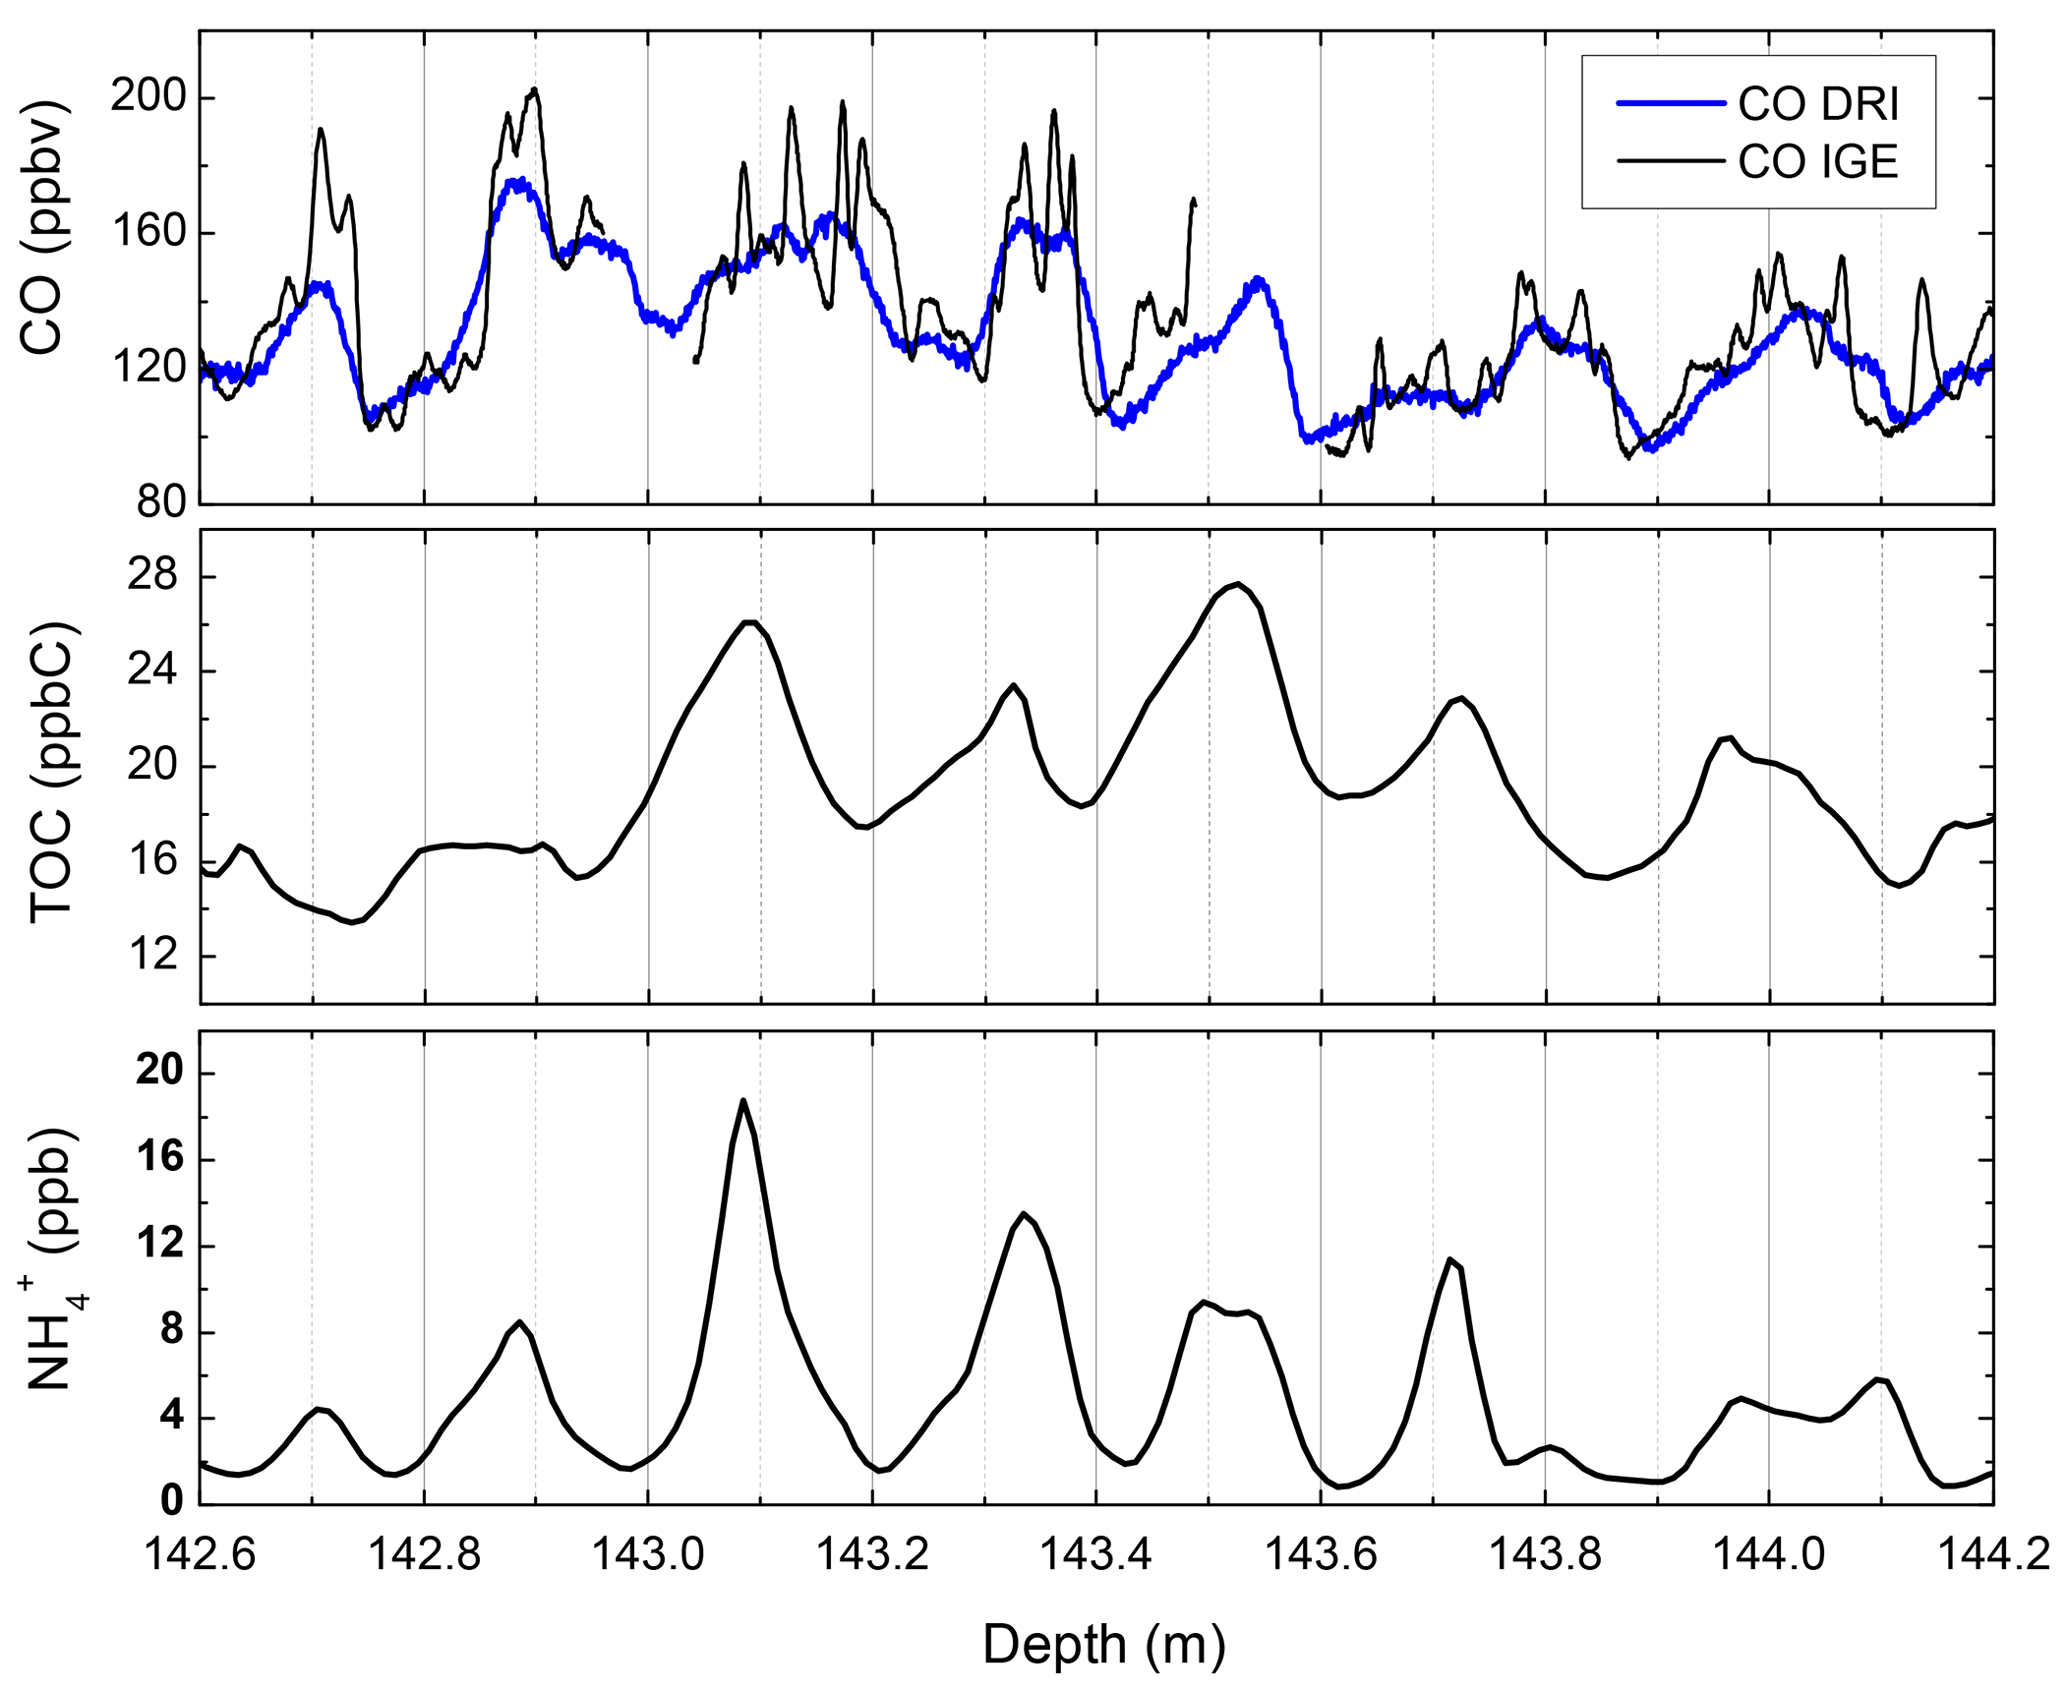
Figure 2High-resolution TOC, , and CO from the PLACE core. CO mixing ratios were measured with both the DRI and IGE CFA systems. shows a well-marked seasonal cycle characterized by a summer maximum. PLACE snow accumulation is about 20 .
High-frequency variability within CO records can be quantitatively characterized using the MAD (median absolute deviation). The MAD values calculated for all CO records collected at DRI every 4 years over a 15-year moving window (similarly to baseline signals, see Sect. 3.1.1) are reported in Fig. S18. For the 1700–1950 CE time period, we observe that the NEEM, NGRIP, Tunu13, and PLACE records exhibit stable and similar MAD values, with mean MAD values over the entire 1700–1950 CE period ranging from 9.9 to 14.2 ppbv, depending on the records. The D4 MAD values are larger, varying from 10 to 30 ppbv. The NEEM, NGRIP, and Tunu13 datasets significantly extend beyond the last 3 centuries and reveal different MAD patterns for ages older than 1700 CE. The Tunu13 record, spanning the last 1300 years, reveals that CO variability remains stable as depth increases, whereas NEEM and NGRIP show increasing MAD with depth, clearly indicating that high variability in CO is more pronounced for older ice. These increases are significant, with MAD values reaching ∼60 ppbv for the deeper sections of the analyzed NEEM and NGRIP ice core sections.
3.2 Do drilling or analytical processes cause CO production?
The observation of high-frequency CO variability along the NEEM-2011-S1 core led Faïn et al. (2014) to discuss if such patterns could be driven by the processes involved in sample collection and analysis. Here, we consider our new data to assess in more detail if such processes can drive CO production.
3.2.1 Ice core drilling
We observe that abrupt CO spikes of similar magnitude occur in ice cores extracted by dry drillings (e.g., PLACE, D4, Tunu13) and when a drilling fluid was used (e.g., NEEM, NGRIP) (Fig. 1). This clearly rules out contamination from the drilling fluid as a cause of high-frequency CO variability, confirming the previous conclusion from Faïn et al. (2014).
Haan et al. (2001) observed CO production within an alpine snowpack in daylight. Drillings are usually conducted at high-altitude sites in summer, during which time UV radiation levels are high. Thus, one could hypothesize that CO is photochemically produced within ice cores just after drilling, when ice cores are handled at the drilling site before being packed in ice core boxes. During the PLACE and NEEM-SC drillings, specific care was taken to never expose freshly drilled cores to direct sunlight. For PLACE, a shaded area was set up for core processing. NEEM 2011-S1 and SC core drillings were conducted in a tent and a trench, respectively. In spite of these measures, all these ice cores reveal CO spikes. In contrast, no specific care was taken during the historical Eurocore drilling when handling cores, with respect to sunlight exposure, and Haan and Raynaud (1998) report that this archive does not exhibit a highly variable CO concentration in the upper section. Based on this, it appears that brief direct exposure to sunlight after drilling is unlikely to be the cause of the large CO spikes
3.2.2 Impact of long-term core storage
By comparing the storage time of different ice cores (storage without light exposure) prior to CO analysis with the same CFA setup (NEEM-2011-S1 and D4), Faïn et al. (2014) concluded that CO production in ice during core storage was unlikely. We extend this observation by comparing central Greenland archives: NGRIP and PLACE records reveal similar abrupt CO spikes and CO baselines (Fig. 1), although these cores were analyzed 15 years and 3 months after drilling, respectively. Furthermore, at IGE, we measured a 10 m long replicate section of the PLACE core nearly 2 years (December 2018) after the main analytical campaign (February 2017), and no change in the CO values was observed (Fig. S14).
3.2.3 Impact of the CFA process
In 2013, at DRI, a 4 m long replicate section of the D4 ice core was melted under dark laboratory conditions. Similar in situ CO production patterns were observed under light and dark melting conditions. These results, which have already been reported by Faïn et al. (2014, Fig. S2), reveal that the CO variability observed along the D4 core is not related to photochemically driven CO production occurring in the sampling lines between the melter head and the CFA extraction box. To further evaluate if the CFA analytical system could somehow induce CO production within the melted ice, a melted D4 sample was collected downstream of the degassing membrane and recirculated in the calibration loop mode (Sect. 2.2.2) for 1 h as degassed blank water. We observed similar CO levels to the deionized water blank.
3.2.4 Results of the investigation of possible rapid CO production from trace organics in the ice during melting
As described above, CO analyses of 20 discrete ice and firn core samples (including the PLACE core) were carried out at the University of Rochester, with the goal of investigating the possibility of the in extractu production of CO from trace organics in the ice during melting of ice core samples (Sects. S2.3 and S1.11, Table S4).
All of the different ice and firn sample types, including samples of different mass and a gas-free ice sample, showed a consistent excess CO growth occurring during the melting step, with excess CO increasing by 6.4 ppbv on average (Fig. 3) – a much smaller CO enhancement than the spikes observed in the CFA records. As the excess CO produced appears stable after melting and consistent between the sample types, the excess CO observed is likely a systematic extraction system blank.
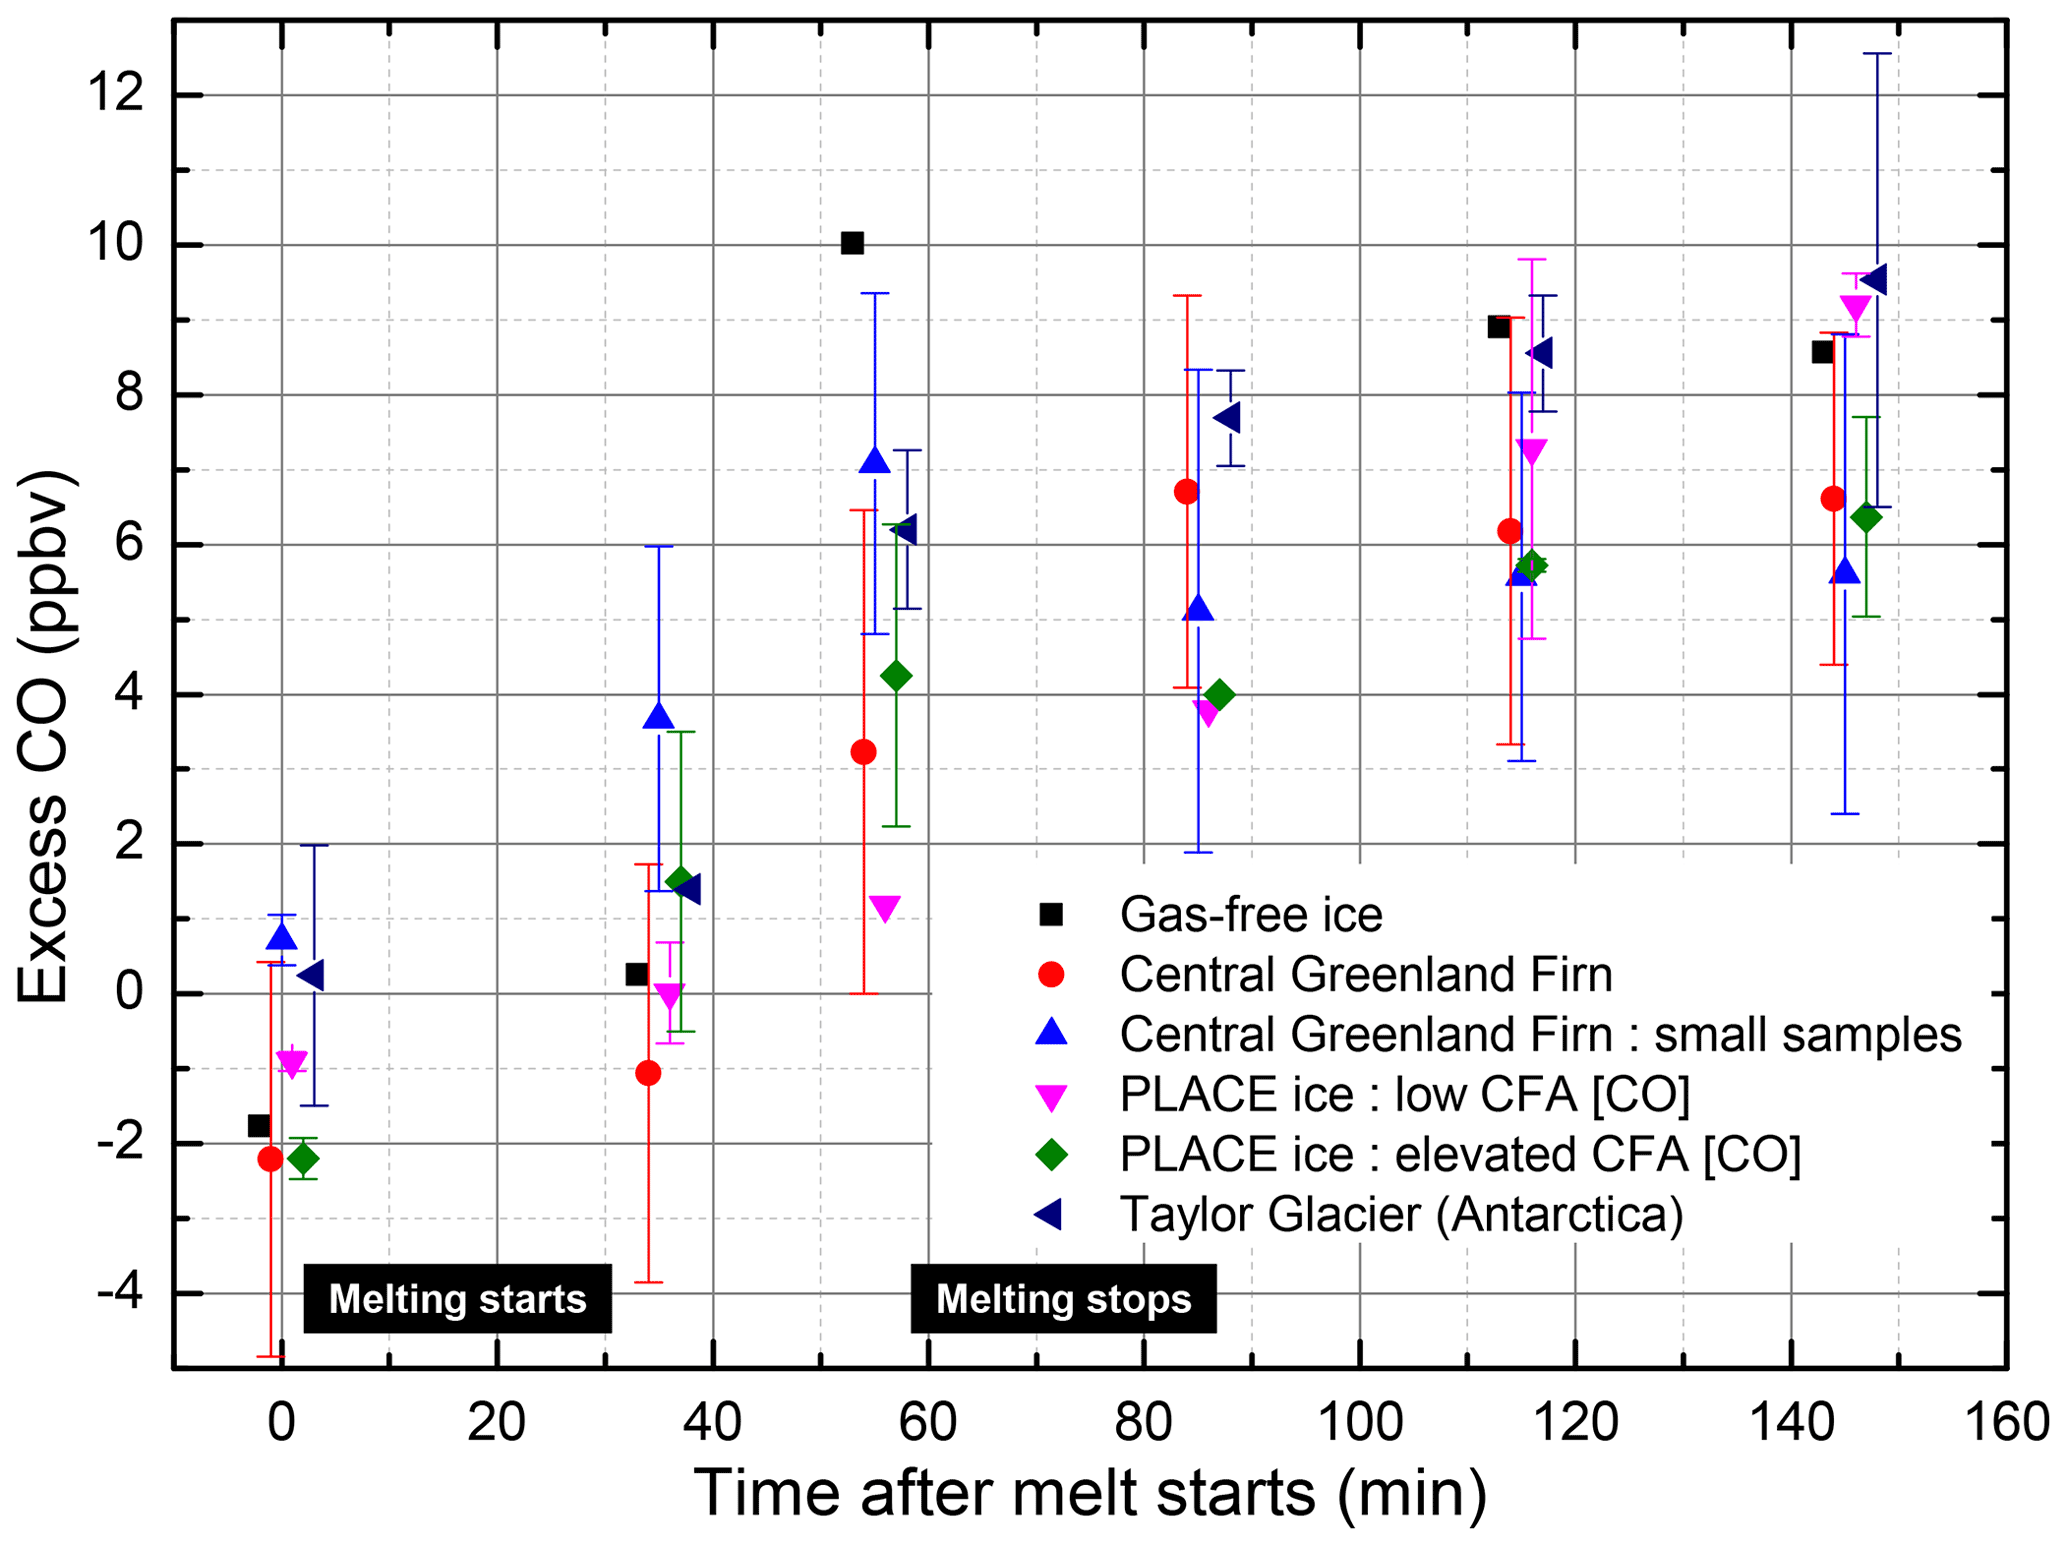
Figure 3Average excess in the CO mixing ratios produced during the melting of discrete samples measured by gas chromatography combined with a mercuric oxide reduction detector. The CO values shown have been corrected for a small (∼3 ppbv) CO excess observed in equivalent tests where the ice samples were not melted (see Sect. S1.11.3). The following samples are investigated: gas-free ice, firn from central Greenland (including low-mass samples), PLACE ice samples exhibiting high CFA [CO] and low CFA [CO], and Taylor Glacier (Antarctica) ice. The samples' descriptions are reported in Table S4. Error bars represent 1 standard deviation for all sample runs of a given type, and points without error bars represent single measurements.
If the CO production mechanism involves organic compounds present in the ice lattice, it would be expected that variations in the concentrations of organics from samples collected at different sites/from different depth levels as well as variations in the melted ice mass would result in significant differences in excess CO. Some of the PLACE ice samples were specifically selected because they exhibited low and stable [CO] in the continuous CFA record, whereas others were selected because they exhibited elevated and spiky [CO] behavior, suggesting the possibility of instantaneous CO production during melting (Fig. 3, Table S4). The other samples, the two Taylor Glacier and gas-free ice samples, were also selected as they should have very different trace organic loadings to the Greenland ice, especially the gas-free ice sample which has no significant organic loading (<2 ppbC). Further, replicate firn samples of different mass would be expected to have a total organic loading that scales with the firn mass. Because there are no significant differences observed in the excess CO produced from these very different sample types (Fig. 3), these results indicate that the melt-extraction process itself does not result in significant CO production from trace organics found within the ice samples. Instead, these results lend further support to the idea that the elevated and highly variable [CO] values observed in Greenland ice samples are due to excess CO produced from in situ production within the ice itself (Faïn et al., 2014; Haan and Raynaud, 1998).
3.3 Atmospheric CO history retrieved from Greenland ice cores
We now explore if the past atmospheric concentrations of CO can be extracted from the low-frequency variability in the CO ice records' baselines (Fig. 1). The key question is as follows: does the in situ production present in all five cores still impact the 5th percentile of the data that we adopt as a baseline?
In our earlier study on the NEEM-S1-2011 core (Fain et al., 2014), we reported that 68 % of the CO spikes were observed in ice layers enriched with pyrogenic aerosols (i.e., exhibiting ammonium levels above 18 ppb). Within the 60 cm length core analyzed in that study, elevated ammonium () and CO were found together with dissolved organic carbon (DOC) (>100 ppbC), representing an important reservoir of carbon that could potentially be oxidized into CO; however, the oxidation processes involved remain unidentified. Here, we focus on the two cores for which we have obtained reliable total organic carbon (TOC) data (Sect. 2.4). These are interesting cores to compare because they have very different snow accumulation rates: Tunu13 has the lowest accumulation rate, which varies from 8 to 13 over time, whereas PLACE is more typical of a late-Holocene Greenland core with a stable accumulation rate of .
3.3.1 The importance of data resolution
Typical CO, TOC, and patterns observed along the PLACE core are reported along a 1.6 m section in Fig. 2. Maximum and minimum levels of the three species occur at similar depths. is commonly used in Greenland ice to identify summer layers that are characterized by a well-marked summer maximum (Legrand and Mayewski, 1997). Investigating summertime and wintertime distributions of [CO] and the concentration of total organic carbon ([TOC]) over the full PLACE record confirms that both species share coherent seasonality (Figs. S22, S26): CO and TOC show lower levels in winter-deposited ice layers, suggesting that the CO signal preserved in winter layers at the PLACE site is more suitable for paleoatmospheric reconstructions.
Typical CO, TOC, and variations along the Tunu13 core appear different to those at the PLACE site (Fig. 4). The seasonal cycle in is still detectable, but the TOC and CO records show much less covariation than at PLACE. PLACE and Tunu13 TOC concentrations were analyzed with the same setup (i.e., impacted by the same analytical smoothing), but the lower accumulation rate of Tunu13 results in a larger smoothing of the TOC signal. The higher degree of smoothing in CO relative to PLACE results in part from Tunu13 being analyzed with the 2013 DRI CFA setup (MicroModule degasser), which shows a larger response time in the gas phase (Table S2). Similarly to TOC, the effect is compounded by the much lower snow accumulation rate of Tunu13 relative to PLACE – the section of core in Fig. 4 only has 8 cm w.e. yr−1. Step tests (Sect. 2.2.7) suggest that for CO a 60 % attenuation would be expected for a sine signal of 10 cm wavelength, a depth interval representing >1 year in this case. The impact of analytical smoothing on the Tunu13 CO patterns was further investigated by convoluting a Tunu13-like synthetic CO signal with the Green function of the 2013 DRI CFA setup (Figs. S8, middle panel, and S12). A 5th percentile baseline was extracted from the smoothed synthetic signal produced by this convolution. The baseline obtained is found up to 8 ppbv above the original synthetic signal for depth intervals spanning few meters (Fig. S13), confirming that CFA analytical smoothing can positively bias the Tunu13 baseline CO level. More details on this conceptual experiment are available in Sect. S1.9.2.

Figure 4High-resolution TOC, , and CO from the Tunu13 core. Snow accumulation is about 8 at this depth.
The significant analytical smoothing for the Tunu13 ice core suggests that annual winter minima in CO (associated with winter minima in TOC) may be unresolvable, which would lead to an overestimation of the baseline even when using the 5th percentile values. In contrast, repeated analysis of the higher-snow-accumulation PLACE core on two different gas-CFA setups (DRI and IGE, Table S2) shows that, despite the DRI setup (2015 configuration) exerting a greater smoothing effect than the IGE one (Sect. S1.9, Figs. S10 and S11), the CO minima values are well-resolved in both cases (Fig. 2). Furthermore, the PLACE CO baseline extracted from the IGE continuous record is similar to the one based on the DRI dataset (Sect. S2.4), suggesting that analytical smoothing is not a limitation on isolating CO levels in the winter ice layers at this site. Convoluting a PLACE-like synthetic CO signal with either the DRI 2015 or the IGE 2017 CFA setup Green function (e.g., Sect. S1.9.2) confirms this result. This suggests that the 5th percentile baseline calculated at PLACE and other high-snow-accumulation sites is suitable for investigating the past evolution of the atmospheric CO burden.
3.3.2 TOC patterns and in situ CO production
The high-resolution TOC measurements collected along the PLACE core exhibit a stable TOC background value of 13.5 ppbC (baseline defined as the 5th percentile), with 17 spikes above 40 ppbC (70 m long record; Fig. S24). TOC levels observed at Tunu13 are lower, with a baseline value of 7.9 ppbC (1σ) and only 10 spikes above 40 ppbC for a longer record (143 m long record; Fig. S25). Tunu13 mean TOC (10 m window averaging) exhibits a low-frequency variability with values ranging from 4 to 12 ppbC (Fig. 5). The low-frequency variability in Tunu13 mean TOC is correlated with changes in the snow accumulation rate (Fig. 5), which varies from 8 to 13 cm w.e. yr−1 (annual average). Along most of the core, this linear relationship between TOC and the snow accumulation rate remains unchanged, although it becomes steeper below 160 m depth (Fig. S27). Such a correlation is not observed at PLACE where the snow accumulation is constant, with annual mean values ranging from 20 to 21.5 .
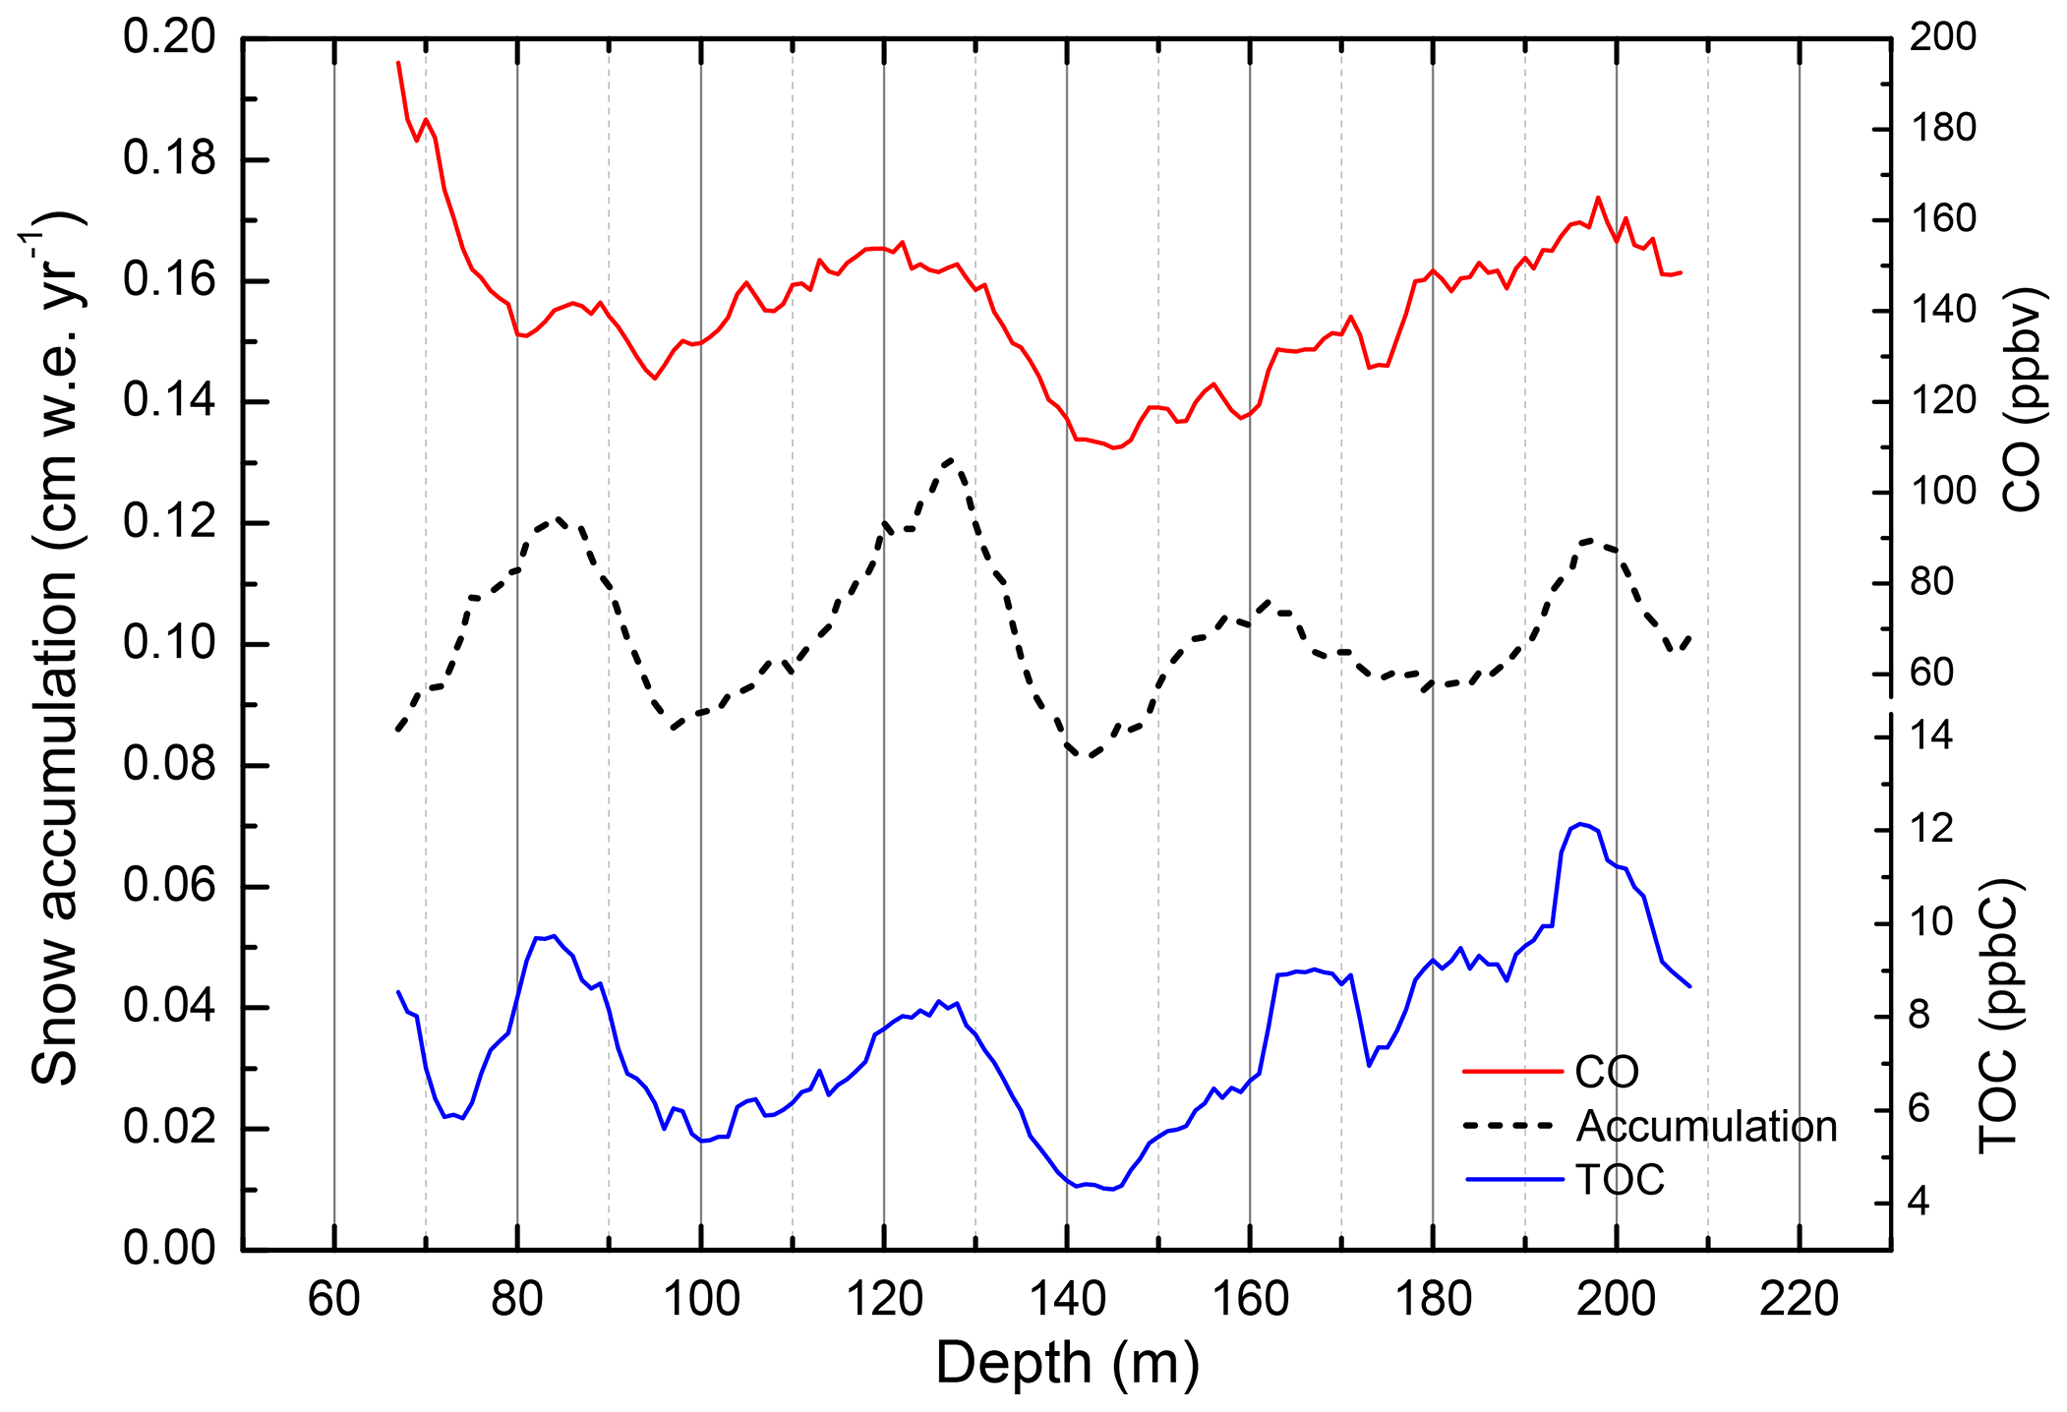
Figure 5Running averages (10 m windows) of TOC and CO concentrations for the Tunu13 core, plotted along with the annually averaged surface snow accumulation rate.
In situ CO production within Greenland ice archives is very often co-located in ice layers where TOC levels are high (e.g., Figs. 2, S22, S26), as observed previously on the NEEM-2011-S1 core (Faïn et al., 2014), suggesting that in situ CO production may be related to the organic carbon (OC) availability. The importance of OC in the processes driving CO in situ production is further supported by the long-term averaged mean CO record (running windows of 10 m) which is significantly correlated with mean TOC at Tunu13 (r2=0.56, p<0.01; Fig. 5) for preindustrial times (gas age prior to 1850 CE, i.e., below 83 m depth), with increases in mean CO when TOC and snow accumulation are higher. However, comparison of the Tunu13 and PLACE datasets suggests that higher TOC levels do not always imply higher CO concentrations: over the 1640–1950 CE gas-age time period, the mean CO mixing ratio is almost identical for Tunu13 and PLACE (137 and 136 ppbv, respectively), whereas mean TOC is higher for PLACE compared with Tunu13 (20 and 7 ppbC, respectively). This may suggest that the required amount of OC to lead to significant in situ CO production has already been reached at the Tunu13 site.
Characterizing the fate of TOC in Greenland ice is a first requirement for a better understanding of in situ CO production processes. Figure 5 suggests that the fate of TOC deposited at Tunu13 is related to the rate of snow accumulation at the surface. Comparing the Tunu13 and PLACE TOC records suggests that the lower the accumulation rate, the lower the TOC baseline concentrations in the deep ice. A snowpit study of recent snow layers deposited at Summit (Hagler et al., 2007) showed that a large fraction of water-soluble and insoluble organic carbon may be lost at the surface during post-deposition processes, such as photochemical reactions. We hypothesize that such processes may be enhanced at lower accumulation rates when the snow layers get exposed to UV radiation for longer.
However, the relationships between TOC and ammonium suggest that other processes can impact TOC after deposition at Tunu13. Forest fire debris reaching central Greenland snow during spring or summer mainly consists of ammonium formate, and organic carbon is mostly made of formate at Summit (Legrand et al., 2016). Legrand and De Angelis (1996) reported a formate-to-ammonium molar ratio close to unity in elevated ammonium events recorded at Summit both during the last 200 years and the Holocene. The relationship between TOC and ammonium at PLACE (Fig. S28) exhibits a similar slope close to unity. A completely different pattern is observed at Tunu13 (Fig. S29), with unexpectedly low TOC observed along ammonium peaks. We suggest that ammonium formate has been remobilized after deposition in the snow at sites with snow accumulation rates lower than 12 . Ammonium remains when deposited due to acidic snow layers. In contrast to ammonium, formate evolves into a different form (presumably gaseous formic acid) that can be released into the free atmosphere above the snowpack or be remobilized to neighboring winter layers. Such a process could contribute to explaining the lower TOC levels observed under lower snow accumulation rates as well as explaining the smoothed shape of the TOC peaks at Tunu13 (Fig. 4). This process can also promote in situ CO production in winter layers where some organic substrates can be remobilized.
3.3.3 Summary
Investigating the CO and TOC PLACE records did not reveal any evidence that the CO baseline could be influenced by in situ production at that site. In contrast, Tunu13 has a lower snow accumulation rate than other sites (Table 1); thus, the analytical CFA smoothing of its CO record is more pronounced. This effect likely introduces a positive bias into the Tunu13 CO baseline record for ice sections impacted by in situ production, with some of the CO baseline signal likely incorporating CO produced in situ from summer ice layers. This limits the interpretation of the Tunu13 baseline as an atmospheric signal in this study.
While the mean CO mixing ratio is significantly correlated with the mean TOC concentrations in ice at Tunu13, this is not the case for the baseline CO level which does not exhibit significant correlations with mean or baseline TOC concentrations. However, we cannot rule out the fact that a redistribution of organic carbon along depth driven by OC post-deposition process (shifting the ammonium–formate equilibrium with the gas phase) specifically impacts the Tunu13 CO record by providing some additional organic substrates in winter layers.
3.4 Comparison of the PLACE and Eurocore datasets
Haan and Raynaud (1998) and Haan et al. (1996) published a pioneering CO dataset based on discrete sampling of the Eurocore ice core. This dataset revealed a smoothed CO signal, interpreted as not being affected by in situ production over the last 300 years (26 samples, depth range from 78 to 154 m). However, the CO data of Haan and Raynaud (1998) for the period preceding 1700 CE displayed a relatively elevated and scattered signal with levels fluctuating from 90 to 180 ppbv, likely impacted by in situ production. Through our study, we were unable to identify a Greenland site where the ice archive provides a low and stable CO record similar to that of Haan and Raynaud (1998) over the last few centuries. Specifically, the CO record retrieved from the PLACE ice core, which was drilled less than 1 km from the Eurocore borehole, shows high-frequency variability along the entire CFA record (80–153 m depth), and this observation is supported by discrete measurements conducted on the PLACE core using an analytical process that is, in principle, similar to the one deployed by Haan and Raynaud (1998) (Sect. 2.2.6, Fig. 6).

Figure 6CO mixing ratio collected (i) along the PLACE ice core, showing the continuous IGE CFA record with the 5th percentile baseline (gray line) and the discrete dataset (black dot); and (ii) along the Eurocore archive, showing the historical Eurocore discrete CO data (blue dot; Haan et al., 1998) and the CFA-based dataset measured in 2019 at IGE (red).
Over the 1700–1900 CE period, Eurocore discrete CO data are about 10 ppbv lower than the baseline of the PLACE CFA-based record (Figs. 6, S23). Furthermore, the trend and rate of change of the two records are similar during 1700–1905 CE but diverge over the 1925–1950 CE interval, with an increasing offset between datasets, and a sharp increase in CO concentrations observed only in the Eurocore record for the 1935–1950 CE time period.
To further investigate this apparent offset between our new Greenland CO records and the Eurocore CO record of Haan and Raynaud (1998) and Haan et al. (1996), we analyzed six 50 cm long sections of the 1989 Eurocore ice core with the gas-CFA IGE setup in January 2019 at depths spanning from 84 to 153 m. A fraction of the Eurocore core has been stored as an archive for 30 years at −20 ∘C. We were able to sample the Eurocore archive at exactly the same depths that Haan and Raynaud (1998) and Haan et al. (1996) did in the 1990s (the gaps left by the discrete sampling conducted by Haan and colleagues could be seen). Figure 6 shows Eurocore data (from both Haan and Raynaud, 1998, and Haan et al., 1996, and from our new CFA dataset) and the PLACE IGE CFA record: to do so, an offset of +6 m was applied to the Eurocore depth scale so as to account for the 26 years of snow accumulation that occurred between the Eurocore and PLACE drillings. Our CFA-based CO analyses reveal high variability along the Eurocore archive. We systematically observed higher CO mixing ratios than previously reported by Haan and Raynaud (1998), including at the exact depths that they sampled. We established that such discrepancies were not related to differences in the CO calibration scales by reanalyzing in 2015 the standard gases used by Haan and Raynaud (1998) and Haan et al. (1996) to calibrate their Eurocore dataset in the 1990s. Overall, our CFA-based Eurocore data are in contradiction with the historical Eurocore dataset but are in good agreement with the PLACE record, in terms of both absolute levels and high variability. The discrete PLACE CO data, measured using a methodology similar to that applied by Haan and Raynaud (1998) and Haan et al. (1996), also exhibit higher values than the Haan et al. (1996) dataset (Fig. 6), whereas they show an excellent agreement with the CFA CO dataset (Fig. S7).
To summarize, we have not been able to reconcile the validity of the Haan et al. (1996) and Haan and Raynaud (1998) results with a new Greenland ice core CO dataset (PLACE). This is despite the analysis of the remaining Eurocore ice from depths co-located with the abovementioned published data and the fact that PLACE ice core was collected just 1 km from the Eurocore site. The reasons for the relatively low and stable CO measurements reported in the 1990s for the Eurocore ice core remain unknown, and our results bring the validity of the Haan et al. (1996) and Haan and Raynaud (1998) results into question.
3.5 Constraining past atmospheric CO in the Northern Hemisphere
3.5.1 CO baseline records over the last 300 years
Extracting atmospheric information from a single CO record retrieved from a Greenland ice archive affected by in situ production features is challenging (e.g., Faïn et al., 2014). However, we show here that the PLACE, NGRIP, NEEM, and D4 records, reconstructed from ice archives originating from different Greenland locations and drilled over a time period spanning more than a decade, exhibit common patterns. We conservatively exclude Tunu13 from paleoatmospheric interpretations, knowing that the Tunu13 baseline CO record could be positively bias by analytical smoothing or the redistribution of organic carbon with depth (see Sect. 3.3). Figure 1 reports the 5th percentile CO baselines extracted over the last 300 years from the D4, NGRIP, NEEM, and PLACE records (DRI dataset). The four CO baseline records all lie within an envelope with a maximum 20 ppbv range. From 1700 to 1875 CE, the records reveal stable or slightly increasing values remaining in the 100–115 ppbv range. From 1875 to 1950 CE, the records indicate a monotonic increase from 100–120 to 135–150 ppbv (i.e., a mean rate of increase of ∼ 0.3 ppbv yr−1). Interestingly, in 1835 CE, the PLACE, NGRIP, NEEM, and D4 baselines exhibit a common maximum in the CO concentration, although at a level just slightly higher than concentrations observed during the 1700–1820 CE period.
A multisite composite CO baseline spanning 1700–1957 CE was generated by considering the D4, NEEM, NGRIP, and PLACE records and excluding Tunu13. For consistency, we only consider CO records collected on the same gas-CFA setup (DRI). The multisite composite, reported in Fig. 7, was obtained by averaging CO baselines values interpolated on a common gas-age scale. An uncertainty envelope (1σ) obtained by considering the independent uncertainty of individual records is plotted along with the composite. Overall, Fig. 7 reports a ∼30 % increase in the atmospheric CO concentration at high latitudes in the Northern Hemisphere from the preindustrial period to 1950 CE.
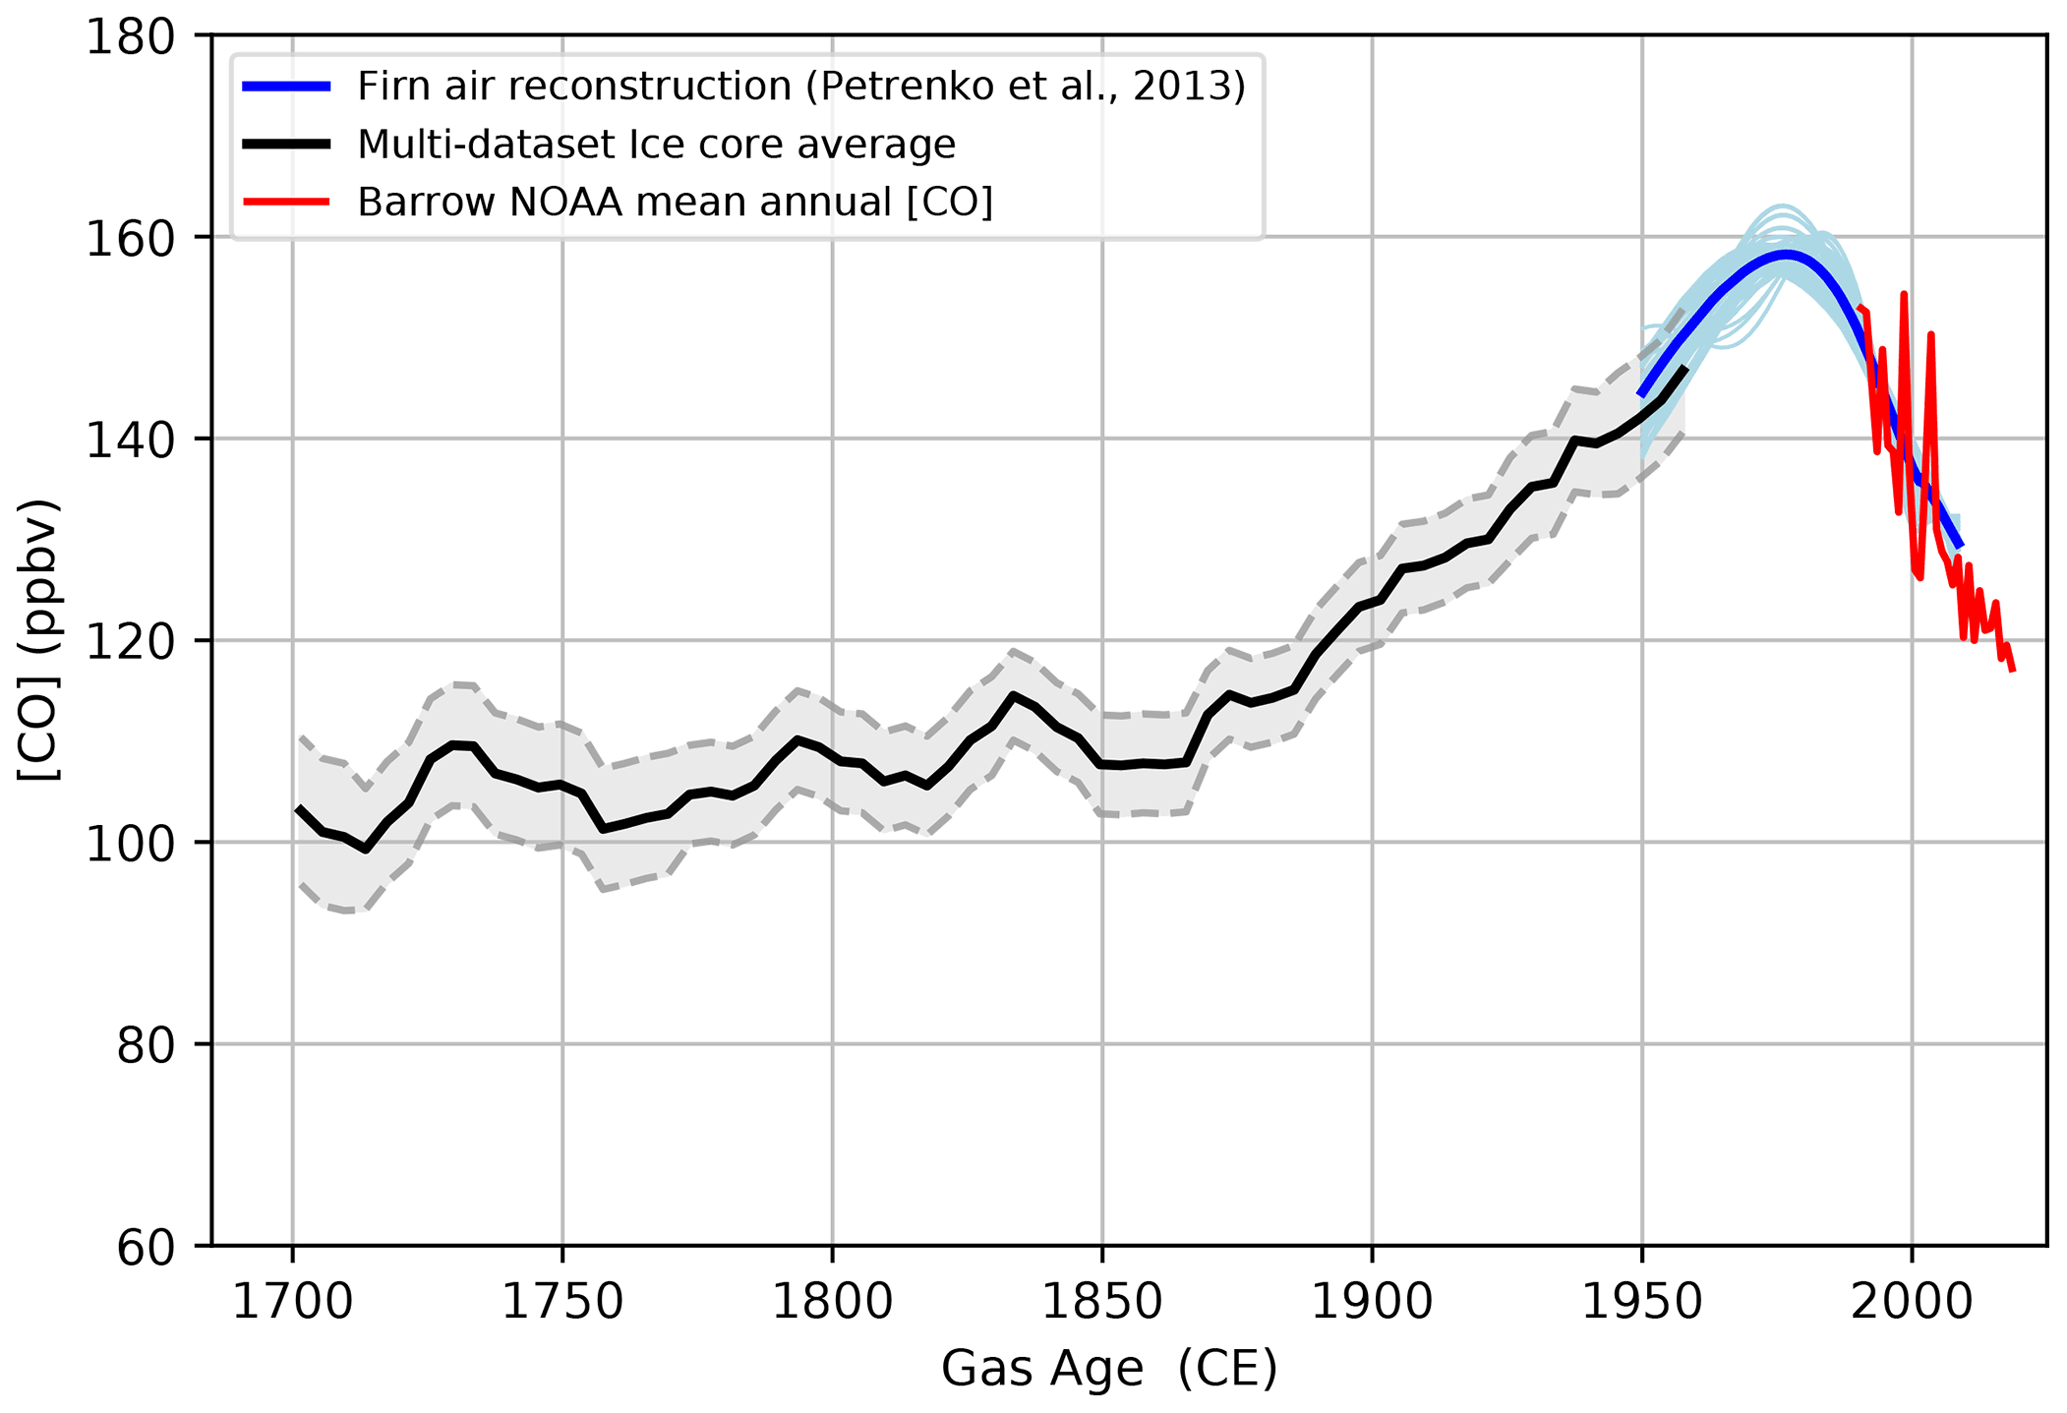
Figure 7Past atmospheric CO mixing ratios for the Northern Hemisphere high latitudes spanning from 1700 to 2018 CE. The black line denotes the multisite average obtained by combining the baselines (5th percentiles) of continuous CO records collected at four Greenland sites (PLACE, NEEM, NGRIP, and D4), representing an upper-bound estimate of past atmospheric CO levels. Light blue denotes the firn air records obtained by combining samples from NEEM, NGRIP, and Summit. Blue represents the average firn air record (Petrenko et al., 2013). The red line represents NOAA atmospheric monitoring at Barrow (Alaska, USA; Petron et al., 2021).
The fact that the CO baseline records from the four different Greenland ice cores are so consistent gives us confidence that our multisite reconstruction provides a reliable reconstruction of past atmospheric changes. An additional argument for this conclusion comes from the good overlap between our multisite reconstruction and CO data from Greenland firn air measurements (Sect. 3.5.2). However, we cannot exclude the possibility that past atmospheric CO levels could have been lower than those shown in Fig. 7; thus, we recommend that our multisite average be taken as an upper bound of past atmospheric CO levels. If in situ CO production drives the high-frequency variability seen throughout the CFA records of these four ice cores, as we hypothesize (see Sect. 3.2), it is impossible to exclude the possibility that minimum CO levels may also be slightly affected (Sect. 3.3).
3.5.2 Comparison with the firn air reconstruction
An independent means to assess the validity of our atmospheric CO reconstruction is to compare it with a reconstruction of Northern Hemisphere high-latitude atmospheric CO mixing ratios from Greenland firn air, available for the 1950–2008 CE period (Petrenko et al., 2013). This reconstruction includes air samples collected in the open porosity of the firn at three sites in Greenland (NGRIP in 2001, Summit in 2006, and NEEM in 2008) and shows that CO records from these three sites agree well with each other as well as with recent atmospheric measurements from Barrow (Alaska, USA; Petron et al., 2021). However, a small contribution from in situ CO production (up to 5 ppbv) within the firn open porosity itself could not be ruled out (Petrenko et al., 2013). This implies that the in situ CO production observed in ice core records, which exhibit [CO] enhancement much larger than 5 ppbv (Fig. 1), is a process happening within the ice matrix, after bubble closure. The reconstructed firn air history suggests that the Arctic CO mixing ratio in 1950 CE was 138–148 ppbv, rose by 10–15 ppbv from 1950 to the 1970s, peaked in the 1970s or early 1980s, and finally declined by about 30 ppbv to present-day levels. The average firn-air-based CO history spanning the last 6 decades (Petrenko et al., 2013) is shown in Fig. 7 along with our ice core CO composite reconstruction. The uncertainty in this scenario is captured by the variability in a set of 61 possible scenarios (Petrenko et al., 2013) and is shown as an envelope in Fig. 7.
PLACE and D4 high-resolution CO baseline records overlap with the firn record. The firn air data suggest that the CO concentration spanned 138–148 ppbv in 1950 CE for the Arctic atmosphere (Fig. 7). The 1950 CE CO concentration range as defined by the PLACE and D4 baselines is 135–150 ppbv, indicating good agreement between firn air and ice core reconstructions.
3.5.3 Spatial representativity of the record
The Atmospheric Chemistry and Climate Model Intercomparison Project (ACCMIP; Lamarque et al., 2013) investigated the long-term changes in atmospheric composition between 1850 and 2100, with the goal of documenting atmospheric composition changes. To investigate the spatial representativity of the ice core record, we compared the CO mixing ratios simulated in the framework of the ACCMIP exercise for the years 1980 and 2000 and averaged them over three different areas: the 45–90∘ N latitudinal band, an area encompassing the Greenland ice sheet (20–60∘ W; 60–84∘ N), and the single grid point including the PLACE drilling location. Average [CO] over Greenland and [CO] at the PLACE drilling location are identical. However, atmospheric [CO] simulated for the 45–90∘ N latitudinal band is about 12 % higher than [CO] simulated over Greenland. These results support our approach to combine ice core reconstructions obtained from different Greenland locations but also indicate that the absolute CO concentrations derived from our datasets are representative of the Greenland, Arctic, atmosphere and may underestimate the average CO concentrations for the entire 45–90∘ N latitudinal band. On the other hand, the temporal changes depicted by our composite record probably have a larger spatial significance than the Greenland context alone.
New continuous profiles of the CO mixing ratio have been measured along five Greenland ice cores: the PLACE, NGRIP, D4, Tunu13, and NEEM-SC archives. We also revisited the NEEM-2011-S1 dataset (Faïn et al., 2014). By coupling ice core melter systems with online measurements (SARA spectrometer), 700 m of ice was analyzed at a high resolution with respect to the CO mixing ratio. This methodology has greatly improved over the last decade, with excellent external precision, low and well-constrained blank values, and a good accuracy. All investigated records revealed high and variable concentrations that cannot be interpreted as changes in atmospheric CO and are most likely related to in situ production occurring within the ice archives themselves after bubble closure. Additional measurements conducted on individual discrete samples allowed us to rule out the possibility of rapid CO production from organics in the ice during melting or other large CFA system artifacts. We have not been able to reconcile the prior Eurocore dataset of Haan and Raynaud (1998) and Haan et al. (1996) with any of the new Greenland ice core CO measurements made using both discrete and continuous analytical methods. Therefore, our results call the accuracy of the relatively low and stable CO values reported by Haan and Raynaud (1998) and Haan et al. (1996) for the Eurocore ice core into question.
We have presented a multisite average ice core reconstruction of past atmospheric CO for the Northern Hemisphere high latitudes, covering the period from 1700 to 1950 CE, providing an upper-bound estimate of past atmospheric CO abundance. This paleoatmospheric signal was extracted from the low-frequency variability in the CO records' baselines of the PLACE, D4, NEEM, and NGRIP archives, which all exhibit consistent trends despite different surface accumulation snow rates and chemical compositions. From 1700 to 1875 CE, the multisite average record is stable with a slight increase with time from 103 to 114 ppbv. Our upper-bound value for the CO mixing ratio during preindustrial times in the Arctic is 110 ppbv. From 1875 to 1950 CE, the CO increases monotonically from 114 to 142 ppbv, with a rate of increase of about 0.3 ppbv yr−1. Finally, excellent agreement between our ice-core-based record and previously published firn air reconstruction is observed in the 1950s (Petrenko et al., 2013). The ice core and firn [CO] histories, spanning 1700–2010 CE, exhibit similar patterns to an up-to-date combined inventory of anthropogenic and open-burning CO emissions (van Marle et al., 2017; Hoesly et al., 2018). Our CFA-based multisite ice core CO reconstruction for Greenland provides an indication of the timing and magnitude of past variations in the Northern Hemisphere high-latitude CO burden that can provide a benchmark for future atmospheric chemistry model studies. Specifically, a natural extension of this work should be the comparison of our ice-core-based atmospheric CO reconstruction with model outputs from the AerChemMIP exercise (Collins et al., 2017).
The high-resolution carbon monoxide datasets are accessible on PANGAEA (https://doi.org/10.1594/PANGAEA.941920; Faïn et al., 2022).
The supplement related to this article is available online at: https://doi.org/10.5194/cp-18-631-2022-supplement.
This scientific project was designed by XF, JC, VVP, RR, EJB, and TB. The high-resolution carbon monoxide measurements were carried out by XF and RHR with support from KF, TB, JC, and EJB. The discrete CO analyses were carried out by PP and EC, and the chemical analyses were carried out by NC and JRM. XF, PP, and VVP participated in the PLACE drilling. RR participated in the Tunu13 drilling. The codes for data processing and modeling were developed by KF, JRM, and XF. All authors contributed to the interpretation of the data. The paper was written by XF with help from all co-authors.
The contact author has declared that neither they nor their co-authors have any competing interests.
Publisher's note: Copernicus Publications remains neutral with regard to jurisdictional claims in published maps and institutional affiliations.
Grateful thanks go to Olivia Maselli, Larry Layman, Daniel Pasteris, Michael Sigl, and other members of the DRI team who assisted with the measurement campaigns. We also wish to thank Frederic Prié, Elise Fourre, and Amaelle Landais for their help with the continuous measurement of water isotopes along the PLACE core at IGE in 2017. We are grateful to Ray Langenfelds for the measurements of gas standards at the CSIRO in 2015. We thank Sophie Szopa and Kostas Tsigaridis for useful discussions. Polar Field Services and the 109th New York Air National Guard as well as the French Polar Institute (IPEV) provided logistical support for ice core drilling. We are grateful to the drillers and field teams. This work also benefited from data available in the public NOAA ESRL database. We thank the people involved in acquiring and analyzing these data as well as making them accessible. This paper was greatly improved by constructive reviews from Murat Aydin and Maria Elena Popa.
This research has been supported by the following programs: the French ANR projects RPD-COCLICO (grant no. 10-RPDOC-002-01 to Xavier Faïn) and NEEM (grant no. 07-VULN-09-001); the EU projects PEGASOS (FP7-IP grant no. ENV-2010/265148) and ICE&LASERS (FP7 ERC grant no. 291062 to Jérôme Chappellaz); the US NSF award nos. 1406236 (Vasilii V. Petrenko), 0221515 (Joseph R. McConnell), 0909541 (Joseph R. McConnell), 1204176 (Joseph R. McConnell), 1406219 (Joseph R. McConnell), and 0968391 (Edward J. Brook, Partnerships in International Research and Education project, PIRE); the Packard Fellowship for Science and Engineering (Vasilii V. Petrenko); the French national program LEFE/INSU (project GreenCO, Xavier Faïn); and, finally, the IPEV Arctic program (grant no. 1159). The NEEM project is directed by the Centre for Ice and Climate at the Niels Bohr Institute, Copenhagen, and the US NSF OPP. It is supported by funding agencies and institutions in Belgium (FNRS-CFB and FWO), Canada (NRCan/GSC), China (CAS), Denmark (FIST), France (IPEV, CNRS/INSU, CEA, and ANR), Germany (AWI), Iceland (RannIs), Japan (NIPR), Korea (KOPRI), the Netherlands (NWO/ALW), Sweden (VR), Switzerland (SNF), the United Kingdom (NERC), and the USA (US NSF, OPP). NGRIP is a multinational research program funded by participating institutions in Denmark, France, Germany, Japan, Sweden, Switzerland, Belgium, Iceland, and the USA.
This paper was edited by Alberto Reyes and reviewed by Murat Aydin and Maria Elena Popa.
Allan, D.: Statistics of atomic frequency standards, P. IEEE, 54, 221–230, https://doi.org/10.1109/PROC.1966.4634, 1966. a
Butler, J. H., Battle, M. O., Bender, M., Montzka, S. A., Clarke, A. D., Saltzman, E. S., Sucher, C. M., Severinghaus, J. P., and Elkins, J. W.: A record of atmospheric halocarbons during the twentieth century from polar firn air, Nature, 399, 749–755, 1999. a
Clark, I. D., Henderson, L., Chappellaz, J., Fisher, D., Koerner, R., Worthy, D. E. J., Kotzer, T., Norman, A. L., and Barnola, J. M.: CO2 isotopes as tracers of firn air diffusion and age in an Arctic ice cap with summer melting, Devon Island, Canada, J. Geophys. Res.-Atmos., 112, D01301, https://doi.org/10.1029/2006jd007471, 2007. a
Collins, W. J., Lamarque, J.-F., Schulz, M., Boucher, O., Eyring, V., Hegglin, M. I., Maycock, A., Myhre, G., Prather, M., Shindell, D., and Smith, S. J.: AerChemMIP: quantifying the effects of chemistry and aerosols in CMIP6, Geosci. Model Dev., 10, 585–607, https://doi.org/10.5194/gmd-10-585-2017, 2017. a, b
Conte, L., Szopa, S., Séférian, R., and Bopp, L.: The oceanic cycle of carbon monoxide and its emissions to the atmosphere, Biogeosciences, 16, 881–902, https://doi.org/10.5194/bg-16-881-2019, 2019. a
Crutzen, P. J.: A discussion of the chemistry of some minor constituents in the stratosphere and troposphere, Pure Appl. Geophys., 106–108, 1385–1399, https://doi.org/10.1007/BF00881092, 1973. a
Deeter, M. N., Edwards, D. P., Francis, G. L., Gille, J. C., Martínez-Alonso, S., Worden, H. M., and Sweeney, C.: A climate-scale satellite record for carbon monoxide: the MOPITT Version 7 product, Atmos. Meas. Tech., 10, 2533–2555, https://doi.org/10.5194/amt-10-2533-2017, 2017. a
Duncan, B., Logan, J. A., Bey, I., Megretskaia, I. A., Yantosca, R. M., Novelli, P. C., Jones, N. B., and Rinsland, C. P.: Global budget of CO, 1988–1997: Source estimates and validation with a global model, J. Geophys. Res., 112, D22301, https://doi.org/10.1029/2007jd008459, 2007. a, b
Faïn, X., Chappellaz, J., Rhodes, R. H., Stowasser, C., Blunier, T., McConnell, J. R., Brook, E. J., Preunkert, S., Legrand, M., Debois, T., and Romanini, D.: High resolution measurements of carbon monoxide along a late Holocene Greenland ice core: evidence for in situ production, Clim. Past, 10, 987–1000, https://doi.org/10.5194/cp-10-987-2014, 2014. a, b, c, d, e, f, g, h, i, j, k, l, m
Faïn, X., Rhodes, R. H., Place, P., Petrenko, V. V., Fourteau, K., Chellman, N. J., Crosier, E., McConnell, J. R., Brook, E. J., Blunier, T., Legrand, M., and Chappellaz, J. A.: High resolution, continous, carbon monoxide records from Greenland ice cores, PANGAEA [data set], https://doi.org/10.1594/PANGAEA.941920, 2022. a
Fourteau, K., Faïn, X., Martinerie, P., Landais, A., Ekaykin, A. A., Lipenkov, V. Ya., and Chappellaz, J.: Analytical constraints on layered gas trapping and smoothing of atmospheric variability in ice under low-accumulation conditions, Clim. Past, 13, 1815–1830, https://doi.org/10.5194/cp-13-1815-2017, 2017. a
Gkinis, V., Popp, T. J., Blunier, T., Bigler, M., Schüpbach, S., Kettner, E., and Johnsen, S. J.: Water isotopic ratios from a continuously melted ice core sample, Atmos. Meas. Tech., 4, 2531–2542, https://doi.org/10.5194/amt-4-2531-2011, 2011. a
Haan, D. and Raynaud, D.: Ice core record of CO variations during the last two millennia: atmospheric implications and chemical interactions within the Greenland ice, Tellus B, 50, 253–262, 1998. a, b, c, d, e, f, g, h, i, j, k, l, m, n, o, p, q, r, s
Haan, D., Martinerie, P., and Raynaud, D.: Ice core data of atmospheric carbon monoxide over Antarctica and Greenland during the last 200 years, Geophys. Res. Lett., 23, 2235–2238, 1996. a, b, c, d, e, f, g, h, i, j, k, l, m, n
Haan, D., Zuo, Y., Gros, V., and Brenninkmeijer, C. A. M.: Photochemical production of carbon monoxide in snow, J. Atmos. Chem., 40, 217–230, 2001. a
Hagler, G. S. W., Bergin, M. H., Smith, E. a., Dibb, J. E., Anderson, C., and Steig, E. J.: Particulate and water-soluble carbon measured in recent snow at Summit, Greenland, Geophys. Res. Lett., 34, L16505, https://doi.org/10.1029/2007GL030110, 2007. a
Hoesly, R. M., Smith, S. J., Feng, L., Klimont, Z., Janssens-Maenhout, G., Pitkanen, T., Seibert, J. J., Vu, L., Andres, R. J., Bolt, R. M., Bond, T. C., Dawidowski, L., Kholod, N., Kurokawa, J.-I., Li, M., Liu, L., Lu, Z., Moura, M. C. P., O'Rourke, P. R., and Zhang, Q.: Historical (1750–2014) anthropogenic emissions of reactive gases and aerosols from the Community Emissions Data System (CEDS), Geosci. Model Dev., 11, 369–408, https://doi.org/10.5194/gmd-11-369-2018, 2018. a, b
Khalil, M., Pinto, J., and Shearer, M.: Atmospheric carbon monoxide, Chemosphere – Global Change Science, 1, ix–xi, https://doi.org/10.1016/S1465-9972(99)00053-7, 1999. a
Kuhl, T. W., Johnson, J. A., Shturmakov, A. J., Goetz, J. J., Gibson, C. J., and Lebar, D. A.: A new large-diameter ice-core drill: the Blue Ice Drill, Ann. Glaciol., 55, 1–6, https://doi.org/10.3189/2014AoG68A009, 2014. a
Lamarque, J.-F., Shindell, D. T., Josse, B., Young, P. J., Cionni, I., Eyring, V., Bergmann, D., Cameron-Smith, P., Collins, W. J., Doherty, R., Dalsoren, S., Faluvegi, G., Folberth, G., Ghan, S. J., Horowitz, L. W., Lee, Y. H., MacKenzie, I. A., Nagashima, T., Naik, V., Plummer, D., Righi, M., Rumbold, S. T., Schulz, M., Skeie, R. B., Stevenson, D. S., Strode, S., Sudo, K., Szopa, S., Voulgarakis, A., and Zeng, G.: The Atmospheric Chemistry and Climate Model Intercomparison Project (ACCMIP): overview and description of models, simulations and climate diagnostics, Geosci. Model Dev., 6, 179–206, https://doi.org/10.5194/gmd-6-179-2013, 2013. a
Legrand, M. and De Angelis, M.: Light carboxylic acids in Greenland ice: A record of past forest fires and vegetation emissions from the boreal zone, J. Geophys. Res., 101, 4129, https://doi.org/10.1029/95JD03296, 1996. a
Legrand, M. and Mayewski, P.: Glaciochemistry of polar ice cores: A review, Rev. Geophys., 35, 219–243, 1997. a
Legrand, M., McConnell, J., Fischer, H., Wolff, E. W., Preunkert, S., Arienzo, M., Chellman, N., Leuenberger, D., Maselli, O., Place, P., Sigl, M., Schüpbach, S., and Flannigan, M.: Boreal fire records in Northern Hemisphere ice cores: a review, Clim. Past, 12, 2033–2059, https://doi.org/10.5194/cp-12-2033-2016, 2016. a, b
Lelieveld, J., Gromov, S., Pozzer, A., and Taraborrelli, D.: Global tropospheric hydroxyl distribution, budget and reactivity, Atmos. Chem. Phys., 16, 12477–12493, https://doi.org/10.5194/acp-16-12477-2016, 2016. a
Maselli, O. J., Fritzsche, D., Layman, L., McConnell, J. R., and Meyer, H.: Comparison of water isotope-ratio determinations using two cavity ring-down instruments and classical mass spectrometry in continuous ice-core analysis, Isot. Environ. Health S., 49, 387–398, https://doi.org/10.1080/10256016.2013.781598, 2013. a
McConnell, J. R. and Edwards, R.: Coal burning leaves toxic heavy metal legacy in the Arctic, P. Natl. Acad. Sci. USA, 105, 12140–12144, https://doi.org/10.1073/pnas.0803564105, 2008. a
McConnell, J. R., Lamorey, S., and Taylor, K. C.: Continuous ice-core chemical analyses using inductively coupled plasma mass spectrometry, Environ. Sci. Technol., 36, 7–11, 2002. a
McConnell, J. R., Edwards, R., Kok, G. L., Flanner, M. G., Zender, C. S., Saltzman, E. S., Banta, J. R., Pasteris, D. R., Carter, M. M., and Kahl, J. D. W.: 20th-century industrial black carbon emissions altered arctic climate forcing, Science, 317, 1381–1384, 2007. a
Morville, J., Kassi, S., Chenevier, M., and Romanini, D.: Fast, low-noise, mode-by-mode, cavity-enhanced absorption spectroscopy by diode-laser self-locking, Appl. Phys. B-Lasers O., 80, 1027–1038, https://doi.org/10.1007/s00340-005-1828-z, 2005. a
NEEM community members: Eemian interglacial reconstructed from a Greenland folded ice core, Nature, 493, 489–494, https://doi.org/10.1038/nature11789, 2012. a
NGRIP community members: High-resolution record of Northern Hemisphere climate extending into the last interglacial period, Nature, 431, 147–151, https://doi.org/10.1038/nature02805, 2004. a
Novelli, P. C., Masarie, K. A., and Lang, P. M.: Distributions and recent changes of carbon monoxide in the lower troposphere, J. Geophys. Res., 103, 19015–19033, 1998. a
Petrenko, V. V., Martinerie, P., Novelli, P., Etheridge, D. M., Levin, I., Wang, Z., Blunier, T., Chappellaz, J., Kaiser, J., Lang, P., Steele, L. P., Hammer, S., Mak, J., Langenfelds, R. L., Schwander, J., Severinghaus, J. P., Witrant, E., Petron, G., Battle, M. O., Forster, G., Sturges, W. T., Lamarque, J.-F., Steffen, K., and White, J. W. C.: A 60 yr record of atmospheric carbon monoxide reconstructed from Greenland firn air, Atmos. Chem. Phys., 13, 7567–7585, https://doi.org/10.5194/acp-13-7567-2013, 2013. a, b, c, d, e, f, g
Petron, G. Crotwell, A. M., Crotwell, M. J., Dlugokencky, E., Madronich, M., Moglia, E., Neff, D., Wolter, S., and Mund, J. W.: Atmospheric Carbon Monoxide Dry Air Mole Fractions, NOAA GML Carbon Cycle Cooperative Global Air Sampling Network [data set], 1988–2020, Version: 2020-04, https://doi.org/10.15138/33bv-s284, 2021. a, b
Rhodes, R. H., Faïn, X., Stowasser, C., Blunier, T., Chappellaz, J., McConnell, J. R., Romanini, D., Mitchell, L. E., and Brook, E. J.: Continuous methane measurements from a late Holocene Greenland ice core: Atmospheric and in-situ signals, Earth Planet. Sc. Lett., 368, 9–19, https://doi.org/10.1016/j.epsl.2013.02.034, 2013. a, b, c, d
Rhodes, R. H., Brook, E. J., Chiang, J. C. H., Blunier, T., Maselli, O. J., McConnell, J. R., Romanini, D., and Severinghaus, J.: Enhanced tropical methane production in response to iceberg discharge in the North Atlantic, Science, 348, 1016–1019, https://doi.org/10.1126/science.1262005, 2015. a, b, c
Rhodes, R. H., Faïn, X., Brook, E. J., McConnell, J. R., Maselli, O. J., Sigl, M., Edwards, J., Buizert, C., Blunier, T., Chappellaz, J., and Freitag, J.: Local artifacts in ice core methane records caused by layered bubble trapping and in situ production: a multi-site investigation, Clim. Past, 12, 1061–1077, https://doi.org/10.5194/cp-12-1061-2016, 2016. a, b
Schwander, J. and Rufli, H.: Electromechanical drilling of a 300-m core in a dry hole at Summit, Mem. Natl. Inst. Polar Res., 49, 93–94, 1994. a
Stowasser, C., Buizert, C., Gkinis, V., Chappellaz, J., Schüpbach, S., Bigler, M., Faïn, X., Sperlich, P., Baumgartner, M., Schilt, A., and Blunier, T.: Continuous measurements of methane mixing ratios from ice cores, Atmos. Meas. Tech., 5, 999–1013, https://doi.org/10.5194/amt-5-999-2012, 2012. a, b
van der Werf, G. R., Randerson, J. T., Giglio, L., van Leeuwen, T. T., Chen, Y., Rogers, B. M., Mu, M., van Marle, M. J. E., Morton, D. C., Collatz, G. J., Yokelson, R. J., and Kasibhatla, P. S.: Global fire emissions estimates during 1997–2016, Earth Syst. Sci. Data, 9, 697–720, https://doi.org/10.5194/essd-9-697-2017, 2017. a
van Marle, M. J. E., Kloster, S., Magi, B. I., Marlon, J. R., Daniau, A.-L., Field, R. D., Arneth, A., Forrest, M., Hantson, S., Kehrwald, N. M., Knorr, W., Lasslop, G., Li, F., Mangeon, S., Yue, C., Kaiser, J. W., and van der Werf, G. R.: Historic global biomass burning emissions for CMIP6 (BB4CMIP) based on merging satellite observations with proxies and fire models (1750–2015), Geosci. Model Dev., 10, 3329–3357, https://doi.org/10.5194/gmd-10-3329-2017, 2017. a
Wang, Z., Chappellaz, J., Martinerie, P., Park, K., Petrenko, V., Witrant, E., Emmons, L. K., Blunier, T., Brenninkmeijer, C. A. M., and Mak, J. E.: The isotopic record of Northern Hemisphere atmospheric carbon monoxide since 1950: implications for the CO budget, Atmos. Chem. Phys., 12, 4365–4377, https://doi.org/10.5194/acp-12-4365-2012, 2012. a
Zheng, B., Chevallier, F., Yin, Y., Ciais, P., Fortems-Cheiney, A., Deeter, M. N., Parker, R. J., Wang, Y., Worden, H. M., and Zhao, Y.: Global atmospheric carbon monoxide budget 2000–2017 inferred from multi-species atmospheric inversions, Earth Syst. Sci. Data, 11, 1411–1436, https://doi.org/10.5194/essd-11-1411-2019, 2019. a